Review

Distribution of Transition Temperatures in Magnetic Transformations: Sources, Effects and Procedures to Extract Information from Experimental Data

Dpto. Física de la Materia Condensada, ICMSE-CSIC, Universidad de Sevilla, P.O. Box 1065, 41080 Sevilla, Spain
*
Author to whom correspondence should be addressed.
Metals 2020, 10(2), 226; https://doi.org/10.3390/met10020226
Submission received: 20 December 2019 / Revised: 1 February 2020 / Accepted: 3 February 2020 / Published: 6 February 2020

Abstract

:
The presence of a distribution of transition temperatures (DTT) is ubiquitous in materials science. It is common to ascribe deviations from theoretical pure-phase behavior to this fact. To adapt the different pure phase models to systems with a DTT, the parameters of such distribution must be known or at least estimated. In this review, the different sources for the existence of such distributions and their effects on magnetothermal properties are summarized. In addition, different models proposed to extract the parameters of the corresponding DTT are discussed and extended, starting from Weiss model, to account for other phenomenologies. Experimental results on amorphous Fe-Nb-B and intermetallic MnCo(Fe)Ge systems are also reported.

1. Introduction

Magnetic behavior of materials is diverse. Despite the existence of different magnetic orders, in this review, we focus on the transition between ferromagnetic (FM) and paramagnetic (PM) phases. For those systems where the coupling between magnetic and crystalline structure can be neglected, the transition from a low temperature ordered FM phase to a high temperature disordered PM phase is smooth. Magnetization at zero field drops to zero at a fixed temperature independently of the heating/cooling rate (i.e., the transition is not thermally activated). In fact, FM phase only applies in a certain temperature range and, if there is neither structural changes nor magnetoelastic coupling, a second-order phase transition (SOPT) takes place at the Curie temperature, T C . Above this temperature, the exchange coupling is overcome by the thermal energy. To describe this magnetic transition, two limit models can be assumed [1]: long range, mean field (MF) approach (Weiss molecular field model), and short range, first neighbors approach (Heisenberg model).
Even in the case that the magnetic transition is not associated with a structural phase transition, coupling between magnetic and crystalline structures cannot always be neglected. In the case of magnetoelastically driven transitions, such as occurs for La(Fe,Si)13 intermetallic [2], coupling between the cell volume and the molecular field constant of Weiss model yielded the development of Bean and Rodbell (BR) model [3]. This model successfully describes a continuous change from SOPT to first-order phase transition (FOPT) as the coupling parameter increases from a low temperature ordered FM to a disordered high temperature PM phase.
Magnetostructural transitions, such as those occurring in magnetic Heusler alloys [4], imply the reversible (although generally hysteretic) structural change from a low entropy, low symmetry, and low temperature phase (i.e., martensite) to a high entropy, high symmetry, and high temperature phase (i.e., austenite). Unlike the former described transitions, magnetostructural ones present a latent heat of the transformation and can be thermally activated (i.e., the transition temperature can be shifted with the heating or cooling rate) [5]. The magnetic nature of the austenite and martensite phases is diverse. It is possible to find both magnetostructural transformations: from a FM martensite to a PM austenite (implying an abrupt decrease to zero of the magnetization at the structural transition [6,7]) or from a PM martensite to a FM austenite (implying an abrupt increase from zero of the magnetization at the transition [8,9,10]). Moreover, transition from FM martensite to FM austenite can be also found [11], implying a step change in the magnetization. Transitions from PM martensite to PM austenite, although possible, are not of interest in our study frame as the zero-field magnetization is null for both structural phases.
Despite the careful preparation of the experimental samples, different factors (inhomogeneities, compositional gradients, crystal/particle size distributions, etc.) can lead to the appearance of non-single pure phase transitions. Deviations from the theoretical single-phase behavior can be corrected assuming a distribution of transition temperatures (DTT) in order to obtain a more realistic description of the behavior of the samples.
In Section 2, the main sources affecting Curie and magnetostructural transition temperatures are discussed. The presence of inhomogeneities in these sources (composition, crystal size, etc.), which can lead to the appearance of a DTT, is discussed.
Section 3 describes the effects produced by the existence of such DTT as well as some deviations from the theoretical predictions of single-phase models.
Section 4 describes different models used to extract the parameters of the DTT. Particularly, we extend one method recently proposed by the authors [12] to describe SOPT under mean field (MF) approach to account for the different types of transitions commented above. To describe systems out of MF frame, we use Curie transitions described by Arrott–Noakes (AN) equation of state (EOS) [13]. To describe magnetoelastic transitions, BR model is used. Finally, a simple model is developed to roughly describe magnetostructural transitions.
Section 5 presents some new experimental data to test the proposed model.
Finally, the main conclusions derived from this study are summarized.

2. Sources for a Distribution of Transition Temperatures

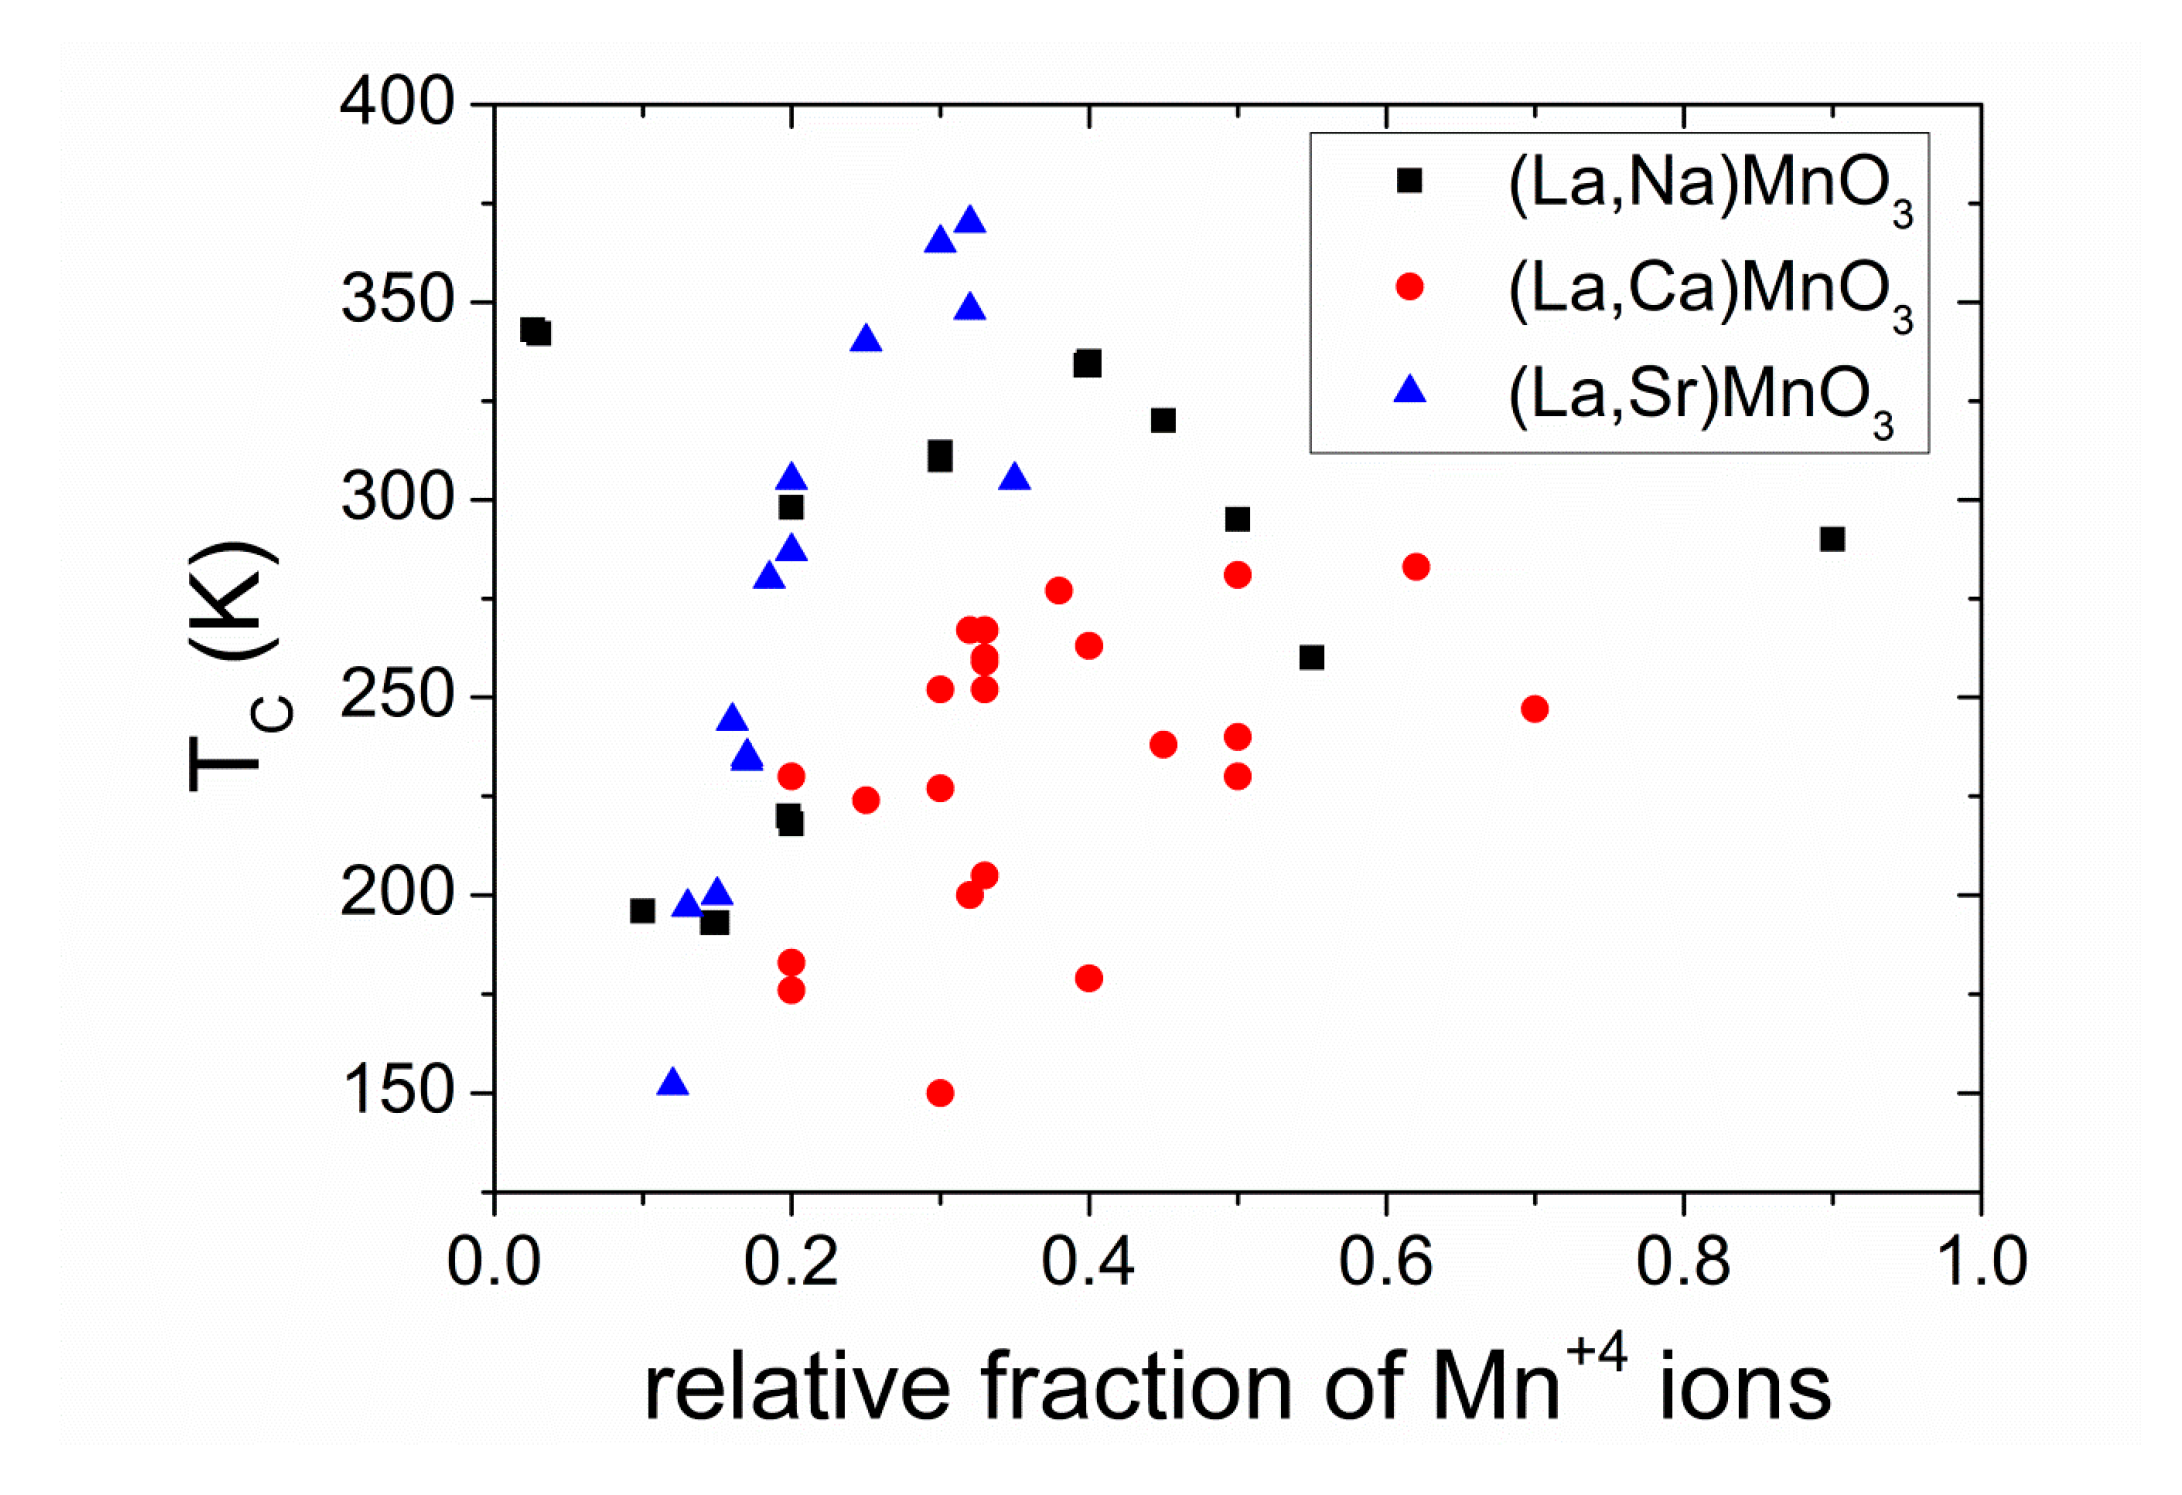
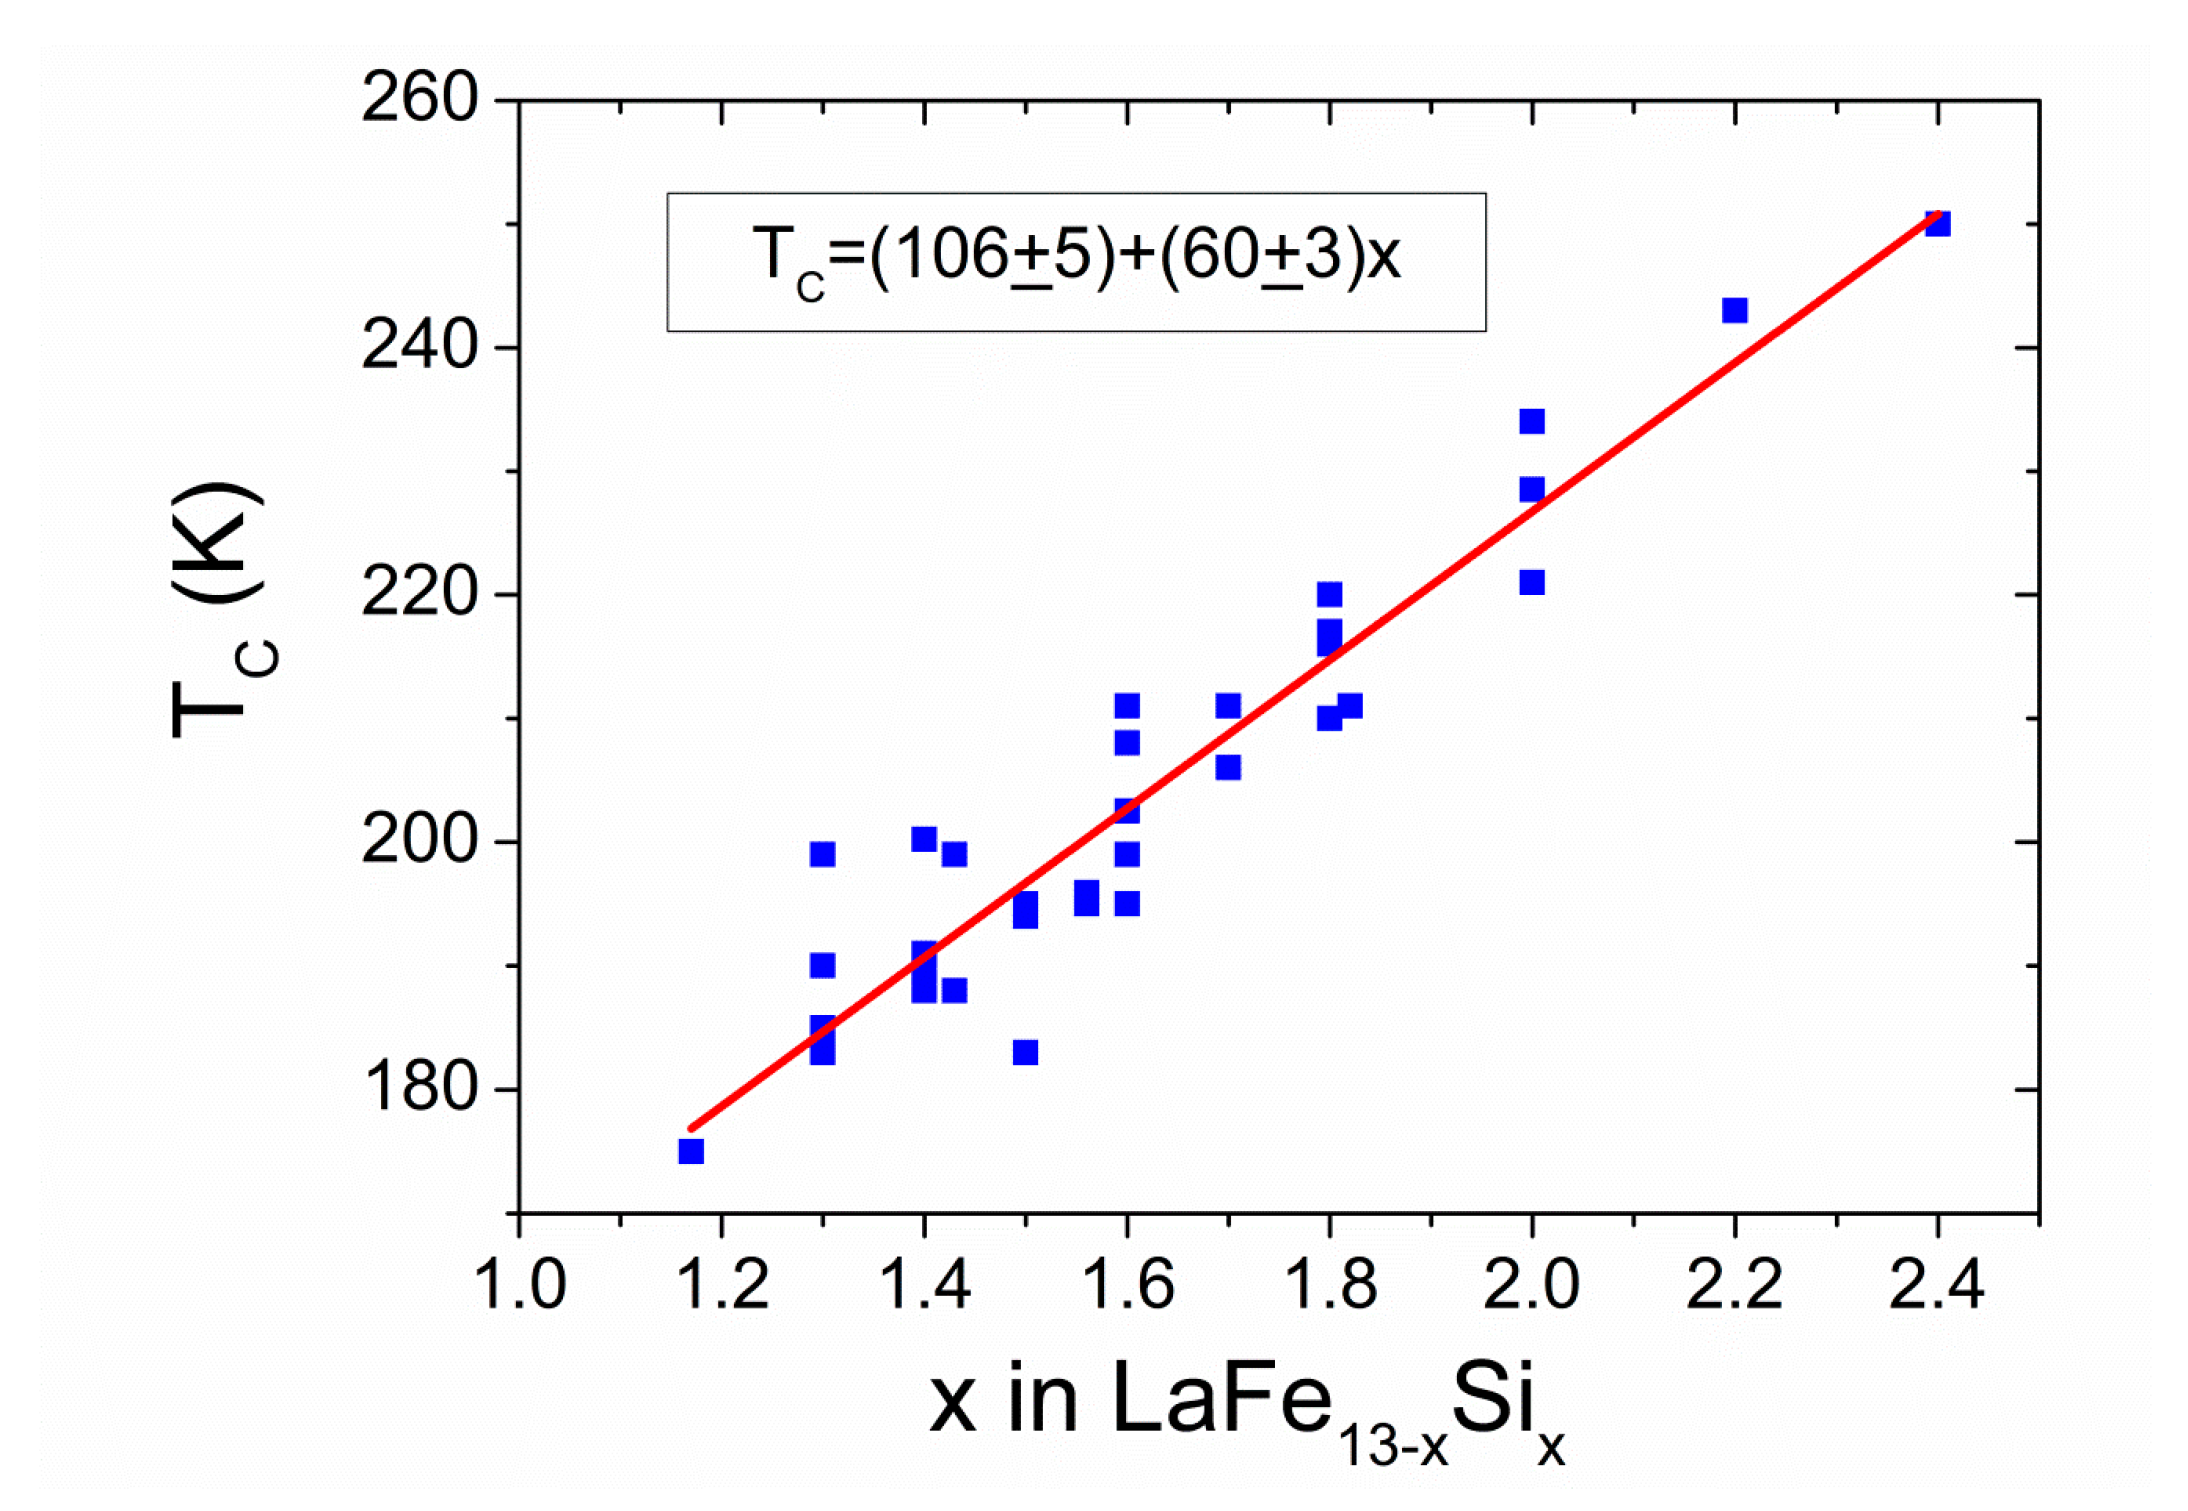
2.1. Compositional Dependence of Transition Temperatures

Compositional heterogeneity is the most intuitive source for the presence of a DTT through the compositional dependence of the transition temperatures (both Curie and magnetostructural ones). The close link between composition and temperature at which the transition occurs naturally yields a DTT when a certain gradient or heterogeneous compositional distribution exists. To estimate the importance of this source, as an example for SOPT, we can explore the dependence of Curie temperature T C , in the frame of the Weiss model [1]:
T C = g J μ B ( J + 1 ) λ M S 3 k B = n V λ μ e f f 2 3 k B
where g J is the Landé factor; μ B is the Bohr magneton; J is the total angular momentum of the magnetic atom; M S is the saturation magnetization; n V is the number density of magnetic atoms; μ e f f = g J J ( J + 1 ) μ B is their effective magnetic moment; k B is the Boltzmann constant; and λ is the molecular field constant (following Blundell’s book notation [1], λ has the same units as μ 0 , the permeability of vacuum). The λ parameter is related to an effective exchange interaction, J e x . Assuming a near neighbors approach:
λ = 2 z J e x ( g J 1 ) 2 n V g J 2 μ B 2
where z is the number of near neighbors to which the atom is exchange coupled. In the case of transition metals ions, for which the orbital component of the angular moment is quenched, Equation (2) reduces to:
λ = z J e x 2 n V μ B 2
The general case gives us a direct relation between T C and the number of near neighbors, the exchange constant and the square of the effective magnetic moment:
T C = 2 z J e x ( g J 1 ) 2 μ e f f 2 3 k B g J 2 μ B 2 = 2 z J e x ( g J 1 ) 2 J ( J + 1 ) 3 k B
where ( g J 1 ) 2 J ( J + 1 ) is de Gennes factor. T C of isostructural compositional series of rare earth (RE) compounds follows a linear trend with de Gennes factor [14,15].
Table 1 collects the experimental magnetic parameters for FM pure metals [1,16] and the effective J e x / k B from Weiss model. Despite this apparently clear picture, the presence of ferromagnetism is far from being easy to explain. In fact, calculated values of J e x from direct exchange interaction are much lower than the experimental ones. The indirect exchange transmitted by the conduction electrons, as described by Ruderman, Kittel, Kasuya, and Yosida [1] (RKKY mechanism), can account for the magnetism in rare earths for which the magnetic moment is due to well localized f electrons and conduction electrons transmit the exchange [16]. However, the partially localized/itinerant nature of the d electrons responsible for the magnetic moment in transition metals adds complexity to the problem [17]. In any case, for metallic systems, the oscillatory dependence of J e x with the atomic separation in metallic systems derived from RKKY interaction must be considered. In addition, magnetic moments of the atoms depend on composition (e.g., in binary systems [18]).
In the case of RE-based amorphous alloys, T C increases as the amount of RE increases and it is maximum for Gd (see Figure 1a). For transition metal-based systems, as is found in Fe-based amorphous alloys, T C is easily tunable by addition of non-magnetic or magnetic elements. When Co is partially substituted for Fe, a general increase of the Curie temperature is observed [19]. Despite the lower μ e f f for Co or Ni than for Fe, a stronger J e x is inferred for both Co and Ni pure systems. In the case of non-magnetic atom substitution (see Figure 1b), T C decreases as Fe content increases in the alloy. Despite the larger number of magnetic moments, exchange is affected by the decrease in the distance between Fe atoms.
Other indirect exchange mechanism occurs in oxides. For example, double exchange in La1-xCaxMnO3 is determined by the presence of two different valences in Mn ions [30]. However, there is no clear correlation but a wide spread of T C data with respect to the fraction of Mn4+ ions (see Figure 2). T C in these systems can be roughly, but better, correlated with the tolerance factor, t , which relates the average ratios of the different ion sites as [31]:
t = R L a + R O 2 ( R M n + R O )
where R L a , R O , and R M n are the radii of the ions at lanthanum, oxygen, and manganese sites, respectively. However, the different ways to compositionally tailor this transition make this correlation just a rude approximation. Generally, substitution of other transition element for Mn yields a deterioration of the double exchange mechanism and thus a decrease of T C [31].
Magnetoelastic transition occurring for La(Fe,Si)13 phase is strongly dependent on the Si content [2,38,39]. Despite the order character of the transition (FOPT for low Si content and SOPT for high Si content [38]), an almost linear correlation is followed with this parameter (see Figure 3). The slope of this linear fitting yields a value of ~4 K change per at % of Si. In this family of alloys, further tailoring of the transition is obtained by substitution of other elements such Co for Fe (increasing T C [40]) or other RE for La (decreasing T C [41]) or by addition of interstitial atoms, mainly H [41] (increasing of T C ).
In the case of magnetostructural transitions of Heusler alloys, the transition temperature, T t , from martensite to austenite phase is much more sensitive to the composition than the T C of the high and low temperature phases. Figure 4 shows different transition temperatures as a function of the number of electrons per atom in the outer shells for the different families of Heusler alloys. It is observed that the slope of change in martensitic transformation is several times larger than the change in the Curie temperature of the austenitic phase, T C A . In fact, as an example, whereas T C A is almost unaffected when composition changes from Ni49.7Mn36.2In14.1 to Ni49.8Mn35.0In15.2, magnetostructural transition decreases ~100 K. This strong dependence in Mn/In ratio is even enhanced in Ni(Co)MnIn, for which 1 at.% increase in Mn and decrease in In yields an increase in martensitic transformation of ~150 K [9].

2.2. Other Factors Affecting Transition Temperature

Crystal size may influence the magnetic transition, particularly when this characteristic structural length (crystal size) becomes of the order of the magnetic exchange correlation length. This magnitude is related to the domain wall thickness, δ ~ A K , where A is the exchange stiffness and K is the magnetic anisotropy constant. This occurs in the nanometer scale (e.g., δ = 18 and 51 nm for bcc Fe and hcp Co, respectively) [42]. In this range, changes in coercivity are huge. From large crystal sizes, a reduction of this parameter enhances the impingement effect of crystal boundaries on the domain wall displacement. However, in the nanometer range, when crystallites are smaller than the wall thickness, averaging out of the magnetocrystalline anisotropy leads to a strong reduction of the coercivity with the sixth power of the crystal size [42]. Therefore, both the softest (α-Fe nanocrystals embedded in an amorphous FM matrix [42]) and the hardest (FeNdB-based nanocrystalline composites [43]) magnetic materials have nanometer microstructure. The averaging out of the magnetocrystalline anisotropy is effective when the nanocrystals are coupled (normally via a soft magnetic amorphous matrix in which they are embedded).
When ferromagnetic nanocrystals are not coupled, isolated monodomain nanocrystals can exhibit superparamagnetic behavior [44], characterized by a blocking temperature, T B < T C . Below T B , normal FM behavior is observed. However, in the range T B < T < T C , the system behaves as a superparamagnet (i.e., a PM with huge magnetic moments and thus described by Langevin function). T B depends on the characteristic time of the measuring technique as it is defined as the temperature at which the relaxation time equals this experimental timescale [45]: T B = 25 K V / k B in the case of quasi-static measurements, where V is the volume of the particle.
A general depletion of T C is found as crystal size decreases and different models have been proposed to explain this (see some examples in [46]). However, changes in the magnetization and Curie transition are theoretically limited to very few layers, approximately <10, in thin films [47]. Nanosized manganites show a broader transition [48] and even bulk antiferromagnetic manganites can be FM when crystal size is reduced to nanometer scale [49]. Reduction of crystal size from 90 to 38 nm in DyCuAl reduces T C from 27 to 24 K [50]. Pr2Fe17 ball milled powders with nanometer size present a lower T C   ~ 290 K than their bulk counterparts ( T C   ~ 300 K) [51].
Different reasoning affects crystal size effect when a magnetostructural transition occurs. The stabilization of the austenite phase by decreasing of the main grain size has been observed in different Heusler systems produced by rapid quenching [52,53,54]. Crystal growth and compositional homogenization is enhanced after annealing of these rapidly quenched systems and, generally, increasing the structural and magnetic transition temperatures [55]. Aguilar-Ortiz et al. [56] reported a shift of the martensitic transformation in Ni50Mn35In15 ribbons from 300 to 285 K as the crystal size decreases from 7.3 to 0.9 μm. They also found variations in the Curie transition of both austenite and martensite (from 309 to 293 K and from 199 to 178 K, respectively). On the other hand, a critical grain size below which martensitic transformation is suppressed has been also reported for Ni-Ti [57] and Fe-Pd [58] alloys.
Many production techniques can lead to the formation of a non-perfectly homogeneous system, producing a broadening of the physical properties of the transition with respect to those expected for theoretically pure system. This effect has been reported for La0.70-xEuxSr0.30MnO3 manganites, where the consequent chemical distribution due to partial substitution of Eu for La affects the magnetic and magnetocaloric properties of the compound [59]. The influence of atomic ordering on the Fe-Zr amorphous powder obtained by high energy ball milling has also been studied, showing that the structural relaxation combined with the homogenization of the composition is responsible for the enhancement of the magnetic interactions [60].
Although the next-nearest-neighbor ordered L21 austenite crystal structure is formed in many kinds of X2YZ magnetic Heusler alloys, such as Ni2MnAl [61], Mn2NiGa [62], and Ni2FeGa [63], various locally disordered structures can be found in the L21 matrix. These materials are normally produced by melt-spinning technique, which can produce textured polycrystalline ribbons and prevents the formation of additional phases due to the high cooling rates during the fabrication process. However, the crystal structure of these compounds strongly depends on the composition and the quenching rate, which can produce site disorder and will drastically influence the magnetic properties due to the ferromagnetic/antiferromagnetic exchange interaction between atoms on the martensitic transformation. In this sense, Passamani et al. [64] reported that Ni2-xFexMn1.44Sn0.56 alloys show a drastic shift of the martensitic transformation after the replacement of Fe atoms for Ni and/or Mn. In this case, Fe-Mn ferromagnetic interactions compensate Mn-Mn antiferromagnetic ones, which leads to the stabilization of austenite phase. In the case of NiFeGa systems [63], the ferromagnetic character of the sample strongly depends on the Fe-Fe interactions. The presence of Fe antisite atoms on Ni or Ga sites results in the modification of magnetic interactions, changing both T C and structural transition temperature, T t . For Mn-Ni-Ga Heusler alloys, theoretical studies on ordered and disordered Mn and Ni sites results in T C = 958 K and 425 K, respectively [65]. These values, compared to the experimental one of 588 K, must indicate the existence of a high degree of disorder in this system. In these melt-spun systems, annealing produces an increase of T t , T C , and saturation magnetization compared to those of as-cast alloy [66].
In general, rapidly quenched systems, as commented above, lead to disordering but also to crystal size reduction when crystalline structures are formed. Therefore, both sources may affect the transition temperatures.
Pressure application, linked to cell volume changes, also affects magnetic transitions as the exchange depends on the distance between the interacting atoms. The T C enhancement of Ni with pressure is reduced for Ni(Fe) alloys with low Fe content. For Ni70Fe30 alloy, T C is almost pressure independent. For higher Fe content, T C decreases with pressure [67].
Pressure application in RECo2 decreases the transition temperature [68] in agreement with the predictions of Khmelevskyi and Mohn [69], which describe the magnetic interaction and order of the transition in these systems taking into account the magnetovolume effects and spin fluctuations. When 0.705 < a < 0.722 nm, where a is the lattice parameter, itinerant electron metamagnetic transition (FOPT) occurs. For high pressures, the linear decrease of the transition temperature with pressure is lost for RE = Ho and Er, becoming pressure independent above 4 GPa [70]. This has been ascribed to the collapse of the Co magnetic moment sublattice, whereas RE sublattice remains almost unchanged with pressure [71].
Pressure application in La(Fe,Si)13 phases decreases the transition temperatures [72]. In fact, the so-called negative pressure effect (addition of interstitial atoms) is particularly important for these magnetocaloric materials and H is added to elevate transition temperatures to room temperature for applications [41].
Theoretical dependence of T C with pressure for Heusler alloys shows a complex behavior dependent on the composition: e.g., whereas, for (Ni1-xPdx)2MnIn, T C increases as pressure increases, for (Ni1-xCux)2MnSn, T C increases with pressure for x < 0.7 but decreases for x > 0.7 [73].

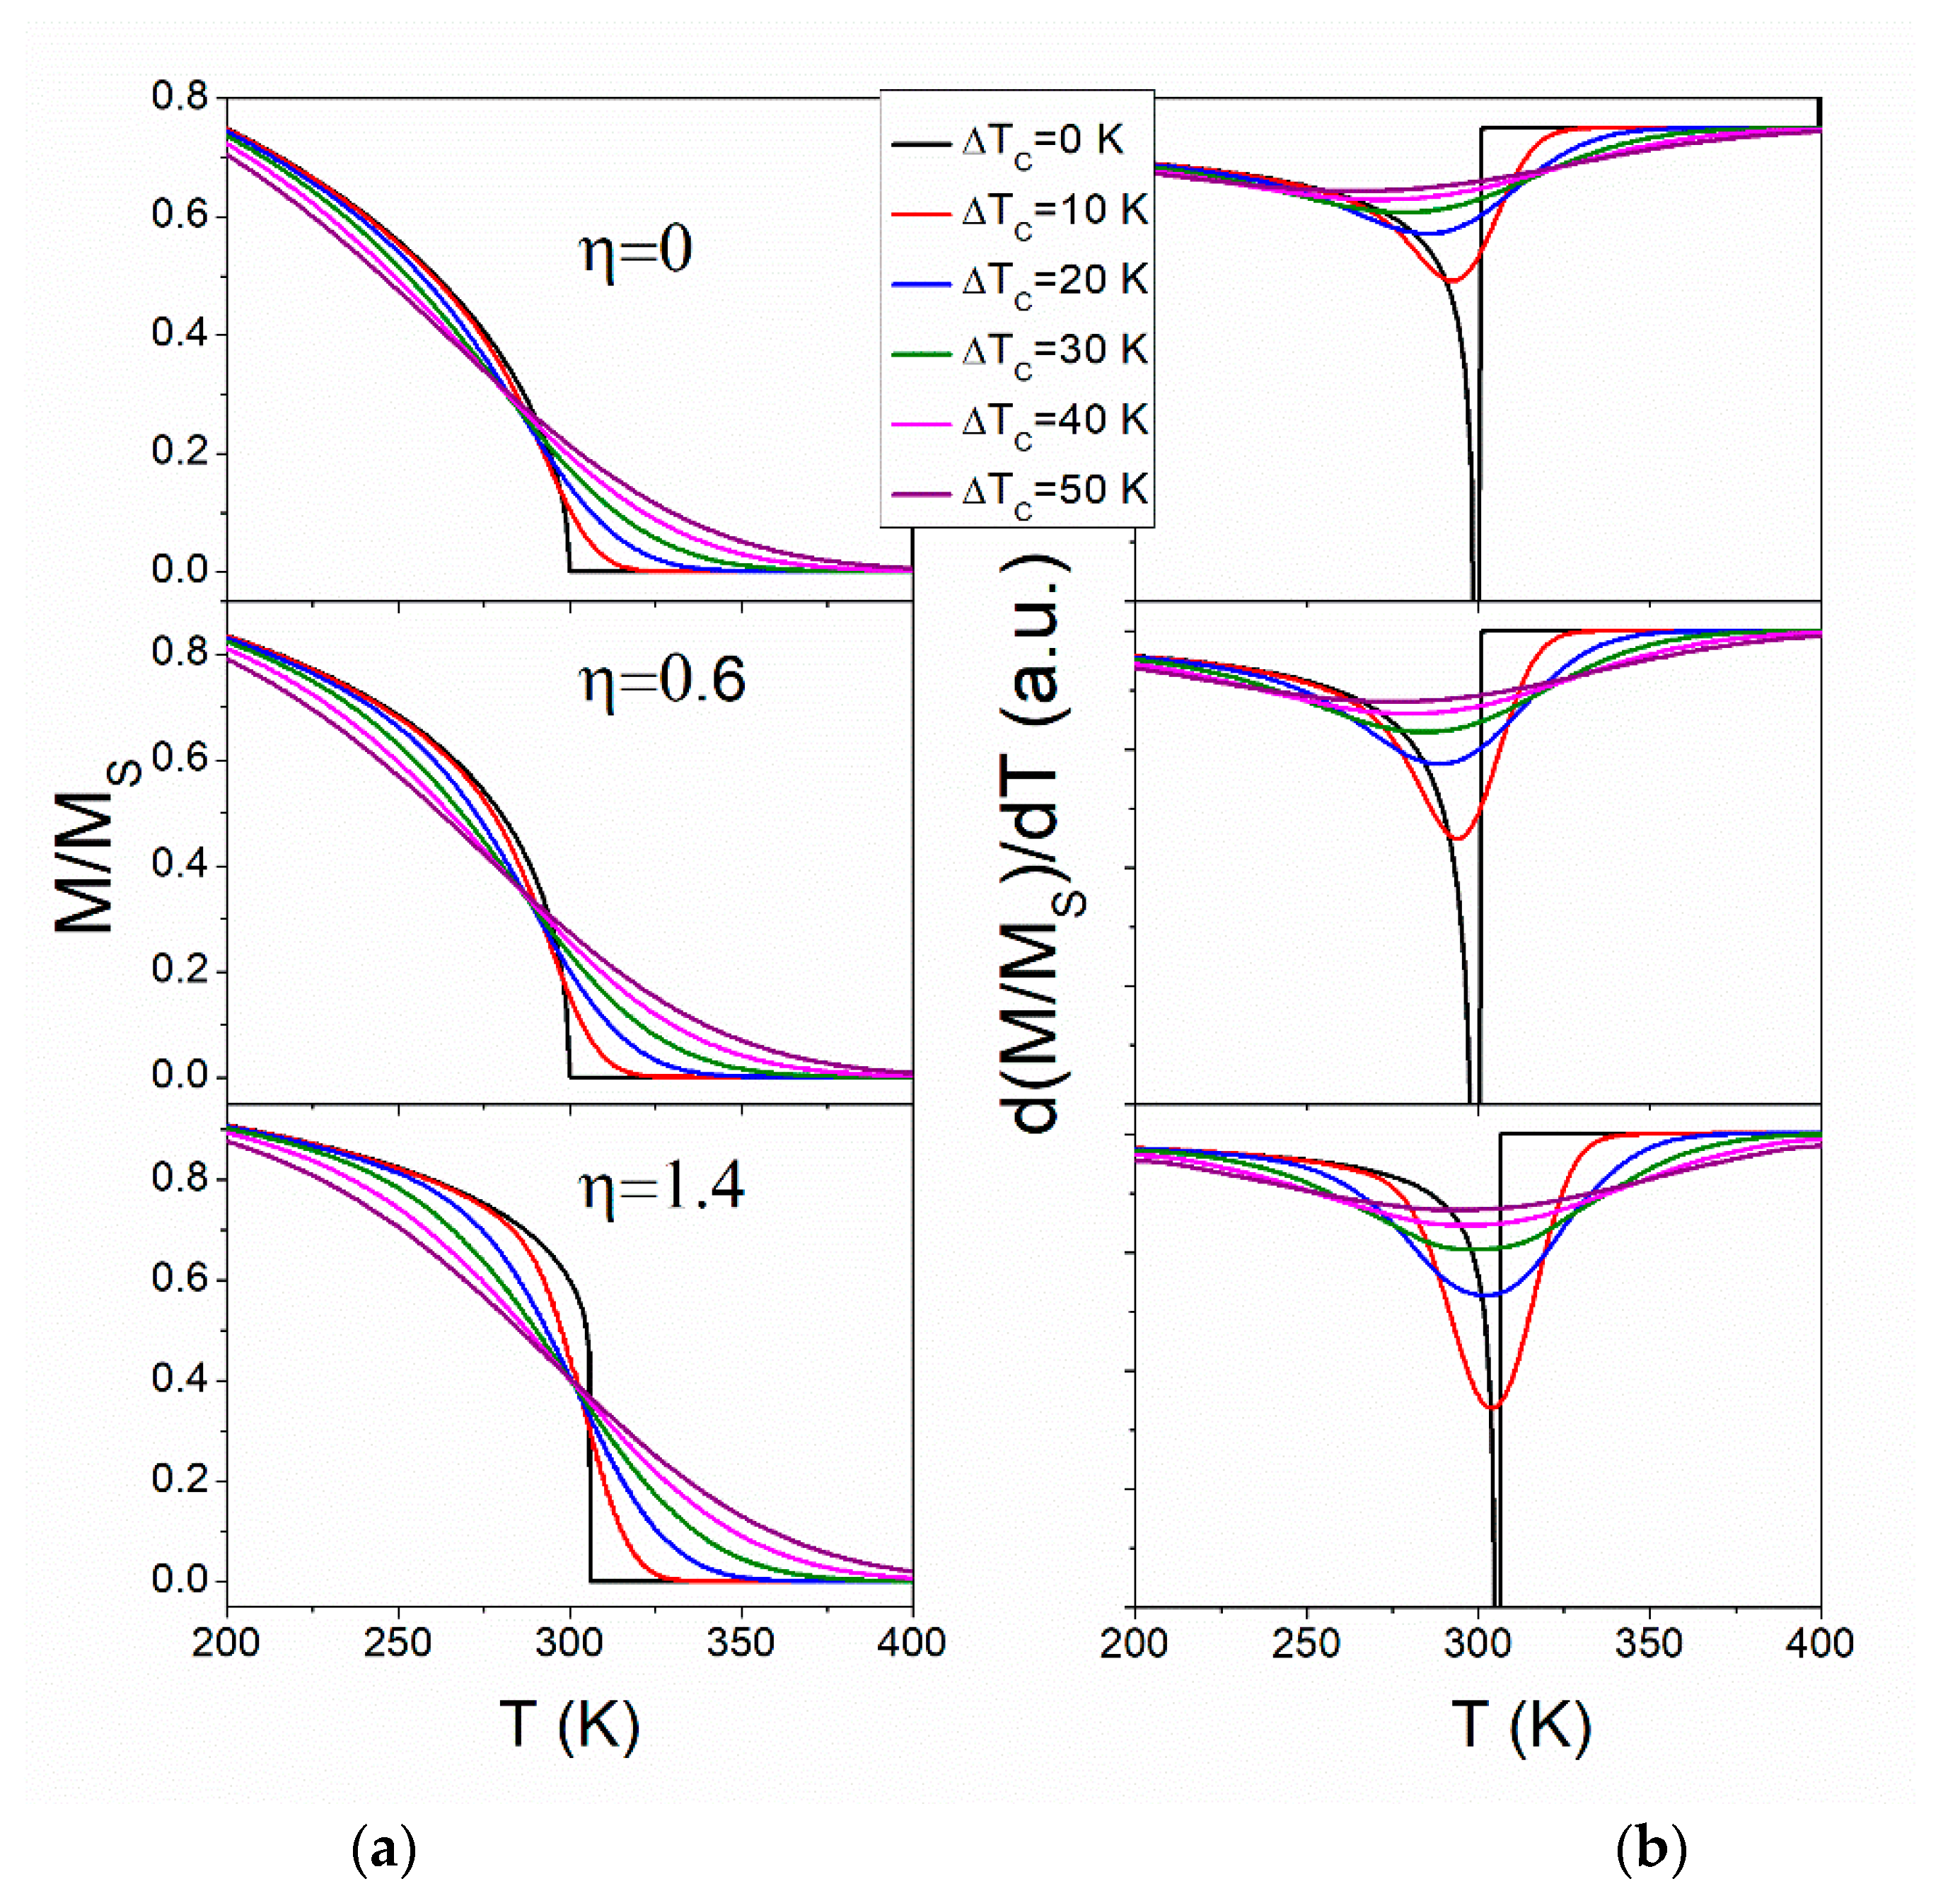
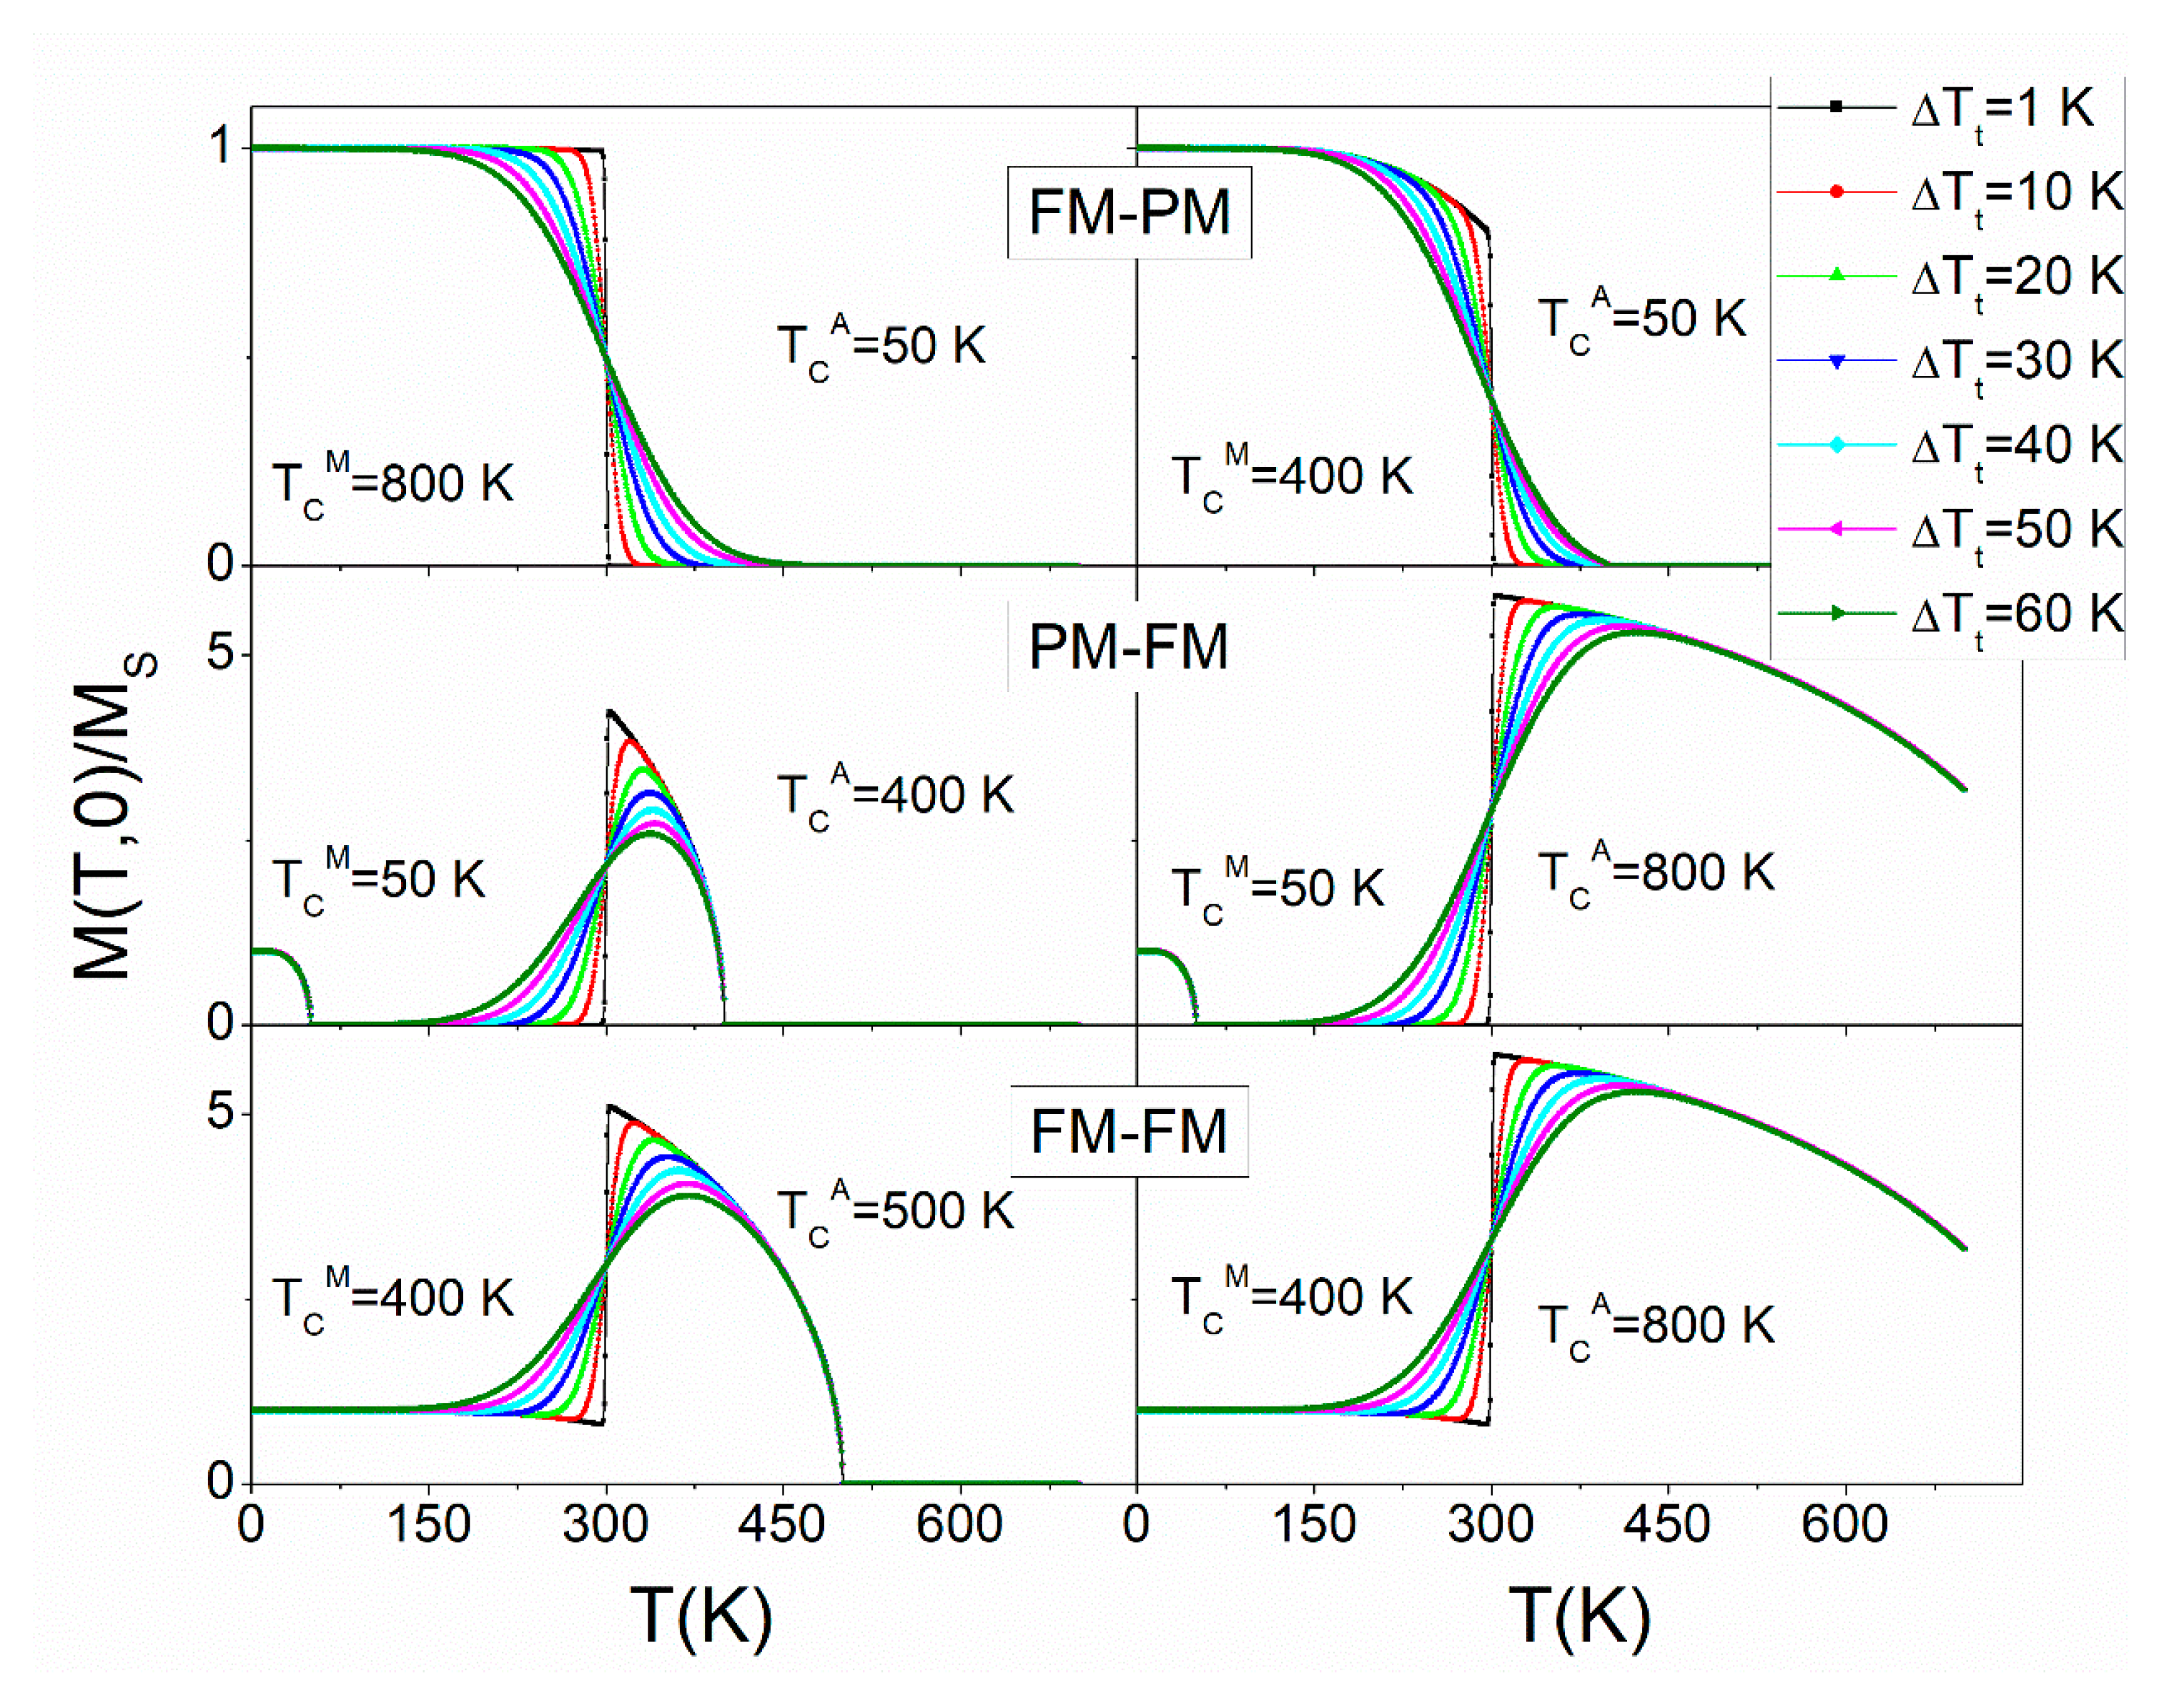
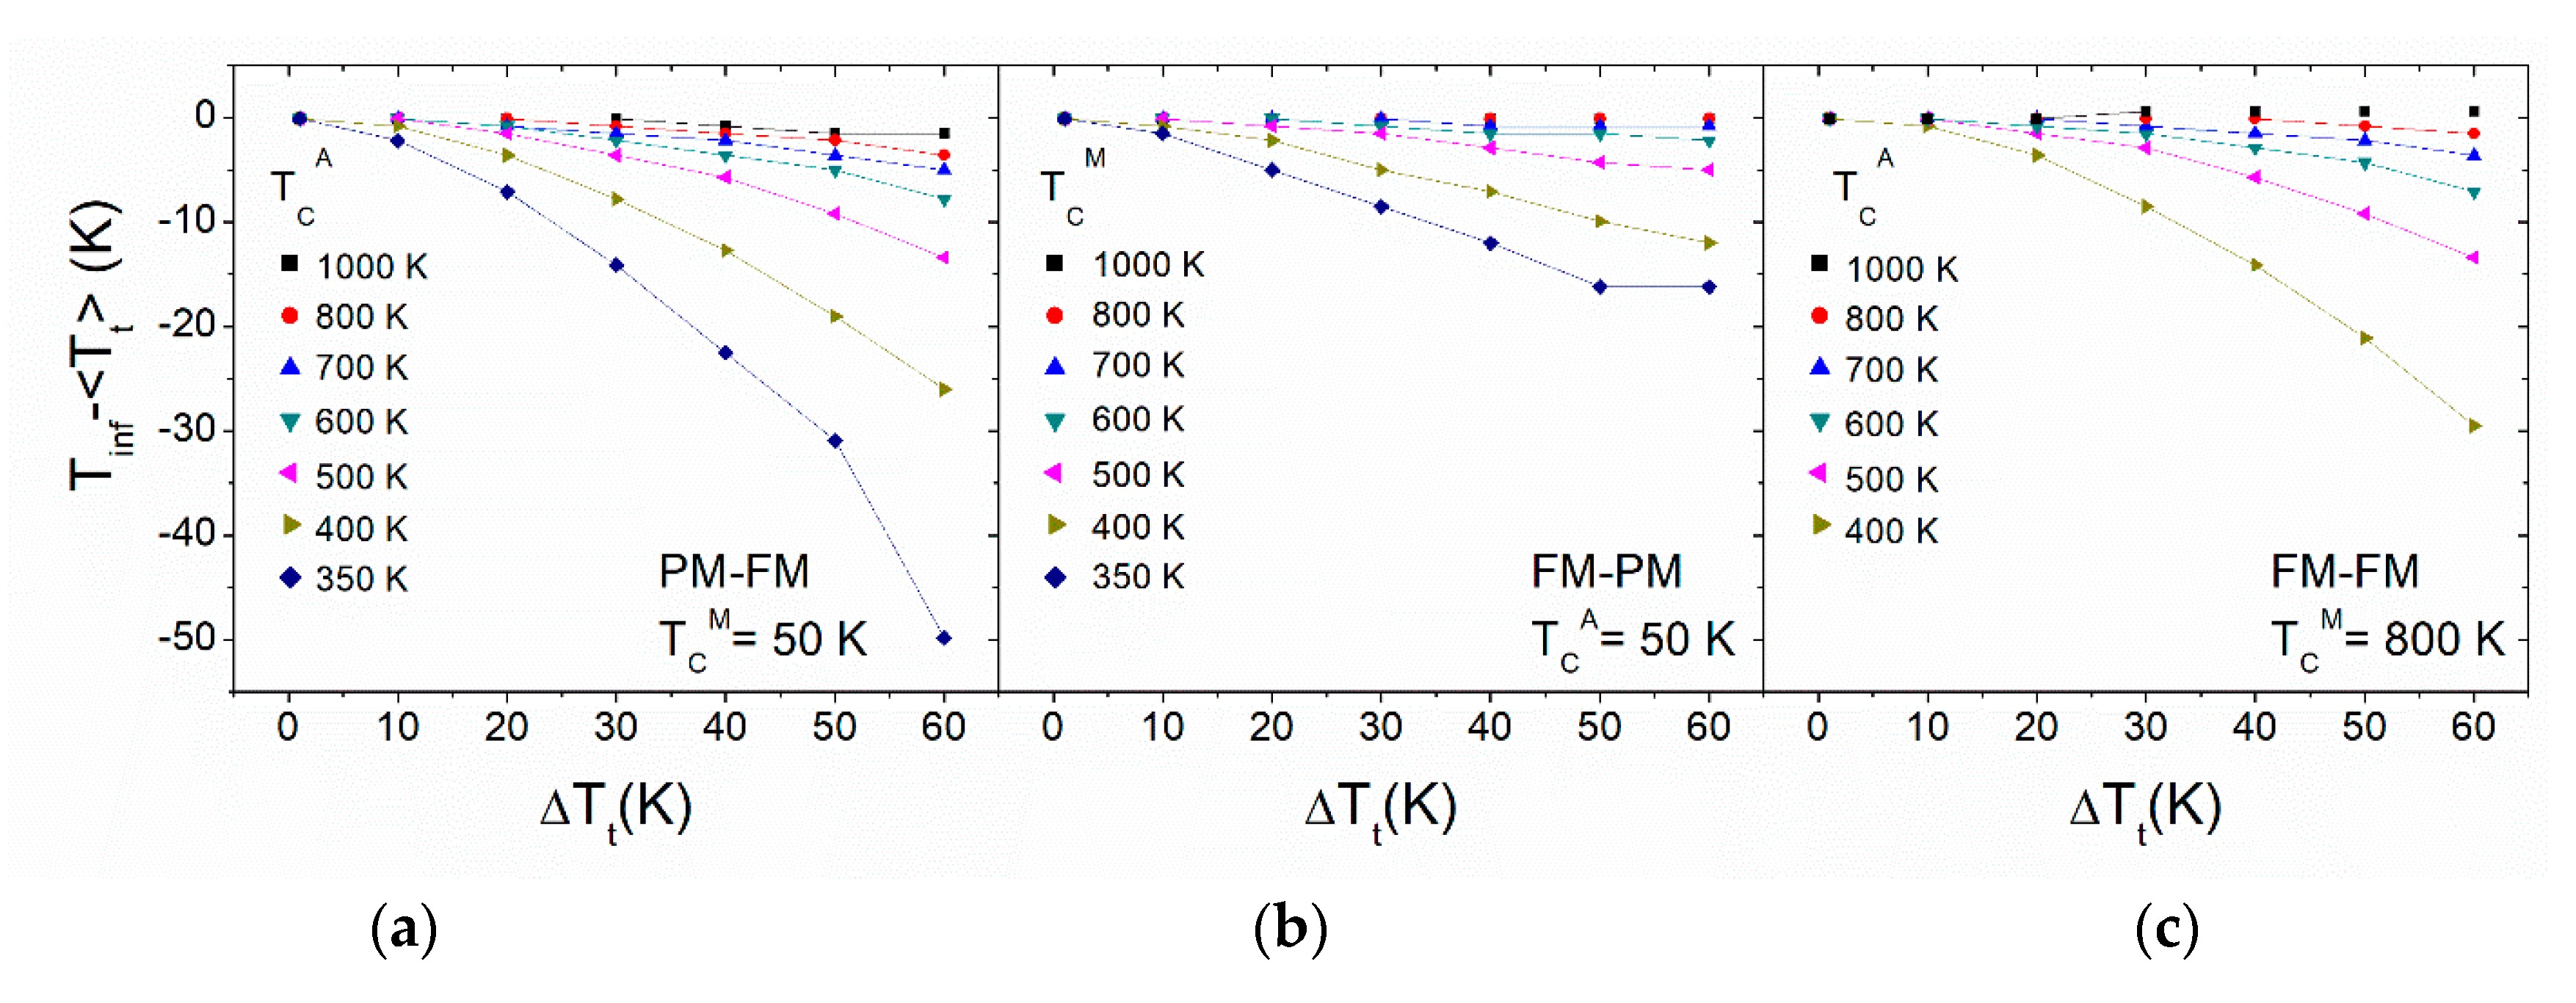
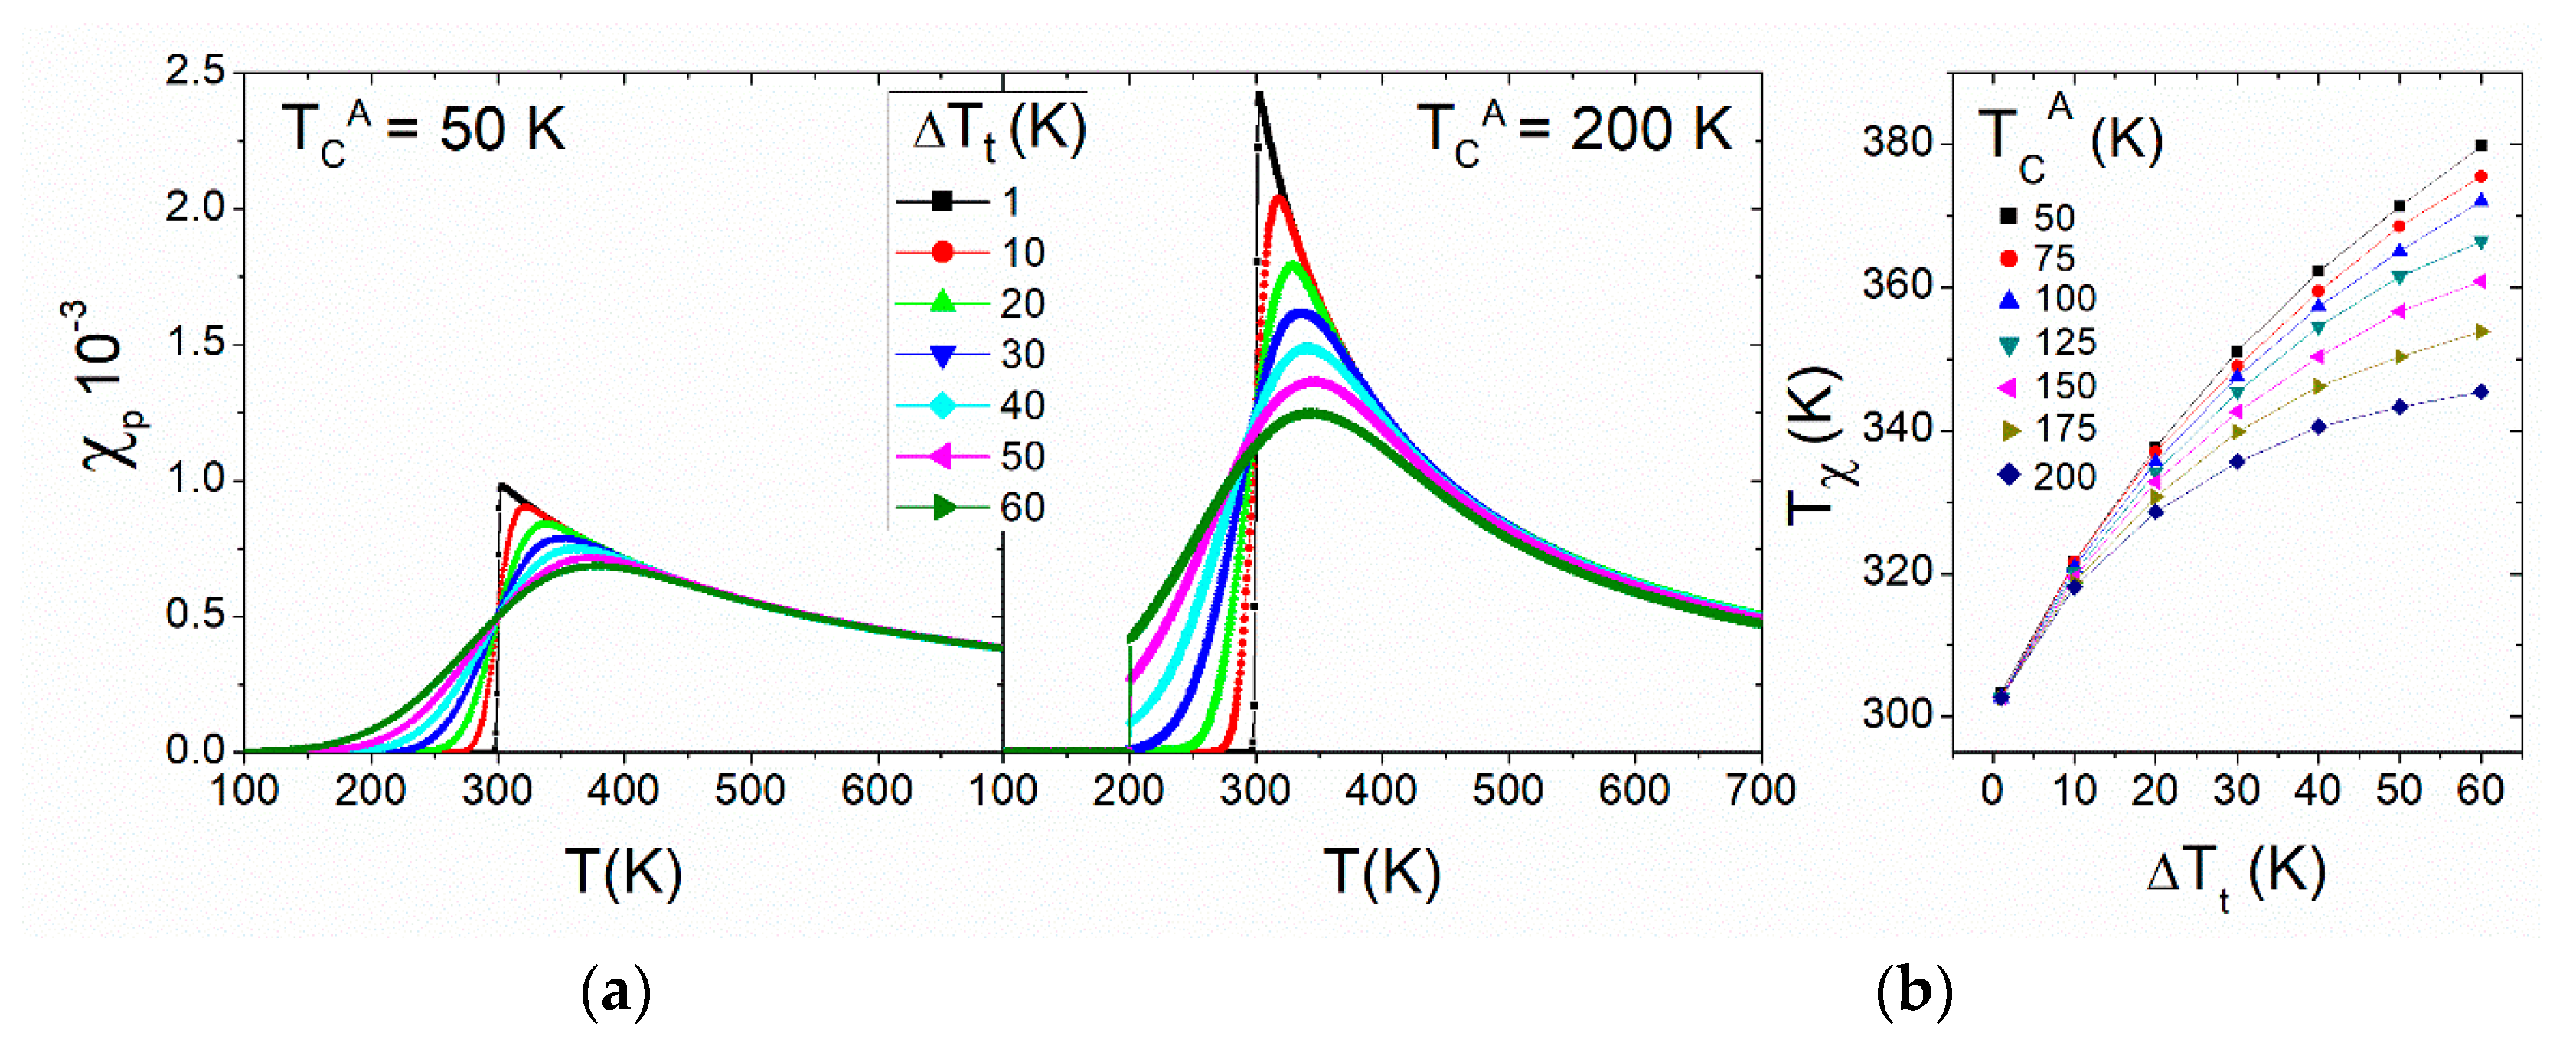
3. Effects of Distribution of Transition Temperatures

The most straightforward effect when a DTT occurs is the smearing of the magnetic transition. To show this effect, magnetization curves as a function of temperature and magnetic field, M ( T , H ) , were calculated using AN equation of state (EOS) [13]:
H 1 / γ = a ( T T C ) M 1 γ + b M 1 β + 1 γ
where a and b are prefactors and β and γ are the critical exponents. Figure 5a shows the obtained curves for different theoretical models (MF, Heisenberg, and Ising). Individual M i ( T , 0 ) curves were obtained for each contribution to a Gaussian distribution of T C i characterized by its standard deviation Δ T C and with an average T C = 300 K. These conditions for the distribution of T C are used along this work unless explicitly stated.
The smearing of the transition necessarily reduces the exponent β describing the decay of the magnetization, at zero field, as T C is approached from lower temperatures: M ~ ( T C T ) β . Figure 5b shows this effect for the calculated curves. Close to the transition (where the AN EOS is more reliable), β decreases. This could lead to a misinterpretation of the actual parameter of the system when a DTT is neglected. Although for T C T the exponent is preserved, it must be taken into account that AN EOS loses its validity far from T C . For example, a single Weiss contribution (dotted curve in upper panel of Figure 5b obtained from Brillouin function) deviates from linearity for T C T > 50 K.
Magnetocaloric effect (MCE) of different systems were analyzed considering a DTT: amorphous alloys [12,74], SOPT manganites [55,75], and other intermetallic phases [76]. It has been generally reported that the presence of a DTT leads to a decrease of the maximum of the magnetic entropy change, Δ S M . However, as the Δ S M ( T ) peak becomes broader, an enhancement of the refrigerant capacity can be obtained [76,77]. Whether this enhancement is significant will depend on the thermal range at which a high enough Δ S M is preserved.
Concerning MCE, the presence of a DTT affects the exponent n describing the field dependence of Δ S M p e a k ( H ) = Δ S M p e a k ( 1 T ) ( μ 0 H ) n at the peak temperature. This parameter is related to the critical exponents ( β , γ , δ ) describing the transition in SOPT pure systems [78]:
n = 1 + β 1 β + γ = 1 + 1 δ ( 1 1 β )
It has been shown [74,79] that, as Δ T C increases, n increases from the theoretical value corresponding to the pure phase towards 1. Although this could be a criterion to estimate Δ T C , it must be taken with care when there are FM impurities such as α-Fe, typically found in La-Fe-Si [80] or Fe-based amorphous [81], as they produce the same effect.
To describe FOPT, two different calculations have been done in this work. In a first approximation, magnetization curves were calculated using BR model [3] to describe magnetoelastic transitions:
M M s = B J [ g μ B J k B T ( μ 0 H + λ M + λ 3 M 3 ) ]
where B J ( y ) is the Brillouin function. Instead of referring to λ 3 coefficient, the model used refers to parameter η:
η = 10 3   J 2 ( J + 1 ) 2 2 J 2 + 2 J + 1 λ 3 λ ( n V g μ B ) 2
where n V is the numerical density of magnetic moments. For η < 1 , Equation (8) corresponds to a SOPT ( η = 0 corresponds to Weiss model) and, for η > 1 , it corresponds to FOPT, being η = 1 the curve corresponding to the tricritical point. Figure 6a shows M ( T , 0 ) / M S for different values of η and Δ T C and Figure 6b shows the corresponding 1 M S d M d T curves. It can be observed that the inflexion point, T i n f , shifts to lower temperatures as Δ T C increases. This feature is used in the next section.
The second method used here to describe FOPT considers abrupt changes from one low temperature phase (martensite) to a high temperature phase (austenite). Both phases are described by Weiss model with their corresponding magnetic moments and T C values. This simple approach tries to resemble very fast individual FOPT magnetostructural transformations, characteristic of martensitic transformations. Therefore, T C of the low temperature phase is named as martensitic Curie temperature, T C M , and that of the high temperature phase is named austenitic Curie temperature, T C A . As commented above (see Figure 4), martensitic transformation temperature, T t , is much more sensitive than Curie transitions in Heusler alloys. Therefore, we consider a Gaussian DTT of the martensitic transformation temperatures, with a standard deviation Δ T t , while T C M and T C A are considered constant. Figure 7 shows the calculated M ( T , 0 ) curves for different Δ T t and different T C M and T C A values, describing FM to PM, PM to FM, and low magnetization FM to high magnetization FM, respectively.

4. Models to Determine the Parameters of a Distribution of Transition Temperatures

Some authors have proposed to directly obtain the parameters of the distribution by fitting the zero-field magnetization versus temperature curves assuming a Gaussian distribution of T C and Weiss model for each individual contribution [82,83]. Besides the non-trivial function for fitting, this direct comparison between the Weiss theory and the experimental results asks for a good description of the system in a wide temperature range by this model.
Bebenin et al. [84] studied the magnetocaloric response of inhomogeneous La0.7X0.3MnO3 (with X = Ca and Ba) using a theoretical approach based on Landau theory, where the free energy per unit volume can be written as a power series of the magnetization M , and adding the external field term:
f = 1 2 a ( T T C ) M 2 + 1 4 B M 4 + 1 6 D M 6 μ 0 M H c o s ( θ )
where a ( T T C ) , B and D are the coefficients of the power series expansion in the Landau approximation. The temperature dependence is only considered for the quadratic prefactor and θ is the angle between field and magnetization. Based on a Gaussian distribution of T C , they proposed the following equation to describe the magnetic entropy change per unit volume, Δ s M ( H ) , at T C , in SOPT systems:
Δ s M p k ( H ) = a 2 [ ( μ 0 H B ) 2 / 3 a Δ T c 2 π B ]
where Δ T C is the standard deviation of the distribution and effects of demagnetizing field can be ignored when high enough fields are considered. At the tricritical point B = 0 , variations of this parameter lead to a different expression (assuming the standard deviation of B around 0 is small enough):
Δ s M p k ( H ) = a 2 [ ( μ 0 H D ) 2 / 5 0.411 a Δ T c D ]
Apparently from the representation of Δ s M p k vs. H 2 / 3 (or H 2 / 5 , in the case of systems at the tricritical point), the slope and the intercept would supply information on Δ T C . However, extra information is needed as three parameters need to be determined. Bebenin et al. also studied the FOPT case but restricted to low fields.
Recently, we proposed a method to obtain the parameters of the DTT, initially based on Weiss model [12] and thus only valid for such MF model describing SOPT. This method uses the differences between the inflexion point, T i n f , of the d M d T curves at zero field, the peak temperature of the MCE, T M C E , and the peak temperature, T χ , of the paramagnetic susceptibility ( χ P ) with respect to T C . The following equations can be obtained for each parameter (error in parenthesis):
T i n f W e i s s T C = 0.732 ( 6 ) Δ T c
T M C E W e i s s T C = 0.658 ( 8 ) Δ T c
T χ W e i s s T C = 0.503 ( 24 ) Δ T c 0.0040 ( 7 ) Δ T C 2
where superscript Weiss indicates the use of this model to describe the magnetization. Whereas T i n f and T M C E shift to lower values with respect to T C , T χ shifts to higher ones. Therefore, the combination of Equation (15) with Equation (13) or Equation (14) allows us to easily estimate T C and Δ T C . Calculations to obtain Equations (13)–(15) were done assuming T C = 300 K and quantum angular momentum J = 7 / 2 with a Landé factor of g =   2 (characteristic values of Gd) [1]. Although the parameters of Gd have been chosen, this does not represent any serious drawback or lack of generality. In fact, the change in T C does not affect the equations (except for T C too close to zero to significantly truncate the Gaussian DTT). However, there is a certain dependence on J , which is shown in Figure 8 for T i n f W e i s s . As it can be observed (keeping g =   2, which is valid for transition metals), the differences are only appreciable for Δ T c > 25 K. In the case of T χ W e i s s , a change in J will only change, in the same factor, the constant C of each individual χ p i = C / ( T T C i ) susceptibility contribution to the DTT and thus no effect is expected for Equation (15).
Experimentally, T i n f and T χ can be obtained from the analysis of the approach to saturation of the magnetization curves [85] and are independent of the magnetic field, while T M C E depends on the maximum applied field (i.e., Equation (14) is obtained for μ 0 Δ H = 1   T).
Assuming Arrott–Noakes EOS (using a =   1 Oe1/γ/K and b = 0.01 Oe1/γ(emu/g)-1/γ-1/β) to describe the systems, similar equations to Equations (13) and (15) can be obtained. Those for T i n f derived from the calculations shown in Figure 5 result:
T i n f M F T C = 0.770 ( 5 ) Δ T c
T i n f H e i s e n b e r g T C = 0.529 ( 4 ) Δ T c
T i n f I s i n g T C = 0.461 ( 5 ) Δ T c
Figure 9a shows the calculated χ P curves as a function of temperature for these three set of critical exponents in AN EOS and Figure 9b shows the evolution of the peak temperature with Δ T c . The equations derived from the fitting are:
T χ M F T C = 0.489 ( 18 ) Δ T c 0.0034 ( 4 ) Δ T c 2
T χ H e i s e n b e r g T C = 0.285 ( 19 ) Δ T c 0.0027 ( 5 ) Δ T c 2
T χ I s i n g T C = 0.377 ( 22 ) Δ T c 0.0036 ( 4 ) Δ T c 2
Concerning calculations derived from BR model, Figure 10 shows the η dependence of the slope of T i n f T C vs. Δ T c . A quadratic dependence is observed for values describing SOPT. The following equation can be derived for SOPT:
T i n f B R ( η ) T C = [ 0.730 ( 3 ) + 0.218 ( 21 ) η + 0.188 ( 22 ) η 2 ] Δ T c
In the case of FOPT, the difference becomes constant for η > 1.5 ( T i n f B R ( η ) T C ~ 0.15 ).
In the η range corresponding to SOPT, magnetic transition of each individual contribution to DTT occurs at its T c i and thus Equation (15) holds and T χ B R ( η < 1 ) = T χ W e i s s . However, for FOPT ( η > 1 ) the magnetic transitions of each individual contributions are shifted to higher temperatures than their corresponding T c i in the DTT and T χ B R ( η > 1 ) T χ W e i s s . As η increases in this range, the deviation from linearity increases.
Finally, concerning our simple model for magnetostructural transitions (magnetization shown in Figure 7), the change in the inflexion point, T i n f F O P T , depends on the Curie temperature of the FM phase. For high enough values of that T C , T i n f F O P T ~ T t , as shown in Figure 11.
In this FOPT model, the study of χ P is senseless except for the transition from a FM low temperature martensite to a PM high temperature austenite. Figure 12a shows two examples of χ P ( T ) for this type of transition along with the evolution of T χ as a function of T C A and Δ T t (Figure 12b). This plot (Figure 12b), in combination with Figure 11b, can be used to estimate the parameters of the DTT. However, for those transitions with a FM phase above T t , a rough estimation of the DTT parameters could be obtained by fitting the d M / d T curves to a Gaussian function (assuming Curie temperatures are far away from the martensitic transition).

5. Experimental Test of the Proposed Model

To test the proposed model for determining the parameters of the DTT, two different series are used: mechanically alloyed partially amorphous Fe75Nb10B15 alloys and half-Heusler MnCo0.8Fe0.2Ge intermetallics developed after annealing of a precursor amorphous system. Microstructure of the samples was characterized by X-ray diffraction (XRD). Details on their production and microstructural and magnetic characterization can be found in [86,87] for the amorphous Fe75Nb10B15 alloys and, for the MnCo0.8Fe0.2Ge intermetallics, in [88].
To apply the different equations (e.g., for Weiss systems, Equations (13)–(15)), magnetization curves are needed. From the analysis of the approach to saturation curves, T i n f and T are obtained (a linear approach is used for simplification). Moreover, to obtain T M C E , magnetic entropy curves are calculated from thermomagnetic dependence of magnetization using Maxwell thermodynamic relation:
Δ S M ( T ) = 0 H m a x μ 0 M ( T , H ) T d H
As expected from Equation (23), T M C E , the temperature for the maximum Δ S M , depends on the maximum applied field H m a x . This value was set to 1 T, as it was done for all the calculations presented above. Magnetization measurements were performed in a Lakeshore 7407 vibrating sample magnetometer. Δ S M ( T ) curves were obtained using the Magnetocaloric Effect Analysis Program [89] to the magnetization curves.

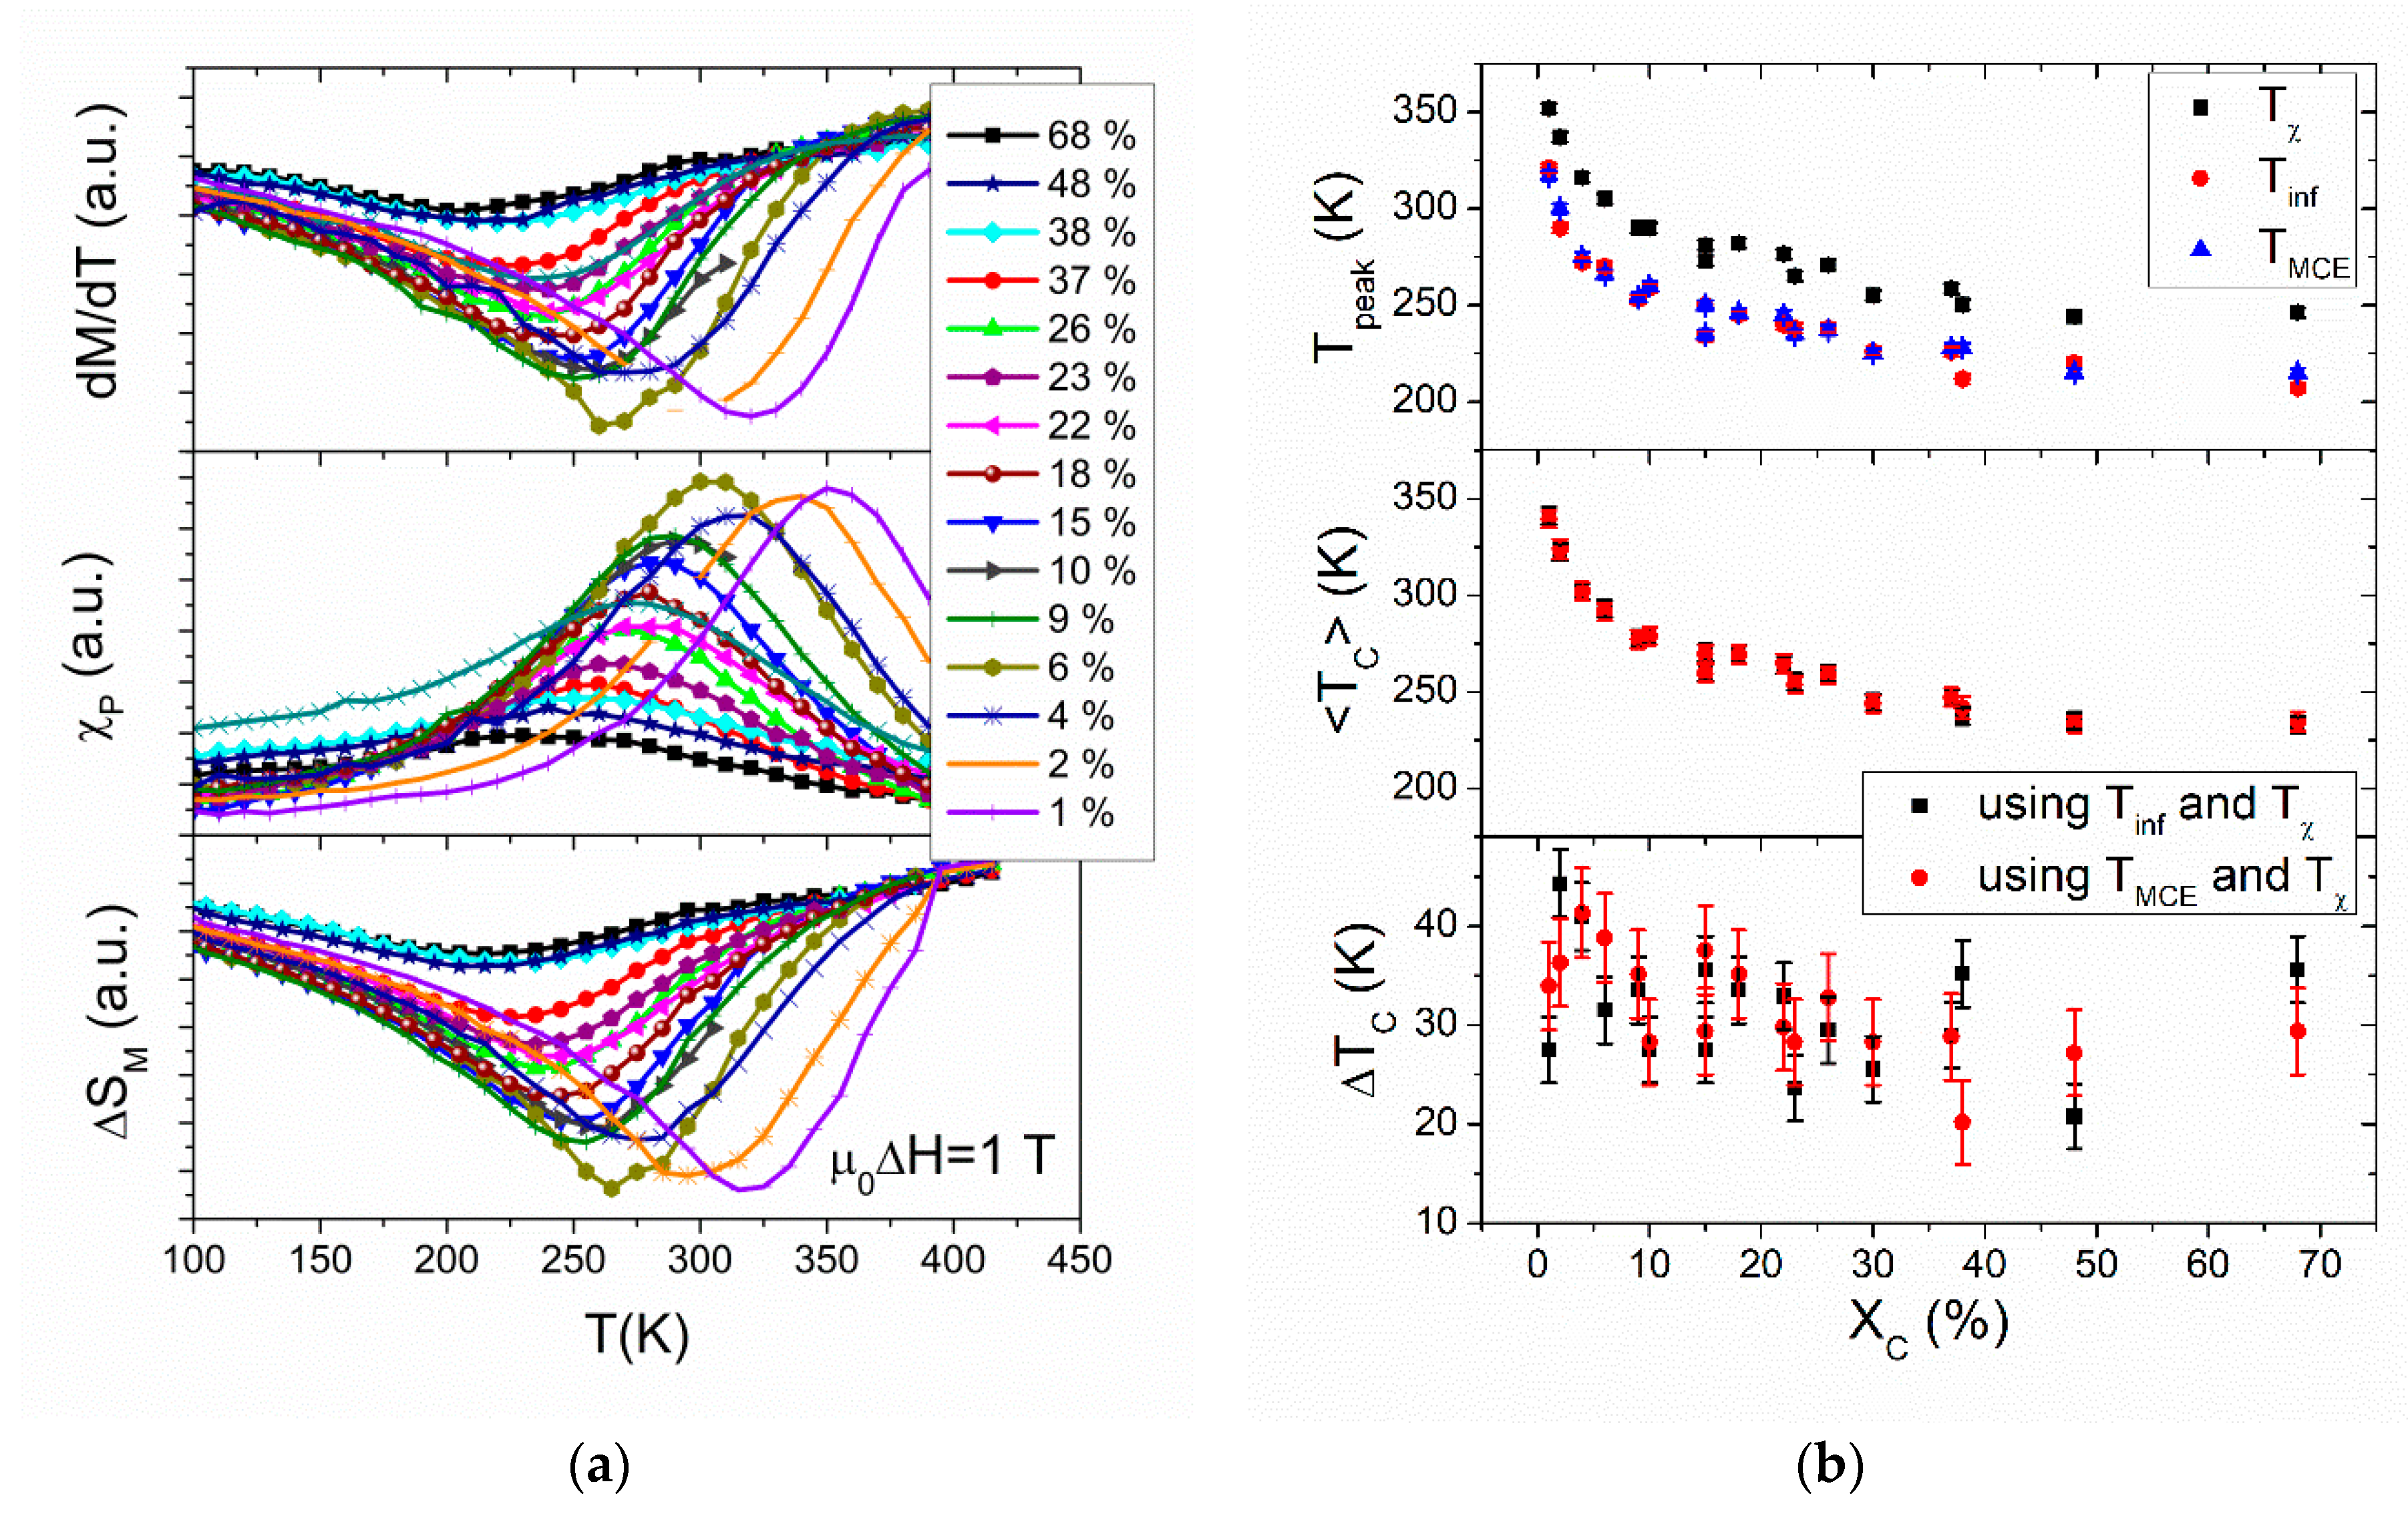
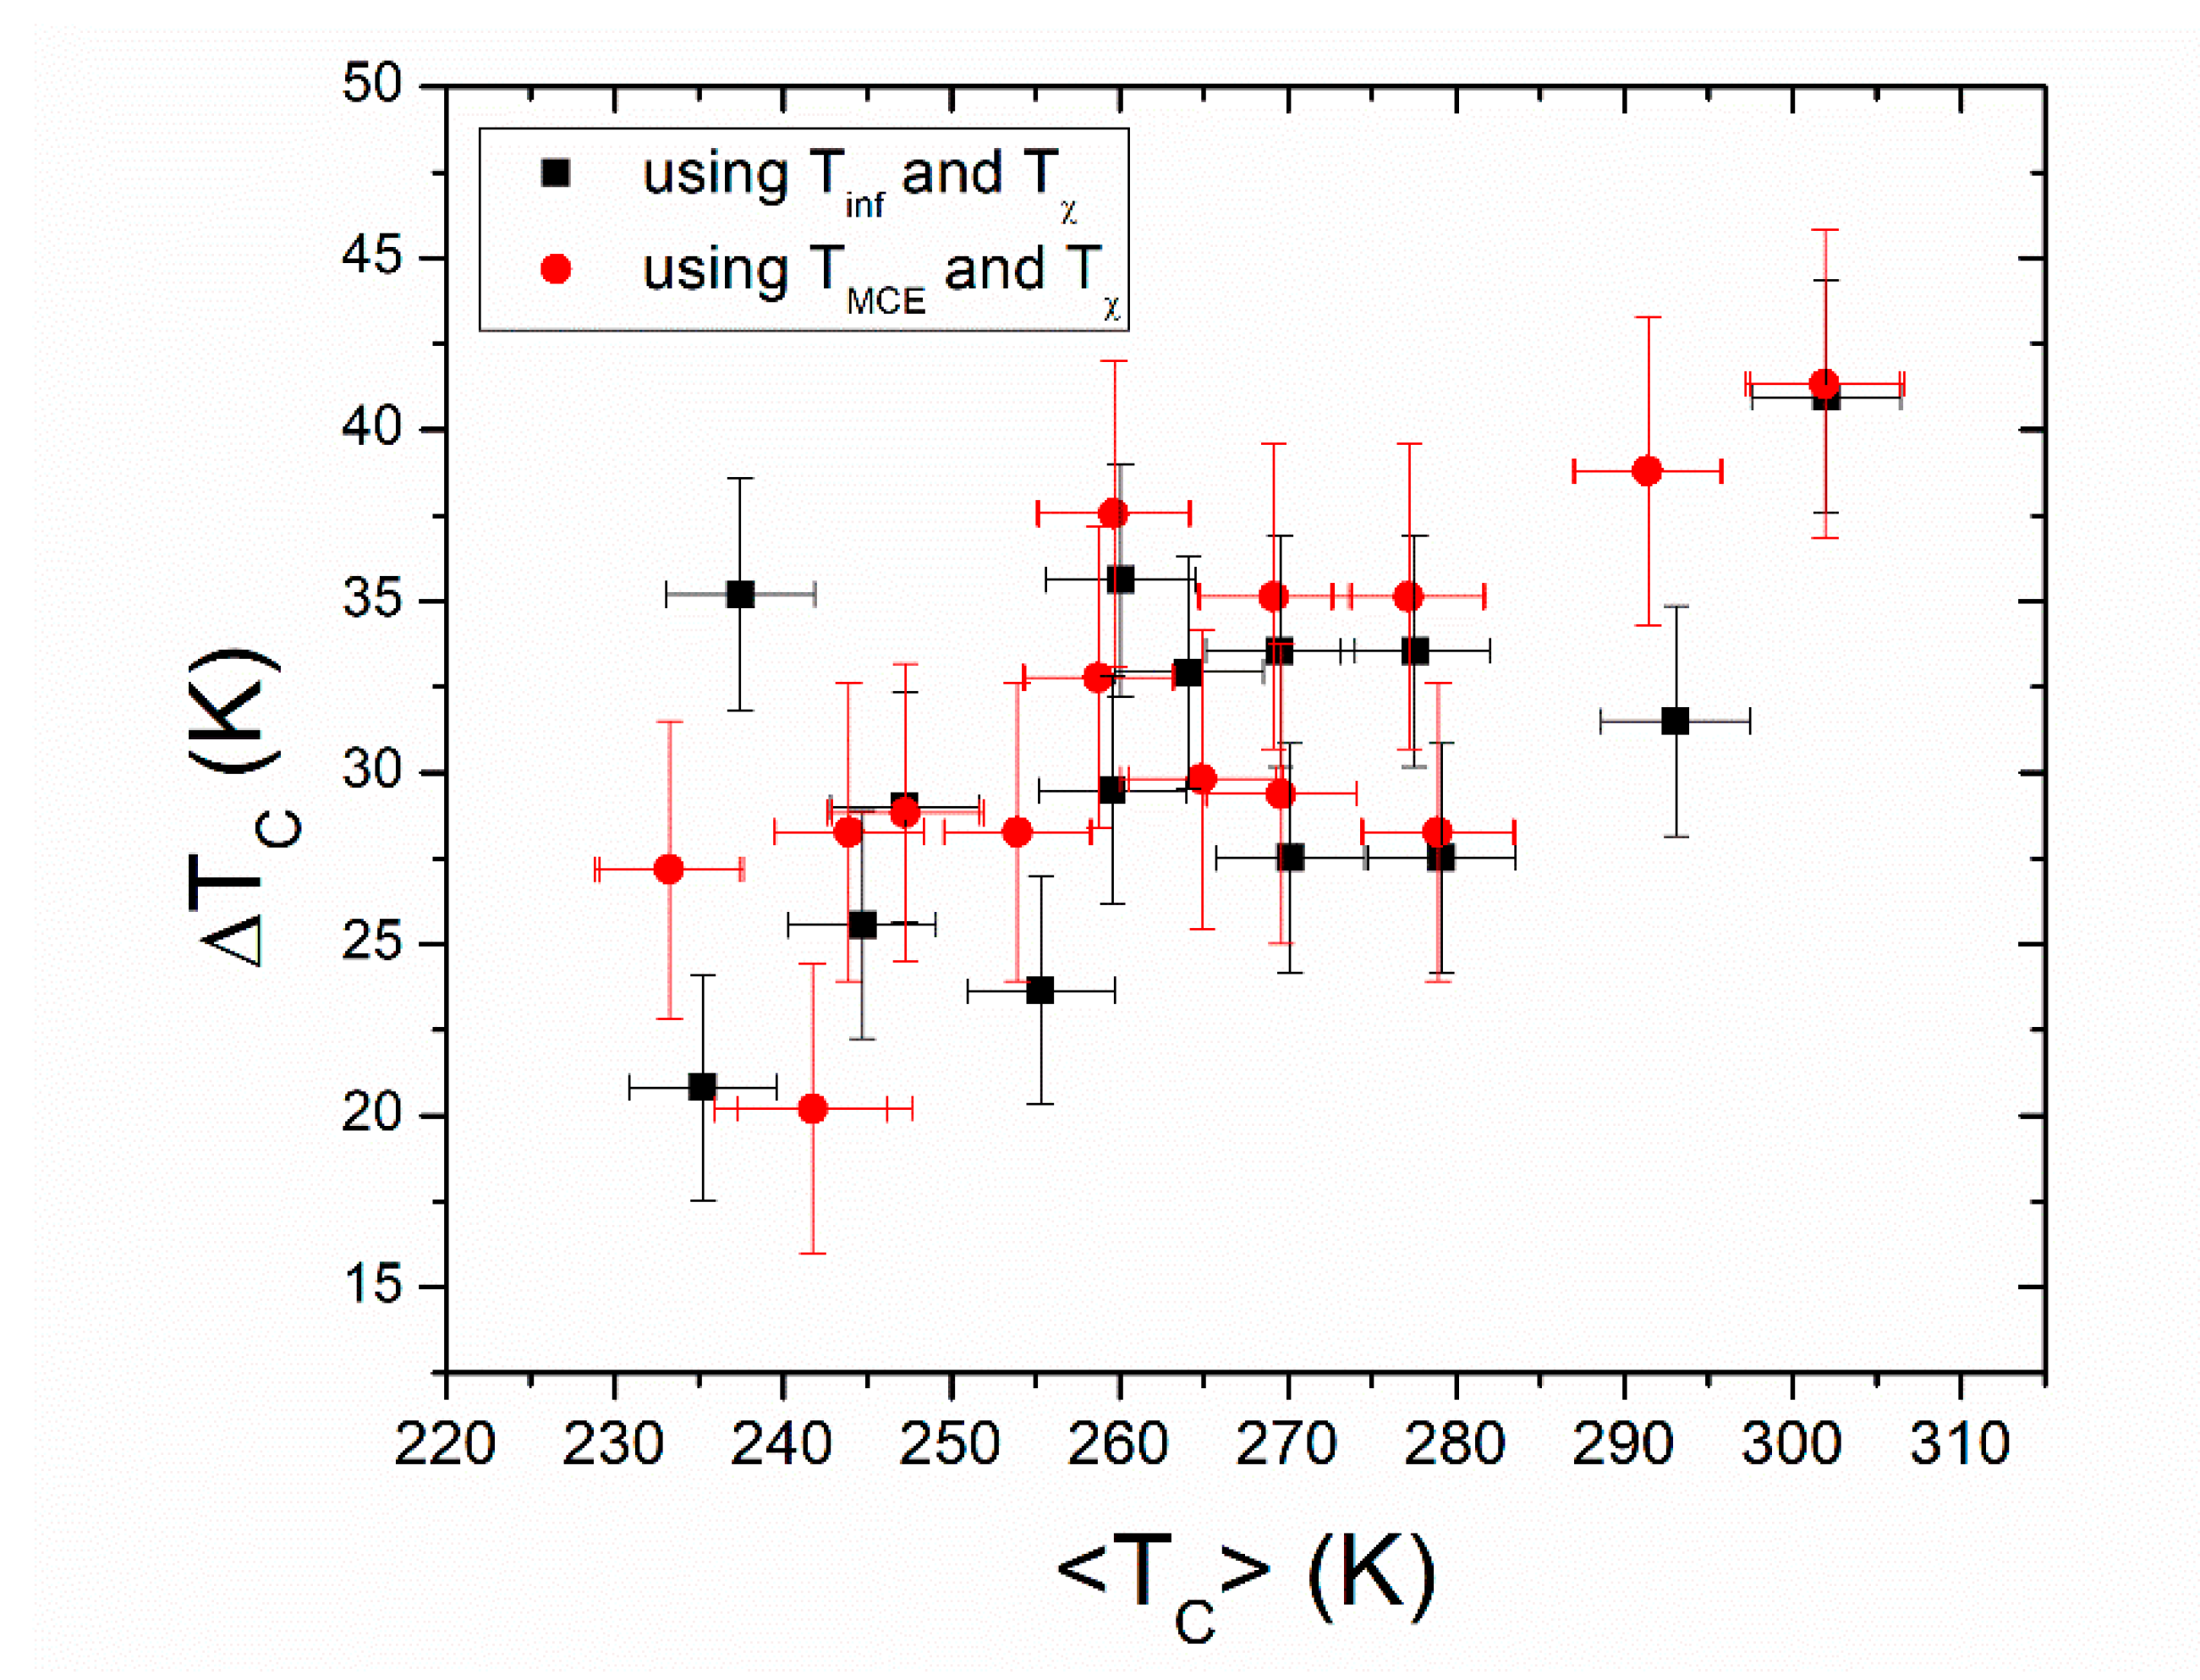
5.1. Partially Amorphous Fe75Nb10B15 Mechanically Alloyed Systems

As a first example, we have applied the previously described method based on the shift of peak temperatures in the frame of the Weiss model (Equations (13)–(15)) to a series of partially amorphous Fe75Nb10B15 alloys. Figure 13a shows the XRD patterns of several partially amorphized samples (the fraction of α-Fe crystalline phase, X C , obtained from Mössbauer spectrometry [81,86,87] for each sample is indicated). Figure 13b shows, as an example, the M ( T , H ) curves of a Fe75Nb10B15 alloy with X C   = 15%. As the magnetic transition studied in this alloy corresponds to the Curie transition of the amorphous phase, effects such as crystal size can be discarded to be responsible of the presence of a DTT. Therefore, compositional heterogeneities can be considered. As crystalline fraction increases, the geometrical distribution of the amorphous phase would resemble a porous sponge-like configuration with the nanocrystals in the pores.
Figure 14a shows the d M / d T at μ 0 H = 0 T and the χ P curves from a linear fitting of the high field magnetization curves along with the Δ S M ( T ) curves (integrated from 0 to μ 0 H = 1 T) for samples with different values of X C .
Figure 14b (upper panel) shows the dependence of the different experimental peak temperatures as a function of X C . From these experimental data, the parameters of the DTT, T C , and Δ T C can be obtained applying Equations (13)–(15) for each sample. T C is shown in the middle panel of Figure 14b and Δ T C in the lower panel of Figure 14b as a function of X C .
Two set of results can be obtained either using Equation (13) combined with Equation (15) or using Equations (14) and (15). Both practical combinations yield the same T C values (between the error bars) and it is clear that, as milling time increases and X C decreases, T C increases. This is due to the progressive increase in Fe content in the amorphous matrix (in agreement with the general case shown in Figure 1) as the α-Fe crystallites disappears.
Concerning Δ T C , this parameter does not show a clear trend due to the large relative error bar. However, when Δ T C is represented as a function of T C (Figure 15), excluding the extreme data ( X C 2% and X C = 68%), a certain correlation between both magnitudes could be inferred. As milling progresses and X C decreases, the DTT describing the amorphous phase would become broader. This can be understood after considering the compositional profile of Nb in Fe-based nanocrystalline systems, where Nb piles up at the boundary of nanocrystals [90]. Therefore, a higher X C implies closer nanocrystals. This leads to a larger overlapping between the compositional profiles and yields a thinner compositional distribution, implying a smaller Δ T C . This is schematically described in Figure 16.
Differences between average values of Δ T C , Δ T C , obtained using T i n f ( Δ T C   =   31 ± 6 K) and using T M C E ( Δ T C   = 32 ± 5 K) are smaller than the error bar. It is worth mentioning that the experimental value of the field exponent of Δ S M p k (after correcting impurities and demagnetizing field), n = 0.757 ± 0.012 [81], is clearly above 0.67 (the theoretical value for a Weiss model). From [74], a Δ T C ~ 20 K can shift n from 0.67 to ~0.8, for MF models.

5.2. Half-Heusler MnCo0.8Fe0.2Ge Intermetallics

MnCo0.8Fe0.2Ge intermetallics were obtained from controlled crystallization of a mechanically amorphized alloy, which was produced after 50 h of milling. Figure 17a shows the XRD patterns of samples heated at 20 K/min in argon up to the different indicated temperatures. Figure 17b shows the crystal size and the lattice parameters of the crystalline phase as a function of the annealing temperature. XRD results were analyzed by Rietveld fitting (Goodness of fit below 1.8). The samples are single phase and the crystal size increases as annealing temperature increases. Figure 18 shows, as an example, the magnetization curves at different temperatures for a MnCo(Fe)Ge sample heated up to 723 K at 20 K/min.
Figure 19a shows the d M / d T at μ 0 H = 0 T, the χ P , and the Δ S M ( T ) curves for samples obtained after heating at different temperatures (indicated in the legend) at 20 K/min. Crystallization of the amorphous phase produced by mechanical alloying occurs at ~550 K. Above this temperature, the only change in the microstructure between the different samples is the crystal size, which almost linearly increases from 14 to 38 nm with the heating temperature in the explored range [91].
No clear trend is observed in the experimental peak temperatures (Figure 19b, upper panel) with the annealing temperature of the different samples (i.e., with the crystal size) being the differences smaller than the error bars. However, a clear difference between T and the other two experimental values indicates the existence of a DTT. The estimate average value Δ T C ~ 10 K (using both T i n f and T M C E ) does not show any trend with the experimental crystal size. T C can be tailored in these compositions by changing the Fe content [92,93], which could be the source of the DTT. This value is clearly smaller than that previously found for the amorphous matrix in FeNbB, which is in agreement with a more restricted composition in the crystalline phase. Moreover, as there is no dependence on the crystal size, the presence of a crystal size distribution can be discarded as responsible for the existence of the DTT.
Concerning the parameters of the DTT in the frame of Weiss model (Figure 19b, middle and lower panels), the differences between using Equation (13) in combination with Equation (15) and the results using Equations (14) and (15) are smaller than error bars.
The experimental values of n could be taken as the slope of a linear fitting of l n ( Δ S M p k ) vs. l n ( H ) (for 1 μ 0 H 1.5 T to prevent demagnetizing field effects). However, the average over the different samples is n = 0.799 ± 0.015 , much higher than those expected for pure phases, which agrees with the existence of a DTT. In fact, taking into account Equation (11), the exponent of a pure phase n p u r e cannot be directly obtained by a linear fitting of l n ( Δ S M p k ) vs. l n ( H ) when a DTT exists, as there is an extra term proportional to Δ T C . When this fact is taken into account, an average value over the different half-Heusler samples yields n p u r e = 0.65 ± 0.04 , which is in the range of values corresponding to Weiss model.

6. Conclusions

During the production of experimental samples, the presence of compositional inhomogeneities, disordering, and distribution of crystal sizes or stress fields can lead to the presence of a distribution of transition temperatures (DTT). Concerning those transitions implying a change in the magnetic properties of the system, the presence of a DTT leads to deviations from the predictions derived from models of pure single phases. In this work, some of these effects are summarized.
From the study of the temperature dependence of the approach to saturation curves, saturation magnetization and paramagnetic susceptibility can be experimentally obtained. The shift of the peak temperatures of these two magnitudes has been analyzed for different model systems (Weiss, Heisenberg, Ising, and Bean and Rodbell) and we have proposed a set of equations to estimate the parameters of the DTT from these shifts.
The results were applied to two different series of alloys, partially amorphous Fe-Nb-B and MnCo(Fe)Ge half-Heusler alloys, for which a mean field model describes the experimental data. It is pointed that the proposed equations depend on the assumed model but the study of the variation of other magnetic properties, such as the magnetocaloric effect, could help to elucidate the most appropriate model to describe our system.

Author Contributions

Conceptualization, A.F.M.-G. and J.S.B.; methodology, A.F.M.-G., R.L.-M., A.V.-C., J.J.I., and J.S.B.; formal analysis, A.F.M.-G., R.L.-M., A.V.-C., J.J.I., and J.S.B.; writing—original draft preparation, A.F.M.-G. and J.S.B.; and writing—review and editing, A.F.M.-G., R.L.-M., A.V.-C., J.J.I., J.S.B. C.F.C., and A.C. All authors have read and agreed to the published version of the manuscript.

Funding

This research was funded by AEI/FEDER-UE (Project MAT 2016-77265-R) and the PAI of the Regional Government of Andalucía.

Acknowledgments

A.F. Manchón-Gordón acknowledges his contract to the VPPI-US of the University of Sevilla. A. Vidal-Crespo acknowledges his PEJUS contract to VPPI-US of the University of Sevilla.

Conflicts of Interest

The authors declare no conflict of interest.

References

  1. Blundell, S. Magnetism in Condensed Matter; Oxford master series in condensed matter physics; Oxford University Press: London, UK, 2001; ISBN 0198505914. [Google Scholar]
  2. Jia, L.; Sun, J.R.; Shen, J.; Dong, Q.Y.; Zou, J.D.; Gao, B.; Zhao, T.Y.; Zhang, H.W.; Hu, F.X.; Shen, B.G. Magnetocaloric effects in the La(Fe,Si)13 intermetallics doped by different elements. J. Appl. Phys. 2009, 105, 07A924. [Google Scholar] [CrossRef]
  3. Bean, C.P.; Rodbell, D.S. Magnetic Disorder as a First-Order Phase Transformation. Phys. Rev. 1962, 126, 104–115. [Google Scholar] [CrossRef]
  4. Planes, A.; Stern-Taulats, E.; Castán, T.; Vives, E.; Mañosa, L.; Saxena, A. Caloric and Multicaloric Effects in Shape Memory Alloys. Mater. Today Proc. 2015, 2, S477–S484. [Google Scholar] [CrossRef]
  5. Ghahremani, M.; ElBidweihy, H.; Bennett, L.H.; Della Torre, E.; Zou, M.; Johnson, F. Implicit measurement of the latent heat in a magnetocaloric NiMnIn Heusler alloy. J. Appl. Phys. 2013, 113, 17A943. [Google Scholar] [CrossRef]
  6. Pareti, L.; Solzi, M.; Albertini, F.; Paoluzi, A. Giant entropy change at the co-occurrence of structural and magnetic transitions in the Ni2.19Mn0.81Ga Heusler alloy. Eur. Phys. J. B 2003, 32, 303–307. [Google Scholar] [CrossRef] [Green Version]
  7. Kosogor, A.; L’vov, A.V.; Lázpita, P.; Seguí, C.; Cesari, E. Magnetocaloric Effect Caused by Paramagnetic Austenite–Ferromagnetic Martensite Phase Transformation. Metals 2018, 9, 11. [Google Scholar] [CrossRef] [Green Version]
  8. Han, Z.D.; Wang, D.H.; Zhang, C.L.; Xuan, H.C.; Gu, B.X.; Du, Y.W. Low-field inverse magnetocaloric effect in Ni50−xMn39+xSn11 Heusler alloys. Appl. Phys. Lett. 2007, 90, 42507. [Google Scholar] [CrossRef]
  9. Gottschall, T.; Skokov, K.P.; Benke, D.; Gruner, M.E.; Gutfleisch, O. Contradictory role of the magnetic contribution in inverse magnetocaloric Heusler materials. Phys. Rev. B 2016, 93, 184431. [Google Scholar] [CrossRef]
  10. Madiligama, A.S.B.; Ari-Gur, P.; Ren, Y.; Koledov, V.v.; Dilmieva, E.T.; Kamantsev, A.P.; Mashirov, A.v.; Shavrov, V.G.; Gonzalez-Legarreta, L.; Grande, B.H. Thermal and magnetic hysteresis associated with martensitic and magnetic phase transformations in Ni52Mn25In16Co7 Heusler alloy. J. Mag. Mag. Mater. 2017, 442, 25–35. [Google Scholar] [CrossRef]
  11. Sutou, Y.; Imano, Y.; Koeda, N.; Omori, T.; Kainuma, R.; Ishida, K.; Oikawa, K. Magnetic and martensitic transformations of NiMnX(X=In, Sn, Sb) ferromagnetic shape memory alloys. Appl. Phys. Lett. 2004, 85, 4358–4360. [Google Scholar] [CrossRef]
  12. Manchón-Gordón, A.F.; Moreno-Ramírez, L.M.; Ipus, J.J.; Blázquez, J.S.; Conde, C.F.; Franco, V.; Conde, A. A procedure to obtain the parameters of Curie temperature distribution from thermomagnetic and magnetocaloric data. J. Non. Cryst. Solids 2019, 520, 119460. [Google Scholar] [CrossRef]
  13. Arrott, A.; Noakes, J.E. Approximate Equation of State For Nickel Near its Critical Temperature. Phys. Rev. Lett. 1967, 19, 786–789. [Google Scholar] [CrossRef]
  14. Kirchmayr, H.R.; Poldy, C.A. Magnetism in rare earth—3d intermetallics. J. Magn. Magn. Mater. 1978, 8, 1–42. [Google Scholar] [CrossRef]
  15. Liu, X.B.; Altounian, Z. Magnetocaloric effect in (Er1-xGdx)Co2 pseudobinary compounds. J. Magn. Magn. Mater. 2005, 292, 83–88. [Google Scholar] [CrossRef]
  16. Jensen, J.; Mackintosh, A.R. Rare Earth Magnetism: Structures and Excitations; International Series of Monographs on Physics; Oxford Science Publications, Clarendon Press: London, UK, 1991; ISBN 0198520271. [Google Scholar]
  17. Stearns, M.B. Why is iron magnetic? Phys. Today 1978, 31, 34–39. [Google Scholar] [CrossRef]
  18. Janke-Gilman, N.; Hochstrasser, M.; Willis, R.F. Measuring atomic moment and magnetic order through magnetic linear dichroism with angular dependence studies of transition-metal alloys. Phys. Rev. B 2004, 70, 184439. [Google Scholar] [CrossRef]
  19. McHenry, M.E.; Willard, M.A.; Laughlin, D.E. Amorphous and nanocrystalline materials for applications as soft magnets. Prog. Mater. Sci. 1999, 44, 291–433. [Google Scholar] [CrossRef]
  20. Huo, J.T.; Zhao, D.Q.; Bai, H.Y.; Axinte, E.; Wang, W.H. Giant magnetocaloric effect in Tm-based bulk metallic glasses. J. Non. Cryst. Solids 2013, 359, 1–4. [Google Scholar] [CrossRef]
  21. Du, J.; Zheng, Q.; Li, Y.B.; Zhang, Q.; Li, D.; Zhang, Z.D. Large magnetocaloric effect and enhanced magnetic refrigeration in ternary Gd-based bulk metallic glasses. J. Appl. Phys. 2008, 103, 23918. [Google Scholar] [CrossRef] [Green Version]
  22. Fang, Y.K.; Lai, C.H.; Hsieh, C.C.; Zhao, X.G.; Chang, H.W.; Chang, W.C.; Li, W. Magnetocaloric effect of the Gd-LRE-Al-(Co, Fe) (LRE=La, Ce, Pr, Nd) glassy ribbons in the intermediate temperature. J. Phys. Conf. Ser. 2011, 266, 12002. [Google Scholar] [CrossRef]
  23. Fang, Y.K.; Chen, H.C.; Hsieh, C.C.; Chang, H.W.; Zhao, X.G.; Chang, W.C.; Li, W. Structures and magnetocaloric effects of Gd65−xRExFe20Al15 (x = 0–20; RE=Tb, Dy, Ho, and Er) ribbons. J. Appl. Phys. 2011, 109, 07A933. [Google Scholar] [CrossRef]
  24. Foldeaki, M.; Giguère, A.; Gopal, B.R.; Chahine, R.; Bose, T.K.; Liu, X.Y.; Barclay, J.A. Composition dependence of magnetic properties in amorphous rare-earth-metal-based alloys. J. Magn. Magn. Mater. 1997, 174, 295–308. [Google Scholar] [CrossRef]
  25. Liu, X.Y.; Barclay, J.A.; Gopal, R.B.; Földeàki, M.; Chahine, R.; Bose, T.K.; Schurer, P.J.; LaCombe, J.L. Thermomagnetic properties of amorphous rare-earth alloys with Fe, Ni, or Co. J. Appl. Phys. 1996, 79, 1630–1641. [Google Scholar] [CrossRef]
  26. Johnson, F.; Shull, R.D. Amorphous-FeCoCrZrB ferromagnets for use as high-temperature magnetic refrigerants. J. Appl. Phys. 2006, 99, 08K909. [Google Scholar] [CrossRef]
  27. Wang, Y.; Bi, X. The role of Zr and B in room temperature magnetic entropy change of FeZrB amorphous alloys. Appl. Phys. Lett. 2009, 95, 262501. [Google Scholar] [CrossRef]
  28. Álvarez, P.; Gorria, P.; Sánchez Marcos, J.; Fernández Barquín, L.; Blanco, J.A. The role of boron on the magneto-caloric effect of FeZrB metallic glasses. Intermetallics 2010, 18, 2464–2467. [Google Scholar] [CrossRef]
  29. Franco, V.; Blázquez, J.S.; Ipus, J.J.; Law, J.Y.; Moreno-Ramírez, L.M.; Conde, A. Magnetocaloric effect: From materials research to refrigeration devices. Prog. Mater. Sci. 2018, 93, 112–232. [Google Scholar] [CrossRef]
  30. Dörr, K. Ferromagnetic manganites: Spin-polarized conduction versus competing interactions. J. Phys. D. Appl. Phys. 2006, 39, R125–R150. [Google Scholar] [CrossRef]
  31. Phan, M.-H.; Yu, S.-C. Review of the magnetocaloric effect in manganite materials. J. Magn. Magn. Mater. 2007, 308, 325–340. [Google Scholar] [CrossRef]
  32. Wali, M.; Skini, R.; Khlifi, M.; Dhahri, E.; Hlil, E.K. A giant magnetocaloric effect with a tunable temperature transition close to room temperature in Na-deficient La0.8Na0.2−xxMnO3 manganites. Dalt. Trans. 2015, 44, 12796–12803. [Google Scholar] [CrossRef]
  33. Regaieg, Y.; Sicard, L.; Monnier, J.; Koubaa, M.; Ammar-Merah, S.; Cheikhrouhou, A. Magnetic and magnetocaloric properties of La0.85(Na1−xKx)0.15MnO3 ceramics produced by reactive spark plasma sintering. J. Appl. Phys. 2014, 115, 17A917. [Google Scholar] [CrossRef]
  34. Skini, R.; Omri, A.; Khlifi, M.; Dhahri, E.; Hlil, E.K. Large magnetocaloric effect in lanthanum-deficiency manganites La0.8−xxCa0.2MnO3 (0.00≤x≤0.20) with a first-order magnetic phase transition. J. Magn. Magn. Mater. 2014, 364, 5–10. [Google Scholar] [CrossRef]
  35. Szewczyk, A.; Gutowska, M.; Dabrowski, B.; Plackowski, T.; Danilova, N.P.; Gaidukov, Y.P. Specific heat anomalies in La1-xSrxMnO3 (0.12 <= x <= 0.2). Phys. Rev. B 2005, 71, 224432. [Google Scholar]
  36. Mira, J.; Rivas, J.; Hueso, L.E.; Rivadulla, F.; López Quintela, M.A. Drop of magnetocaloric effect related to the change from first- to second-order magnetic phase transition in La2/3(Ca1−xSrx)1/3MnO3. J. Appl. Phys. 2002, 91, 8903–8905. [Google Scholar] [CrossRef]
  37. Barik, S.K.; Mahendiran, R. Effect of Bi doping on magnetic and magnetocaloric properties of La0.7−xBixSr0.3MnO3 (0≤x≤0.4). J. Appl. Phys. 2010, 107, 93906. [Google Scholar] [CrossRef]
  38. Moreno-Ramírez, L.M.; Romero-Muñiz, C.; Law, J.Y.; Franco, V.; Conde, A.; Radulov, I.A.; Maccari, F.; Skokov, K.P.; Gutfleisch, O. Tunable first order transition in La(Fe,Cr,Si)13 compounds: Retaining magnetocaloric response despite a magnetic moment reduction. Acta Mater. 2019, 175, 406–414. [Google Scholar] [CrossRef]
  39. Fujita, A.; Fujieda, S.; Hasegawa, Y.; Fukamichi, K. Itinerant-electron meta-magnetic transition and large magnetocaloric effects in La(FexSi1-x)13 compounds and their hydrides. Phys. Rev. B 2003, 67, 104416. [Google Scholar] [CrossRef] [Green Version]
  40. Hu, F.X.; Gao, J.; Qian, X.L.; Ilyn, M.; Tishin, A.M.; Sun, J.R.; Shen, B.G. Magnetocaloric effect in itinerant electron metamagnetic systems La(Fe1−xCox)11.9Si1.1. J. Appl. Phys. 2005, 97, 10M303. [Google Scholar] [CrossRef] [Green Version]
  41. Fujieda, S.; Fujita, A.; Fukamichi, K. Enhancement of magnetocaloric effects in La1−zPrz(Fe0.88Si0.12)13 and their hydrides. J. Appl. Phys. 2007, 102, 23907. [Google Scholar] [CrossRef]
  42. Herzer, G. Soft Magnetic Materials—Nanocrystalline Alloys. Handb. Magn. Adv. Magn. Mater. 2007. [Google Scholar]
  43. Gutfleisch, O.; Willard, M.A.; Brück, E.; Chen, C.H.; Sankar, S.G.; Liu, J.P. Magnetic Materials and Devices for the 21st Century: Stronger, Lighter, and More Energy Efficient. Adv. Mater. 2011, 23, 821–842. [Google Scholar] [CrossRef]
  44. Wohlfarth, E.P. Magnetic properties of single domain ferromagnetic particles. J. Magn. Magn. Mater. 1983, 39, 39–44. [Google Scholar] [CrossRef]
  45. Morup, S.; Hansen, M.F. Handbook of Magnetic and Advanced Magnetic Materials; John Willey & Sons: Hoboken, NJ, USA, 2007. [Google Scholar]
  46. Cao, L.; Xie, D.; Guo, M.; Park, H.S.; Fujita, T. Size and shape effects on Curie temperature of ferromagnetic nanoparticles. Trans. Nonferrous Met. Soc. China 2007, 17, 1451–1455. [Google Scholar] [CrossRef]
  47. Jensen, P.J.; Dreyssé, H.; Bennemann, K.H. Thickness dependence of the magnetization and the Curie temperature of ferromagnetic thin films. Surf. Sci. 1992, 269–270, 627–631. [Google Scholar] [CrossRef]
  48. Santos, J.D.; Sanchez, T.; Alvarez, P.; Sanchez, M.L.; Sanchez Llamazares, J.L.; Hernando, B.; Escoda, L.; Escoda, L.; Suñol, J.J.; Varga, R. Microstructure and magnetic properties of Ni50Mn37Sn13 Heusler alloy ribbons. J. Apply. Phys. 2008, 103, 07B326. [Google Scholar] [CrossRef]
  49. Andrade, V.M.; Vivas, R.J.C.; Pedro, S.S.; Tedesco, J.C.G.; Rossi, A.L.; Coelho, A.A.; Rocco, D.L.; Reis, M.S. Magnetic and magnetocaloric properties of La0.6Ca0.4MnO3 tunable by particle size and dimensionality. Acta Mater. 2016, 102, 49–55. [Google Scholar] [CrossRef] [Green Version]
  50. Das, K.; Das, I. Giant enhancement of magnetocaloric effect at room temperature by the formation of nanoparticle of La0.48Ca0.52MnO3 compound. J. Appl. Phys. 2016, 119, 93903. [Google Scholar] [CrossRef]
  51. Dong, Q.; Shen, B.; He, S.; Jiang, H.; Zheng, W.; Sun, J. Effect of Crystal Grain Dimension on the Magnetic Properties and Magnetocaloric Effects in DyCuAl Compound. J. Nanosci. Nanotechnol. 2012, 12, 1040–1043. [Google Scholar] [CrossRef]
  52. Gorria, P.; Álvarez, P.; Marcos, J.S.; Sánchez Llamazares, J.L.; Pérez, M.J.; Blanco, J.A. Crystal structure, magnetocaloric effect and magnetovolume anomalies in nanostructured Pr2Fe17. Acta Mater. 2009, 57, 1724–1733. [Google Scholar] [CrossRef]
  53. Wang, W.; Yu, J.; Zhai, Q.; Luo, Z.; Zheng, H. Origin of retarded martensitic transformation in Heusler Ni–Mn–Sn melt-spun ribbons. Intermetallics 2013, 42, 126–129. [Google Scholar] [CrossRef]
  54. Dasa, R.; Saravanan, P.; Arvindha Babu, D.; Perumal, A.; Srinivasan, A. Influence of solidification rate and heat treatment on magnetic refrigerant properties of melt spun Ni51Mn34In14Si1 ribbons. J. Magn. Magn. Mater. 2013, 344, 152–157. [Google Scholar] [CrossRef]
  55. Zhang, Y.; Zheng, Q.; Xia, W.; Zhang, J.; Du, J.; Yan, A. Enhanced large magnetic entropy change and adiabatic temperature change of Ni43Mn46Sn11 alloys by a rapid solidification method. Scr. Mater. 2015, 104, 41–44. [Google Scholar] [CrossRef]
  56. Aguilar-Ortiz, C.O.; Camarillo-García, J.P.; Vergara, J.; Álvarez-Alonso, P.; Salazar, D.; Chernenko, V.A.; Flores-Zúñiga, H. Effect of solidification rate on martensitic transformation behavior and adiabatic magnetocaloric effect of Ni50Mn35In15 ribbons. J. Alloys Compd. 2018, 748, 464–472. [Google Scholar] [CrossRef]
  57. Waitz, T.; Karnthaler, H.P. Martensitic transformation of NiTi nanocrystals embedded in an amorphous matrix. Acta Mater. 2004, 52, 5461–5469. [Google Scholar] [CrossRef]
  58. Seki, K.; Kura, H.; Sato, T.; Taniyama, T. Size dependence of martensite transformation temperature in ferromagnetic shape memory alloy FePd. J. Apply. Phys. 2008, 103, 063910. [Google Scholar] [CrossRef]
  59. Amaral, J.S.; Tavares, P.B.; Reis, M.S.; Araújo, J.P.; Mendonça, T.M.; Amaral, V.S.; Vieira, J.M. The effect of chemical distribution on the magnetocaloric effect: A case study in second-order phase transition manganites. J. Non. Cryst. Solids 2008, 354, 5301–5303. [Google Scholar] [CrossRef]
  60. Pizarro, R.; Garitaonandia, J.S.; Plazaola, F.; Barandiarán, J.M.; Greneche, J.M. Magnetic and Mössbauer study of multiphase Fe-Zr amorphous powders obtained by high energy ball milling. J. Phys. Condens. Matter. 2000, 12, 3101–3112. [Google Scholar] [CrossRef]
  61. Fujita, A.; Fukamichi, K.; Gejima, F.; Kainuma, R.; Ishida, K. Magnetic properties and large magnetic-field-induced strains in off-stoichiometric Ni–Mn–Al Heusler alloys. Appl Phys. Lett. 2000, 77, 3054. [Google Scholar] [CrossRef]
  62. Zhang, J.; Cai, W.; Gao, Z.Y.; Sui, J.H. Microstructures and magnetic property in Mn-rich off-stoichiometric Mn2NiGa Heusler alloys. Scripta Mater. 2008, 58, 798–801. [Google Scholar] [CrossRef]
  63. Rama Rao, N.V.; Gopalan, R.; Manivel Raja, M.; Chandrasekaran, V.; Suresh, K.G. Mössbauer studies on structural ordering and magnetic properties of melt-spun Ni–Fe–Ga ribbon. Appl. Phys. Lett. 2008, 93, 202503. [Google Scholar] [CrossRef]
  64. Passamani, E.C.; Córdova, C.; Alves, A.L.; Moscon, P.S.; Larica, C.; Takeuchi, A.Y.; Biondo, A. Magnetic studies of Fe-doped martensitic Ni2Mn1.44Sn0.56-type Heusler alloy. J. Phys. D: Appl. Phys. 2009, 42, 215006. [Google Scholar] [CrossRef]
  65. D’Souza, S.W.; Roy, T.; Barman, S.R.; Chakrabarti, A. Magnetic properties and electronic structure of Mn–Ni–Ga magnetic shape memory alloys. J. Phys. Condens. Matter 2014, 26, 506001. [Google Scholar] [CrossRef] [PubMed] [Green Version]
  66. Gutierrez, J.; Lazpita, P.; Barandiaran, J.M.; Fdez-Gubieda, M.L.; Chaboy, J.; Kawamura, N. Annealing influence on the atomic ordering and magnetic moment in a Ni–Mn–Ga alloy. J. Magn. Magn. Mater. 2007, 316, e610. [Google Scholar] [CrossRef]
  67. Slater, J.C. Note on the Effect of Pressure on the Curie Point of Iron-Nickel Alloys. Phys. Rev. 1940, 58, 54–56. [Google Scholar] [CrossRef]
  68. Singh, N.K.; Suresh, K.G.; Nigam, A.K.; Malik, S.K.; Coelho, A.A.; Gama, S. Itinerant electron metamagnetism and magnetocaloric effect in RCo2-based Laves phase compounds. J. Magn. Magn. Mater. 2007, 317, 68–79. [Google Scholar] [CrossRef] [Green Version]
  69. Khmelevskyi, S.; Mohn, P. The order of the magnetic phase transitions in RCo2(R = rare earth) intermetallic compounds. J. Phys. Condens. Matter 2000, 12, 9453–9464. [Google Scholar] [CrossRef]
  70. Syschenko, O.; Sechovsky, V.; Divis, M.; Fujita, T.; Hauser, R.; Fujii, H. Magnetism in rare earth Co2 compounds under high pressures. J. Appl. Phys. 2001, 89, 7323. [Google Scholar] [CrossRef]
  71. Kozlenko, D.P.; Burzo, E.; Vlaic, P.; Kichanov, S.E.; Rutkauskas, A.V.; Savenko, B.N. Sequential Cobalt Magnetization Collapse in ErCo2: Beyond the Limits of Itinerant Electron Metamagnetism. Sci. Rep. 2015, 5, 8620. [Google Scholar] [CrossRef] [Green Version]
  72. Lyubina, J.; Nenkov, K.; Schultz, L.; Gutfleisch, O. Multiple Metamagnetic Transitions in the Magnetic La(Fe,Si)13Hx. Phys. Rev. Lett. 2008, 101, 177203. [Google Scholar] [CrossRef]
  73. Bose, S.K.; Kudrnovsky, J.; Drchal, V.; Turek, I. Pressure dependence of Curie temperature and resistivity in complex Heusler alloys. Phys. Rev. B 2011, 84, 174422. [Google Scholar] [CrossRef] [Green Version]
  74. Moreno-Ramírez, L.M.; Ipus, J.J.; Franco, V.; Blázquez, J.S.; Conde, A. Analysis of magnetocaloric effect of ball milled amorphous alloys: Demagnetizing factor and Curie temperature distribution. J. Alloys Compd. 2015, 622, 606–609. [Google Scholar] [CrossRef]
  75. M’Nassri, R.; Cheikhrouhou-Koubaa, W.; Koubaa, M.; Boudjada, N.; Cheikhrouhou, A. Magnetic and magnetocaloric properties of Pr0.6-xEuxSr0.4MnO3 manganese oxides. Sol. Stat. Comm. 2011, 151, 1579–1582. [Google Scholar] [CrossRef]
  76. Alvarez-Alonso, P.; Sánchez Llamazares, J.L.; Sánchez-Valdés, C.F.; Cuello, G.J.; Franco, V.; Gorria, P.; Blanco, J.A. On the broadening of the magnetic entropy change due to Curie temperature distribution. J. Appl. Phys. 2008, 115, 17A929. [Google Scholar] [CrossRef] [Green Version]
  77. Blázquez, J.S.; Franco, V.; Conde, A. Enhancement of the magnetic refrigerant capacity in partially amorphous Fe70Zr30 powders obtained by mechanical alloying. Intermetallics 2012, 26, 52–56. [Google Scholar] [CrossRef]
  78. Franco, V.; Blázquez, J.S.; Conde, A. Field dependence of the magnetocaloric effect in materials with a second order phase transition: A master curve for the magnetic entropy change. Appl. Phys. Lett. 2006, 89, 222512. [Google Scholar] [CrossRef]
  79. Bahl, C.R.H.; Bjørk, R.; Smith, A.; Nielsen, K.K. Properties of magnetocaloric materials with a distribution of Curie temperatures. J. Magn. Magn. Mater. 2012, 324, 564–568. [Google Scholar] [CrossRef]
  80. Blázquez, J.S.; Moreno-Ramírez, L.M.; Ipus, J.J.; Kiss, L.F.; Kaptás, D.; Kemény, T.; Franco, V.; Conde, A. Effect of α-Fe impurities on the field dependence of magnetocaloric response in LaFe11.5Si1.5. J. Alloys Compd. 2015, 646, 101–105. [Google Scholar] [CrossRef]
  81. Ipus, J.J.; Moreno-Ramírez, L.M.; Blázquez, J.S.; Franco, V.; Conde, A. A procedure to extract the magnetocaloric parameters of the single phases from experimental data of a multiphase system. Appl. Phys. Lett. 2014, 105, 172405. [Google Scholar] [CrossRef] [Green Version]
  82. Campillo, G.; Berger, A.; Osorio, J.; Pearson, J.E.; Bader, S.D.; Baca, E.; Prieto, P. Substrate dependence of magnetic properties of La0.67Ca0.33MnO3 films. J. Magn. Magn. Mater. 2001, 237, 61–68. [Google Scholar] [CrossRef]
  83. Berger, A.; Campillo, G.; Vivas, P.; Pearson, J.E.; Bader, S.D.; Baca, E.; Prieto, P. Critical exponents of inhomogeneous ferromagnets. J. Appl. Phys. 2002, 91, 8393–8395. [Google Scholar] [CrossRef] [Green Version]
  84. Bebenin, N.G.; Zainullina, R.I.; Ustinov, V. V Magnetocaloric effect in inhomogeneous ferromagnets. J. Appl. Phys. 2013, 113, 73907. [Google Scholar] [CrossRef]
  85. Brown, W.F. Theory of the Approach to Magnetic Saturation. Phys. Rev. 1940, 58, 736–743. [Google Scholar] [CrossRef]
  86. Ipus, J.J.; Blázquez, J.S.; Franco, V.; Lozano-Pérez, S.; Conde, A. Role of starting phase of boron on the mechanical alloying of FeNbB composition. J. Alloys Compd. 2013, 553, 119–124. [Google Scholar] [CrossRef]
  87. Ipus, J.J.; Blázquez, J.S.; Franco, V.; Conde, A. The use of amorphous boron powder enhances mechanical alloying in soft magnetic FeNbB alloy: A magnetic study. J. Appl. Phys. 2013, 113, 17A330. [Google Scholar] [CrossRef]
  88. Vidal-Crespo, A.; Ipus, J.J.; Blázquez, J.S.; Conde, A. Mechanical Amorphization and Recrystallization of Mn-Co(Fe)-Ge(Si) Compositions. Metals 2019, 9, 534. [Google Scholar] [CrossRef] [Green Version]
  89. Available online: http://www.lakeshore.com/products/Vibrating-Sample-Magnetometer/Pages/MCE.aspx (accessed on 1 December 2019).
  90. Blázquez, J.S.; Franco, V.; Conde, A. The influence of Cu addition on the crystallization and magnetic properties of FeCoNbB alloys. J. Phys. Condens. Matter 2002, 14, 11717–11727. [Google Scholar] [CrossRef] [Green Version]
  91. Vidal-Crespo, A.; Ipus, J.J.; Blázquez, J.S.; Conde, A. Optimization of thermal treatment to produce magnetocaloric MnCo(Fe)Ge intermetallic from mechanical alloying precursors. submitted.
  92. Johnson, V. Diffusionless orthorhombic to hexagonal transitions in ternary silicides and germanides. Inorg. Chem. 1975, 14, 1117–1120. [Google Scholar] [CrossRef]
  93. Li, G.J.; Liu, E.K.; Zhang, H.G.; Zhang, Y.J.; Chen, J.L.; Wang, W.H.; Zhang, H.W.; Wu, G.H.; Yu, S.Y. Phase diagram, ferromagnetic martensitic transformation and magnetoresponsive properties of Fe-doped MnCoGe alloys. J. Magn. Magn. Mater. 2013, 332, 146–150. [Google Scholar] [CrossRef] [Green Version]
Figure 1. (a) T C of rare earth (RE)-based amorphous alloys as a function of the average atomic number of the RE for three different families: RE55Co20Al25 [20,21], RE65Fe20Al15 [22,23], and RE70Fe30 [24,25]. (b) T C of Fe-B-Zr amorphous alloys as a function of the Fe content (data taken from [26,27,28] and supplemental material in [29]).
Metals 10 00226 g001
Figure 2. T C transition temperature as a function of the Mn+4 fraction in La-manganites (data taken from supplemental material of [29] and [31,32,33,34,35,36,37]).
Metals 10 00226 g002
Figure 3. T C transition temperature as a function of the Si content in La(Fe,Si)13 system (data taken from supplemental material in [29] and references therein).
Metals 10 00226 g003
Figure 4. Martensitic (solid symbols) and Curie (hollow symbols) temperatures as a function of the number of the outer electrons per atom for: (a) two families of half-Heusler alloys; and (b) four families of Heusler alloys (data taken from supplemental material in [29] and references therein).
Metals 10 00226 g004
Figure 5. (a) Normalized magnetization at zero field vs. temperature calculated using Arrott–Noakes EOS for individual contributions and a Gaussian distribution for several standard deviations. (b) l n ( M / M S ) as a function of l n ( T C T ) . The slope corresponds to the effective critical exponent β . Curves were generated using Arrott–Noakes EOS for MF, Heisenberg, and Ising models. The curve corresponding to a single Weiss-type contribution is also shown in the upper panel of (b) as a dotted curve for comparison.
Metals 10 00226 g005
Figure 6. (a) Normalized magnetization at zero field vs. temperature calculated using Bean and Rodbell model for individual contributions and a Gaussian distribution for several standard deviations and values of η parameter; and (b) the corresponding 1 M S d M d T curves.
Metals 10 00226 g006
Figure 7. Magnetization at zero field (normalized with respect to that of pure martensite phase at T =   0 K) vs. temperature calculated using abrupt transitions from a low temperature phase (Weiss system with T C M ) to a high temperature phase (Weiss system with T C A ) and a Gaussian distribution for several standard deviations of the martensitic transformation. Specific magnetization at 0 K is taken as 15 emu/g for martensite and 90 emu/g for austenite phases.
Metals 10 00226 g007
Figure 8. Deviations of T i n f W e i s s with respect to T C as a function of Δ T c for different values of J .
Metals 10 00226 g008
Figure 9. (a) χ P curves as a function of temperature for MF, Heisenberg, and Ising systems for different values of Δ T c . (b) Peak temperature of χ P as a function of Δ T c .
Metals 10 00226 g009
Figure 10. Dependence on η of the slope of the plot of T i n f B R T C vs. Δ T c . The parabolic curve is a fitting to the SOPT range.
Metals 10 00226 g010
Figure 11. Evolution of T i n f T t for simulated curves corresponding to magnetostructural sharp transitions vs. the standard deviation Δ T t of DTT and as a function of (a) T C A , in a PM to FM transition; (b) T C M , in a FM to PM transition; and (c) T C A , in a FM to FM transition. T t =   300 K for all DTT.
Metals 10 00226 g011
Figure 12. (a) Calculated χ P curves assuming a distribution of sharp FOPT from a FM martensite to a PM austenite for T C A =   50 K and for T C A = 20 0 K. (b) Evolution of the peak temperature of the susceptibility curves vs. Δ T t and as a function of T C A . T t =   300 K was used for all DTT.
Metals 10 00226 g012
Figure 13. Experimental results of partially amorphous Fe75Nb10B15 alloys. (a) XRD patterns as a function of the crystalline fraction (shown in percent). (b) Magnetization curves for different temperatures for the sample with X C   = 15%.
Metals 10 00226 g013
Figure 14. (a) Experimental data for d M / d T and χ P vs. T curves from the analysis of approach to saturation and Δ S M ( T ) curves for Fe75Nb10B15 partially amorphous alloys as a function of the crystalline fraction (shown in percent in the legend). (b) Experimental peak temperatures for d M / d T , χ P , and Δ S M ( T ) curves (upper panel); mean Curie temperatures, T C (middle panel); and standard deviation, Δ T C , (lower panel) of the DTT from Equations (13)–(15), as a function of the crystalline fraction.
Metals 10 00226 g014
Figure 15. Δ T C versus T C using Equations (13) and (15) (black squares) and Equations (14) and (15) (red circles) for Fe75Nb10B15 partially amorphous alloys. Extreme data for X C   2% and X C =   68% are excluded.
Metals 10 00226 g015
Figure 16. Schematic view of the broadening of the amorphous compositional profile dependence with the crystalline fraction. Solid red lines correspond to the total compositional profile, whereas dashed black lines correspond to the compositional profiles for isolated nanocrystals.
Metals 10 00226 g016
Figure 17. (a) XRD patterns of the MnCo0.8Fe0.2Ge intermetallics milled for 50 h and heated up to the indicated temperatures at 20 K/min. (b) Crystal size (above) and lattice parameters (below) from XRD Rietveld analysis as a function of the annealing temperature.
Metals 10 00226 g017
Figure 18. Isothermal magnetization curves for the MnCo(Fe)Ge sample annealed at 723 K.
Metals 10 00226 g018
Figure 19. (a) Experimental data for d M / d T and χ P curves from the analysis of approach to saturation and Δ S M ( T ) curves for half-Heusler MnCo0.8Fe0.2Ge intermetallics obtained after heating at different temperatures (indicated in the legend) at 20 K/min. (b) Experimental peak temperatures for: d M / d T , χ P and Δ S M ( T ) curves (upper panel); mean Curie temperatures, T C (middle panel); and standard deviation, Δ T C , of the DTT (lower panel) from Equations (13)–(15), as a function of the annealing temperature for MnCo(Fe)Ge alloy.
Metals 10 00226 g019
Table 1. Magnetic properties of FM pure metals [1,16] and estimated J e x / k B from Weiss model.
Ferromagnet T C ( K ) Magnetic Moment (μB)Crystal Structure J e x / k B ( K )
Fe10432.22bcc159
Co13941.715hcp237
Ni6310.605fcc862
Gd2937.98hcp2.3
Tb2209.77hcp2.6
Dy8910.83hcp1.5
Ho2011.2hcp0.5
Er209.9hcp0.9
Tm327.61hcp3.4

