Article

Tracing Microalloy Precipitation in Nb-Ti HSLA Steel during Austenite Conditioning

1
Department of Materials Science, Saarland University, Campus D3.3, 66123 Saarbrücken, Germany
2
Materials Engineering Center Saarland, Campus D3.3, 66123 Saarbrücken, Germany
3
AG der Dillinger Hüttenwerke, 66763 Dillingen, Germany
4
Engineering Office and Consultant, 38229 Salzgitter, Germany
5
Department of Materials Engineering, KU Leuven, 3001 Leuven, Belgium
6
NiobelCon bvba, 2970 Schilde, Belgium
*
Author to whom correspondence should be addressed.
Metals 2020, 10(2), 243; https://doi.org/10.3390/met10020243
Submission received: 23 January 2020 / Revised: 7 February 2020 / Accepted: 9 February 2020 / Published: 12 February 2020
(This article belongs to the Special Issue Thermomechanical Processing of Steels)

Abstract

:
The microalloying with niobium (Nb) and titanium (Ti) is standardly applied in low carbon steel high-strength low-alloy (HSLA) steels and enables austenite conditioning during thermo-mechanical controlled processing (TMCP), which results in pronounced grain refinement in the finished steel. In that respect, it is important to better understand the precipitation kinetics as well as the precipitation sequence in a typical Nb-Ti-microalloyed steel. Various characterization methods were utilized in this study for tracing microalloy precipitation after simulating different austenite TMCP conditions in a Gleeble thermo-mechanical simulator. Atom probe tomography (APT), scanning transmission electron microscopy in a focused ion beam equipped scanning electron microscope (STEM-on-FIB), and electrical resistivity measurements provided complementary information on the precipitation status and were correlated with each other. It was demonstrated that accurate electrical resistivity measurements of the bulk steel could monitor the general consumption of solute microalloys (Nb) during hot working and were further complemented by APT measurements of the steel matrix. Precipitates that had formed during cooling or isothermal holding could be distinguished from strain-induced precipitates by corroborating STEM measurements with APT results, because APT specifically allowed obtaining detailed information about the chemical composition of precipitates as well as the elemental distribution. The current paper highlights the complementarity of these methods and shows first results within the framework of a larger study on strain-induced precipitation.

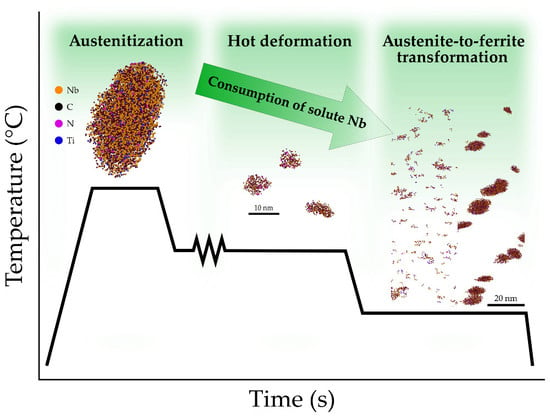
Graphical Abstract

1. Introduction

The development of weldable low-carbon steels with high mechanical strength and good toughness is the basis for many modern applications in the structural, energy, and automotive sectors. Key to this steel development is the use of microalloying in combination with thermo-mechanical controlled processing (TMCP) [1,2,3,4]. Such high-strength low-alloyed (HSLA) steels are being produced as strip and plate products covering a wide range of thicknesses and yield strength levels up to 700 MPa. The involved strengthening mechanisms are in first place grain refinement followed by precipitation and dislocation strengthening. Grain refinement in combination with low carbon content is particularly effective in lowering the ductile-to-brittle transition temperature (DBTT) and increasing the ductile plateau toughness.
Microalloying elements, in particular niobium and titanium, play a major role in achieving these strengthening mechanisms. Grain refinement in the final product starts with preventing excessive austenite coarsening during soaking treatment. Therefore, particles insoluble at that high temperature (>1200 °C), typically consisting of TiN, are required [5]. Niobium ideally is brought into solution by the soaking treatment. It is the most efficient microalloying element for suppressing recrystallization during rolling at lower austenite temperatures [6]. The obstruction of recrystallization is caused by solute drag of niobium atoms segregated to the austenite grain boundary, as well as by grain boundary pinning after strain-induced precipitation of small Nb(C,N) particles [5,7]. Any niobium left in solid solution after austenite conditioning has further metallurgical effects that contribute to strengthening. Solute niobium delays the austenite-to-ferrite transformation provoking under-cooling and thus further refining grain structure, or in combination with accelerated cooling, promoting transformation into bainite [8]. Depending on the finishing conditions, solute niobium can also precipitate as ultra-fine particles in ferrite, enhancing strength according to the Orowan-Ashby mechanism [9]. Therefore, it is of great importance to predict and verify the solute and precipitate status of microalloying elements along the entire process route.
In Nb-Ti dual microalloyed steels, a considerable fraction of the nominal titanium addition precipitates at the late stages of solidification caused by segregation of titanium and nitrogen to the residual melt. Any titanium that has not precipitated during solidification does so at temperatures below 1200 °C, even in undeformed austenite as detailed by Kunze et al. [10]. At higher austenite temperatures, these precipitates nucleate on dislocations, yielding particle rows or tapes where the particle diameters are in the range of 20 to 50 nm. Below 1000 °C, supersaturation becomes so high that nucleation of TiN can also take place in the matrix resulting in randomly distributed particles with sizes below 15 nm [10].
Niobium carbide has quite a good solubility in low-carbon steels. For industrially relevant carbon and nitrogen levels, more than 0.1 wt. % Nb can be dissolved at 1200 °C [11]. The niobium solubility diminishes with decreasing temperature to a value of around 0.01 wt. % at 900 °C. Despite this, sufficient supersaturation allowing spontaneous precipitation of NbC in the matrix is not being reached. However, heterogeneous nucleation of NbC on pre-existing TiN particles is possible. It has been found that up to 0.02 wt. % niobium can be trapped in this way [12,13]. The amount of solute niobium effective for retarding recrystallization is therefore reduced [5,7,14]. This can be overcome by increasing the amount of niobium added to the steel. Higher niobium additions are also motivated by the increase of the temperature of non-recrystallization (TNR) enabling higher finish rolling temperatures and thus, yielding better efficiencies in the mill [15,16].
The precipitation of niobium at lower austenite temperatures, where solubility is sufficiently reduced and supersaturation occurs, is greatly facilitated by introducing deformation [11]. This is shown schematically in Figure 1. The precipitation kinetics reaches a maximum at temperatures between 950 and 900 °C [17,18]. Rolling in that temperature range induces simultaneous precipitation of NbC thereby strongly obstructing the recrystallization of deformed austenite grains. It is also obvious that rolling schedules adopted by hot strip mills result in a much lower amount of niobium precipitation than plate mill rolling schedules.
The niobium left in solute solution after rolling is available for precipitation during or after the phase transformation from austenite to ferrite. These NbC precipitates can nucleate as a consequence of partitioning and local supersaturation in the vicinity of the moving phase front, known as interphase precipitation [19,20]. Spontaneous precipitation after phase transformation can occur by nucleation on dislocations or by a mechanism of replacing iron by niobium atoms in previously formed nano-cementite particles as described by Hin et al. [21]. The kinetics of spontaneous niobium precipitation in ferrite is also relatively slow under typical finishing conditions for plate and strip products (Figure 2) [22]. It is apparent that even under hot finishing conditions, niobium precipitation will not be complete. Colder finishing conditions promoting bainite formation largely prevent niobium precipitation. Secondary heat treatment such as tempering, however, allows nearly complete precipitation [23].
The optimum exploitation of niobium with regard to the aforementioned physical metallurgical effects demands a precise knowledge of the solute niobium status before and after hot deformation. Numerous studies exist on how to calculate the behavior of microalloying elements using thermodynamics, which was recently summarized [24]. Several techniques that either directly or indirectly measure the niobium in solution exist. Early work of LeBon et al. [25] used hardness testing to quantify the amount of precipitated niobium based on the assumption of a higher hardness being due to less niobium in solution. However, such measurements are liable to misinterpretation caused by competing effects on the hardness.
Electrical resistivity measurements of alloys rely on the principle that solute precipitant elements are consumed while precipitation advances. As the iron matrix of the steel is more and more depleted of elements participating in precipitation, the resistivity of the steel drops because solute elements are stronger scattering centers for electrons in comparison to precipitates. Simoneau et al. [26] measured the electrical resistivity of niobium-microalloyed steels isothermally held at 900 °C for different times and found a good correlation with different precipitation stages. Park et al. [27] estimated the dissolution temperature of a Nb-microalloyed steel to be the point where the electrical resistivity reached a plateau and verified it by using transmission electron microscopy (TEM) replica. Jung et al. [28,29] expanded this technique to the more complex Nb-Ti-V system to investigate the precipitation behavior in thermo-mechanically processed microalloyed steels with and without deformation in the austenite field. By applying the lever rule to the resistivity curve, they could show that the precipitation mole fraction of pre-strained samples increases earlier with respect to unstrained samples. These reported results rely on the fact that the upper and lower limit of the electrical resistivity are tied to the total dissolution or precipitation of niobium, respectively. However, for (Nb,Ti)(C,N) steels, the maximum amount of niobium in solution is generally less than the nominal amount due to the above-mentioned reasons. Therefore, in that case, the electrical resistivity curves need to be calibrated on the actual amount of niobium in solution.
One common technique to assess the amount of solute niobium is the extraction of precipitates by dissolving the metallic matrix in acid. Subsequently, filtering the precipitates from the solution and measurement of both filter and filtrate yields the niobium precipitated and in solid solution, respectively [16,30]. This method ensures a very elegant and statistically significant measurement. However, it cannot be excluded that small precipitates either pass through the filter or partially dissolve during the extraction and thereby bias the analysis of solute niobium concentration.
A feasible alternative is given by atom probe tomography (APT), which detects all elements with the same high sensitivity and a spatial resolution in the sub-nanometer range [31]. Therefore, the technique applies especially well to investigation of segregation lines or nanometer-sized precipitates. Furthermore, APT can also measure the chemical composition of the matrix, excluding even the smallest precipitates or clusters inside the composition calculation [32], contrary to other spectroscopy techniques. APT was used to characterize (Nb,Ti)(C,N) particles formed during hot-rolling of microalloyed HLSA steels [33,34,35,36,37]. Nöhrer et al. investigated the influence of deformation level [33], while Kostryzhev and Pereloma et al. investigated the influence of the deformation temperature [34,35] on the precipitation of (Nb,Ti)(C,N) in low-alloyed steels. Due to the small analysis volume of APT measurements, quantitative data of the precipitation number density or size distribution must be treated with caution. (S)TEM characterization, which is often used to obtain counting statistics, is liable to misinterpretation because of the user-dependent production of thin foils or carbon replica films. In addition, depending on the user, there might be a precipitate size range that will be not detected by either APT or TEM. This might be also due to the loss of smallest precipitates during excessive etching when producing the replica, as shown in the case of Kostryzhev et al. [35].
Accordingly, the correlation and calibration of electrical resistivity measurements on the APT analysis of precipitates and matrix offers a high potential for obtaining meaningful quantitative data for the precipitation kinetics of (Nb,Ti)(C,N). This can help to establish a guideline for the heat treatments during steel processing.
In this work, APT was used to detect and differentiate precipitates that form during various TMCP stages, in combination with scanning transmission electron microscopy (STEM-on-FIB). Furthermore, the amount of solute niobium measured by APT for different processing stages was correlated with the electrical resistivity method. It was shown that both, deformation level and temperature during hot working, could be distinguished based on electrical resistivity. Finally, the composition of precipitates formed at lower austenite temperature as well as after transformation to ferrite was characterized with APT.

2. Materials and Methods

The current study was conducted on a laboratory melt of a Nb and Ti dual-microalloyed steel according to the composition as listed in Table 1. Similar compositions are in industrial use for advanced linepipe or structural steel grades either produced as plate or hot-rolled strip. The weight percent ratio of titanium and nitrogen in this analysis has a value of 3.4 corresponding almost exactly to an atomic Ti:N ratio of 1:1.
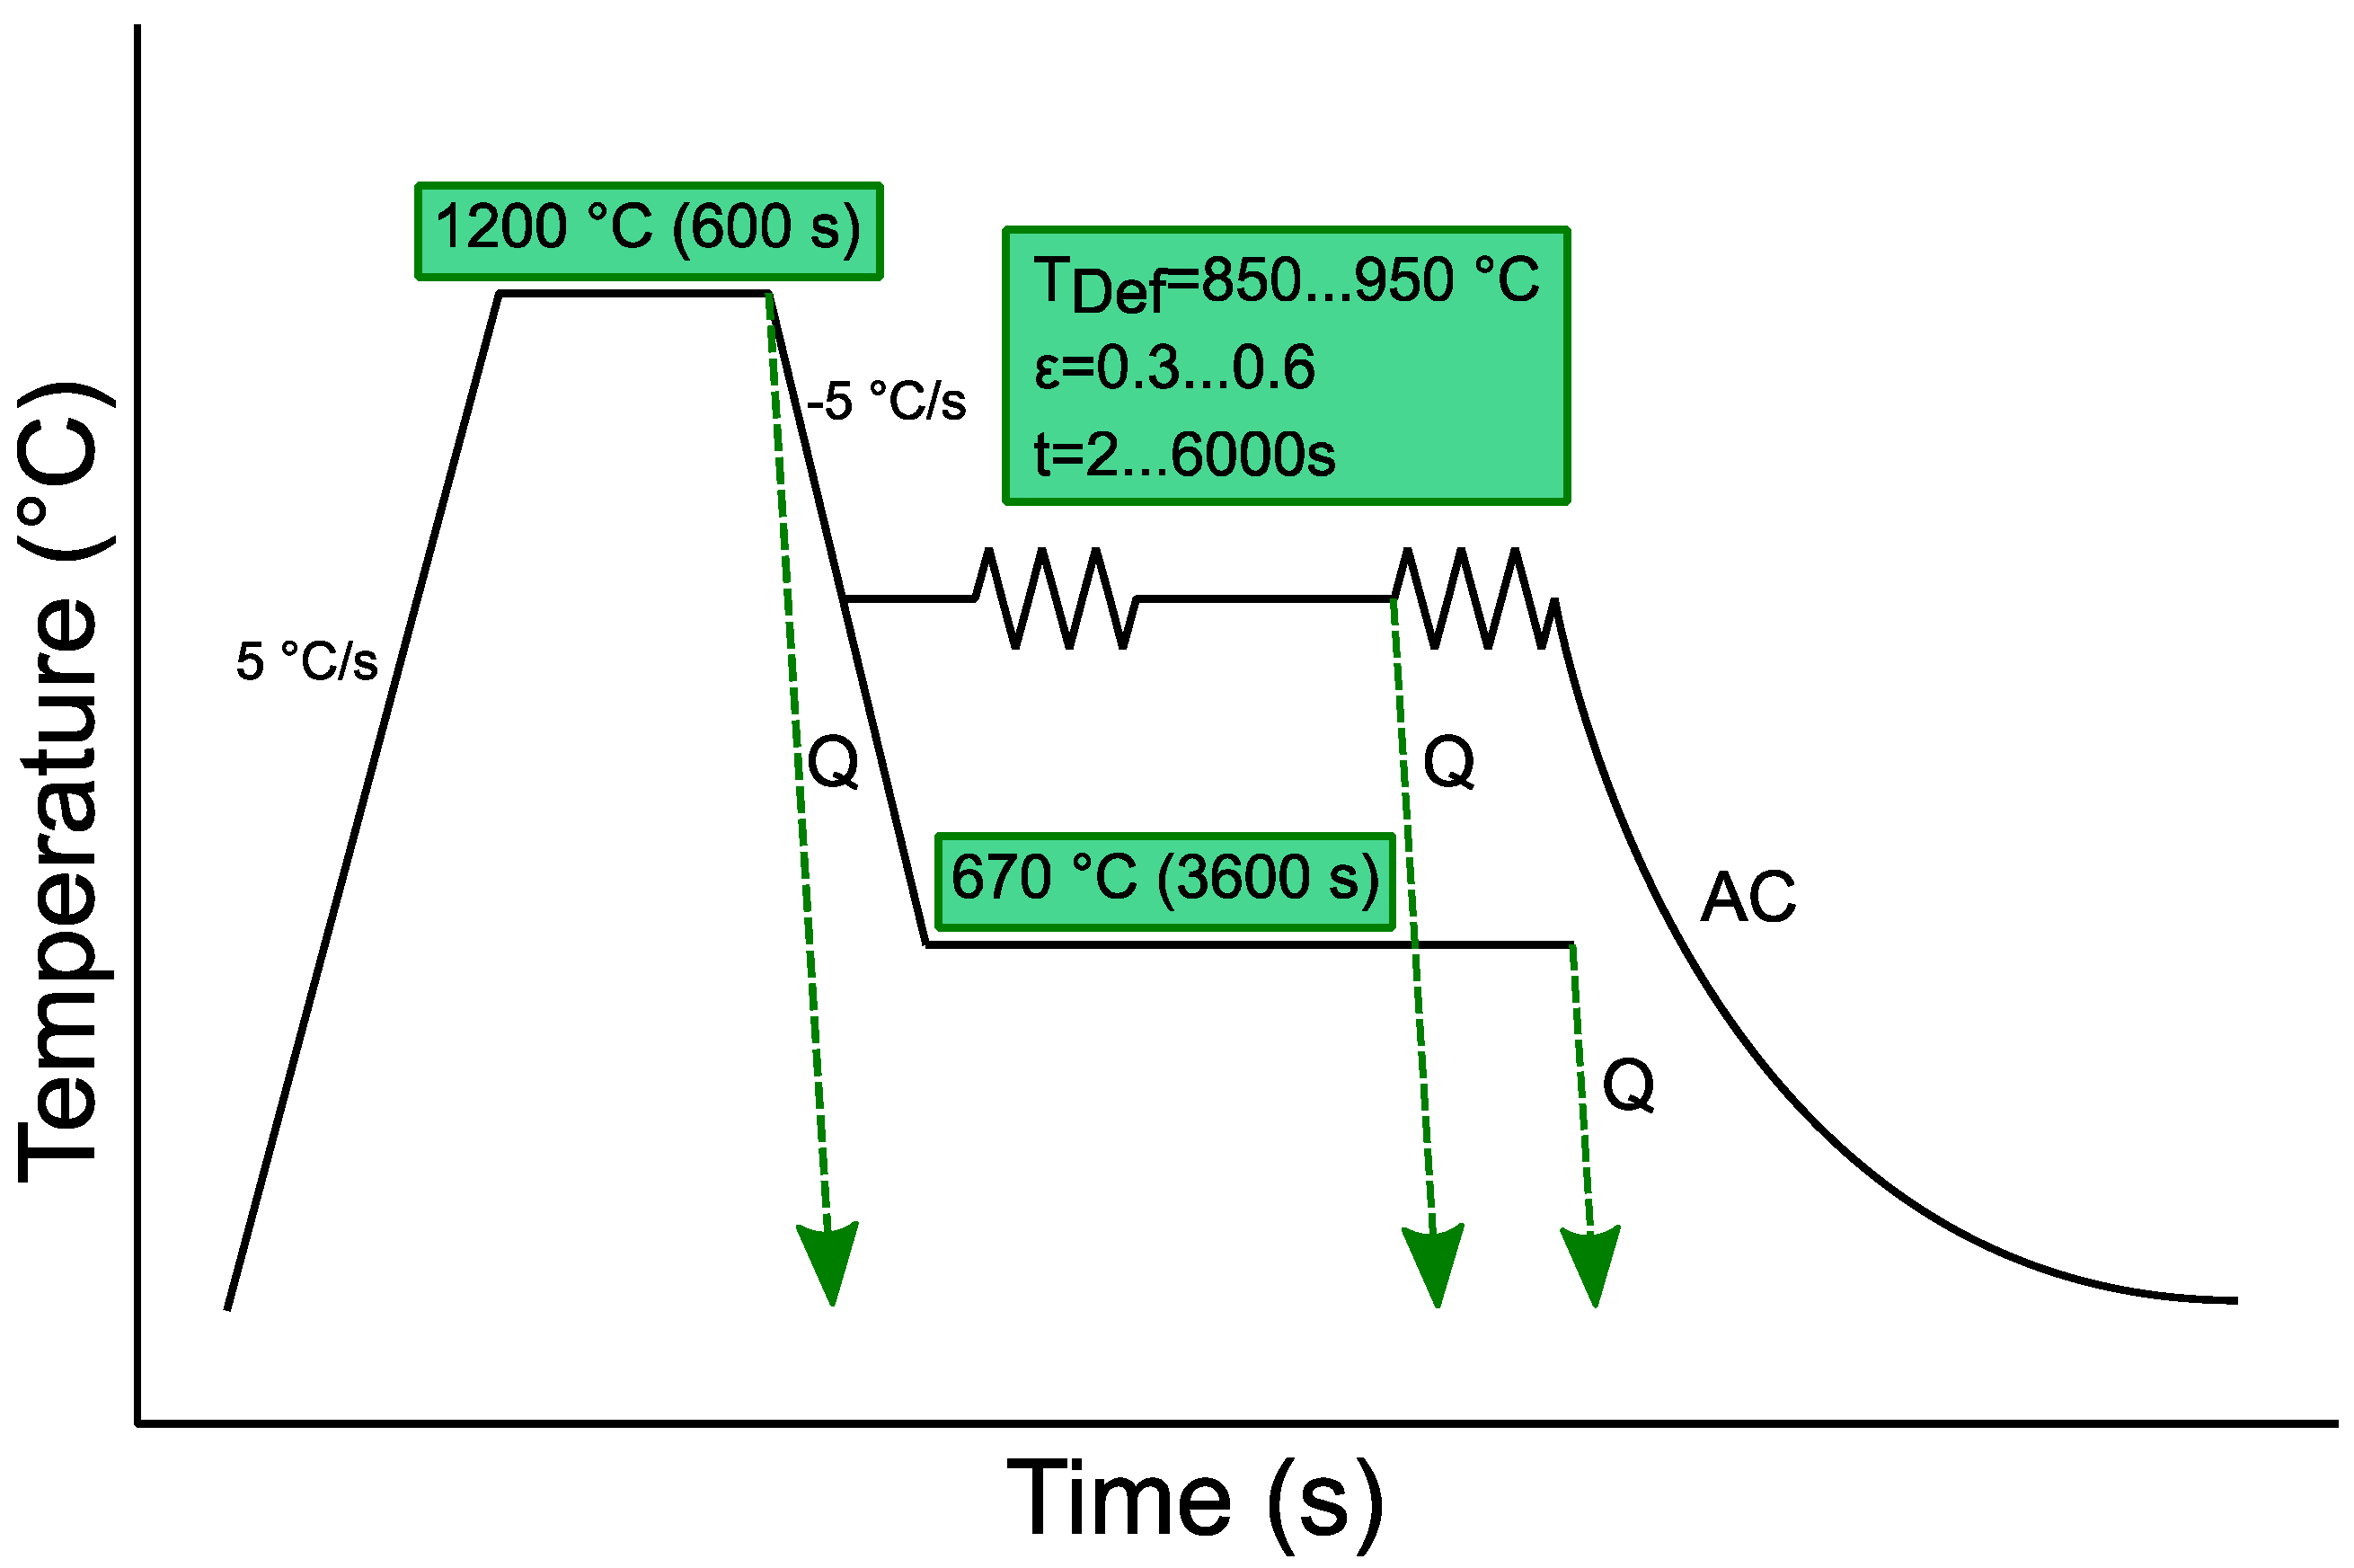
Cylinders of as-cast material were cut into a dimension of 16 mm length and 8 mm diameter. The sample cylinders were then thermo-mechanically processed in a Gleeble 3800 simulator (Dynamic Systems Inc., Poestenkill, NY, USA), using a hot-compression module with compressed helium gas as quenching medium. A schematic of the different heat-treatment simulations is shown in Figure 3. It consisted of an austenitizing stage at 1200 °C for 10 min, followed by cooling down to the deformation temperatures of 950 °C, 900 °C, and 850 °C, respectively, with a rate of 5 °C/s. Double-hit compression tests (ε = 0.3 + 0.3) with variable inter-pass times (ranging from 2 to 100 s) were performed to determine the non-recrystallization temperature (TNR) and to reveal the softening stasis. Single-hit compression tests (ε = 0.3 or ε = 0.6) and subsequent isothermal holding periods ranging from 2 to 6000 s followed by quenching were performed to characterize strain-induced precipitation. Additional samples were directly quenched from temperatures of 1200 °C and 950 °C without deformation, whereas one sample was held isothermally at 670 °C for 1 h after cooling down from 1200 °C, and subsequently quenched. These treatments aimed at characterizing the precipitation status before austenite deformation as well as after the austenite-to-ferrite transformation.
For each TMCP-stage described above, cylindrical samples were machined for electrical resistivity measurements by cutting cylinders of length 10 mm and diameter 5.6 mm from the thermo-mechanically deformed samples. The rather short length is due to constraints originating from the maximum cylinder length which could be treated in the Gleeble compression module without buckling. The setup for measuring the electrical resistivity was a 4-point measurement, as described in early works of Simoneau et al. [26]. The voltage drop within fixed potential points on the sample is proportional to the internal resistivity. Oxides or contaminations with organic residue will greatly increase the resistivity and produce erroneous values. Therefore, before measuring, the samples were further ground with 1200 grid sandpaper and cleaned with isopropyl alcohol to establish the most optimal surface conditions. The temperature was maintained at 23 °C for all measurements.
For selected samples, cylinders were also cut along the length and the samples were prepared for metallographic inspection by light-optical microscopy, carbon replica technique and APT. Polishing with 6, 3, and 1 µm diamond suspension and a final oxide polishing using silica slurry (0.05 µm) was conducted as final surface preparation steps. For all investigations, sample sections in the half-length and quarter-width were investigated because at this position the local strain was calculated to be approximately equal to the nominal strain during compression. Metallography for assessing the prior austenite grain structure was conducted using hot aqueous supersaturated picric acid and images were taken with a light-optical microscope Leica DM6000 (Leica Microsystems, Wetzlar, Germany). The prior austenite grain sizes where analyzed by computational image analysis in the software package AxioVision SE64 Rel. 4.9.1 (Carl Zeiss Microscopy GmbH, Jena, Germany) by applying simple gray-level thresholding and watershed segmentation. Carbon replica were prepared by using a 2 vol. % Nital etching after carbon coating and investigated in STEM-on-FIB (Helios NanolabTM 600, Thermo Fisher Inc., Waltham, MA, USA, formerly FEI Company, Hillsboro, OR, USA). In the same setup, electron dispersive spectroscopy (EDS) was conducted to obtain a qualitative chemical analysis of selected precipitates. For this, each precipitate was measured with 50,000 X-ray photon counts.
APT was done using a LEAP 3000X HR (Cameca SAS, Gennevilliers, France, USA) with voltage pulsing mode. APT analyzes specimen volumes of about 80 nm × 80 nm × 200 nm (typically tens of millions of atoms). The instrumental details are described elsewhere [31]. The specimens were prepared using the conventional lift-out technique in the FIB-SEM dual station (Helios NanolabTM 600, Thermo Fisher Inc., Waltham, MA, USA, formerly FEI Company, Hillsboro, OR, USA) [38]. A final low voltage milling at 2 kV was performed to minimize the gallium-induced damage. APT measurements were done at 15% pulse fraction, temperature of around 60 K, pressure lower than 1.33 × 10⁻⁸ Pa, frequency of 200 kHz and evaporation rate set at 5 atoms per 1000 pulses. All APT data reconstruction was done within the software IVAS 3.6.14 (Cameca SAS, Gennevilliers, France, USA). The composition measurements between detected precipitates and the steel matrix were adequately distinguished. Precipitates were analyzed using a constant iso-concentration surface with 1 at. % Nb, which gave best visual representation of the precipitate surfaces. Small clusters were analyzed using the maximum separation method [39], whereas the steel matrix composition was measured using precipitation/cluster or grain boundary/segregation-free volume of at least 1,000,000 atoms.
Lastly, the thermo-kinetic software MatCalc v 6.0 (Vienna, Austria, https://matcalc.at/) was used for a computational simulation of the precipitation density of different deformation temperatures and grades.

3. Results

Based on double-hit compression tests in the Gleeble apparatus and evaluation of respective softening behavior (Figure 4a), significant softening retardation was measured below 975 °C. The softening of double-compressed samples was recorded for constant temperatures between 1050 and 850 °C and after holding for 15 s. It equaled 20% at 963 °C and was defined as the TNR of the laboratory steel [3]. Representative microstructures for all deformation temperatures were recorded in light-optical microscopy after etching to reveal the prior austenite structure (Figure 4c). The mean prior austenite grain (PAG) equivalent diameter decreased and the number of grains (edge grains in micrographs excluded) increased with longer inter-pass times between compression hits (Figure 4b and Table 2).

3.1. Electrical Resistivity Measurements

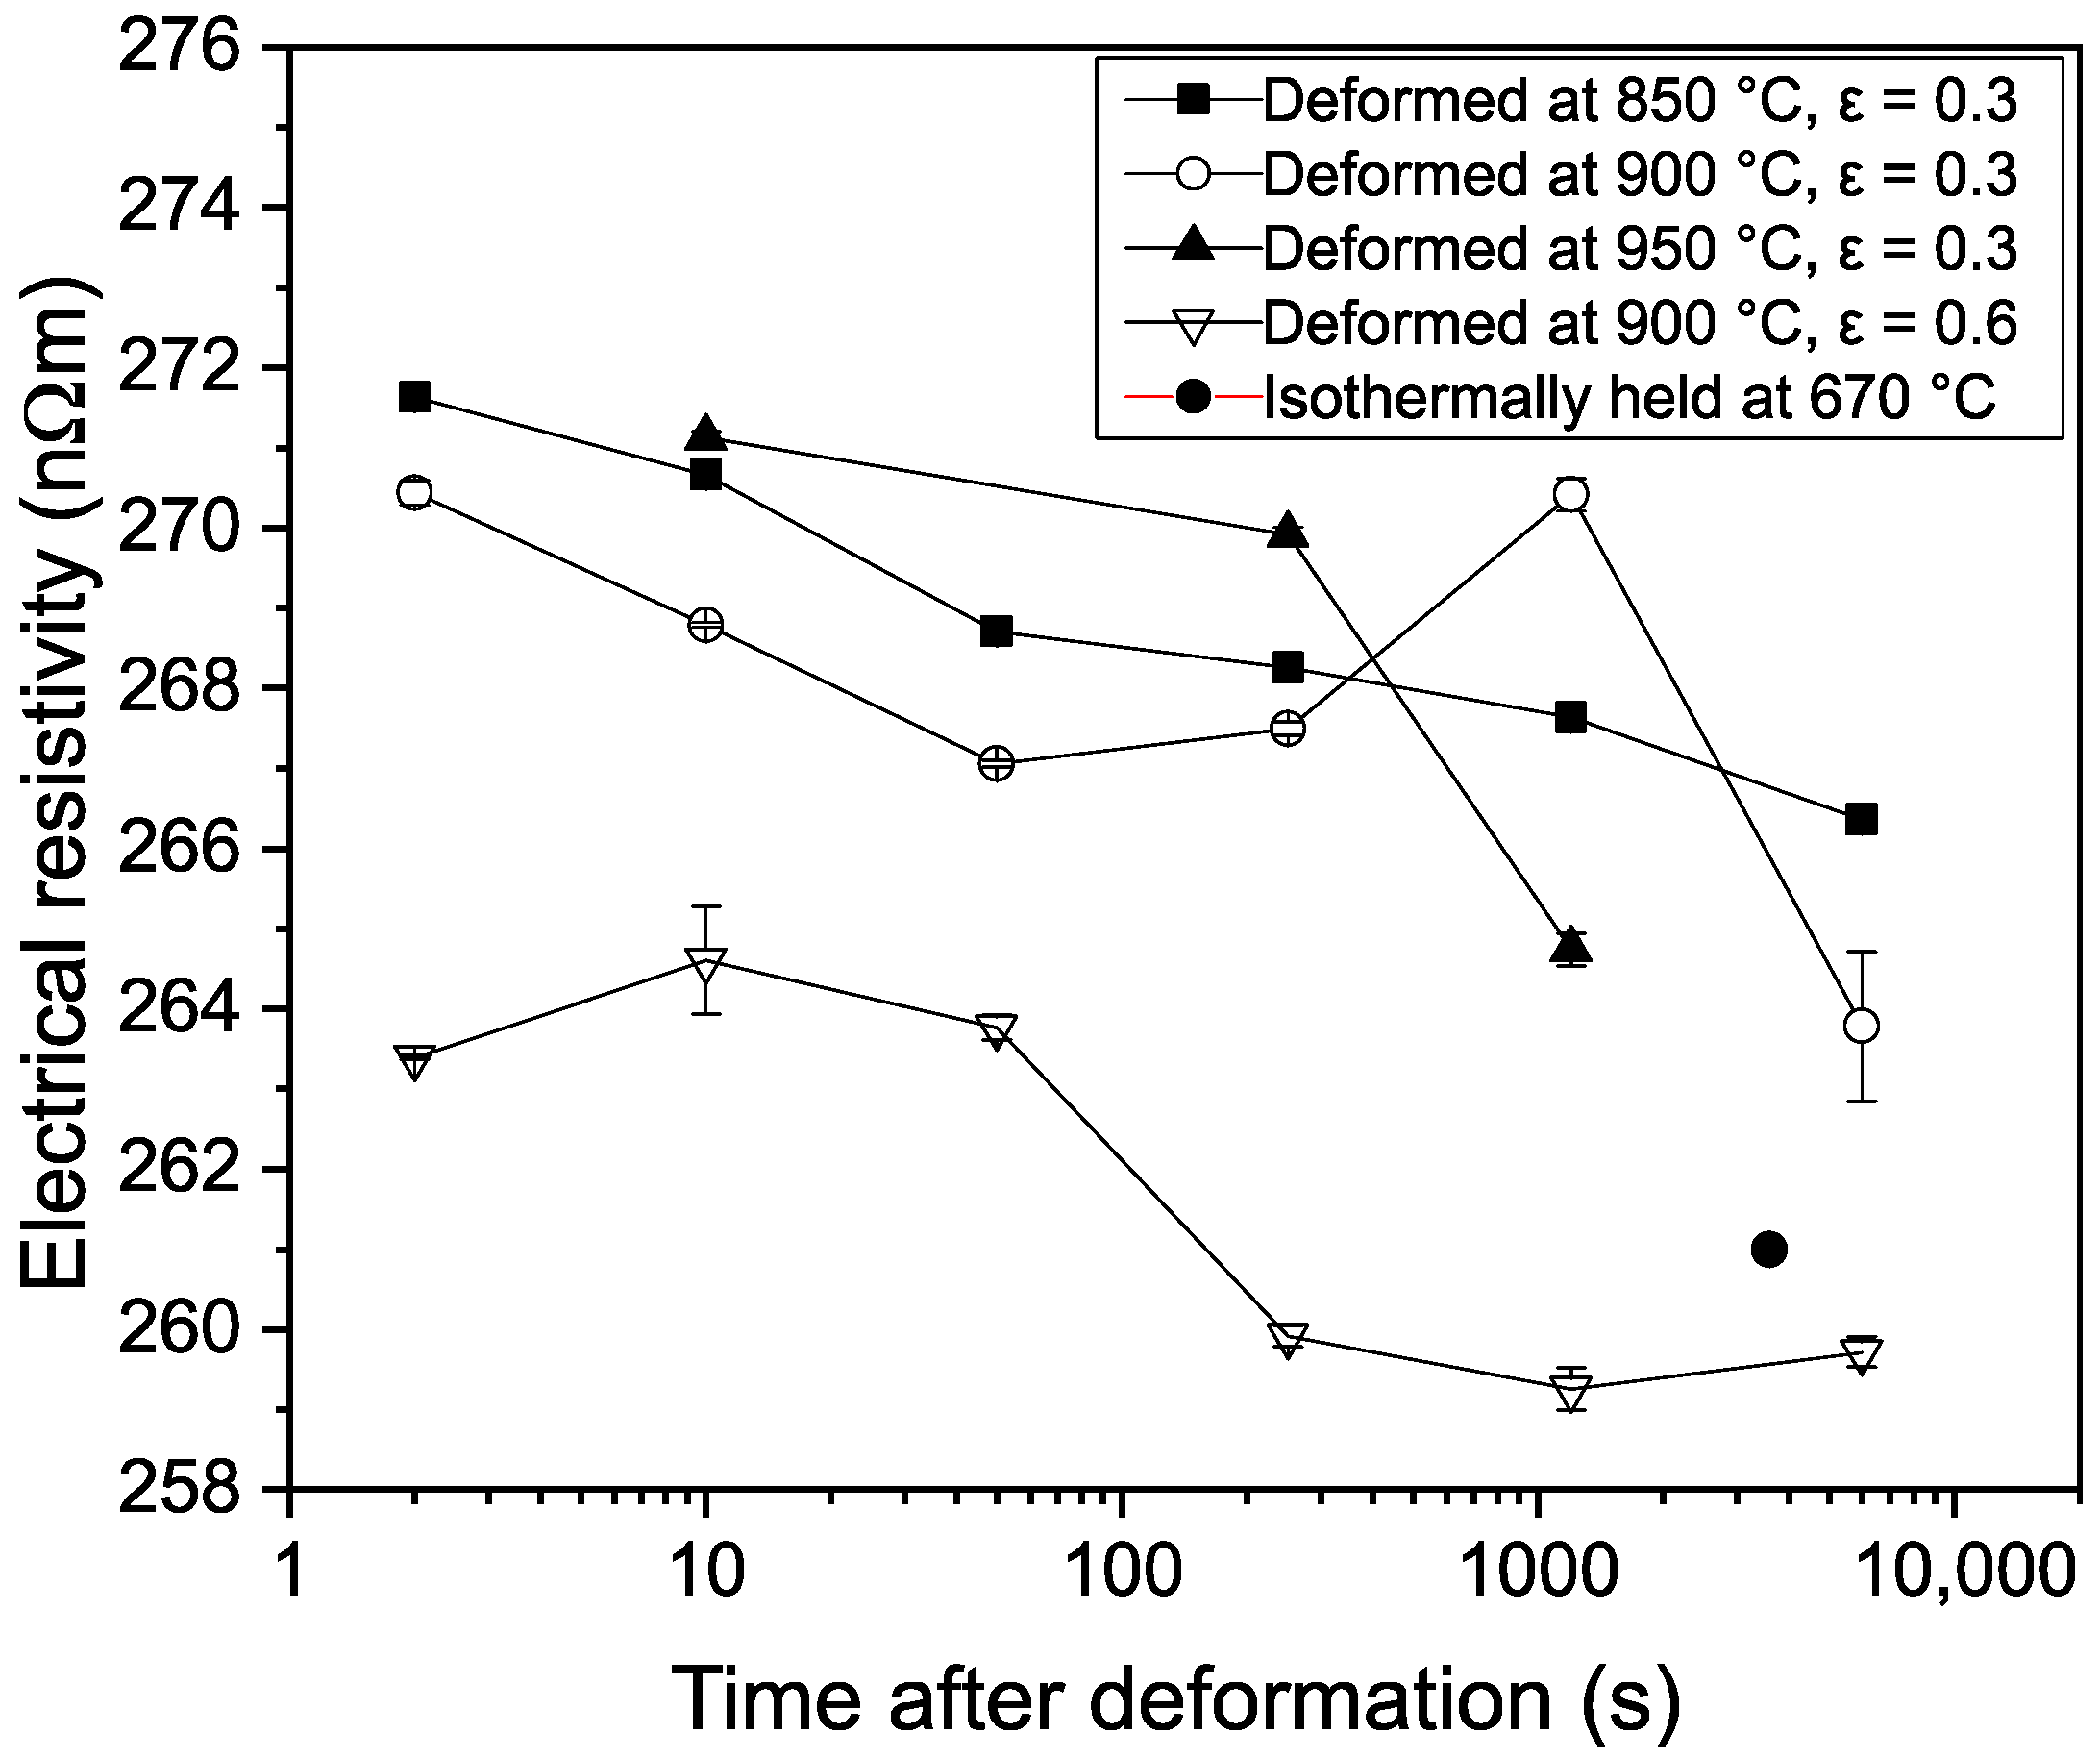
The electrical resistivity behavior as a function of the time elapsed after deformation is shown in Figure 5 for the temperatures 850, 900, and 950 °C. For all temperatures, there was an almost steady decrease of resistivity after deformation which slowed over time (note the logarithmic time axis). Directly after the deformation, the resistivity was around 272 and 270 nΩm for samples deformed at 850 and 900 °C, respectively, and decreased to 266 and 264 nΩm after 6000 s. The resistivity of the samples deformed at 900 °C was mostly lower than that for 850 °C, having an offset of roughly 1 nΩm. For 950 °C, after 1200 s, the resistivity dropped below the respective values of 850 °C and 900 °C after being larger for shorter holding times. The resistivity of the sample deformed at 900 °C and held for 1200 s increased compared to other values and was reproduced in many different measurements. When the deformation was increased to ε = 0.6, compared to ε = 0.3, the resistivity was lower even for short holding times, and then dropped finally to resistivity values of roughly 259 nΩm. Just above this value, with 261 nΩm, lay the electrical resistivity of the sample that was isothermally held at 670 °C for 1 h.
For these measurements to provide a quantitative understanding of the evolution of precipitation, calibration on the solute niobium was carried out. This was achieved by using APT, as shown in Section 3.3.

3.2. Precipitate Characterization by STEM

Precipitation at different treatment stages was investigated by producing carbon replica films and analyzing them using STEM-on-FIB. Samples directly quenched from 1200 °C revealed precipitates that did not dissolve during the soaking treatment, whereas those quenched from 950 °C indicated whether additional precipitates have formed during the cooling phase from soaking temperature. Analyzing the same condition after deformation by a strain of ε = 0.6 and a holding time of 200 and 1200 s revealed newly formed strain-induced precipitates.
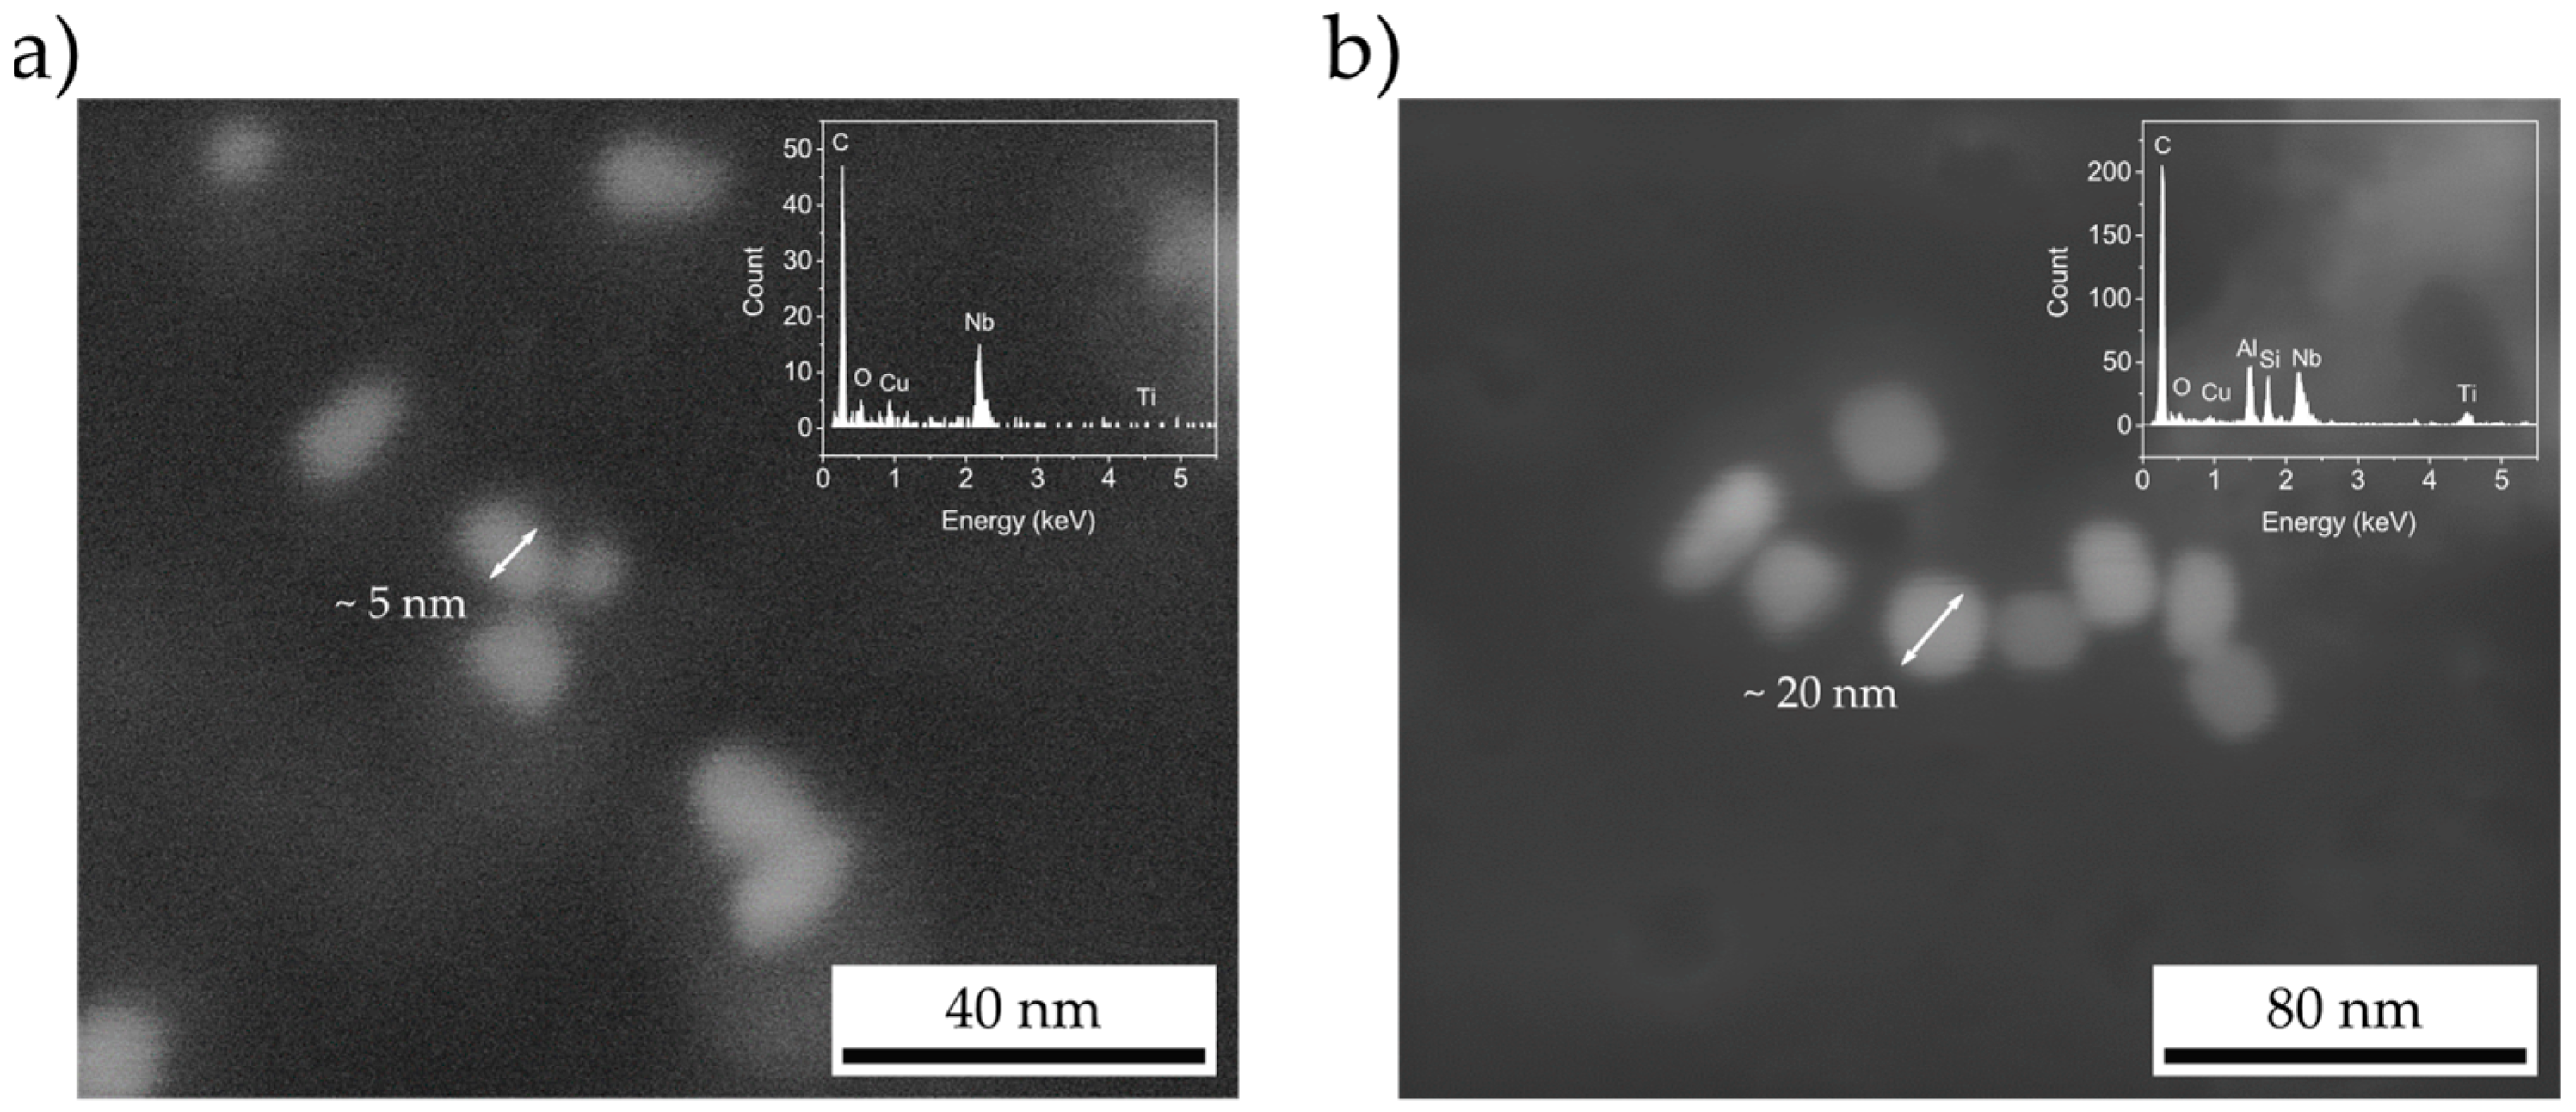
Figure 6a shows the precipitate population of a sample cooled down to 950 °C after soaking at 1200 °C, followed by quenching. One can observe particles decorating the prior austenite grain boundaries (indicated by white arrows), particle clusters inside the austenite grain and rather randomly distributed particles. The stage after soaking at 1200 °C comprised aligned clusters of cube-shaped particles having sizes of up to 80 nm that had not dissolved. Energy dispersive x-ray spectroscopy (EDS) identified the particle composition as being Nb-rich TiN (Figure 6b). Al, Si, and Cu elemental signals had their origin from the STEM setup. The particle clusters likely originated from casting and had not dissolved during soaking. A fraction of smaller cube-shaped particles with a size of around 12 nm, appeared to be rather pure TiN (Figure 6c). In addition, these particles must have existed before the soaking treatment. Similar-sized particles are found carrying a Nb-rich layer on two opposing sides (Figure 6d) that seemed to have nucleated on pre-existing TiN cubes. For part of these compound particles, the Nb-rich layer had grown into a larger dimension (Figure 6e). However, the Nb-rich layer appeared to grow only along one direction on opposite sides of the TiN core. Finally, bean-shaped particles were found showing niobium and titanium peaks in the EDS spectrum, yet not comprising a core-shell morphology (Figure 6f). All these particle species were also found in the various hot-deformed samples.
After applying deformation, the precipitate population observed by STEM was strongly augmented by a large amount of small precipitates which were homogeneously distributed inside the grains. Figure 7 shows their size and distribution exemplarily on the sample deformed at 950 °C with a strain of ε = 0.3. The size of precipitates is in the range of 5 to 20 nm depending on the holding period after the compression hit, which was 200 and 1200 s, respectively. EDS shows that the precipitates are free or nearly free of titanium even after prolonged holding times.

3.3. APT Analysis of Precipitates and Solute Niobium Dtatus

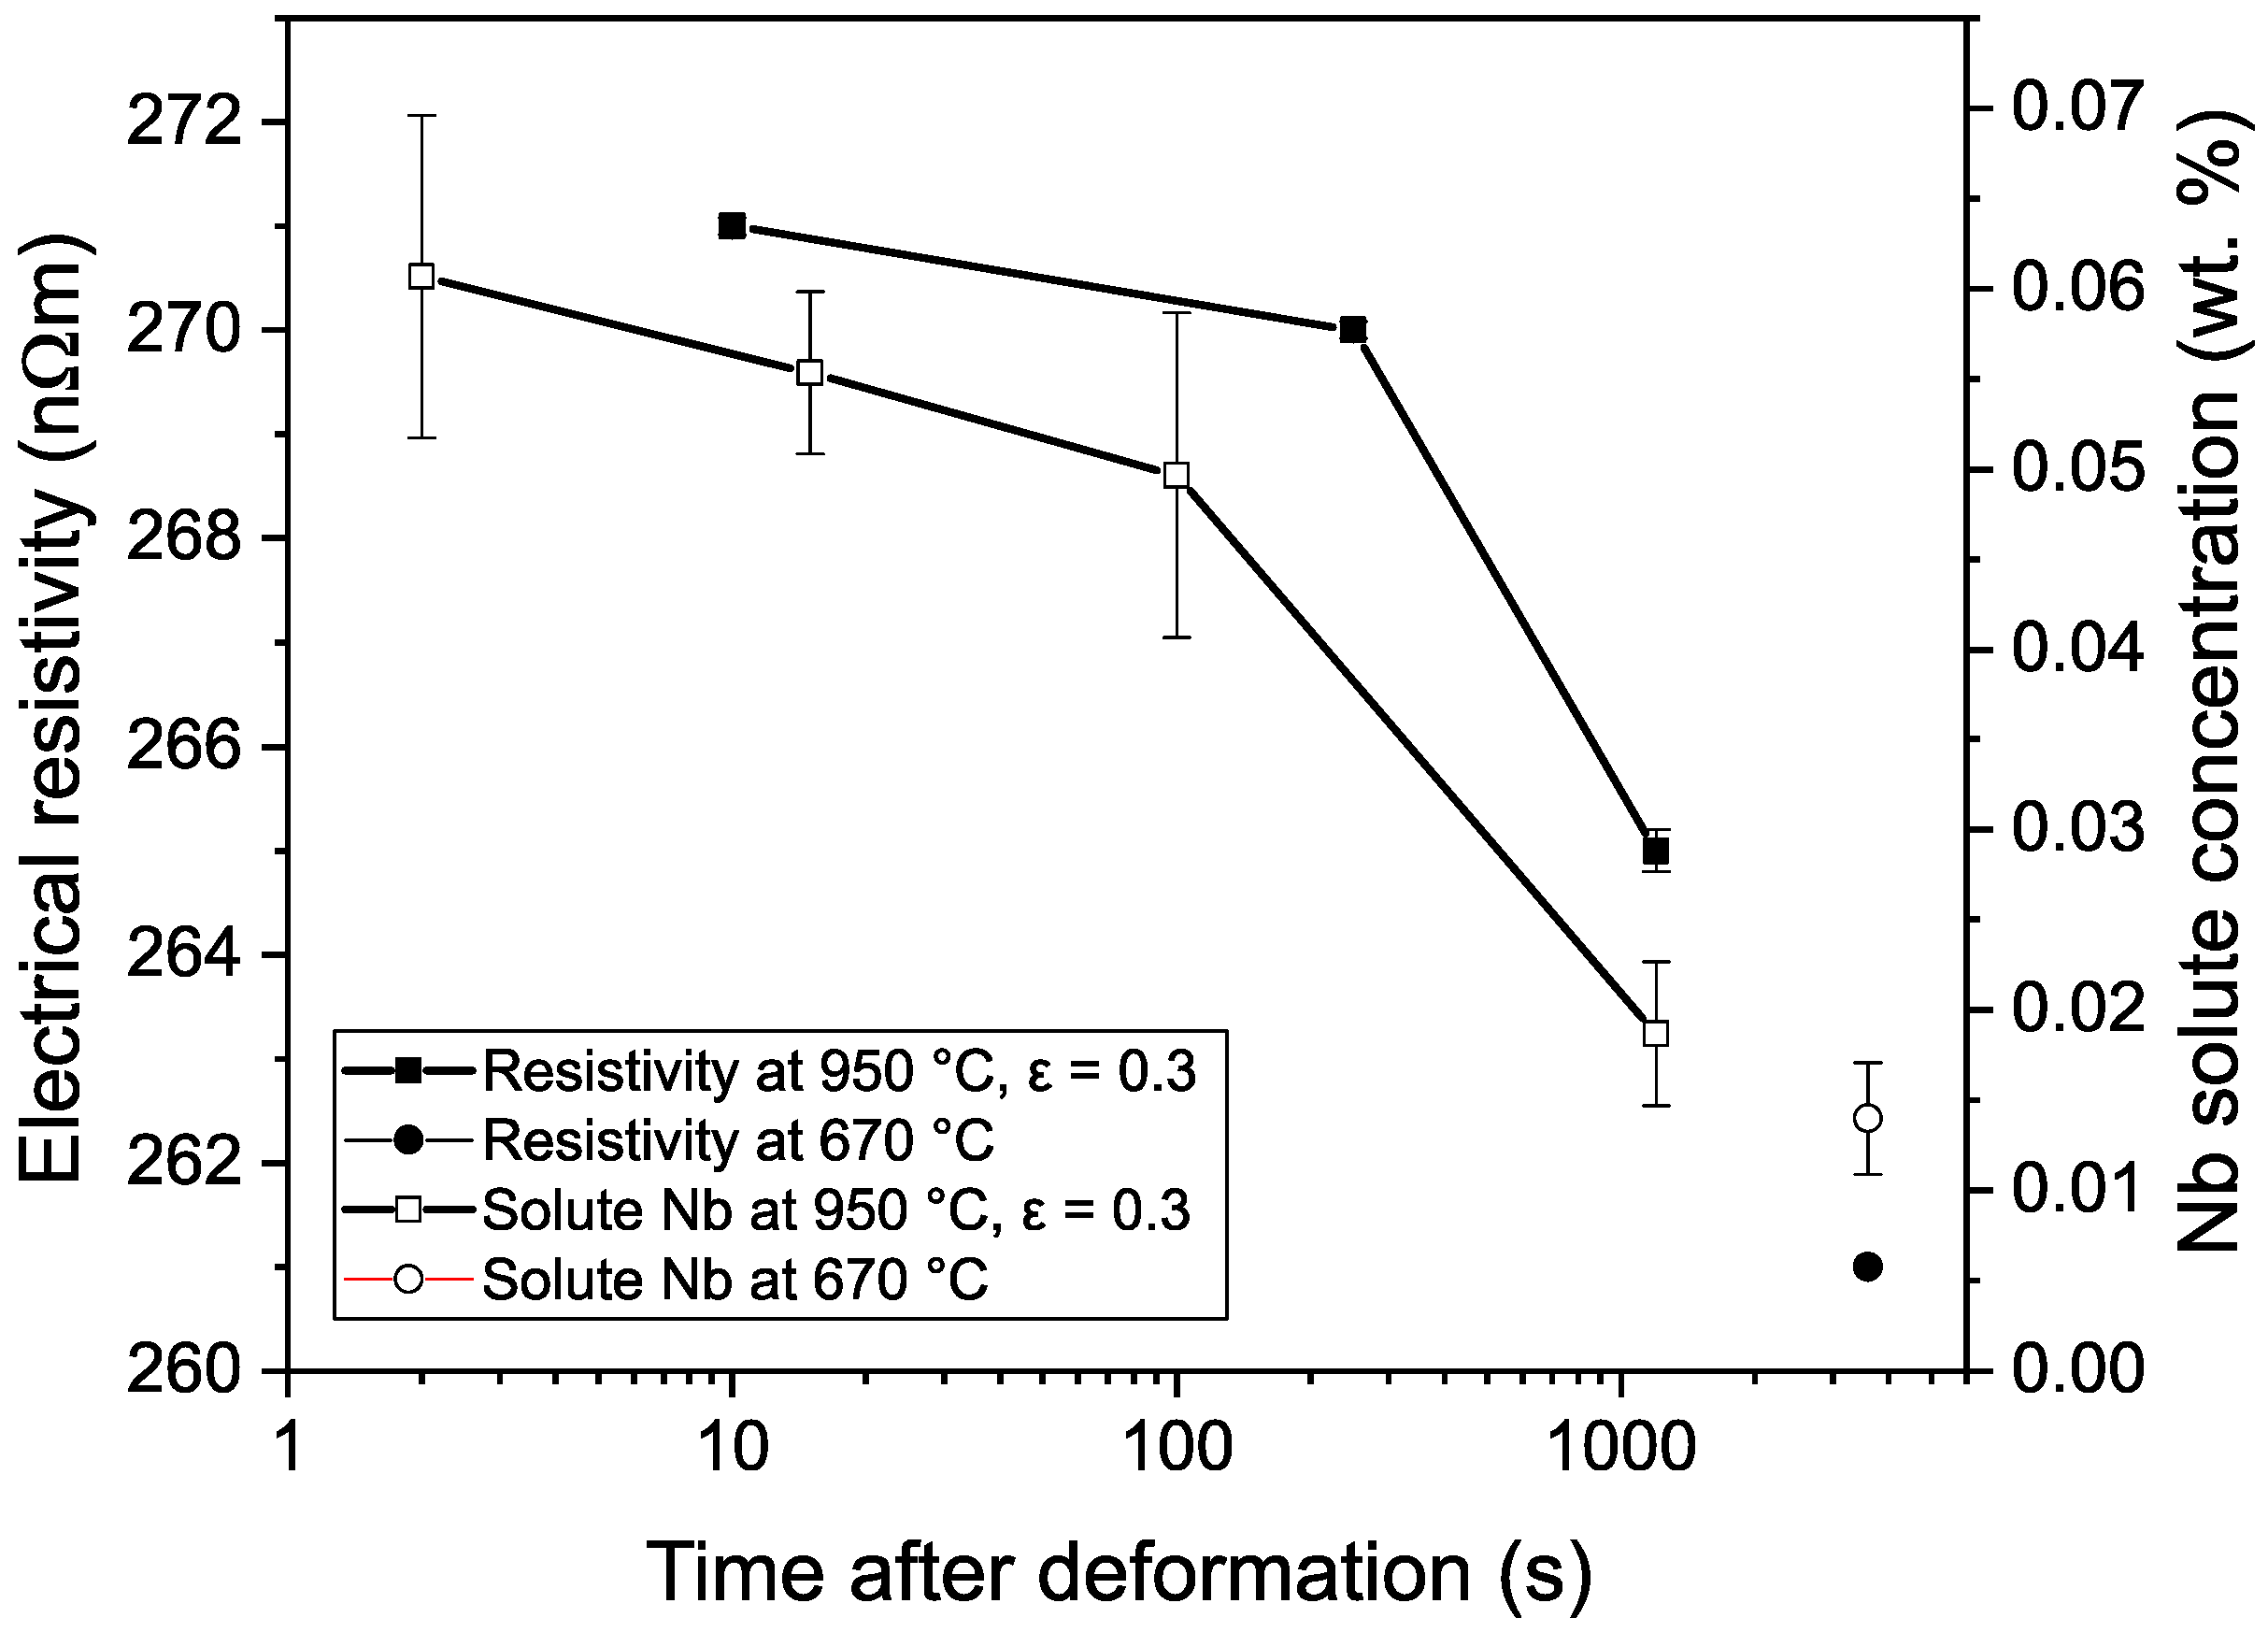
Along with the precise analysis of precipitates, the precipitate-free material volume bore valuable information as it allowed the determination of the amount of niobium dissolved in the steel matrix, or, in other words, the characterization of the solute depletion after precipitation in the neighborhood. Figure 8 compares the decreasing mass fraction of solute niobium measured by APT in the steel matrix with the electrical resistivity as a function of the time elapsed after deformation (950 °C, ε = 0.3, and 670 °C isothermally held for 1 h). For the deformed sample, the APT analysis revealed an initial solute niobium content of 0.061 ± 0.009 wt. %, whereas the steel nominally contained 0.085 wt. % niobium (Table 1). This indicates that the difference of around 0.024 wt. % niobium had precipitated before the deformation treatment. For the applied temperature-deformation condition, solute niobium was depleted to 0.019 ± 0.004 wt. % after a holding for 1200 s. Thus, approximately 70% of the initially dissolved niobium precipitated as deformation-induced particles. In the case of the sample isothermally held at 670 °C for 1 h, the concentration of solute niobium is 0.014 ± 0.003 wt. % which is 16.5% of nominal concentration or, taking the measured initial amount in the deformed sample, 23%. In the precipitation/segregation-free areas, the other carbide forming elements—titanium, carbon and nitrogen—were not detected in the mass spectra of the APT measurements, because they were either below the detection limit (the background of the APT measurements was around 10 atoms), or the respective peaks in the mass spectrum had an overlap with a much higher concentrated element (e.g., nitrogen totally fell into the peaks of silicon, which has a much higher concentration and therefore quantification of nitrogen would have produced values with high uncertainty).
Overlaying the data from electrical resistivity measurements showed a good correlation with the APT data (Figure 8). In addition to the matrix measurements, homogeneous precipitates were analyzed by APT in samples deformed at a lower austenite temperature (850 °C, ε = 0.6, quenched after holding for 200 s), which had a bean-shaped morphology (Figure 9). Their morphology best resembled the morphology of precipitates shown in Figure 6f, indicating that these precipitates also existed in the samples that were directly quenched from high austenite temperature without deformation. Their existence is rather interesting, since the understanding of particles having a heterogeneous TiN-core-Nb(C,N)-shell morphology is quite established. As visible in Figure 9, the particle predominantly consisted of carbon and niobium as well as smaller fractions of titanium and nitrogen. The elemental distribution in this particle was homogeneous and its composition is given in Table 3. The amount of niobium and titanium was nearly the same as the amount of carbon and nitrogen, so that the particle can be considered being a stoichiometric (Nb,Ti)(C,N) precipitate.
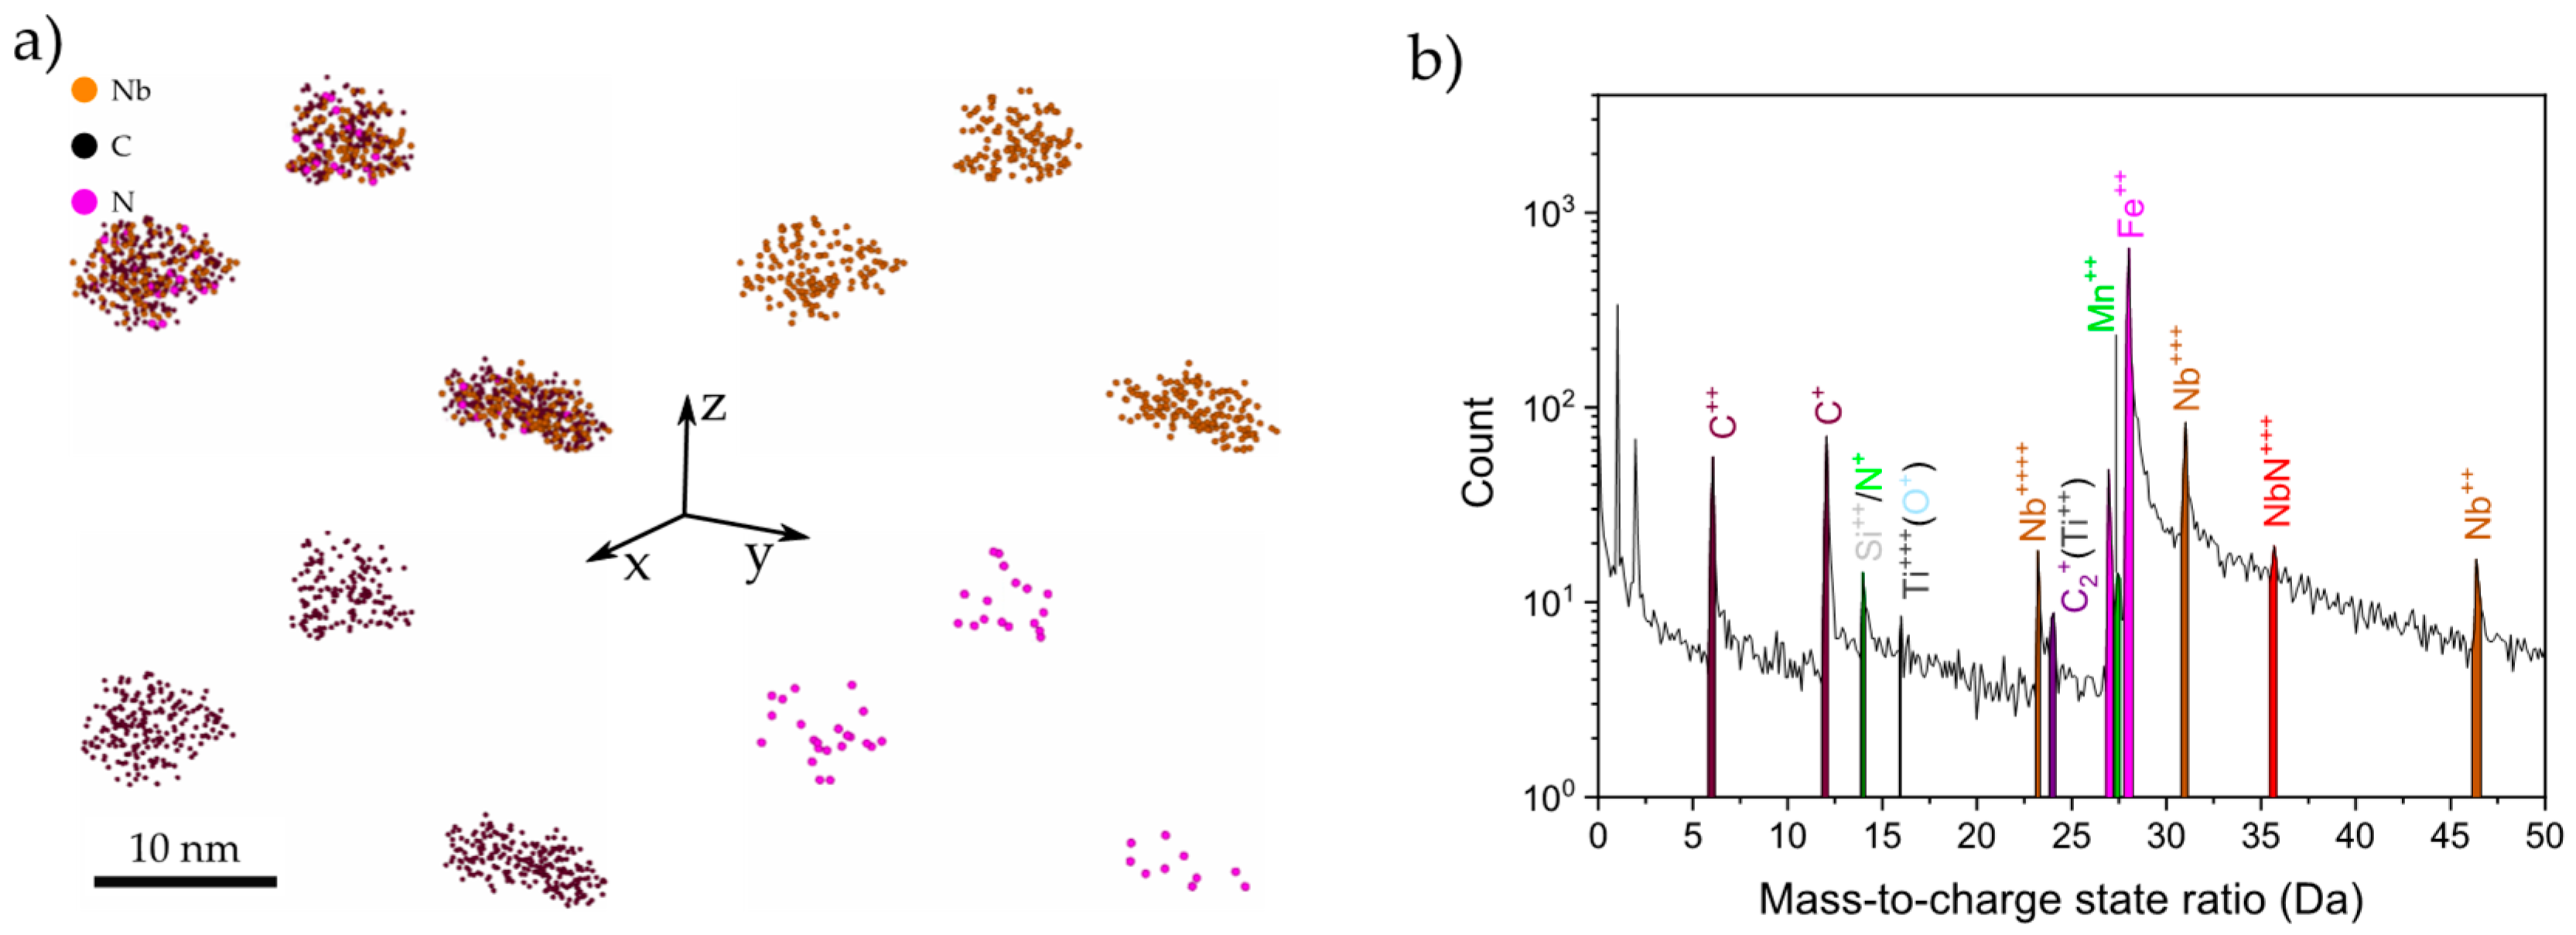
As shown before, after applying strain, the precipitate population observed by STEM was strongly expanded by a large number of small particles (Figure 7). In the sample deformed with a higher strain of ε = 0.6 at 850 °C, APT could detect small precipitates which are represented in Figure 10a. Table 4 shows that carbon and niobium were indeed the dominant elements in these precipitates, while only a small fraction of nitrogen and practically no titanium was found. The APT mass spectra peaks of 12C2+ and 12C+/12C22+ both contained significantly more atoms than the combined niobium atoms in the respective peaks at 23.3 Da (93Nb4+), 30.9 Da (93Nb3+), 46.5 Da (93Nb2+), and the (93Nb14N)3+ (Figure 10b). The peak at 24 Da corresponded either to carbon or titanium. Since no Ti2+ isotopes at 23, 23.5, 24.5, and 25 Da were present, the peak at 24 Da was assigned to 12C2+. Although it is not possible to assure that all the counts at this peak correspond unambiguously to carbon, these counts represent only 5% of the particle composition. Adding up all carbon counts, the Nb/C ratio was only 1.2:2. Yet, if the nitrogen counts are considered as well, the ratio of niobium to interstitial atoms approaches 1:2. Consequently, the chemistry of the precipitates was considered to be sub-stoichiometric (Table 4).
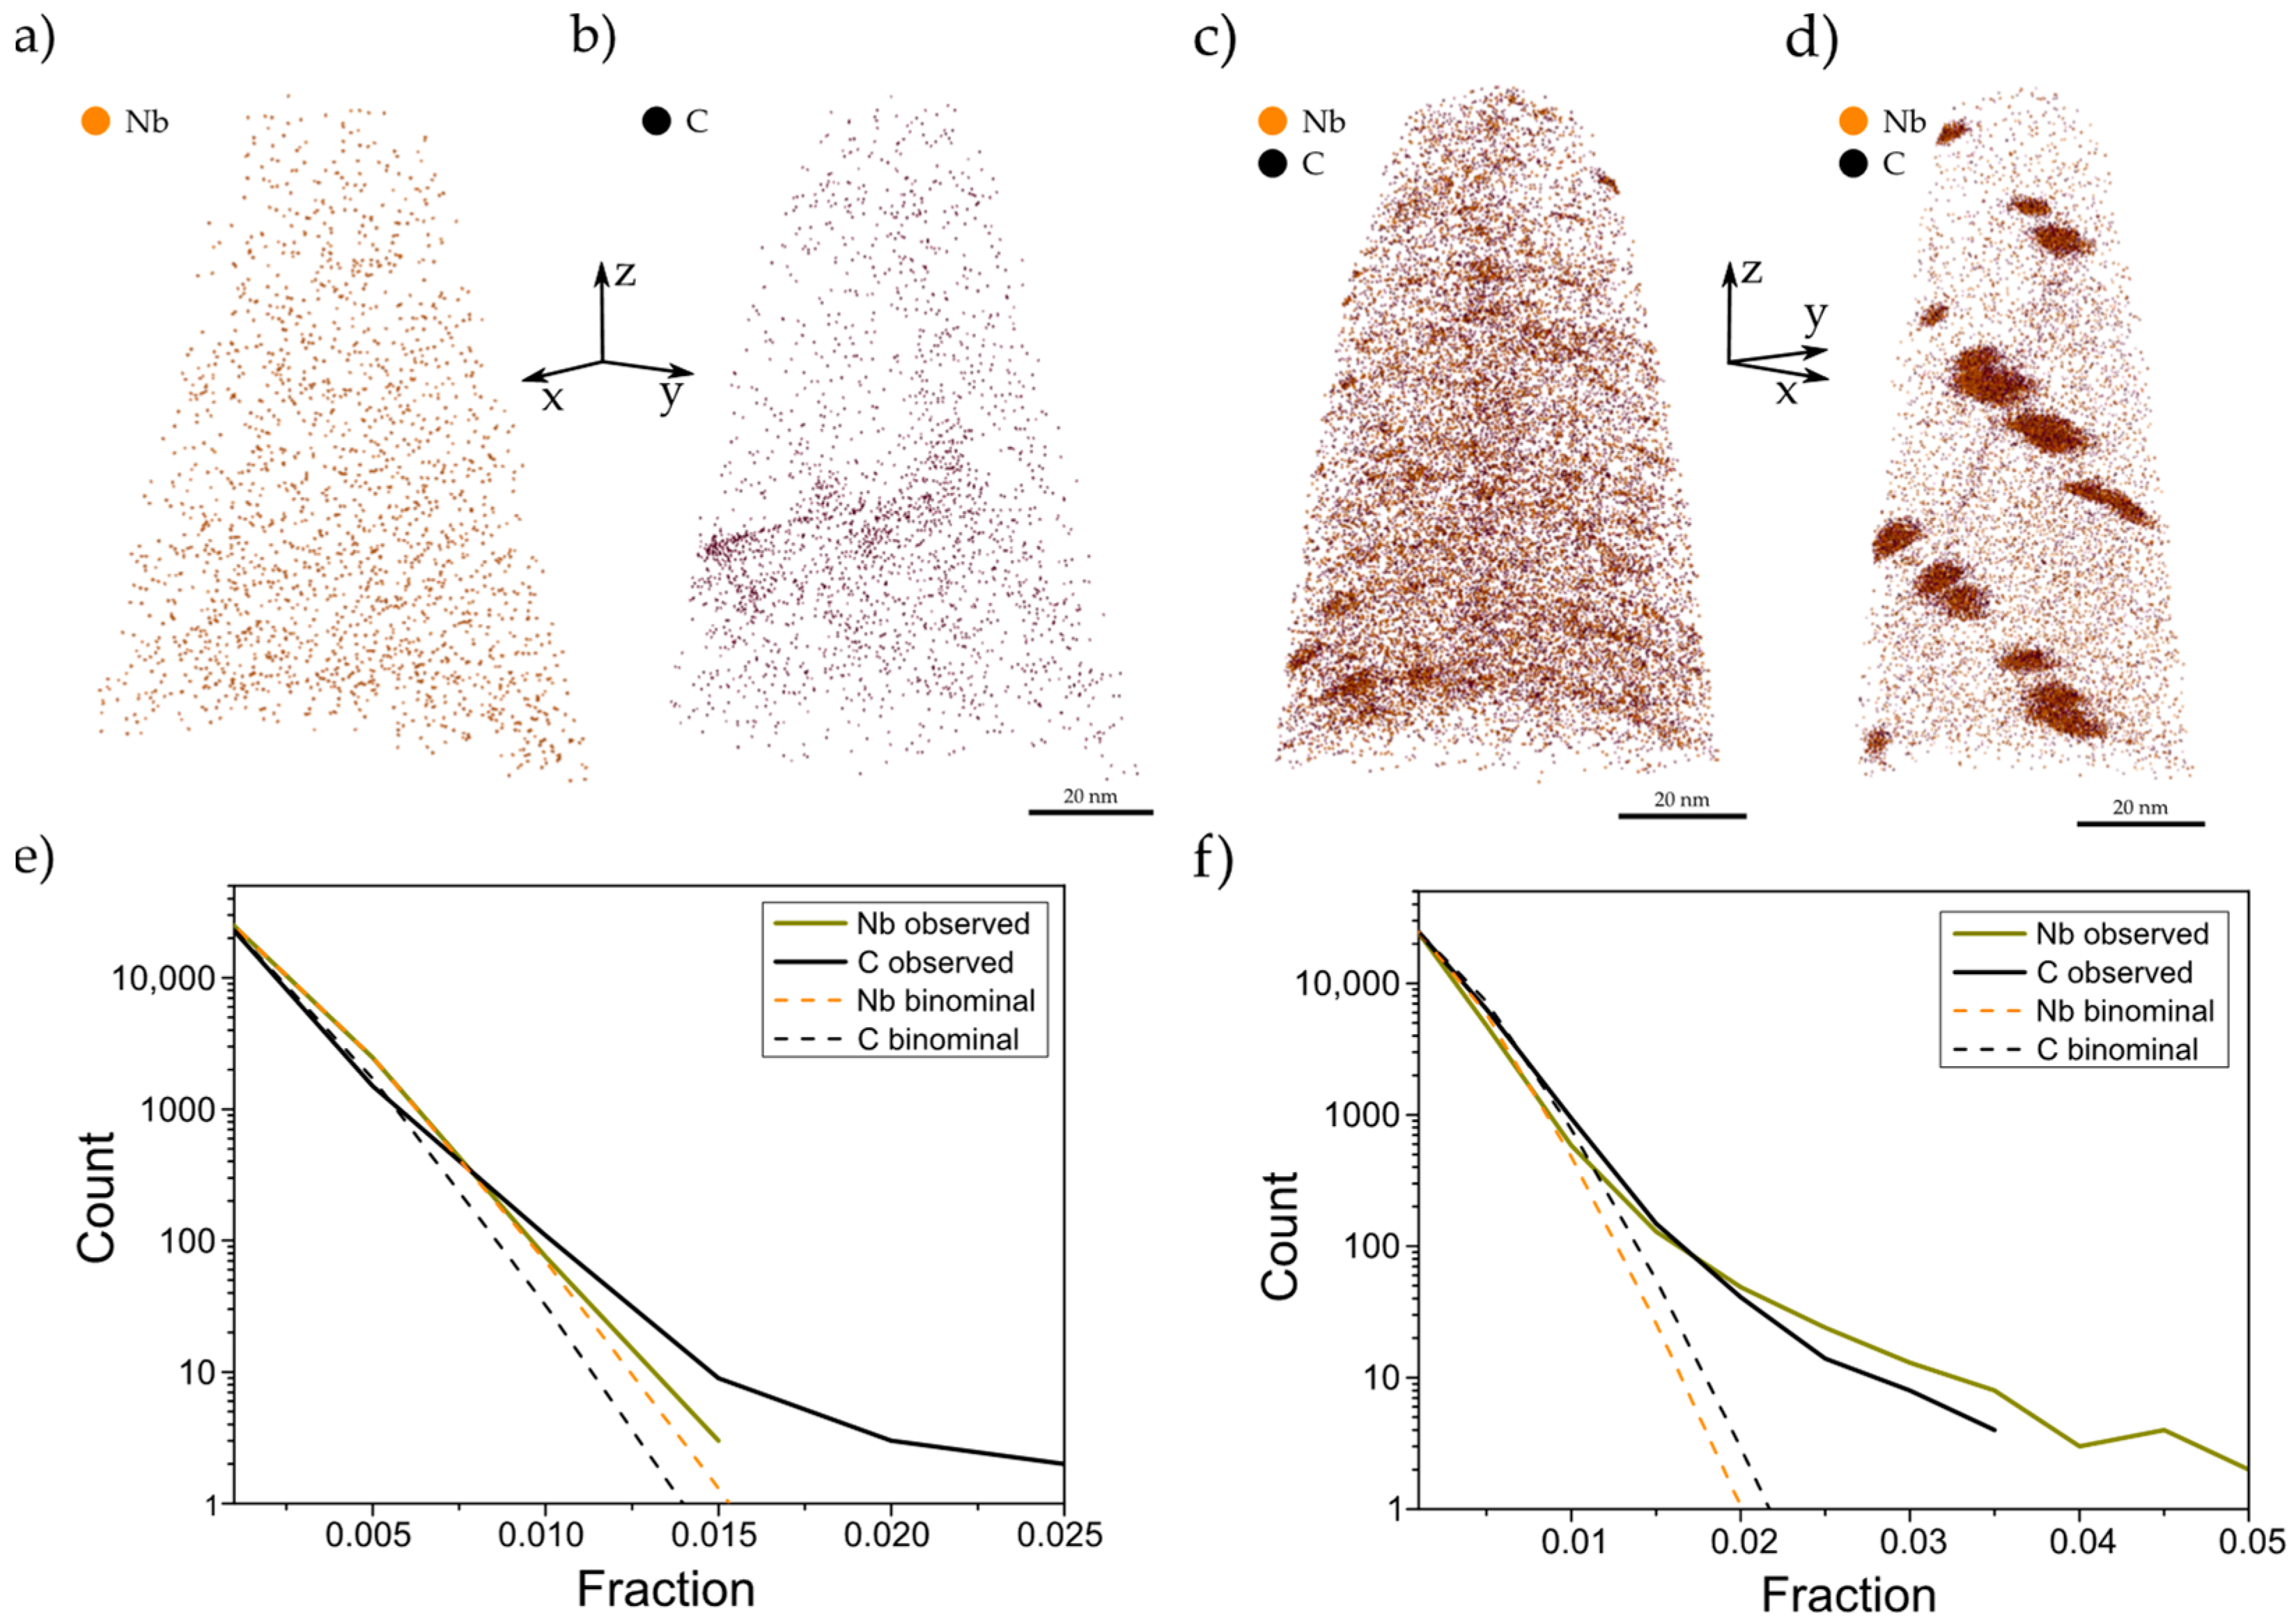
In samples deformed at 950 °C and quenched after short holding times up to 1200 s, carbon clusters were observed as shown in Figure 11b, whereas for niobium, the atom map (Figure 11a) indicated no obvious clustering in any of the cases (for ten or more measurements for each holding time 2, 15, 100, and 1200 s, analogous to the APT analysis shown in Figure 8). To rule out early stages of clustering, the distribution of the carbon and niobium atoms in the APT reconstructions was compared to a random distribution (frequency distribution analysis in IVAS software, binning 200 ions; Figure 11e). It can be seen that in the particular case of the atom maps of Figure 11a,b, only carbon was exhibiting a small deviation of 0.5 to 1 at. % from random distribution for a small number of clusters (Figure 11b), while niobium appeared to be randomly distributed throughout the volume (Figure 11a). No precipitates as detected in STEM (Figure 7) were detected by APT.
Finally, APT analysis was performed on the sample that was isothermally held at 670 °C after soaking at 1200 °C and cooling without deformation. It is reasonable to assume that the precipitation in this sample will be similar to the sample cooled to 850 °C and subsequently quenched. In absence of strain-induced precipitation, a substantial amount of solute niobium is thus still present at the austenite-to-ferrite transformation temperature, when the niobium solubility drastically decreases. Figure 11c,d depict two atom reconstructions showing only niobium and carbon from samples after the isothermal holding period. The atom map in Figure 11c contained short-range clustering of niobium and carbon with sizes of 0.5 to 2 nm (after the maximum separation algorithm [39] with the clustering atom species niobium and carbon using the parameters dmax = 1.2 nm, Nmin = 10 atoms, and an erosion step of 1.2 nm). The nearest-neighbor distribution showed a deviation from randomness (Figure 11f) for both carbon and niobium. In another ferrite grain of the same sample (Figure 11d), precipitates of typically less than 10 nm size have developed and the matrix was depleted from niobium although a small residual amount was still in solution. The precipitates were aligned in arrays and comprised an aspect ratio not equal to 1 and that was more pronounced for the larger particles. This alignment of particles is a typical feature of interphase precipitation, which occurs during the austenite-to-ferrite transformation [19,20,40]. For areas exhibiting interphase precipitation like in Figure 11d, a solute amount of niobium of 0.018 ± 0.002 wt. % was measured in the surrounding matrix, whereas for areas containing clusters such as in Figure 11c, the solute amount could be only estimated because of the diffuse boundary between NbC clusters and the steel matrix. In an exaggerated generous definition of a cluster—using a minimum cluster size of only 4 atoms—the remaining volume still contained 0.005 ± 0.002 wt. % of niobium according to peak decomposition. This result corresponds well to the data provided in Figure 2, where 90% of niobium is calculated to be precipitated after a similar heat treatment of a comparable steel. In the as-cast state of the steel melt used in this work, interphase precipitation analogous to Figure 11d was found, but with the difference, that the matrix was almost completely depleted of niobium, having only 0.002 ± 0.002 wt. % in solution.
The compositions of both cases in Figure 11c,d are given in Table 5. For the cluster composition, clusters larger than 20 atoms were regarded, which would mean a count of roughly 60 atoms (for the reported detector efficiency of 37% this equals, for example, a round nano-precipitate of one atomic layer and 2 nm diameter, as found by Breen et al. [41]). The precipitates and clusters had very similar compositions and were also stoichiometric like the homogenous precipitate from the soaked and quenched sample (Figure 9).

4. Discussion

4.1. Precipitation Behavior before TMCP Treatment

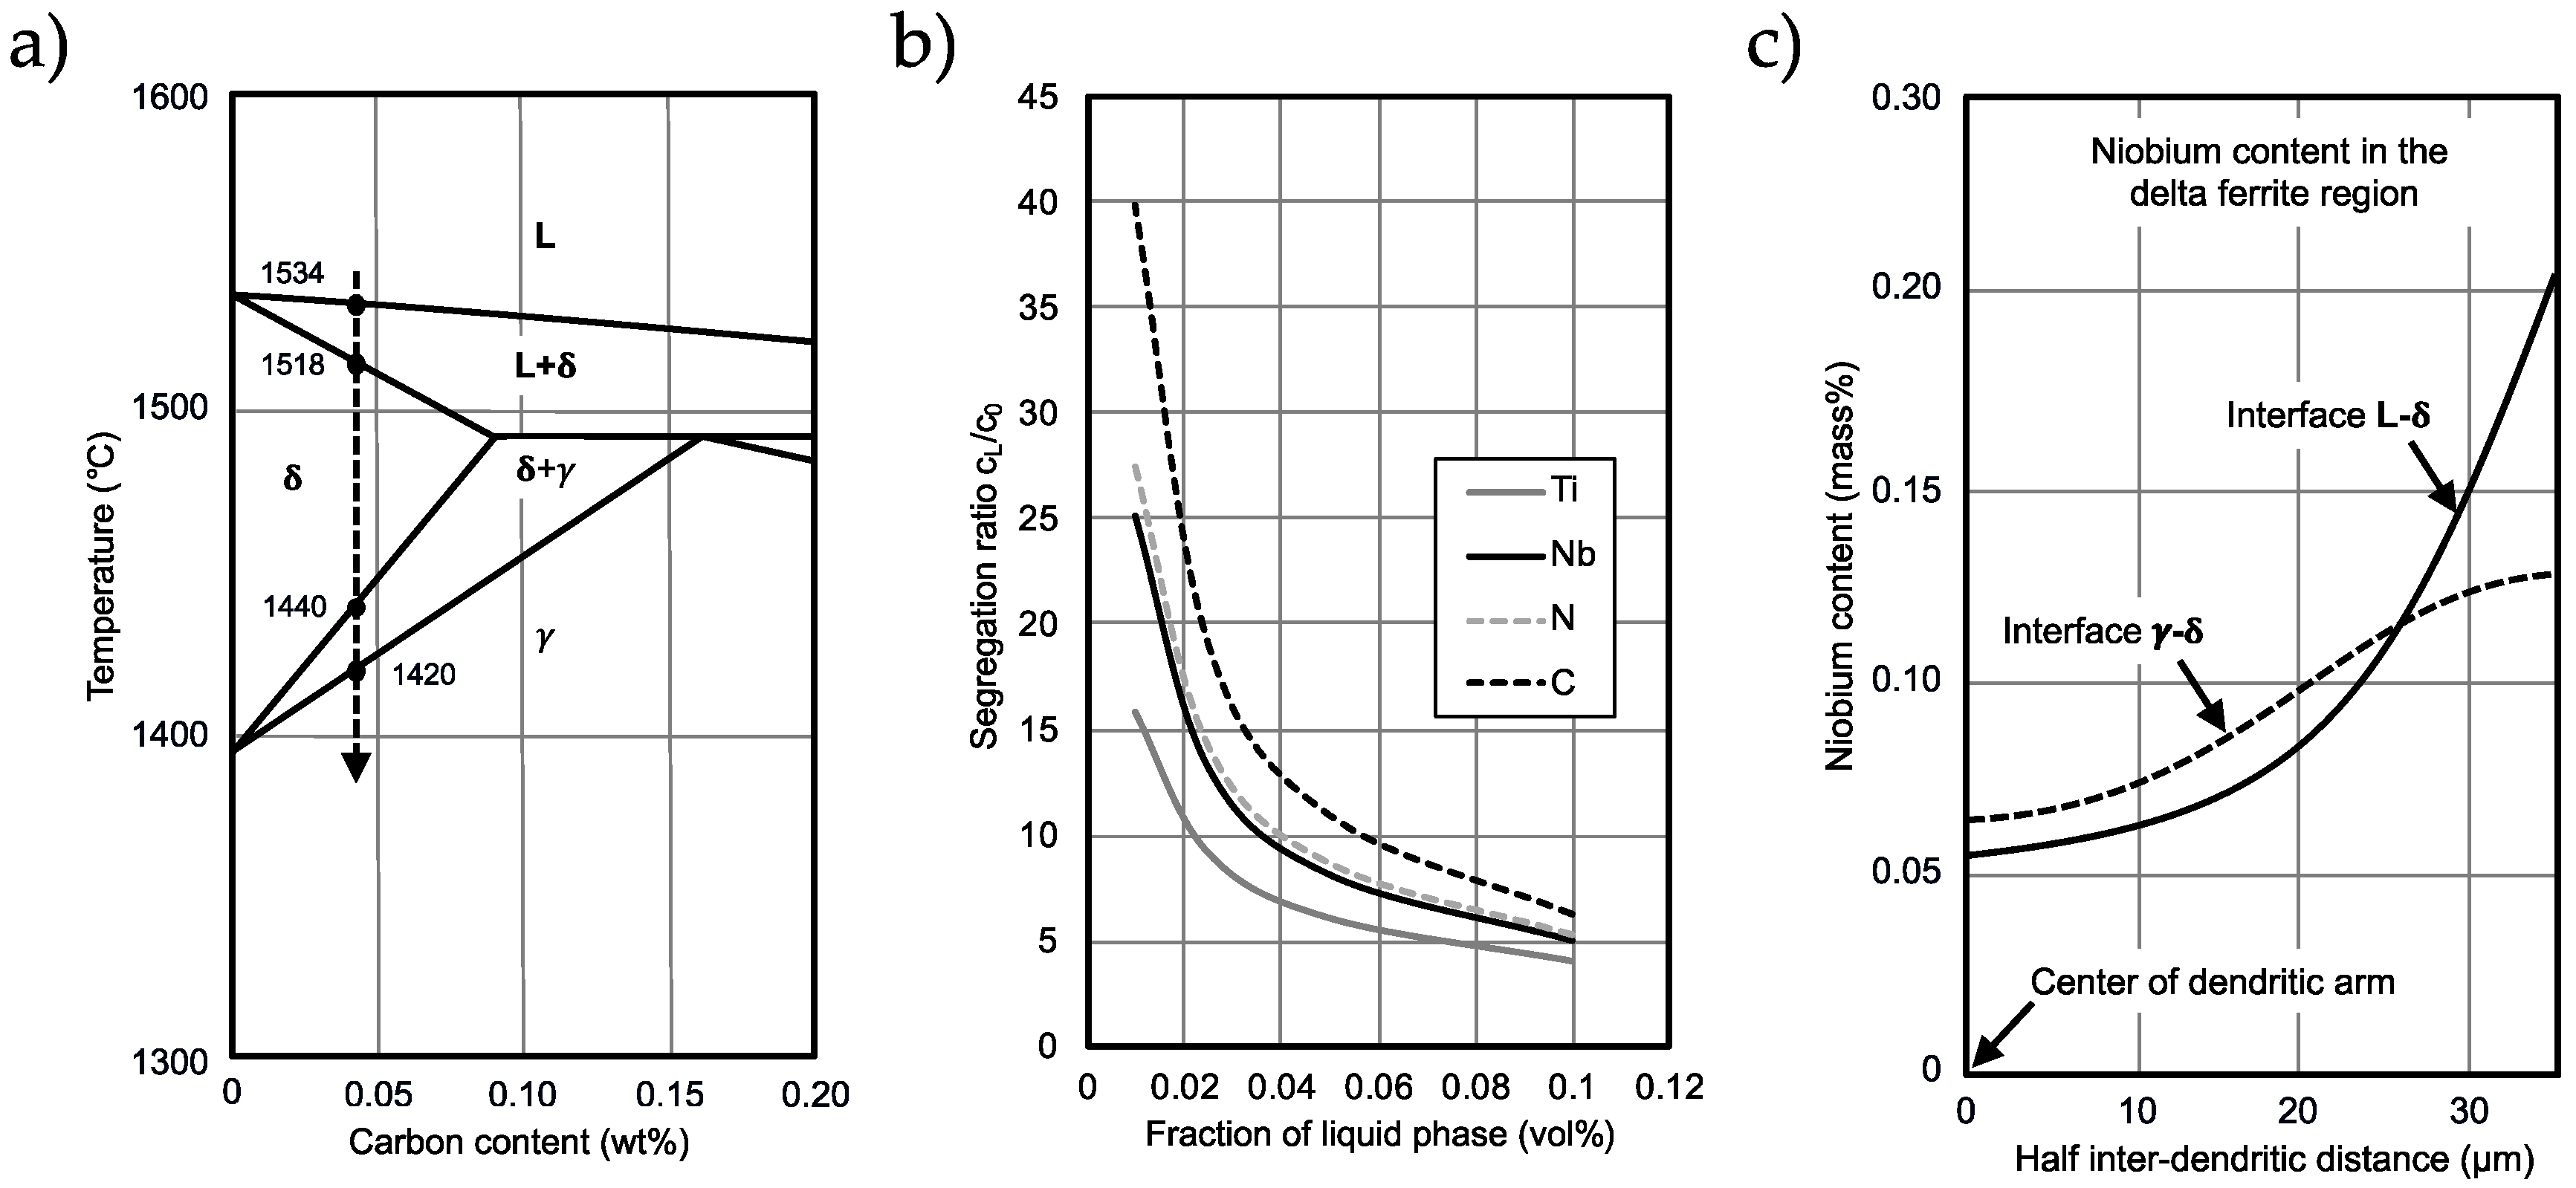
The types of precipitates observed and their evolution with simulated processing are generally in agreement with the results of other publications in literature [5,10,11]. Cube-shaped TiN particles typically containing a smaller fraction of niobium were already present at high austenite temperature (>1200 °C). The spatial arrangement of these particles and their proximity suggest that these had been formed in residual liquid pools during the late solidification phase. Titanium, niobium, nitrogen, and carbon all strongly segregated to the liquid phase as the amount of solidified delta-ferrite increased. The local supersaturation with titanium and nitrogen locally became so high that spontaneous precipitation occurred. The severity of segregation was controlled by the distribution coefficient of the respective element and might have resulted in local supersaturation exceeding the solubility limit. The segregation ratios, cL/c0, of the relevant elements titanium, niobium, nitrogen, and carbon were calculated as a function of the remaining liquid volume fraction, fL, with progressing solidification using Scheil’s equation [42] and published distribution coefficients (kTi = 0.4, kNb = 0.3, kN = 0.28, and kC = 0.2, compiled by Morita and Tanaka [43]) according to:
c L c 0 = f L k 1
Figure 12b demonstrates the segregation ratio of the four elements as a function of the remaining liquid volume fraction. According to Kunze et al. [10], TiN can precipitate in liquid steel if the supersaturation product of both elements exceeds the limit solubility by a factor of approximately 10. For steels having near-stoichiometric titanium and nitrogen contents as considered in the present study, this condition is fulfilled when the volume fraction of liquid phase is becoming less than 5 vol. %. Niobium has a higher segregation ratio in the residual liquid phase than titanium. Nevertheless, supersaturation levels necessary for spontaneous precipitation typically are not reached. However, type II dendritic precipitates can nucleate on titanium-rich nitride particles at the very final stage of the inter-dendritic liquid, or alternatively, on delta-ferrite phase boundaries as described in detail by Chen et al. [44]. The precipitates have a cored structure and are unstable at higher austenite temperature, where niobium carbide precipitates re-dissolve, leaving behind a string of small insoluble titanium-rich particles.
Upon full solidification, the significantly unequal distribution of solute microalloys between the center of a secondary dendrite and the last liquid periphery is quickly diminished by fast diffusion of these atoms in the delta-ferrite (Figure 12c). Short secondary dendrite arm spacings exhibit a quite equalized concentration profile at the transformation to austenite.
TiN is practically insoluble in austenite so that any remaining solute titanium is expected to precipitate upon further down-cooling. Such particles nucleate at dislocations and austenite grain boundaries. Considering the degree of solute titanium depletion and the diffusion range, these particles are expected to have a relatively small size in the range of 10 to 20 nm.
At the simulated reheating temperature of 1200 °C, niobium for the current alloy composition has a solubility of 0.27 wt. % (based on a commonly accepted solubility product log [Nb] × [C] = −7900/T + 3.42 [45]). An estimation of the dissolution kinetics predicts that particle sizes in the order of 1 µm could dissolve within the 10 min of soaking treatment. Therefore, it is concluded that the NbC caps are growing onto TiN cubes during down-cooling from soaking temperature to a lower austenite temperature. The fact that the NbC caps grow unidirectionally to opposite sides, suggests that the TiN particle is located at a dislocation or grain boundary, providing fast diffusion of niobium and carbon in this direction.
According to EDS measurements in Figure 6b, the precipitates that form above the deformation temperature incorporated a considerable amount of niobium. The APT measurements of the steel matrix (for the samples 950 °C, ε = 0.3) confirmed this (Figure 8), as the concentrations lay approximately at 0.06 wt. % even 2 s after deformation, whereas the nominal bulk composition was around 0.085 wt. %. This means that more than one quarter of the added niobium had already precipitated, prior precipitated on TiN or TiCN, and as a consequence lost for later strain-induced precipitation or precipitation strengthening. This was also found by Hegetschweiler et al. [14], who used particle extraction methods. On the contrary, in niobium microalloyed steels without titanium, all niobium can be brought back into solution, as was shown by an APT study by Palmiere et al. [32].

4.2. Precipitation Behavior during TMCP Treatment

The electrical resistivity method allowed to follow the evolution of strain-induced precipitation. The drop of resistivity can be explained by the nucleation and/or growth of precipitates and the subsequent consumption of solute niobium, and consequently, less scattering of electrons. According to the results of the different temperatures in Figure 5, the samples deformed at 900 °C had the lowest resistivity in general, which also corresponds to the well-accepted fact that precipitation both commences and completes much earlier in that temperature range (Figure 2). According to the resistivity data, the consumption of niobium for precipitation at 900 °C was multiple times faster than for 850 °C. However, the difference between samples of varying deformation temperatures but constant deformation grade (ε = 0.3) was relatively low compared with an increased deformation (900 °C, ε = 0.6). As deformation induces many dislocations, the dominating effect for solute niobium and carbon consumption was due to strain-induced precipitation. The strong decrease could have been either due to a higher nucleation rate or an increased niobium diffusion along the dislocation core (pipe diffusion), both consuming niobium and carbon faster. In principle, the deformation degree seemed to have the dominating effect over deformation temperature, which was also found by Jung et al. [29]. The cooling rate from austenitizing temperature down to the deformation temperature was 5 °C/s and therefore the difference in total TMCP time for the different temperatures was only 10 s between each other. Consequently, the influence of precipitates formed or grown during cooling on the difference of resistivity should be negligible in this discussion. In Figure 8, the falling niobium concentration in the steel matrix, although only analyzed in detail for the sample deformed at 950 °C, correlated well with the downward trend of the electrical resistivity with increasing holding time after deformation. Theoretically, the other carbide-forming elements—titanium, carbon, and nitrogen—also increase the resistivity when in solid solution, however, their quantification in the steel matrix was not possible for the investigated steel composition. For the counts in the mass spectrum belonging to titanium (Figure 10b), the matrix spectrum neither had visible peaks at 16 Da, nor at 24 Da. With the background of roughly 10 atoms, this means that for all measurements the solute titanium amount was lower than 5 ppm (for illustration, the amount of 0.002 wt. % solute niobium which was measured in the as-cast sample with visible peaks equaled 200 atoms in an APT measurement of 10,000,000 atoms which was well above the background noise). Since even at the austenite-to-ferrite transformation temperature titanium could be found in precipitates, a small amount must have still been in solution. Likewise, no carbon (with the exception of the carbon atmospheres, and occasional lath boundaries or retained austenite islands) was detected in the matrix. For nitrogen, the quantification is additionally complicated by the overlap of the nitrogen peak at 14 Da with silicon, that had a much larger abundance in the sampled steel. As it will be discussed further on, when addressing potential errors of the resistivity measurements, carbon and nitrogen influences might actually be ruled out for quenched samples.
The large family of precipitates that typically form during TMCP of Nb-Ti-microalloyed HSLA steels makes it challenging to fully distinguish them relying solely on (S)TEM. Adding APT to the characterization toolbox brought about the ability to characterize the chemistry of single precipitates with the highest resolving power available to date and without interfering with the precipitate environment, i.e., steel matrix or neighbor precipitates. For example, the bean-shaped precipitates with homogeneous niobium and titanium atom distribution in Figure 9 had a size and morphology that could be identified as both the STEM-characterized precipitates present at soaking (Figure 6f), or the ones detected after deformation (Figure 7). However, APT reveals the composition of the precipitate to contain also small fractions of titanium (Table 3), whereas the careful comparison of precipitates after deformation and austenite-to-ferrite transformation (Figure 10, Table 4, and Figure 11c,d, Table 5, respectively) showed that strain-induced precipitation contains no titanium with regard to the detection limits of the APT. Characterization of the precipitate in Figure 9 on the basis of (S)TEM could erroneously identify it as the product of deformation, which would overestimate the growth kinetics of strain-induced precipitates for the investigated deformation temperature (note that this Ti-containing precipitate was found after a holding time of 200 s, whereas even at 950 °C, only after 1200 s can strain-induced precipitates reach such a size (Figure 7)). Despite a very precise chemical quantification of the big and small (Nb,Ti)(C,N) precipitates, small size deviations are possible due to APT-related artifacts. The so-called local magnification effect [46] appears when precipitates have a very different evaporation field compared to the matrix. In this special case, (Nb,Ti)(C,N) showed a high evaporation field of around 55–60 V/nm for pure NbC. In the steel matrix with an evaporation field of 33 V/nm, the reconstructed precipitates would therefore appear larger than they were. Although a direct size comparison of APT and STEM-measured precipitates was not possible, the medium-sized and homogeneous (Nb,Ti)(C,N) precipitates found in STEM for samples quenched from the soaking temperature (Figure 6f) fell in a similar range as the APT-measured precipitate in Figure 9.
A more plausible explanation for the origin of the precipitate in Figure 9 is, that it had formed during the casting. If these precipitates did not (re-)dissolve during reheating, they would still be present in the samples quenched from a higher austenite deformation temperature after austenitizing at 1200 °C (Figure 6f), as well as in all other deformed samples. As it was shown for the Ti-containing small precipitates in the samples transformed isothermally into ferrite (Figure 11,d), titanium was still in solution at the austenite-to-ferrite transformation temperature. The bigger (Nb,Ti)(C,N) precipitates might therefore be the outcome of the coarsening of clusters such as displayed in Figure 11c. Preliminary work on the co-microalloying of niobium and titanium considered the higher temperature stability of (Nb,Ti)(C,N) precipitates to be the reason for their presence even after soaking at high austenite temperatures [5,7].
When applying deformation, STEM images showed a sharp increase in very small precipitates which grew with the holding time (Figure 7). Likewise, APT results depicted small precipitates in the sample deformed with ε = 0.6 strain at 850 °C and found them to be free or nearly free of titanium but with an over-stoichiometric amount of carbon (Figure 10 and Table 4).
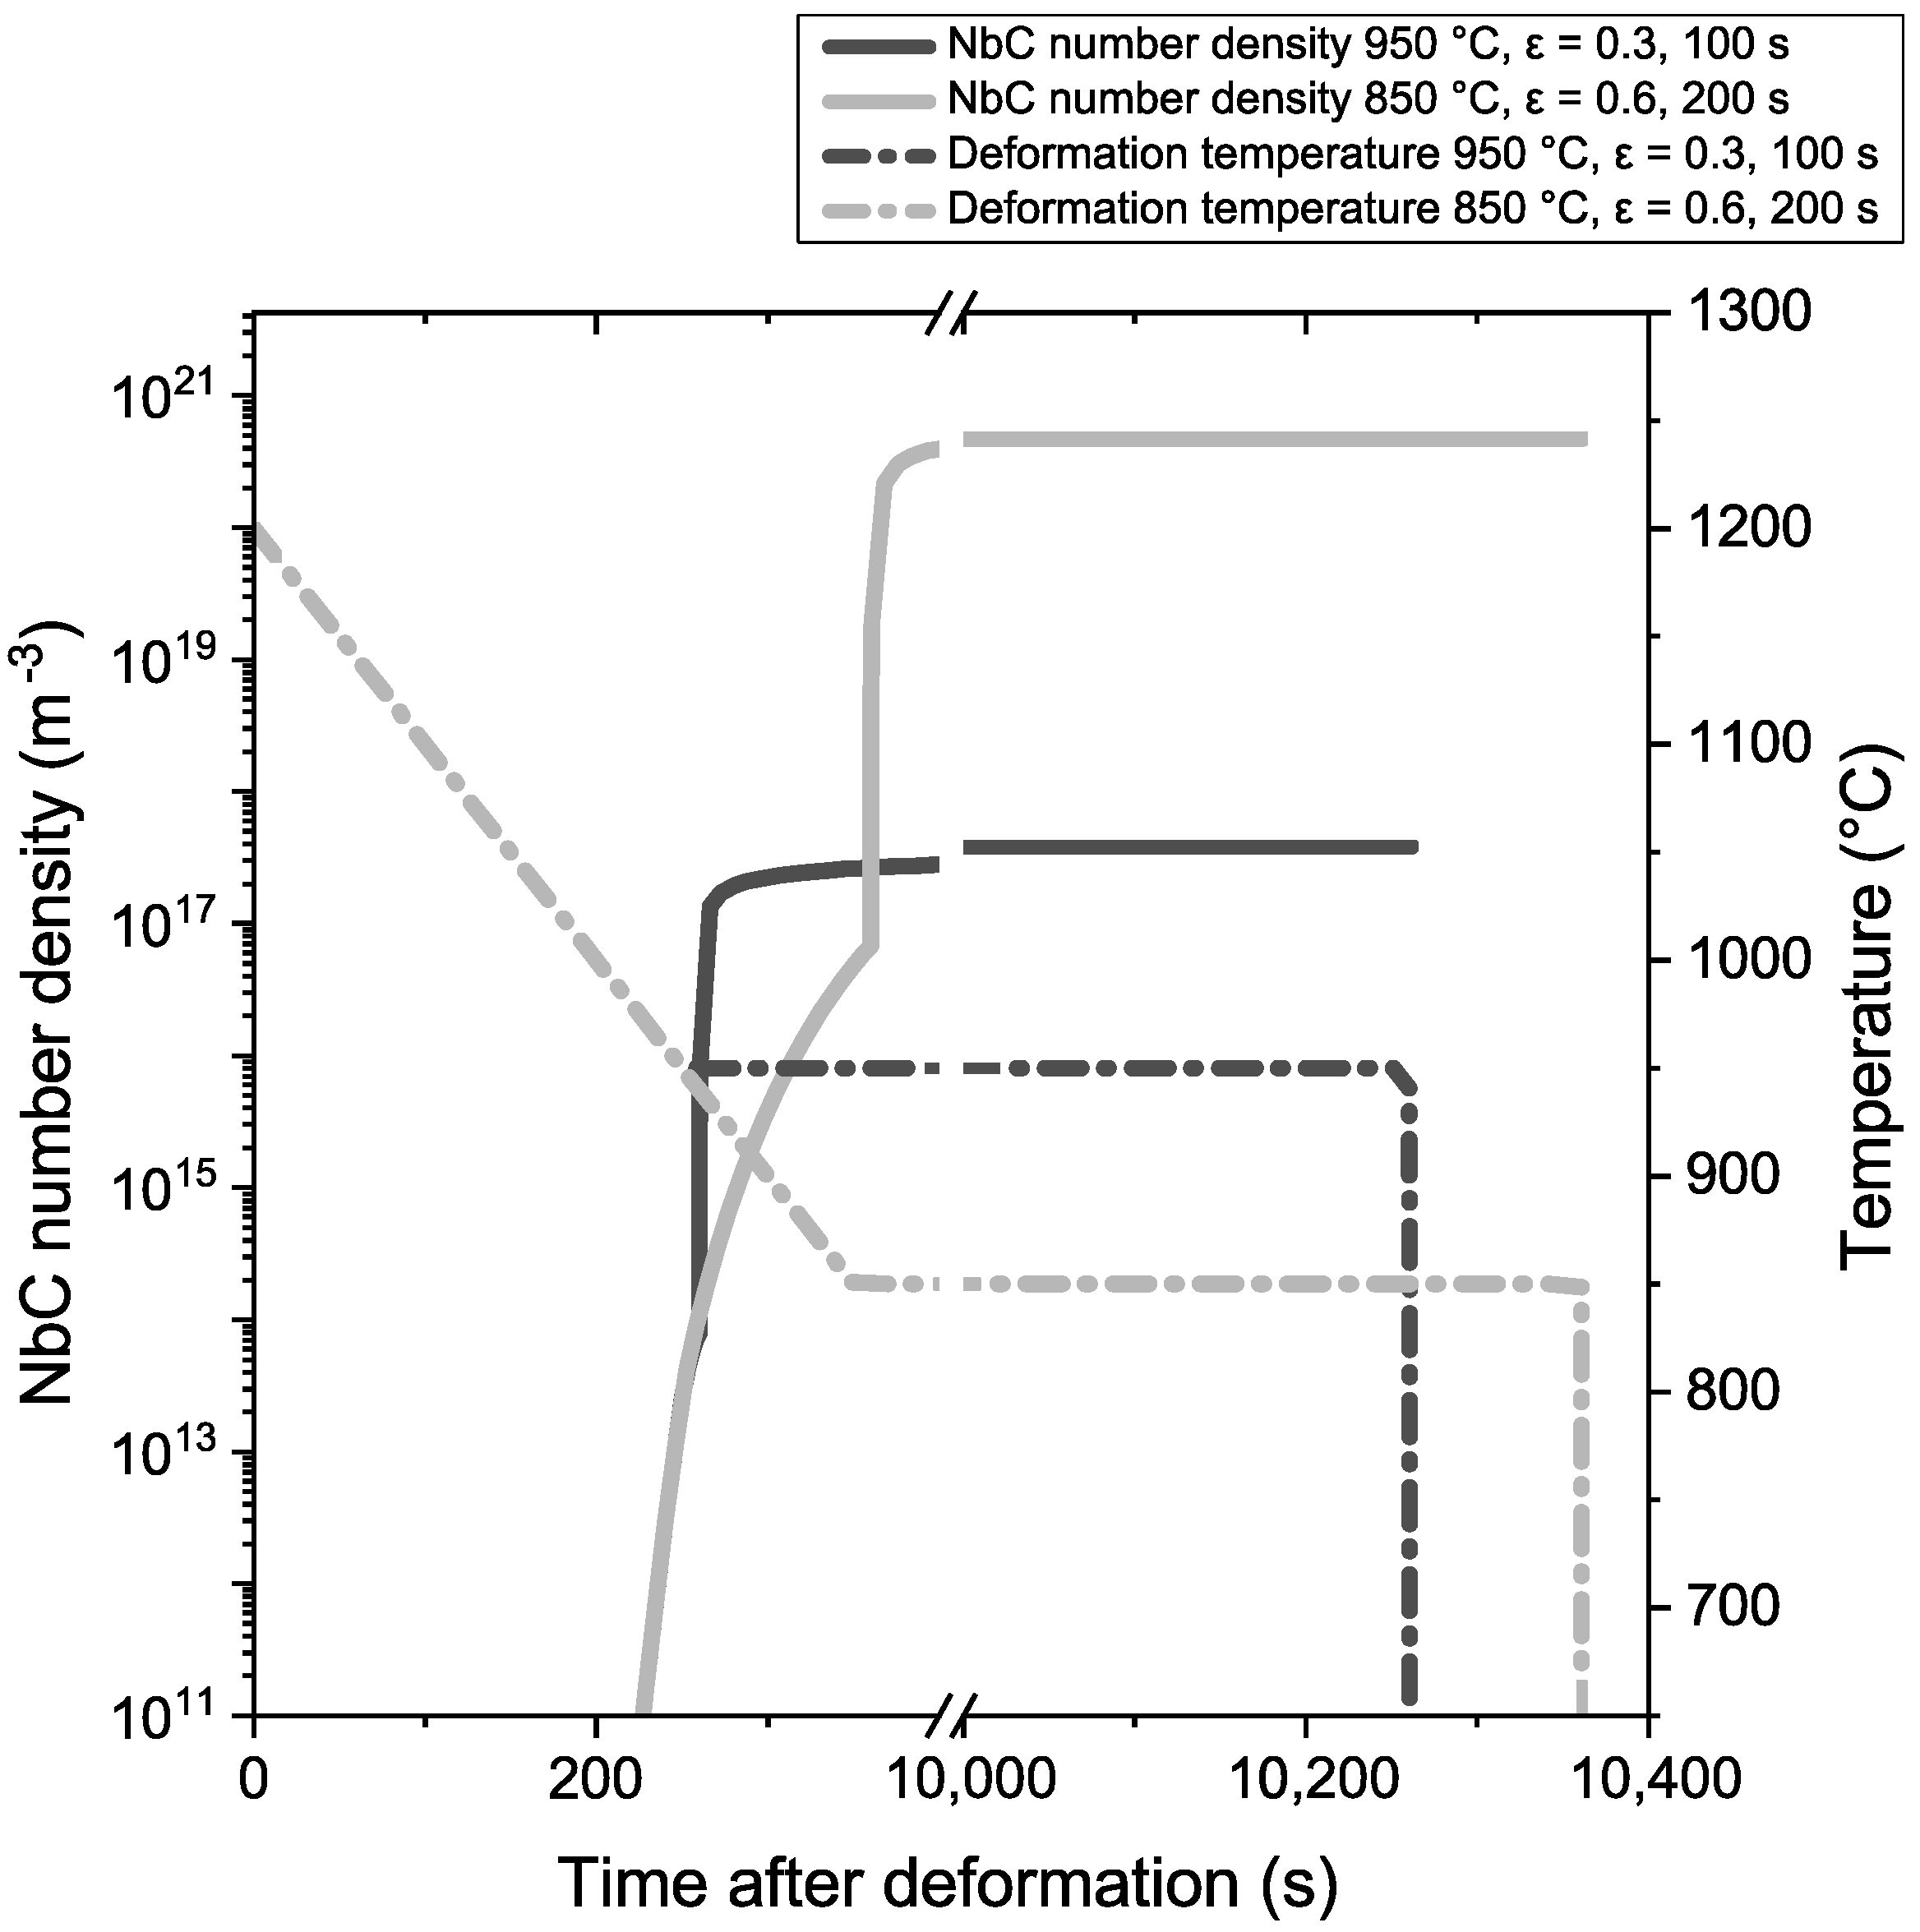
In the sample deformed at 950 °C with ε = 0.3 strain, no precipitates were detected by APT although their existence and coarsening are visible in STEM (Figure 7). MatCalc simulations were conducted (Figure 13) to investigate the density of precipitates that could be expected after deformation at higher and lower austenite temperatures and with varying deformation. According to simulation, the precipitation density increased by a factor of 103 when lowering the deformation temperature from 950 °C to 850 °C and increasing total strain from ε = 0.3 to ε = 0.6. The number density of 1017/m3 in the case of 950 °C, ε = 0.3 would approximately correspond to the detection of one particle every 8000 measurements, assuming homogeneous particle spacing and an average volume of one APT measurement with a diameter of 80 nm at the base and a length of 200 nm. On the contrary, for 850 °C, ε = 0.6, an average of one detection every six measurements was predicted. This lies in the range of the experimental findings for these cases. Furthermore, compared to the influence of the deformation temperature, the decrease in electrical resistivity was more pronounced when raising the deformation from ε = 0.3 to ε = 0.6, as shown for the samples deformed at 900 °C (Figure 5). This was also well reflected by the increased detectability of NbC in APT in higher-deformed samples. Together with the APT measurements, it is concluded that the measured effect stems from strain-induced precipitation. The strain-induced NbC had a non-stoichiometric composition with a carbon content being more than 1.5 times larger than the niobium concentration. A previous investigation using APT had discussed the hypothesis of a deficiency of carbon detection in carbides [47], which is contrary to the findings of the present work. In addition, if these precipitates are strain-induced, then it is conceivable that the carbon surplus came from its segregation along dislocations which had preceded the precipitation formation. Carbon atmospheres as possible precursors were detected in almost every APT measurement of the samples deformed at 950 °C, and many of them showed line-like features like in Figure 11b. The carbon enrichments are therefore assumed to be Cottrell atmospheres and niobium, which has a slow diffusion rate compared to carbon, diffused during a later stage to form precipitates. When deformation increased, more dislocations were produced, facilitating the diffusion along the dislocation core. Therefore, the particle detection statistics during APT experiments strengthen the assumption that the precipitates found were indeed induced by strain. The existence of metastable NbC precipitates was already discussed earlier by Danoix et al. [48] and the detected Nb(C,N) in the sample subjected to a higher deformation provided evidence of their existence.
Kostryzhev et al. [35] proposed early stages of precipitation in the form of clusters (in the range of 30 to 60 atoms) during austenite deformation. No evidence of such a clustering was found in this work. The atom maps of deformed and then quenched samples did not show any visible clustering of niobium or titanium except the already discussed precipitates in the sample 850 °C, ε = 0.6. In Figure 11, the atom distribution of the sample deformed at 950 °C, ε = 0.3 and the sample held at 670 °C for 1 h were compared. In the latter case, Figure 11f displays a marked deviation of niobium and carbon distribution from random, which is also visibly clustered in the atom map of Figure 11c. In contrast, sample 950 °C, ε = 0.3 had no visible niobium clustering (Figure 11a), while the carbon clustering in Figure 11b shows a possible Cottrell atmosphere as discussed above. It is therefore concluded that strain-induced precipitation during deformation in the higher austenite temperature regime is challenging to trace with APT alone due to the low particle density in low-deformed austenite. An ongoing project is developing a methodology that aims at increasing the precipitate yield in APT measurements by their extraction and re-encapsulation in a suitable matrix material. It is envisioned that by this methodology, precipitates of any heat treatment can be measured with sufficient yield.
The correlation of APT results with the electrical resistivity proved that bulk measurements can successfully describe the precipitation sequence occurring at the atomic scale. As specific resistance measurements were quite challenging for the investigated samples, the sources of error need to be addressed as well. The electrical resistivity relies on the precise measurements of the current that flows through the sample, the voltage drop over the sample, and the precise knowledge of the relative position of the potential points. The latter aspect was especially important, as for the currently used Gleeble setup, the hot-deformed samples were relatively short to prevent buckling. The total increment of resistivity decrease from dissolved to fully precipitated accounts only for approximately 10% of the total resistivity range. The distance of the potential is proportional to the measured resistance, therefore a misplacement of several hundreds of microns in the present setup introduces large errors of the calculated resistivity. Future experiments with larger samples may help to reduce the error in the measurement of the distance of the potential points. Another aspect worth mentioning is the assumption, that the other elements in the sampled steel do not change their atomic distribution in the different investigated heat treatment stages. This approximation might be correct for most elements, such as manganese, copper, silicon, and nickel, which did not take part in the precipitation process according to APT results. However, long-range chemical inhomogeneities which stem from casting of the ingots could produce variations in the resistivity irrespective of the solute niobium consumption during precipitation. Additionally, pores in the sample would decrease the cross section for the passing current and increase the measured electrical resistance. All this could be the reason for unexpected resistivity values as was the case for the sample 900 °C, ε = 0.3 and held for 1200 s before quenching (Figure 5). Regarding carbon and nitrogen, which actively took part in the precipitation process, tempering at low temperature was conducted in prior work to bring all solute carbon and nitrogen to lath or grain boundaries [26,28,29]. However, more recent experimental data suggest that even under heat treatment conditions severely obstructing diffusion—such as quenching from the austenite field to room temperature—there is sufficient time for interstitial atoms to diffuse to bainite or martensite lath boundaries or prior austenite grain boundaries in large quantity [49,50], or, as in some cases, to dislocations (Figure 11b). Therefore, the matrix is depleted of those elements, which was also confirmed by APT measurements in the present work. Consequently, their influence on changes of the electrical resistivity was assumed to be negligible.

4.3. Precipitation during Austenite-to-Ferrite Transformation

When isothermally held at 670 °C for 1 h, APT measured a high density of (Nb,Ti)(C,N) precipitates. In some ferrite grains, very fine clusters with sizes even below 1 nm were found, whereas in other grains, an ordered arrangement of bigger (5–10 nm) precipitates typical for interphase precipitation appeared. These two phenomena coexisted in the same heat treatment as evidenced in Figure 11c,d. During transformation, the interphase precipitation proceeded over the moving ferrite grain front into the austenite and when a certain level of supersaturation was reached, the solute niobium precipitated along the whole front. However, some grains might have transformed too quickly for interphase precipitation to follow, or the grain orientation was not favorable [20]. Therefore, instead of interphase precipitation, a Nb supersaturation of the freshly formed ferrite led to a high nucleation density resulting in the fine-scale clustering/precipitation visible in Figure 11c.
The interphase precipitates had a similar composition as the medium-sized (Nb,Ti)(C,N) (Table 3 and Table 5, respectively). Interphase precipitation was also observed in the as-cast state, likewise, containing titanium. As these small (Nb,Ti)(C,N) precipitates were not present in the hot-deformed and quenched samples, they must have either totally dissolved again during soaking or coarsened to larger particles, similar to the one shown in Figure 9. The Gibbs-Thompson effect predicts solubilities almost twice as high for small precipitates compared to larger ones as found in the samples quenched from austenitization temperature [51]. Therefore, smaller (Nb,Ti)(C,N) precipitates could have completely re-dissolved, whereas bigger precipitates did not dissolve during re-heating. The residual solute amount of niobium after the isothermal holding phase was measured to be approximately 0.014 ± 0.003 wt. %. Considering that 0.061 ± 0.009 wt. % niobium was re-dissolved after soaking and was therefore available for precipitation during isothermal holding, the fraction of precipitation was approximately 77%. This is close to the value that would be expected according to the kinetics shown in Figure 2 and was also well reflected in the electrical resistivity measurements.

5. Conclusions

Multi-scale characterization methods were used to quantify the precipitation status of niobium during austenite conditioning in a typical Nb-Ti microalloyed high-strength low-alloy steel, namely electrical resistivity, STEM and APT measurements. These methods provided complementary information on nucleation, growth, spatial distribution, and chemical composition of Nb(C,N) precipitates.
The reported results showed that the electrical resistivity method can efficiently monitor the progress of precipitation for different TMCP conditions. Measuring the average amount of solute niobium in the steel matrix by APT allowed to calibrate the electrical resistivity method. Such measurements also demonstrated that, in Nb-Ti dual microalloyed steel, part of the niobium is bound in mixed Ti,Nb(C,N) particles that do not dissolve during typical soaking treatment.
The chemical composition and spatial arrangement of such Nb-rich TiN particles indicated that both, Nb and Ti, had reached a high segregation level in inter-dendritic liquid pools existing just before full solidification.
APT allowed a detailed chemical characterization of particles as compared to electron microscopy. It was demonstrated that precipitates being present before the deformation stage can be distinguished from strain-induced precipitates, thus, preventing erroneous estimations of growth kinetics. In this context, current typical restrictions on the detectability and precise size estimation of precipitates will be addressed in future work through an extraction and re-encapsulation methodology.
The observed core-shell structures of TiN cubes with NbC caps were assumed to form after reheating by re-precipitation of niobium onto insoluble TiN particles. The fact that the caps did not form on all cube faces allowed to conclude that niobium is supplied by preferred diffusion paths such as a grain boundary or dislocation.
Precipitates that formed at lower austenite temperature or during transformation to ferrite had a chemical composition dominated by niobium and carbon. It was found that these particles scavenged the small quantity of titanium and nitrogen atoms that remained in solution. The titanium and nitrogen atoms are randomly incorporated within the NbC particle.
APT was able to show the formation of atom clusters in the nucleation stage of particles. During TMCP treatment applied in this study, only weak clustering of carbon could be detected, yet no significant clustering of niobium was seen. However, after isothermal holding in the ferrite phase, the formation of niobium-carbon clusters was evident.
With regard to strain-induced precipitation, all characterization methods used in this study confirmed that the degree of deformation is dominating over temperature with regard to precipitate nucleation during TMCP treatment, which is in agreement with established knowledge.

Author Contributions

Conceptualization, J.W., E.D. and H.M.; methodology and experimental validation, J.W., D.B. and A.H.; Formal analysis and data curation, J.W.; visualization, J.W. and H.M.; writing—original draft preparation, J.W. and H.M.; writing—review and editing, H.M., A.H., D.B., E.D., V.F. and F.M.; supervision, project administration, D.B., H.M., V.F., and F.M.; funding acquisition, D.B., J.W. and F.M. All authors have read and agreed to the published version of the manuscript.

Funding

The authors express their gratitude to CBMM for providing the financial funding of this work. Furthermore, J.W. wishes to acknowledge the EFRE funds (C/4-EFRE-13/2009/Br) of the European Commission. The Atom Probe was financed by the DFG and the Federal State Government of Saarland (INST 256/298-1 FUGG).

Acknowledgments

The authors also thank Comtes FHT for the fruitful discussions.

Conflicts of Interest

The authors declare no conflict of interest.

References

  1. Dutta, B.; Palmiere, E.J. Effect of prestrain and deformation temperature on the recrystallization behavior of steels microalloyed with niobium. Metall. Mater. Trans. A 2003, 34, 1237–1247. [Google Scholar] [CrossRef]
  2. Dutta, B.; Sellars, C.M. Effect of composition and process variables on Nb(C,N) precipitation in niobium microalloyed austenite. Mater. Sci. Technol. 1987, 3, 197–206. [Google Scholar] [CrossRef]
  3. Deardo, A.J. Niobium in modern steels. Int. Mater. Rev. 2003, 48, 371–402. [Google Scholar] [CrossRef]
  4. Morrison, W.B. Microalloy steels-the beginning. Mater. Sci. Technol. 2009, 25, 1066–1073. [Google Scholar] [CrossRef]
  5. Hong, S.G.; Kang, K.B.; Park, C.G. Strain-induced precipitation of NbC in Nb and Nb-Ti microalloyed HSLA steels. Scr. Mater. 2002, 46, 163–168. [Google Scholar] [CrossRef]
  6. Cuddy, L.J.; Raley, J.C. Austenite grain coarsening in microalloyed steels. Metall. Trans. A 1983, 14, 1989–1995. [Google Scholar] [CrossRef]
  7. Gong, P.; Palmiere, E.J.; Rainforth, W.M. Dissolution and precipitation behaviour in steels microalloyed with niobium during thermomechanical processing. Acta Mater. 2015, 97, 392–403. [Google Scholar] [CrossRef]
  8. Jia, T.; Militzer, M. The Effect of Solute Nb on the Austenite-to-Ferrite Transformation. Metall. Mater. Trans. A 2014, 46, 614–621. [Google Scholar] [CrossRef]
  9. Altuna, M.A.; Iza-Mendia, A.; Gutiérrez, I. Precipitation of Nb in ferrite after austenite conditioning. Part II: Strengthening contribution in high-strength low-alloy (HSLA) steels. Metall. Mater. Trans. A 2012, 43, 4571–4586. [Google Scholar] [CrossRef] [Green Version]
  10. Kunze, J.; Mickel, C.; Backmann, G.; Beyer, B.; Reibold, M.; Klinkenberg, C. Precipitation of titanium nitride in low-alloyed steel during cooling and deformation. Steel Res. 1997, 68, 441–449. [Google Scholar] [CrossRef]
  11. Klinkenberg, C.; Hulka, K.; Bleck, W. Niobium Carbide Precipitation in Microalloyed Steel. Steel Res. Int. 2004, 75, 744–752. [Google Scholar] [CrossRef]
  12. Zhou, C.; Priestner, R. The evolution of precipitates in Nb-Ti microalloyed steels during solidification and post-solidification cooling. ISIJ Int. 1996, 36, 1397–1405. [Google Scholar] [CrossRef]
  13. Craven, A.J.; He, K.; Garvie, L.A.J.; Baker, T.N. Complex heterogeneous precipitation in titanium–niobium microalloyed Al-killed HSLA steels—I.(Ti,Nb)(C,N) particles. Acta Mater. 2000, 48, 3857–3868. [Google Scholar] [CrossRef]
  14. Hegetschweiler, A.; Borovinskaya, O.; Staudt, T.; Kraus, T. Single-particle mass spectrometry of titanium and niobium carbonitride precipitates in steels. Anal. Chem. 2019, 91, 943–950. [Google Scholar] [CrossRef]
  15. Miao, C.L.; Shang, C.J.; Zhang, G.D.; Subramanian, S.V. Recrystallization and strain accumulation behaviors of high Nb-bearing line pipe steel in plate and strip rolling. Mater. Sci. Eng. A 2010, 527, 4985–4992. [Google Scholar] [CrossRef]
  16. Cao, Y.; Xiao, F.; Qiao, G.; Huang, C.; Zhang, X.; Wu, Z.; Liao, B. Strain-induced precipitation and softening behaviors of high Nb microalloyed steels. Mater. Sci. Eng. A 2012, 552, 502–513. [Google Scholar] [CrossRef]
  17. Akben, M.G.; Bacroix, B.; Jonas, J.J. Effect of vanadium and molybdenum addition on high temperature recovery, recrystallization and precipitation behavior of niobium-based microalloyed steels. Acta Metall. 1983, 31, 161–174. [Google Scholar] [CrossRef]
  18. Watanabe, H.; Smith, Y.E.; Pehlke, R.D. Precipitation kinetics of niobium carbonitride in austenite of high-strength low-alloy steels. In The Hot Deformation of Austenite; TMS-AIME: New York, NY, USA, 1977; pp. 140–168. [Google Scholar]
  19. Herman, J.C.; Donnay, B.; Leroy, V. Precipitation kinetics of microalloying additions during hot-rolling of HSLA steels. ISIJ Int. 1992, 32, 779–785. [Google Scholar] [CrossRef] [Green Version]
  20. Okamoto, R.; Borgenstam, A.; Ågren, J. Interphase precipitation in niobium-microalloyed steels. Acta Mater. 2010, 58, 4783–4790. [Google Scholar] [CrossRef]
  21. Hin, C.; Bréchet, Y.; Maugis, P.; Soisson, F. Kinetics of heterogeneous dislocation precipitation of NbC in alpha-iron. Acta Mater. 2008, 56, 5535–5543. [Google Scholar] [CrossRef]
  22. Perrard, F.; Deschamps, A.; Bley, F.; Donnadieu, P.; Maugis, P. A small-angle neutron scattering study of fine-scale NbC precipitation kinetics in the α-Fe–Nb–C system. J. Appl. Crystallogr. 2006, 39, 473–482. [Google Scholar] [CrossRef] [Green Version]
  23. Huang, B.M.; Yang, J.R.; Yen, H.W.; Hsu, C.H.; Huang, C.Y.; Mohrbacher, H. Secondary hardened bainite. Mater. Sci. Technol. 2014, 30, 1014–1023. [Google Scholar] [CrossRef]
  24. Costa e Silva, A. Challenges and opportunities in thermodynamic and kinetic modeling microalloyed HSLA steels using computational thermodynamics. Calphad Comput. Coupling Phase Diagrams Thermochem. 2020, 68, 101720. [Google Scholar] [CrossRef]
  25. LeBon, A.; Rofes-Vernis, J.; Rossard, C. Recristallisation et précipitation provoquées par la déformation à chaud: Cas d’un acier de construction sondable au niobium. Mem. Soc. Rev. Met. 1973, 70, 577–588. [Google Scholar]
  26. Simoneau, R.; Bégin, G.; Marquis, A.H. Progress of NbCN precipitation in HSLA steels as determined by electrical resistivity measurements. Met. Sci. 1978, 12, 381–386. [Google Scholar] [CrossRef]
  27. Park, J.S.; Lee, Y.K. Determination of Nb(C,N) dissolution temperature by electrical resistivity measurement in a low-carbon microalloyed steel. Scr. Mater. 2007, 56, 225–228. [Google Scholar] [CrossRef]
  28. Jung, J.-G.; Bae, J.-H.; Lee, Y.-K. Quantitative evaluation of dynamic precipitation kinetics in a complex Nb-Ti-V microalloyed steel using electrical resistivity measurements. Met. Mater. Int. 2013, 19, 1159–1162. [Google Scholar] [CrossRef]
  29. Jung, J.-G.; Park, J.-S.; Kim, J.; Lee, Y.-K. Carbide precipitation kinetics in austenite of a Nb–Ti–V microalloyed steel. Mater. Sci. Eng. A 2011, 528, 5529–5535. [Google Scholar] [CrossRef]
  30. Rivas, A.L.; Matlock, D.K.; Speer, J.G. Quantitative analysis of Nb in solution in a microalloyed carburizing steel by electrochemical etching. Mater. Charact. 2008, 59, 571–577. [Google Scholar] [CrossRef]
  31. Gault, B.; Moody, M.P.; Cairney, J.M.; Ringer, S.P. Atom Probe Microscopy; Springer Series in Materials Science; Springer: New York, NY, USA, 2012; Volume 160, ISBN 978-1-4614-3435-1. [Google Scholar]
  32. Palmiere, E.J.; Garcia, C.I.; De Ardo, A.J. Compositional and microstructural changes which attend reheating and grain coarsening in steels containing niobium. Metall. Mater. Trans. A 1994, 25, 277–286. [Google Scholar] [CrossRef]
  33. Nöhrer, M.; Mayer, W.; Primig, S.; Zamberger, S.; Kozeschnik, E.; Leitner, H. Influence of Deformation on the Precipitation Behavior of Nb(CN) in Austenite and Ferrite. Metall. Mater. Trans. A 2014, 45, 4210–4219. [Google Scholar] [CrossRef]
  34. Pereloma, E.V.; Kostryzhev, A.G.; AlShahrani, A.; Zhu, C.; Cairney, J.M.; Killmore, C.R.; Ringer, S.P. Effect of austenite deformation temperature on Nb clustering and precipitation in microalloyed steel. Scr. Mater. 2014, 75, 74–77. [Google Scholar] [CrossRef] [Green Version]
  35. Kostryzhev, A.G.; Al Shahrani, A.; Zhu, C.; Ringer, S.P.; Pereloma, E.V. Effect of deformation temperature on niobium clustering, precipitation and austenite recrystallisation in a Nb-Ti microalloyed steel. Mater. Sci. Eng. A 2013, 581, 16–25. [Google Scholar] [CrossRef] [Green Version]
  36. Kapoor, M.; O’Malley, R.; Thompson, G.B. Atom probe tomography study of multi-microalloyed carbide and carbo-nitride precipitates and the precipitation sequence in Nb-Ti HSLA steels. Metall. Mater. Trans. A 2016, 47, 1984–1995. [Google Scholar] [CrossRef]
  37. Maruyama, N.; Uemori, R.; Sugiyama, M. The role of niobium in the retardation of the early stage of austenite recovery in hot-deformed steels. Mater. Sci. Eng. A 1998, 250, 2–7. [Google Scholar] [CrossRef]
  38. Thompson, K.; Lawrence, D.; Larson, D.J.; Olson, J.D.; Kelly, T.F.; Gorman, B. In situ site-specific specimen preparation for atom probe tomography. Ultramicroscopy 2007, 107, 131–139. [Google Scholar] [CrossRef]
  39. Vaumousse, D.; Cerezo, A.; Warren, P.J. A procedure for quantification of precipitate microstructures from three-dimensional atom probe data. Ultramicroscopy 2003, 95, 215–221. [Google Scholar] [CrossRef]
  40. Timokhina, I.B.; Hodgson, P.D.; Ringer, S.P.; Zheng, R.K.; Pereloma, E.V. Precipitate characterisation of an advanced high-strength low-alloy (HSLA) steel using atom probe tomography. Scr. Mater. 2007, 56, 601–604. [Google Scholar] [CrossRef]
  41. Breen, A.J.; Xie, K.Y.; Moody, M.P.; Gault, B.; Yen, H.-W.; Wong, C.C.; Cairney, J.M.; Ringer, S.P. Resolving the morphology of niobium carbonitride nano-precipitates in steel using atom probe tomography. Microsc. Microanal. 2014, 20, 1100–1110. [Google Scholar] [CrossRef]
  42. Scheil, E. Bemerkungen zur Schichtkristallbildung. Z. Met. 1942, 34, 70–72. [Google Scholar]
  43. Morita, Z.; Tanaka, T. Thermodynamics of solute distributions between solid and liquid phases in iron-base ternary alloys. Trans. Iron Steel Inst. Jpn. 1983, 23, 824–833. [Google Scholar] [CrossRef]
  44. Chen, Z.; Loretto, M.H.; Cochrane, R.C. Nature of large precipitates in titanium-containing HSLA steels. Mater. Sci. Technol. 1987, 3, 836–844. [Google Scholar] [CrossRef]
  45. Narita, K. Physical Chemistry of the groups IVa(Ti,Zr), Va(V,Nb,Ta) and the rare earth elements in steel. Trans. Iron Steel Inst. Jpn. 1975, 15, 145–152. [Google Scholar] [CrossRef]
  46. Vurpillot, F.; Bostel, A.; Blavette, D. Trajectory overlaps and local magnification in three-dimensional atom probe. Appl. Phys. Lett. 2000, 76, 3127–3129. [Google Scholar] [CrossRef]
  47. Thuvander, M.; Weidow, J.; Angseryd, J.; Falk, L.K.L.; Liu, F.; Sonestedt, M.; Stiller, K.; Andrén, H.-O. Quantitative atom probe analysis of carbides. Ultramicroscopy 2011, 111, 604–608. [Google Scholar] [CrossRef] [Green Version]
  48. Danoix, F.; Bémont, E.; Maugis, P.; Blavette, D. Atom probe tomography i. early stages of precipitation of nbc and nbn in ferritic steels. Adv. Eng. Mater. 2006, 8, 1202–1205. [Google Scholar] [CrossRef]
  49. Li, Y.J.; Ponge, D.; Choi, P.; Raabe, D. Segregation of boron at prior austenite grain boundaries in a quenched martensitic steel studied by atom probe tomography. Scr. Mater. 2015, 96, 13–16. [Google Scholar] [CrossRef]
  50. Li, Y.J.; Ponge, D.; Choi, P.; Raabe, D. Atomic scale investigation of non-equilibrium segregation of boron in a quenched Mo-free martensitic steel. Ultramicroscopy 2015, 159, 240–247. [Google Scholar] [CrossRef]
  51. Porter, D.A.; Easterling, K.E. Phase Transformations in Metals and Alloys, 2nd ed.; CRC Press: Boca Raton, FL, USA, 1992; ISBN 0748757414. [Google Scholar]
Figure 1. Schematic of rolling pass schedules in the thermo-mechanical controlled processing (TMCP) regime for strip and plate mills with respect to TNR (dashed line) and precipitation (PPT) kinetics.
Metals 10 00243 g001
Figure 2. Kinetics of spontaneous NbC precipitation in ferrite in an experimental high-Nb steel after solution annealing and quenching [22]; typical cooling curves and tempering conditions are indicated.
Metals 10 00243 g002
Figure 3. Schematic of the simulated heat treatments. Samples were characterized as-quenched (Q) from austenitization temperature or cooled down to deformation temperature TDef = 950, 900, and 850 °C with varying strain ε, holding times t, and quenching/second compression to measure the softening, and air cooling (AC). In addition, one sample was cooled down from austenitization temperature, aged at 670 °C for 1 h, and quenched afterwards.
Metals 10 00243 g003
Figure 4. (a) Softening behavior of austenite after Gleeble double-hit deformation recorded for different deformation temperatures, (b) austenite grain size distribution as a function of the inter-pass time between two deformation hits derived from (c) light-optical metallography of the respective prior austenite microstructures after etching.
Metals 10 00243 g004
Figure 5. Evolution of electrical resistivity with the time after deformation for samples quenched from deformation at 850 °C, 900 °C, and 950 °C with ε = 0.3 and ε = 0.6 and after quenching from isothermal holding at 670 °C for 1 h.
Metals 10 00243 g005
Figure 6. High Angular Diffraction Dark Field (HADDF)-STEM images of carbon replica films comprising precipitates present after quenching from 1200 °C and 950 °C. (a) Grain boundaries decorated by line-like precipitation of (b) large (approx. 80 nm), cube-shaped precipitates which EDS identified as Nb-rich TiN. (c) Homogeneously distributed in the grain interior were TiN of smaller size (<15 nm) as well as (d) TiN with heterogeneously nucleated Nb-rich caps, which (e) also could be larger. (f) Nb- or Ti-rich Nb (or Ti)(C,N) were found with a homogeneous atom distribution.
Metals 10 00243 g006
Figure 7. Dark Field (DF)-STEM image and EDS spectra depict precipitates that had formed after hot deformation at 950 °C, ε = 0.3, and holding for (a) 200 or (b) 1200 s.
Metals 10 00243 g007
Figure 8. Atom probe tomography (APT) evaluation of solute Nb in the steel matrix and correlation with electrical resistivity measurements for samples deformed at 950 °C, ε = 0.3, and isothermally held at 670 °C for 1 h.
Metals 10 00243 g008
Figure 9. APT analysis of a bean-shaped particle similar to those in Figure 6f, but measured in the sample deformed at a lower austenite temperature and higher strain (850 °C, ε = 0.6), and quenched after holding for 200 s. Niobium, carbon, titanium, and nitrogen atoms are displayed.
Metals 10 00243 g009
Figure 10. APT analysis of precipitates formed after deformation at a lower austenite temperature and higher strain (850 °C, ε = 0.6) and holding for 200 s. (a) Atom distribution map with niobium, carbon and nitrogen depicted; (b) mass-to-charge state ratio and the detected elemental peaks.
Metals 10 00243 g010
Figure 11. (a,b,e) APT analysis of a sample deformed at 950 °C and quenched after a short holding time of 2 s. (a) Niobium atom map, (b) carbon atom map, and (e) nearest-neighbor distribution of niobium and carbon observed in atom reconstruction (solid lines) vs. random distribution (dashed lines). (c,d,f) Quenching after isothermal holding at 670 °C for 1 h on samples soaked at 1200 °C led to (c) pronounced clustering or (d) interphase precipitation. (f) Nearest-neighbor distribution analysis of the dataset reconstructed in (c) shows strong deviation of the observed niobium and carbon distribution (solid lines) from a random distribution (dashed lines).
Metals 10 00243 g011
Figure 12. (a) Solidification scenario in the delta-ferrite range of the binary Fe-C diagram (equilibrium transformation temperatures for carbon content of 0.04 wt. %); (b) calculated segregation ratios as function of the residual liquid share; (c) homogenization of unequal niobium distribution after solidification by fast diffusion in delta-ferrite as a function of the secondary dendrite arm spacing.
Metals 10 00243 g012
Figure 13. MatCalc simulation of the precipitate number density evolution over time for varying compression with a total deformation of ε = 0.3 at 950 °C and ε = 0.6 at 850 °C.
Metals 10 00243 g013
Table 1. Steel composition.
ElementCSiMnPCrMoNiCuAlNNbTi
wt. %0.0420.321.690.0120.0360.0210.1950.2150.0330.0050.0850.017
Table 2. Mean prior austenite grain (PAG) equivalent diameter and grain count in a 500 × 500 µm2 area.
Inter-Pass TimeMean PAG Equivalent Grain Diameter (µm)Number of Grains
2 s27.354144
15 s24.335121
100 s22.595634
Table 3. Elemental composition of APT-measured, bean-shaped particle displayed in Figure 9.
ElementNbCTiN
Atom count45824400480177
at. %47.545.65.01.7
Table 4. Elemental composition of precipitates measured by APT in Figure 10.
ElementNbCTiN
Atom count410688-74
at. %35.058.7-6.3
Table 5. Elemental composition of interphase precipitates (IP) and clusters of samples which went through the austenite-to-ferrite transformation at 670 °C for 1 h (Figure 11c,d).
ElementNbCTiN
IP (Figure 11d)----
Atom count752846547
at. %45.351.03.30.4
Clusters (Figure 11c)----
Atom count77088566405190
at. %45.750.82.41.1