Oxidation and Corrosion Behavior of New Low-Cost Ti-7Fe-3Al and Ti-7Fe-5Cr Alloys from Titanium Hydride Powders


Department of Materials Science and Engineering, IAAB, Universidad Carlos III de Madrid, Avda. Universidad 30, 28911 Leganés, Spain
*
Author to whom correspondence should be addressed.
Metals 2020, 10(2), 254; https://doi.org/10.3390/met10020254
Submission received: 27 January 2020
/
Revised: 10 February 2020
/
Accepted: 12 February 2020
/
Published: 14 February 2020
(This article belongs to the Special Issue Powder Metallurgy of Titanium Alloys)
Abstract
:High production costs of Ti alloys usually hinders their use in industry sectors like the automotive and hence, low-cost titanium alloys could broaden titanium alloy usage. This work presents the study of three alloys— Ti-Fe, Ti-Fe-Al, and Ti-Fe-Cr—produced by powder metallurgy methods. The design of the compositions was aimed at reducing cost and enhance the oxidation and corrosion resistance while not decreasing the mechanical performance. The use of titanium hydride as raw material instead of Ti powder is highlighted as a key feature in the design and manufacturing procedure of the alloys. Introducing a dehydrogenation process during sintering favors the densification process while reducing the oxygen contamination and the production cost. There is a lack of studies focused on the implementation of affordable PM Ti alloys in high demanding environments. Therefore, a study of high temperature oxidation resistance and electrochemical behavior was performed.
1. Introduction
Titanium and its alloys are widely used in aeronautical, military, and biomedical sectors for their combination of corrosion resistance in aggressive environments, high specific strength, and biocompatibility. The main handicap that holds back steel and aluminum replacement by titanium alloys in most large-scale applications is the high production cost and metalworking of the final product [1]. In the context of low-cost Ti alloys, powder metallurgy (PM) techniques offers an alternative method for reducing manufacturing cost of Ti alloys [2] with features such as being a near-net-shape method [3,4] which drastically reduces machining costs and increases material yield and allowing new alloys design, as it prevents the segregation of alloy elements that can occur during ingot metallurgy solidification [5].
Considering that Fe is one of the most effective β-phase stabilizer while still being a low-cost alloying element [5,6], it stands out as potential replacement for high cost vanadium that could deliver the high demanding properties that aeronautical, biomedical, and transport applications [5,6,7] require from commercial Ti alloys. In order to preserve the performance of commercial alloys while reducing the production cost, it has been reported that Al and Cr may produce an enhancement in corrosion and oxidation resistance [8,9,10,11,12]. However, oxidation and corrosion behavior studies of PM Ti alloys are uncommon and the introduction of sintering enhancement elements like iron has been focused on mechanical properties [6,13], with a lack of appropriate studies to evaluate the corrosion and oxidation resistance of Ti-Fe alloys [14,15].
TiH2 powders are widely known for general production of raw titanium by hydride–dehydride (HDH) process. However, sintering of final parts directly from titanium hydride powder is a new approach deviating from traditional PM methods to overcome the high cost of Ti alloys that it was first reported by Ivasishin [16]. This approach brings new features to PM alloys such as better oxygen control and densification during sintering while reducing production costs.
Considering this, the aim of this work seeks to report the oxidation and corrosion resistance of the new Ti-7Fe-3Al and Ti-7Fe-5Cr alloys, that have been designed to include potential alloying elements for high temperature applications and the optimization and enhancement of the sintering process using TiH2 powders. The Ti-7Fe alloy was chosen as an initial composition to be modified, since this is a well-established alloy from previous authors [5,13,17].
High temperature oxidation tests of these alloys were carried out and the oxidation kinetics of the α and β phases was studied, establishing the suitability of affordable elements on Ti alloys such as iron, aluminum, and chromium. These compositions were compared to commercial α + β alloy Ti-6Al-4V and pure α-Ti which usually has the best oxidation properties but lacks the mechanical characteristics at medium and low temperatures that α + β alloy, like Ti-Fe compositions, has.
In addition, corrosion studies with Harrison dissolution were performed as a simulation of aeronautical environment in order to understand the suitability of the new alloys in very demanding applications.
2. Materials and Methods
2.1. Starting Materials and Powder Processing
The development of low-cost Ti alloys requires a good mechanical performance combined with an excellent oxidation and corrosion resistance in high demanding environments. However, the enhancement of properties should not imply an increase in manufacturing cost. Iron is stated as one of the most suitable for this purpose due to the strong β stabilizing effects, the other two elements proposed for study are Cr and Al.
ThermoCalc 2017a [18] software with SOL5 database was used to obtain the phase equilibrium diagrams for Ti-7Fe-xAl and Ti-7Fe-yCr alloys, setting Ti-7Fe composition as starting point for the 2-dimensional phase equilibrium diagram, based on previous related works [5,6,14]. Therefore, two compositions were selected, Ti-7Fe-3Al and Ti-7Fe-5Cr.
The starting powders used to produce the alloys were titanium hydride powder (TiH2) supplied by GfE (Nürnberg, Germany), elemental Fe powders from Pometon (Maerne, Italy), Chromium powder from Alfa Aesar (Kandel, Germany, 99.2% high purity) and elemental aluminum powders from Alfa Aesar (Kandel, Germany, 99.8% high purity). Particle size distribution of the powders was measured on a Mastersizer 2000 analyzer from Malvern Instrument (Malvern, UK).
Blends were prepared and mixed from the elemental powders in a Turbula mixer for 2 h to guarantee powder homogeneity. In addition, thermal behavior for each composition was studied by performing DTA-TG analysis of each blended powders on a Setaram Setsys Evolution equipment to evaluate the phase transitions, dehydrogenation process of powders, melting points of the compositions and the effect of alloy elements on sintering. The DTA-TG analysis was carried out under Argon atmosphere, with a heating and cooling rate of 10 °C/min up to 1000 °C in alumina crucibles.
Ti-7Fe, Ti-7Fe-3Al, and Ti-7Fe-5Cr samples were compacted at 700 MPa in a uniaxial press using zinc stearate as wall-die lubricant. Sintering was carried out in a high vacuum furnace (10−5 mbar), at 1300 °C for 1 h resulting in cylindrical disk around 15 mm diameter and 4 mm thick. Moreover, density and porosity measurements were conducted by He pycnometer. Oxygen and nitrogen content analysis were performed on a calibrated LECO TC 500 equipment (LECO, St Joseph, MI, USA).
XRD analyses were performed on Siemens D5000 diffractometer (Siemens, München, Germany) with monochromatic Co Kα radiation, covering 2θ angles from 25° to 80° to analyze the crystal structures. The hardness measurements were performed on a Wilson Wolpert 930N (Wilson Wolpert, Fort Worth, TX, USA).
All samples were prepared following a standard metallographic preparation which included grinding with SiC abrasives papers up to 1000 grit and polishing with 1 µm and 0.3 µm Al2O3 particles. The microstructural observations were made on the cross-section samples by scanning electron microscopy (SEM) on a Philips XL 30 equipped (Philips, Amsterdam, The Nederland) with energy dispersive X-ray spectroscopy (EDX).
2.2. High Temperature Oxidation Behavior
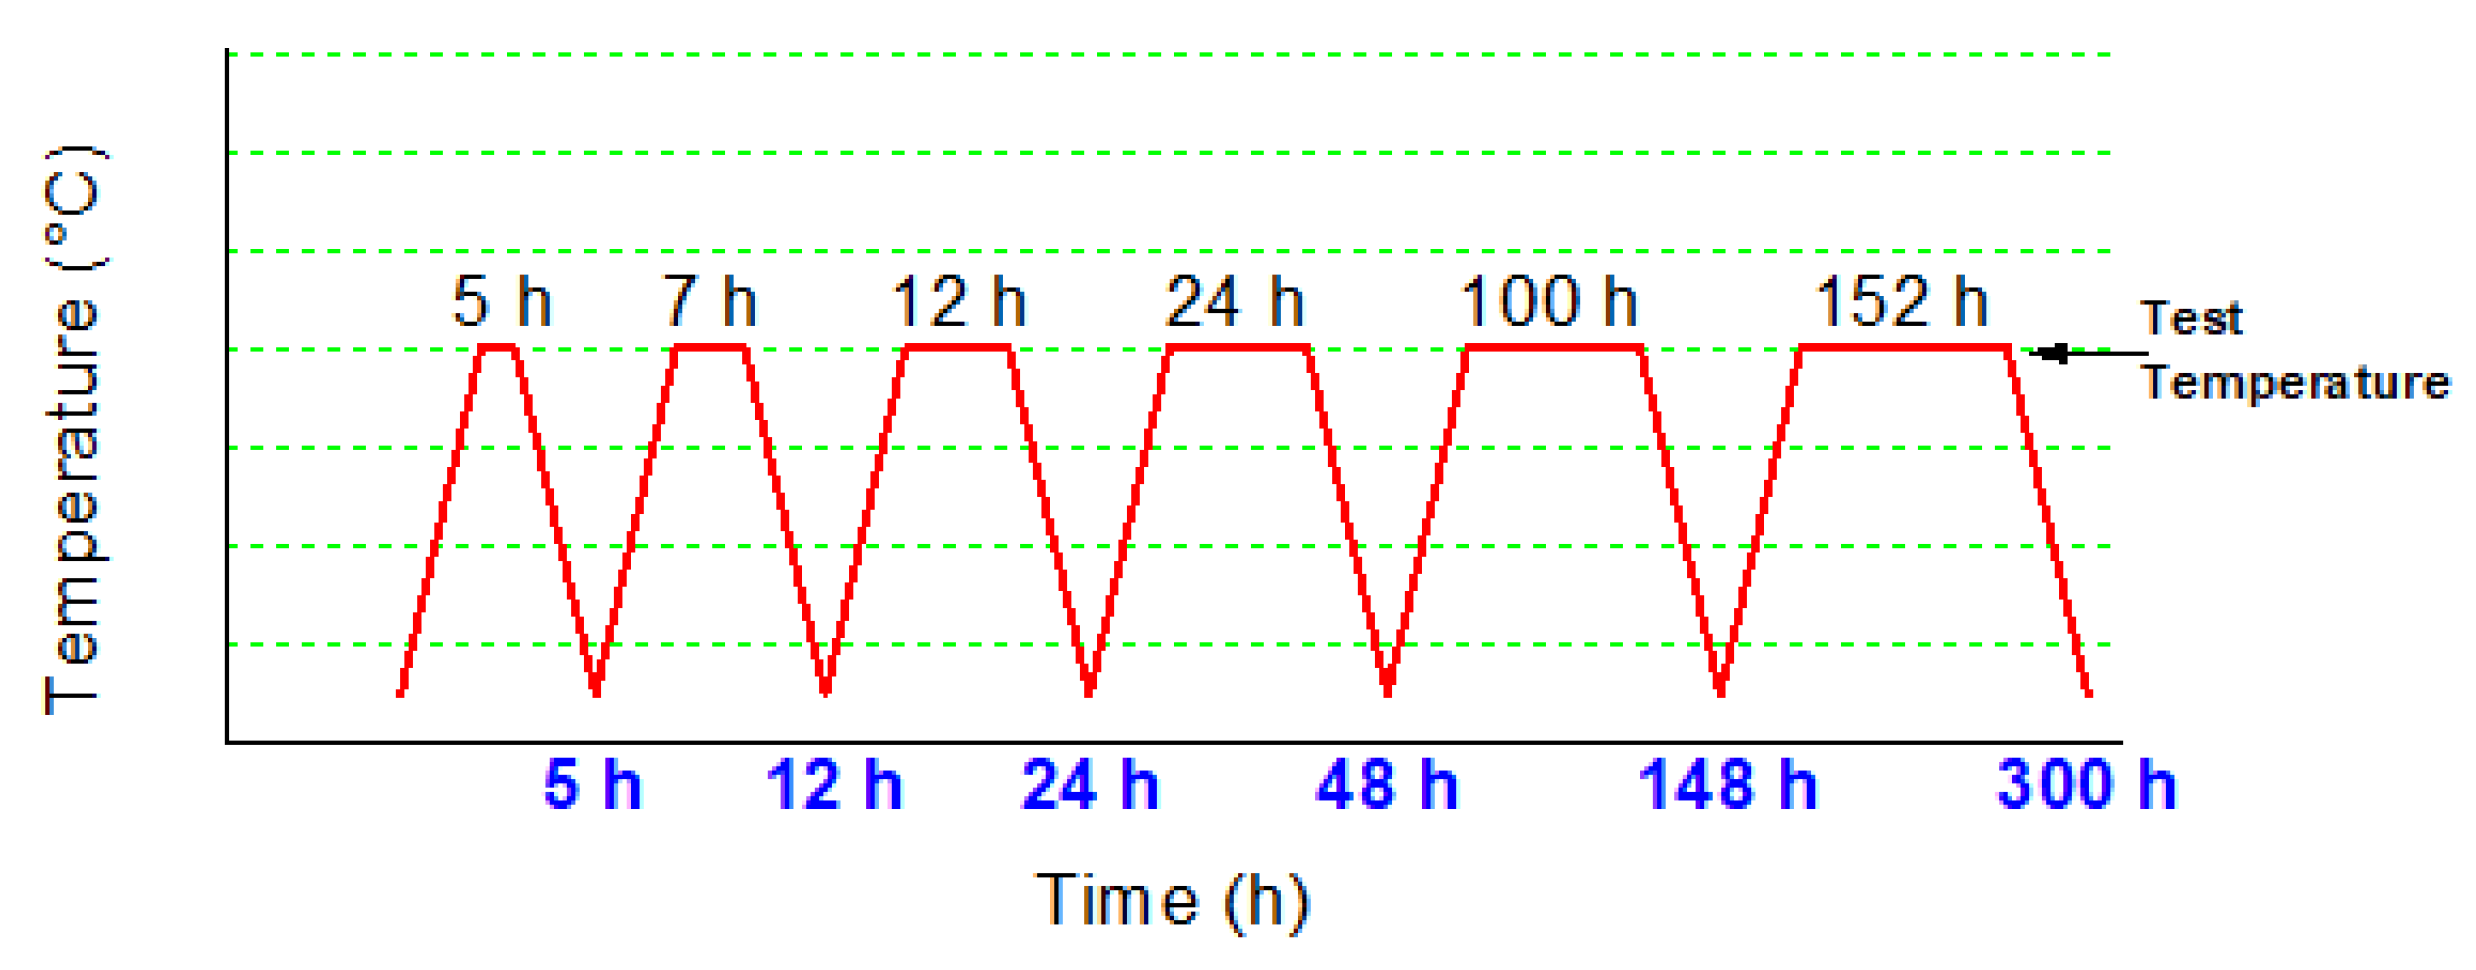
Ti-7Fe, Ti-7Fe-3Al, and Ti-7Fe-5Cr sintered samples were tested in order to determine the effect produced by the alloying elements on the oxidation behavior. For comparison purposes, unalloyed Ti samples produced by powder metallurgy were also measured. Isothermal high temperature oxidation tests were performed under static air in a muffle furnace, at two temperatures: 600 °C and 500 °C, for up to 300 h. During the tests five interruptions were done after 5, 12, 24, 48, and 148 h followed by furnace cooling, using the cycle illustrated in Figure 1. Samples were weighted at room temperature on a balance with an accuracy of ±0.00001 g. To ensure that all surfaces were always in contact with air, four samples of each composition were held and suspended with Inconel wires inside the furnace. During samples manipulation, particular care was taken due to possible spallation effect. Heating/cooling rate was kept low to prevent the implications of a high mismatch in the coefficient of thermal expansion between oxides and substrate that could result in oxide breakdown.
According to a previous study, spallation in titanium alloys usually only occurs on oxide layers formed at high temperatures (>800 °C) and prolonged time duration could result in failure and separation of layers [19]. The testing temperature of this work does not reach such high temperatures and hence no spallation effect is expected.
To prevent oxide layer degradation during metallographic preparation of the samples tested, all treated samples were protected by a Cu layer deposited by electrodeposition. Then, the samples were cut, and the cross-section was analyzed by scanning electron microscopy. The oxides from the outer layers were analyzed by XRD.
2.3. Electrochemical Measurements
For electrochemical measurements, the samples from the three alloys were connected to a copper wire and immersed in Harrison dissolution as a simulation of aeronautical environment with a surface of 0.63 cm2 in permanent contact with the electrolyte. The surface of the alloy prior to immersion was grinded with SiC paper (180–1000 grade). The three-electrode electrochemical setup is constituted of a platinum wire as a counter electrode, a saturated KCl electrode as a reference electrode and the Ti sample as a working electrode. The open circuit potential (OCP) and the potentiodynamic polarization curves were measured on a potentiostat/galvanostat PGSTAT302N (Metrohm-Autolab, Utrecht, The Netherlands).
The OCP measurements were performed under 24 h of immersion in Harrison solution and obtaining as a result polarization curves in the range from VOCP-0.1V to VOCP+1V using a scan rate of 0.6 mV/s. The corrosion potential and corrosion current density was determined by Tafel extrapolation of the cathodic and anodic branches.
3. Results
3.1. Thermodynamic Calculations
Thermodynamic equilibrium calculations using ThermoCalc software were performed in order to determine the optimum aluminum and chromium content. The selection of the compositions aims to produce a microstructure without intermetallic compounds and an enhancement of the oxidation resistance at high temperature. Previous authors have already considered the implications of different alloying elements and they are also considered for the selection of the compositions [7,8,20,21].
Figure 2 shows the quasi binary equilibrium phase diagrams for Ti-7Fe-xAl (a) and Ti-7Fe-yCr (b) alloys respectively, setting a fixed amount of 7% of Fe in both cases. The Ti-7Fe-xAl equilibrium phase diagram shows two intermetallic phases that are thermodynamically stable in different ranges of aluminum content: between 0 and 5% of aluminum content we find TiFe phase and above 5% Al, Ti3Al appears. For this reason, an amount of 3% below the 5% of Al content was chosen for the alloy composition as it will not cause unfavorable growth of Ti3Al intermetallic phase [22]. Concerning TiFe phase, it has been established in previous studies that TiFe phase needs long periods of cooling time to fully develop after sintering [5], and hence it is unlikely to form. PM techniques allow the development of new compositions that cannot be obtained by traditional metallurgy, due to the segregation of elements that can occur during the melting process and its consequent contamination. In comparison, the diffusion of the elements in PM methods take place in a solid-state, never reaching the melting point of the elements and, therefore, avoiding this concern.
Regarding Ti-7Fe-yCr equilibrium phase diagram, the TiCr2 phase appears to always be thermodynamically stable as Cr content increases, but from similarities in Ti-Fe-Cr with TiFe structures [7], the intermetallic TiCr2 phase is not expected to form. The amount of 5% chromium content was chosen for the alloy composition because it was successfully introduced in previous studies with an increase in properties like strength, ductility, and tendency of the Ti alloy to passivate [8,20], therefore, it is also expected to enhance Ti-Fe-Cr mechanical and high temperature oxidation properties.
3.2. Optimization of Dehydrogenation Process
Table 1 shows the particle size distribution of the powders used. TiH2 and Cr powders have D50 of 24 µm and 7 µm, respectively. Fe powders has D50 of 34 µm and the Al powders has D50 of 130 µm, being the biggest particle size of all powders added to produce the Ti alloys.
The advantages of the introduction of titanium hydride powder as starting powders are lower cost, higher compressibility, and better oxygen control [23,24]. However, the dehydrogenation process may be affected by factors like the atmosphere employed during heating, presence of impurities or the formation of intermetallics. Therefore, the dehydrogenation behavior must be studied in detail in order to control the final microstructure and properties.
Figure 3 shows the curves of a DTA and TG analysis performed in order to understand the changes expected during the dehydrogenation process and sintering of the samples. The onset, peak, and offset temperatures of the peaks for all compositions are listed in Table 2. DTA peaks combined with the weight loss show a three-step hydrogen decomposition for all compositions, in agreement with previous studies by Bhosle et al. [25] that argue that decomposition occurs following Equation (1).
TiH2 → TiHx → α-Ti, where 0.7 < x > 1.1
However, Liu et al. [26] also proposed another reaction model for dehydrogenation TiH2 powders where reaction occurs as Equation (2).
δ → δ + βH → βH → βH + αH + α, where δ is TiH2 phase
Ivasishin et al. [23] also described how single-phase TiH2 (δ) exists up to 450 °C where it begins to decompose and (TiH2 (δ) → β) phase transformation occurs. Then, (β → α) transformation takes place where, at approximately 650 °C, and only single α phase is left; eventually at higher temperatures α phase transforms into the β cubic phase.
For Ti-7Fe-5Cr composition, the first peak appears at approximately 507 °C and a second one at 603 °C. From the comparison between alloys and unalloyed compositions, α stabilizer elements influence the reactions temperatures by slightly dropping the onset temperatures of the two reactions. Therefore, Ti-7Fe-3Al composition has the lowest onset temperature by approximately 5% in comparison from TiH2 powder. Finally, all alloys show a decomposition shoulder approximately at 640 °C where residual hydrogen from previous reaction is released.
Robertson et al. [27] also describes how mass loss due to release of hydrogen was effectively completed at 700 °C. Ivasishin et al. [23] also found how hydrogen desorption ends at around 700 °C. For this reason, before reaching the sintering temperature of 1300 °C, a dwell of 1 hour at 700 °C was performed in the sintering cycle to ensure a complete dehydrogenation.
Table 3 shows the hydrogen relative mass loss and volume shrinkage observed for all compositions after sintering. Hydrogen relative mass loss was calculated from the weight lost after sintering with respect to the stoichiometric content expected to be lost considering the amount of initial TiH2 hydride powder, and assuming complete atomic decomposition, following Equation (1), for the wt % of the TiH2 powder added on each composition. It can be observed that Ti-7Fe-3Al and Ti-7Fe-5Cr show complete dehydrogenation, whereas Ti-7Fe reached approximately 96% of hydrogen elimination. Ti-7Fe-5Cr alloy shows a relative mass loss above 100% presumably due to non-related hydrogen mass loses like chromium sublimation on high vacuum atmosphere as a result of the very low vapor pressure point of the chromium [28]. In terms of volume shrinkage, this does not involve only hydrogen decomposition, but also porosity. All three alloys show about 21–25% of volume reduction.
Therefore, it can be concluded that the dehydrogenation process was accomplished successfully with the sintering conditions proposed.
3.3. Effect of Composition on Microstructure and Properties
Results concerning relative density, porosity and Vickers hardness for the sintered samples are shown at Table 4. For comparison purposes, results from as cast Ti-6Al-4V [29], Cp Ti [29], and Ti-7Fe alloys from previous works with HDH powders and extrusion processing route are also included [17]. The reason for the absence of porosity in Ti-7Fe (Extruded) is due to the deformation step after sintering [17]. The relative density of Ti-7Fe (PM) in this work increases approximately 2% compared to the relative density of Ti-7Fe from elemental HDH powders used in [17]. These results are in accordance with previous studies where it is shown that usage of TiH2 as starting powder leads to very high sintered density [30,31]. Other relevant feature is that the relative density of the sintered compact with aluminum is the lowest. This behavior could be related to the higher oxygen content and high size of aluminum powders that hinders the densification process; moreover, the DTA curve for this composition in Figure 3 shows a tiny exothermic peak at 661 °C that could correspond to the reaction between Ti and Al leading to remaining porosity. In contrast, fine chromium powder enhances the final sintered density. The lowest Vickers hardness corresponds to Ti-7Fe-3Al due to the higher porosity, followed by Ti-7Fe and Ti-7Fe-5Cr compositions as they have higher oxygen content. All three alloys present about 10–15% reduction of hardness compared to commercially as-cast Ti-6Al-4V, presumably related to dislocation and microstructure refinement on cooling during casting.
Results of the microstructural analysis performed in scanning electron microscope are shown in Figure 4, whereas the XRD spectra of the samples are stated in Figure 5. All sintered microstructures show a combination of α+β phases. Ti-7Fe and Ti-7Fe-3Al microstructures consist of a matrix of β grains (bright contrast) with α lamellas (dark contrast) inside and on the grain boundaries. However, Ti-7Fe-5Cr alloy is mainly β phase with fine needle-like α phase. It is important to point out that this predominantly β phase, is achieved with only 12% of alloying elements when commercial β-Ti alloys, usually have a high amount of β stabilizing elements, around approximately of 30% [32]. The fine needle-like α phase and the change in morphology is attributed to higher β stabilizer content and the different and slower growth process of the α phase during the sintering cooling step.
The EDS measurements from Figure 4d confirm the distribution of α-stabilizing alloying elements on the darker phase (Al-rich phase) and β-stabilizing elements on the brighter phase (Fe-Cr-rich phase). Iron and chromium are mainly detected on the cubic phase of the microstructure and they tend to concentrate on this phase because of the higher solubility. In contrast, aluminum tends to settle on α phase because of the α stabilizer effect of the element.
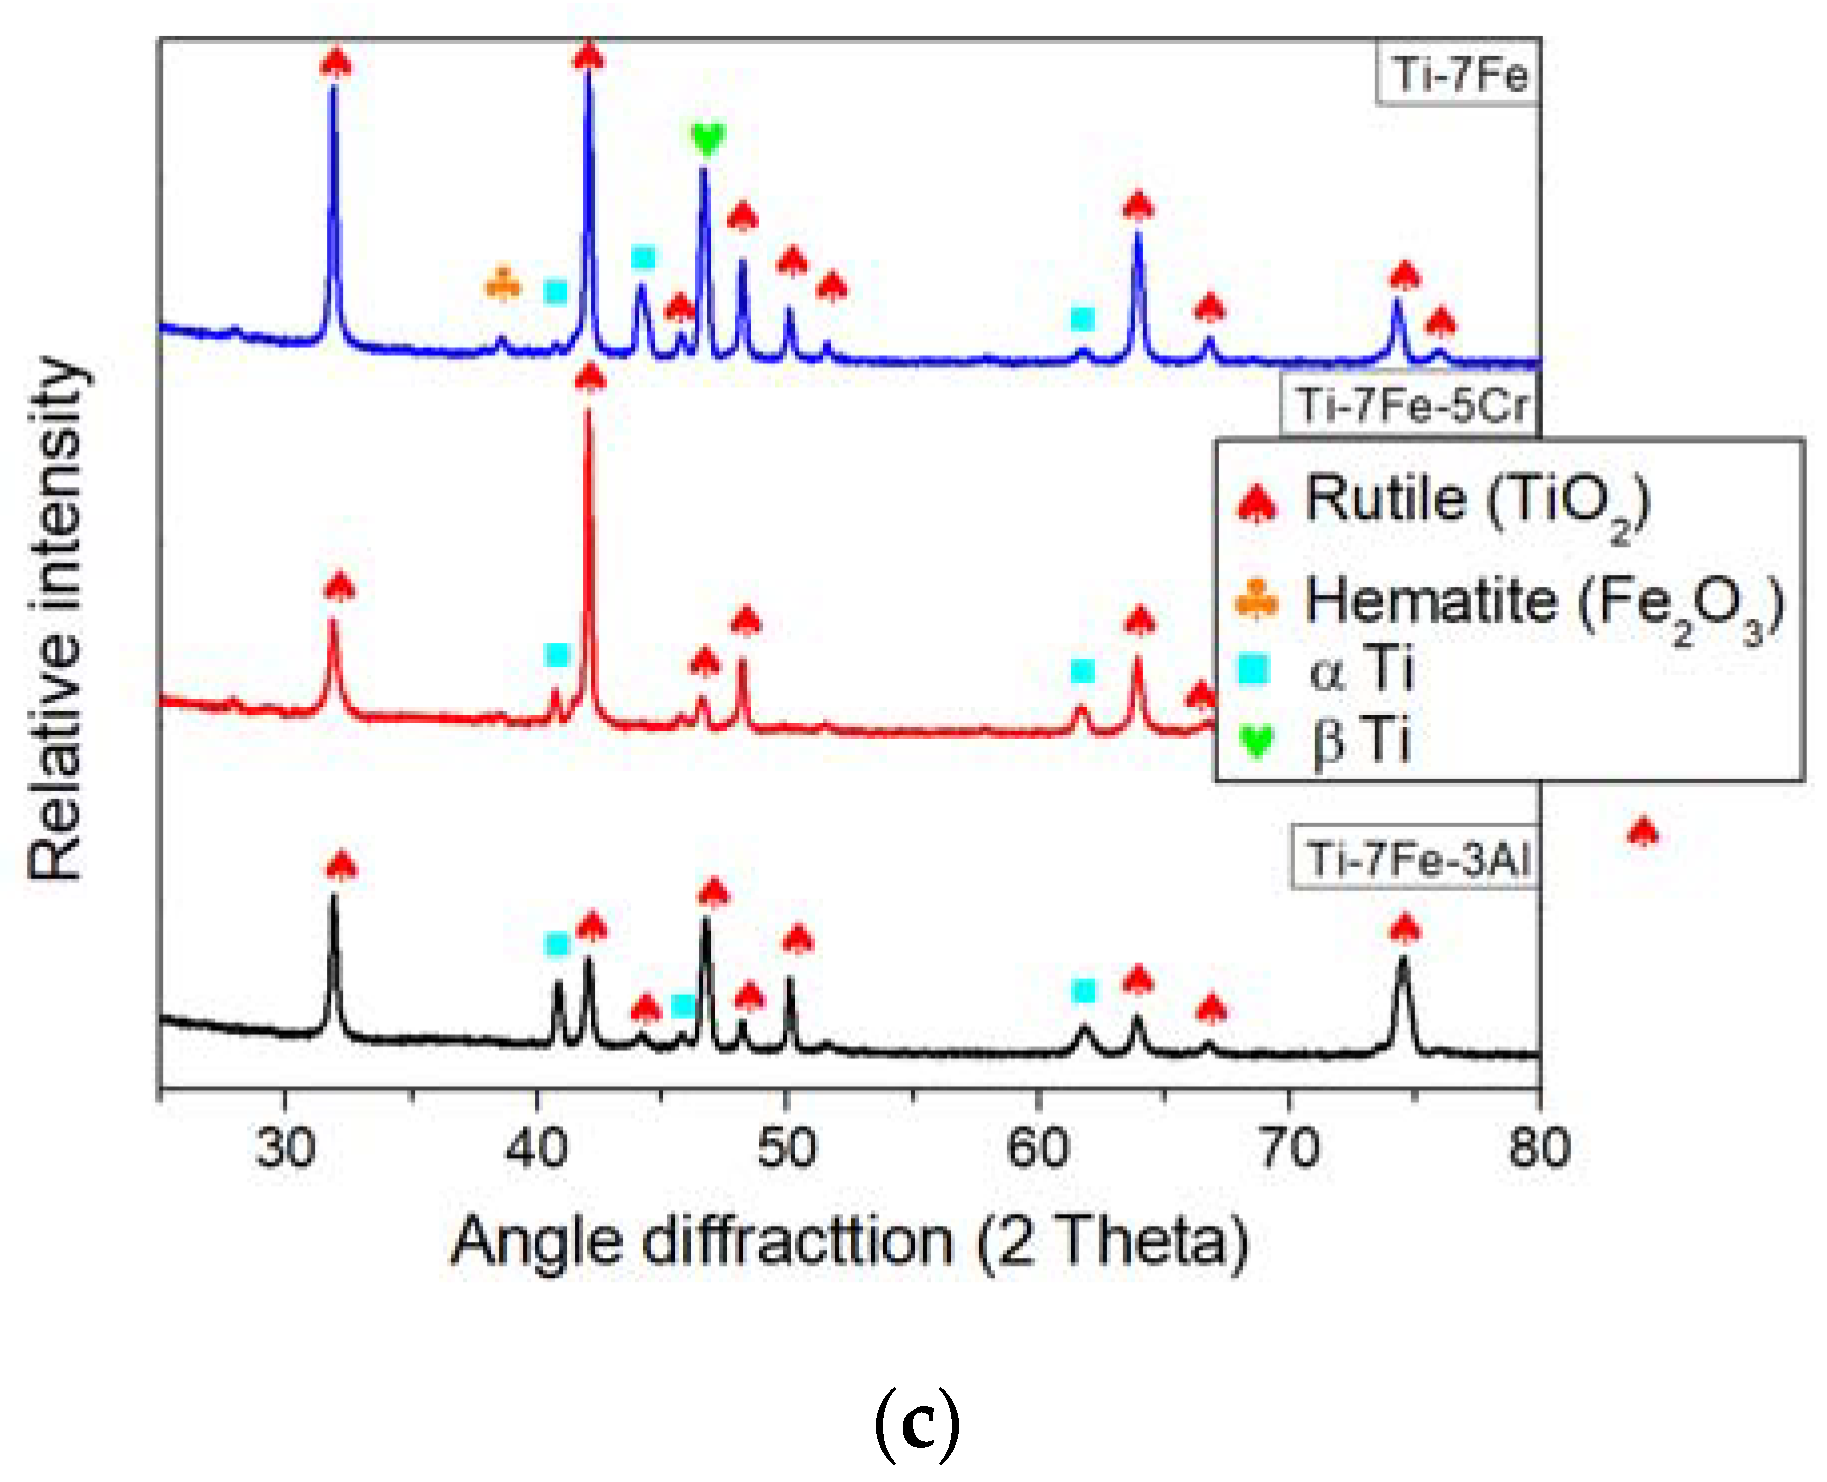
Furthermore, Rietveld quantification from DRX analysis confirms volumetric distribution of approximately 63%, 71%, and 90% β phase for Ti-7Fe-3Al, Ti-7Fe, and Ti-7Fe-5Cr alloy, respectively. Only α and β phases where present in all alloys studied, no intermetallic phase was found on the XRD spectra, as predicted. On Ti-7Fe-5Cr results, relevant β peaks at 46° are more prominent than in the other alloys as a result of the combined beta stabilizing effect from chromium and iron.
3.4. High Temperature Oxidation Resistance
3.4.1. High Temperature Test for 300 h at 600 °C
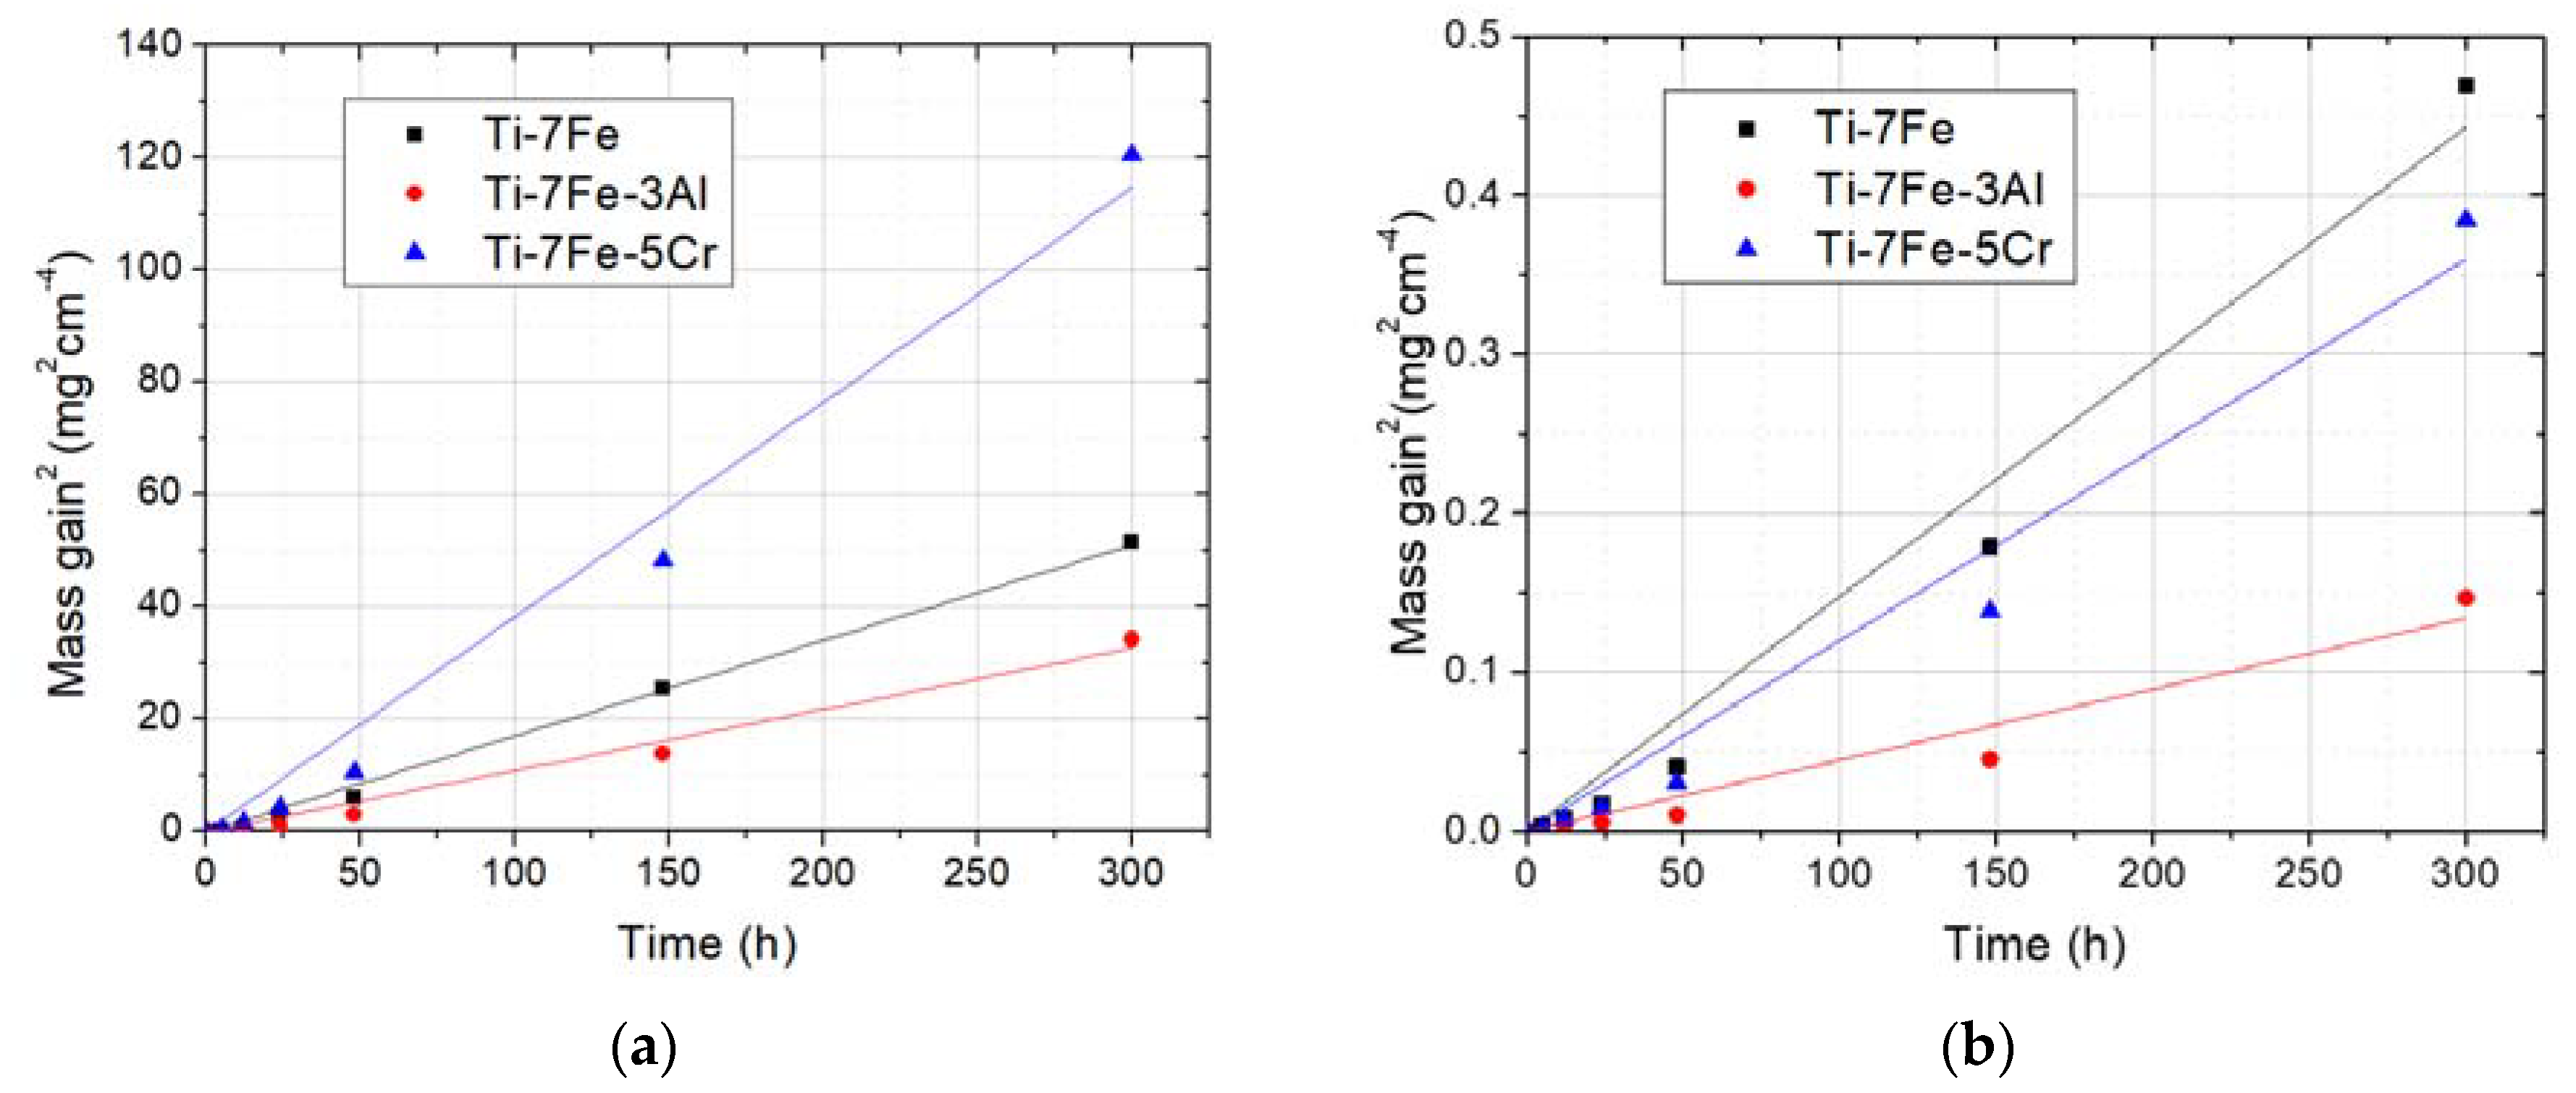
Figure 6 shows the mass gain from 600 °C oxidation tests after 300 h for Ti-7Fe, Ti-7Fe-3Al, Ti-7Fe-5Cr, and unalloyed samples. For comparison reasons, results from previous authors [33] of as-cast Ti-6Al-4V alloy tested at the same temperature are also included. Ti-7Fe-5Cr alloy reach approximately 11 mg/cm2 weight gain after 300 h and it has the highest mass gain showing the worst oxidation resistance from all tested alloys. In comparison, base Ti-7Fe has approximately 7 mg/cm2 weight gain after the 300 h experiments, showing better oxidation resistance than the Ti-7Fe-5Cr alloy. Ti-7Fe-3Al alloy shows better oxidation resistance than Ti-7Fe-5Cr and Ti-7Fe alloys. It is worth noticing that all of these new alloys have worse oxidation resistance than typical Ti-6Al-4V and unalloyed PM titanium at that same temperature. All error bars represented are relatively small and well defined. Therefore, weight gain line and error bar of each composition does not intercept between them and it guarantees no misleading interpretations between compositions.
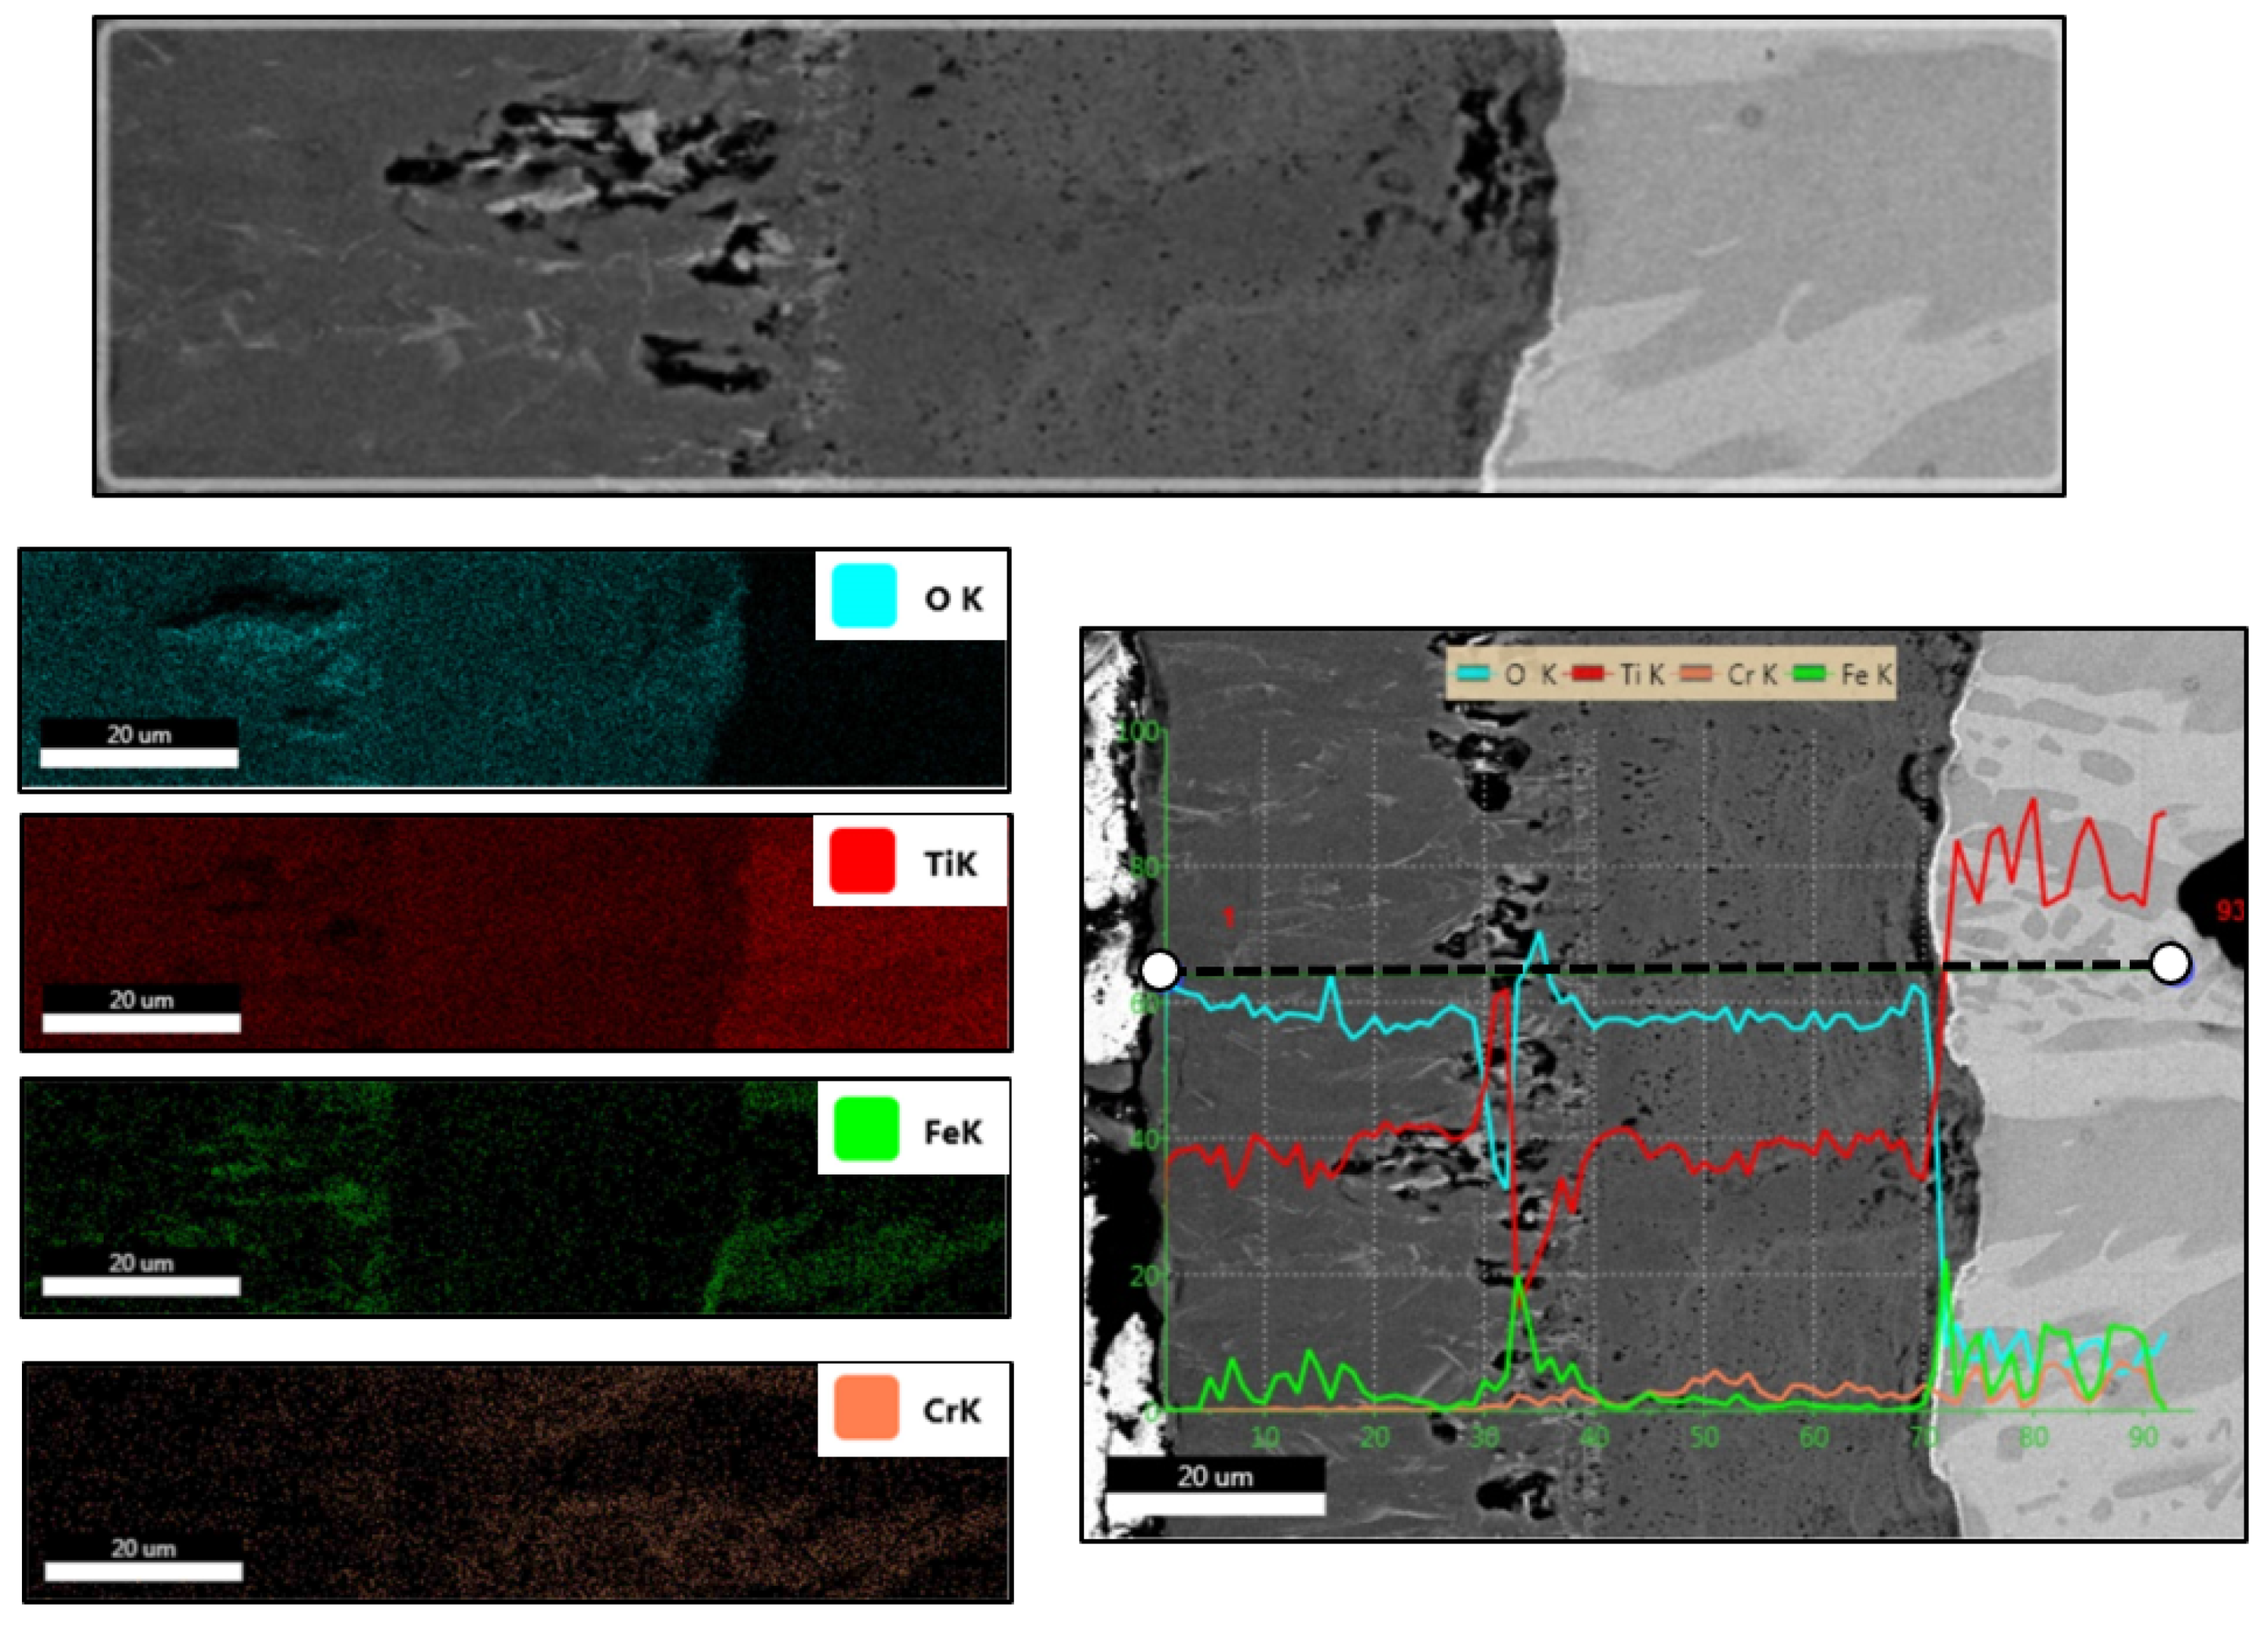
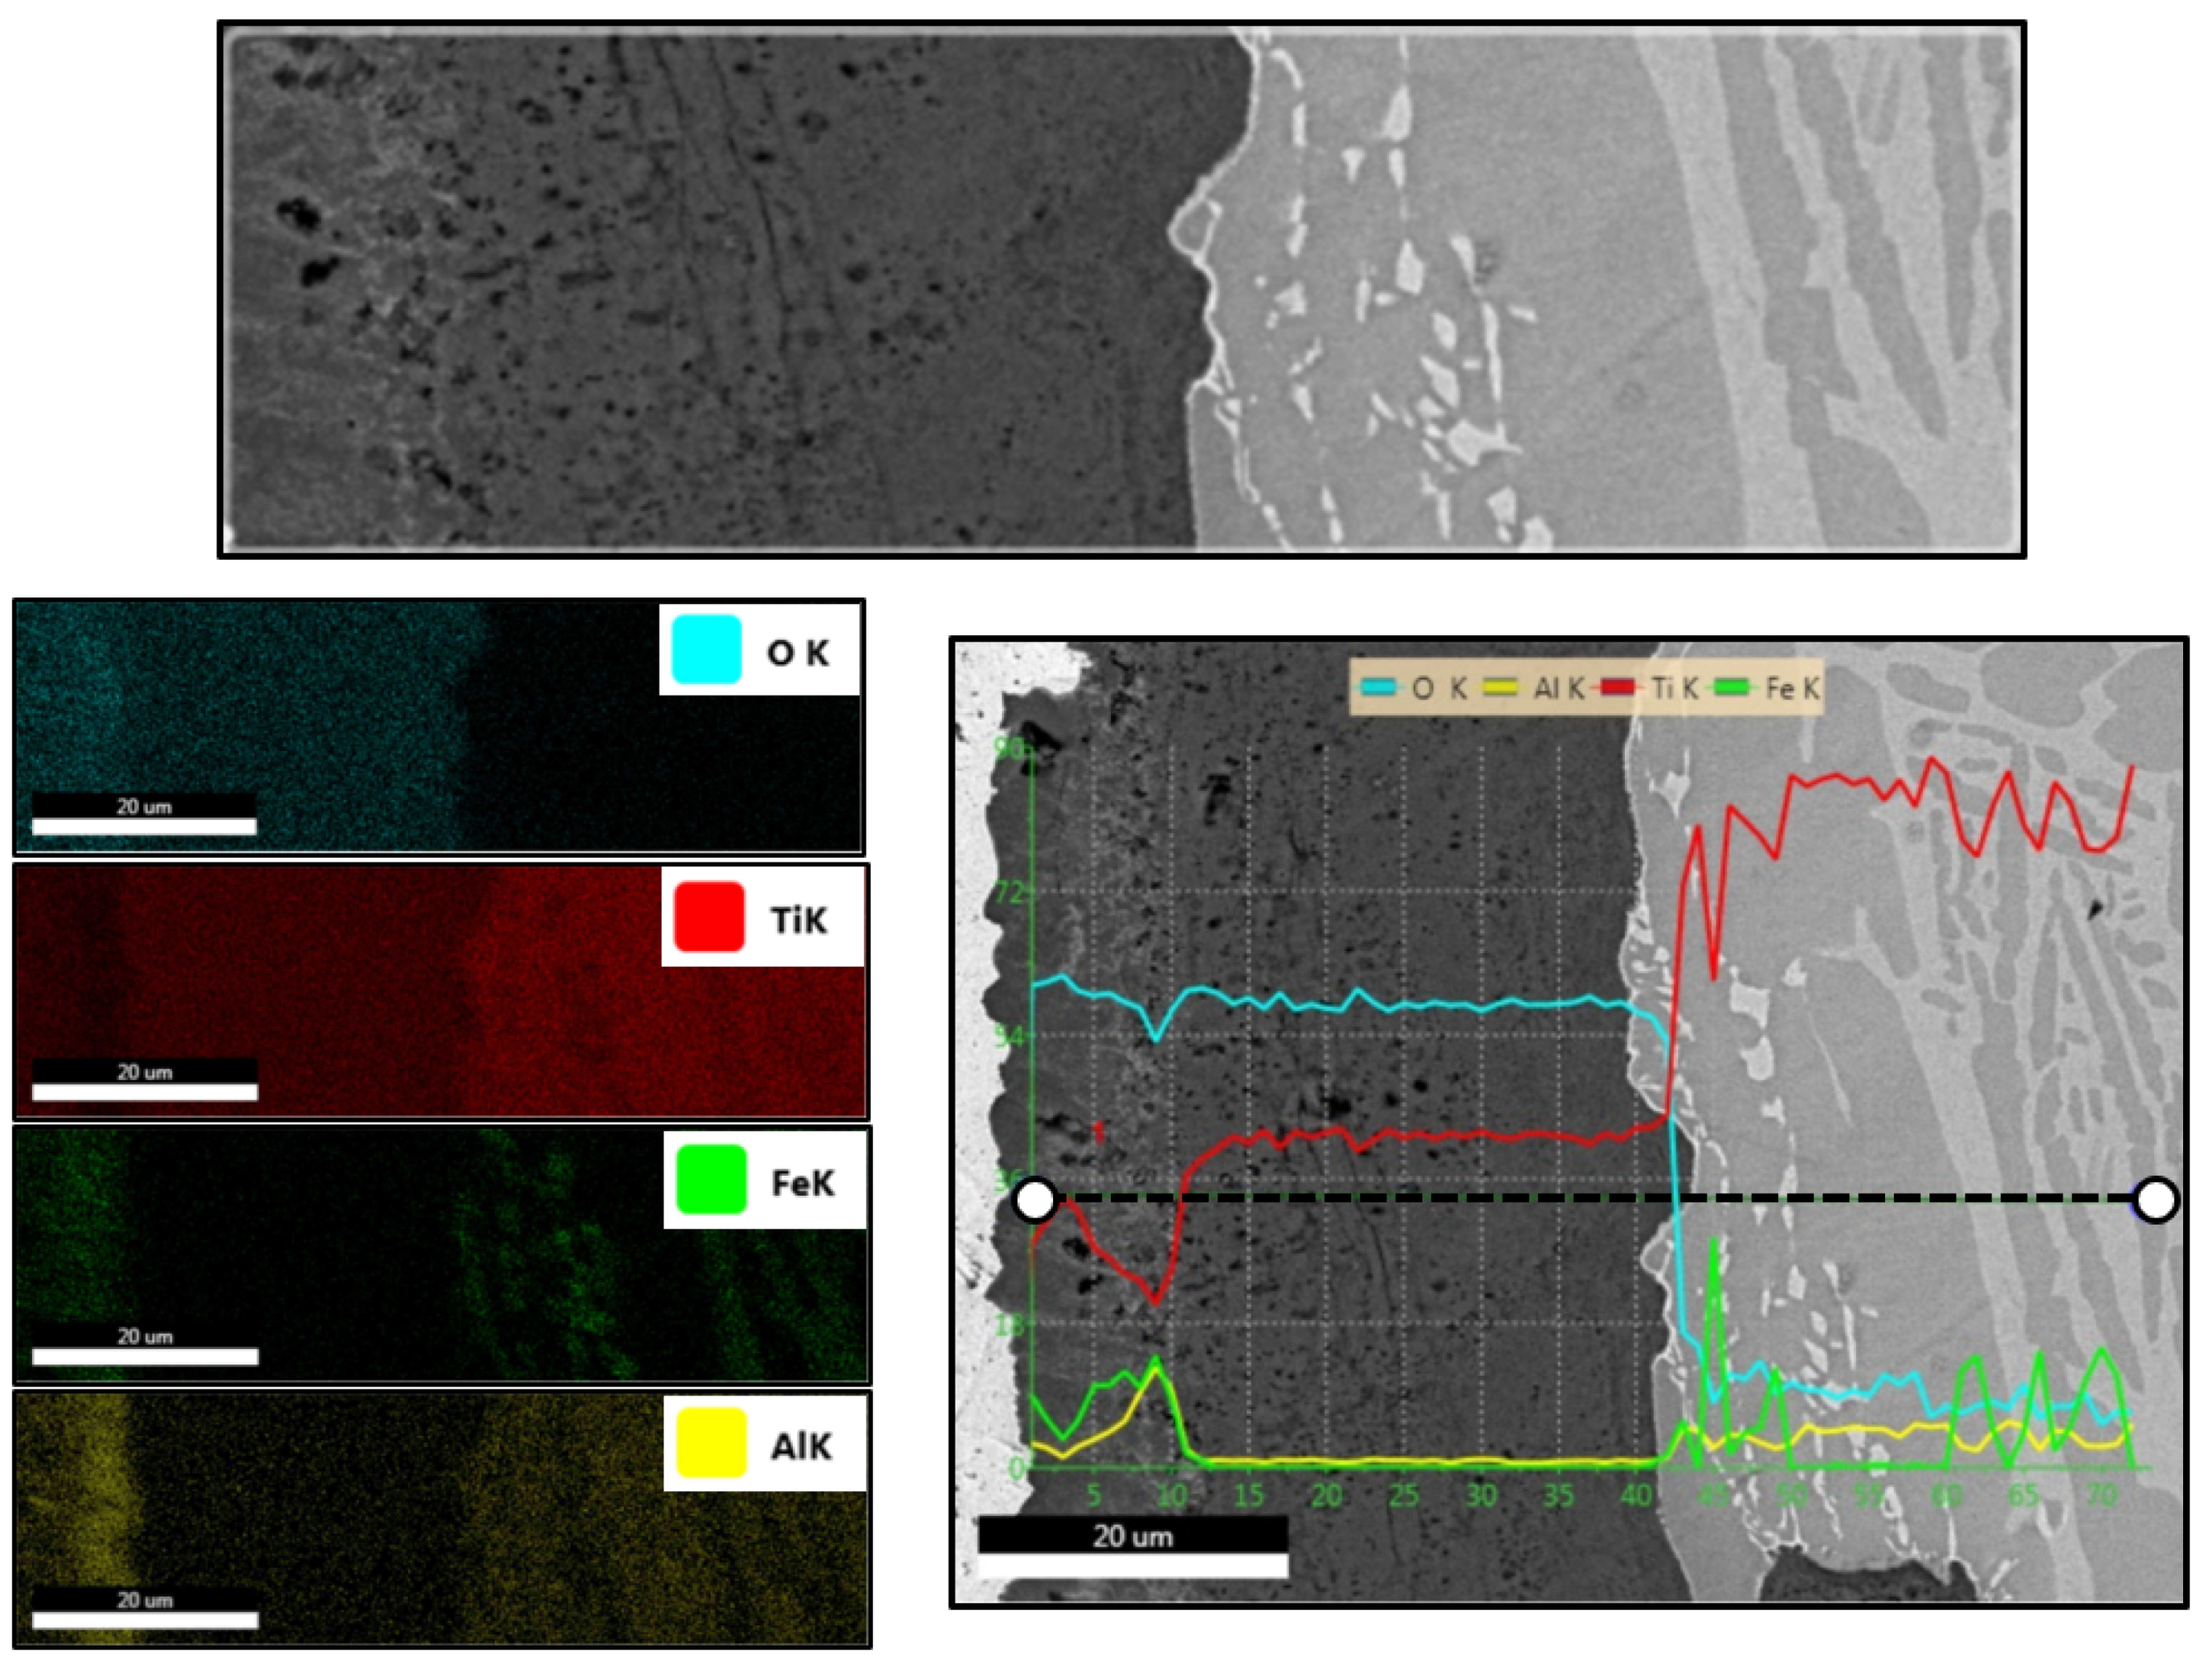
Backscattered electron images from cross section of the Ti alloys samples tested for 300 h at 600 °C are shown in Figure 7 and mapping and linear chemical composition analysis (EDX) of each oxide layer developed on the surface after been tested for 300 h at 600 °C is also described Figure 8, Figure 9 and Figure 10.
Three oxide layers developed during the oxidation process can be seen on the cross section of Ti-7Fe-5Cr samples from Figure 7a; the mapping and linear EDS concentration analysis can also be seen in Figure 8, that helps to understand the oxidation mechanisms. Layer 1 in Figure 7a corresponds to a mainly titanium oxide approximately 27 µm thick which two important features: Firstly, Kirkendall porosity was found on layer 1 which might facilitate oxygen diffusion inwards and accelerates oxidation process. Secondly, the mapping analysis reveals little bright threads with high iron oxide concentration appearing parallel to the diffusion direction, revealing iron diffusion outwards in layer 1. Layer 2 corresponds to a mixture of titanium, iron and chromium oxides and it is possible that the layer 1–2 interface may corresponds to initial sample outer surface. Layer 3 in Figure 7a corresponds to a predominantly titanium oxide layer with little Fe and Cr concentration. Oxygen concentration levels are stablished about 60 at % and in combination with almost 40 at% of titanium, proportion levels suggest that TiO2 rutile was the molecular form found in all layers. This feature it is confirmed on the XRD patters from Figure 7e where rutile was predominately found.
In the Ti-7Fe sample, three layers can be observed in Figure 7b and the element distribution can also be seen in Figure 9. Layer 1 and layer 2 correspond to oxide layers 6 µm and 19 µm thick, respectively. Layer 1 from Figure 7b is predominantly titanium oxide with little Fe-rich bright threads, following the same oxidation kinetic than Ti-7Fe-5Cr samples. Layers 2 and 3 in Figure 7b only correspond to titanium oxide. However, as it can be seen from SEM images, porosity only appears on layer 2 rather than on layer 3, despite both layers having similar concentrations. This Kirkendall porosity could be explained due to high diffusion rate of iron in layer 2 outwards towards layer 1, leaving behind vacancies and porosity as a result. The general lower oxide layer thickness is in accordance with the lower mass gain observed for this sample. On XRD analysis from Figure 7e, rutile and iron oxide were found on the outer oxide layers.
Concerning Ti-7Fe-3Al samples from Figure 7c and the EDS analysis from Figure 10: layer 1 has predominantly titanium and iron oxide while in layer 2, aluminum oxide also appears. Layer 3 and 4 is composed of titanium oxide with little Kirkendall porosity concentrated on the third layer. XRD analysis of the outer layers (Figure 7e) confirms predominantly rutile presence with little hematite (Fe2O3). Furthermore, an additional layer was found on the substrate and it corresponds to a depletion region on the microstructure of the alloy substrate where the starting microstructure has been modified due to selective oxidation of the two-phase alloy causing dissolution of Fe-rich phase and diffusion outward.
It is well known in the industry that aluminum oxides and chromium oxides deliver good performance in high oxidation temperatures applications, whereas iron oxides which are non-protective oxides can decrease the reliability of the alloys. At 600 °C, Ti-7Fe-5Cr and Ti-7Fe thermocalc diagrams (Figure 2) show a stable α phase and a Fe-rich β phase. So it is expected, and it is also confirmed from the mass gain measurements of Figure 6 that Ti-7Fe-5Cr alloy, which has almost a full β microstructure with iron concentrations, would have the worst oxidation resistance due to easier formation of non-protective and heavier iron oxide. On the contrary, Ti-7Fe-3Al with aluminum concentration as a α-stabilizer has a β-transus temperature above 600 °C, as it can be seen from ThermoCalc prediction in Figure 2. It is known that α-phase is more suitable for high temperatures application due to reasonable creep properties and high thermal stability of the HCP crystalline structure, combined with the higher diffusion rate of aluminum and self-diffusion of the titanium in α-phase to form protective titanium and aluminum oxides. This explains the enhancement in oxidation resistance shown in the Ti-7Fe-3Al alloy in comparison from base Ti-7Fe.
3.4.2. High Temperature Test for 300 h at 500 °C
Regarding the oxidation test at 500 °C, all alloys develop much thinner oxide layers in comparison to samples tested at 600 °C. This behavior is reasonable since 500–600 °C range is critical for titanium alloys in terms of high temperature oxidation. The mass gain of 500 °C oxidation test as exposure time increases is presented in Figure 11. The Ti-7Fe alloy shows the worst oxidation resistance with 0.68 mg/cm2 at the end of the test. The Ti-7Fe-5Cr with a measure about 0.61 mg/cm2 at the end of the 300 h revealed less mass gain that Ti-7Fe. However, it is still above the 0.41 mg/cm2 unalloyed Ti has shown. Ti-7Fe-3Al samples have the best oxidation resistance with 0.38 mg/cm2 after 500 °C oxidation test. At 500 °C, β-Ti phase becomes non-thermodynamically stable and α-Ti begins to develop in the alloy surface. Due to the α stabilizing effect of the Al and the O, the oxidation kinetics lead to preferential diffusion of Al, O, and self-diffusion of titanium in α-Ti phase because of their higher solubility, as opposed to Fe or Cr diffusion and the resulting reaction with oxygen.
Regarding Ti-7Fe and Ti-7Fe-5Cr alloys, β-Ti phase is still non-thermodynamically stable and, in contrast to Ti-7Fe-3Al composition, there are no α-stabilizer elements in the α-phase. Therefore, Ti oxides will preferentially grow in α-Ti. Some chromium and iron oxides will also form to some extent. However, the introduction of chromium and hence chromium oxides slightly enhance the oxidation resistance of the alloy as it is seen in Figure 11.
Cross section of Ti-7Fe and Ti-7Fe-5Cr samples after 500 °C oxidation test for 300 h are shown in Figure 12. The low thickness of the oxide layer from Ti-7Fe-3Al hinders the metallographic preparations associated to SEM observation. From the cross section of PM Ti-7Fe samples, it can be seen that there are three different layers: layer 1 and layer 3 correspond to the alloy substrate and the Cu protective coating, respectively. Layer 2 is the only oxide layer with a thickness of 3 µm produced in the 500 °C oxidation test. Rutile was found as the main oxide in the XRD analysis of Figure 12c and in the linear EDX analysis from Figure 13.
Cross section from Ti-7Fe-5Cr samples after 500 °C oxidation test is shown in Figure 12b. Only the layer 2 was developed after the oxidation test with a thickness of 1 µm. Moreover, the XRD pattern from Figure 12c confirms the growth of titanium oxide, whereas layer 1 and layer 3 correspond to alloy substrate and Cu protective coating, respectively. Thickness from Ti-7Fe-5Cr and Ti-7Fe samples are in accordance with the mass gain observed where thinner oxide layer is associated with the composition that showed better oxidation resistance, in this case Ti-7Fe-5Cr. In the XRD analysis of Ti-7Fe-3Al, rutile was only detected.
3.4.3. Oxidation Kinetics Discussion
The oxidation kinetic of metals and alloys are commonly described by a parabolic-law of the thermogravimetry measurements [34].
where Λm describes the mass gain per unit area of the sample, Kp represents the oxidation rate constant (mg2 cm−4 h−1) and t as the oxidation time (h). When parabolic relationship (n = 2) exists between mass gain and time, according to Wagner’s theory, oxidation kinetics are controlled by element diffusion. Kp values and parabolic fitting according to Wagner theory are shown in Table 5 and Figure 14. R-square values indicate adequate fitting and hence suggest that all oxidation kinetics are controlled by diffusion process of elements. However, Ti-7Fe alloy shows better R-square fit than Ti-7Fe-3Al and Ti-7Fe-5Cr and this suggests that the inclusion of Al and Cr changes the oxidation kinetics towards other oxidation mechanism like the formation of protective compounds, not contemplated by Wagner’s theory of diffusion. However, despite showing the possible formation of protective chromium oxides in Ti-7Fe-5Cr alloy at 600 °C, the high amount of β-phase and the higher diffusivity of iron hinder the possible protective performance of the chromium oxides.
Comparing R-square fits at different temperatures, Kp shows that at 600 °C the alloys have better R-square fit than at 500 °C due to higher diffusion rates of the elements that control the oxidation process. This is expected, since at 500 °C oxide layer thickness is low and therefore diffusion-controlled process might not yet dominate oxide layer growth.
Wagner’s theory assumes purely diffusionally controlled oxidation kinetics and does not account for transient regimes or mixed diffusion/reaction behavior or formation of protective compounds, which are common in multielement alloys or when more than one oxide is formed, as is the case in the current study. Therefore, the oxidation rate constant was also obtained by complete parabolic fitting following Monceau et al. [35] general procedure (Equation (4)) of a parabola equation, which also takes account for non-diffusional oxidation mechanisms. The results are shown in Table 6 and Figure 15.
Excellent fitting was obtained with Monceau parabola procedure and it shows more reliable oxidation rate constant as it offers the advantage of accounting for pure diffusion control, mixed (diffusion/reaction) control, and protective oxidation layers.
3.5. Electrochemical Measurements
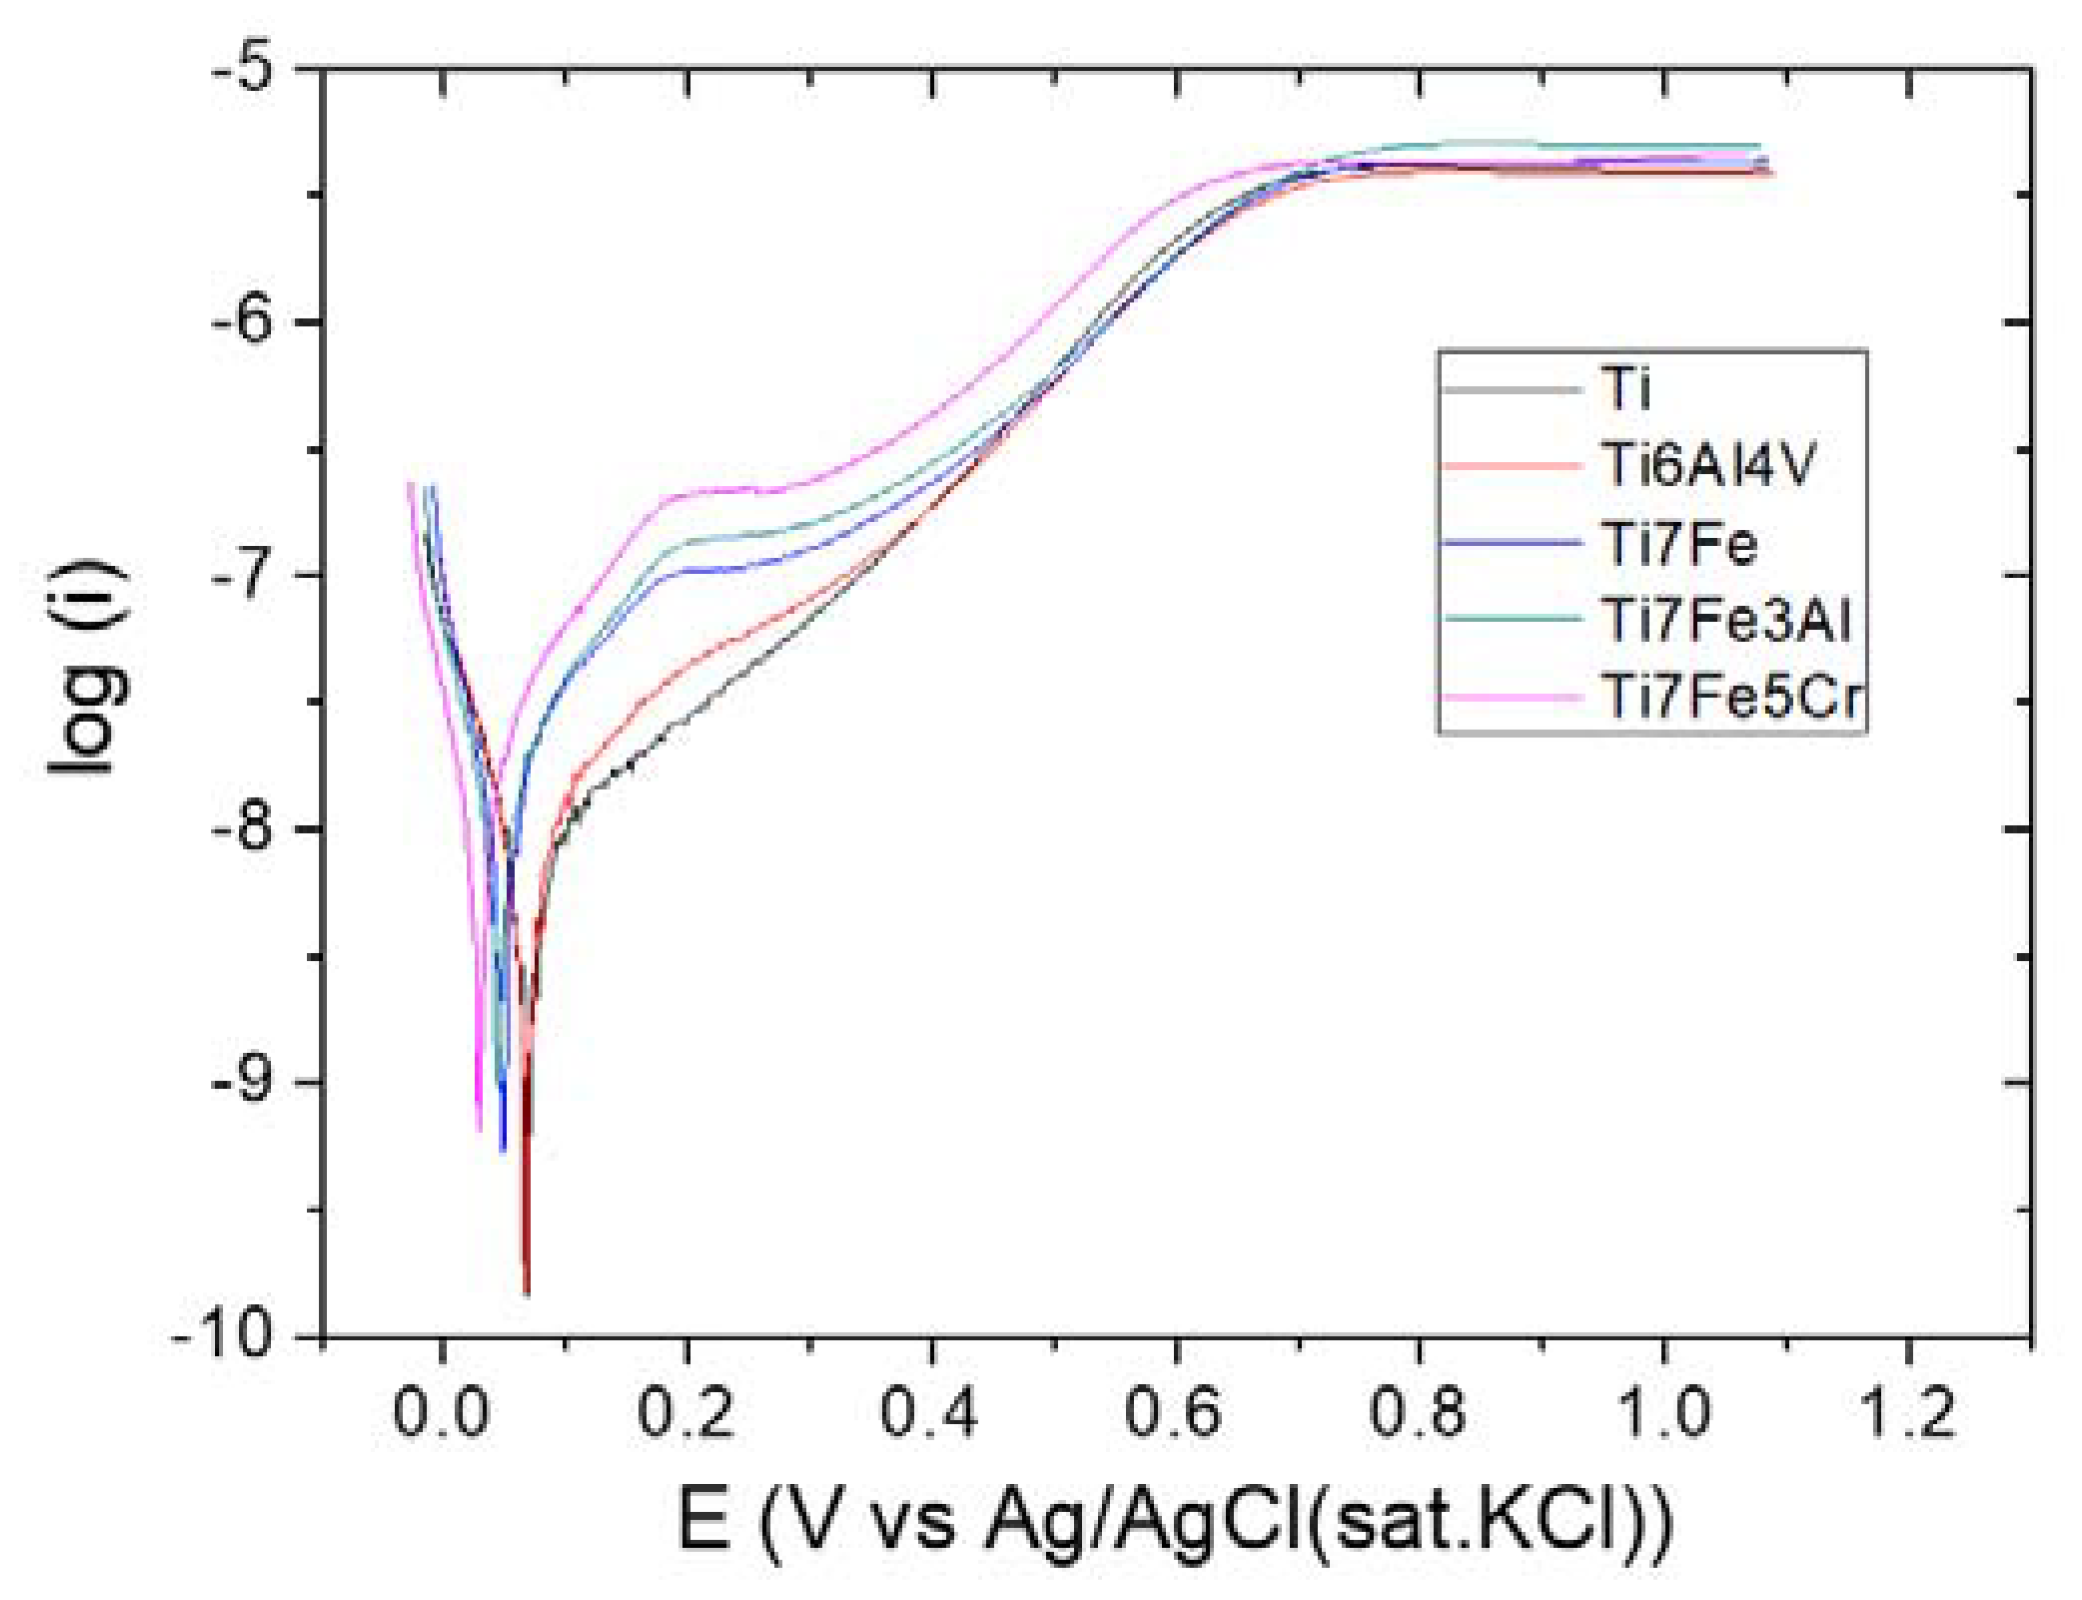
Open Circuit Potential and Potentiodynamic Polarization
Table 7 shows results of the open circuit potential (OCP) measurements for all samples carried out in Harrison solutions for 24 h including the corrosion potentials (Ecorr) and corrosion current densities (Icorr) from the potentiodynamic polarization curves of Figure 16. For comparison purposes, unalloyed Ti and PM Ti-6Al-4V corrosion parameters were also measured at same conditions. The immersion in solutions over time enhances the formation of passive films and it is represented as a shift to positive values of the OCP. However, if the OCP leans towards negative values, it could be a consequence of local breakdown, dissolution of the film, or even no passive film formation.
All OCP values are mainly identical and this indicates that a stable film has grown and stabilized successfully. The corrosion potentials (Ecorr) are estimated from the polarization curves and the corrosion current densities (icorr) can be obtained by Tafel analysis of the cathodic and anodic branches. The results show that Ti-Fe alloys have similar Icorr values and corrosion rates, all of them slightly higher than unalloyed Ti and PM Ti-6Al-4V representing that Fe addition increases the corrosion rate of the alloy. Ti-Fe alloys shows to be similar to unalloyed Ti and Ti-6Al-4V. Therefore, all recent Ti-Fe alloys have comparable corrosion resistance than highly investigated and commercial Ti-6Al-4V alloy.
4. Conclusions
Starting from an already developed Ti-7Fe alloy, two new low cost Ti alloys were designed using thermodynamic calculations from ThermoCalc [18] in order to analyze the influence of Al and Cr alloy elements in oxidation resistance behavior in the Ti-Fe system. The PM route follows the traditional uniaxial pressing in sintering in high vacuum of green compacts from elemental powders and titanium hydride powder. The procedure followed aimed to reduce manufacturing costs by integrating near-net shape models in the production methodology and by replacing high value elements (i.e., vanadium) for well stablished and affordable components such as iron or aluminum.
Ti-7Fe and Ti-7Fe-3Al alloys show a α+β microstructure whereas with only 12% of β-stabilizer elements, the Ti-7Fe-5Cr alloy is able of obtain mainly β microstructures, a remarkable feature that differs from traditional β-Ti alloys with high content of β stabilizers like commercial Ti−5553 (Ti−5Al−5V−5Mo−3Cr−0.5Fe).
In comparison to alloys obtained using HDH Ti as starting powders, TiH2 powders have proven to enhance by approximately 2% the densification during sintering by increasing hydrogen and alloy elements’ diffusion during dehydrogenation process.
The oxidation behavior at temperatures near 500 °C, aluminum inhibits more efficiently the formation of iron oxide, despite the absence of evidences of aluminum oxide growth in outer surface layers. Comparison to CP Ti which traditionally exhibits excellent corrosion with a full α phase microstructure, aluminum has proven to have successfully enhance the oxidation resistance properties by approximately 10%. In terms of chromium addition, it stabilizes mainly β phase microstructures. However, it also shows an improvement of oxidation resistance compared to Ti-7Fe, but worse than CP Ti.
At temperatures approximately of 600 °C, alloys containing chromium exhibit the worst performance of all due to the higher amount of β phase, followed by Ti-7Fe and Ti-7Fe-3Al. The alloy that has higher amount of α phase in the substrate has showed better oxidation resistance. The presence of Cr, even though is often associated with better oxidation resistance, did not improve oxidation performance. In case of aluminum, it certainly shows a slight improvement of 20% from base Ti-7Fe. However, all three Ti-Fe alloys presented worse oxidation resistance than traditional CP Ti or Ti-6Al-4V.
As conclusion, in oxidation resistance, open porosity usually implies more surface exposed to oxidation. However, it does not seem to be the most relevant feature, this being the amount of Fe-rich beta phase present on the microstructure of the alloy and the introduction of aluminum or chromium which inhibits iron oxide growth. The corrosion resistance of all alloys that, in aeronautical an environment, are comparable to conventional Ti alloys compositions (Ti- 6Al-4V).
At temperatures about 500 °C, the designed Ti-Fe alloys show good performance that make it possible to reduce the high cost that always hinders the use of titanium alloys in many industries. CP Ti is more expensive than using stainless steel and hence by reducing about 10 to 15% of Ti usage, could potentially increase savings by the same proportions.
The information obtained about the aluminum and chromium additions as alloy elements carries positive improvements for Ti-Fe-Al and Ti-Fe-Cr alloys. Microstructure and surface quality are highlighted as critical factors for oxidation and corrosion resistance. Therefore, surface modification and heat treatments can further improve such properties.
Author Contributions
The conceptualization was designed by E.G. The methodology was designed and improved by all authors; E.R., S.A.T., and E.G. The formal analysis, investigation, and validation were carried out by all authors; E.R., S.A.T., and E.G. The writing of the original draft was prepared by E.R. The reviews and editing of the manuscript were made by all authors. The supervision was made by S.A.T. and E.G. All authors have read and agreed to the published version of the manuscript.
Funding
The authors would like to thank the funding provided for this research by the Regional Government of Madrid (Dir. Gral. Universidades e Investigación) through the project ADITIMAT-CM (P2018/NMT4411), the Spanish Government through the Ramón y Cajal contract RYC-2014-15014 and the project BIOHYB (PCIN-2016-123).
Conflicts of Interest
The authors declare no conflict of interest. The funders had no role in the design of the study; in the collection, analyses, or interpretation of data; in the writing of the manuscript, or in the decision to publish the results.
References
- Froes, F.H.; Imam, A. Titanium: A historic and current perspective part II. Adv. Mater. Process. 2018, 176, 18–24. [Google Scholar]
- Cui, C.; Hu, B.M.; Zhao, L.; Liu, S. Titanium alloy production technology, market prospects and industry development. Mater. Des. 2011, 32, 1684–1691. [Google Scholar] [CrossRef]
- Froes, F.H.S.; Gungor, M.N.; Imam, M.A. Cost-affordable titanium: The component fabrication perspective. JOM 2007, 59, 28–31. [Google Scholar] [CrossRef]
- Samarov, V.; Seliverstov, D. Fabrication of near-net-shape cost-effective titanium components by use of prealloyed powders and hot isostatic pressing. In Titanium Powder Metallurgy; Elsevier: San Diego, CA, USA, 2015; pp. 313–336. [Google Scholar]
- Esteban, P.G.; Bolzoni, L.; Ruiz-Navas, E.M.; Gordo, E. PM processing and characterisation of Ti-7Fe low cost titanium alloys. Powder Metall. 2011, 54, 242–245. [Google Scholar] [CrossRef] [Green Version]
- Bolzoni, L.; Herraiz, E.; Ruiz-Navas, E.M.; Gordo, E. Study of the properties of low-cost powder metallurgy titanium alloys by 430 stainless steel addition. Mater. Des. 2014, 60, 628–636. [Google Scholar] [CrossRef] [Green Version]
- Wang, S.; Wang, K.; Chen, G.; Li, Z.; Qin, Z.; Lu, X.; Li, C. Thermodynamic modeling of Ti-Fe-Cr ternary system. Calphad 2017, 56, 160–168. [Google Scholar] [CrossRef]
- Hsu, H.-C.; Pan, C.-H.; Wu, S.-C.; Ho, W.-F. Structure and grindability of cast Ti–5Cr–xFe alloys. J. Alloys Compd. 2009, 474, 578–583. [Google Scholar] [CrossRef]
- Yamanoglu, R.; Gulsoy, N.; Olevsky, E.A.; Gulsoy, H.O. Production of porous Ti5Al2.5Fe alloy via pressureless spark plasma sintering. J. Alloys Compd. 2016, 68, 654–658. [Google Scholar] [CrossRef] [Green Version]
- Syarif, J.; Kurniawan, E.; Sajuri, Z.; Omar, M. Influence of iron on phase stability and corrosion resistance of Ti-15% Cralloy. Sains Malays. 2013, 42, 1775–1780. [Google Scholar]
- Lu, J.; Zhao, Y.; Niu, H.; Zhang, Y.; Du, Y.; Zhang, W.; Huo, W. Electrochemical corrosion behavior and elasticity properties of Ti–6Al–xFe alloys for biomedical applications. Mater. Sci. Eng. C 2016, 62, 36–44. [Google Scholar] [CrossRef]
- Pimenova, N.V.; Starr, T.L. Electrochemical and corrosion behavior of Ti–xAl–yFe alloys prepared by direct metal deposition method. Electrochim. Acta 2006, 51, 2042–2049. [Google Scholar] [CrossRef]
- Bolzoni, L.; Ruiz-Navas, E.M.; Gordo, E. Quantifying the properties of low-cost powder metallurgy titanium alloys. Mater. Sci. Eng. A 2017, 687, 47–53. [Google Scholar] [CrossRef]
- Esteban, P.G.; Ruiz-Navas, E.M.; Bolzoni, L.; Gordo, E. Low-cost titanium alloys? Iron may hold the answers. Met. Powder Rep. 2008, 64, 24–27. [Google Scholar] [CrossRef]
- Bolzoni, L. Low-cost Fe-bearing powder metallurgy Ti alloys. Met. Powder Rep. 2019, 74, 308–313. [Google Scholar] [CrossRef]
- Ivasishin, O.M.; Savvakin, D.G.; Moxson, V.S.; Bondareval, K.A.; Froes, F.H.S. Titanium powder metallurgy for automotive components. Mater. Technol. 2002, 17, 20–25. [Google Scholar] [CrossRef]
- Gordo, E.; Morales-Rivas, L.; Böhme, L.; Kerscher, E.; Tsipas, S.A.; Bolzoni, L. Fatigue and oxidation behavior of low-cost PM Ti-Fe alloys. In Proceedings of the 4th International Conference on Titanium Powder Metallurgy & Additive Manufacturing, Xi’an, China, 8–10 September 2017. [Google Scholar]
- Andersson, J.O.; Helander, T.; Höglund, L.; Shi, P.; Sundman, B. Thermo-Calc and DICTRA, computational tools for materials science. Calphad 2002, 26, 273–312. [Google Scholar] [CrossRef]
- Kumar, S.; Narayanan, T.S.N.S.; Raman, S.G.S.; Seshadri, S.K. Thermal oxidation of CP Ti-An electrochemical and structural characterization. Mater. Charact. 2010, 61, 589–597. [Google Scholar] [CrossRef]
- Ho, W.-F.; Pan, C.-H.; Wu, S.-C.; Hsu, H.-C. Mechanical properties and deformation behavior of Ti–5Cr–xFe alloys. J. Alloys Compd. 2009, 472, 546–550. [Google Scholar] [CrossRef]
- Yoon, J.-W.; Hyun, Y.-T.; Kim, J.-H.; Yeom, J.-T.; Yoon, S.-Y. Effect of Fe on the high temperature oxidation of Ti-Al-Fe alloys. Korean J. Mater. Res. 2011, 21, 357–363. [Google Scholar] [CrossRef] [Green Version]
- Lee, S.W.; Kim, K.M.; Park, C.H.; Hong, J.K.; Yeom, J.-T.; Shih, D.S. Effects of TiFe Intermetallic Compounds on the Tensile Behavior of Ti-4Al-4Fe-0. 25Si Alloy, Metall. Mater. Trans. A 2017, 48, 561–567. [Google Scholar] [CrossRef]
- Ivasishin, O.; Moxson, V. Low-cost titanium hydride powder metallurgy. In Titanium Powder Metallurgy; Qian, M., Sam Froes, F.H., Eds.; Butterworth-Heinemann: Boston, MA, USA, 2015; pp. 117–148. [Google Scholar]
- Chen, G.; Liss, K.D.; Auchterlonie, G.; Tang, H.; Cao, P. Dehydrogenation and Sintering of TiH2: An In Situ Study. Metall. Mater. Trans. A 2017, 48, 2949–2959. [Google Scholar] [CrossRef]
- Bhosle, V.; Baburaj, E.; Miranova, M.; Salama, K. Dehydrogenation of TiH2. Mater. Sci. Eng. A 2003, 356, 190–199. [Google Scholar] [CrossRef]
- Liu, H.; He, P.; Feng, J.C.; Cao, J. Kinetic study on nonisothermal dehydrogenation of TiH2 powders. Int. J. Hydrogen Energy 2009, 34, 3018–3025. [Google Scholar] [CrossRef]
- Robertson, I.M.; Schaffer, G.B. Comparison of sintering of titanium and titanium hydride powders. Powder Metall. 2010, 53, 12–19. [Google Scholar] [CrossRef]
- Alcock, C.B.; Itkin, V.P.; Horrigan, M.K. Vapour Pressure Equations for the Metallic Elements: 298–2500K. Can. Metall. Q. 1984, 23, 309–313. [Google Scholar] [CrossRef]
- Rocha, D.S.S.; Adabo, L.G.; Henriques, P.G.E.; Nóbilo, A.M.A.D. Vickers Hardness of Cast Commercially Pure Titanium and Ti-6Al-4V Alloy Submitted to Heat Treatments. Braz. Dent. J. 2006, 17, 126–129. [Google Scholar] [CrossRef]
- Ivasishin, O.M.; Demidik, A.N.; Savvakin, D.G. Use of titanium hydride for the synthesis of titanium aluminides from powder materials. Powder Metall. Met. Ceram. 1999, 38, 482–487. [Google Scholar] [CrossRef]
- Wang, H.T.; Lefler, M.; Fang, Z.Z.; Lei, T.; Fang, S.M.; Zhang, J.M.; Zhao, Q. Titanium and Titanium Alloy via Sintering of TiH 2. Key Eng. Mater. 2010, 436, 157–163. [Google Scholar] [CrossRef]
- Boyer, R.; Welsch, G.; Collings, E.W. Materials Properties Handbook: Titanium Alloys; ASM International: Cleveland, OH, USA, 1998. [Google Scholar]
- Frangini, S.; Mignone, A.; de Riccardis, F. Various aspects of the air oxidation behaviour of a Ti6Al4V alloy at temperatures in the range 600–700 °C. J. Mater. Sci. 1994, 29, 714–720. [Google Scholar] [CrossRef]
- Wagner, C. Reaktionstypen bei der Oxydation von Legierungen, Zeitschrift für Elektrochemie, Berichte der Bunsengesellschaft. Phys. Chem. 1959, 63, 772–782. [Google Scholar]
- Monceau, D.; Pieraggi, B. Determination of Parabolic Rate Constants from a Local Analysis of Mass-Gain Curves. Oxid. Met. 1998, 50, 477–493. [Google Scholar] [CrossRef] [Green Version]
Figure 1.
High temperature oxidation test cycle.

Figure 2.
ThermoCalc [18] equilibrium phase diagrams (a) Ti-7Fe-yCr (b) Ti-7Fe-xAl.
Figure 2.
ThermoCalc [18] equilibrium phase diagrams (a) Ti-7Fe-yCr (b) Ti-7Fe-xAl.

Figure 3.
DTA-TG curves for the Ti alloys blended powders (a) DTA and (b) TG.

Figure 4.
Sem images (BSE mode ×1000) of sintered samples (a) Ti-7Fe, (b) Ti-7Fe-3Al, (c) Ti-7Fe-5Cr, and (d) EDS analysis on each specified point.
Figure 4.
Sem images (BSE mode ×1000) of sintered samples (a) Ti-7Fe, (b) Ti-7Fe-3Al, (c) Ti-7Fe-5Cr, and (d) EDS analysis on each specified point.

Figure 5.
XRD patterns of as-sintered Ti alloys.

Figure 6.
Mass gain as exposure time increase in 600 °C oxidation test for 300 h of Ti-7Fe-5Cr, Ti-7Fe, Ti-7Fe-3Al, Ti-6Al-4V [33], and unalloyed Ti samples.
Figure 6.
Mass gain as exposure time increase in 600 °C oxidation test for 300 h of Ti-7Fe-5Cr, Ti-7Fe, Ti-7Fe-3Al, Ti-6Al-4V [33], and unalloyed Ti samples.

Figure 7.
Backscattered electron image of cross section of (a) Ti-7Fe-5Cr, (b)Ti-7Fe, (c)Ti-7Fe-3Al, (d) unalloyed Ti, and (e) XRD patterns of samples tested at 600 °C for 300 h.
Figure 7.
Backscattered electron image of cross section of (a) Ti-7Fe-5Cr, (b)Ti-7Fe, (c)Ti-7Fe-3Al, (d) unalloyed Ti, and (e) XRD patterns of samples tested at 600 °C for 300 h.


Figure 8.
Results of the EDS area and linear mapping (at %) conducted on Ti-7Fe-5Cr samples oxidized for 300 h at 600 °C.
Figure 8.
Results of the EDS area and linear mapping (at %) conducted on Ti-7Fe-5Cr samples oxidized for 300 h at 600 °C.

Figure 9.
Results of the EDS area and linear mapping (at %) conducted on Ti-7Fe samples oxidized for 300 h at 600 °C.
Figure 9.
Results of the EDS area and linear mapping (at %) conducted on Ti-7Fe samples oxidized for 300 h at 600 °C.

Figure 10.
Results of the EDS area and linear mapping (at %) conducted on Ti-7Fe-3Al samples oxidized for 300 h at 600 °C.
Figure 10.
Results of the EDS area and linear mapping (at %) conducted on Ti-7Fe-3Al samples oxidized for 300 h at 600 °C.

Figure 11.
Mass gain as exposure time increase in the 500 °C oxidation test for 300 h of Ti-7Fe-5Cr, Ti-7Fe, Ti-7Fe-3Al, and unalloyed Ti powder metallurgy samples.
Figure 11.
Mass gain as exposure time increase in the 500 °C oxidation test for 300 h of Ti-7Fe-5Cr, Ti-7Fe, Ti-7Fe-3Al, and unalloyed Ti powder metallurgy samples.

Figure 12.
Backscattered electron image of cross section of (a) Ti-7Fe (b) Ti-7Fe-5Cr, and (c) XRD patterns of samples tested at 500 °C for 300 h.
Figure 12.
Backscattered electron image of cross section of (a) Ti-7Fe (b) Ti-7Fe-5Cr, and (c) XRD patterns of samples tested at 500 °C for 300 h.


Figure 13.
Linear mapping (at %) along the superficial oxide of (a) Ti-7Fe (b) Ti-7Fe-5Cr alloys after 500 °C oxidation test.
Figure 13.
Linear mapping (at %) along the superficial oxide of (a) Ti-7Fe (b) Ti-7Fe-5Cr alloys after 500 °C oxidation test.

Figure 14.
Wagner linearization of square of mass gain vs. time at (a) 600 °C (b) 500 °C.

Figure 15.
Monceau parabolic fit time vs. mass gain at (a) 600 °C and (b) 500 °C.

Figure 16.
Potentiodynamic polarization curves of unalloyed Ti and Ti alloys.


Table 1.
Characteristics of the starting powders.
| Property | Powder | ||||
|---|---|---|---|---|---|
| TiH2 | Fe | Al | Cr | ||
| Density (g/cm3) | 3.83 ± 0.02 | 7.786 ± 0.003 | 2.6708 ± 0.0012 | 7.56 ± 0.05 | |
| Particle size distribution (µm) | D90 | 55 | 70 | 243 | 17 |
| D50 | 24 | 34 | 130 | 7 | |
| D10 | 8 | 15 | 70 | 3 | |
Table 2.
Onset and offset parameters from the two-step reaction of hydrogen decomposition.
| Composition | First Decomposition Reaction | Second Decomposition Reaction | Third Decomposition Shoulder | |||||
|---|---|---|---|---|---|---|---|---|
| Onset | Peak | Offset | Onset | Peak | Offset | Onset | Offset | |
| TiH2 | 481 | 511 | 539 | 554 | 592 | 635 | 638 | 808 |
| Ti-7Fe-5Cr | 474 | 507 | 549 | 549 | 603 | 641 | 643 | 831 |
| Ti-7Fe | 463 | 498 | 548 | 548 | 610 | 643 | 646 | 844 |
| Ti-7Fe-3Al | 457 | 506 | 545 | 545 | 601 | 634 | 637 | 823 |
Table 3.
Hydrogen mass loss and volume shrinkage from sintering process.
| Composition | Ti-7Fe | Ti-7Fe-3Al | Ti-7Fe-5Cr |
|---|---|---|---|
| Hydrogen relative mass loss (%) | 96 ± 1 | 99 ± 1 | 103 ± 5 |
| Volume shrinkage (%) | 23.68 ± 0.76 | 21.09 ± 0.72 | 25.27 ± 0.48 |
Table 4.
Relative density, porosity, and Vickers hardness of the TiH2 samples and from HDH powders from previous studies.
Table 4.
Relative density, porosity, and Vickers hardness of the TiH2 samples and from HDH powders from previous studies.
| Ti powder Type | Alloy | Relative Density (%) | Total Porosity (%) | Closed Porosity (%) | Hardness HV30 | Oxygen Content |
|---|---|---|---|---|---|---|
| HDH [17] | Ti-7Fe (PM) | 94.7 | 5.27 | 2.66 | 308 ± 12 | - |
| Ti-7Fe (Extruded) | 100 | - | - | 325 ± 12 | - | |
| TiH2 | Ti-7Fe (PM) | 96.01 | 3.59 | 1.64 | 286 ± 10 | 0.415 ± 0.018 |
| Ti-7Fe-3Al (PM) | 93.57 | 7.46 | 3.61 | 283 ± 16 | 0.409 ± 0.03 | |
| Ti-7Fe-5Cr (PM) | 97.46 | 1.85 | 1.01 | 306 ± 8 | 0.45 ± 0.005 | |
| As-cast [29] | Ti-6Al-4V | - | - | - | 340 ± 6 | 0.17 |
| CP Ti | 200 ± 5 | 0.15 |
Table 5.
Calculated parabolic oxidation rate constant Kp for different alloys and temperatures according to Wanger theory of oxidation.
Table 5.
Calculated parabolic oxidation rate constant Kp for different alloys and temperatures according to Wanger theory of oxidation.
| Composition | Ti-7Fe | Ti-7Fe-3Al | Ti-7Fe-5Cr | |||
|---|---|---|---|---|---|---|
| Temperature (°C) | 500 | 600 | 500 | 600 | 500 | 600 |
| Kp (mg2∙cm−4∙h−1) | 0.0014 | 0.17 | 4.4 × 10⁻⁴ | 0.1 | 0.0012 | 0.39 |
| R-square fit of Kp | 0.9834 | 0.9963 | 0.9627 | 0.9866 | 0.9784 | 0.9864 |
Table 6.
Calculated oxidation rate constant Kp for different alloys and temperatures according to Monceau et al. [35] oxidation procedure.
Table 6.
Calculated oxidation rate constant Kp for different alloys and temperatures according to Monceau et al. [35] oxidation procedure.
| Composition | Ti-7Fe | Ti-7Fe-3Al | Ti-7Fe-5Cr | |||
|---|---|---|---|---|---|---|
| Temperature (°C) | 500 | 600 | 500 | 600 | 500 | 600 |
| * Kp (mg2∙cm−4∙h−1) | 0.0027 | 0.198 | 0.0014 | 0.181 | 0.0025 | 0.642 |
| R-square fit of * Kp | 0.9983 | 0.9983 | 0.9911 | 0.9998 | 0.9967 | 0.9996 |
*Kp: Oxidation rate constant according to Monceau procedure.
Table 7.
Corrosion parameters of potentiodynamic polarization alloys in Harrison solution at room temperature.
Table 7.
Corrosion parameters of potentiodynamic polarization alloys in Harrison solution at room temperature.
| Ti | Ti-7Fe | Ti-7Fe-5Cr | Ti-7Fe-3Al | Ti-6Al-4V | |
|---|---|---|---|---|---|
| EOCP (V) | 0.09 ± 0.04 | 0.1 ± 0.02 | 0.1 ± 0.02 | 0.11 ± 0.01 | 0.11 ± 0.02 |
| Icorr/V | 0.0085 ± 0.0026 | 0.023 ± 0.0092 | 0.027 ± 0.01 | 0.019 ± 0.01 | 0.0101 ± 0.0018 |
| Ecorr/V | 0.062 ± 0.043 | 0.043 ± 0.054 | 0.034 ± 0.021 | 0.05 ± 0.042 | 0.074 ± 0.023 |
© 2020 by the authors. Licensee MDPI, Basel, Switzerland. This article is an open access article distributed under the terms and conditions of the Creative Commons Attribution (CC BY) license (http://creativecommons.org/licenses/by/4.0/).
Share and Cite
MDPI and ACS Style
Reverte, E.; Tsipas, S.A.; Gordo, E. Oxidation and Corrosion Behavior of New Low-Cost Ti-7Fe-3Al and Ti-7Fe-5Cr Alloys from Titanium Hydride Powders. Metals 2020, 10, 254. https://doi.org/10.3390/met10020254
AMA Style
Reverte E, Tsipas SA, Gordo E. Oxidation and Corrosion Behavior of New Low-Cost Ti-7Fe-3Al and Ti-7Fe-5Cr Alloys from Titanium Hydride Powders. Metals. 2020; 10(2):254. https://doi.org/10.3390/met10020254
Chicago/Turabian StyleReverte, Eduardo, Sophia A. Tsipas, and Elena Gordo. 2020. "Oxidation and Corrosion Behavior of New Low-Cost Ti-7Fe-3Al and Ti-7Fe-5Cr Alloys from Titanium Hydride Powders" Metals 10, no. 2: 254. https://doi.org/10.3390/met10020254
Note that from the first issue of 2016, this journal uses article numbers instead of page numbers. See further details here.