Article

A Methodology for Incorporating the Effect of Grain Size on the Energy Efficiency Coefficient for Fatigue Crack Initiation Estimation in Polycrystalline Metal

1
School of Industrial Engineering, Purdue University, West Lafayette, IN 47907, USA
2
The Timken Company, North Canton, OH 44720, USA
3
Birck Nanotechnology Center, Purdue University, West Lafayette, IN 47907, USA
*
Author to whom correspondence should be addressed.
Metals 2020, 10(3), 355; https://doi.org/10.3390/met10030355
Submission received: 3 February 2020 / Revised: 3 March 2020 / Accepted: 5 March 2020 / Published: 9 March 2020
(This article belongs to the Special Issue Fatigue Life Prediction of Metallic Materials)

Abstract

:
Estimating fatigue crack initiation of applied loading is challenging due to the large number of individual entities within a microstructure that could affect the accumulation of dislocations. In order to improve the prediction accuracy of fatigue crack initiation models, it is essential to accurately compute the energy dissipated into the microstructure per fatigue loading cycle. The extent of the energy dissipated within the microstructure as a fraction of the overall energy imparted by loading has previously been defined as the ‘energy efficiency coefficient’. This work studied the energy efficiency coefficient as a factor in the measurement of accumulated plastic strain energy stored at the crack initiation site during cyclic loading. In particular, the crystal plasticity constitutive formulation was known as ’length scale independent’ previously. As a result, a semi-empirical approach was presented whereby the potential effect of grain size can be accounted for without the use of a strain gradient plasticity approach. The randomized representative volume elements were created based on the experimental analysis of grain size distribution. The work was aimed at capturing some of the effects of grain size and utilizing them to complete a semi-empirical estimation of crack initiation in polycrystalline materials. The computational methodology ensured the representative of microstructural properties, including the elastic constant and critical resolved shear stress via appreciable fit achieved with the empirical tensile test results. Crystal plasticity finite element modeling was incorporated into a finite element code to estimate the potential for crack initiation. The energy efficiency coefficient was computed for a class of material with grain size to C11000 electrolytic tough pitch (ETP) copper. This methodology can improve fatigue crack initiation life estimation and advance the fundamental study of energy efficiency coefficient during fatigue crack initiation.

1. Introduction

It is crucial to study fatigue crack initiation, since it can account for a large part of fatigue life— especially for low loading amplitude and high cycle fatigue commonly seen in real world. Choi and Liu estimated that the ratio of crack initiation to crack propagation is at least 50% for samples with finish hard machined surfaces [1]. In Mughrabi’s review, the fatigue crack initiation occupied a major fraction (over 60%) of fatigue life for low-carbon steel [2]. Kazymyrovych et al. observed that fatigue crack initiation was more than 90% of fatigue life for very high cycle fatigue [3]. However, few existing fatigue crack initiation models can accurately predict the life spent in the crack initiation stage.
To improve the accuracy of fatigue life estimation, it is important to consider the effect of microstructure. Polycrystalline metals are mechanically anisotropic with different microstructures and different orientations. The heterogeneous grain size distributions lead to variation in fatigue lives in different regions, which makes life prediction difficult. Everaerts et al. observed that Ti6Al4V samples with an average alpha grain size of 5 µm spent around 10 times the number of loading cycles in crack the initiation stage compared to samples with an average alpha grain size of 10 µm [4]. Cruzado found that for low cyclic loading fatigue in Iconel 718® samples, the crack initiation cycle is dependent on the microstructure, with around a difference of 6   × 10 4 when comparing the grain sizes in the ASTM 8.5 and three standards [5]. Alexandre el al. reviewed fatigue crack initiation lives for grain sizes ranging from 1 to 1000 µm and recorded that initiation life can deviate from 10 4 to 10 7 fatigue cycles [6]. As a result, the effect of grain size has become an important aspect to study.
Crystal plasticity finite element method (CPFEM) is a useful tool for investigating the deformation of crystalline aggregate caused by the anisotropy of the microstructure. This method allows the discretization of the microstructure and the incorporation of crystal plasticity formulation and deformation kinematics into different regions within the microstructure. Prithivirajan et al. used CPFEM to characterize the effect of pore size on the initiation of stress concentration and cracking [7]. Minaii et al. showed that the grain size effects of cumulative plastic slip and crack initiation are highly dependent on load conditions [8]. Signor et al. illustrated that the energy is not evenly distributed. Instead, the energy tends to concentrate in zones such as persistent slip bands that eventually lead to defect accumulation and crack initiation [9]. Manonukul and Dunne used CPFEM to investigate high and low cycle fatigue crack initiation in nickel alloy and reported that critical resolved shear stress and critical accumulated slip are important fatigue crack indicators [10]. Hochhalter et al. factored slip localization, grain orientation, and particle aspect ratio into CPFEM and emphasized that local stress and strain are essential to predict crack initiation [11].
Modern advances in computational power allow for a more accurate computation of the energy dissipation into the material microstructure. Such advances support the development of computationally-driven models that will help reduce or explain the large variability inherent to fatigue crack initiation estimations. This is the primary motivation for this manuscript.
The energy efficiency coefficient is a factor to measure the accumulate efficiency of energy for defects at the crack initiation site. Historically, the seemly ‘stochastic’ nature of fatigue crack initiation models can be modified to help achieve a deterministic solution by incorporating this sort of an energy efficiency coefficient, as studied by several researchers [12,13,14,15,16,17,18,19]. Bhat and Fine proposed one of the early fatigue crack initiation models based on critical energy change during cyclic loading [12]. Tanaka and Mura [13] proposed that cracks were initiated as the energy reaches a critical value, and elaborated into a representative model written in Equation (1)
N i = γ s ρ t m ( Δ τ 2 ) ( Δ γ p 2 )
where N i is the crack initiation life (cycles), γ s is the surface energy (J/ m 2 ), ρ is the energy efficiency coefficient, t m is the maximum bandwidth,   Δ τ 2 is the shear stress amplitude (MPa), and Δ γ p 2 is the plastic slip per cycle. Based on this model, Fine and Bhat reported that an increase of the energy efficiency factor caused by an increase in the environmental temperature during fatigue testing [14]. Voothaluru and Liu [15,16] first demonstrated the use of a crystal plasticity finite element model to estimate the energy efficiency factor in copper. They showed that CPFEM is as an effective tool for quantifying the energy efficiency factor.
Following these studies, Wan et al. [20,21], Dabiri et al. [22], and Naderi et al. [23] also used CPFEM to study the effect of material microstructure on fatigue crack initiation life. Li et al. [24] studied the effect on microstructures that led to deviations in the energy efficiency factor. However, the implementation of the CPFE model is inherently length-scale-independent and cannot directly account for the variable effects created by length-scale changes in these microstructures. It would thus be of interest to investigate the effect of grain size by incorporating a modified material constant (in this paper consider critical resolved shear stress (CRSS)), as proposed method by Verma and Biswas [25], to further improve the accuracy of prediction of fatigue crack prediction.
The aim of the present work is to study the energy efficiency coefficient during fatigue crack initiation. The potential effect of grain size on polycrystalline copper is investigated using CPFEM. Since the crystal plasticity constitutive formulation is length scale independent, a semi-empirical approach was presented whereby the potential effect of grain size can be accounted for without the use of a strain gradient plasticity approach. This approach is expected to improve fatigue crack initiation life estimation and advance the fundamental study of energy efficiency coefficient during fatigue crack initiation.

2. Methods

Polycrystalline copper samples with two different grain size distributions were prepared for push–pull fatigue and tensile testing. The experimental procedures are explained in Section 2.1, Section 2.2 and Section 2.3. The crystal plasticity finite element model and the computational framework are summarized in Section 2.4 as user material subroutine (UMAT) constitutive codes in ABAQUS. Based on the tensile tests results, the elastic constant and critical resolved shear stress were determined using CPFEM, which is elaborated upon in Section 2.5. Finally, the authors’ semi-empirical approach to determine the energy efficiency coefficient for variations of different material grade is discussed in Section 2.6.

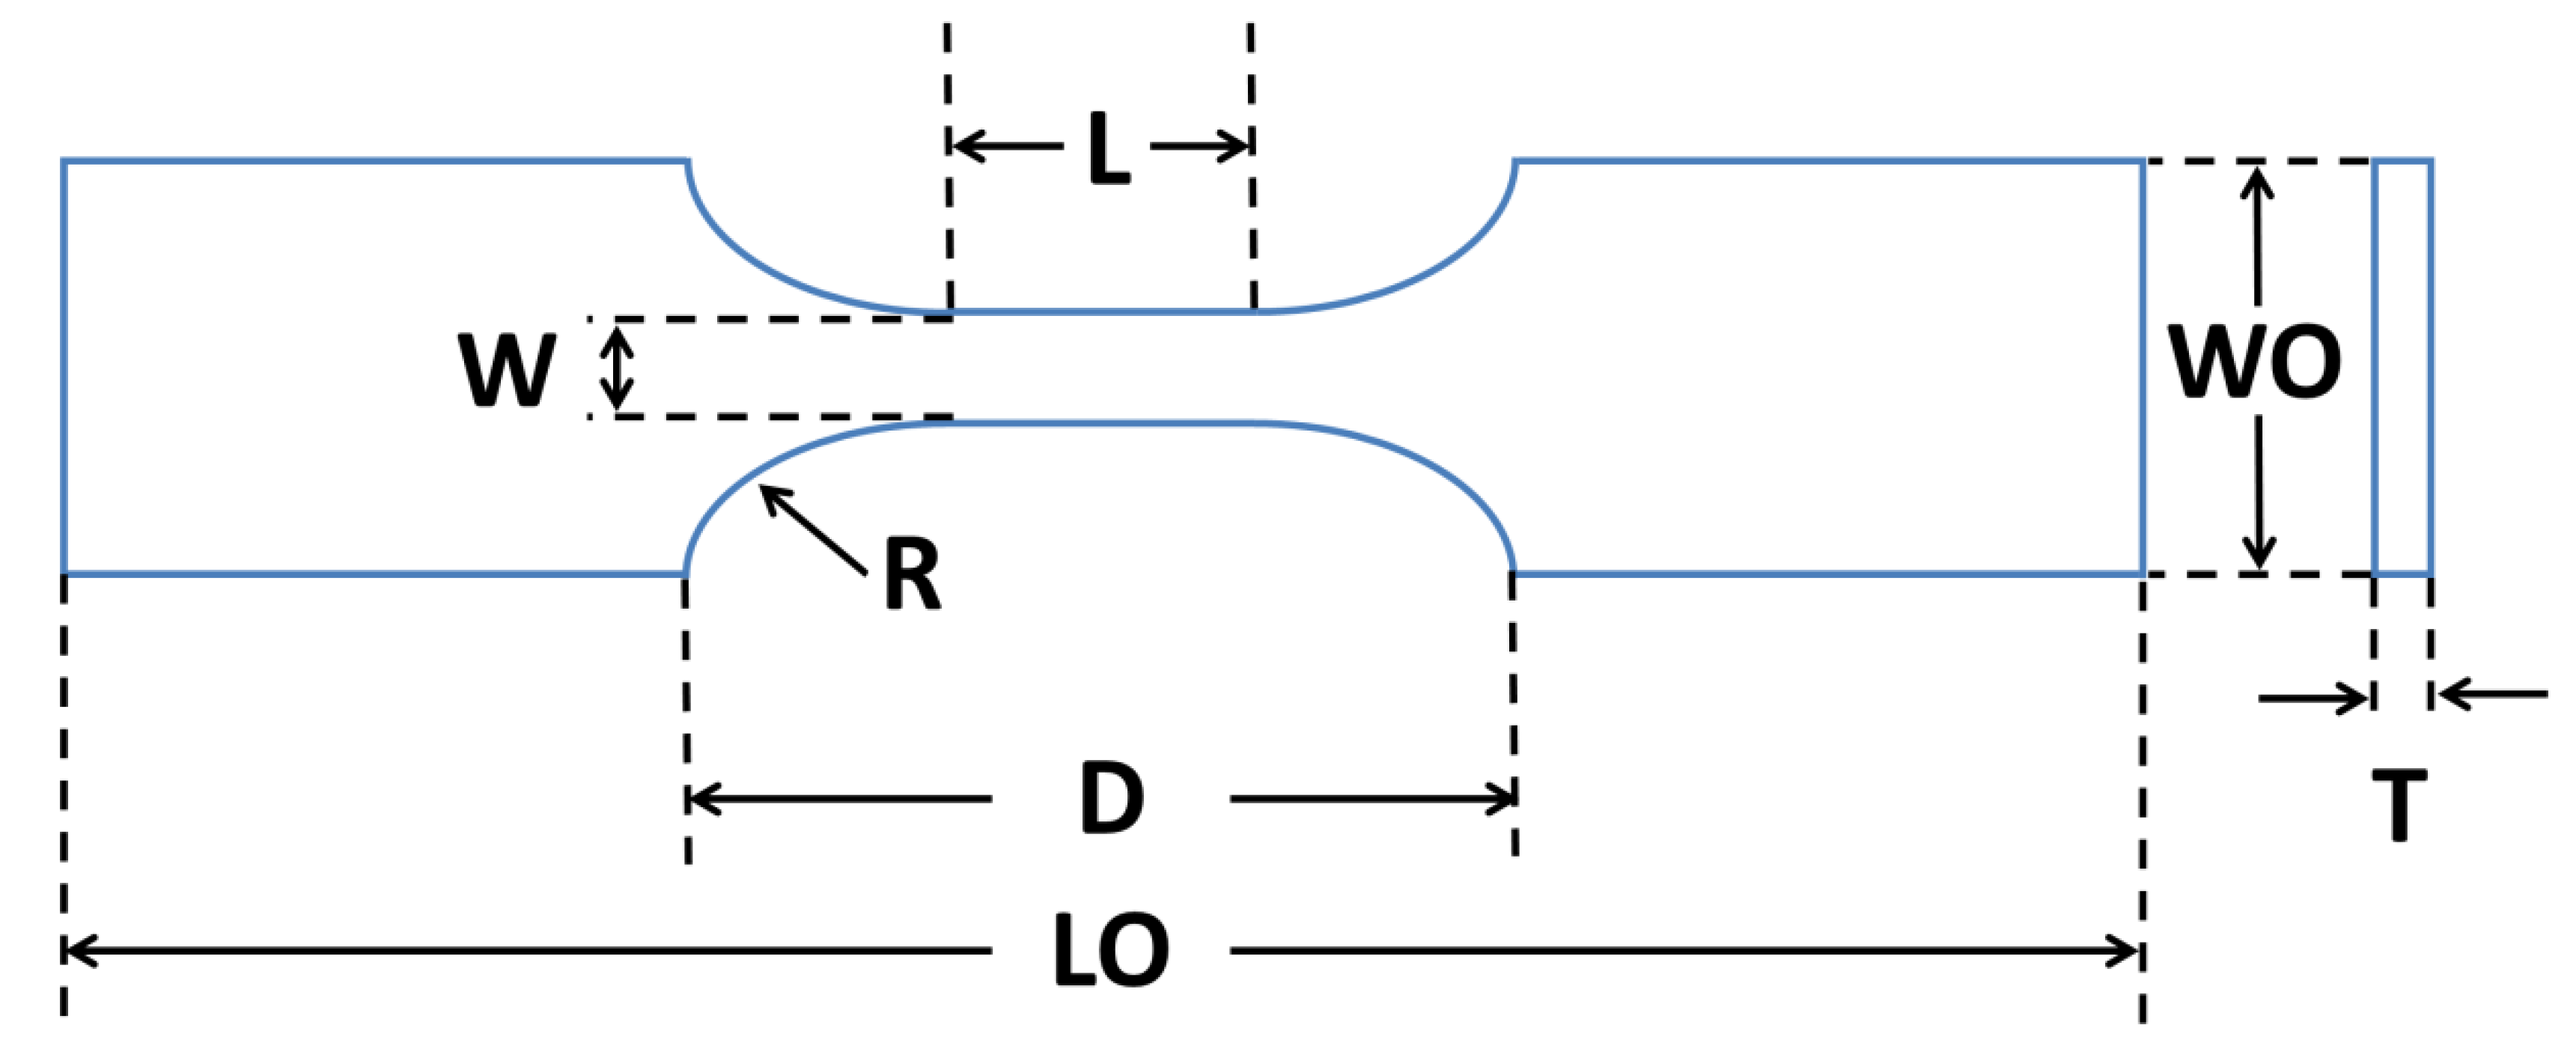
2.1. Microstructure Characterization and Sample Design

An electrolytic tough pitch (ETP) sheet of Grade 110 polycrystalline copper sheet was used in this study. The sample preparation methods were based on a previous study [26]. The copper bar was cut into a dog-bone shape for fatigue and tensile tests by an end mill. The sample dimension was based on the ASTM E606 Standard [27], as shown in Figure 1 and Table 1. Variations in two different grain size distributions were achieved by the heat treatment methods described upon in Table 2. The coarse grain annealing samples had an average diameter of 104.2 μm and a standard deviation of 10 μm. The fine grain stress-relieved samples had an average diameter of 14.2 μm and standard deviation of 2 μm.

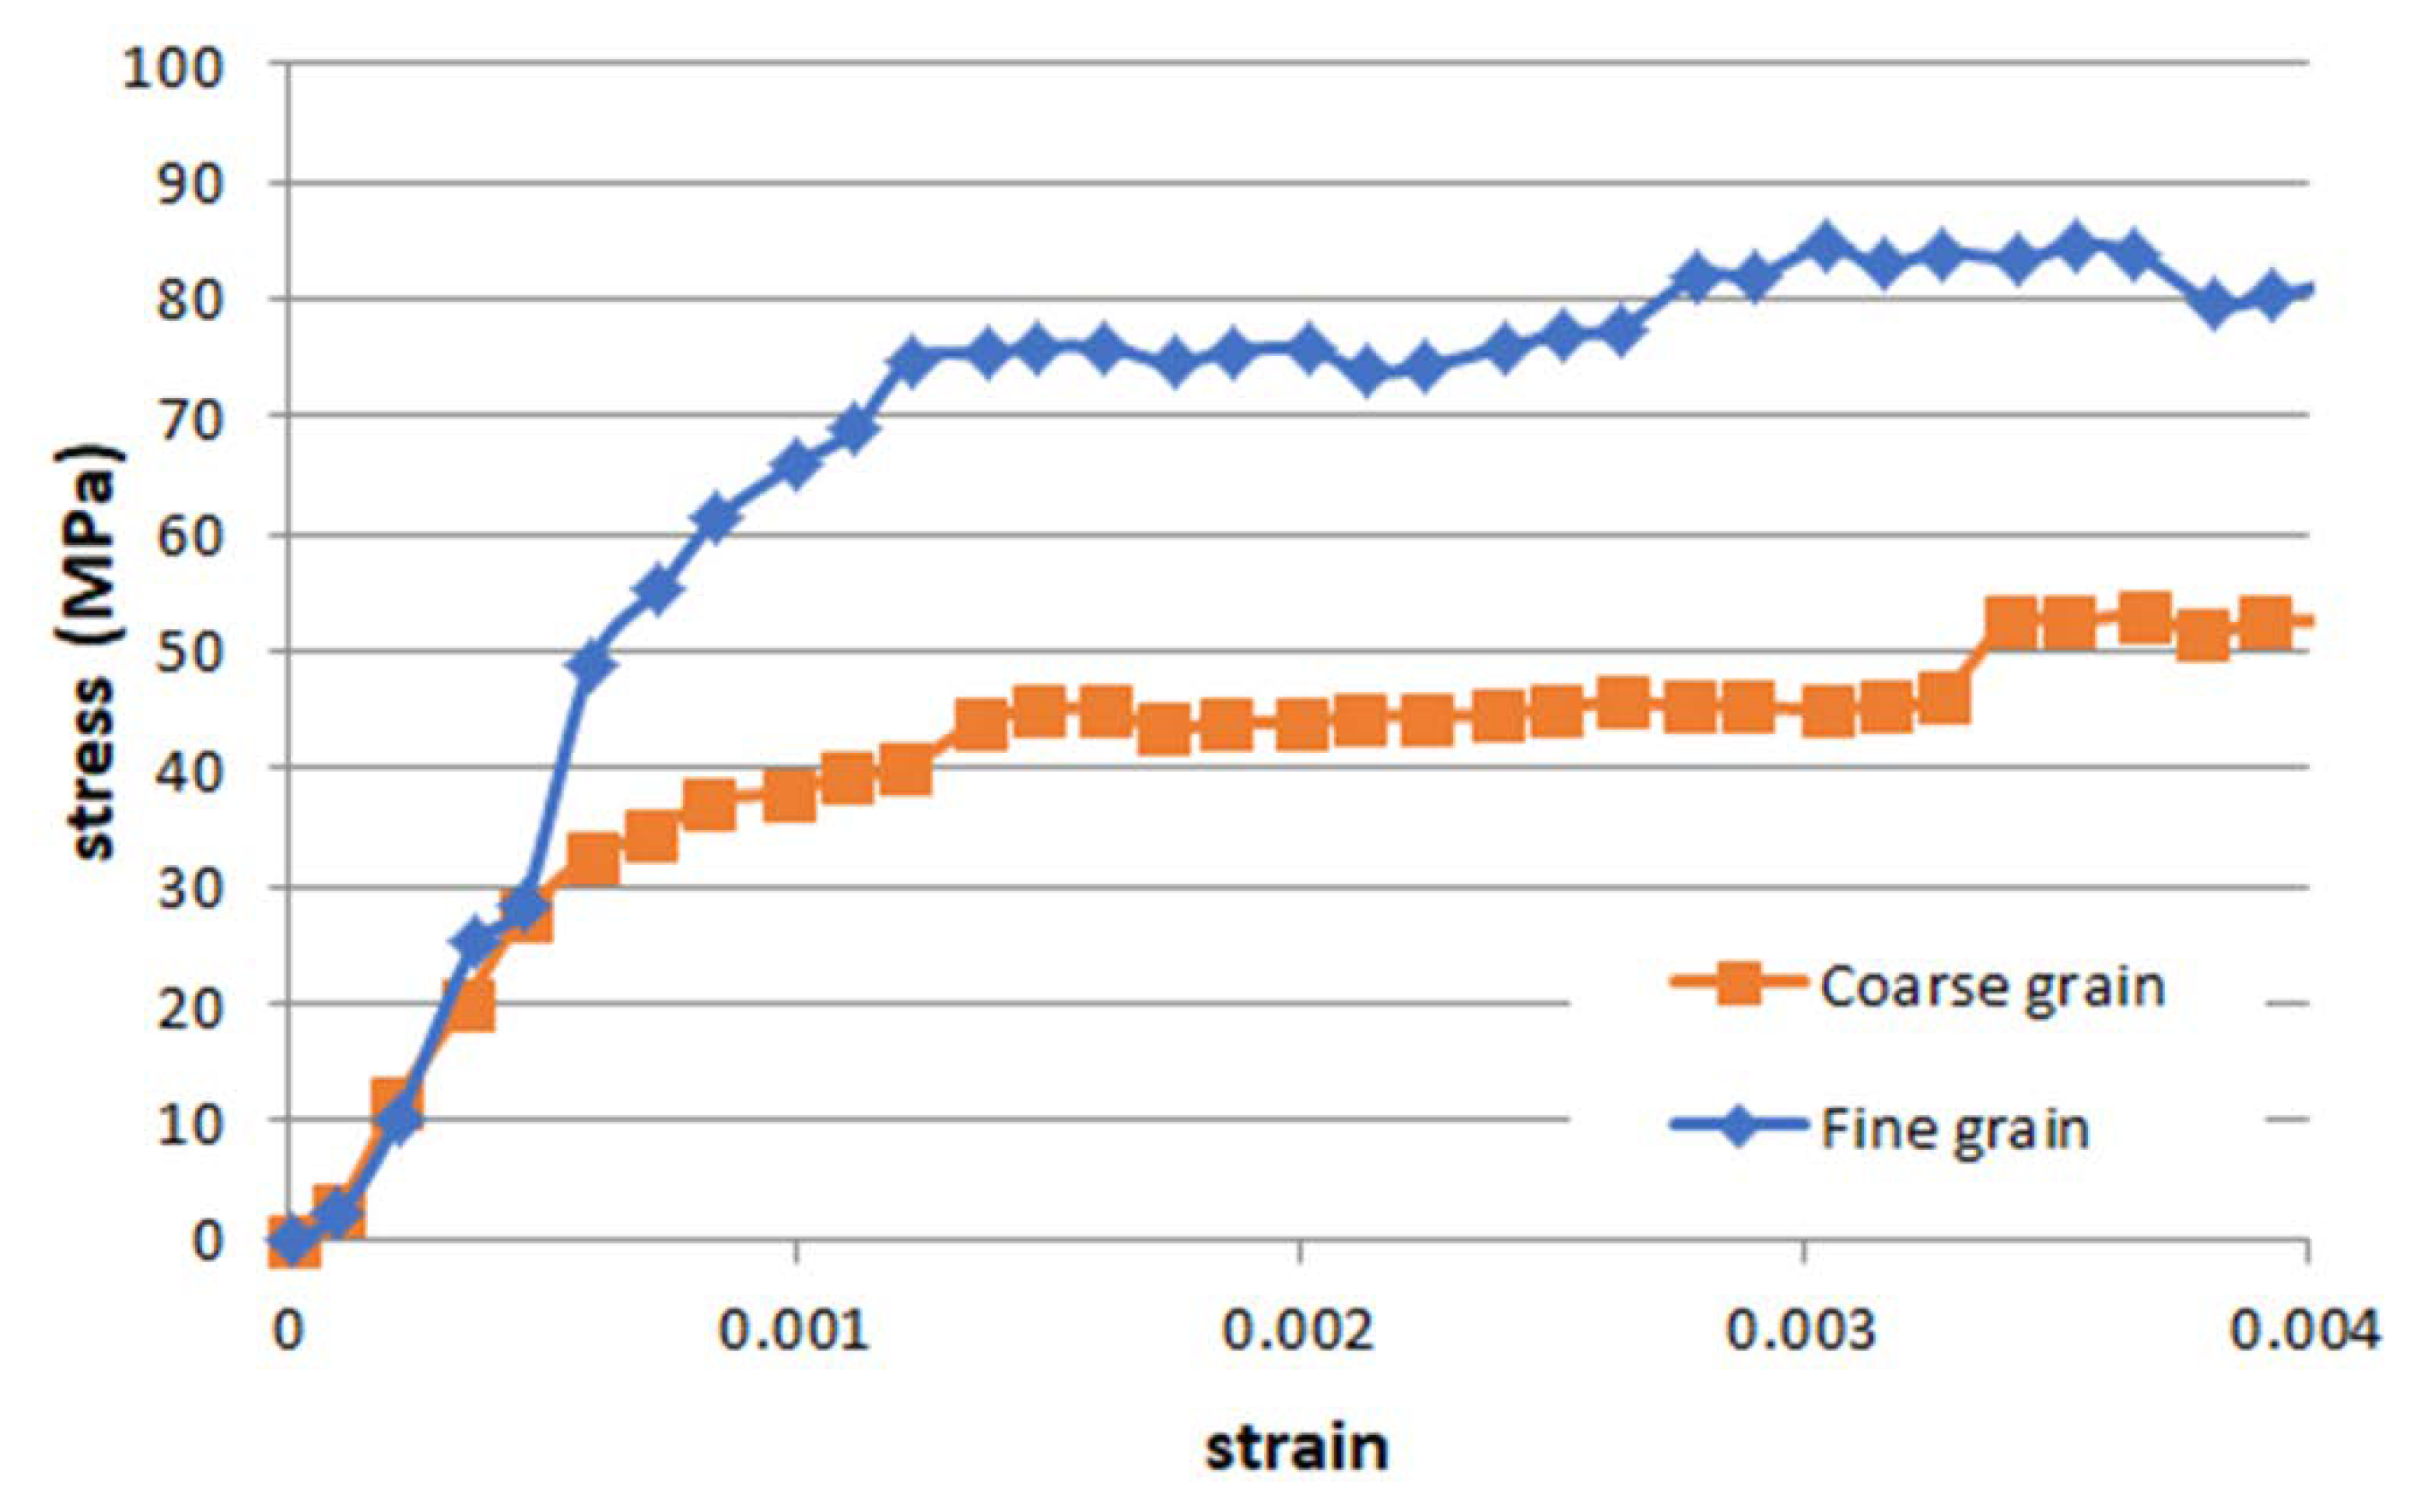
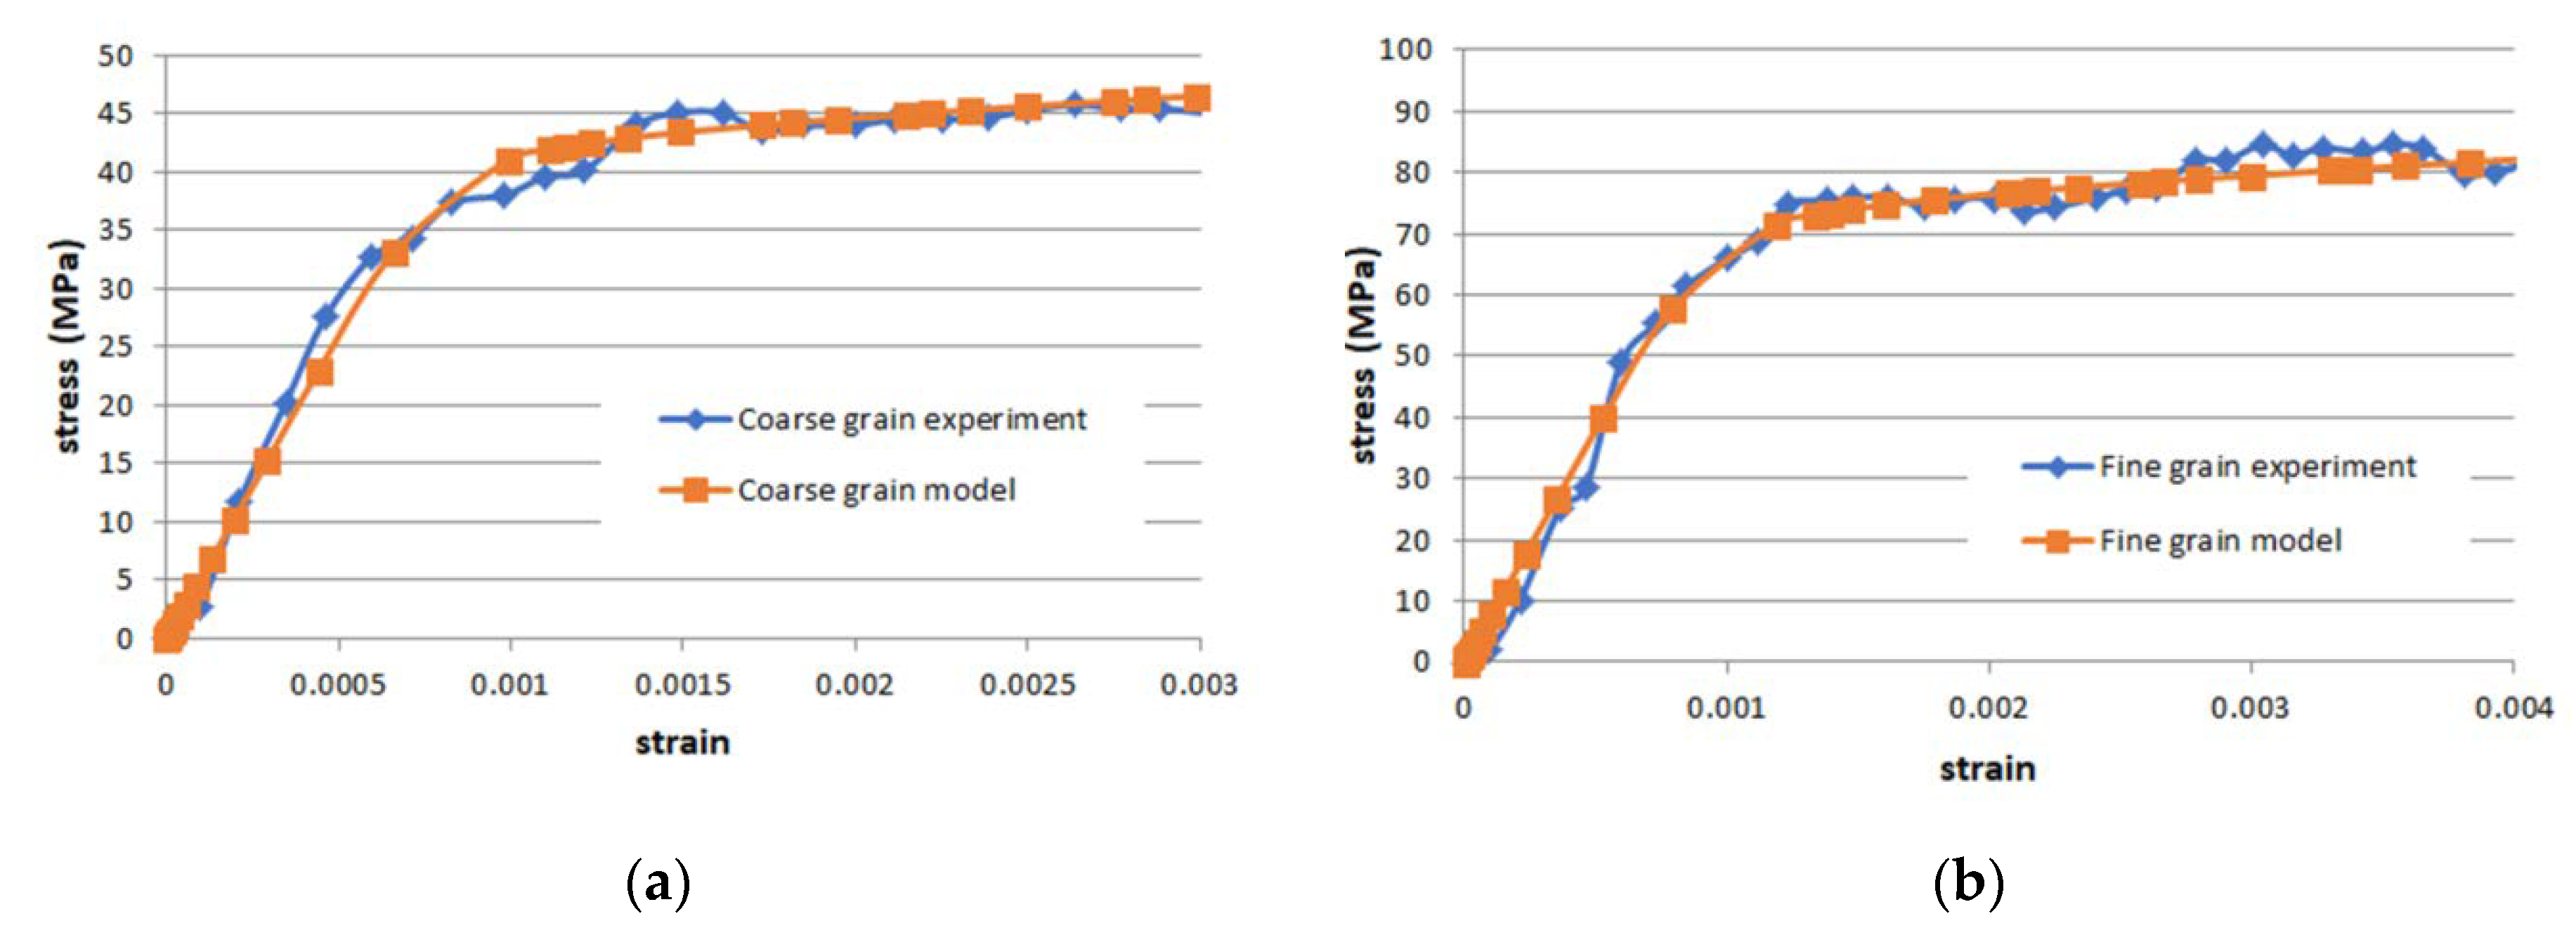
2.2. Tensile Testing

In order to determine the constitutive response of the two material grades, uniaxial tensile tests were carried out by employing an MTS uniaxial tensile testing machine. The experimental procedure was based on the ASTM E8 Standard [28]. The stress–strain response at each gauge section was measured by an extensometer. The recorded results of a small deformation region are shown in Figure 2.

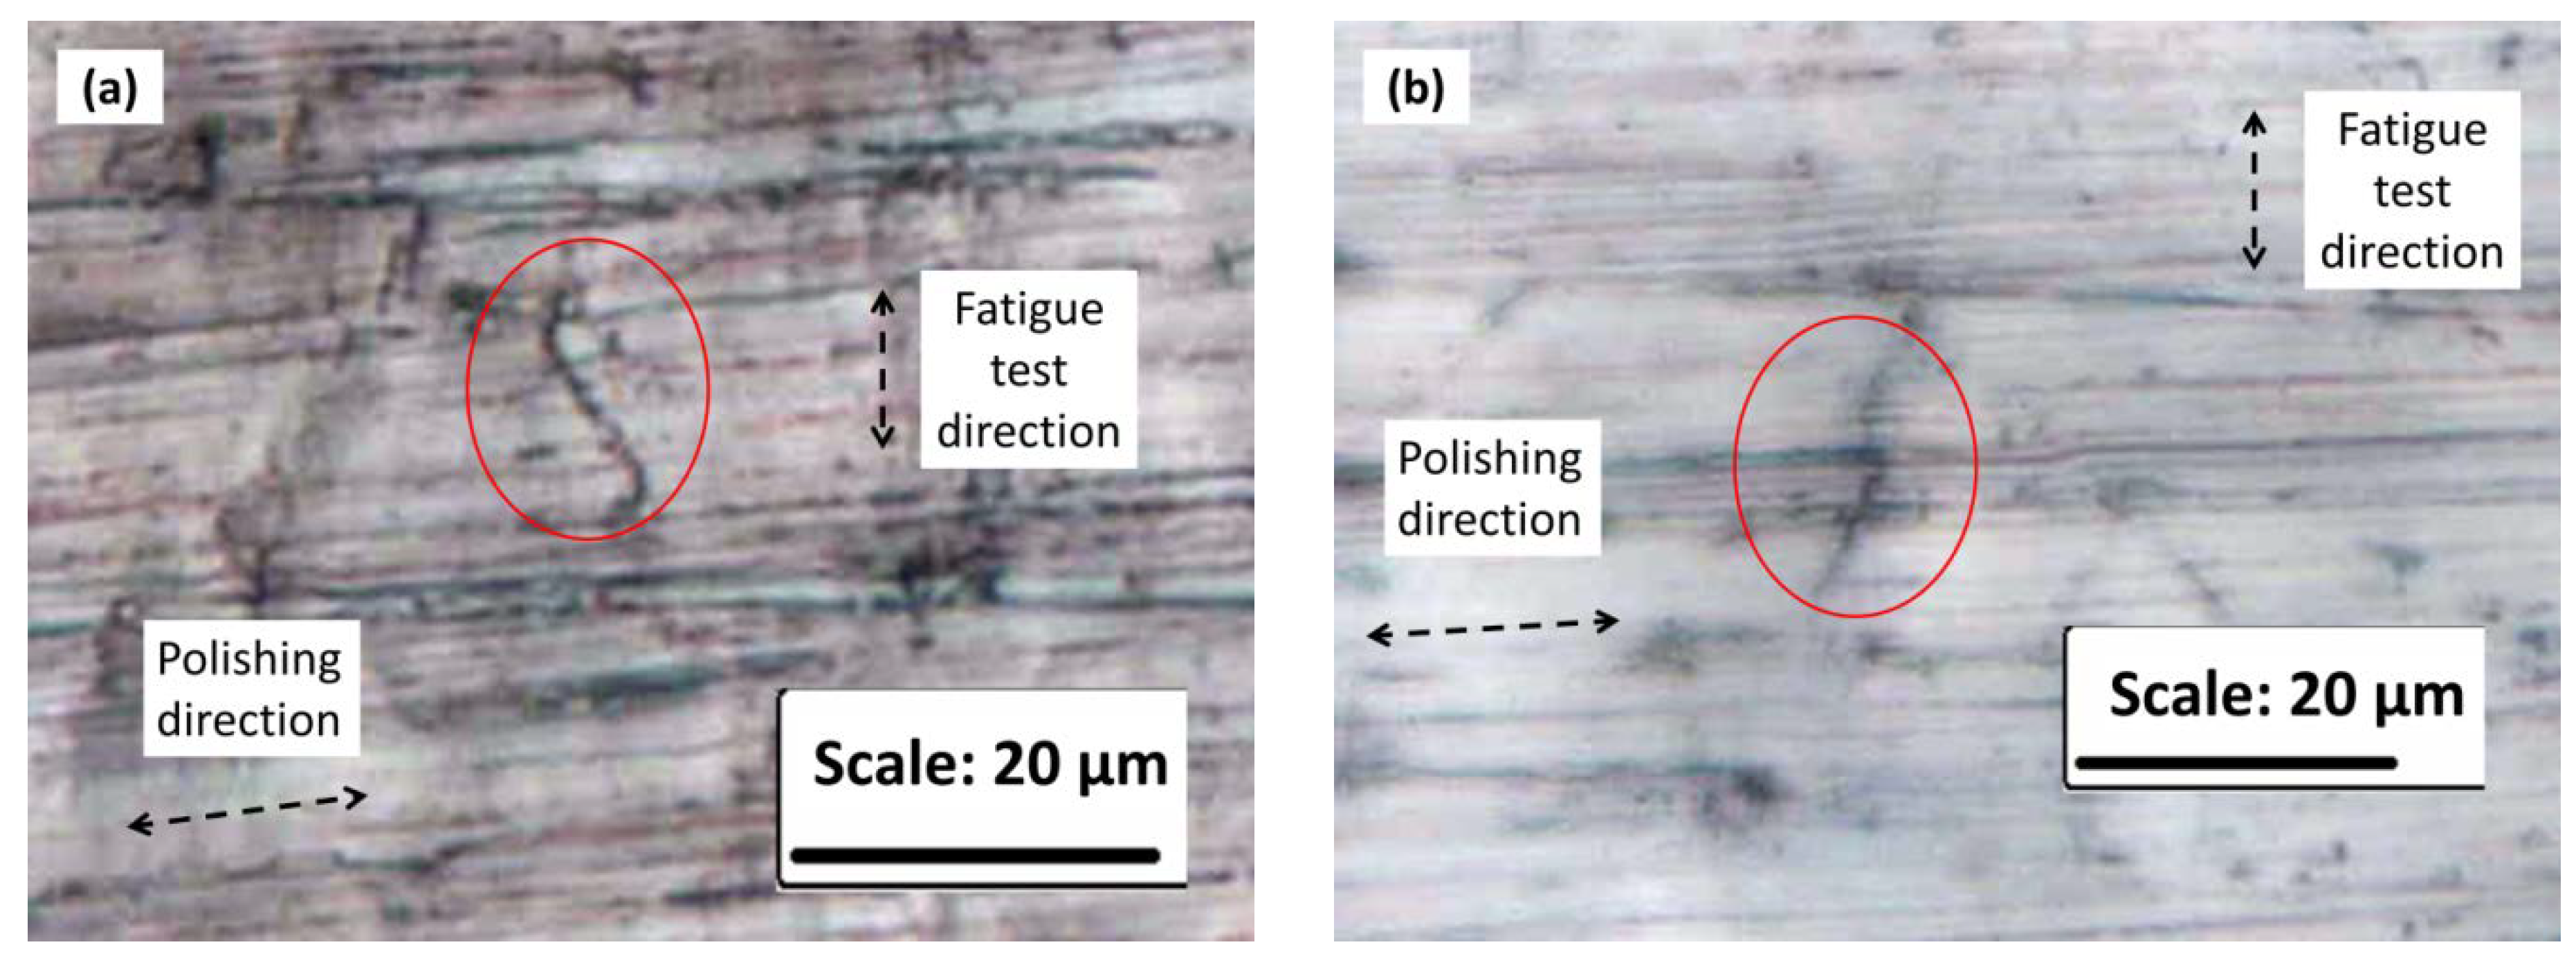
2.3. Fatigue Testing

Uniaxial completely reversed push–pull ( R = 1 ) tensile fatigue tests were performed by a hydraulic test machine from MTS, Eden Prairie, MN USA. The testing condition was 64 MPa with a constant frequency of 0.5 Hz. To obtain the initiation lives, the samples were hand-polished by carbide sandpaper with an ANSI grit of 400, 600, 800, 1200, or 2000, successively as specified in the ASTM E3 Standard [29]. The samples were then periodically examined with an optical microscope until crack initiation was observed. Ten samples were tested with each grain size to obtain the crack initiation life. ”Crack initiation” is defined as the fatigue cycle time at which the smallest crack can be observed through a (40 times) optical microscope. The results showed that cracks initiated at an average of 90 cycles for the coarse grain sample and at an average of 50,000 cycles for the fine grain sample, as shown in Figure 3.

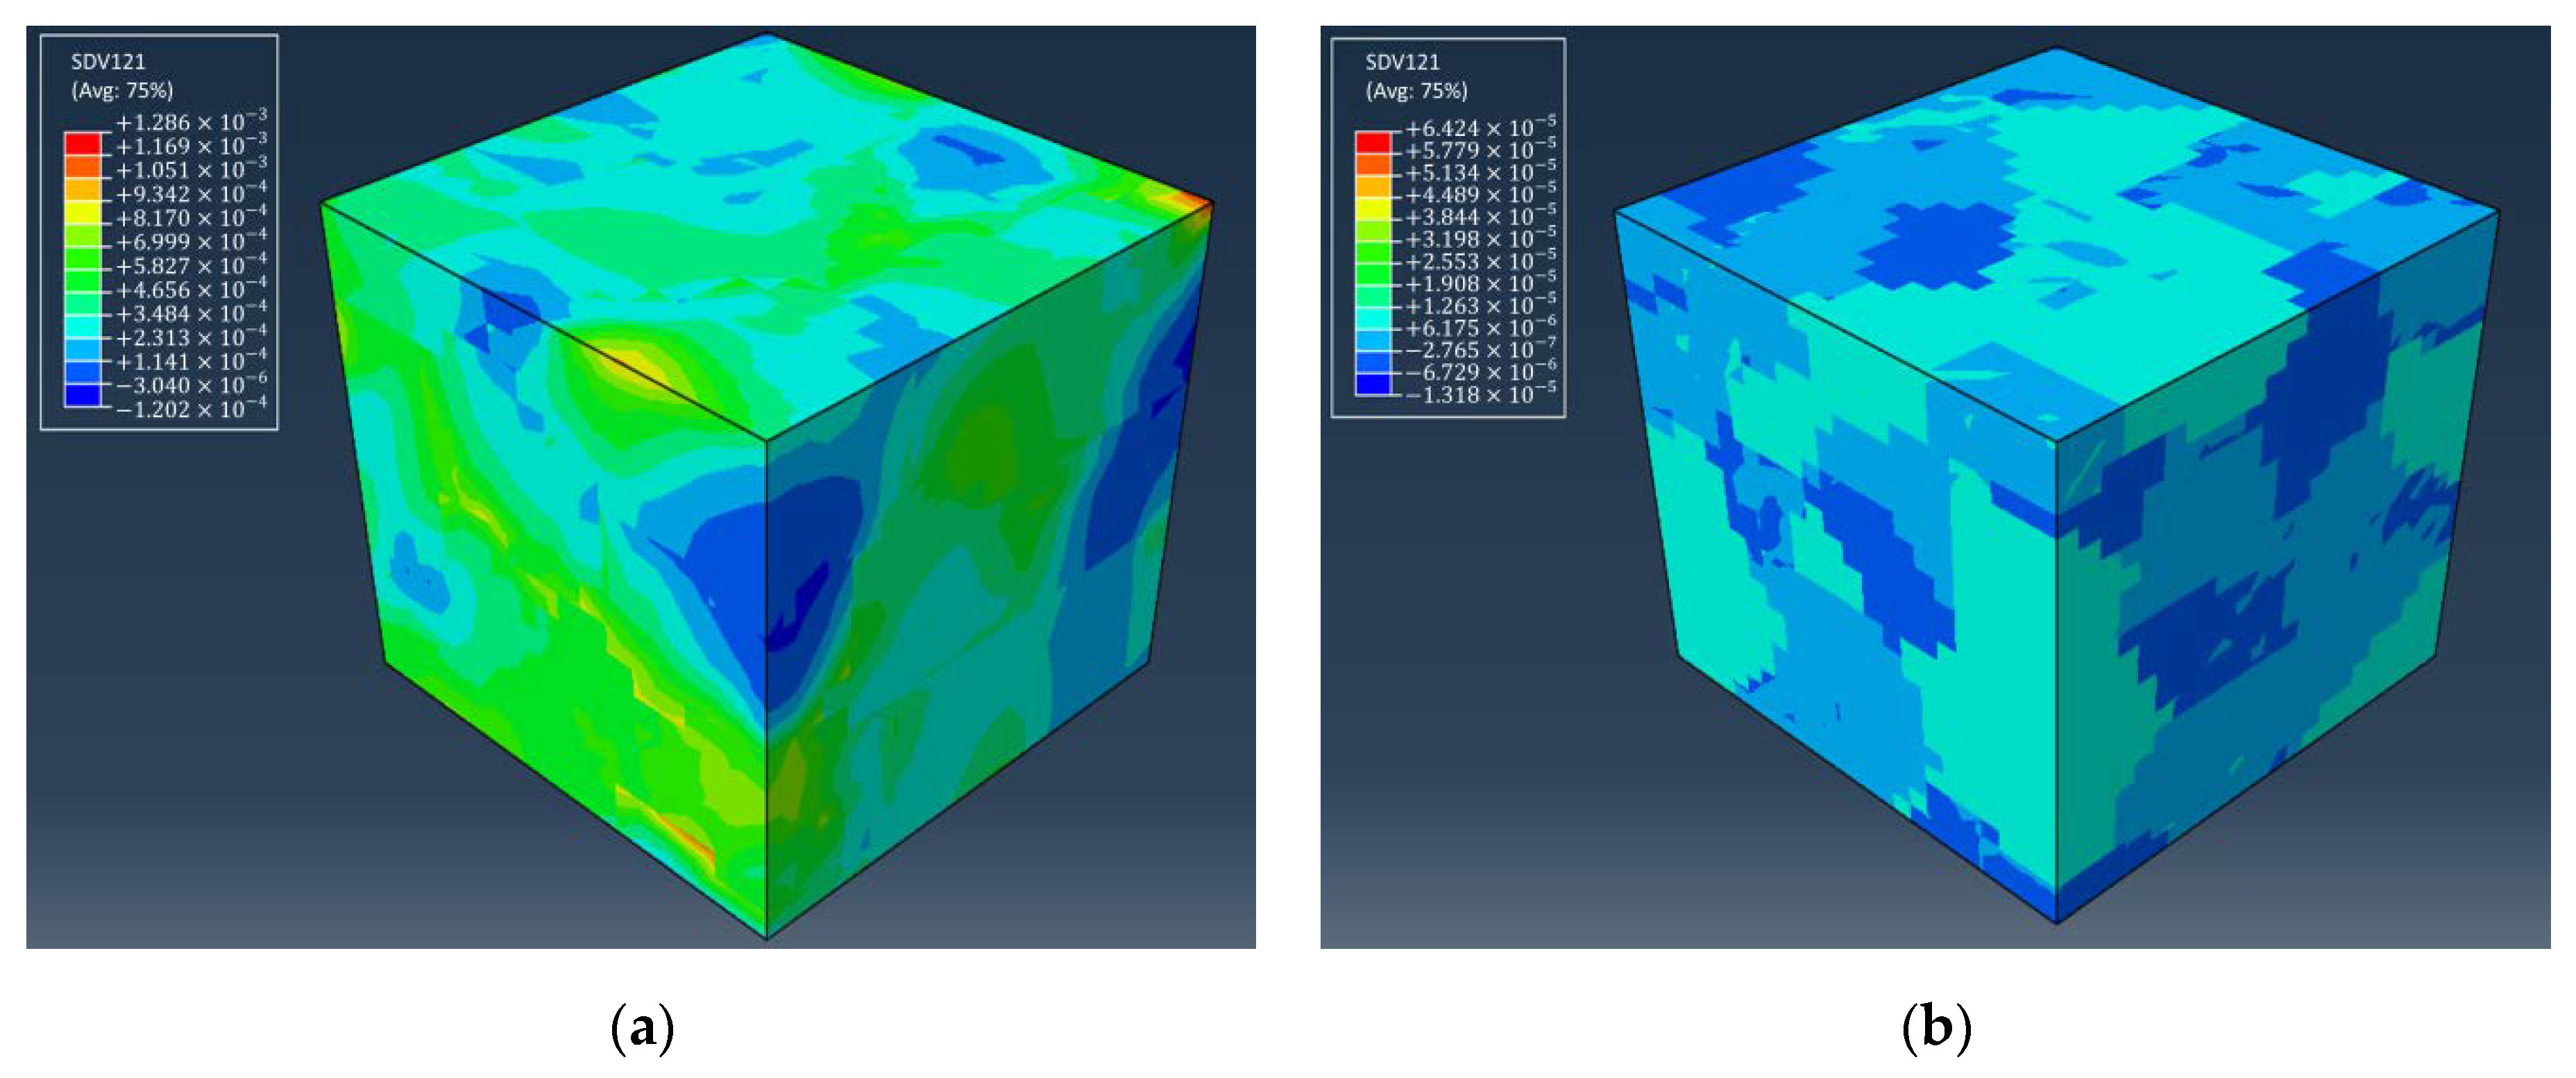
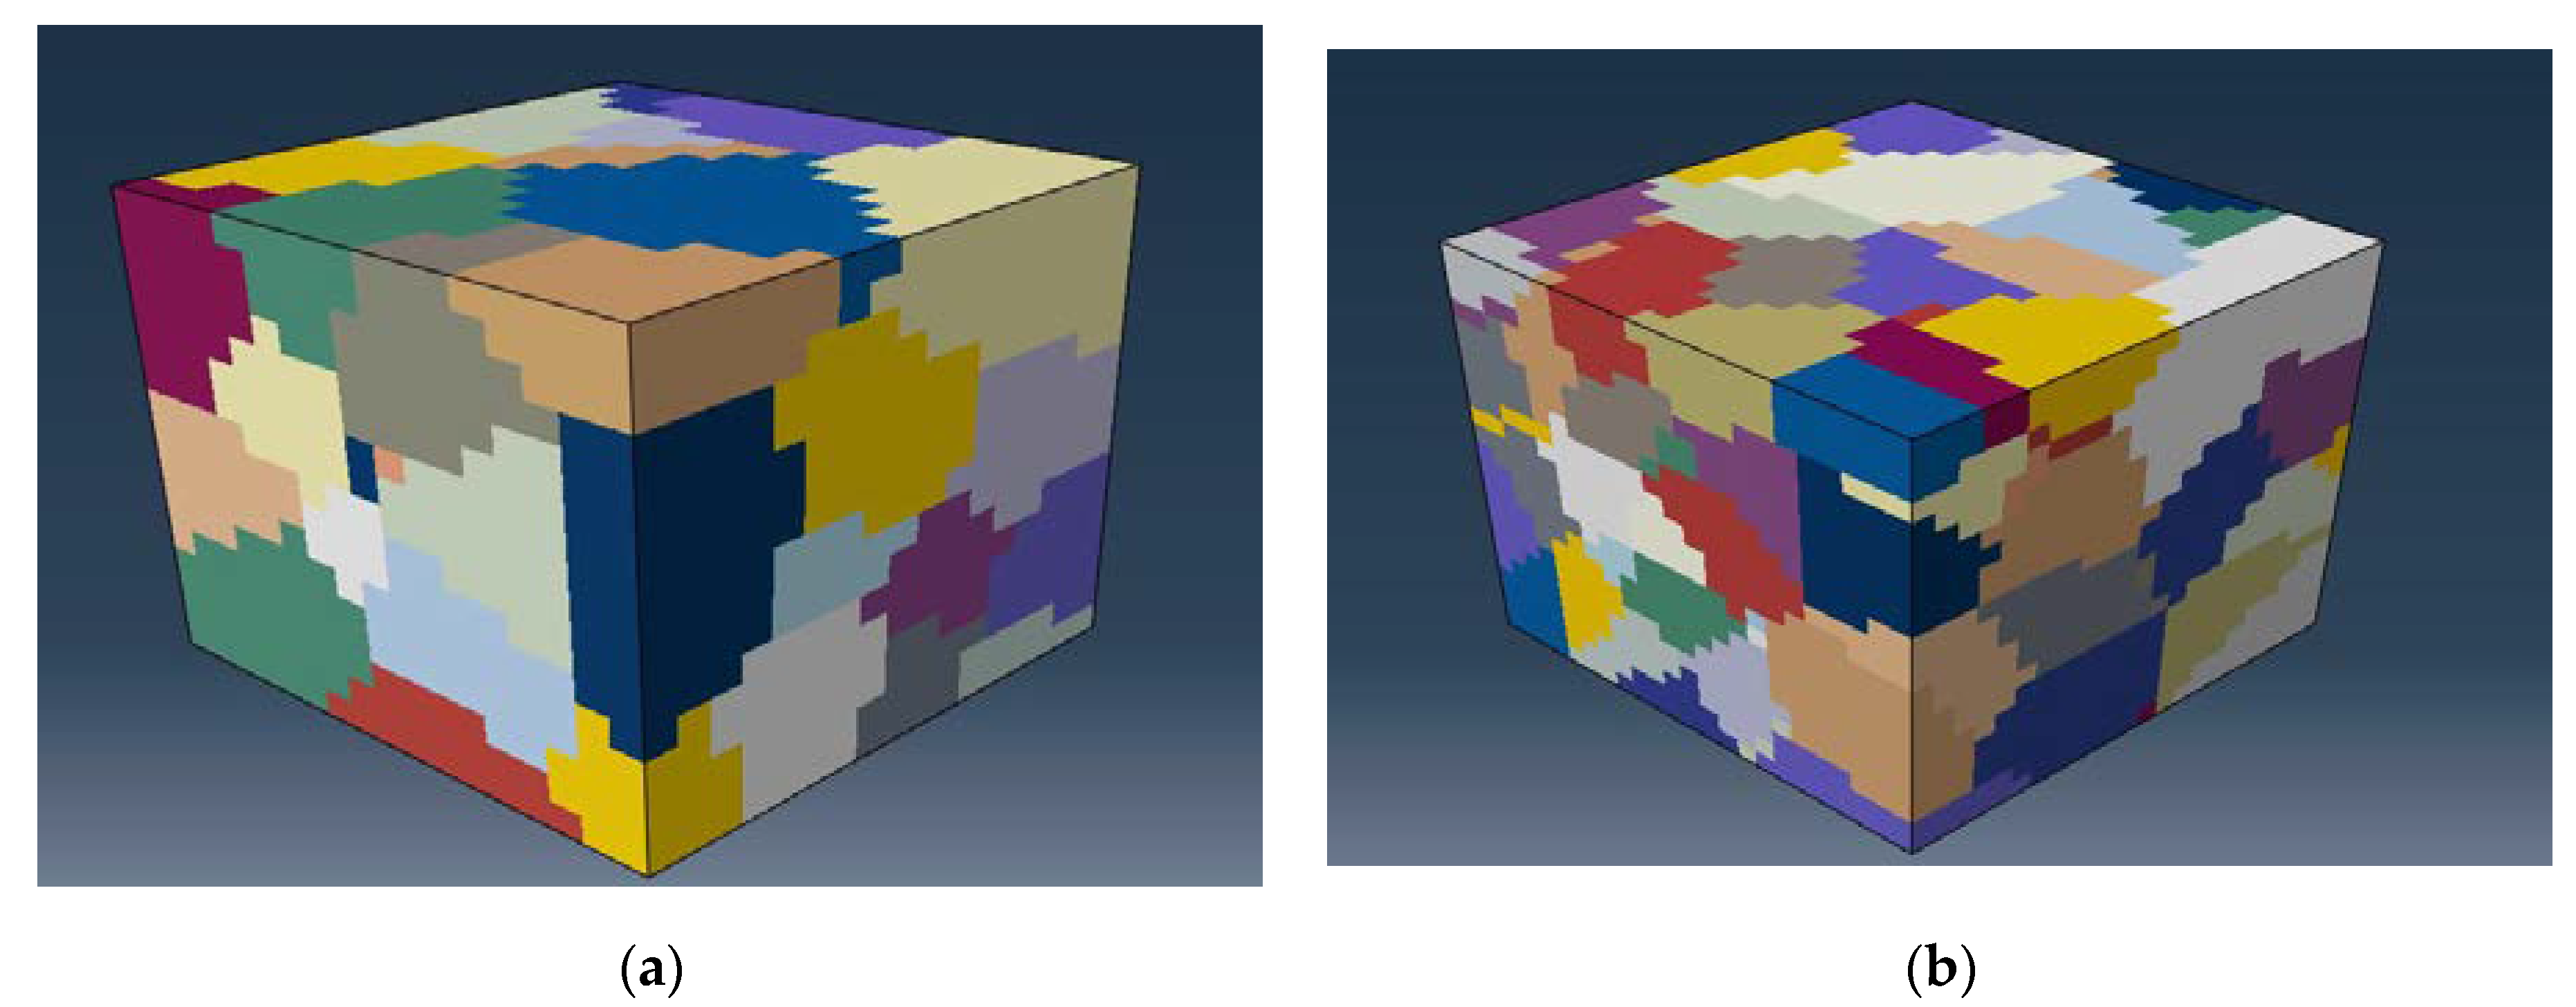
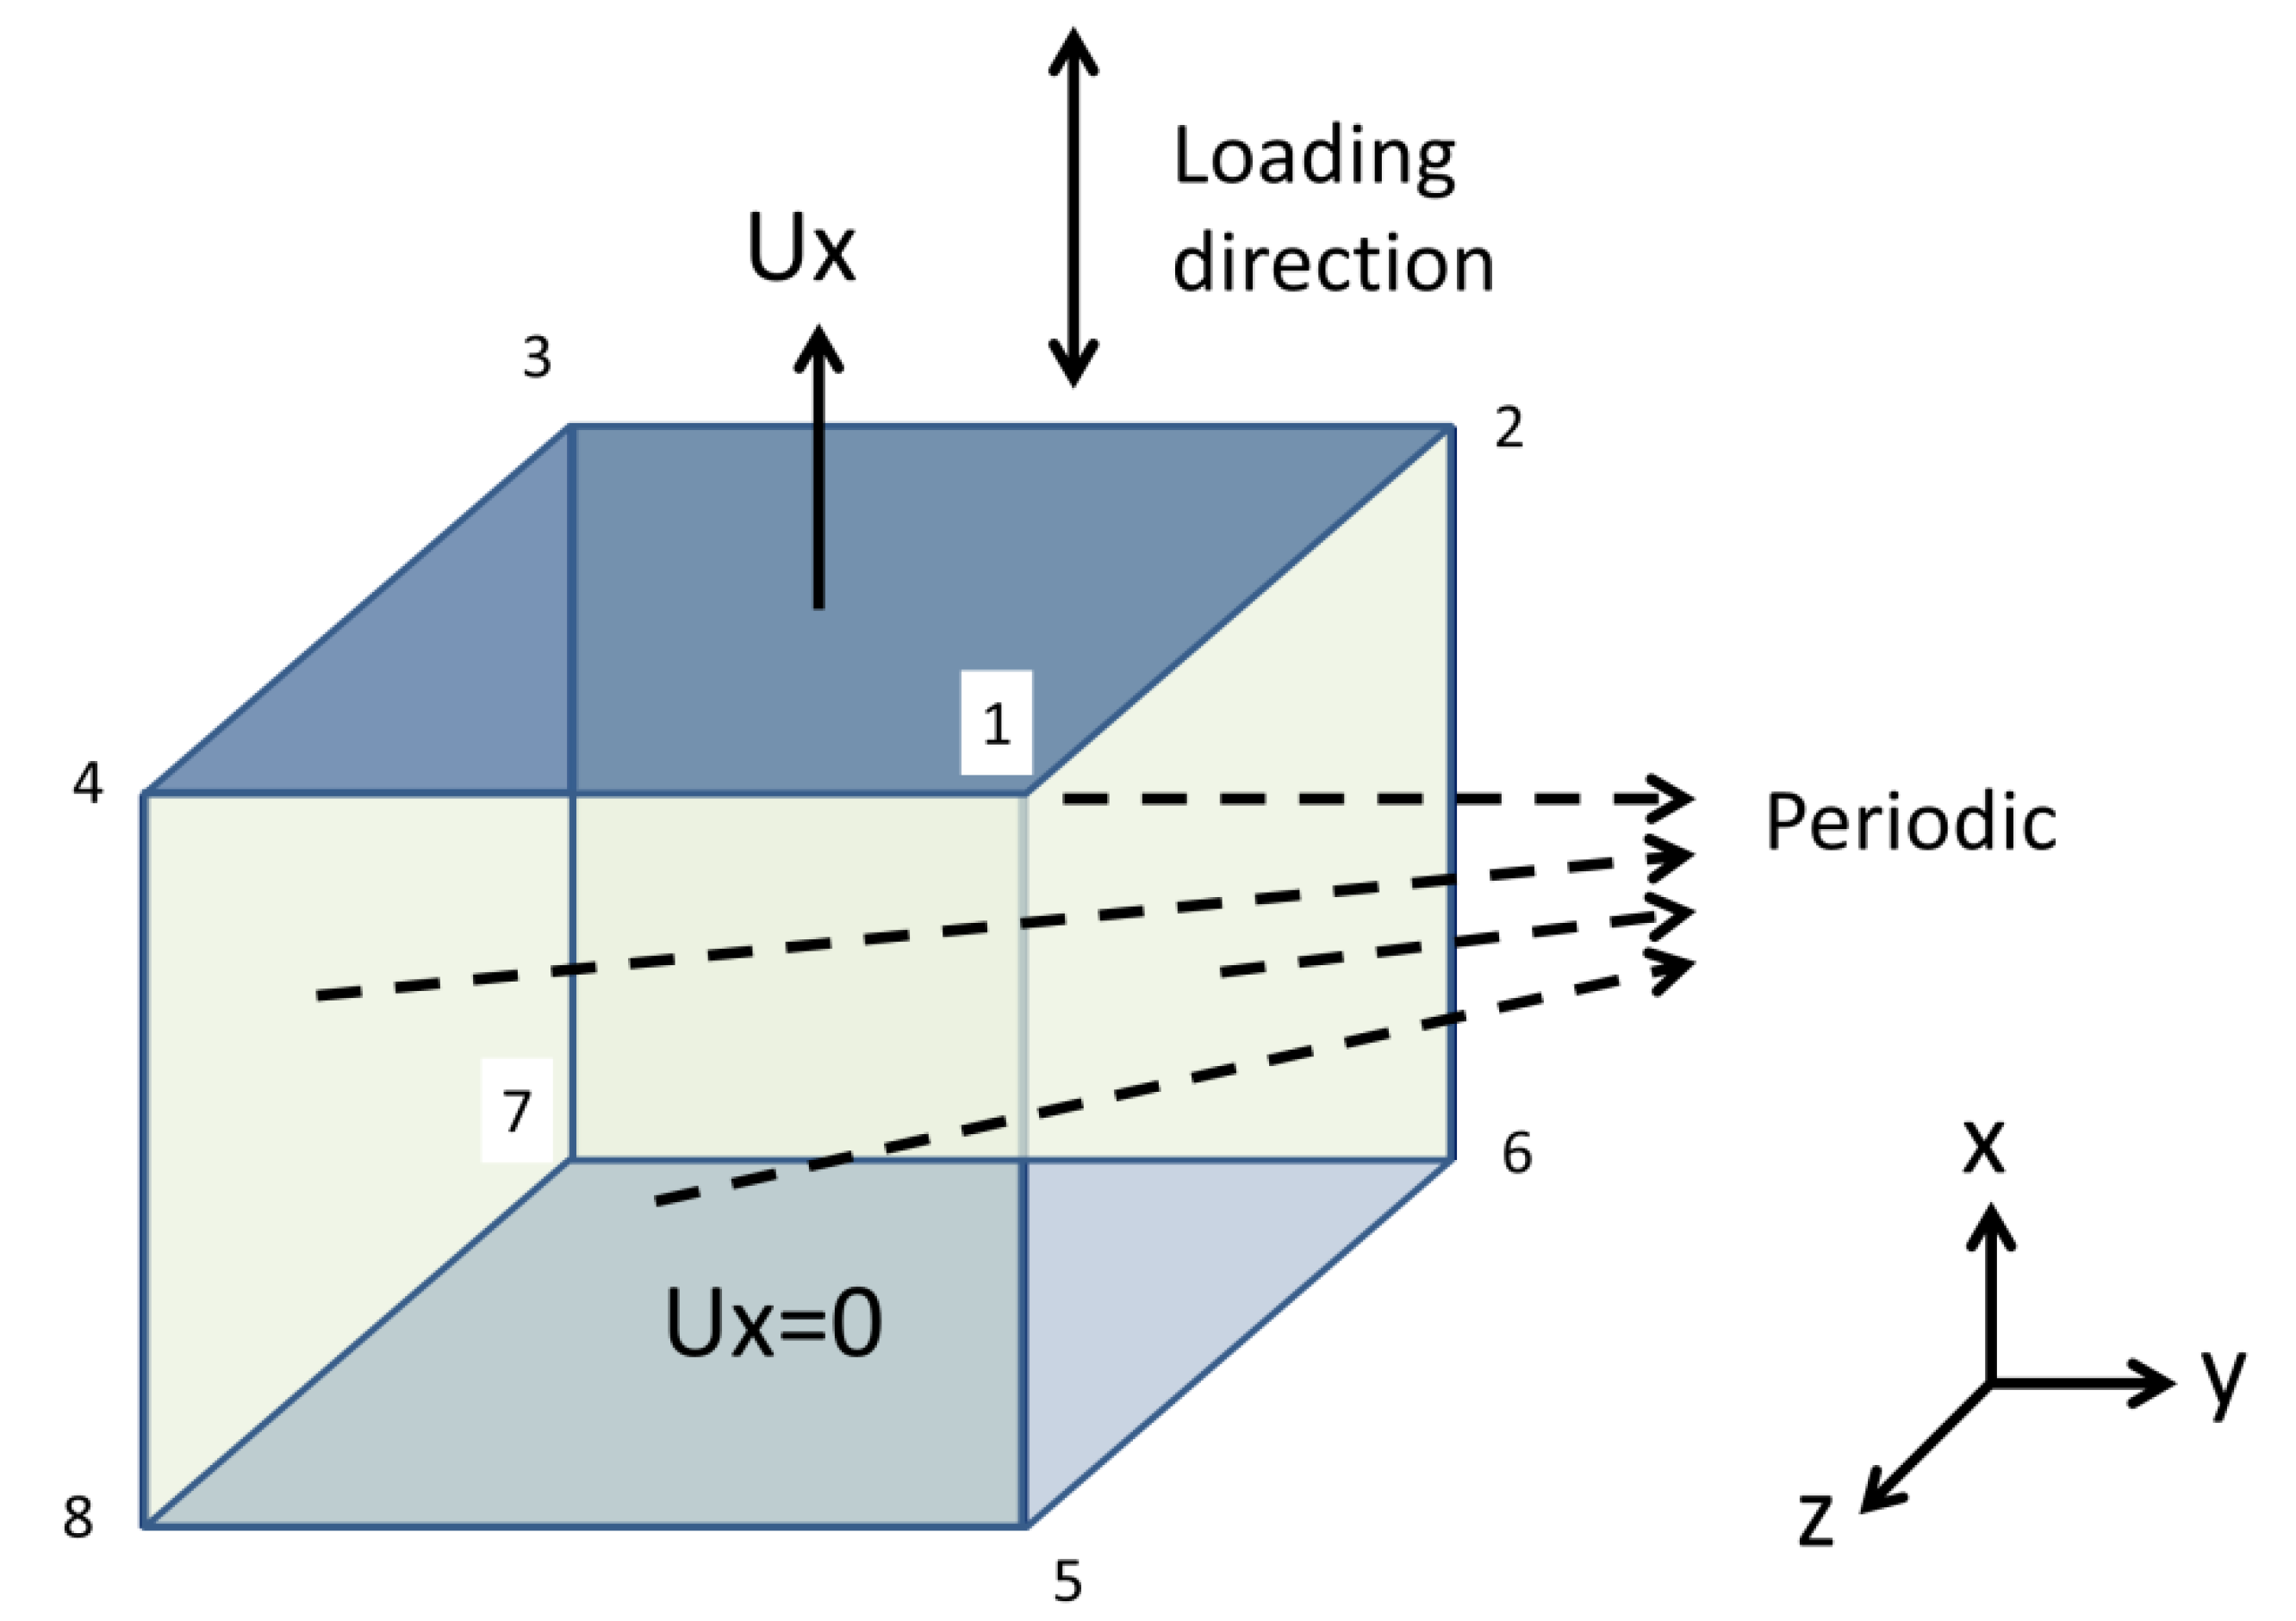
2.4. Crystal Plasticity Finite Element Model

The crystal plasticity finite element model (CPFEM) is based on the small deformation kinematical theory [30,31]. The constitutive model evaluates the stress and strain states related to the crystal slip system and is coded as a user-subroutine in the ABAQUS software [32,33]. This subroutine provides the plastic constitutive relationship of each crystal so the potential crack initiation regions can be analyzed.
The computational framework was followed as outlined in Voothaluru and Liu’s previous work [15,16,17]. First, a macro-scale model was developed to compute the resolved shear stress and shear strain conditions of the whole component. The boundary condition of the macro-scale model simulates the cyclic loading of uniaxial completely reversed push–pull (R = −1) tensile fatigue discussed in Section 2.3. Second, based on the macro-scale model, the potential crack initiation zones as the weakest region were identified. Third, micro-scale models were developed as sub-models for potential crack initiation zones.
Cyclic stress loads were simulated on 150 instantiations in ABAQUS using simple C3D8R elements using discretized representative volume element (RVE) methods [34,35]. Based on the microstructure observation in Section 2.1, 150 RVEs were generated to simulate the constitutive relationship at the weakest region. Figure 4 is an illustration of the RVEs for both the large and small grain specimens. For each RVE, the grain orientations input were randomly generated, since the copper samples did not have any inherent texture in them. The grain aggregates were chosen to match the overall scale of the specimens. The material constant (in this paper consider critical resolved shear stress) were adjusted as per Verma and Biswas [25] to account for the length-scale effects. The overall shear strain rate and stress results were the average of all 150 models respectively for two classes of microstructure. As a result, the randomly generated orientations would not induce artificially stress and strain risers.
The RVE was constrained by displacement boundary conditions ( U x ) applied across all nodes on the top face (1—2—3—4) due to cyclic loading. The bottom face (5—6—7—8) was tied to the reference points as U x = 0 to fix the RVE. Periodic boundary conditions were applied to the other faces (1—2—5—6), (1—4—5—8), (3—4—7—8), and (2—3—6—7) to allow localized deformation as shown in Figure 5. In order to simulate the behavior of bulk material with only a small RVE it is imperative to apply periodic boundary conditions as described by Smit [36], Kumar et al. [37], and Zhang [38]. The boundary conditions are setup so that the constraints are imposed on the opposite sides so that opposite edges deform in the same manner as described in detail in Smit et al. [37] and Zhang [38].
The following assumptions of the model: (1) continuum plasticity of isotropy, (2) incompressibility, (3) independence of hydrostatic stress, and (4) isotropic hardening. For the plastic slip of a single crystal, it assumes the slip obeys Schmid’s law.
Given that the focus of this work is fatigue crack initiation, the model primarily considers small deformation theory. The strain increment is composed of an elastic part and a plastic part [39], as shown in Equation (2).
F   =   F e   ·   F p
The elastic deformation gradient ( F e ) corresponds to lattice stretching and rotation of the lattice; the plastic deformation gradient ( F p ) is related to plastic shear of the material to an intermediate configuration in which the orientation and spacing are the same as the original configuration [16]. It is assumed that the elastic properties are unaffected by slip and that stress is determined solely by the elastic deformation gradient. The velocity gradient L in the current configuration would be related to the deformation gradient as shown in Equation (3). The plastic velocity gradient ( L p ) can be expressed as a function of the plastic shear rate ( γ s ˙ ), slip direction, and normal to the slip plane as given by Equation (4). The sum ranges over all activated slip systems where in the unit vectors s * s by Equation (5) and m * s by Equation (6) are the slip direction and normal to slip plane in the deformed configuration.
L   =   F ˙   ·   F 1 = L e + L p
L p = s γ s ˙ s * s m * s
s * s = F e   ·   s s
m * s = m s   ·   F e 1
The plastic shear rate ( γ s ˙ ) for each slip system ( s ) is a function of the ratio of resolved shear stress at the slip system ( τ s ) over drag stress ( g s ), as shown in Equation (7) [40]. The resolved shear stress is the product of the Cauchy stress tensor with the slip deformation tensor (Schmid factor), as shown in Equation (8). Based on the hardening law [41], the drag stress ( g s ) is slip resistance related to the shear strain increments over all slip systems through the isotropic hardening coefficient H d i r and the dynamic recovery coefficient ( H d y n ) in Equation (9). Back stress ( x s ) is related to the dynamic recovery coefficient ( A d y n ), as shown in Equation (10).
γ s ˙ = γ 0 ˙ | τ s x s g s | n sgn ( τ s )
τ s = σ : ( s s m s )
g s = s H dir | γ s ˙ | q s s s H dyn | γ s ˙ |
x s = A dir s γ s ˙ x s A dyn | γ s ˙ |
where τ s is the resolved shear stress of slip system (s), σ is the Cauchy stress tensor, s s   is the slip direction of the s t h slip plane in the reference configuration, m s   is the Schmid factor normal to the slip plane in the reference configuration, and q s s is the hardening factor.

2.5. Determination of the Elastic Constant and Critical Resolved Shear Stress

The critical resolved shear stress change for different material grades was determined with the tensile test stress and strain response, as per Verma and Biswas’s recent work [25]. The critical resolved shear stress can be determined by comparing the stress and strain responses of CPFEM to the tensile test results. The parameters were estimated so that an appreciable fit was achieved with the empirical results. Note: Since this study focus was on fatigue crack initiation, again, only the small deformation region was considered.

2.6. Determination of the Energy Efficiency Coefficient

In this study, the energy efficiency coefficient was determined using the method presented by Voothaluru and Liu [15]. The energy efficiency coefficients at the weakest point are computed by Equation (11)
ρ = γ s N i   t m ( Δ τ 2 ) ( Δ γ p 2 )
where surface energy γ s , maximum persistent slip band width ( t m ), and crack initiation life N i were based on experimental measurements. The resolved shear stress ( Δ τ 2 ) and plastic slip per cycle ( Δ γ p 2 ) were computed based on CPFEM.

3. Results and Discussion

3.1. Elastic Constants and Critical Resolved Shear Stress

The elastic constants ( C 11 , C 12 , C 44 ) and critical resolved shear stress (CRSS) were determined based on the stress–strain curves of the coarse and fine grains shown in Figure 2. The determination of the model parameters was described in Section 2.5. Table 3 and Figure 6 demonstrate the curve fitting results. The elastic constants were identical for both the coarse grains and the fine grains. Critical resolved shear stress (CRSS) is the stress required to move dislocation across the slip plane. The CRSS was larger for the fine grains than for the coarse grains, which satisfies the Hall–Petch relationship [42,43]. As grain size decreases, plastic slip resistance increases as a result of the strengthening of the grain boundaries [44,45].

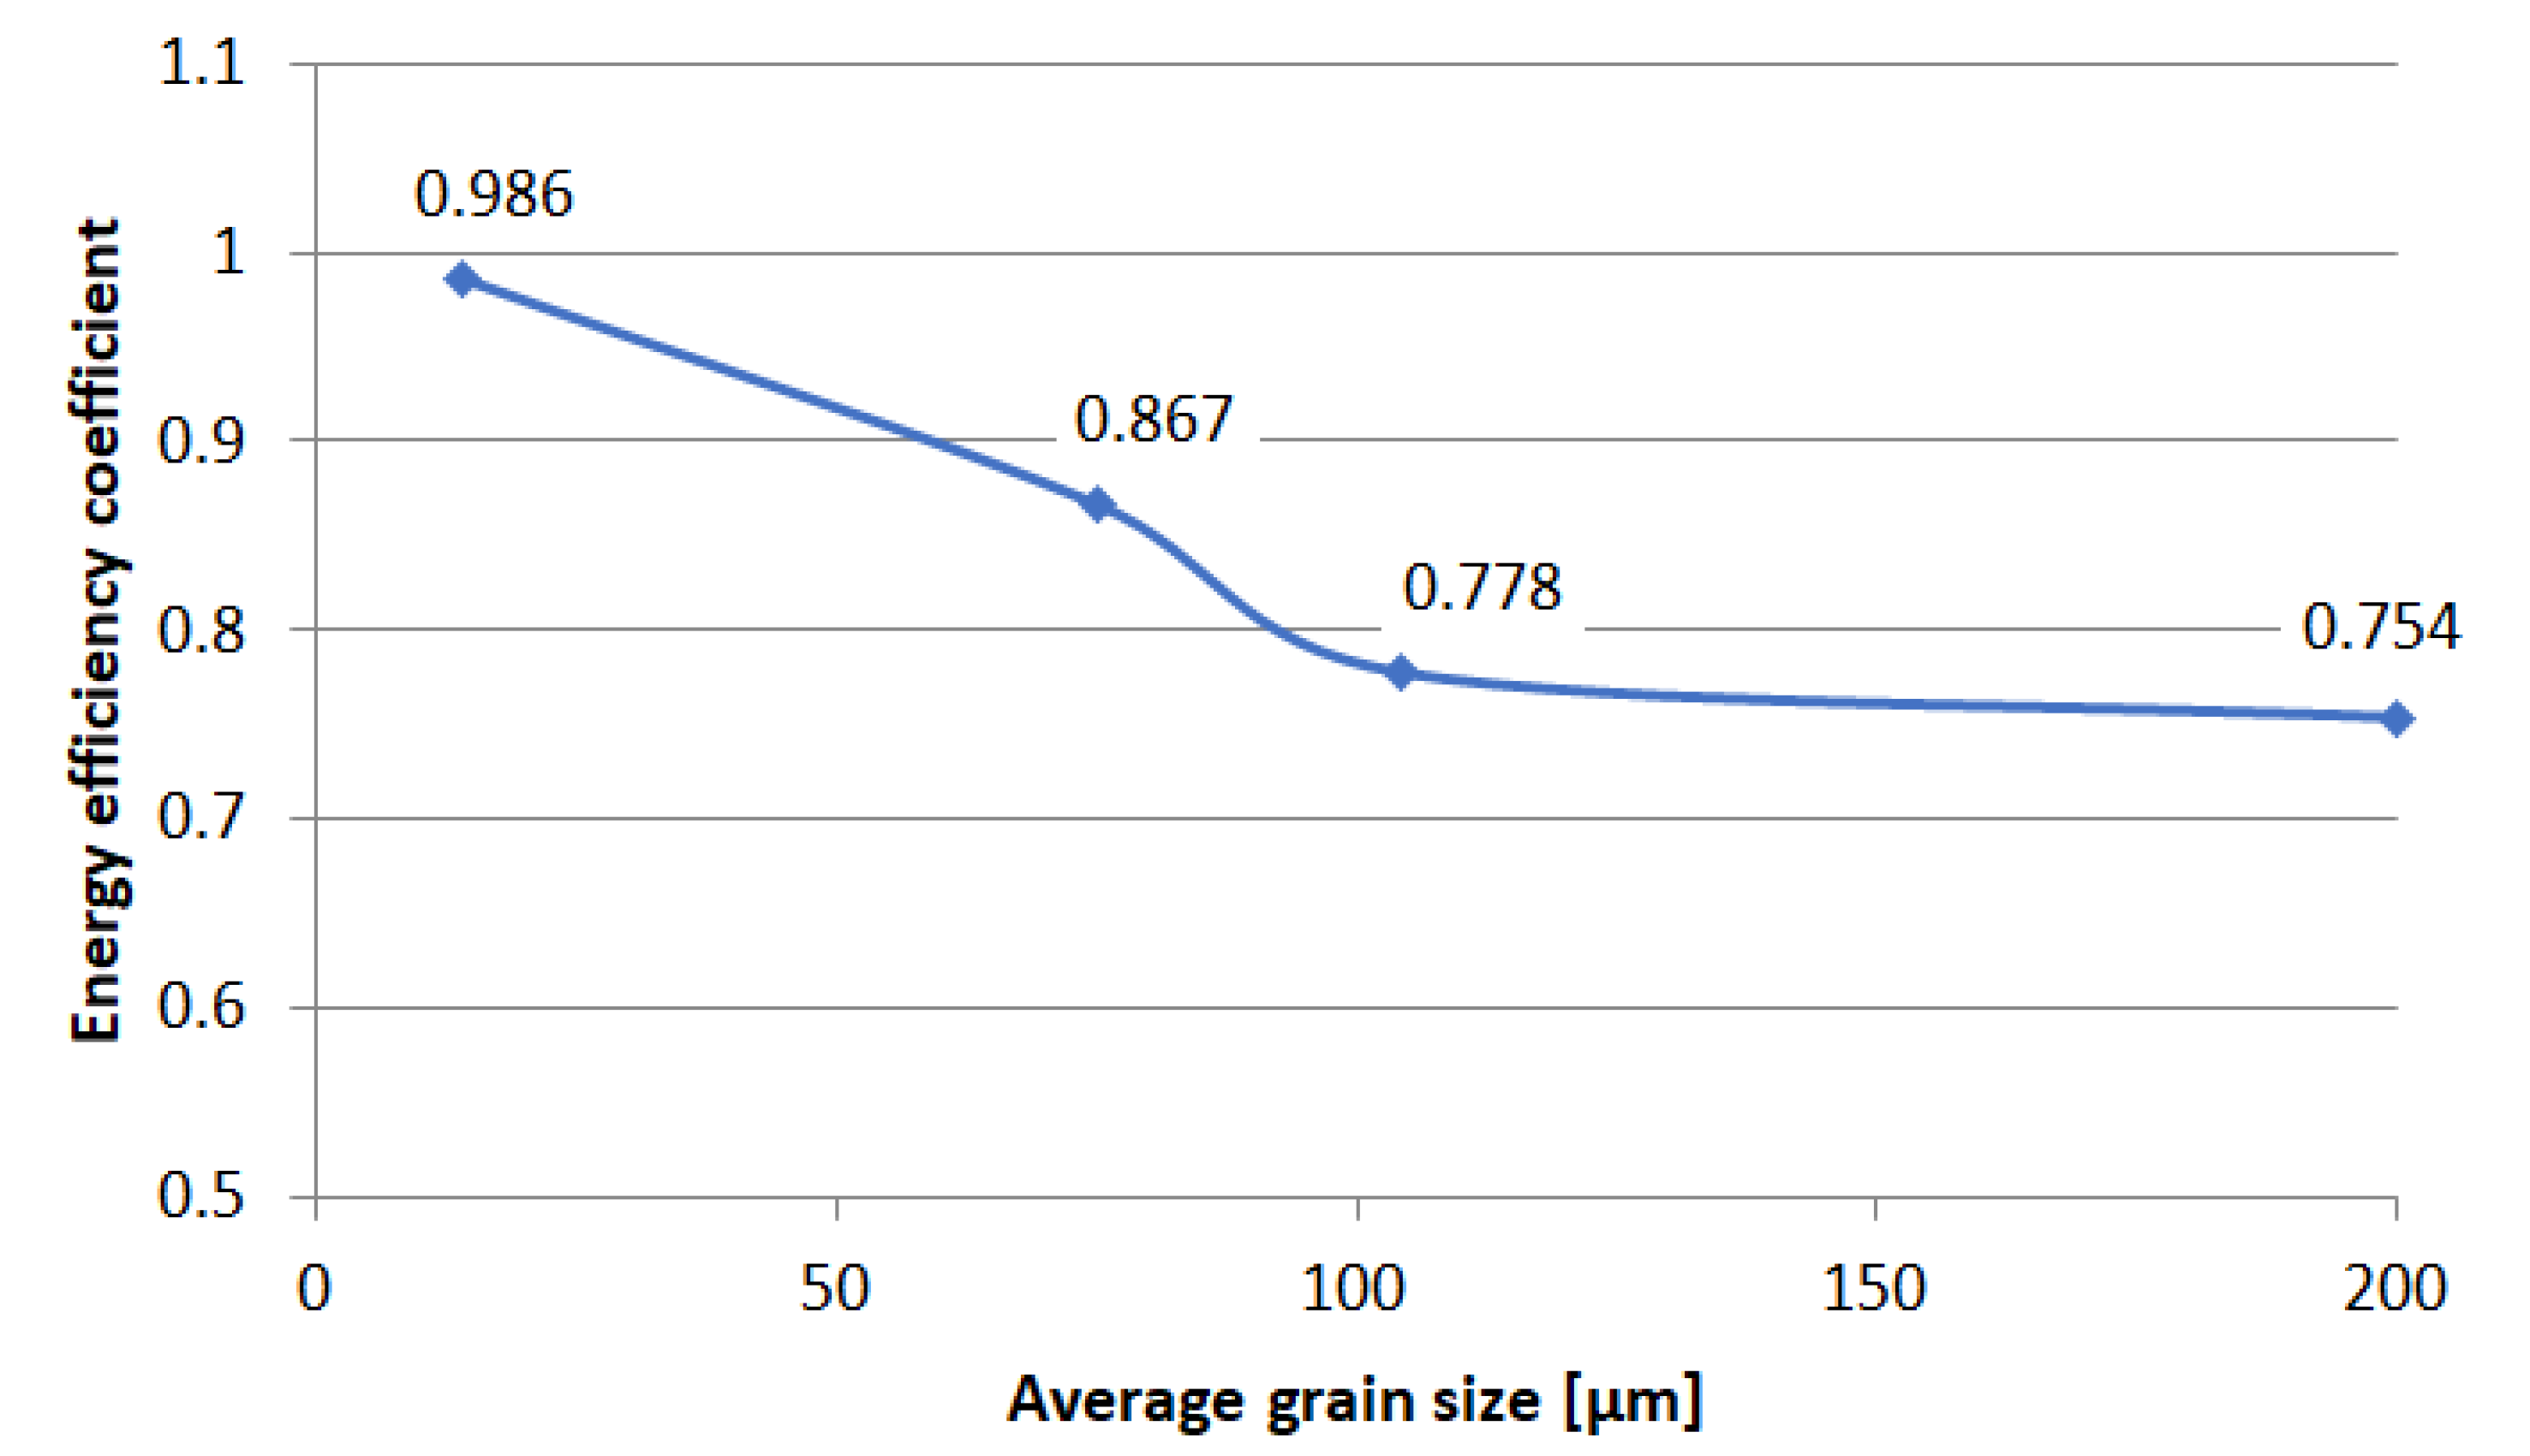
3.2. Effect of Grain Size on the Energy Efficiency Coefficient (ρ)

The energy efficiency coefficient (ρ) was computed based on Tanaka and Mura’s model [13]. The surface energy was 1.7 J / m 2 for copper, obtained from Kwon [46]. The maximum persistent slip band width ( t m ) was based on a previous experimental study [26] and the crack initiation life ( N i ) was described in Section 2.3. The resolved shear stress ( Δ τ 2 ) and plastic slip per cycle ( Δ γ p 2 ) were computed based on the CPFEM, as shown in Table 4 and Figure 7. Note: The saturated cycles were run for up to 20 iterations for all models. The overall shear strain rate and stress results were the average of all 150 models respectively for two classes of microstructure. The shear strain/slip accumulation was within 0.5% after mesh sensitivity analysis completed. As a result, the randomly generated orientations would not artificially induce stress and strain risers.
The plastic slip per cycle was much smaller for the fine grains than that for the coarse grains due to the Hall–Petch effect. The computed energy efficiency coefficient was 0.778 for coarse grains (average grain size   =   104.2 µm) and 0.986 for fine grain (average grain size   =   14.2 µm). The energy efficiency coefficient for fine grain was 26.7% larger than for coarse grains, implying that more energy was absorbed by the materials during cyclic loading. Since the coarse grain materials have a lower CRSS, more energy is transformed into heat and dissipated due to the plastic slip. To demonstrate the effect of grain size of the energy efficiency coefficient, the computed coefficients were compared with previous studies [14,15,16,46], which is summarized in Figure 8, for polycrystal copper. The average grain size is inversely proportional to the energy efficiency coefficient.

3.3. Crack Initiation Prediction Improvement

The energy efficiency coefficient was computed to be a constant for a specific class of material grain sizes. By using this approach, the shear stress amplitude and plastic slip per cycle at the localized weakest location could be computed to reduce overall inconsistencies and artificially induced stress risers incorporated as a result of unrepresentative volumes.
Computing a localized energy efficiency coefficient can considerably improve fatigue crack initiation estimation. In order to demonstrate the capability of the new model, its predicted crack initiation was compared with those of previously existing models by Fine and Bhat [14] and Voothaluru and Liu [16,17], as shown in Table 5. The newly proposed model demonstrated improvement of up to 97.78% compared to Fine and Bhat’s model, which underestimated the fatigue crack initiation as a result of not including the localized microstructure at the weakest region. In addition, the new model improved accuracy up to 10.06% compared with Voothaluru and Liu’s model by including the effect of grain size on the energy efficiency coefficient. Thus, it can be seen that incorporating the energy efficiency coefficient specific to the class of microstructures of the potential crack location can significantly improve fatigue crack initiation estimation.

4. Conclusions

A methodology to incorporate the potential effect of grain size on the energy efficiency coefficient through crystal plasticity finite element modeling was presented in this paper. This semi-empirical approach can remove the barrier of representative volume element, which is inherently length scale independent. The energy efficiency coefficient was studied as a factor to measure the amount of accumulated plastic strain energy stored at the crack initiation site. The case study of C11000 electrolytic tough pitch (ETP) copper demonstrated the capability of this method to improve the accuracy of fatigue life estimation.
The critical resolved shear stress of fine grain samples was found to be 70% larger than that of coarse grain samples. The energy efficiency coefficient of the fine grain structure was found to be 27% larger than that of fine copper, due to the strengthening of the grain boundary aligned with the Hall–Petch relation. The computation of localized plastic energy dissipated per cycle can considerably improve the fatigue crack initiation estimation by up to 97.78% compared with Fine and Bhat’s model [14]. By incorporating the effect of grain size on the energy efficiency coefficient, the model’s life estimation accuracy improved up to 10.06% compared to Voothaluru and Liu’s model [16,17].
This methodology allowed for a more accurate computation of the amount of energy dissipation into the material microstructure, and will ultimately enable the development of computationally driven models that will help reduce or explain the large variability inherent in fatigue crack initiation estimations.

Author Contributions

Conceptualization, C.R.L. and C.-Y.O.; methodology, C.-Y.O., C.R.L. and R.V.; software, R.V.; validation, C.-Y.O.; writing—original draft preparation, C.-Y.O.; writing—review and editing, R.V. and C.R.L.; supervision, C.R.L.; project initiation and administration, C.R.L.; funding acquisition, C.R.L. and C.-Y.O. All authors have read and agreed to the published version of the manuscript.

Funding

This work was supported by the National Science Foundation (CMMI), through grant no. 1562960. Some ideas and materials are patent pending owned by Purdue University. Publication of this article was funded in part by Purdue University Libraries Open Access Publishing Fund.

Conflicts of Interest

The authors declare no conflict of interest.

References

  1. Choi, Y.; Liu, C.R. Rolling Contact Fatigue Life of Finish Hard Machined Surfaces: Part 1. Model Development. Wear 2006, 261, 485–491. [Google Scholar] [CrossRef]
  2. Mughrabi, H. Microstructural Mechanisms of Cyclic Deformation, Fatigue Crack Initiation and Early Crack Growth. Philos. Trans. R. Soc. A Math. Phys. Eng. Sci. 2015, 373, 20140132. [Google Scholar] [CrossRef] [PubMed] [Green Version]
  3. Kazymyrovych, V.; Bergström, J.; Burman, C. The Significance of Crack Initiation Stage in Very High Cycle Fatigue of Steels. Steel Res. Int. 2010, 81, 308–314. [Google Scholar] [CrossRef]
  4. Everaerts, J.; Verlinden, B.; Wevers, M. The Influence of the Alpha Grain Size on Internal Fatigue Crack Initiation in Drawn Ti-6Al-4V Wires. In Procedia Structural Integrity, Proceedings of the 21st European Conference on Fracture, ECF21, Catania, Italy, 20–24 June 2016; Elsevier: Amsterdam, The Netherlands, 2016; Volume 2, pp. 1055–1062. [Google Scholar] [CrossRef]
  5. Cruzado, A.; Lucarini, S.; Llorca, J.; Segurado, J. Crystal Plasticity Simulation of the Effect of Grain Size on the Fatigue Behavior of Polycrystalline Inconel 718. Int. J. Fatigue 2018, 113, 236–245. [Google Scholar] [CrossRef] [Green Version]
  6. Alexandre, F.; Deyber, S.; Pineau, A. Modelling the optimum grain size on the low cycle fatigue life of a Ni based superalloy in the presence of two possible crack initiation sites. Scr. Mater. 2004, 50, 25–30. [Google Scholar] [CrossRef]
  7. Prithivirajan, V.; Sangid, M.D. The role of defects and critical pore size analysis in the fatigue response of additively manufactured IN718 via crystal plasticity. Mater. Des. 2018, 150, 139–153. [Google Scholar] [CrossRef]
  8. Minaii, K.; Farrahi, G.H.; Karimpour, M.; Bahai, H.; Majzoobi, G.H. Investigation of microstructure effect on fretting fatigue crack initiation using crystal plasticity. Fatigue Fract. Eng. Mater. Struct. 2019, 42, 640–650. [Google Scholar] [CrossRef]
  9. Signor, L.; Villechaise, P.; Ghidossi, T.; Lacoste, E.; Gueguen, M.; Courtin, S. Influence of local crystallographic configuration on microcrack initiation in fatigued 316LN stainless steel: Experiments and crystal plasticity finite elements simulations. Mater. Sci. Eng. A 2016, 649, 239–249. [Google Scholar] [CrossRef]
  10. Manonukul, A.; Dunne, F.P.E. High- and Low-Cycle Fatigue Crack Initiation Using Polycrystal Plasticity. In Proceedings of the Royal Society of London, London, UK, 8 July 2004; Series A: Mathematical, Physical and Engineering Sciences; The Royal Society: London, UK, 2004; Volume 460, pp. 1881–1903. [Google Scholar] [CrossRef]
  11. Hochhalter, J.D.; Littlewood, D.J.; Christ, R.J.; Veilleux, M.G.; Bozek, J.E.; Ingraffea, A.R.; Maniatty, A.M. A Geometric approach to modeling microstructurally small fatigue crack formation: II. physically based modeling of microstructure-dependent slip localization and actuation of the crack nucleation mechanism in AA 7075-T651. Model. Simul. Mater. Sci. Eng. 2010, 18, 045004. [Google Scholar] [CrossRef]
  12. Bhat Shrikant, P.; Fine Morris, E. Fatigue crack nucleation in iron and a high strength low alloy steel. Mater. Sci. Eng. A 2001, 314, 90–96. [Google Scholar] [CrossRef]
  13. Tanaka, K.; Mura, T. A Dislocation model for fatigue crack initiation. J. Appl. Mech. 1981, 48, 97–103. [Google Scholar] [CrossRef]
  14. Fine Morris, E.; Bhat Shrikant, P. A model of fatigue crack nucleation in single crystal iron and copper. Mater. Sci. Eng. A 2007, 468, 64–69. [Google Scholar] [CrossRef]
  15. Voothaluru, R.; Richard Liu, C. Determination of lattice level energy efficiency for fatigue crack initiation. Fatigue Fract. Eng. Mater. Struct. 2013, 36, 70–78. [Google Scholar] [CrossRef]
  16. Voothaluru, R.; Liu, C.R. A Crystal plasticity based methodology for fatigue crack initiation life prediction in polycrystalline copper. Fatigue Fract. Eng. Mater. Struct. 2014, 37, 671–681. [Google Scholar] [CrossRef]
  17. Voothaluru, R. A Crystal Plasticity Based Methodology for Modeling Fatigue Crack Initiation and Estimating Material Coefficients to Predict Fatigue Crack Initiation Life at Micro, Nano and Macro Scales. Ph.D. Thesis, Purdue University, West Lafayette, IN, USA, 2014. [Google Scholar]
  18. Lin, M.R.; Fine, M.E.; Mura, T. Fatigue crack initiation on slip bands: Theory and experiment. Acta Metall. 1986, 34, 619–628. [Google Scholar] [CrossRef]
  19. Li, L.; Shen, L.; Proust, G. Fatigue Crack Initiation Life Prediction for Aluminium Alloy 7075 Using Crystal Plasticity Finite Element Simulations. Mech. Mater. 2015, 81, 84–93. [Google Scholar] [CrossRef]
  20. Wan, V.V.C.; Cuddihy, M.A.; Jiang, J.; MacLachlan, D.W.; Dunne, F.P.E. An HR-EBSD and Computational Crystal Plasticity Investigation of Microstructural Stress Distributions and Fatigue Hotspots in Polycrystalline Copper. Acta Mater. 2016, 115, 45–57. [Google Scholar] [CrossRef]
  21. Wan, V.V.C.; Jiang, J.; MacLachlan, D.W.; Dunne, F.P.E. Microstructure-Sensitive Fatigue Crack Nucleation in a Polycrystalline Ni Superalloy. Int. J. Fatigue 2016, 90, 181–190. [Google Scholar] [CrossRef]
  22. Dabiri, M.; Laukkanen, A.; Bjork, T. Fatigue Microcrack Nucleation Modeling: A Survey of the State of the Art. Int. Rev. Mech. Eng. 2015, 9, 368–376. [Google Scholar] [CrossRef]
  23. Naderi, M.; Amiri, M.; Iyyer, N.; Kang, P.; Phan, N. Prediction of Fatigue Crack Nucleation Life in Polycrystalline AA7075-T651 Using Energy Approach. Fatigue Fract. Eng. Mater. Struct. 2016, 39, 167–179. [Google Scholar] [CrossRef]
  24. Li, D.F.; Barrett, R.A.; O’Donoghue, P.E.; O’Dowd, N.P.; Leen, S.B. A Multi-Scale Crystal Plasticity Model for Cyclic Plasticity and Low-Cycle Fatigue in a Precipitate-Strengthened Steel at Elevated Temperature. J. Mech. Phys. Sol. 2017, 101, 44–62. [Google Scholar] [CrossRef] [Green Version]
  25. Verma, R.K.; Biswas, P. Crystal Plasticity-Based Modelling of Grain Size Effects in Dual Phase Steel. Mater. Sci. Technol. 2016, 32, 1553–1558. [Google Scholar] [CrossRef]
  26. Ou, C.Y.; Liu, C.R. The Effects of Grain Size and Strain Amplitude on Persistent Slip Band Formation and Fatigue Crack Initiation. Metall. Mater. Trans. A 2019, 50, 5056–5065. [Google Scholar] [CrossRef]
  27. ASTM International: ASTM E606/E606M-12; ASTM International: West Conshohocken, PA, USA, 2012.
  28. ASTM E8/E8M-16a, Standard Test Methods for Tension Testing of Metallic Materials; ASTM International: West Conshohocken, PA, USA, 2016.
  29. ASTM International: ASTM E3; ASTM International: West Conshohocken, PA, USA, 2017.
  30. Taylor, G.I. Plastic Strain in Metals. Inst. Met. 1938, 62, 307. [Google Scholar]
  31. Asaro, R.J. Crystal Plasticity. J. Appl. Mech. 1983, 50, 921–934. [Google Scholar] [CrossRef]
  32. Huang, Y. A User-Material Subroutine Incorporating Single Crystal Plasticity in the ABAQUS Finite Element Program; Harvard University Research Report; Harvard University: Cambridge, MA, USA, 1991. [Google Scholar]
  33. Liu, B.; Raabe, D.; Roters, F.; Eisenlohr, P.; Lebensohn, R.A. Comparison of Finite Element and Fast Fourier Transform Crystal Plasticity Solvers for Texture Prediction. Modell. Simul. Mater. Sci. Eng. 2010, 18, 085005. [Google Scholar] [CrossRef]
  34. Voothaluru, R.; Bedekar, V.; Xie, Q.; Stoica, A.D.; Hyde, R.S.; An, K. In-Situ Neutron Diffraction and Crystal Plasticity Finite Element Modeling to Study the Kinematic Stability of Retained Austenite in Bearing Steels. Mater. Sci. Eng. A 2018, 711, 579–587. [Google Scholar] [CrossRef] [Green Version]
  35. Voothaluru, R.; Bedekar, V.; Yu, D.; Xie, Q.; An, K.; Pauskar, P.; Hyde, R.S. Investigating the Difference in Mechanical Stability of Retained Austenite in Bainitic and Martensitic High-Carbon Bearing Steels Using in Situ Neutron Diffraction and Crystal Plasticity Modeling. Metals 2019, 9, 482. [Google Scholar] [CrossRef] [Green Version]
  36. Smit, R.J.M.; Brekelmans, W.A.M.; Meijer, H.E.H. Prediction of the mechanical behavior of nonlinear heterogeneous systems by multi-level finite element modeling. Comput. Methods Appl. Mech. Eng. 1998, 155, 181–192. [Google Scholar] [CrossRef]
  37. Kumar, R.S.; Wang, A.J.; Mcdowell, D.L. Effects of Microstructure Variability on Intrinsic Fatigue Resistance of Nickel-Base Superalloys—A Computational Micromechanics Approach. Int. J. Fract. 2006, 137, 173–210. [Google Scholar] [CrossRef]
  38. Zhang, J.; Prasannavenkatesan, R.; Shenoy, M.M.; McDowell, D.L. Modeling Fatigue Crack Nucleation at Primary Inclusions in Carburized and Shot-Peened Martensitic Steel. Eng. Fract. Mech. 2009, 76, 315–334. [Google Scholar] [CrossRef]
  39. Suiker, A.S.; Turteltaub, S. Computational modelling of plasticity induced by martensitic phase transformations. Int. J. Numer. Methods Eng. 2005, 63, 1655–1693. [Google Scholar] [CrossRef]
  40. Hutchinson, J.W. Bounds and Self-Consistent Estimates for Creep of Polycrystalline Materials. Proc. R. Soc. Lond. A 1976, 348, 101. [Google Scholar]
  41. Brown, S.B.; Kim, K.H.; Anand, L. An Internal Variable Constitutive Model for Hot Working of Metals. Int. J. Plast. 1989, 5, 95–130. [Google Scholar] [CrossRef] [Green Version]
  42. Hall, E.O. The deformation and ageing of mild steel: III discussion of results. Proc. Phys. Soc. 1951, 64, 747–753. [Google Scholar] [CrossRef]
  43. Petch, N.J. The cleavage strength of polycrystals. J. Iron Steel Inst. 1953, 174, 25–28. [Google Scholar]
  44. Argon, A.S. Strengthening Mechanismi Crystal Plasticity; Oxford University: New York, NY, USA, 2008. [Google Scholar]
  45. Fleck, N.A.; Muller, M.F.; Ashby, M.F.; Hutchinson, J.W. Strain gradient plasticity: Theory and experiment. Acta Metall. Mater. 1994, 42, 475–487. [Google Scholar] [CrossRef]
  46. Kwon, I.B. Fatigue Crack Initiation in Copper at Room and Cryogenic Temperatures. Ph.D. Thesis, Northwestern University, Evanston, IL, USA, 1987. [Google Scholar]
Figure 1. A dog-bone-shaped sample for the fatigue test.
Metals 10 00355 g001
Figure 2. Comparison of the stress–strain curve of fine grain (average grain size—14.2 µm) and coarse grain (average grain size—104.2 µm) samples.
Metals 10 00355 g002
Figure 3. Crack initiation of (a) the fine grain sample, and (b) the coarse grain sample.
Metals 10 00355 g003
Figure 4. Illustration of representative volume elements generated for (a) large grains and (b) small grains.
Metals 10 00355 g004
Figure 5. Boundary conditions for the representative volume elements (RVEs): (1—2—3—4):   U x ; (5—6—7—8):   U x = 0 ; (1—2—5—6), (1—4—5—8), (3—4—7—8), (2—3—6—7): periodic.
Metals 10 00355 g005
Figure 6. Comparison of the predicted stress–strain response with experimental uniaxial tension testing for (a) coarse grain and (b) fine grain.
Metals 10 00355 g006
Figure 7. Plastic slip accumulation for (a) one large grain RVE, and (b) one small grain RVE.
Metals 10 00355 g007
Figure 8. Computed energy efficiency coefficient for different grain sizes of polycrystal copper.
Metals 10 00355 g008
Table 1. Dimensions of the dog-bone sample.
W—Width of Narrow Section3.18 (mm)
T—Thickness1.5875 (mm)
L—Length of narrow section9.53 (mm)
WO—Width overall, min12.7 (mm)
LO—Length overall, min63.5 (mm)
G—Gage length7.62 (mm)
D—Distance between grips25.4 (mm)
R—Radius of fillet12.7 (mm)
Table 2. Heat treatment procedures and grain size distributions.
Material GradeHeat Treatment ProceduresGrain Size Distribution (μm)
Coarse grainAnnealing: Heated to 700 °C in a vacuum for 1 h, then furnace-cooled to room temperatureAverage diameter: 104.2
Standard deviation: 10
Fine grainStress-relieving: Heated to 200 °C in a vacuum for 30 min, and then furnace-cooled to room temperatureAverage diameter: 14.2
Standard deviation: 2
Table 3. Elastic constants and critical resolved shear stress (CRSS).
Grain Distribution C 11 C 12 C 44 CRSS (MPa)
Coarse grain
(average grain size   =   104.2 µm)
1811426945.9
Fine grain
(average grain size   =   14.2 µm)
1811426978.2
Table 4. Cyclic loading-computed parameters.
Grain DistributionApplied Stress (MPa)Shear Stress Amplitude (MPa)Plastic Slip per CycleComputed Energy Efficiency Coefficient
Coarse grain
(average grain size   =   104.2 µm)
6466.1 3.9 × 10 4 0.778
Fine grain
(average grain size   =   14.2 µm)
6440.8 1.09 × 10 6 0.986
Table 5. Crack initiation life prediction vs. previous models.
Normal Stress Amplitude (MPa)150110100
Plastic strain amplitude 8.46 × 10 4 1.53 × 10 4 0.3 × 10 4
Crack initiation life by experiment (cycles)15070,000100,000
Life predicted by Fine and Bhat [14]-11316345
% improvement using the new model
( % E r r o r o l d % E r r o r n e w )
-97.78%92.94%
Life predicted by Voothaluru and Liu [16,17]Benchmark63,29189,222
% improvement using the new model
( % E r r o r o l d % E r r o r n e w )
-8.98%10.06%
Life predicted by the new modelBenchmark7042599,280

