Shape Change and Crystal Orientation of B19 Martensite in Equiatomic TiPd Alloy by Isobaric Test


1
Department of Materials Science and Engineering, Kumamoto University, 2-39-1 Kurokami, Kumamoto 860-8555, Japan
2
Division of Materials Science and Chemistry, Faculty of Advanced Science and Technology, Kumamoto University, 2-39-1 Kurokami, Kumamoto 860-8555, Japan
3
National Institute for Materials Science (NIMS), Tsukuba, Ibaraki 305-0047, Japan
*
Author to whom correspondence should be addressed.
Metals 2020, 10(3), 375; https://doi.org/10.3390/met10030375
Submission received: 13 February 2020
/
Revised: 9 March 2020
/
Accepted: 12 March 2020
/
Published: 14 March 2020
Abstract
:We investigated the texture and the shape change in the equiatomic TiPd alloy, and discussed the relationship between the shape change and the atomic movements associated with martensitic transformation. Thermomechanical analyzer tests indicate that the direction of the shape change was different between the 0° and 90° samples, cutting out parallel and perpendicular to the hearth side of button ingot, respectively. In the 0° sample, shrinking and expansion were observed during the reverse and forward martensitic transformations, respectively, whereas the opposite tendency was confirmed in the 90° sample compared to the 0° sample. During the isobaric test, the martensitic variants were oriented to a (010) plane with compressive loading, and the B2 parent phase crystals also became coarse. There is a close relationship between the shape change due to the crystal orientation by the isobaric test and the shear-shuffling direction due to martensitic transformation.

1. Introduction
Ti-Ni alloys with thermoelastic martensitic transformation exhibit excellent shape memory properties, and therefore, are widely used as shape memory alloys in the industrial and medical fields [1]. However, since the Ti-Ni alloy has a martensitic transformation start temperature (Ms) of 373 K or less, its use range is limited. In recent years, there has been a demand for the development of new shape memory alloys that can be used at high temperatures, including for jet engine parts proposed by NASA in the United States [2].
As one of the high-temperature shape memory alloys, equiatomic TiPd alloys have been studied a lot. This alloy undergoes martensitic transformation from a cubic B2 structure (Space group: Pmm) to an orthorhombic B19 structure (Pmma) at Ms = 783 K [3]. It has been also reported that the equiatomic TiPd alloy has a shape recovery ratio of about 60%, using the following equation: shape recovery ratio = (L’’ − L’)/ (L’ − L0) × 100, where is L0: initial length of sample, L’: deformed sample length, and L’’: recovered sample length. Moreover, the shape recovery ratio improves with the addition of a third element [4,5]. In addition, Sato et al. reported that a complete shape recovery was achieved by the effect of a training process, that is, a repeated isobaric test on the Ti-Pd-Zr alloy [6]. The isobaric test is a process of changing the temperature while applying a load, that is, a process of repeating martensitic transformation with loading. The complete shape recovery is considered to originate from the texture being oriented in a particular direction during the isobaric test. However, the identification of an oriented plane due to the isobaric test and the origin of a crystal plane orientation have not been clarified yet.
There have been some reports on the shape change due to the reverse martensitic transformation related to shape recovery. The Ti-Ni alloy [7] and the Ti-Ni-Pd alloy [8] change shape in the direction of shrinkage with martensitic transformation, whereas the Hf-Pd alloy [9] and the Fe-Ni alloy [10] change shape in the expanding direction. Furthermore, Wang et al. reported that the amount and direction of shape change in Ti-Ni and Ti-Ni-Fe alloys subjected to cold rolling were significantly different with the reduction ratio in the rolling direction, the transversal direction, and the normal direction [11]. These support that the amount and direction of shape change accompanying martensitic transformations are greatly related to the alloy type and crystal orientation. It is well known that shape memory effects depend on the crystal orientations. Effects of texture orientation on shape memory strain and martensitic deformation in Ti-Ni alloys have been clarified previously [12,13,14]. In addition, it has been reported that the texture orientation significantly influences the stress–strain curve and shape memory effects in Cu-based shape memory alloys [15,16]. Kim et al. calculated the orientation dependence of martensitic transformation strain in the Ti-22Nb-6Ta alloy by combining its texture and lattice-corresponding information, and showed a good agreement with experimental values [17]. Therefore, this method is expected to provide the relationship between crystal orientation and the shape change due to martensitic transformation, leading to the elucidation of the effect in the isobaric test.
In this study, we investigated the texture and the shape change in the equiatomic TiPd alloy, which is a typical high-temperature-type shape memory alloy, by using electron backscatter diffraction (EBSD) measurements, a thermomechanical analyzer (TMA), and compression tests. The relationship between shape change and atomic movements associated with martensitic transformation, that is, a shear-shuffling mechanism, is also discussed based on those experimental results.
2. Materials and Methods
The equiatomic TiPd alloy was prepared from 99.9% titanium and 99.9% palladium (mass %) by arc melting in an argon atmosphere. The button-shaped ingots were remelted eight times. Those button ingots were annealed in an argon quartz tube at 1273 K for 3.6 ks, followed by water-quenching. The dimension change of the specimen was recorded accurately by heating up to 973 K and cooling down to R. T. (Room Temperature) in a TMA (TMA-60, Shimadzu, Kyoto, Japan) at the rate of 20 K/min in an argon flow under a small compression force of 0.05 N. For the TMA, 3 mm × 3 mm × 0.5 mm rectangular parallelepiped specimens were cut from the annealed button ingot using a micro-cutter. The TMA tests were performed using two types of samples cutting out parallel and perpendicular to the hearth side of the button ingot, which are called the 0° and 90° samples, respectively, in order to investigate the shape change based on crystal orientation difference for the button ingot. A compression test (AG-250KNX, Shimadzu, Kyoto, Japan) was performed to investigate the detwinning stress and yield point at room temperature and high temperature. Compressive specimens of 2.5 mm × 2.5 mm × 5 mm with the longitudinal direction parallel to the hearth side of the button ingot were spark-cut. The initial strain rate of the compressive test was 3 × 10⁻⁴/s. The strains of the samples were measured by the stroke of the compression testing machine. Furthermore, a compression test (AG-500kNIS, Shimadzu, Kyoto, Japan) was also performed while changing the temperature with a constant load in order to investigate the shape change as an isobaric test. This test was performed at 50 MPa, and the temperature ranged from room temperature to 923 K, with a heating and cooling rate of 50 K/min. The strains of the samples were measured by direct observation using the CCD (Charge Coupled Device) camera in the compression testing machine.
The constituent phases were examined using a high temperature x-ray diffractometer (HTXRD, RIGAKU RINT-TTR III, Rigaku, Akishima, Tokyo, Japan) with Ni-filtered Cu K alpha radiation (the combination of K alpha 1 and K alpha 2, removing K beta). The structures and lattice parameter were analyzed with the Pawley method [18] using software PDXL (Ver. 2.4, Rigaku, Akishima, Tokyo, Japan). The texture and crystal orientation were determined using a scanning electron microscope (SEM, JEOL 7200F, JEOL Ltd., Akishima, Tokyo, Japan) equipped with an EBSD analyzer at an accelerating voltage of 20 kV. The sample was subjected to colloidal polishing (BUEHLER Master Met: hydrogen peroxide solution = 5:1) after mechanical polishing. An EBSD analysis was made with the TSL Orientation Imaging Microscopy system (Ver. 7.3.1, TSL solutions, Sagamihara, Kanagawa).
3. Results and Discussions
3.1. Microstructure and Shape Change of Water-Quenched Equiatomic TiPd Alloys
Figure 1a,b shows the results of the TMA test on the 90° and 0° samples, respectively. The 90° sample gradually expanded with the heating from room temperature, and then it drastically expanded between the As (reverse transformation start temperature) and the Af (reverse transformation finish temperature) temperatures, as shown in Figure 1a. Upon cooling, it drastically shrank between the Ms and the Mf (martensitic transformation finish temperature) temperatures. On the other hand, in the 0° sample shown in Figure 1b, rapid shrinking was observed from As to Af, and rapid expansion was observed from Ms to Mf. Large shape changes in both specimens were confirmed with the reverse transformation and the forward transformation of the martensitic transformation. The origin of the crossing of the curves before and after the transformation on both samples may have originated from the thin sample thickness of 0.5 mm and the oxidation at high temperature. It can be noted that the 90° sample in Figure 1a shows the same direction of shape change due to martensitic transformation as the Ti-Ni alloy [7] and the Ti-Ni-Pd alloy [8], whereas the 0° sample in Figure 1b shows the same behavior as the Hf-Pd alloy [9] and the Fe-Ni alloy [10]. This supports that the direction of shape change corresponding to the cut surface with the same alloy depends on the crystal orientation. Therefore, each crystal orientation of both samples was investigated by the EBSD analysis.
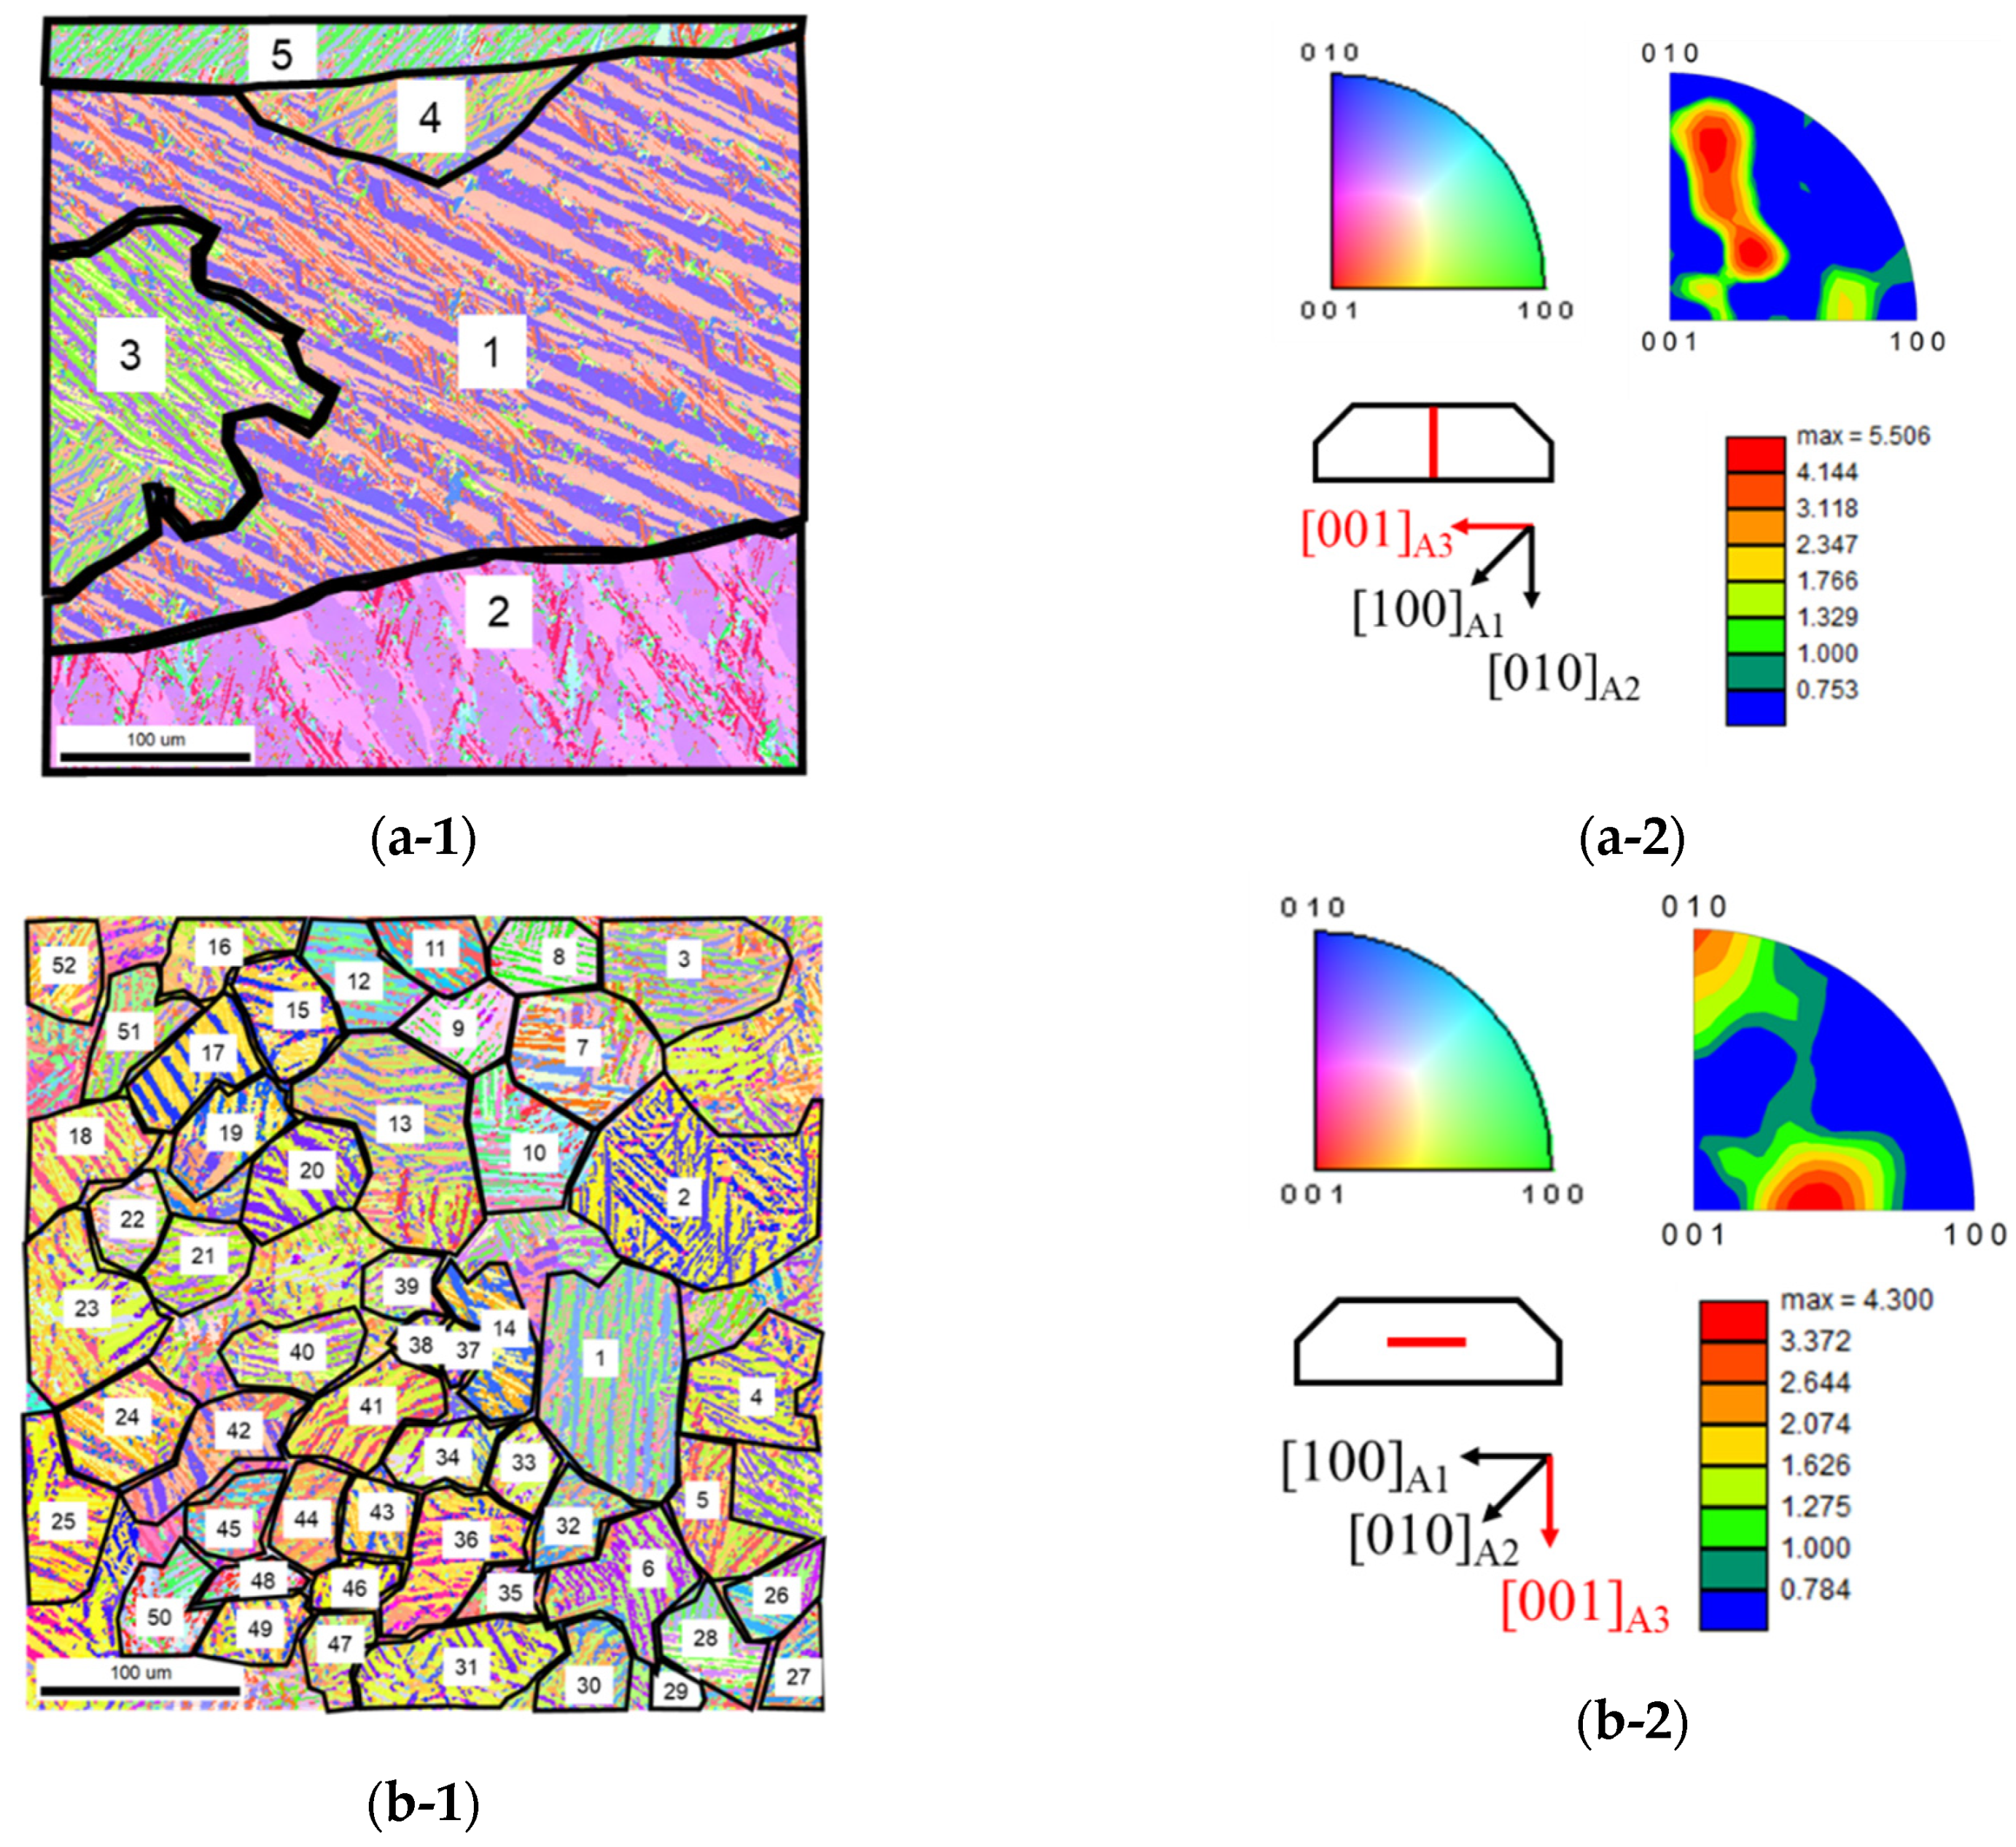
Based on the EBSD results, the crystal orientation of the parent phase in perpendicular and parallel to the hearth side was identified to discuss the relationship between the results of the TMA test and the texture by calculating the strain associated with the martensitic transformation. Figure 2 (a-1,2) and (b-1,2) show the results of the EBSD measurement of the 90° and 0° samples. The martensitic transformation of the TiPd alloy was from a B2 structure to B19 structure, and there were six combinations of lattice-corresponding variants.
Therefore, six types of lattice-corresponding variants appeared when the parent phase underwent martensitic transformation. When the lattice vector of the parent phase and the set of the pole figure of the martensite were overlapped using the stereo net, the parent phase in the A3 direction could be estimated. This provided each old parent phase crystals, as shown by the bold black lines in Figure 2. Five large grains corresponding to the old parent phase surrounded by the black lines were composed of plate-shaped martensite variants, and those were oriented to (253) and (425) planes, as shown in Figure 2 (a-1,2). On the other hand, the 0° sample in Figure 2 (b-1,2) shows that the crystal grains corresponding to more than 50 old parent phases consisted of plate-shaped martensitic variants, and that those are largely oriented to (101) or (010) planes. From these results, it was found that the shape of the crystal grains in the old parent phases was the long columnar crystal according to the solidification from the hearth side by arc-melting, and the crystal orientations of martensitic variants were different for each cut surface of the button ingot.
The transformation strain associated with the martensitic transformation was calculated using the method reported in Sato et al. [6] and Kim et al. [17] on the basis of the above EBSD results and HTXRD measurements. HTXRD measurements were performed to identify constituent phases and accurate lattice constants before and after the martensitic transformation of the equiatomic TiPd alloy. The HTXRD measurement at 823 K before the reverse martensitic transformation provided that the lattice parameters were a = 0.461 nm, b = 0.285 nm, c = 0.481 nm in the orthorhombic B19 (Pmma) structure. One at 873 K after the reverse martensitic transformation indicates that the lattice constant of the cubic B2 (Pmm) structure was identified to be a = 0.318 nm. These were in good agreement with previous studies [3]. By using these lattice constants, the individual transformation strain of each lattice-corresponding variant in the parent phase was calculated, and the transformation strain in the entire measured region was analyzed with the area ratio of individual crystal grains. Table 1a,b lists the transformation strain corresponding to each grain in Figure 2(a-1) and (b-1), respectively. It can be seen that the positive and negative values were calculated for each region, indicating the expansion and shrinking, respectively, of each grain during martensitic transformation. From Table 1a, it was found that the transformation strain was −0.649% as a whole in the 90° sample, and it showed that the 90° sample tended to change in the direction of shrinking when martensitic transformation occurred from the B2 structure to the B19 structure. This is consistent with the TMA measurement of Figure 1a. In Table 1b, the transformation strain was −1.091% as a whole in the 0° sample and therefore, the direction of shape change due to martensitic transformation was the same as in the 90° sample. This tendency is in disagreement with the TMA measurement of Figure 1b. Thus, there was the need to perform as many extensive EBSD measurements as possible. Furthermore, in order to clarify the relationship between the shape change and the crystal orientation exactly, compression tests and the isobaric test were performed.
3.2. Microstructure and Shape Change of Equiatomic TiPd Alloy during the Isobaric Test
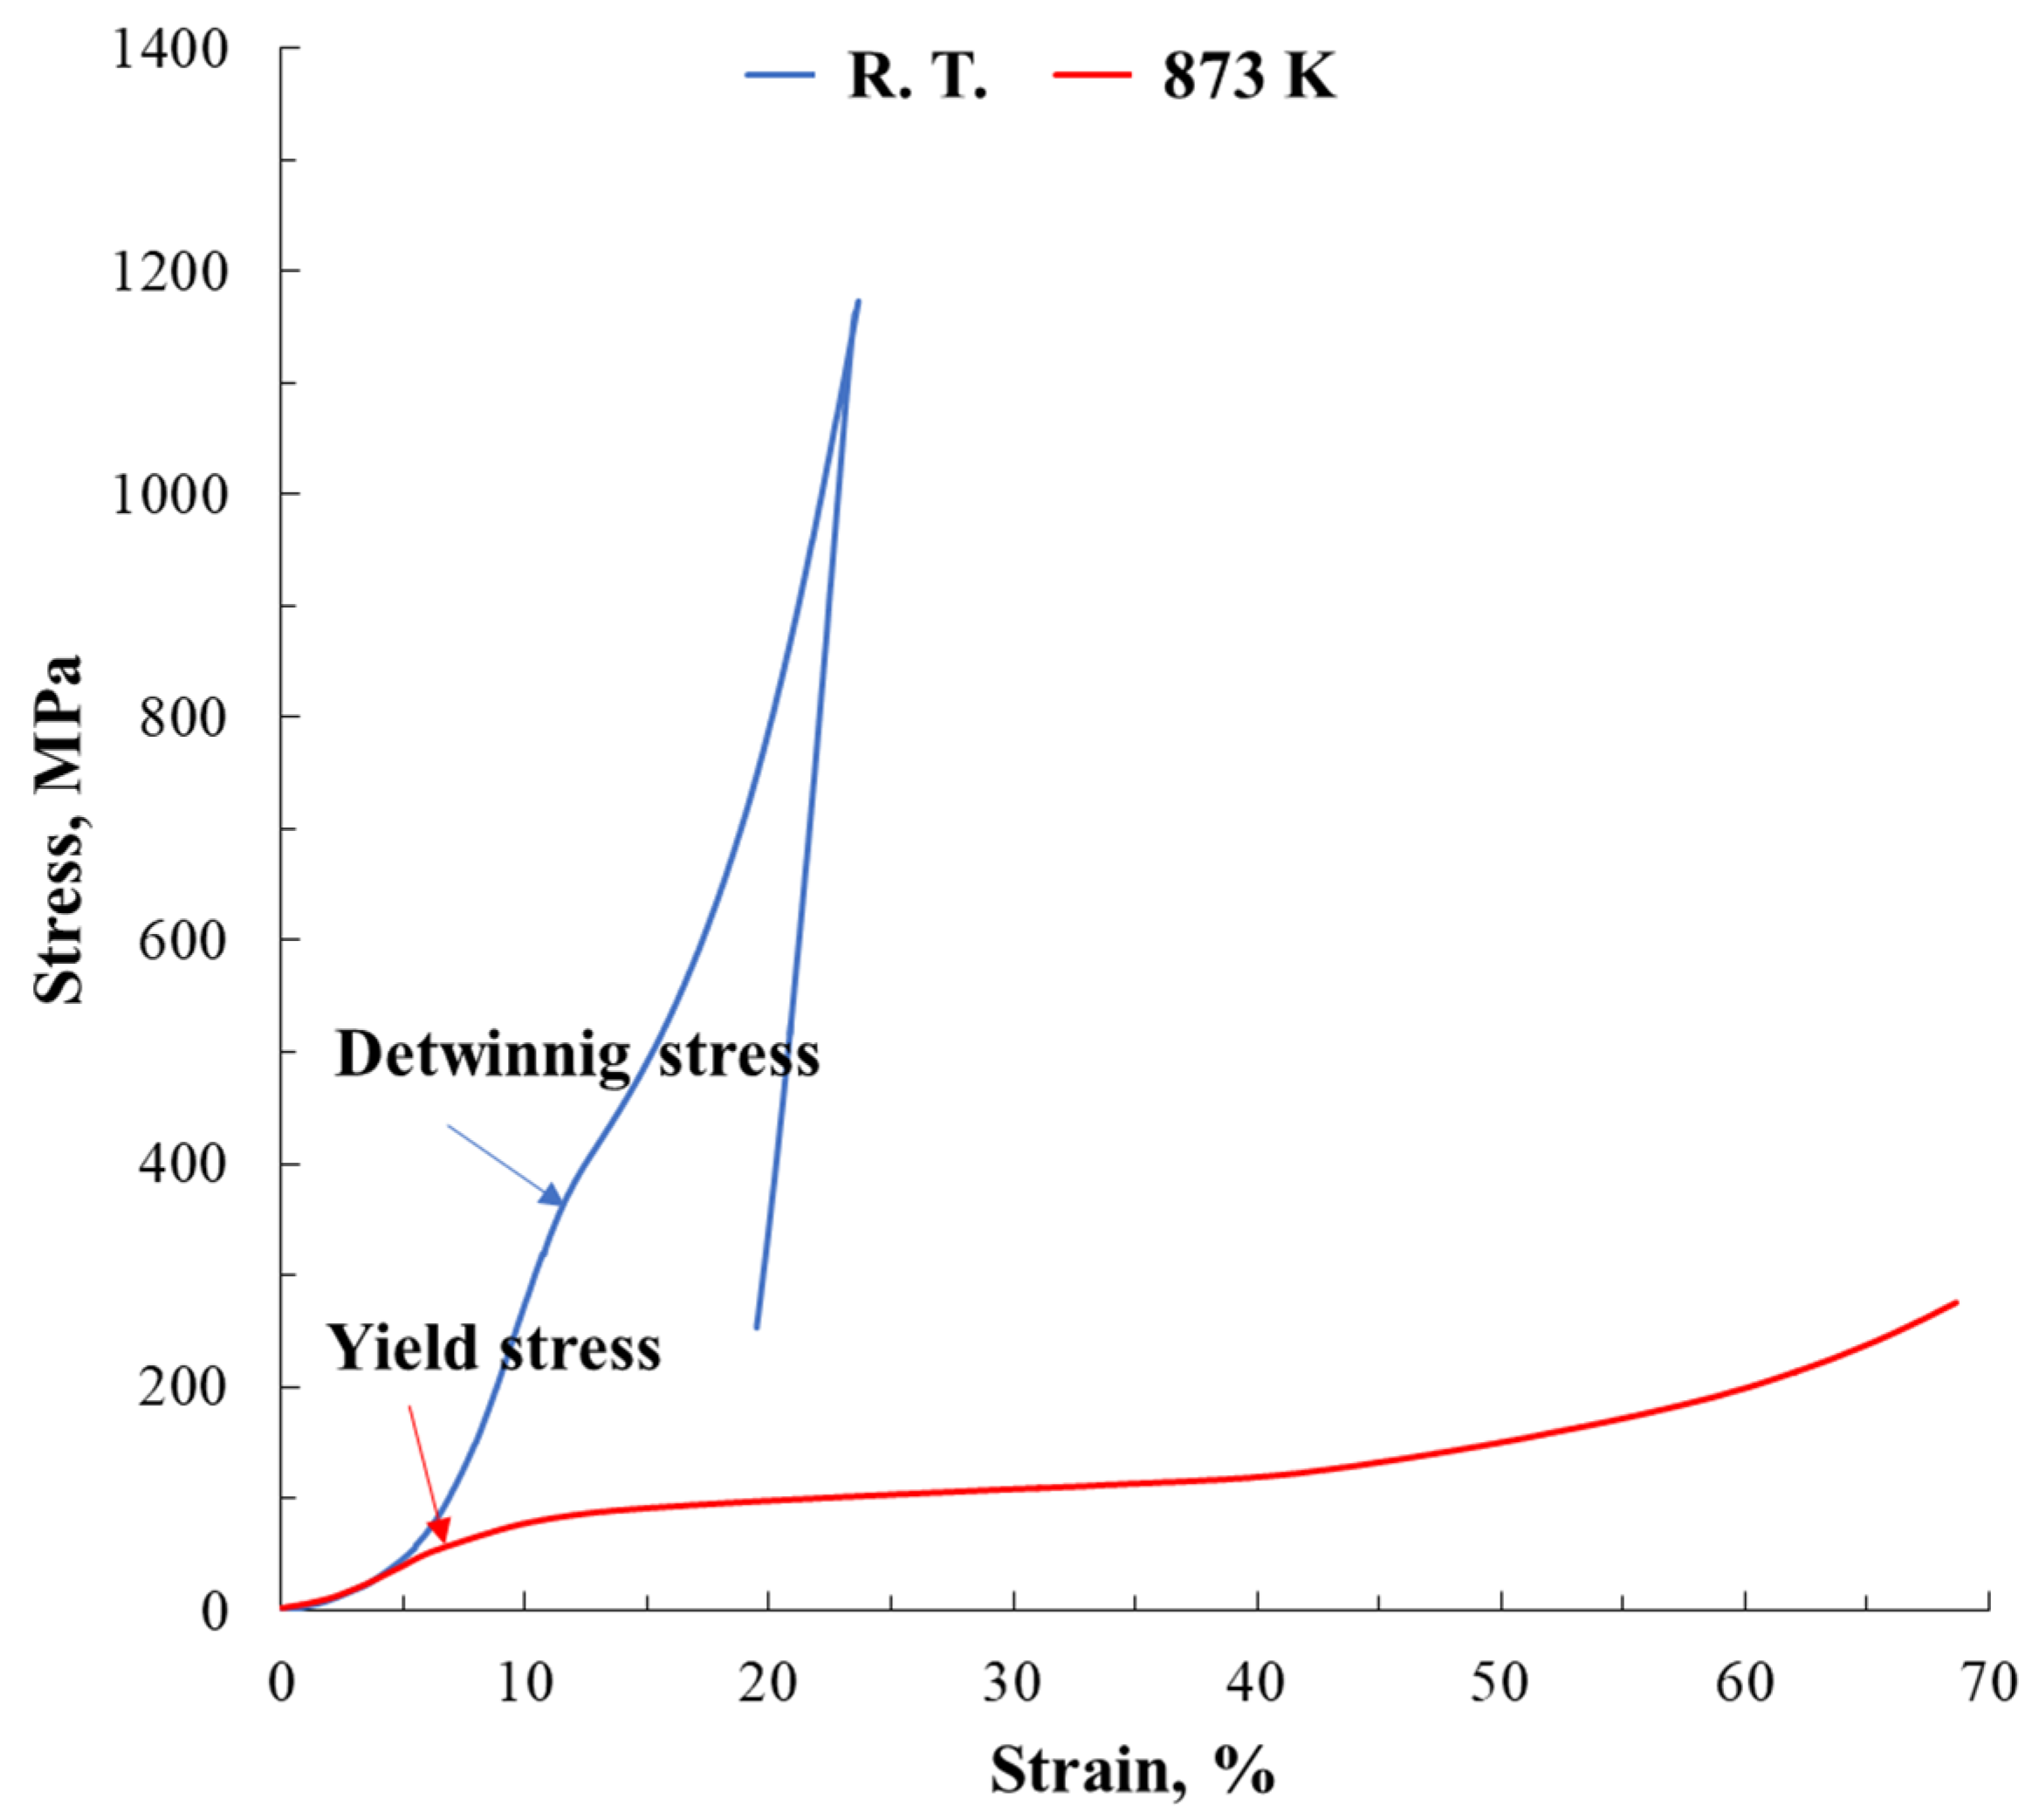
Before the isobaric test, the compression test was performed to investigate the detwinning stress and the yield point in the equiatomic TiPd alloy. Figure 3 shows the stress–strain curves in the compression test at room temperature and 873 K. In the martensitic phase at room temperature, only single yielding was observed. The detwinning and yield stress of the TiPd alloy in the previous study at 758 K [4,5] were 249 and 617 MPa, respectively. Thus, it is considered that the single yielding of 390 MPa obtained at room temperature was the detwinning stress. It seems that the yield point was not obtained due to brittleness of the TiPd alloy at room temperature because fracture occurred during increasing stress. In addition, at 873 K after the reverse transformation of the martensitic transformation, the yield point (0.2% proof stress) was 62 MPa. This was in good agreement with previous studies [4,5].
Based on the HTXRD measurements and compression tests, the isobaric test was as follows: the compressive specimens with the longitudinal direction between the center side and the edge side of button ingot were heated from room temperature to 923 K (Af or more), cooled to 723 K (Mf or less), heated again to 923 K, and returned to room temperature. The load was applied at 50 MPa, which was less than the yield point. Figure 4 is the strain–temperature curves from the forward transformation of the martensitic transformation in the first cycle, which was the test result after once heating from room temperature to 923K. In Figure 4, it is confirmed that the shape changed due to forward and reverse martensitic transformation during cooling and heating, respectively, which is similar to the the TMA test shown in Figure 1a. The values between Ms and Mf in Figure 4 indicate the transformation strain, which includes the recovery strain and the plastic strain. The transformation strain between As and Af shows only the recovery strain. EBSD measurements were performed to investigate changes in the crystal orientation due to this isobaric test.
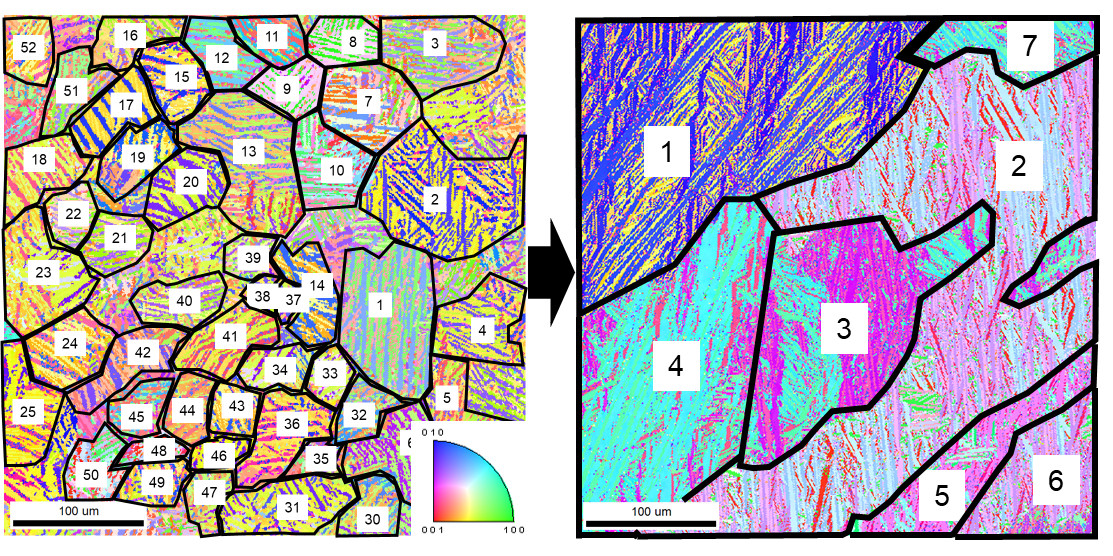
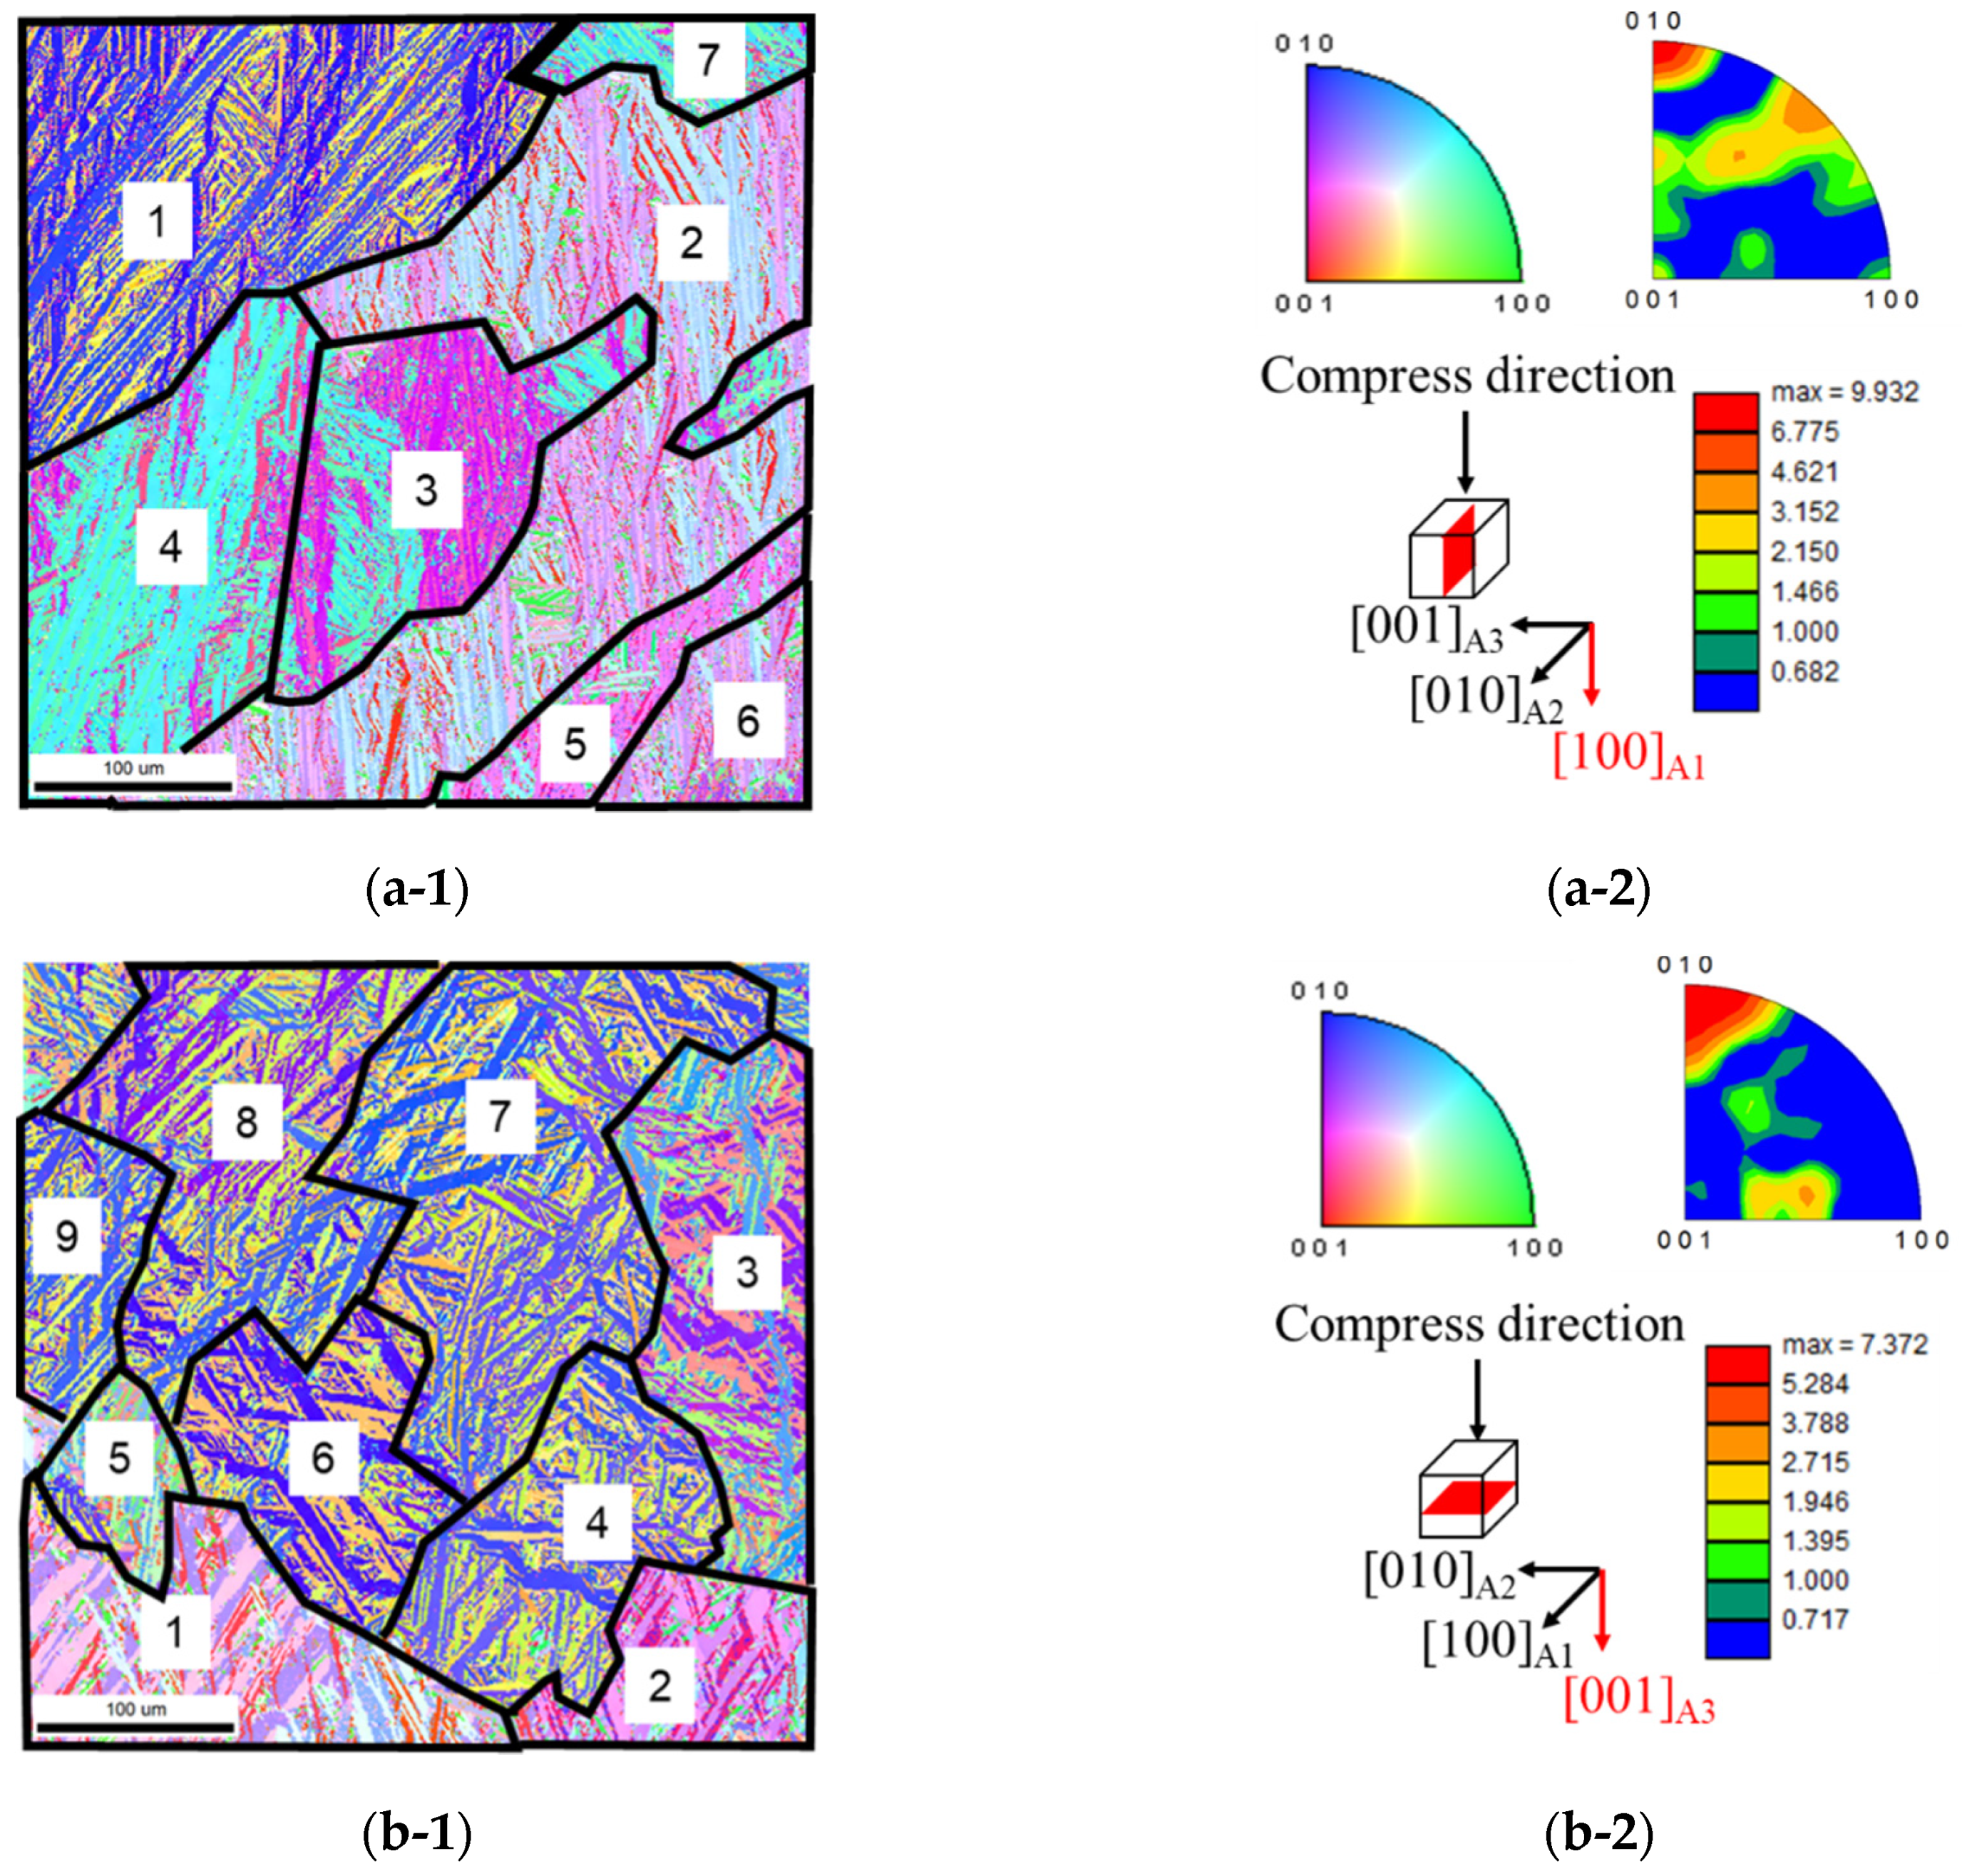
Figure 5(a-1,2) and 5(b-1,2) show the EBSD results of the cross-section and the plan-view in the compression direction after the isobaric test in Figure 4, respectively, where the A1 direction in Figure 5(a-1,2) and the A3 direction in Figure 5 (b-1,2) correspond to the compression direction. In the A1 direction of Figure 5(a-1,2) and the A3 direction of Figure 5(b-1,2), it can be seen that plate-shaped martensitic variants are strongly oriented to (010). This originated from the rearrangement of martensitic variants due to stress-loading [6]. Although the micrographs are not included here, it was found that the texture was more strongly oriented to a (010) plane for the entire sample after the compression test at room temperature in Figure 3. Consequently, it became clear that when the compressive load was applied to the martensitic phase on the equiatomic TiPd alloy, it was strongly oriented to (010). Comparing the old parent phases of the EBSD results after the isobaric test in Figure 5(a-1) and the corresponding cut surface of the 0° sample in Figure 2b, it can be seen that the grain size of the old parent phase after the isobaric test is clearly larger. Since the isobaric test was performed at 50 MPa, it is unlikely that the parent phase became large due to the recrystallization in the martensitic phase itself during the isobaric test. Therefore, the coarsening of B2 grains originated from repeating the forward and reverse martensitic transformation during the isobaric test. Using the same method as in Table 1, the transformation strain for each grain after the isobaric test shown in Figure 5 are summarized in Table 2. The positive and negative values are calculated for each region as in Table 1. The calculated transformation strain does not include the plastic strain, that is, as it corresponds to the values between As and Af in Figure 4. The total transformation strain for the perpendicular and parallel to the compression direction indicated 1.690% and −2.863% as listed in Table 2a,b, respectively, indicating the expansion and shrinking due to the martensitic transformation. The shrinking for the parallel to the compression direction shown in Table 2b was consistent with the isobaric test in Figure 4. Furthermore, when comparing each corresponding transformation strain shown in Table 1 and Table 2, the total strain increased from −0.649% in Table 1a to −2.863% in Table 2b by the isobaric test. Moreover, the expansion for the perpendicular to the compression direction expressed as 1.690 in Table 2a was in agreement with the TMA measurement in Figure 1b. This larger transformation strain and the agreement of direction for shape change is due to the texture with a specific crystal orientation by the isobaric test.
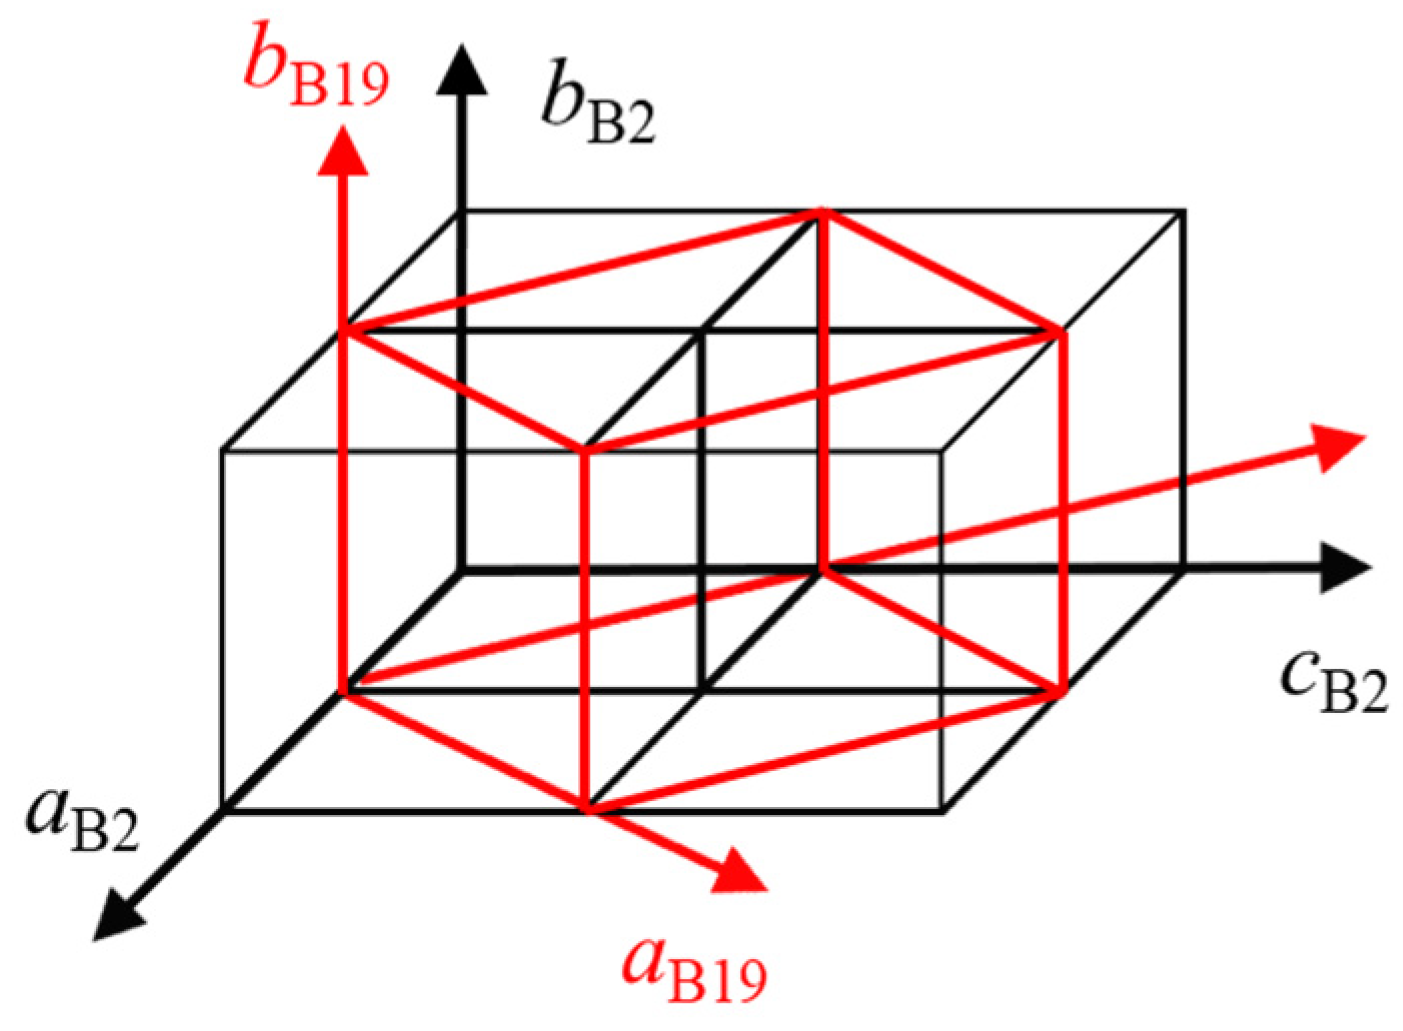
Here, we discuss the relationship between the shape change and the atomic movements associated with martensitic transformation, that is, a shear-shuffling mechanism. Figure 6 schematically shows the relationship of the lattice correspondence between the B2 and the B19 structure in the equiatomic TiPd alloy. The shear-shuffling orientation of the equiatomic TiPd alloy has been reported as (101) []B2 [19]. The b-axis of the B2 phase, which is the vertical direction for the shear-shuffling orientation, shrinks by martensitic transformation, and then the a- and c-axes of the B2 phase, which are the parallel direction for it, expand during martensitic transformation. Based on Figure 4, Figure 5(b-1) and Table 2b with the isobaric test, martensitic variants oriented to a (010) plane along the compression direction, and then the transformation strain for each variant and the shape change indicate the shrinkage. This direction is perpendicular to the shear-shuffling orientation. On the other hand, Table 2a indicates that the transformation strain and shape change of the vertical direction for the compression one tends to be an expansion. This direction is parallel to the shear-shuffling orientation. These results are summarized as follows. The martensitic variants arrange with compressive loading as the isobaric test, and then orient along the (010) plane to be perpendicular for the shear-shuffling direction during martensitic transformation. The sample also expands in a direction parallel to the shear-shuffling orientation. Consequently, there is a close relationship between the shape change due to the crystal orientation by the isobaric test and the shear-shuffling direction due to martensitic transformation. As a material design for high-temperature shape memory alloys, it is very useful to control the crystal orientation of martensitic variants by the isobaric test by considering the shear-shuffling mechanism due to martensitic transformation, leading to the improvement of shape memory characteristics.
4. Conclusions
In this study, the texture and shape change of the equiatomic TiPd alloy were investigated by EBSD measurement, TMA and compression tests. The relationship between the shape change and the shear-shuffling mechanism associated with martensitic transformation are also discussed. The obtained results are summarized as follows.
- (1)
- TMA tests indicate that the direction of the shape change was different between the 0° and 90° samples cutting out parallel and perpendicular to the hearth side of button ingot, respectively. In the 0° sample, shrinking and expansion were, respectively, observed during the reverse and forward martensitic transformations, whereas the opposite tendency was confirmed in the 90° sample compared to the 0° sample.
- (2)
- During the isobaric test, the martensitic variants arranged and oriented to a (010) plane with compressive loading, and the B2 parent phase crystals also became coarse. There was a close relationship between the shape change due to the crystal orientation by the isobaric test and the shear-shuffling direction due to martensitic transformation. The sample shrank along the compression direction, which is perpendicular to the shear-shuffling orientation. In the vertical direction for the compressive loading, the sample expands in a direction parallel to the shear-shuffling orientation.
Author Contributions
S.H., M.M. and Y.Y.-M. conceived and designed the experiments; S.H. performed the experiments, analyzed the data, wrote original draft preparation; M.M. and Y.Y.-M. wrote review and editing. All authors have read and agreed to the published version of the manuscript.
Funding
This work was supported by JSPS KAKENHI Grant Number JP19KK0125.
Conflicts of Interest
The authors declare no conflict of interest.
References
- Otsuka, K.; Sawamura, T.; Shimizu, K. Crystal Structure and Internal Defects of Equiatomie TiNi Martensite. Physica Status Solidi 1971, 5, 457–470. [Google Scholar] [CrossRef]
- Jani, J.M.; Leary, M.; Subic, A.; Gibson, M.A. A review of shape memory alloy research, applications and opportunities. Mater. Des. 2014, 56, 1078–1113. [Google Scholar] [CrossRef]
- Donkersloot, H.C.; Van Vucht, J.H.N. Martensitic transformations in gold-titanium, palladium-titanium and platinum-titanium alloys near the equiatomic composition. J. Less Common Metals 1970, 20, 83–91. [Google Scholar] [CrossRef]
- Yamabe-Mitarai, Y. Development of High-Temperature Shape Memory Alloys Above 673 K. Mater. Sci. Forum 2016, 879, 107–112. [Google Scholar] [CrossRef]
- Yamabe-Mitarai, Y.; Arockiakumar, R.; Wadood, A.; Suresh, K.S.; Kitashima, T.; Hara, T.; Shimojo, M.; Tasaki, W.; Takahashi, M.; Takahashi, S.; et al. Ti(Pt, Pd, Au) based high temperature shape memory alloys. Mater. Today Proc. 2015, 2S, 517–522. [Google Scholar] [CrossRef]
- Sato, H.; Kim, H.Y.; Shimojo, M.; Yamabe-Mitarai, Y. Training effect on microstructure and shape recovery in Ti-Pd-Zr alloys. Mater. Trans. 2017, 58, 1479–1486. [Google Scholar] [CrossRef] [Green Version]
- Wayman, C.M.; Duerig, T.W. Engineering Aspects of Shape Memory Alloys; Butterworth-Heinemann: Oxford, UK, 1990; p. 10. [Google Scholar]
- Bigelow, G.S.; Padula, S.A., II; Garg, A.; Noebe, R.D. Correlation between mechanical behavior and actuator-type performance of Ni-Ti-Pd high-temperature shape memory alloys. In Proceedings of the 14th International Symposium on: Smart Structures and Materials & Nondestructive Evaluation and Health Monitoring, San Diego, CA, USA, 18–22 March 2007. [Google Scholar]
- Hisada, S.; Matsuda, M.; Takashima, K.; Yamabe-Mitarai, Y. Structural analysis and martensitic transformation in equiatomic HfPd alloy. J. Solid State Chem. 2018, 258, 712–717. [Google Scholar] [CrossRef]
- Mohapatra, G.; Sommer, F.; Mittemeijer, E.J. Calibration of a quenching and deformation differential dilatometer upon heating and cooling: Thermal expansion of Fe and Fe-Ni alloys. Thermochimica Acta 2007, 453, 31–41. [Google Scholar] [CrossRef]
- Wang, J.J.; Omori, T.; Sutou, Y.; Kainuma, R.; Ishida, K. Two-way shape memory effect induced by cold-rolling in Ti-Ni and Ti-Ni-Fe alloys. Scr. Mater. 2005, 52, 311–316. [Google Scholar] [CrossRef]
- Inoue, H.; Miwa, N.; Inakazu, N. Texture and shape memory strain in TiNi alloy sheets. Acta Mater. 1996, 44, 4825–4834. [Google Scholar] [CrossRef]
- Liu, Y.; Xie, Z.L.; Van Humbeeck, J.; Delaey, L. Effect on texture orientation on the martensite deformation of NiTi shape memory alloy sheet. Acta Mater. 1999, 47, 645–660. [Google Scholar] [CrossRef]
- Otsuka, K.; Ren, X. Physical metallurgy of Ti-Ni-based shape memory alloys. Prog. Mater. Sci. 2005, 50, 511–678. [Google Scholar] [CrossRef]
- Shu, Y.C.; Bhattacharya, K. The influence of texture on the shape memory effect in polycrystals. Acta Mater. 1998, 46, 5457–5473. [Google Scholar] [CrossRef] [Green Version]
- Sutou, Y.; Omori, T.; Yamauchi, K.; Ono, N.; Kainuma, R.; Ishida, K. Effect of grain size and texture on pseudoelasticity in Cu-Al-Mn-based shape memory wire. Acta Mater. 2005, 53, 4121–4133. [Google Scholar] [CrossRef]
- Kim, H.Y.; Sasaki, T.; Okutsu, K.; Kim, J.I.; Inamura, T.; Hosoda, H.; Miyazaki, S. Texture and shape memory behavior of Ti-22Nb-6Ta alloy. Acta Mater. 2006, 54, 423–433. [Google Scholar] [CrossRef]
- Pawley, G.S. Unit-cell refinement from powder diffraction scans. J. Appl. Cryst. 1981, 14, 357–361. [Google Scholar] [CrossRef]
- Otsuka, K.; Ren, X. Recent developments in the research of shape memory alloys. Intermetallics 1999, 7, 511–528. [Google Scholar] [CrossRef]
Figure 1.
Strain as a function of temperature during thermo-mechanical test of equiatomic TiPd alloy. (a) 90 and (b) 0 degrees sample.
Figure 1.
Strain as a function of temperature during thermo-mechanical test of equiatomic TiPd alloy. (a) 90 and (b) 0 degrees sample.

Figure 2.
Inverse pole figures and texture plots on A3 direction of equiatomic TiPd alloy. (a-1,2) 90 and (b-1,2) 0 degrees sample.
Figure 2.
Inverse pole figures and texture plots on A3 direction of equiatomic TiPd alloy. (a-1,2) 90 and (b-1,2) 0 degrees sample.

Figure 3.
Compress test of equiatomic TiPd alloy.

Figure 4.
Strain-Temperature curves of equiatomic TiPd alloy. The applied stress is 50 MPa.
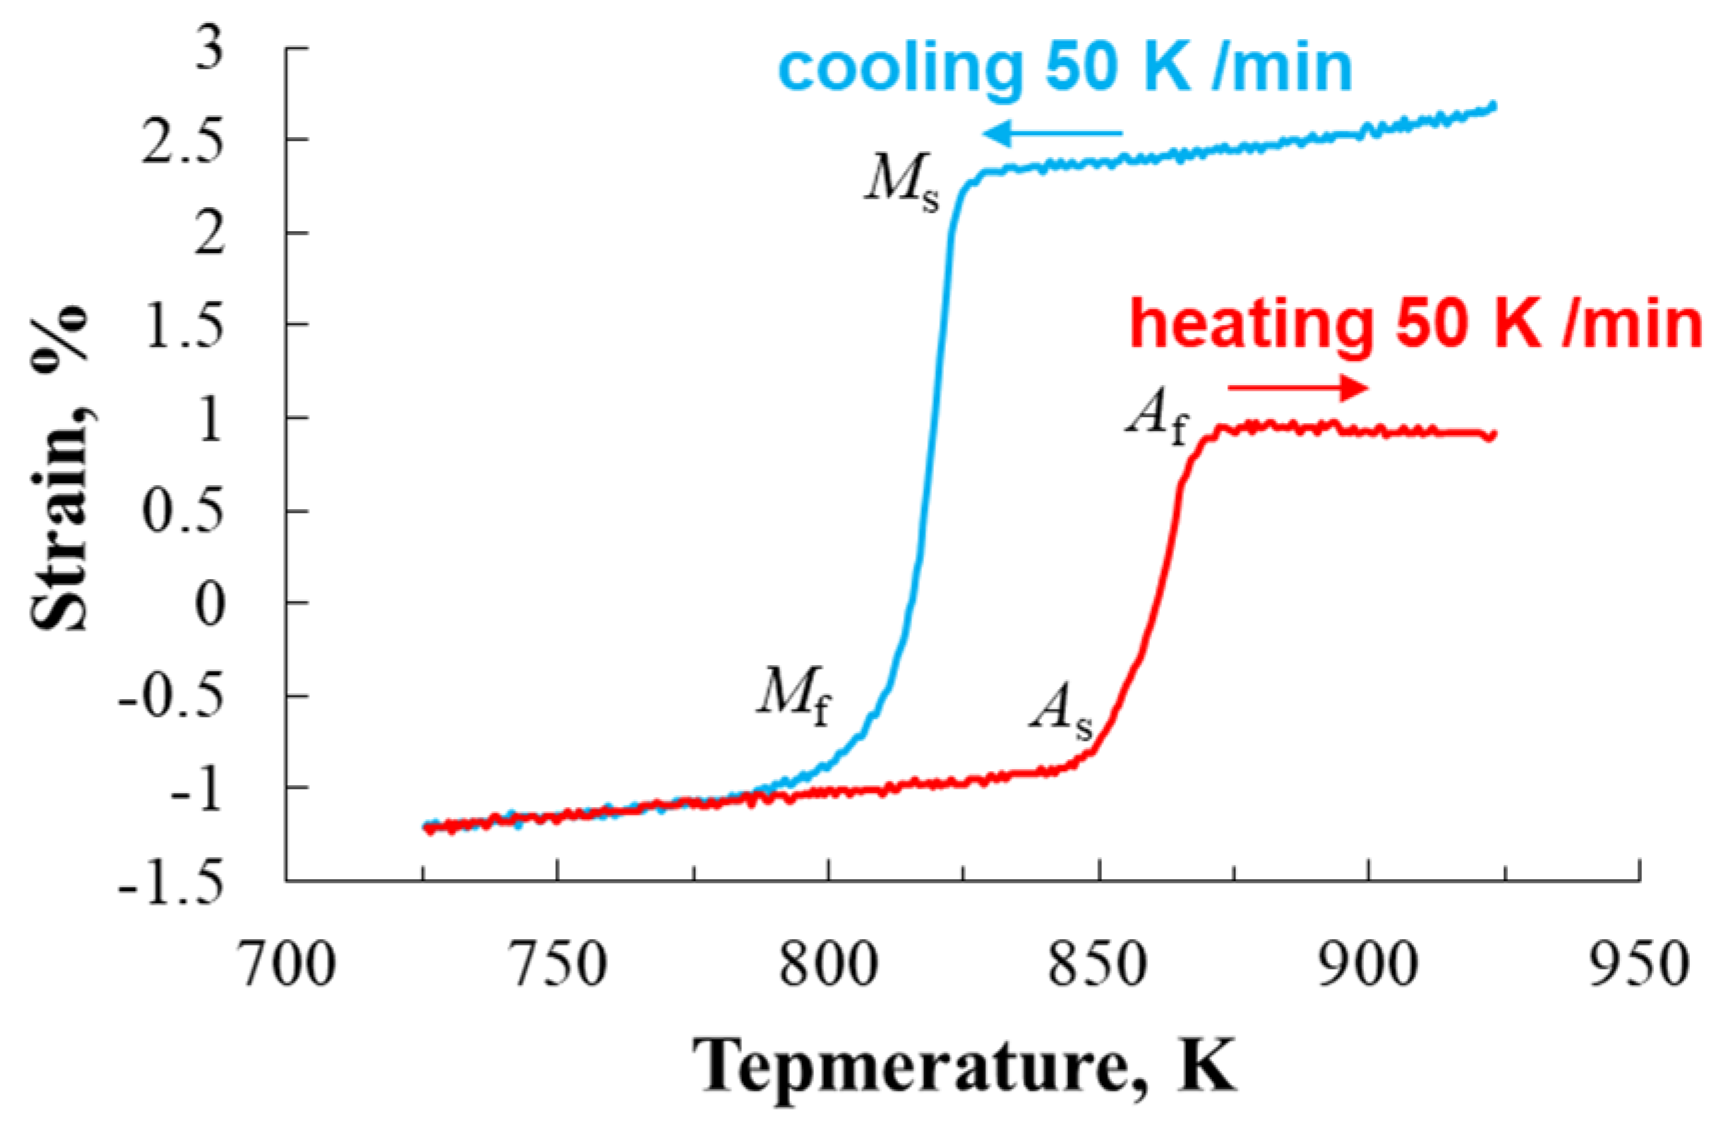
Figure 5.
Inverse pole figures and texture plots on the (a-1,2) A1 direction of the isobaric tested equiatomic TiPd alloy cut in the compression direction and the (b-1,2) A3 direction of the tested equiatomic TiPd alloy cut in a vertical compression direction.
Figure 5.
Inverse pole figures and texture plots on the (a-1,2) A1 direction of the isobaric tested equiatomic TiPd alloy cut in the compression direction and the (b-1,2) A3 direction of the tested equiatomic TiPd alloy cut in a vertical compression direction.

Figure 6.
Lattice correspondence between B2 parent phase and B19 martensite phase.


Table 1.
Transformation strain calculated by the electron backscatter diffraction (EBSD) results of the equiatomic TiPd alloy. (a) 90 and (b) 0-degree sample.
Table 1.
Transformation strain calculated by the electron backscatter diffraction (EBSD) results of the equiatomic TiPd alloy. (a) 90 and (b) 0-degree sample.
| (a) | (b) | ||||||
|---|---|---|---|---|---|---|---|
| Area | ε(%) | Area | ε(%) | Area | ε(%) | Area | ε(%) |
| 1 | −0.807 | 1 | −0.314 | 19 | 0.003 | 37 | −0.003 |
| 2 | −0.805 | 2 | −0.313 | 20 | −0.147 | 38 | −0.014 |
| 3 | −0.751 | 3 | −0.073 | 21 | −0.043 | 39 | 0.013 |
| 4 | 0.268 | 4 | −0.107 | 22 | −0.019 | 40 | 0.005 |
| 5 | 0.773 | 5 | 0.039 | 23 | 0.218 | 41 | 0.099 |
| Total | −0.649 | 6 | −0.171 | 24 | −0.033 | 42 | 0.037 |
| 7 | −0.031 | 25 | 0.101 | 43 | 0.007 | ||
| 8 | −0.014 | 26 | −0.084 | 44 | −0.013 | ||
| 9 | −0.075 | 27 | 0.026 | 45 | 0.001 | ||
| 10 | −0.050 | 28 | −0.058 | 46 | 0.026 | ||
| 11 | 0.020 | 29 | 0.003 | 47 | 0.018 | ||
| 12 | −0.123 | 30 | 0.041 | 48 | 0.020 | ||
| 13 | 0.071 | 31 | −0.025 | 49 | −0.018 | ||
| 14 | −0.061 | 32 | −0.019 | 50 | 0.011 | ||
| 15 | −0.040 | 33 | 0.031 | 51 | −0.007 | ||
| 16 | 0.048 | 34 | 0.029 | 52 | 0.041 | ||
| 17 | −0.047 | 35 | 0.019 | Total | −1.091 | ||
| 18 | −0.002 | 36 | −0.110 | ||||
Table 2.
Transformation strain calculated by the EBSD results of the isobaric tested equiatomic TiPd alloy. (a) Vertical compression direction and (b) compression direction.
Table 2.
Transformation strain calculated by the EBSD results of the isobaric tested equiatomic TiPd alloy. (a) Vertical compression direction and (b) compression direction.
| (a) | (b) | ||
|---|---|---|---|
| Area | ε (%) | Area | ε (%) |
| 1 | 0.660 | 1 | −1.165 |
| 2 | 0.828 | 2 | 0.159 |
| 3 | −0.051 | 3 | −3.059 |
| 4 | 0.285 | 4 | −2.906 |
| 5 | 0.010 | 5 | −0.535 |
| 6 | −0.012 | 6 | −0.288 |
| 7 | −0.029 | 7 | −3.993 |
| Total | 1.690 | 8 | −3.950 |
| 9 | −3.982 | ||
| Total | −2.863 | ||
© 2020 by the authors. Licensee MDPI, Basel, Switzerland. This article is an open access article distributed under the terms and conditions of the Creative Commons Attribution (CC BY) license (http://creativecommons.org/licenses/by/4.0/).
Share and Cite
MDPI and ACS Style
Hisada, S.; Matsuda, M.; Yamabe-Mitarai, Y. Shape Change and Crystal Orientation of B19 Martensite in Equiatomic TiPd Alloy by Isobaric Test. Metals 2020, 10, 375. https://doi.org/10.3390/met10030375
AMA Style
Hisada S, Matsuda M, Yamabe-Mitarai Y. Shape Change and Crystal Orientation of B19 Martensite in Equiatomic TiPd Alloy by Isobaric Test. Metals. 2020; 10(3):375. https://doi.org/10.3390/met10030375
Chicago/Turabian StyleHisada, Shota, Mitsuhiro Matsuda, and Yoko Yamabe-Mitarai. 2020. "Shape Change and Crystal Orientation of B19 Martensite in Equiatomic TiPd Alloy by Isobaric Test" Metals 10, no. 3: 375. https://doi.org/10.3390/met10030375
Note that from the first issue of 2016, this journal uses article numbers instead of page numbers. See further details here.