Copper Corrosion Behavior in Simulated Concrete-Pore Solutions


1
Applied Physics Department, Research Center for Advanced Study (CINVESTAV-IPN), Mérida 97310, Mexico
2
Department of Chemistry, University of Nevada, Reno, 1664 N. Virginia St., Reno, NV 89557, USA
*
Author to whom correspondence should be addressed.
Metals 2020, 10(4), 474; https://doi.org/10.3390/met10040474
Submission received: 9 March 2020
/
Revised: 30 March 2020
/
Accepted: 31 March 2020
/
Published: 4 April 2020
(This article belongs to the Special Issue Corrosion Effects on Durability of RC Structures)
Abstract
:The copper corrosion was studied for 30 days in two alkaline electrolytes: saturated Ca(OH)2 and cement extract, employed to simulate concrete-pore environments. Electrochemical Impedance Spectroscopy (EIS) and Cyclic Voltammetry were carried out at the open circuit potential (OCP), and potentiodynamic polarization (PDP) curves were performed for comparative purposes. Electrochemical current fluctuations, considered as electrochemical noise (EN), were employed as non-destructive methods. The tests revealed that sat. Ca(OH)2 is the less aggressive to the Cu surface, mainly because of the lower in one order pH. In consequence, the OCP values of Cu were more positive, the polarization resistance values were higher by one order of magnitude, and the anodic currents of Cu were lower than those in the cement extract. The analyzed EN indicated that the initial corrosion attacks on the Cu surface are quasi-uniform, resulting from the stationary persistent corrosion process occurring in both model solutions. XPS analysis and X-ray diffraction (XRD) patterns revealed that in sat. Ca(OH)2, a Cu2O/CuO corrosion layer was formed, which effectively protects the metallic Cu-surface. We present evidence for the sequential oxidation of Cu to the (+1) and (+2) species, its impact on the corrosion layer, and also its protective properties.
Keywords:
concrete pore; alkaline solution; cement extract; sat. Ca(OH)2; corrosion tests; copper oxides; XPS; XRD
1. Introduction
Concrete-embedded metals corrode in fresh and humid concrete, where the direct metal oxidation in the pore alkaline environment leads to changes at the metal interface during the curing time. The corrosion process can stop when a protective oxide film is formed on the metal surface, the so-called passive layer. If the concrete is dry, it is unlikely to promote metal corrosion. However, the corrosion could proceed later in the hardened concrete when its pores, capillaries and cavities contain humidity, and dissolved ionic ingredients extracted from the cement are aggressive against metal in the presence of oxygen diffused at the metal surface (except for aluminum, for example) [1]. Further, this internal electrolyte increases the electrical conductivity of concrete, which raises the rate of the electrochemical anodic process that in turn accelerates the corrosion process [2].
Metals other than reinforcing steel frequently embedded in or used in contact with concrete are principally aluminum, copper, lead and zinc [2]. According to Halstead’s report [3], copper pipes are used in concrete when there is no contamination with ammonia. The use of copper in the construction field is fully spread in residential electrical wiring and the transport of water, heating, natural gas and refrigeration [4]. On the other hand, it is also used in gutters and downspouts, suspended gutters, vertical walls, the crowning of walls, expansion joints for buildings, and in wall covering [5].
According to Pourbaix diagrams [6], copper may have good corrosion resistance in aqueous salt solutions in a wide pH range (5–12), as well as being relatively insensitive to chloride salts because of the low solubility of the copper(I)-chloride corrosion product [7,8]. It is reported that, in air, a Cu(I)-oxide layer forms on copper and its alloys, which, once embedded in most concrete or cement mortar, undergoes negligible uniform corrosion, because this layer presents low solubility [7,8]. In cement with higher alkalinity (pH value of the cement stone-pores solution > 13.3), copper is not sufficiently resistant [9]. According to Freedman, the copper surface should be protected when it comes into contact with concrete mixtures containing high sulfur components, such as slag cement, ash and fly ash, because they may lower the pH, and promote a relatively acidic environment that is highly corrosive to most metals, including copper [9]. Xu et al. consider that the copper oxide growth is significantly retarded by the presence of sulfur [10], because the corrosion redox potential in sulfide environments is several hundred millivolts more negative than that required for copper oxide formation [11]. Therefore, this fact suggests that the formation of Cu2S and CuS could occur at values close to the redox potential (corrosion potential, OCP) in cement extract solution.
The corrosion behavior of copper was investigated in aqueous solutions of different pH values, using electrochemical and surface analysis methods [12]. At sufficiently high pH (12 pH to 13 pH values) the film grown on the Cu surface is covered by a layer mainly composed of protective monoclinic cupric oxide (CuO), with the inclusion of copper hydroxide. The reported anodic reactions are [11]:
it is considered that Cu2O oxide (1) is insoluble in water and is a hydrophobic substance, factors which affect to a certain extent the interaction of polar water molecules with the surface [13].
2Cu + 2OH− → Cu2O + H2O + 2e−,
Cu + 2OH− → CuO + H2O + 2e−,
Cu + 2OH− → Cu(OH)2 + 2e−,
The cathodic reaction involves the reduction of oxygen, the diffusion of which through the oxide layer controls the corrosion process [11]:
O2 + H2O + 4e− → 4OH−,
Studies of metals in concrete are a topic of discussion with regard to instrumental techniques and data interpretation [14,15]. Reported difficulties in experimental measurements include the electrode and cell design, the potential drop (IR) in the concrete and its compensation, the development of macro-corrosion cells and the restriction of oxygen diffusion [16]. The use of submerged electrodes in model solutions that simulate the concrete-pore electrolyte avoids many of the above difficulties [16,17,18,19]. The model solutions allow comparative results to be obtained, and control of some testing parameters, which are difficult to achieve with concrete samples, mainly not homogeneous in their internal surface. Many model solutions have been proposed, including the use of a saturated aqueous solution of Ca(OH)2 (pH 12–13) [14,16,18,20,21,22,23], aqueous KOH and NaOH [24,25,26,27], and cement extract solution [11,16,28,29]. The most commonly reported model is the saturated Ca(OH)2 solution. However, the composition of the concrete-pore solution is more complex, since it includes other compounds extracted from the cement in the presence of humidity, in addition to Ca(OH)2. Previously, several studies have reported the electrochemical corrosion behavior of carbon steel, stainless AISI 304 and 316 in concrete-pore model solutions [16,30,31,32,33,34,35,36].
Despite the use of copper in the construction industry, very little systematic work has been carried out on the behavior of copper and its alloys in contact with concrete, and their corrosion mechanism in concrete-pore solutions has not yet been clarified. Therefore, in view of the advantages of model solutions, it is appropriate to study the corrosion behavior of copper in this type of environment, because it allows comparative results to be obtained, and some testing parameters to be controlled, which are difficult to achieve in the non-homogeneous internal surface of concrete samples. The contact of metal and mineral materials (produced with cement) plays an important role from a corrosion-technical point of view.
There are few studies on the corrosion susceptibility of copper exposed to concrete environments, and most of these do not employ electrochemical techniques, even though they have the advantage of being practical and fast [2,4,7,8,11].
In this work, we characterize the initial stages of the corrosion of copper exposed to two model electrolyte solutions for up to 720 h (30 days), simulating the electrolyte of the concrete-pore, viz saturated calcium hydroxide solution and cement extract solution, renamed as I and II solutions, respectively. The research was carried out with different electrochemical and surface analysis methods, such as: open circuit potential monitoring and electrochemical current fluctuations, considered as electrochemical noise (EN), which were employed as two non-destructive methods; electrochemical impedance spectroscopy (EIS), potentiodynamic polarization (PDP) curves, cyclic voltammetry (CV), scanning electron microscopy (SEM) and X-Ray Diffraction (XRD). Some authors have used a few of these techniques to characterize the attack suffered by steels in concrete [37,38] or in solutions that simulate concrete [16,35,39], as well as to determine the corrosion products that are formed during the process.
2. Materials and Methods
2.1. Samples and Solution Preparation
Commercial copper sheet (>99.99%) was cut into square samples of 1 cm2, and these were cleaned with ethanol. All samples were abraded with wet SiC paper to 4000 grit, using ethanol as lubricant, and then it was sonicated, and dried in air prior to immersion tests. The solution I (sat. Ca(OH)2), used to simulate the non-carbonated concrete pore, was prepared from analytical grade reagent Ca(OH)2 (Sigma-Aldrich, St. Louis, MO, USA) and ultrapure deionized water (18.2 MΩ·cm). For the solution II (cement extract) a 1:1 wt./wt. mixture of Portland cement type I produced by CEMEX (CEMEX, S.A.B. de C.V., San Pedro Garza García, N.L., México) was used, along with ultrapure deionized water. Table 1 gives the chemical composition of the cement used, and that of the cement-extracted solution after filtration according to Wang et al. [40]. The mixture was stored for 24 h, in order to allow cement hydration, and it was kept in a sealed container to avoid absorption of CO2 from the air. Subsequently, the suspended particles were removed from the supernatant by filtering the solution II with a 125 mm pore-size filter paper (Whatman, Kent, UK). Copper behavior was studied in the absence of chlorides, because the copper surface in concrete is not usually exposed to Cl− ions during the initial stages. The pH values of the solutions I and II were 12 and 13, respectively. The pH was regularly checked by a pH meter, and the Cu samples were immediately immersed to avoid carbonation effects.
2.2. Immersion Tests and Surface Characterization
The Cu flat samples (1 cm × 1 cm × 0.3 cm) were immersed in 100 mL of solutions I and II (triplicated) according to the American Society for Testing and Materials (ASTM) standard guide for the laboratory immersion corrosion testing of metals [41]. They were withdrawn after 1 h, 24 h, 360 h and 720 h, rinsed with deionized water, and dried in air at room temperature (21 °C). In order to evaluate the damage on the copper surface, the corrosion products formed were removed from the surface of the samples exposed for 720 h, submerged them in a sulfuric acid solution during 2 min at 21 °C, according to the cleaning procedure recommended by ASTM G1 standard [42]. Further, their surfaces were characterized by Scanning Electron Microscopy (SEM-EDS, XL-30 ESEM-JEOL JSM-7600F, JEOL Ltd., Tokyo, Japan). The corrosion products were analyzed with an X-Ray Diffraction instrument (Siemens D-5000, Munich, Germany) and X-Ray Photoelectron Spectroscopy (K-Alpha, Thermo Scientific, Waltham, MA, USA).
2.3. Electrochemical Measurements
An Interface-1000E potentiostat/galvanostat/ZRA (Gamry Instruments, Philadelphia, PA, USA) was used for electrochemical experiments, with a typical three-electrode cell configuration inside a Faraday cage. The working electrode was the copper plate with an exposed area of 0.8 cm2, and the Pt plate was used as an auxiliary, and a saturated calomel electrode (SCE) as the reference electrode. All experiments were carried out at room temperature (21 °C). Electrochemical Impedance Spectroscopy (EIS) measurements were performed at the open circuit potential (OCP), applying an AC signal of ±15 mV amplitude, in a frequency range from 100 kHz to 10 mHz, and with a sampling size of 10 data points/decade. EIS diagrams were recorded at different immersion periods in solutions I and II: 30 min (initial), 24 h, 360 h and 720 h. Potentiodynamic polarization (PDP) curves were made for comparative purposes at initial time of immersion (30 min), with a scan rate of 10 mV·s−1, starting from −0.35 V to 0.35 V vs. OCP. Both EIS diagrams and PDP curves were analyzed with Gamry Echem Analyst® software (Gamry Instruments, version 7.0.1, Philadelphia, PA, USA). Cyclic Voltammetry was carried with scan range of −1.2 V in cathodic direction and 0.5 V in anodic direction from OCP and with scan rate of 25 mV·s−1 and 100 mV·s−1. Before voltammetry experiments, the open circuit potential of the electrodes in the model solution was monitored until it stabilized (30 min). All CV scans started in open circuit potential, then subsequently continuing in the cathodic direction. For each sample, 10 cycles were run. All potentials refer to the SCE, and anodic currents are shown as positive.
For Electrochemical Noise measurements (EN), two identical working electrodes and the SCE reference electrode were employed, according to ASTM G199-09 standard [43]. The three electrodes were connected to the potentiostat in the zero-resistance ammeter mode (ZRA) to record both current and potential values with a sampling frequency of 1 Hz during 24 h. Subsequently, the acquired EN signals were pre-processed, transformed and analyzed by the Electrochemical Signal Analyzer® software (Gamry Instruments, version 7.0.1, Philadelphia, PA, USA).
3. Results and Discussion
Copper plates were prepared in the same manner as those used as control. Figure 1 shows the SEM image of copper sample, as well as its elemental EDS analysis, which shows high copper content corresponding to the matrix, as well as lower oxygen content.
Figure 2 shows the XPS of the control Cu sample (without immersion in the model solution). The XPS determined the existence of a native copper oxide layer, which was not possible to detect by XRD. These facts indicate that the oxide is present probably as an amorphous nanometric layer, formed by a direct air-oxidation mechanism [44,45]. Despite the low oxygen content revealed by the EDS analysis for the control sample, XPS (Figure 2) mainly indicates the presence of Cu2O, which seems to form immediately on the surface of the copper when it comes in contact with the air. The oxidation rate decreases over time, and practically stops when the thickness of the cuprite film reaches 5 nm [45].
3.1. Surface Morphology and Analysis of the Cu Surface after Exposure to Concrete-Pore Solutions I and II
3.1.1. Scanning Electronic Microscopy
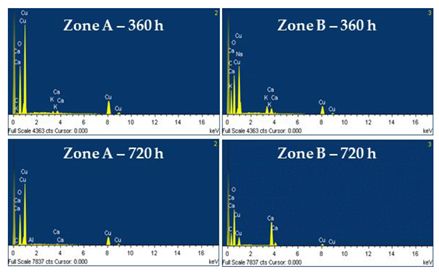
SEM images of the Cu surface, after exposure for 360 h and 720 h to sat. Ca(OH)2 (solution I), are shown in Figure 3a,b. These images and their respective EDS analysis (Table 2) suggest that on the copper surface the corrosion layer formed presents two different morphological visible zones: the lighter A and the darker B. The layer elemental analysis of zone A presents high contents of copper and relatively low values for oxygen, which ratio probably corresponds to copper oxide. EDS analysis indicates the presence of Ca traces in zone A, while in zone B the calcium content is significant, accompanied by carbon and twice higher oxygen contents. These results permit the conclusion that the layer in the darker zones B could be considered as formed by CaCO3, which is the main product of the reaction of atmospheric CO2 with Ca(OH)2 [46], even though the container was open only during the time taken for measurements.
The copper surface also changes after immersion in cement extract (solution II) for 360 h (Figure 4a) and 720 h (Figure 4b), presenting formed corrosion layer having a morphology and elemental composition in two distinguishable zones, labeled as A and B. The EDS composition of zones A (Table 3) is very similar to that observed on copper after exposure to solution I for 360 h and 720 h (Figure 3a,b, Table 2), indicating that the surface of copper is mainly covered by Cu-oxide. Meanwhile, the dark zone B extends in area over time and the formation of CaCO3 is more significant in content (Figure 4b, Table 3), presenting crystals with larger size. The EDS analysis (Table 3) also shows the presence of elements such as Na, K and Al originating from the cement extract (solution II).
Figure 5 compares Cu surfaces, the corrosion layers of which were removed after exposure for 720 h to sat. Ca(OH)2 (solution I, Figure 5a), and cement extract (solution II, Figure 5b). The images indicate that the observed corrosion attack on the copper surface is more pronounced after exposure in the cement extract model solution (Figure 5b).
3.1.2. X-ray Diffraction Patterns
According to the reports [12,47,48,49] in alkaline solution the corrosion layer of copper consists of tenorite (CuO), cuprite (Cu2O), as two stable oxides having black and reddish color, respectively, and copper hydroxide (Cu(OH)2). Figure 6 presents X-ray diffraction patterns of the layers formed on Cu surface after exposure for 720 h in each of the concrete-pore model solutions. It can be seen that after 720 h of immersion in sat. Ca(OH)2 model solution (Figure 6a), CuO was formed as a main corrosion copper product, accompanied by CaCO3 at very low intensity and a low signal of Cu2O, another corrosion product at this later period of test.
In the case of samples immersed in cement extract (Figure 6b), CuO and CaCO3 were also detected. However, Cu(OH)2 was also detected after 720 h of immersion, and this fact suggests that in solution II (cement extract), the corrosion layer is a mix of two compounds: CuO and Cu(OH)2.
3.1.3. X-ray Photoelectron Spectroscopy
In order to investigate at which stage in time Cu(OH)2 was formed on the copper surface in cement extract model solution, XPS was performed. The analysis (Figure 7) indicated that this copper corrosion product was formed during the initial 24 h of immersion (Equation (3)), destroying the protective layer of Cu2O oxide.
3.2. Electrochemical Measurements
3.2.1. Open Circuit Potential (OCP)
Table 4 shows the recorded values of open circuit potential (OCP), considered as the free corrosion potential of Cu exposed for different immersion times in each concrete-pore medium: sat. Ca(OH)2 (solution I) and cement extract (solution II). It should be noted that the values of OCP of Cu in solution I are more positive than those of Cu in solution II, and at the end of this experiment OCP shifts by ≈90 mV to a more positive value (152 mV, Table 4), indicating the growth of a protective layer after the immersion in sat. Ca(OH)2 model solution, mainly composed of CuO according to the XRD spectra (Figure 6a). However, in cement extract the OCP maintained less positive values, and at the end of the experiment was even lower (29 mV) than the initial value (47 mV). These facts suggest that the formed layer on the Cu surface, composed of CuO/Cu(OH)2/CaCO3 (Figure 6b), offers less efficient protection, than that formed in the sat. Ca(OH)2 model solution. We considered that the pH difference between the two model solutions is the determining factor in the corrosion potential value and corrosion rate.
3.2.2. Electrochemical Impedance Spectroscopy (EIS)
Figure 8 presents EIS Nyquist plots for a copper surface, exposed for different periods (up to 720 h) to each concrete-pore model solutions. The incomplete semicircle shape can be attributed to the double-layer capacitance, as well as to the charge transfer resistance of the surface, because of the layers formed upon it. In the case of copper in the sat. Ca(OH)2 solution I (Figure 8a), it may be seen that the size of the incomplete capacitive semicircle increases with time, up to the maximum exposure time of 720 h. However, in cement extract solution II (Figure 8b), the capacitive arch increases during up to 360 h of immersion and then shows a slight decline. The difference in the protective efficiency of the layers grown on copper reflects the order of the impedance magnitude, i.e., one order lower in solution II, indicating that the corrosion layer is less protective for the copper surface that that formed in solution II of the cement extract. This fact correlates well with the more positive values of OCP in model solution I (Table 4), as well as with the difference in the composition of corrosion layers, according to XRD (Figure 6) and XPS (Figure 7) analysis, and in line with the above comments.
At high frequencies (between 100 Hz and 1000 Hz) the EIS Bode plots (Figure 9) show the total impedance associated with the solution resistance (Rs) at the Cu-electrolyte interface and specifics of the electrochemical corrosion process. There is approximately one order of difference in Rs, being higher in solution I, which fact indicates that the CuO layer is difficult to penetrate of active species and oxygen molecules. At frequencies between 1 Hz and 0.01 Hz, the total impedance can be attributed to the electrochemical corrosion process, which occurs on the metal surface: the formation of several corrosion products—Cu2O, CuO and Cu(OH)2 [50,51,52]. It may be seen that, with the passage of time, the tendencies in change of the total impedance for Cu in both model solutions follow those reported above for OCP values (Table 4). The EIS diagrams suggest also that the copper behavior followed different mechanism in I and II concrete-pore model solutions. Nishikata et al. consider that if the phase shift θ goes further than −45° (Figure 9) on a plot of θ vs log f (f-frequency), the current distribution becomes uniform at least in the low frequency limit, and an accurate corrosion rate can be determined from the obtained polarization resistance [53].
The equivalent electric circuit that theoretically models the behavior of copper exposed to both model solutions is presented in Figure 10. (This circuit presents an average of goodness of fit of 10−4).
The circuit as proposed includes a solution resistor (Rs), as well as a capacitor (Ccp) and a resistor (Rcp), both associated with the corrosion product layer (Cu2O/CuO or Cu2O/CuO/Cu(OH)2). Cdl is the double-layer capacitance, and Rct is the charge transfer resistance. For satisfactory EIS diagram simulation, it is necessary to replace the capacitors (Ccp and Cdl) with a constant phase element (CPE) in the equivalent circuit [54]. The CPE element is equal to [C(jω) × n]−1, where C corresponds to the interfacial capacitance, j is the imaginary number, ω is the angular frequency, and n is an exponential factor in the range between 0 and 1; when n = 1, there is an ideal capacitor, and when n = 0, an ideal resistor is involved [55]. The most accepted common explanation of the presence of CPE and incomplete semicircles on solid electrodes is microscopic roughness, causing a non-homogeneous distribution in the solution resistance, as well as in the double-layer capacitance [56]. The magnitude of the exponent n indicates the degree of homogeneity of the surface. The poor homogeneity of the surface is related to some type of pore structure permeating electrolyte, ions and neutral molecules through it [57]. The low Ccp values (10−5–10−7 F·cm−2·Hz1-ncp) of the copper in both solutions suggest an insignificant contribution of the charge current. At the end of our experiment (720 h), the values of ndl (6.3 × 10⁻¹–8.9 × 10⁻¹, Table 5), for example, indicate that the impedance is not dependent on the presence or absence of redox reactions [57].
Polarization resistance (Rp) was calculated using the following equation [55]:
Rp = Rcp + Rct.
The calculated parameters presenting the equivalent circuit (Figure 10) are listed in Table 6. It can be seen that the charge transfer resistance (Rct), as well as the polarization resistance (Rp) of Cu immersed in sat. Ca(OH)2 increase significantly over the time (in one and two orders, respectively), while in the cement extract solution their rise is in one order lower (Table 6). These facts confirm that the cement extract solution is more aggressive for copper as a concrete-pore model solution, attributable to the variance in the chemical composition of both model solutions, as well as being associated with the difference in composition of the formed corrosion layers on copper surface (Figure 6).
3.2.3. Potentiodynamic Polarization Curves (PDP)
The acquired PDP curves for Cu, exposed to both concrete-pore model solutions, are plotted in Figure 11. It may be noted that the densities of anodic corrosion currents of Cu tend to reach a limiting value after an initial polarization ΔE ≈ 50 mV. A similar fact has been reported for copper sheet in alkaline media [58]. However, the limiting anodic current of Cu immersed in cement extract solution is one order higher than that of Cu in sat. Ca(OH)2. This fact indicates again that the cement extract solution is more aggressive with respect to copper, than is the concrete-pore model of sat. Ca(OH)2. Such dissimilarity observed in PDP curves could be attributed to the variance in the chemical composition of both model solutions, as well being associated with the difference in the composition of the formed corrosion layers on the copper surface (Figure 6). On the other hand, both cathodic curves match significantly (Figure 11), revealing that the cathodic reduction of the initial air-formed Cu2O and the oxygen reduction on the copper cathodic sites, occur in a similar way in both model solutions. However, it could be noted that the cathodic current required for the reduction of Cu2O in sat. Ca(OH)2 solution is higher, but not significantly. Since both types of polarization curves do not have a Tafel region, it is questionable whether the corrosion current density (jcorr) of copper solely should be acquired through Tafel extrapolation. However, it is possible simply to extract the Tafel slopes (ba and bc) from the pre-Tafel region, in the vicinity of the free corrosion potential (Ecorr), in order to consider the activation-controlled kinetics of the systems [59]. The corrosion rate (jcorr) of freely corroding metal in the absence of coverage effects is inversely proportional to polarization resistance, as described by the Stern-Geary relationship [60]:
where B′ is the apparent Stern-Geary coefficient, a function of the anodic and cathodic Tafel slopes (ba and bc). Certain commercially available instruments for polarization resistance measurements use a pre-selected value, such as 30 mV, which based on experience may give adequate accuracy in many cases [61]. The polarization resistance (Rp) was acquired by EIS technique, and Table 6 compares the time evolution of Rp and the jcorr of Cu. The results reveal that the corrosion rate (jcorr), as well as the Rp values of Cu exposed in cement extract solution, has constantly been one order higher than that obtained in sat. Ca(OH)2, confirming that the cement extract solution is more aggressive to copper.
jcorr = B′/Rp,
3.2.4. Electrochemical Noise Measurements
The fluctuations of Cu-electrode current density, exposed to each of the concrete-pore model solutions, were reordered at open circuit potential (OCP) after the first 24 h (Figure 12). The amplitude of the fluctuations was approximately 3 μA·cm−2, and they were considered as electrochemical noise (EN), which indicated a quasi-stationary, persistent process occurring on the Cu surface. The EN signals (Figure 12) were processed with the software, giving the values of σi and irms, corresponding to the standard deviation and the mean square root of the current noise, respectively. They were used to calculate the pitting index (PI), revealing the susceptibility of copper surface to uniform or localized corrosion in these initial stages up to 24 h, following the proposed equation [62]:
PI = σi (irms)−1,
The values of PISol. I = 0.180 and PISol. II = 0.116 revealed that the corrosion occurs as quasi-uniform attacks on the copper surface in both concrete-pore media. According to Dawson [62], only PI values above 0.6 may indicate localized corrosion. The obtained PI values correlate with the low amplitude of the current fluctuations, which are characteristic of the uniform corrosion process [63].
3.2.5. Cyclic Voltammetry Measurements
In order to investigate the stages of copper surface transformation and differentiate the copper behavior exposed to each model solutions, cyclic voltammograms were performed (Figure 13). Voltammograms show two peaks in the anodic region. The first peak, labelled as A, is attributed to the oxidation of metallic copper to cuprous oxide (Cu2O), and the second peak B to CuO or Cu(OH)2 formation [64,65,66], although thermodynamically, the CuO is more stable [67]. It could be noted that the anodic current density of peak A of copper in cement extract solution (Figure 13b) is higher than that in sat. Ca(OH)2, confirming again that the cement extract media is the more aggressive. This fact collaborates with the anodic currents registered by the PDP curves (Figure 11).
Two possible reaction pathways for the formation of Cu2O (peak A) have been proposed: the direct oxidation of copper, via one electron step that leads to the formation of Cu2O (Ec. 7) [11], which initially results in Cu(OH), and which again breaks down into Cu2O through the following reactions [64]:
Cu + OH− → Cu(OH) + e−,
2Cu(OH) → Cu2O + H2O,
However, reaction (3) is more likely thermodynamically [68]:
because the Cu+, and thus, Cu(OH) are not stable species.
2Cu + 2OH− → Cu2O + H2O + 2e−,
The second anodic peak (B) is probably due to the oxidation of cuprous oxide to either (or both) CuO and Cu(OH)2 according to the following equations [64]:
Cu2O + 2OH− → 2CuO + H2O + 2e−,
Cu2O + 2OH− + H2O → 2Cu(OH)2 + 2e−,
The resulting Cu(OH)2, formed in cement extract solution, exists in the following equilibrium [65]:
Cu(OH)2 → CuO + H2O,
Therefore, it is assumed that the second peak of the anodic region could be a multilayer CuO film in contrast to the Cu2O monolayer under the first peak [65].
In the cathodic region, peaks C and D are involved. Peak C could be attributed mainly to the reduction of CuO or Cu(OH)2 to Cu2O [68]. On the other hand, peak D could be attributed to the reduction of the Cu2O to metallic Cu, with the participation of oxygen reduction process [64,65,67,68].
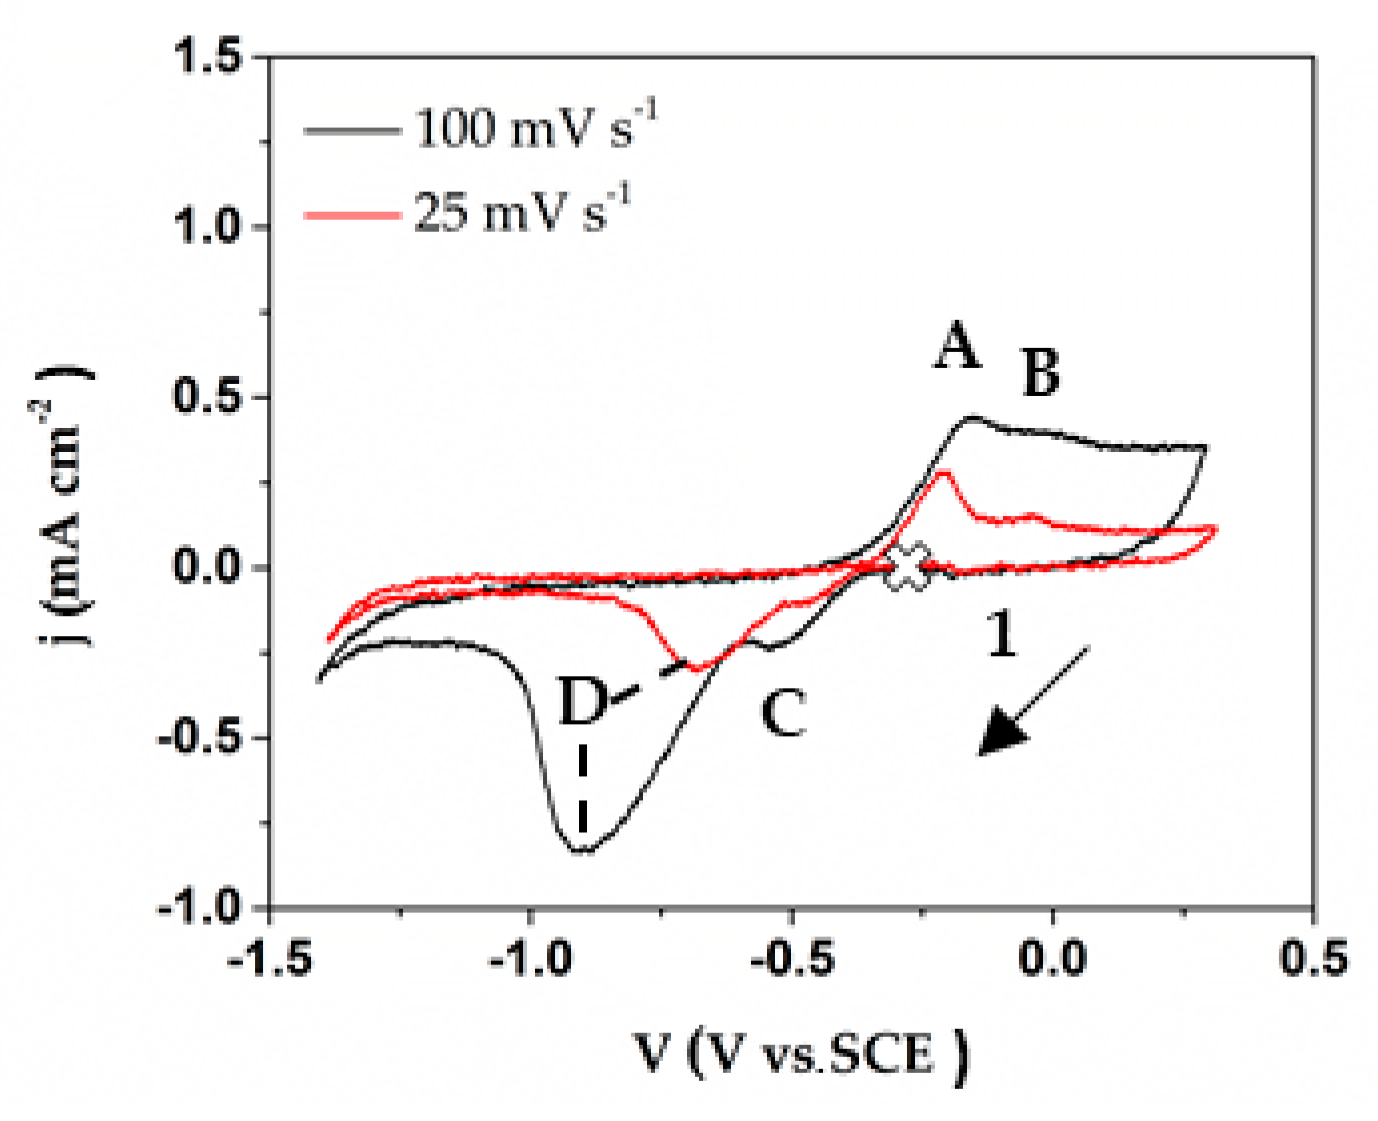
As an example, CVs at two scan rates (25 mV·s−1 and 100 mV·s−1) were performed to study the mechanism of electrode process occurring at the electrode surface of Cu exposed to cement extract solution (Figure 14). It could be noted that with the exception of peak D (reduction of Cu2O to metallic Cu), no other peaks (A, B, C) have a linear dependence between the peak current (ip) and the square root of the scanning speed (v1/2) [69]. This behavior indicates that the processes, which correspond to peaks A, B and C, are not completely controlled by diffusion, because there is a small dependence of the position on the scan rate [70]. The peak D is also limited by kinetics, because the peak position is very sensitive to the scan rate, consistent with a process where kinetics is the limiting step.
The results presented in this study indicate that the cement extract solution (pH 13) is more aggressive than that of sat. Ca(OH)2 (pH 12). This difference could be contributed mainly to the lower in one order pH of sat. Ca(OH)2 model solution, as well as to the variety of ions in the cement extract solution.
4. Conclusions
The present work compares the electrochemical behavior of copper exposed to saturated calcium hydroxide and cement extract alkaline solutions up to 720 h (30 days), as two model electrolytes simulating the concrete-pore. With the time of immersion, the composition of the corrosion layer grown on copper changes in different manner. X-ray diffraction patterns revealed that in solution I, tenorite (CuO) is the predominant corrosion product on the copper surface, while in solution II (cement extract), this layer is a mix of two compounds: CuO and Cu(OH)2, the last formed after the initial time of exposure. In both media, CaCO3 was also detected.
The electrochemical tests revealed that the cement extract (solution II) is more aggressive to copper than the sat. Ca(OH)2 (solution I). This difference contributes mainly to the lower in one order pH of sat. Ca(OH)2 model solution, than that of cement extract, as well as to the presence of a variety of ions, as part of the cement, in addition to Ca2+ ions. As a consequence, the open circuit potential values of Cu are significantly less positive in the cement extract, and the EIS impedance magnitudes are by one order lower, indicating that the formed layer is less protective for the copper surface than that formed in sat. Ca(OH)2 solution. Additionally, the polarization curves (PDP) showed that the value of the limiting anodic current of Cu exposed to cement extract solution is one order of magnitude higher than that in sat. Ca(OH)2 solution, confirming also that the cement extract media is more aggressive for the Cu surface
The equivalent electric circuit obtained for EIS, which models the behavior of copper, fitted satisfactorily to the Nyquist and Bode plots. The calculated parameters presenting the equivalent circuit indicated that the charge transfer resistance (Rct), as well as the polarization resistance (Rp) of Cu immersed in sat. Ca(OH)2 increase significantly in the time (in one and two orders, respectively), while in the cement extract solution their rise is in one order lower. This is another fact, as a consequence of the different pH of both model solutions to the copper surface.
The current density fluctuations of Cu, considered as electrochemical noise (EN), indicated a quasi-stationary, persistent corrosion process occurring on the Cu surface, after exposure to each model solution. In accordance with the calculated pitting index (PI), the corrosion attacks on the copper surface could be considered as quasi-uniform.
Overall, our results lead to the conclusion that, although there are similarities like the fact that model solutions attack the surface in a quasi-uniform manner, the overall copper corrosion develops in different ways in each concrete-pore model solution.
The extract cement electrolyte is more aggressive towards the copper surface. In the CVs experiments, anodic peaks correspond to the formation of a Cu2O monolayer, followed by a complex layer of CuO or Cu(OH)2 under potentiodynamic conditions consistent with the sequential formation of Cu1+ and Cu2+, and therefore, we consider that the corrosion mechanism occurs via two, one-electron oxidation steps.
Author Contributions
Á.B. performed the preparation of samples and the corrosion tests. M.A.A.-A. contributed to the methodology and technical interpretation of the CVs results. Á.B. and L.V. discussed the results and wrote the manuscript, with contributions of all authors. L.V. supervised the project. All correspondence should be addressed to L.V. All authors have read and agreed to the published version of the manuscript.
Funding
This research received no external funding.
Acknowledgments
M.Sci. Ángel Adrián Bacelis Jiménez extends warm thanks to CONACYT, awarding his scholarship as a student at CINVESTAV-IPN, Applied Physics Department. Further, the authors express their gratitude to LANNBIO-CINVESTAV for permitting the use of their facilities, as well as Dora A. Huerta-Quintanilla, Daniel Aguilar and Wilian Cauich for their technical assistance in SEM-EDS, XRD, and XPS analysis. Mario A. Alpuche-Avilés acknowledges the support of NSF Career Award CHE-1255387 and MRI- 1726897.
Conflicts of Interest
The authors declare no conflict of interest.
References
- Emregül, K.C.; Aksüt, A.A. The behavior of aluminum in alkaline media. Corros. Sci. 2000, 42, 2051–2067. [Google Scholar] [CrossRef]
- Woods, H. Corrosion of Embedded Materials Other Than Reinforcing Steel. In Significance of Tests and Properties of Concrete and Concrete-Making Materials; Mielenz, R., Bloem, D., Gregg, L., Gregg, L., Kesler, C., Price, W., Eds.; ASTM International: West Conshohocken, PA, USA, 1966; pp. 230–238. [Google Scholar] [CrossRef]
- Halstead, P.E. The corrosion of metals in contact with concrete. Chem. Ind. 1957, 34, 1132–1137. [Google Scholar]
- Duffó, G.S.; Farina, S.B.; Rodríguez, F.M. Corrosion behaviour of non-ferrous metals embedded in mortar. Constr. Build. Mater. 2019, 210, 548–554. [Google Scholar] [CrossRef]
- Freire, F. Edificio Automatizado de Oficinas: Uso del Cobre en la Arquitectura; Universidad Peruana de Ciencias Aplicadas: Lima, Perú, 2001. [Google Scholar]
- Pourbaix, M. Atlas of Electrochemical Equilibria in Aqueous Solutions; NACE: Houston, TX, USA, 1974; pp. 384–392. [Google Scholar]
- Nürnberger, U. Corrosion of metals in contact with mineral building materials. Otto Graf J. 2001, 12, 69–80. [Google Scholar]
- Nürnberger, U. Corrosion of metals in contact with mineral building materials. In Corrosion of Reinforcement in Concrete. Mechanisms, Monitoring, Inhibitors and Rehabilitation Techniques; Raupach, M., Elsener, B., Polder, R., Mietz, J., Eds.; Woodhead Publishing Limited: Cambridge, UK, 2007; pp. 1–9. [Google Scholar] [CrossRef]
- Freedman, S. Corrosion of nonferrous metals in contact with concrete. Mod. Concr. 1970, 36, 33–34. [Google Scholar]
- Xu, H.C.; Seshadri, G.; Kelber, J.A. Effect of Sulfur on the Oxidation of Copper in Aqueous Solution. J. Electrochem. Soc. 2000, 147, 558–561. [Google Scholar] [CrossRef]
- King, F. Corrosion of Copper in Alkaline Chloride Environments. Swedish Nuclear Fuel and Waste Management Co.: Stockholm, Sweden, 2002; pp. 27–58. [Google Scholar]
- Feng, Y.; Siow, K.S.; Teo, W.K.; Tan, K.L.; Hsieh, A.K. Corrosion mechanisms and products of copper in aqueous solutions at various pH values. Corrosion 1997, 53, 389–398. [Google Scholar] [CrossRef]
- Ma, L.; Wang, L.; Li, C.; Guo, J.; Shrotriya, P.; Deng, C.; Zhao, J. Hybrid nanosecond laser processing and heat treatment for rapid preparation of super-hydrophobic copper surface. Metals 2019, 9, 668. [Google Scholar] [CrossRef] [Green Version]
- Francis, P.; Lee, T. The Use of Synthetic Environments for Corrosion Testing; ASTM International: West Conshohocken, PA, USA, 1988. [Google Scholar] [CrossRef]
- Berke, N.; Chaker, V.; Whiting, D. Corrosion Rates of Steel in Concrete; ASTM International: West Conshohocken, PA, USA, 1990. [Google Scholar] [CrossRef]
- Veleva, L.; Alpuche-Aviles, M.A.; Graves-Brook, M.K.; Wipf, D.O. Comparative cyclic voltammetry and surface analysis of passive films grown on stainless steel 316 in concrete pore model solutions. J. Electroanal. Chem. 2002, 537, 85–93. [Google Scholar] [CrossRef]
- Cabrini, M.; Fontana, F.; Lorenzi, S.; Pastore, T.; Pellegrini, S. Effect of organic inhibitors on chloride corrosion of steel rebars in alkaline pore solution. J. Chem. 2015, 2015, 1–10. [Google Scholar] [CrossRef] [Green Version]
- Cabrini, M.; Lorenzi, S.; Pastore, T. Cyclic voltammetry evaluation of inhibitors for localised corrosion in alkaline solutions. Electrochim. Acta 2014, 124, 156–164. [Google Scholar] [CrossRef]
- Jolivet, D.; Bonen, D.M.; Shah, S.P. The corrosion resistance of coated steel dowels determined by impedance spectroscopy. Cem. Concr. Res. 2007, 37, 1134–1143. [Google Scholar] [CrossRef]
- Andrade, C.; Blanco, V.M.; Collazo, A.; Keddam, M.; Nóvoa, X.R.; Takenouti, H. Cement paste hardening process studied by impedance spectroscopy. Electrochim. Acta 1999, 44, 4313–4318. [Google Scholar] [CrossRef]
- Jiang, J.Y.; Liu, Y.; Chu, H.Y.; Wang, D.; Ma, H.; Sun, W. Pitting Corrosion Behaviour of New Corrosion-Resistant Reinforcement Bars in Chloride-Containing Concrete Pore Solution. Materials 2017, 10, 903. [Google Scholar] [CrossRef] [Green Version]
- Jiang, J.Y.; Wang, D.; Chu, H.Y.; Ma, H.; Liu, Y.; Gao, Y.; Shi, J.; Sun, W. The passive film growth mechanism of new corrosion-resistant steel rebar in simulated concrete pore solution: Nanometer structure and electrochemical study. Materials 2017, 10, 412. [Google Scholar] [CrossRef] [Green Version]
- Cabrini, M.; Lorenzi, S.; Pastore, T. Study of localized corrosion of steel reinforcing in inhibited alkaline solutions. Metall. Ital. 2013, 105, 21–31. [Google Scholar]
- Oranowska, H.; Szklarska-Smialowska, Z. An electrochemical and ellipsometric investigation of surface films grown on iron in saturated calcium hydroxide solutions with or without chloride ions. Corros. Sci. 1981, 21, 735–747. [Google Scholar] [CrossRef]
- Berman, H. The Effect of Sodium Chloride on the Corrosion of Concrete Reinforcing Steel and on the pH of Calcium Hydroxide Solution; Federal Highway Administration: Washington, DC, USA, 1974. [Google Scholar]
- Ftikos, C.; Parissakis, G. The combined action of Mg2+ and Cl− ions in cement pastes. Cem. Concr. Res. 1985, 15, 593–599. [Google Scholar] [CrossRef]
- Zakroczymski, T.; Fan, C.J.; Szklarska-Smialowska, Z. Kinetics and mechanism of passive film formation on iron in 0.05 M NaOH. J. Electrochem. Soc. 1985, 132, 2862–2867. [Google Scholar] [CrossRef]
- Montemor, M.F.; Simoes, A.M. Analytical characterization of the passive film formed on steel in cement past intersticial solutions. Port. Electrochim. Acta 1995, 13, 453–456. [Google Scholar]
- Montemor, M.F.; Simoes, A.M.; Ferreira, M.G. Analytical characterization of the passive film formed on steel in solutions simulating the concrete interstitial electrolyte. Corrosion 1998, 54, 347–353. [Google Scholar] [CrossRef]
- Moreno, M.; Morris, W.; Alvarez, M.G.; Duffó, G.S. Corrosion of reinforcing steel in simulated concrete pore solutions: Effect of carbonation and chloride content. Corros. Sci. 2004, 46, 2681–2699. [Google Scholar] [CrossRef]
- Saremi, M.; Mahallati, E. A study on chloride-induced depassivation of mild steel in simulated concrete pore solution. Cem. Concr. Res. 2002, 32, 1915–1921. [Google Scholar] [CrossRef]
- Bertolini, L.; Bolzoni, F.; Pastore, T.; Pedeferri, P. Behaviour of stainless steel in simulated concrete pore solution. Br. Corros. J. 1996, 31, 218–222. [Google Scholar] [CrossRef]
- Chen, W.; Du, R.G.; Ye, C.Q.; Zhu, Y.F.; Lin, C.J. Study on the corrosion behavior of reinforcing steel in simulated concrete pore solutions using in situ Raman spectroscopy assisted by electrochemical techniques. Electrochim. Acta 2010, 55, 5677–5682. [Google Scholar] [CrossRef]
- Zhang, F.; Pan, J.; Lin, C. Localized corrosion behaviour of reinforcement steel in simulated concrete pore solution. Corros. Sci. 2009, 51, 2130–2138. [Google Scholar] [CrossRef]
- Veleva, L.; Alpuche-Aviles, M.A.; Graves-Brook, M.K.; Wipf, D.O. Voltammetry and surface analysis of AISI 316 stainless steel in chloride-containing simulated concrete pore environment. J. Electroanal. Chem. 2005, 578, 45–53. [Google Scholar] [CrossRef]
- Fajardo, S.; Bastidas, D.M.; Ryan, M.P.; Criado, M.; McPhail, D.S.; Bastidas, J.M. Low-nickel stainless steel passive film in simulated concrete pore solution: A SIMS study. Appl. Surf. Sci. 2010, 256, 6139–6143. [Google Scholar] [CrossRef]
- Bragança, M.O.; Portella, K.F.; Bonato, M.M.; Alberti, E.; Marino, C.E. Performance of Portland cement concretes with 1% nano-Fe3O4 addition: Electrochemical stability under chloride and sulfate environments. Constr. Build. Mater. 2016, 117, 152–162. [Google Scholar] [CrossRef]
- Andrade, C.; Keddam, M.; Nóvoa, X.R.; Pérez, M.C.; Rangel, C.M.; Takenouti, H. Electrochemical behaviour of steel rebars in concrete: Influence of environmental factors and cement chemistry. Electrochim. Acta 2001, 46, 3905–3912. [Google Scholar] [CrossRef]
- Freire, L.; Catarino, M.A.; Godinho, M.I.; Ferreira, M.J.; Ferreira, M.G.; Simoes, A.M.; Montemor, M.F. Electrochemical and analytical investigation of passive films formed on stainless steels in alkaline media. Cem. Concr. Compos. 2012, 34, 1075–1081. [Google Scholar] [CrossRef] [Green Version]
- Wang, L.; Zhan, S.; Tang, X.; Xiu, Q.; Qian, K. Pore Solution Chemistry of Calcium Sulfoaluminate Cement and Its Effects on Steel Passivation. Appl. Sci. 2019, 9, 1092. [Google Scholar] [CrossRef] [Green Version]
- ASTM International. ASTM G31-12a. In Standard Guide for Laboratory Immersion Corrosion Testing of Metals; ASTM International: West Conshohocken, PA, USA, 2012. [Google Scholar]
- ASTM International. ASTM, G-1. In Standard Practice for Preparing, Cleaning, and Evaluating Corrosion Test Specimens; ASTM International: West Conshohocken, PA, USA, 2017. [Google Scholar]
- ASTM International. ASTM, G199-09. In Standard Guide for Electrochemical Noise Measurement; ASTM International: West Conshohocken, PA, USA, 2014. [Google Scholar]
- Mattsson, E.; Holm, R. Copper and Copper alloys. In ASTM STP 435; Ailor, W., Coburn, S., Eds.; ASTM International: West Conshohocken, PA, USA, 1968; pp. 187–210. [Google Scholar] [CrossRef]
- Lopesino, P.; Alcántara, J.; de la Fuente, D.; Chico, B.; Jiménez, J.; Morcillo, M. Corrosion of Copper in Unpolluted Chloride-Rich Atmospheres. Metals 2018, 8, 866. [Google Scholar] [CrossRef] [Green Version]
- Fernández, J.; Renedo, M.J. Sulfation and Carbonation Competition in the Treatment of Flue Gas from a Coal-Based Power Plant by Calcium Hydroxide. Int. J. Chem. React. Eng. 2015, 13, 177–182. [Google Scholar] [CrossRef]
- Ribotta, S.B.; La orgia, L.F.; Gassa, L.M.; Folquer, M.E. Characterization of anodic films formed on copper in 0.1 M borax solution. J. Electroanal. Chem. 2008, 624, 262–268. [Google Scholar] [CrossRef]
- Babić, R.; Metikoš-Huković, M.; Jukić, A. A study of copper passivity by electrochemical impedance spectroscopy. J. Electrochem. Soc. 2001, 148, B146–B151. [Google Scholar] [CrossRef]
- Strehblow, H.H.; Titze, B. The investigation of the passive behaviour of copper in weakly acid and alkaline solutions and the examination of the passive film by esca and ISS. Electrochim. Acta 1980, 25, 839–850. [Google Scholar] [CrossRef]
- Yasuda, H.; Yu, Q.; Chen, M. Interfacial factors in corrosion protection: An EIS study of model systems. Prog. Org. Coat. 2001, 41, 273–279. [Google Scholar] [CrossRef]
- Xia, S.J.; Yue, R.; Rateick, R.G.; Birss, V.I. Electrochemical studies of AC/DC anodized Mg alloy in NaCl solution. J. Electrochem. Soc. 2004, 151, B179–B187. [Google Scholar] [CrossRef]
- Wen, L.; Wang, Y.; Zhou, Y.; Guo, L.; Ouyang, J.H. Microstructure and corrosion resistance of modified 2024 Al alloy using surface mechanical attrition treatment combined with microarc oxidation process. Corros. Sci. 2011, 53, 473–480. [Google Scholar] [CrossRef]
- Nishikata, A.; Ichihara, Y.; Tsuru, T. An application of electrochemical impedance spectroscopy to atmospheric corrosion study. Corros. Sci. 1995, 37, 897–911. [Google Scholar] [CrossRef]
- Danaee, I.; Khomami, M.N.; Attar, A. Corrosion behavior of AISI 4130 steel alloy in ethylene glycol–water mixture in presence of molybdate. Mater. Chem. Phys. 2012, 135, 658–667. [Google Scholar] [CrossRef]
- Galai, M.; Benqlilou, H.; Ebn Touhami, M.; Belhaj, T.; Berrami, K.; El Kafssaoui, H. Comparative analysis for the corrosion susceptibility of copper alloys in sandy soil. Environ. Eng. Res. 2018, 23, 164–174. [Google Scholar] [CrossRef] [Green Version]
- Danaee, I.; Noori, S. Kinetics of the hydrogen evolution reaction on NiMn graphite modified electrode. Int. J. Hydrogen Energy 2011, 36, 12102–12111. [Google Scholar] [CrossRef]
- Naseer, A.; Khan, A.Y. A study of growth and breakdown of passive film on copper surface by electrochemical impedance spectroscopy. Turk. J. Chem. 2009, 33, 739–750. [Google Scholar] [CrossRef]
- Yeganeh, M.; Saremi, M. A comparison between the corrosion behavior of nanostructured copper thin films deposited on oxidized silicon and copper sheet in alkaline media. Surf. Coat. Technol. 2010, 205, 2218–2224. [Google Scholar] [CrossRef]
- Mansfeld, F. Tafel slopes and corrosion rates obtained in the pre-Tafel region of polarization curves. Corros. Sci. 2005, 47, 3178–3186. [Google Scholar] [CrossRef]
- ASTM International. ASTM International. ASTM G102-89. In Standard Practice for Calculation of Corrosion Rates and Related Information from electrochemical Measurements; ASTM International: West Conshohocken, PA, USA, 2015. [Google Scholar]
- Rosborg, B. Recorded Corrosion Rates on Copper Electrodes in the Prototype Repository at the Äspö HRL; Swedish Nuclear Fuel and Waste Management Co.: Stockholm, Sweden, 2013; pp. 7–29. [Google Scholar]
- Dawson, J. Electrochemical Noise Measurement: The Definitive In-Situ Technique for Corrosion Applications. In Electrochemical Noise Measurement for Corrosion Applications; Kearns, J., Scully, J., Roberge, P., Reichert, D., Dawson, J., Eds.; ASTM International: West Conshohocken, PA, USA, 1996; Volume 1277, pp. 3–35. [Google Scholar] [CrossRef]
- Legat, A.; Dolecek, V. Corrosion monitoring system based on measurement and analysis of electrochemical noise. Corrosion 1995, 51, 295–300. [Google Scholar] [CrossRef]
- Zaafarany, I.; Boller, H. Electrochemical behavior of copper electrode in sodium hydroxide solutions. Curr. World Environ. 2009, 4, 277. [Google Scholar] [CrossRef]
- El Haleem, S.A.; Ateya, B.G. Cyclic voltammetry of copper in sodium hydroxide solutions. J. Electroanal. Chem. Interfacial Electrochem. 1981, 117, 309–319. [Google Scholar] [CrossRef]
- Dong, S.; Xie, Y.; Cheng, G. Cyclic voltammetric and spectroelectrochemical studies of copper in alkaline solution. Electrochim. Acta 1992, 37, 17–22. [Google Scholar] [CrossRef]
- Latimer, W. Oxidation Potentials, 2nd ed.; Prentice-Hall: New York, NY, USA, 1952; p. 188. [Google Scholar]
- Ambrose, J.; Barradas, R.G.; Shoesmith, D.W. Investigations of copper in aqueous alkaline solutions by cyclic voltammetry. J. Electroanal. Chem. Interfacial Electrochem. 1973, 47, 47–64. [Google Scholar] [CrossRef]
- Thomas, D.; Rasheed, Z.; Jagan, J.S.; Kumar, K.G. Study of kinetic parameters and development of a voltammetric sensor for the determination of butylated hydroxyanisole (BHA) in oil samples. J. Food Sci. Technol. 2015, 52, 6719–6726. [Google Scholar] [CrossRef] [PubMed] [Green Version]
- Bard, A.; Faulkner, J. Electrochemical Methods—Fundamentals and Applications, 2nd ed.; John Wiley & Sons: New York, NY, USA, 2001; pp. 226–260. [Google Scholar]
Figure 1.
Scanning electron microscopy (SEM) image (3000×) of the copper control sample and its energy-dispersive X-ray spectroscopy (EDS) analysis.
Figure 1.
Scanning electron microscopy (SEM) image (3000×) of the copper control sample and its energy-dispersive X-ray spectroscopy (EDS) analysis.
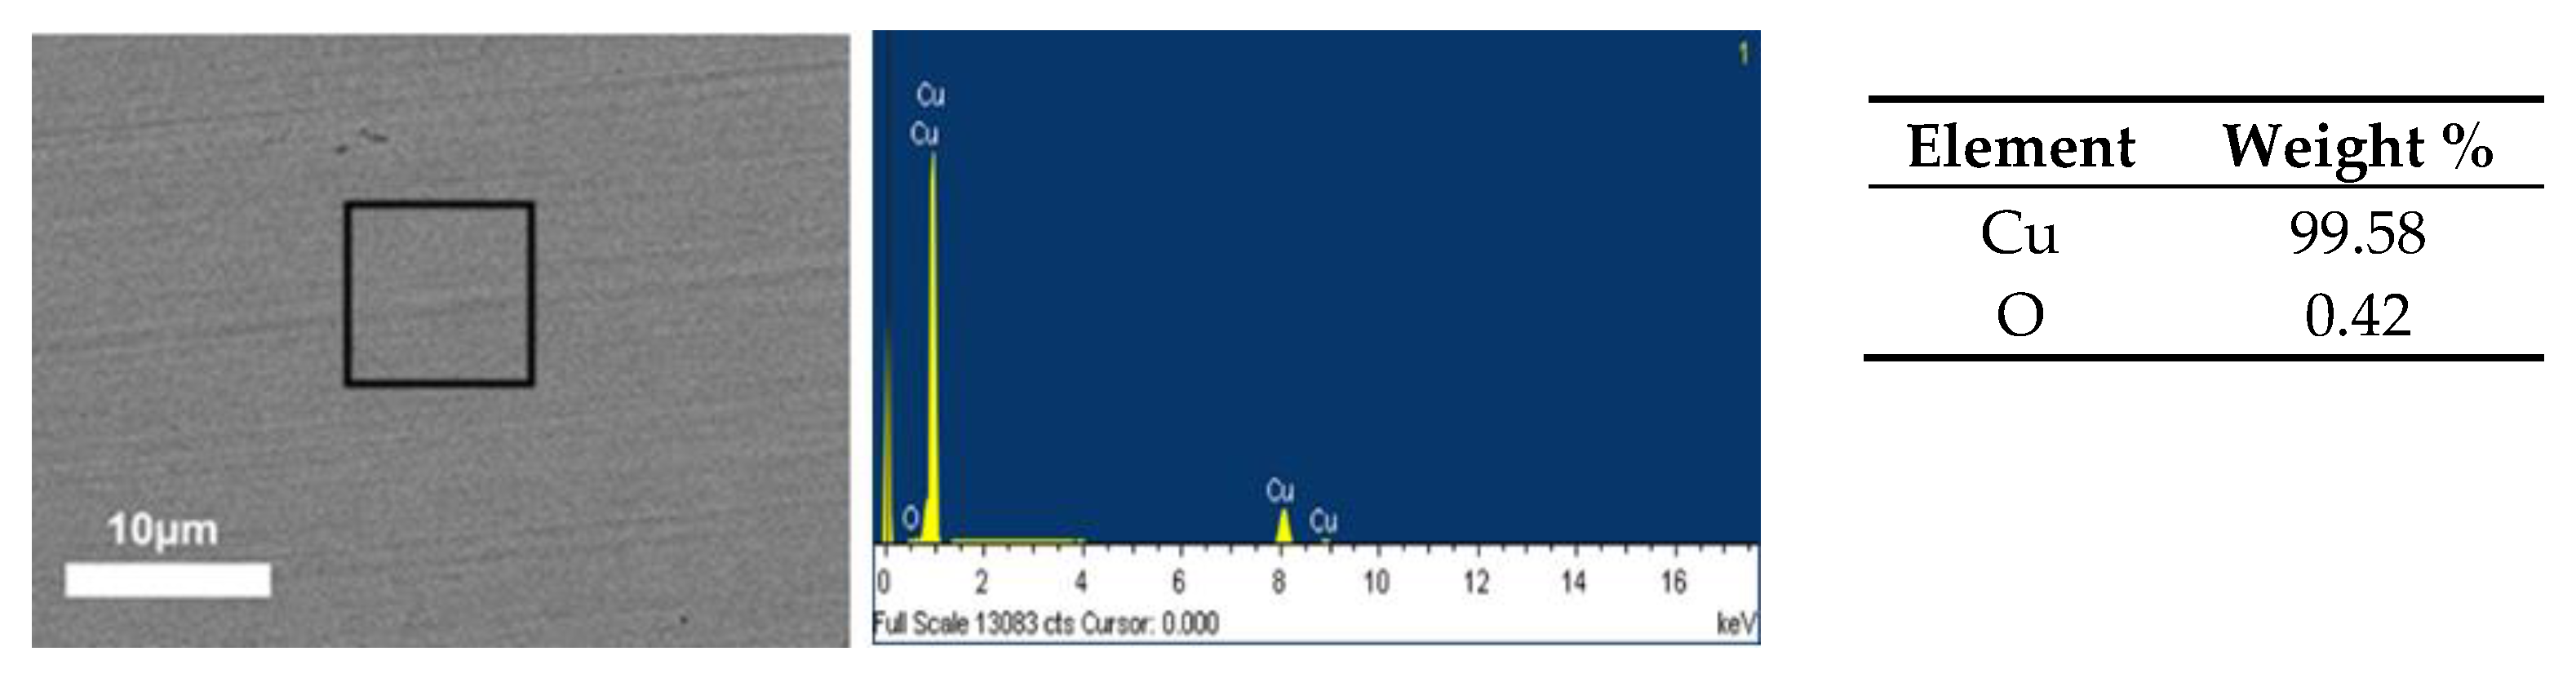
Figure 2.
Overview X-ray photoelectron spectroscopy (XPS) spectra acquired from copper control sample surface: (a) full spectrum; (b) and (c) spectrum for Cu2p3 and O1s, respectively.
Figure 2.
Overview X-ray photoelectron spectroscopy (XPS) spectra acquired from copper control sample surface: (a) full spectrum; (b) and (c) spectrum for Cu2p3 and O1s, respectively.
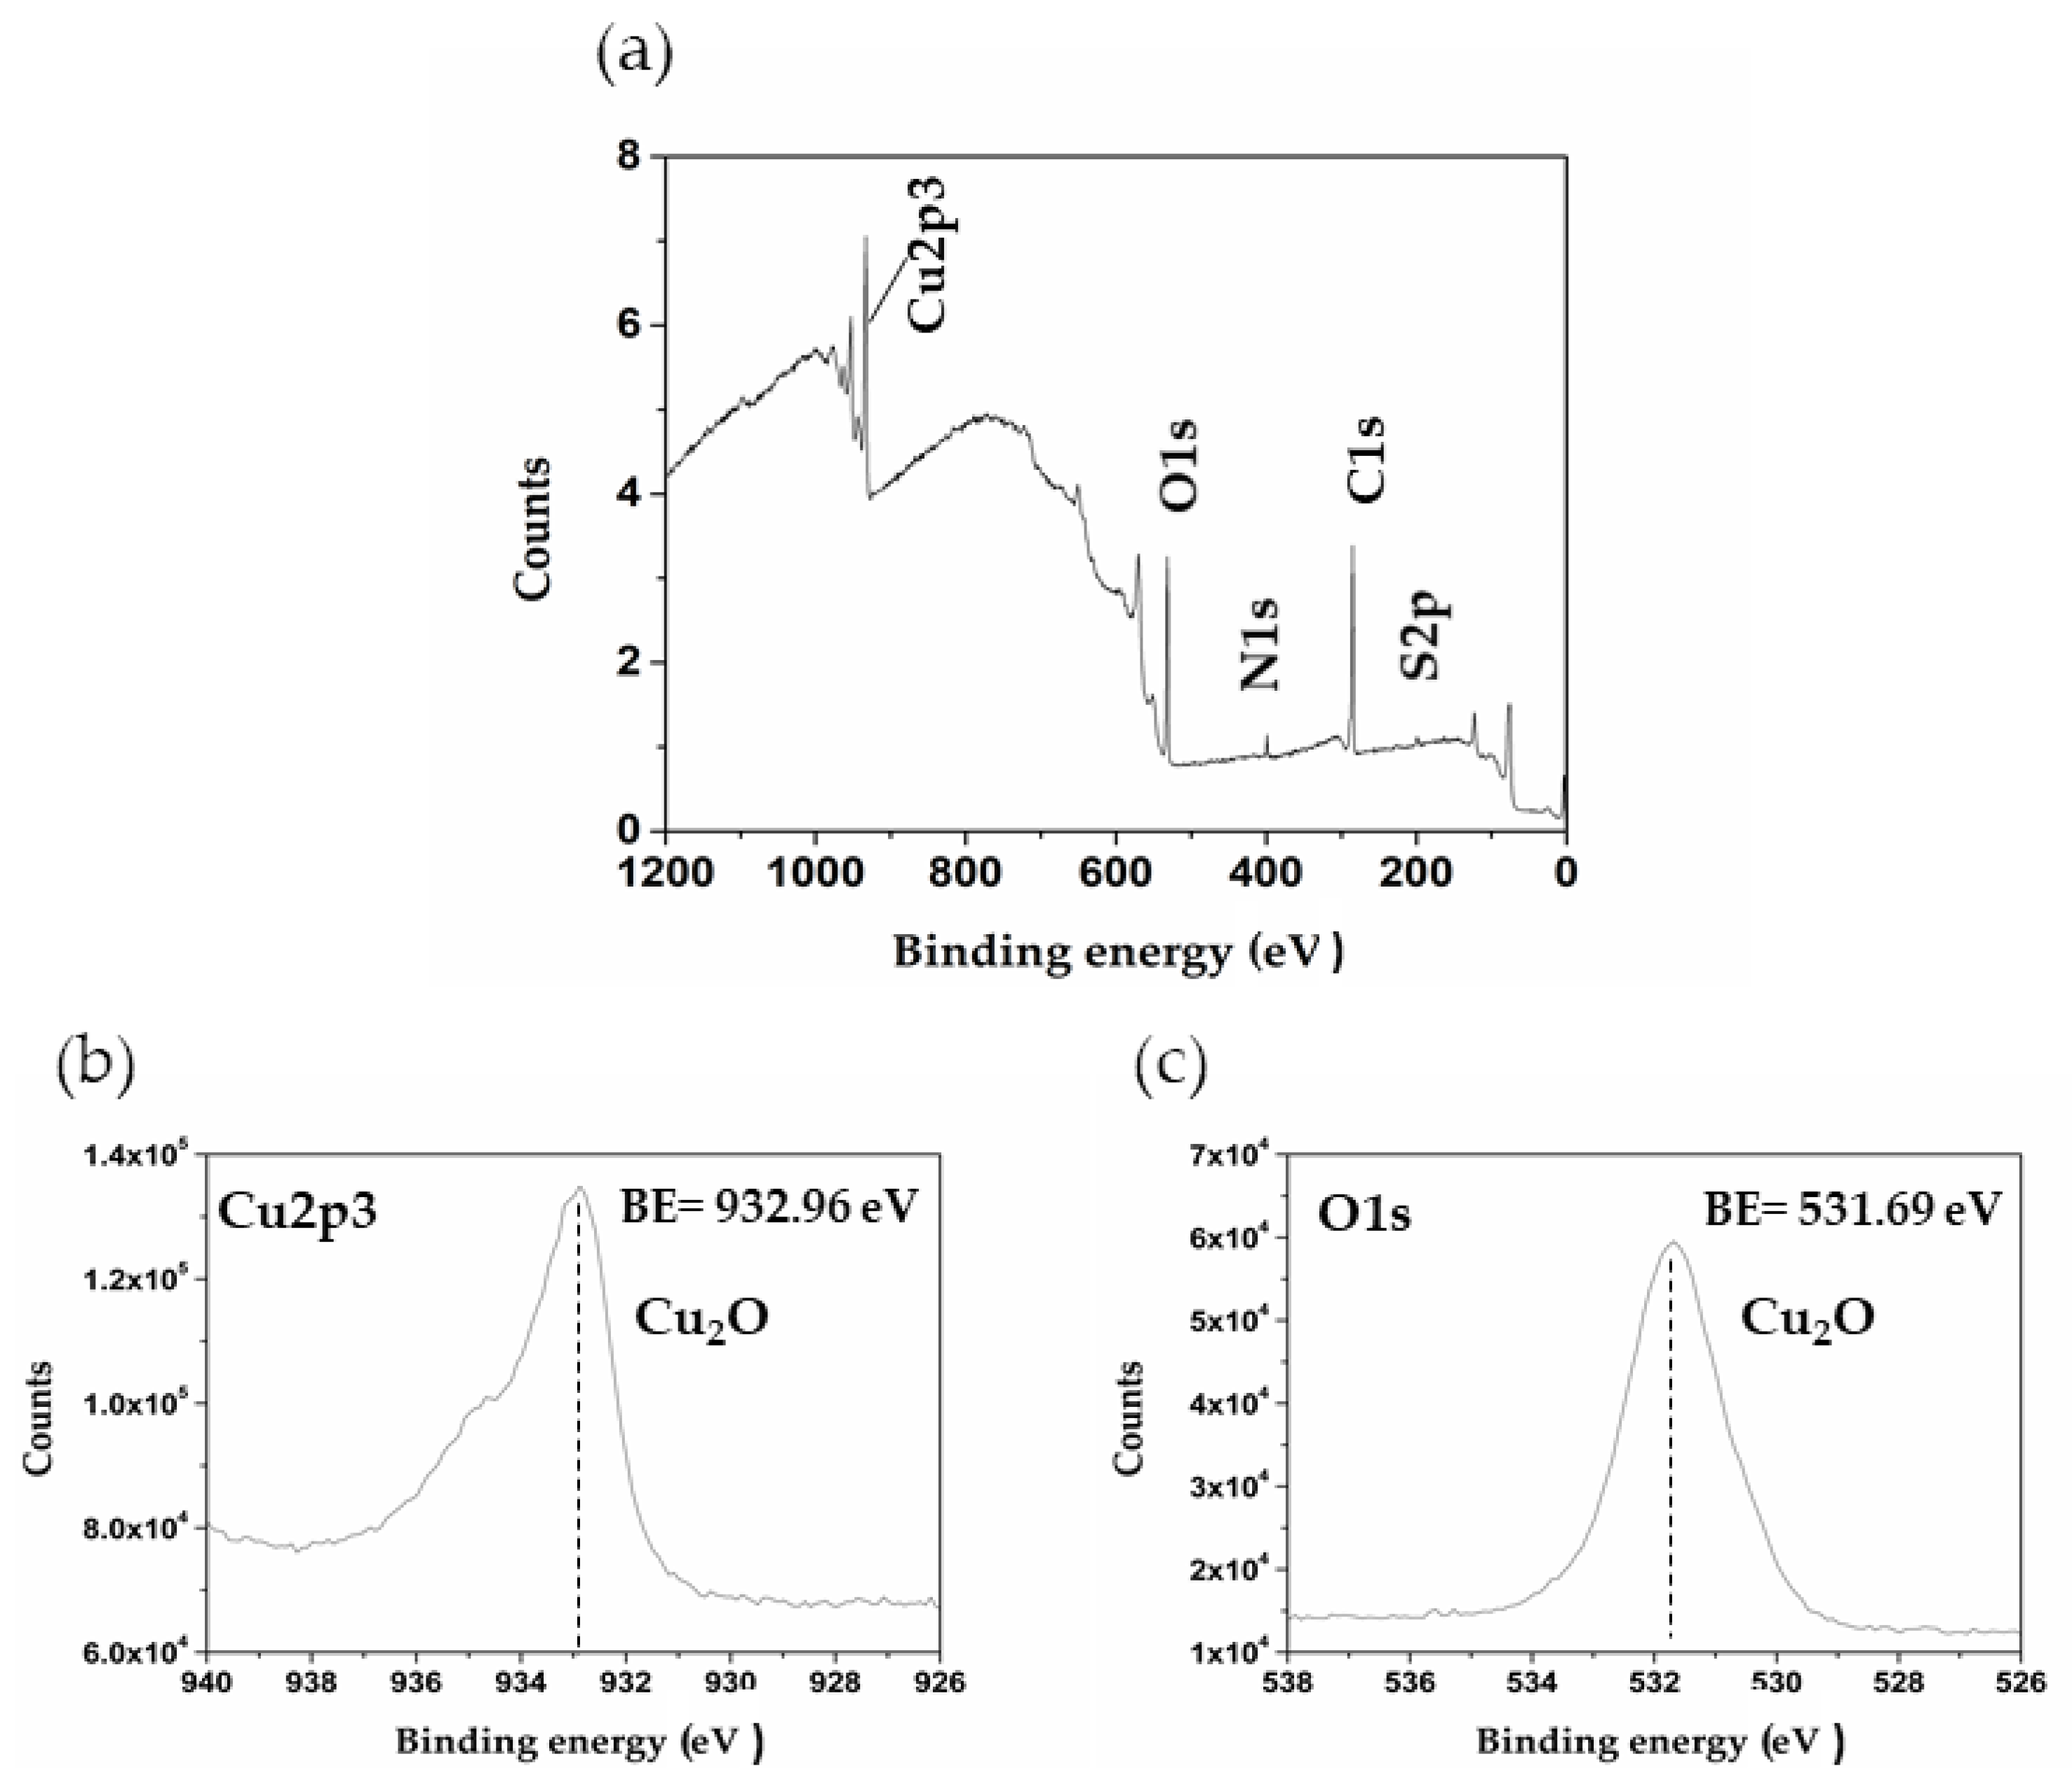
Figure 3.
SEM images (3000×) of Cu surface after exposure to sat. Ca(OH)2 (solution I) for: (a) 360 h and (b) 720 h.
Figure 3.
SEM images (3000×) of Cu surface after exposure to sat. Ca(OH)2 (solution I) for: (a) 360 h and (b) 720 h.
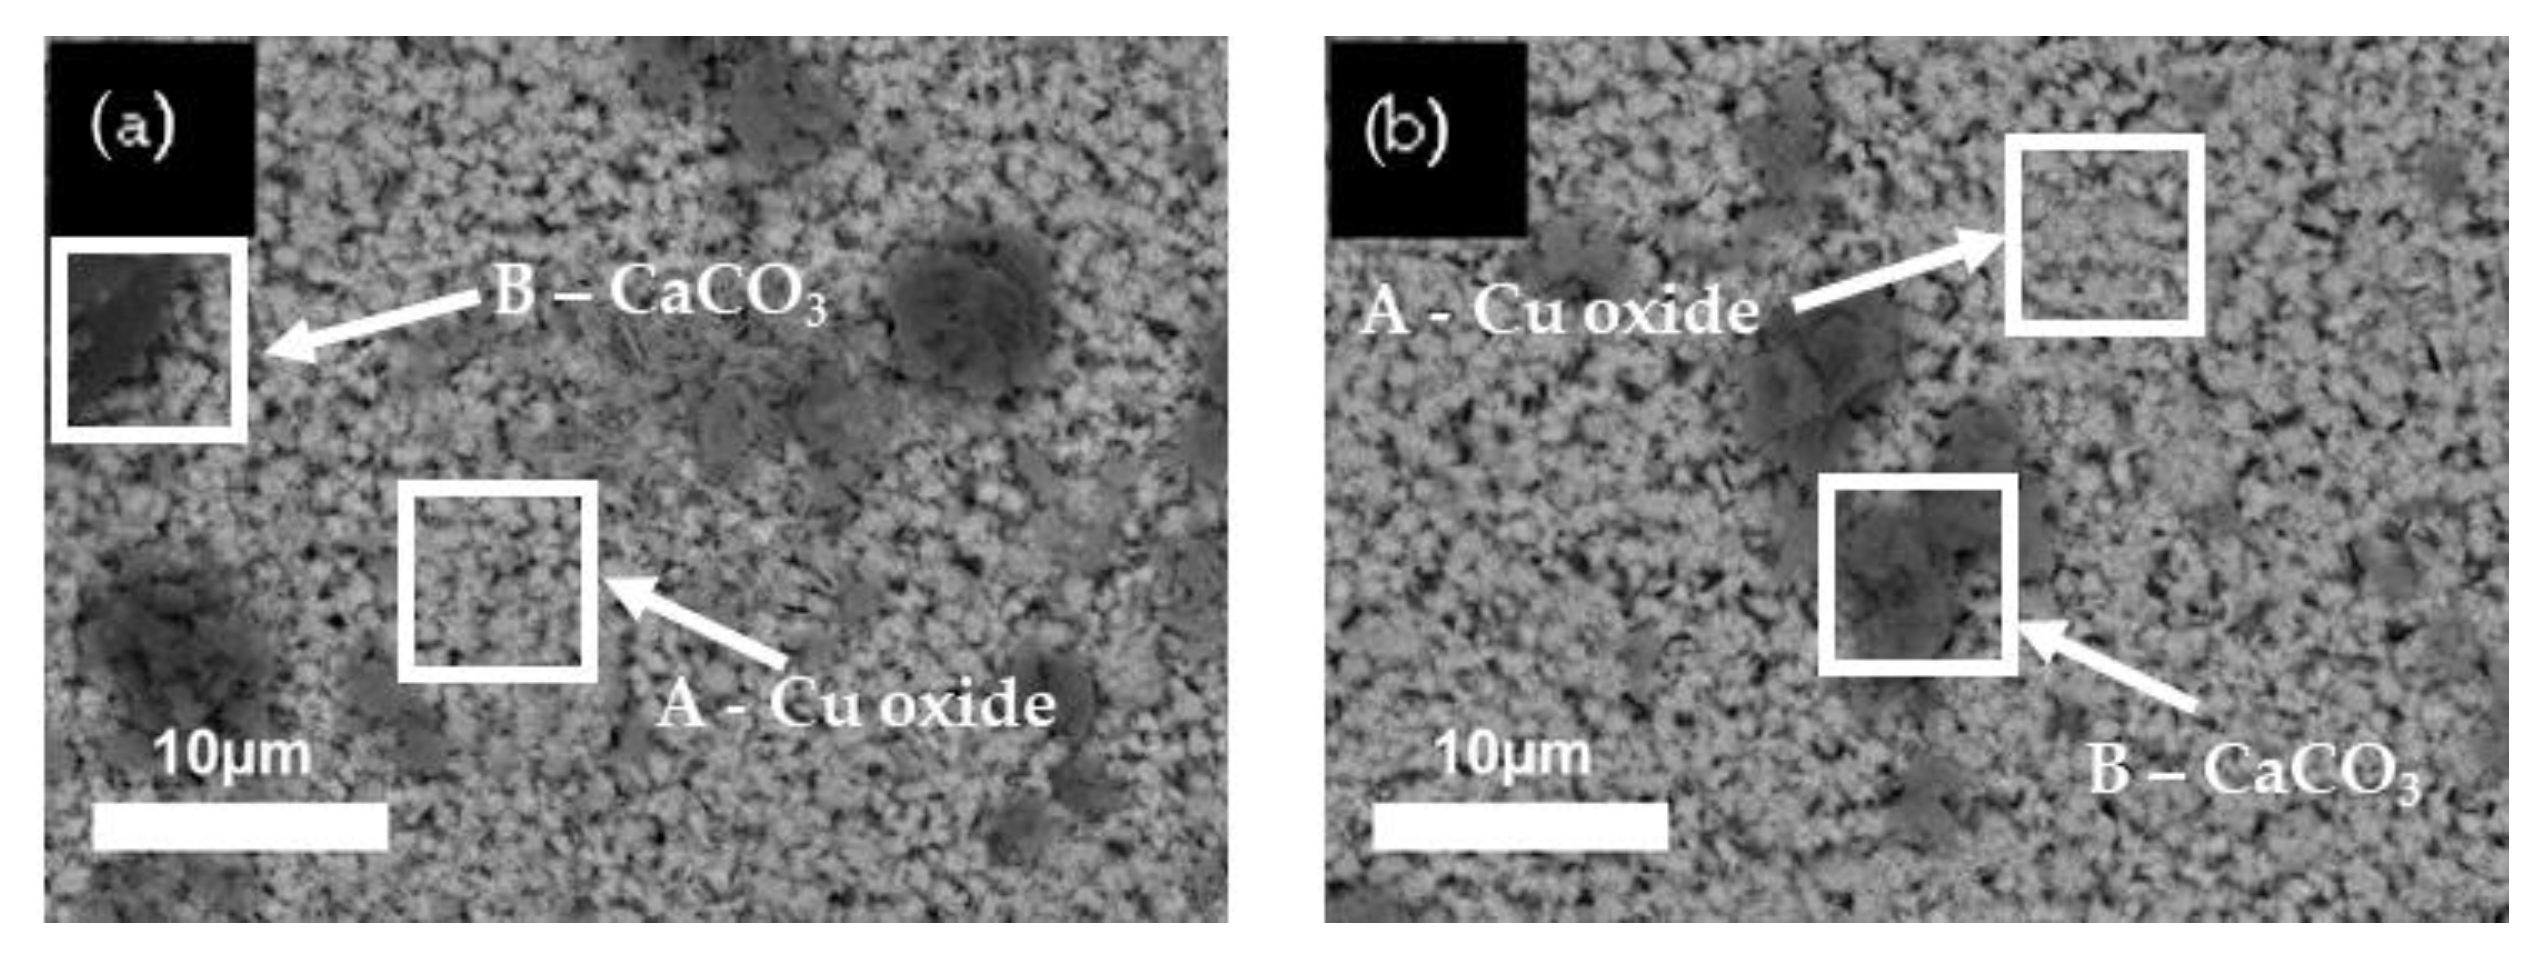
Figure 4.
SEM images (3000×) of Cu surface after exposure to solution II (cement extract) for 360 h (a) and 720 h (b).
Figure 4.
SEM images (3000×) of Cu surface after exposure to solution II (cement extract) for 360 h (a) and 720 h (b).

Figure 5.
SEM images (3000×) of Cu surfaces, after removal of corrosion layers formed during exposure to both model solutions for 720 h: (a) sat. Ca(OH)2 (solution I) and (b) cement extract (solution II).
Figure 5.
SEM images (3000×) of Cu surfaces, after removal of corrosion layers formed during exposure to both model solutions for 720 h: (a) sat. Ca(OH)2 (solution I) and (b) cement extract (solution II).

Figure 6.
X-ray diffraction patterns comparing the crystalline compounds formed on Cu surface after 720 h of exposure to: (a) sat. Ca(OH)2 and (b) extract cement concrete-pore model solutions.
Figure 6.
X-ray diffraction patterns comparing the crystalline compounds formed on Cu surface after 720 h of exposure to: (a) sat. Ca(OH)2 and (b) extract cement concrete-pore model solutions.
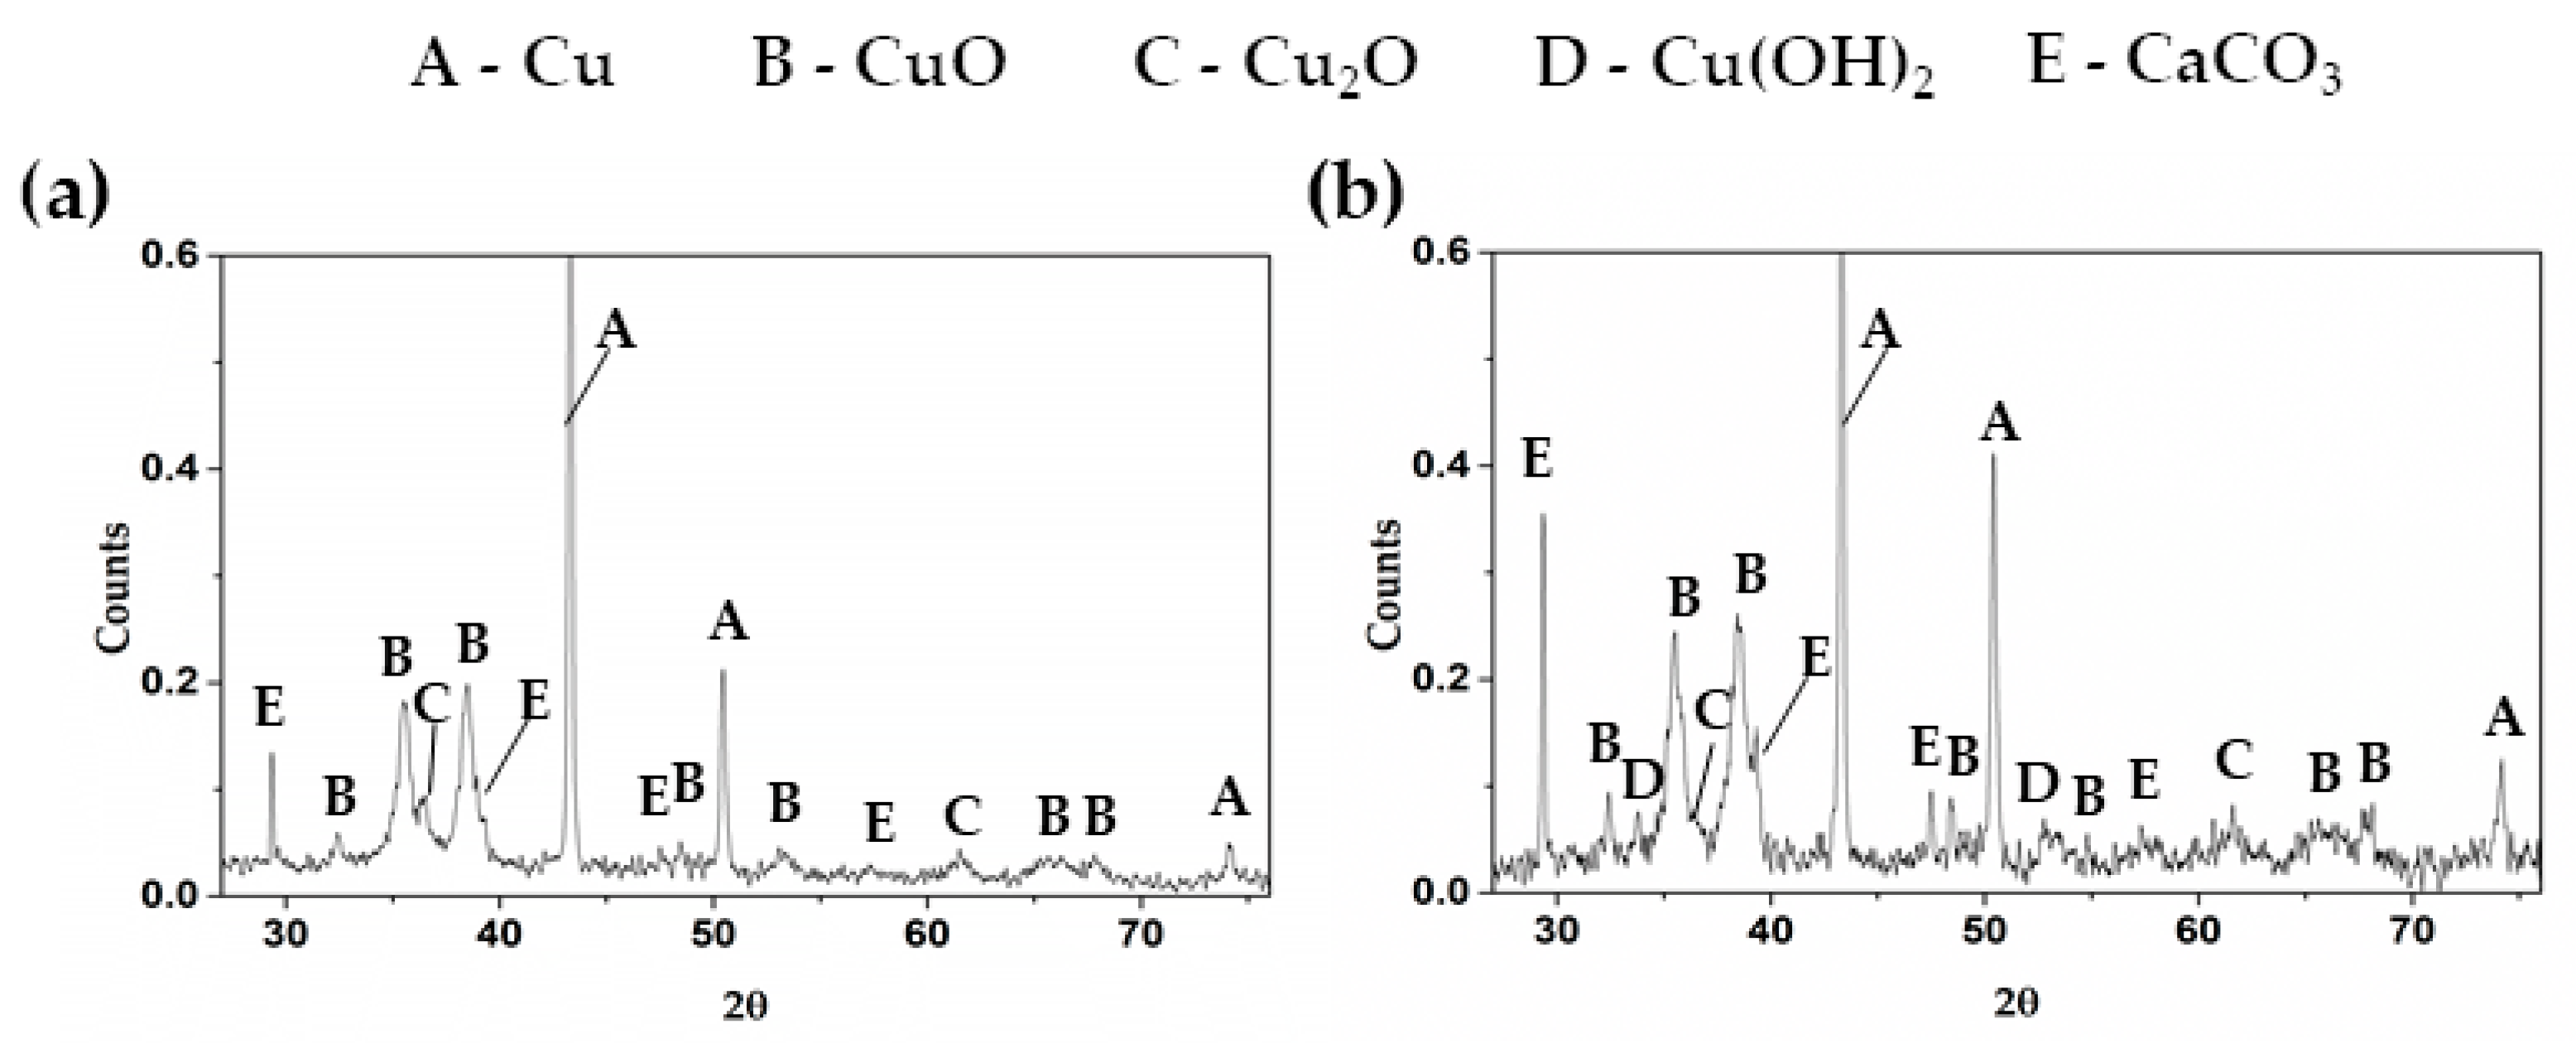
Figure 7.
Overview XPS spectra acquired from copper exposure to cement extract (solution II) after 24 h: (a) full spectrum; (b) and (c) spectrum for Cu2p3 and O1s, respectively.
Figure 7.
Overview XPS spectra acquired from copper exposure to cement extract (solution II) after 24 h: (a) full spectrum; (b) and (c) spectrum for Cu2p3 and O1s, respectively.

Figure 8.
Electrochemical Impedance Spectroscopy (EIS) Nyquist plots for a copper exposed up to 30 days (720 h) to two model concrete-pore solutions: (a) sat. Ca(OH)2, solution I and (b) cement extract, solution II.
Figure 8.
Electrochemical Impedance Spectroscopy (EIS) Nyquist plots for a copper exposed up to 30 days (720 h) to two model concrete-pore solutions: (a) sat. Ca(OH)2, solution I and (b) cement extract, solution II.

Figure 9.
EIS Bode plots for a copper exposed up to 30 days (720 h) in: (a) sat. Ca(OH)2, solution I and (b) cement extract, solution II.
Figure 9.
EIS Bode plots for a copper exposed up to 30 days (720 h) in: (a) sat. Ca(OH)2, solution I and (b) cement extract, solution II.
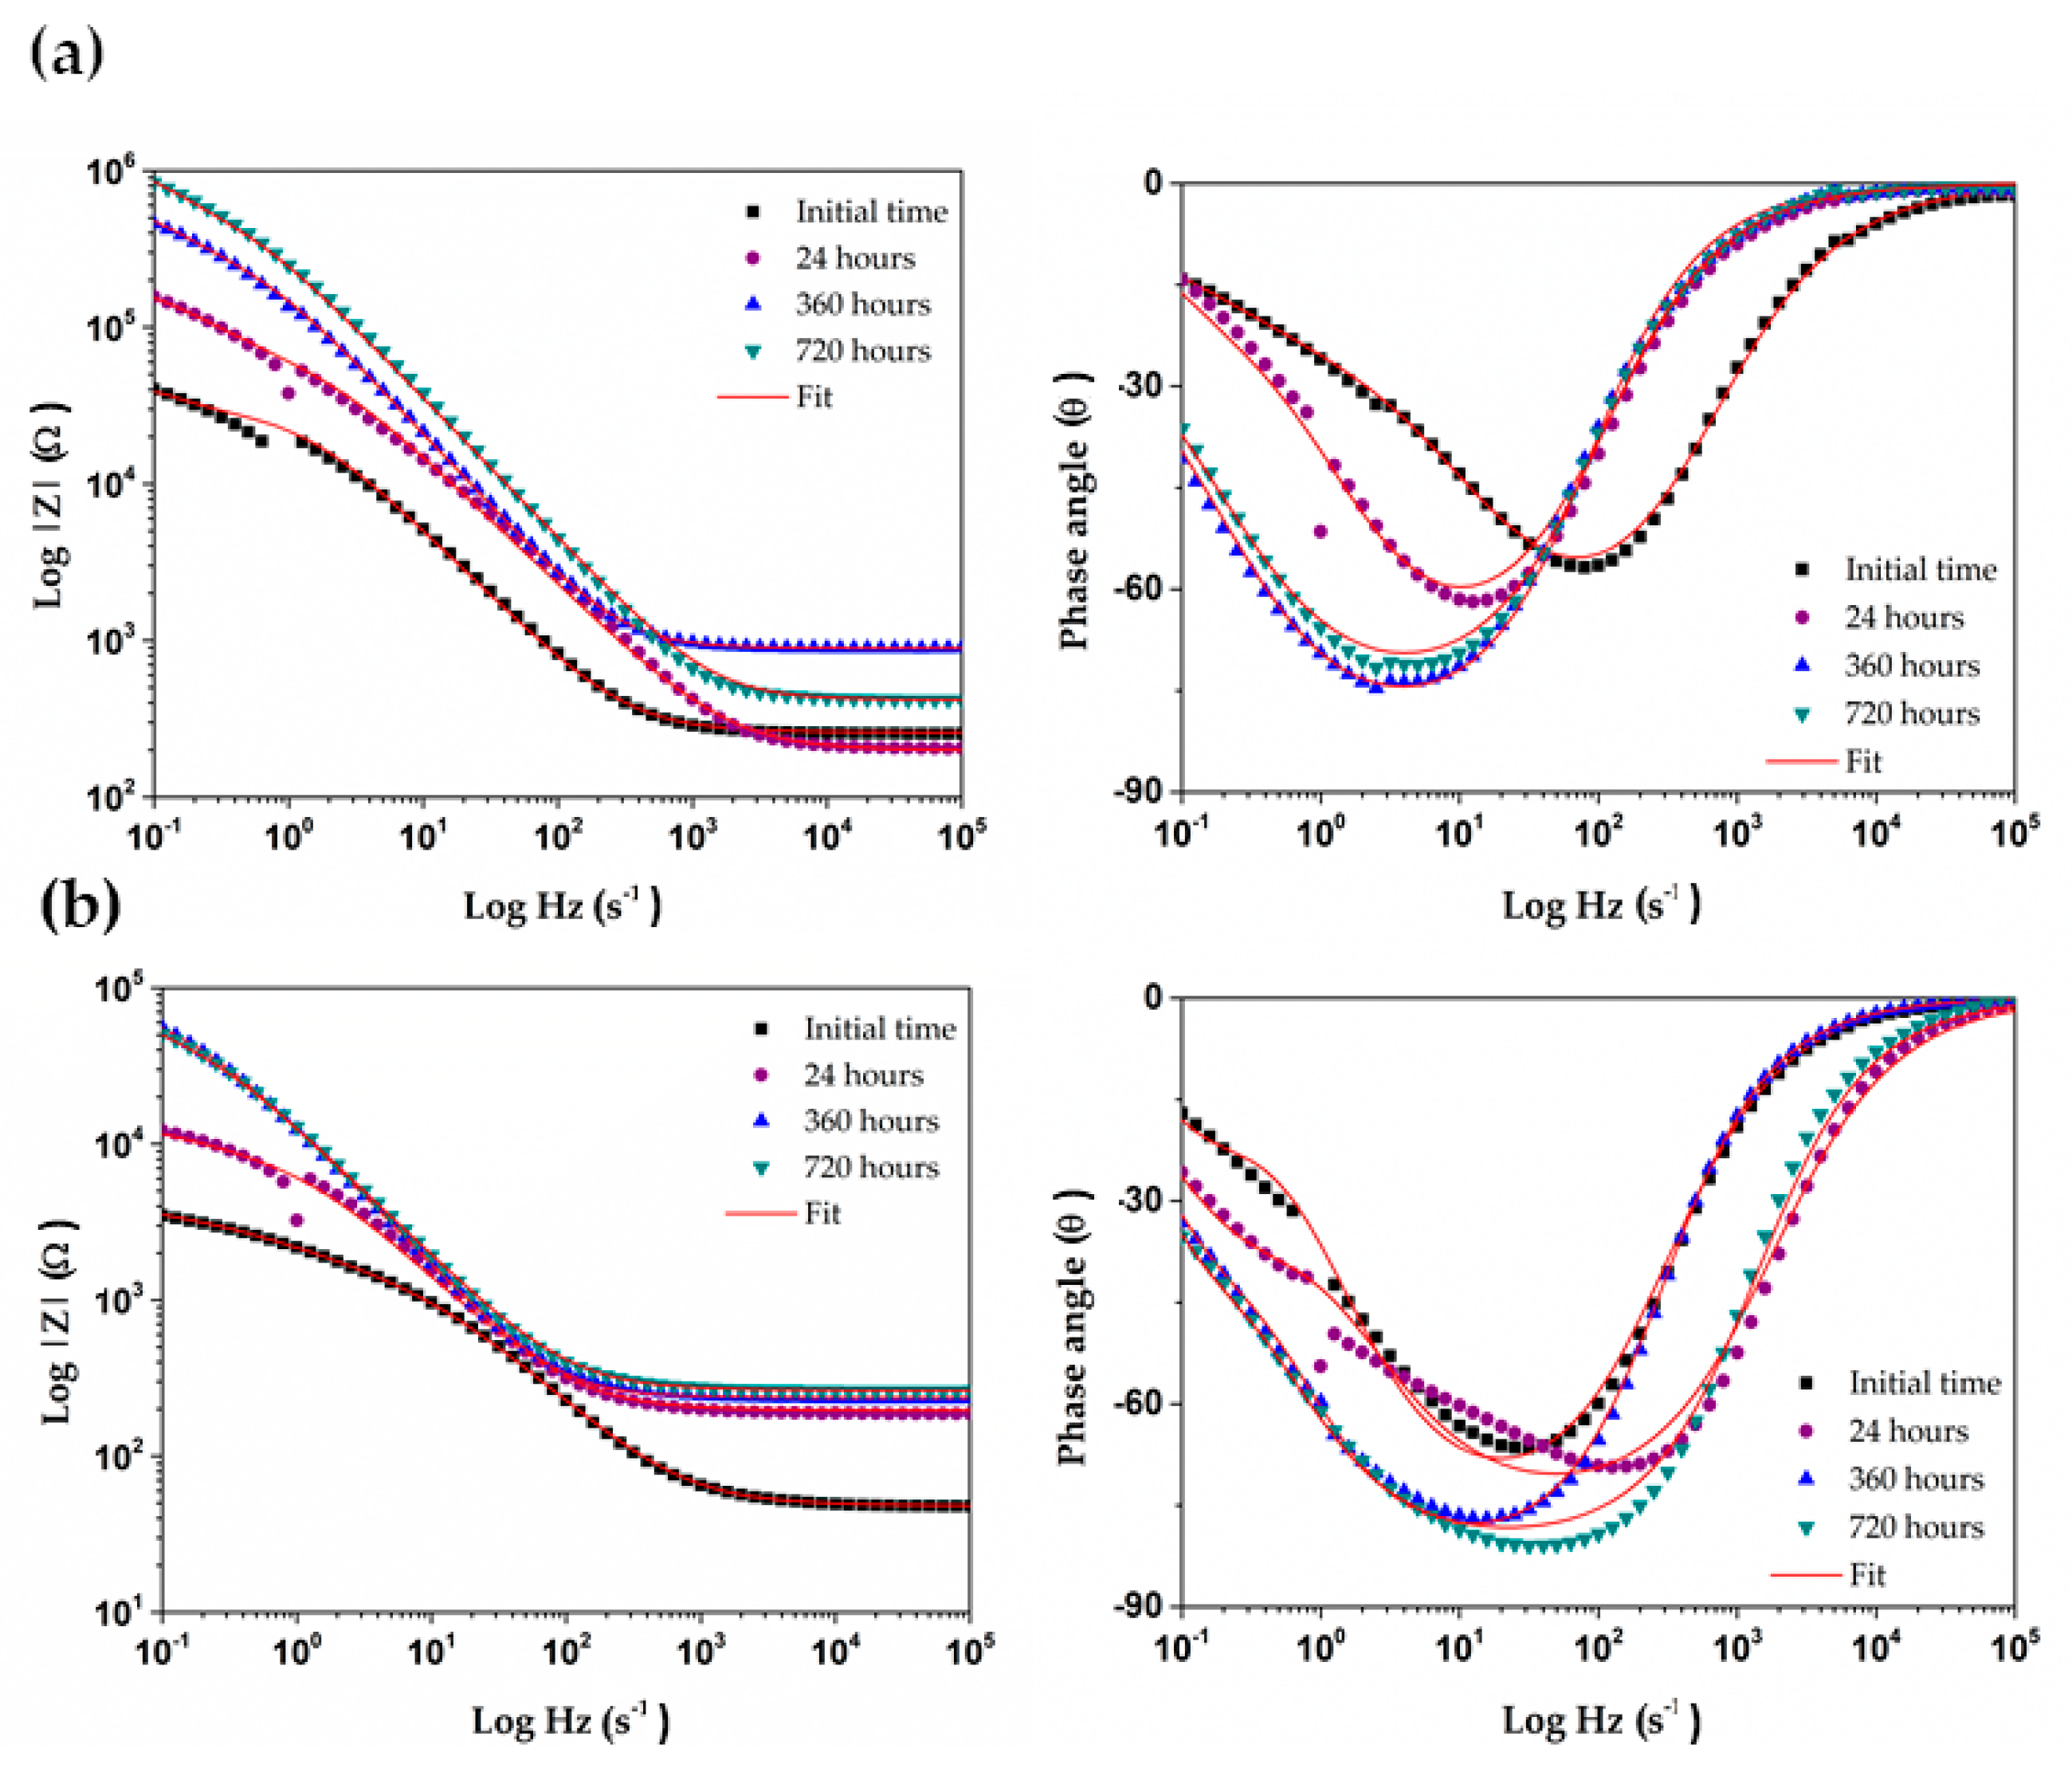
Figure 10.
Equivalent electric circuit fitted to the EIS plots of copper exposed to I and II concrete-pore model solutions.
Figure 10.
Equivalent electric circuit fitted to the EIS plots of copper exposed to I and II concrete-pore model solutions.

Figure 11.
Potentiodynamic polarization curves of Cu exposed to two concrete pore model electrolytes: solution I, saturated Ca(OH)2 (red curves) and solution II, cement extract (black curves).
Figure 11.
Potentiodynamic polarization curves of Cu exposed to two concrete pore model electrolytes: solution I, saturated Ca(OH)2 (red curves) and solution II, cement extract (black curves).
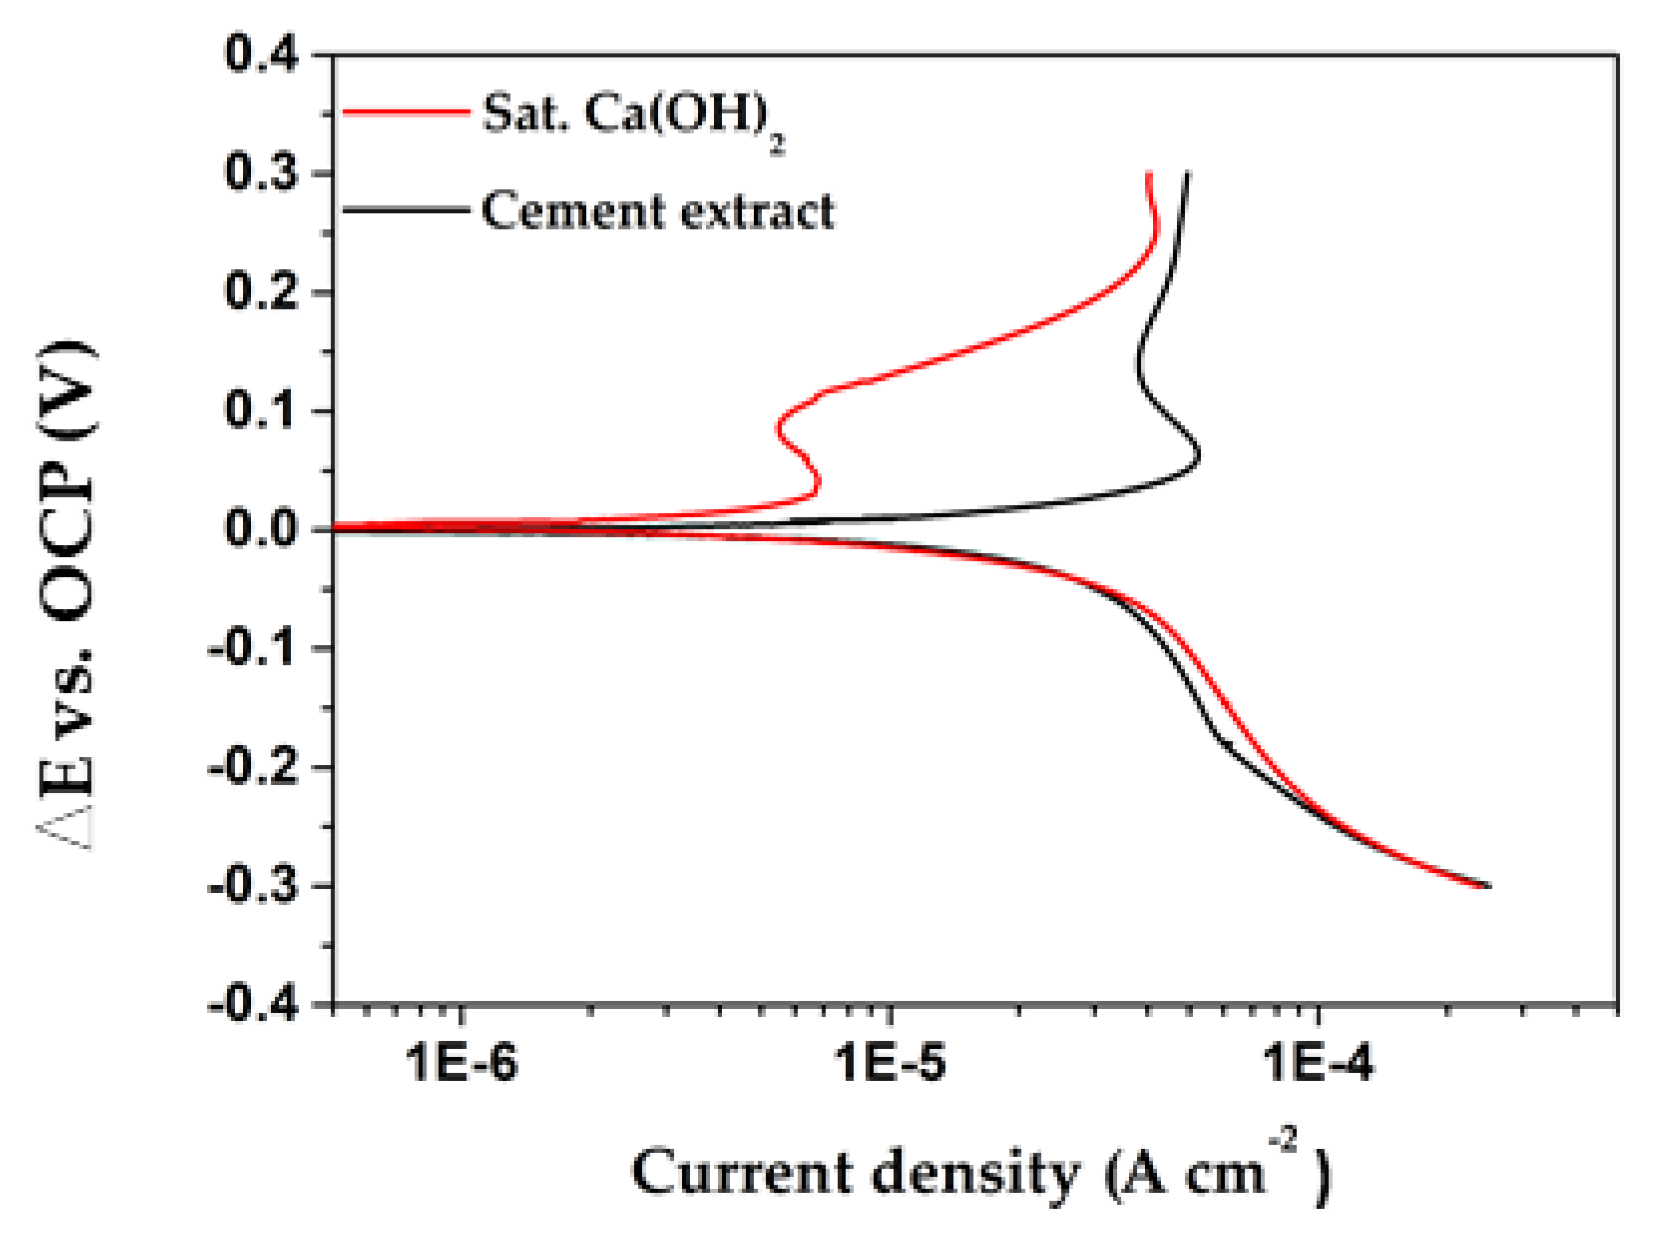
Figure 12.
Current density fluctuations recorded (at open circuit) during 24 h of exposure of Cu to: (a) sat. Ca(OH)2 and (b) cement extract concrete-pore model solutions.
Figure 12.
Current density fluctuations recorded (at open circuit) during 24 h of exposure of Cu to: (a) sat. Ca(OH)2 and (b) cement extract concrete-pore model solutions.

Figure 13.
Cyclic voltammograms (25 mV·s−1) of Cu at the initial time of immersion in: (a) sat. Ca(OH)2 and (b) cement extract model solutions. (1 marks the start of scans from open circuit potential).
Figure 13.
Cyclic voltammograms (25 mV·s−1) of Cu at the initial time of immersion in: (a) sat. Ca(OH)2 and (b) cement extract model solutions. (1 marks the start of scans from open circuit potential).
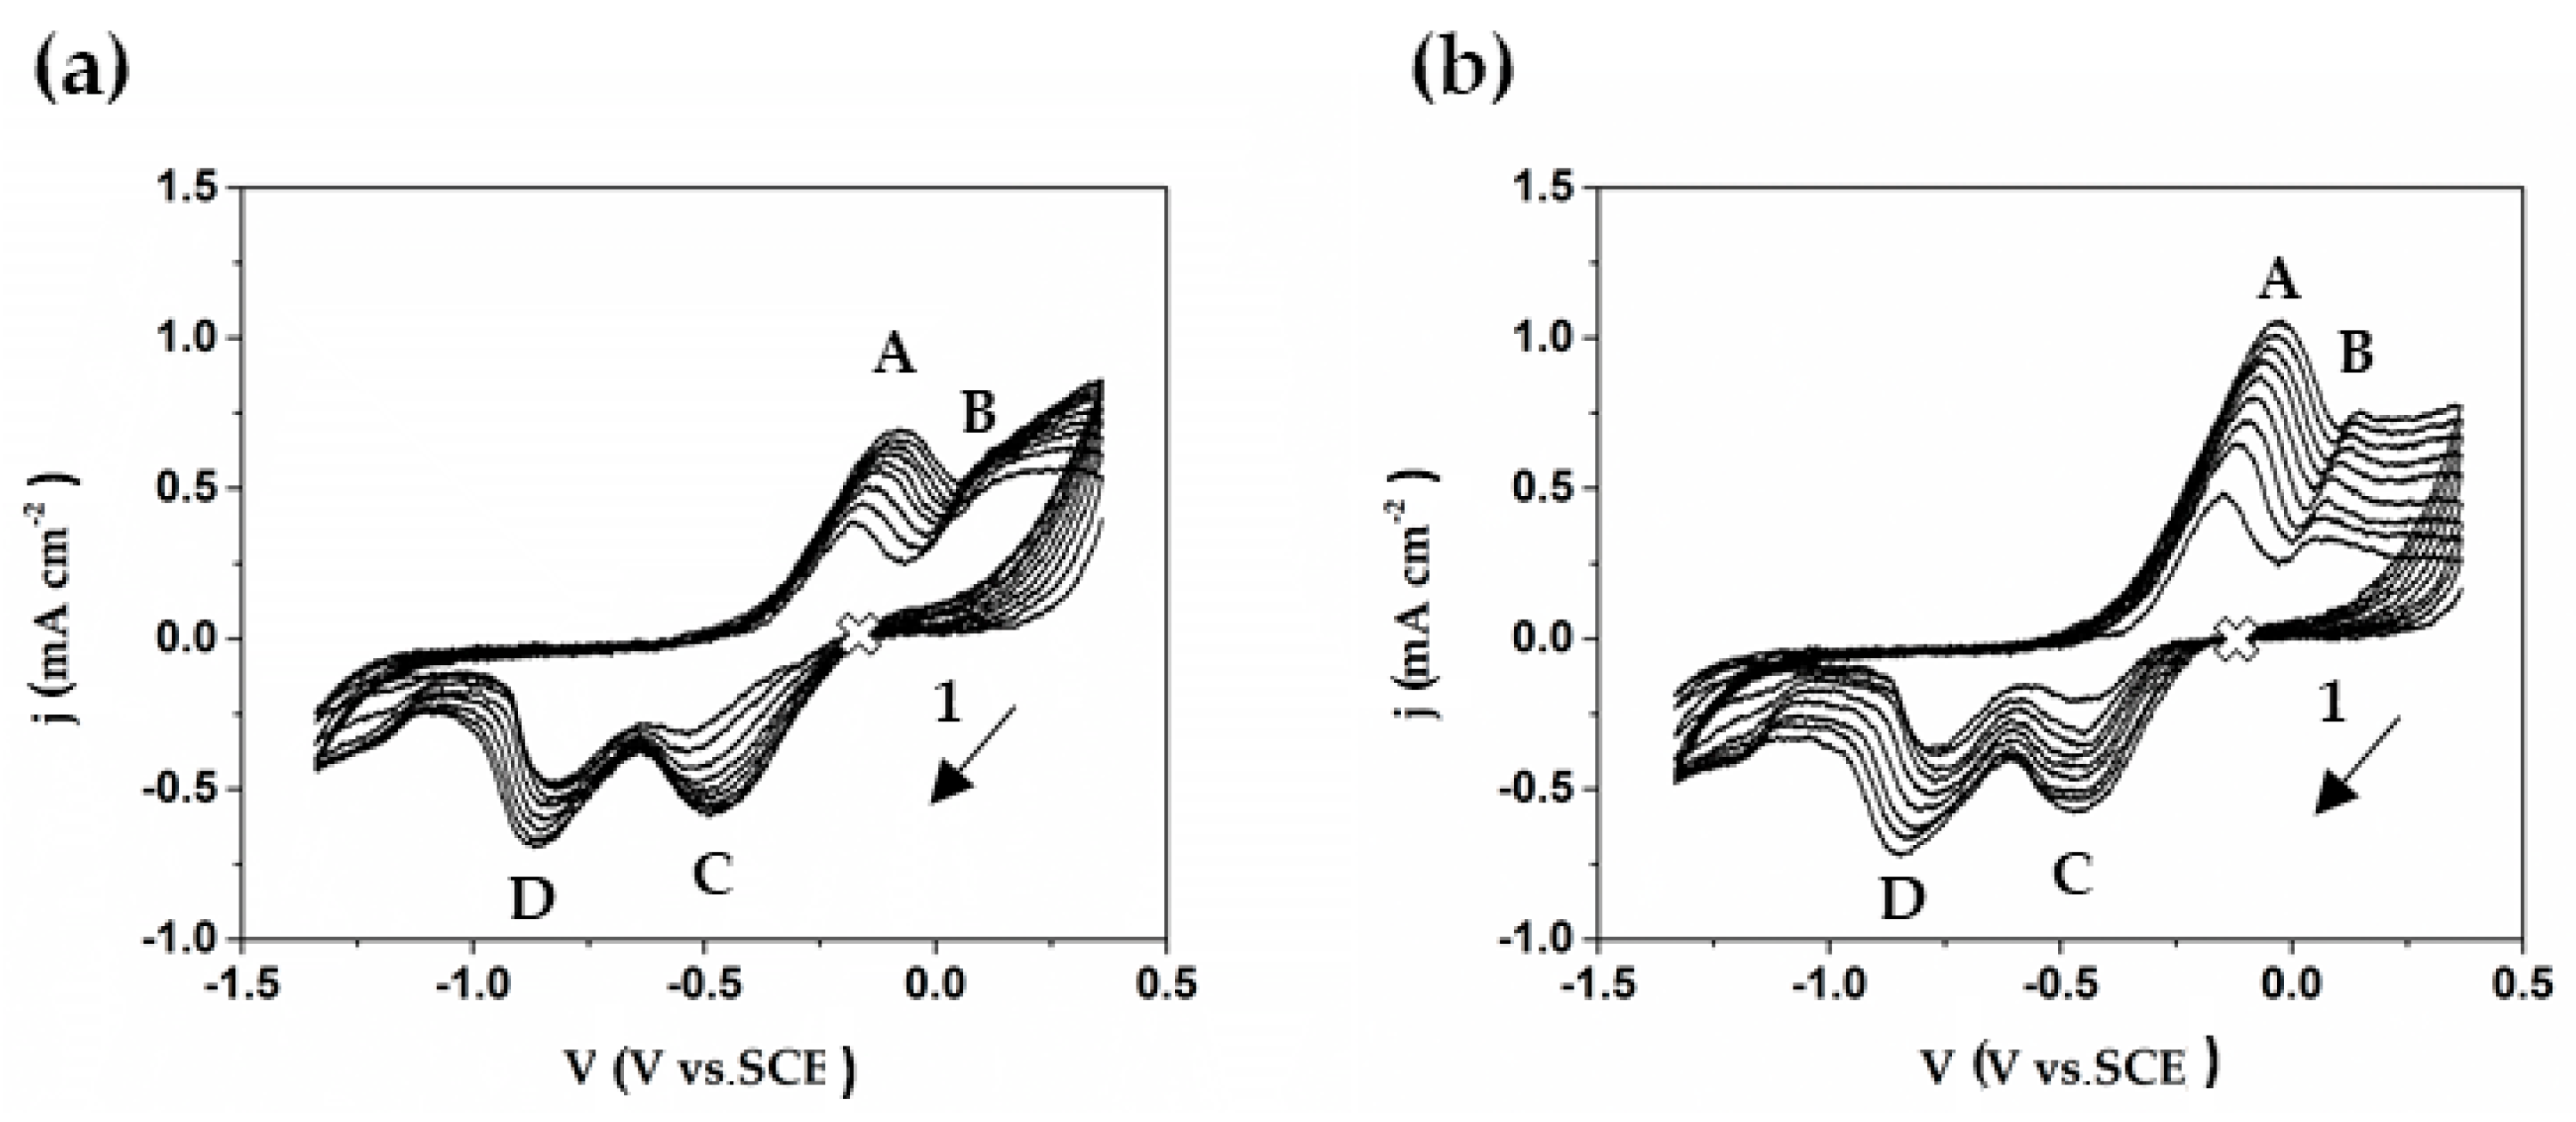
Figure 14.
Cyclic voltammograms of Cu immersed in the cement extract concrete-pore model solution, recorded at a scan rate of 25 mV·s−1 (red line) and 100 mV·s−1 (black line). (1 marks the start of scans from open circuit potential).
Figure 14.
Cyclic voltammograms of Cu immersed in the cement extract concrete-pore model solution, recorded at a scan rate of 25 mV·s−1 (red line) and 100 mV·s−1 (black line). (1 marks the start of scans from open circuit potential).

Table 1.
Composition of Portland cement according to the producer and chemical analysis of filtered cement extract solution as proposed [40] after 24 h.
Table 1.
Composition of Portland cement according to the producer and chemical analysis of filtered cement extract solution as proposed [40] after 24 h.
| Portland Cement | Cement Extract b | |||
|---|---|---|---|---|
| Compound | Weight % a | Weight % b | Ion | Concentration mmol/L |
| SiO2 | 21.35 | 22.30 | Ca2+ | 6.4 |
| Al2O3 | 4.87 (as Al3+) | 4.62 | K+ | 35.1 |
| Fe2O3 | 2.89 (as Fe3+) | 2.44 | Na+ | 18.3 |
| CaO | 66.84 (as Ca2+) | 58.42 | SO42- | - |
| K2O | 0.39 | 0.35 | OH− | 56.4 |
| Na2O | 0.08 | 0.28 | - | - |
| SO3 | 2.42 | 2.20 | - | - |
| MgO | 1.16 (as Mg2+) | 1.92 | - | - |
a—According to this study; b—According to [40].
Table 2.
EDS analysis (wt. %) of Cu surface after exposure to sat. Ca(OH)2 (solution I), corresponding to zones presented in Figure 3.
Table 2.
EDS analysis (wt. %) of Cu surface after exposure to sat. Ca(OH)2 (solution I), corresponding to zones presented in Figure 3.

| Element Weight % | Zone A | Zone B | ||
|---|---|---|---|---|
| 360 h | 720 h | 360 h | 720 h | |
| Cu | 66.88 | 70.82 | 10.53 | 26.52 |
| O | 28.37 | 26.00 | 56.23 | 43.04 |
| Ca | 1.55 | 1.10 | 18.77 | 17.55 |
| C | 3.20 | 2.08 | 14.47 | 12.89 |
Table 3.
EDS analysis (wt. %) of Cu surface after exposure to cement extract (solution II) for 360 h (a) and 720 h (b).
Table 3.
EDS analysis (wt. %) of Cu surface after exposure to cement extract (solution II) for 360 h (a) and 720 h (b).
| Element Weight % | Zone A | Zone B | ||
|---|---|---|---|---|
| 360 h | 720 h | 360 h | 720 h | |
| Cu | 67.95 | 69.68 | 34.57 | 13.80 |
| O | 27.37 | 27.72 | 28.16 | 51.29 |
| Ca | 1.31 | 0.45 | 2.35 | 19.41 |
| C | 2.60 | 1.84 | 27.98 | 15.49 |
| Na | - | - | 4.06 | - |
| K | 0.77 | - | 2.88 | - |
| Al | - | 0.32 | - | - |
Table 4.
Change in time of free corrosion potential values at open circuit (OCP) of Cu exposed to sat. Ca(OH)2 and cement extract concrete-pore model solutions.
Table 4.
Change in time of free corrosion potential values at open circuit (OCP) of Cu exposed to sat. Ca(OH)2 and cement extract concrete-pore model solutions.
| Time (h) | Sat. Ca(OH)2 Solution I (mV vs. SHE) | Cement Extract Solution II (mV vs. SHE) |
|---|---|---|
| Initial | 62 ± 0.07 | 47 ± 0.12 |
| 24 | 108 ± 0.01 | 81 ± 0.33 |
| 360 | 136 ± 0.02 | 79 ± 0.05 |
| 720 | 152 ± 0.07 | 29± 0.04 |
Table 5.
Fitting parameters obtained from the EIS measurements for copper immersed in sat. Ca(OH)2 (solution I) and cement extract (solution II) concrete-pore models (21 °C) up to 720 h.
Table 5.
Fitting parameters obtained from the EIS measurements for copper immersed in sat. Ca(OH)2 (solution I) and cement extract (solution II) concrete-pore models (21 °C) up to 720 h.
| Time (h) | ||||||||
|---|---|---|---|---|---|---|---|---|
| Parameter | Initial | 24 | 360 | 720 | ||||
| I | II | I | II | I | II | I | II | |
| Rs (kΩ·cm2) | 2.5 × 10⁻¹ | 4.8 × 10⁻² | 1.9 × 10⁻¹ | 1.9 × 10⁻¹ | 8.8 × 10⁻¹ | 2.3 × 10⁻¹ | 4.1 × 10⁻¹ | 2.6 × 10⁻¹ |
| Ccp (F·cm−2·Hz1-ncp) | 5.4 × 10⁻⁶ | 2.5 × 10⁻⁵ | 2.1 × 10⁻⁶ | 2.3 × 10⁻⁵ | 1.2 × 10⁻⁶ | 1.4 × 10⁻⁵ | 6.8 × 10⁻⁷ | 1.6 × 10⁻⁵ |
| ncp | 8.6 × 10⁻¹ | 8.1 × 10⁻¹ | 8.4 × 10⁻¹ | 8.3 × 10⁻¹ | 9.2 × 10⁻¹ | 9.0 × 10⁻¹ | 9.0 × 10⁻¹ | 8.5 × 10⁻¹ |
| Rcp (kΩ·cm2) | 3.1 × 10 | 1.3 | 8.3 × 10 | 9.4 | 3.5 × 10² | 6.0 × 10² | 7.0 × 10² | 6.0 × 101 |
| Cdl (F·cm−2·Hz1-ncp) | 8.5 × 10⁻⁵ | 2.4 × 10⁻⁴ | 7.8 × 10⁻⁶ | 2.0 × 10⁻⁴ | 3.7 × 10⁻⁶ | 4.8 × 10⁻⁵ | 2.2 × 10⁻⁶ | 6.8 × 10⁻⁵ |
| ndl | 1 | 5.1 × 10⁻¹ | 8.1 × 10⁻¹ | 8.3 × 10⁻¹ | 9.2 × 10⁻¹ | 6.1 × 10⁻¹ | 8.9 × 10⁻¹ | 6.3 × 10⁻¹ |
| Rct (kΩ·cm2) | 0.1 × 10² | 3.3 | 1.3 × 10² | 4.4 | 3.4 × 10² | 0.7 × 10² | 6.5 × 10² | 5.3 × 101 |
| Rp (kΩ·cm2) | 4.7 × 101 | 4.7 | 2.1 × 10² | 1.4 × 10 | 6.9 × 10² | 1.3 × 10² | 1.3 × 10³ | 1.1 × 10² |
| c2 | 5.4 × 10⁻³ | 3.7 × 10⁻⁴ | 1.2 × 10⁻² | 1.7 × 10⁻² | 5.6 × 10⁻⁴ | 8.5 × 10⁻⁴ | 4.2 × 10⁻³ | 8.3 × 10⁻⁴ |
Table 6.
Rp and jcorr values of Cu immersed in sat. Ca(OH)2 and cement extract concrete-pore solutions.
Table 6.
Rp and jcorr values of Cu immersed in sat. Ca(OH)2 and cement extract concrete-pore solutions.
| Time (h) | Sat. Ca(OH)2 | Cement Extract | ||
|---|---|---|---|---|
| Rp (kΩ·cm2) | jcorr (µA·cm2) | Rp (kΩ·cm2) | jcorr (µA·cm2) | |
| Initial | 4.7 × 10 | 6.4 × 10⁻¹ | 4.7 | 6.2 |
| 24 | 2.1 × 10² | 1.4 × 10⁻¹ | 1.3 × 10 | 2.1 |
| 360 | 6.9 × 10² | 4.0 × 10⁻² | 1.3 × 10² | 2.3 × 10⁻¹ |
| 720 | 1.3 × 10³ | 2.0 × 10⁻² | 1.1 × 10² | 2.7 × 10⁻¹ |
© 2020 by the authors. Licensee MDPI, Basel, Switzerland. This article is an open access article distributed under the terms and conditions of the Creative Commons Attribution (CC BY) license (http://creativecommons.org/licenses/by/4.0/).
Share and Cite
MDPI and ACS Style
Bacelis, Á.; Veleva, L.; Alpuche-Avilés, M.A. Copper Corrosion Behavior in Simulated Concrete-Pore Solutions. Metals 2020, 10, 474. https://doi.org/10.3390/met10040474
AMA Style
Bacelis Á, Veleva L, Alpuche-Avilés MA. Copper Corrosion Behavior in Simulated Concrete-Pore Solutions. Metals. 2020; 10(4):474. https://doi.org/10.3390/met10040474
Chicago/Turabian StyleBacelis, Ángel, Lucien Veleva, and Mario A. Alpuche-Avilés. 2020. "Copper Corrosion Behavior in Simulated Concrete-Pore Solutions" Metals 10, no. 4: 474. https://doi.org/10.3390/met10040474
Note that from the first issue of 2016, this journal uses article numbers instead of page numbers. See further details here.