Acoustic Properties of 316L Stainless Steel Hollow Sphere Composites Fabricated by Pressure Casting

Key Laboratory of Superlight Materials & Surface Technology, Ministry of Education, Harbin Engineering University, Harbin 150001, China
*
Author to whom correspondence should be addressed.
Metals 2020, 10(8), 1047; https://doi.org/10.3390/met10081047
Submission received: 27 June 2020
/
Revised: 23 July 2020
/
Accepted: 28 July 2020
/
Published: 3 August 2020
Abstract
:In this study, we prepared metal hollow sphere composites (MHSCs) using metal hollow spheres (MHSs) by pressure casting under vacuum conditions, and investigated the acoustic properties. The density of the MHSCs was measured using the mass to volume ratio, the microstructure of the MHSCs was observed using a scanning electron microscope, and the acoustic properties of the MHSCs were tested using an impedance tube. The measured MHSCs showed that the densities of the MHSCs with the random distribution of MHSs with diameter ~3.28 mm (1.74 g/cm3 to 1.77 g/cm3) (MHSC-3.28) were nearly equal to that of the MHSCs with the random distribution of MHSs with diameter ~5.76 mm (1.74 g/cm3 to 1.76 g/cm3) (MHSC-5.76), and lower than that of the MHSCs with the layered structure of MHSs with diameter ~3.28 mm (1.93 g/cm3 to 1.97 g/cm3) (MHSC-LS). Microstructural observations confirmed that the interface region between the MHSs and matrix demonstrated a simple physical combination pattern with pores. The acoustic properties of the MHSCs showed that the sound absorption coefficient of MHSC-LS was lower than that of MHSC-3.28 and higher than that of MHSC-5.76 at off-resonance. The sound absorption coefficient peak value of MHSC-3.28 was higher than that of MHSC-LS, and lower than that of MHSC-5.76 at resonance. The sound transmission loss of MHSC-3.28 was lower than that of MHSC-5.76, which shows the rules are independent from the resonance. The sound transmission loss of MHSC-LS was higher than that of MHSC-5.76 at resonance, but lower than that of MHSC-3.28 at off-resonance. In addition, we discuss the propagation mechanism of the sound waves in the MHSC, which is mainly determined by the distribution of the MHSs in the MHSC.
1. Introduction
In the second decade of the 21st century, the industry dictated a number of requirements for multi-functional materials, which provided new challenges in the field of materials science. Properties that appear incompatible at first glance, such as high strength, sound insulation, heat resistance, and fire resistance, and at the same time low density, should be combined in one material to meet the growing requirements of the automotive, aerospace, and marine industries [1]. Responding to this challenge, modern science has paid attention to the study of materials, such as syntactic foams containing hollow spherical objects. Hundreds of micron-sized ceramic hollow spheres were studied as a filler for ceramic composites [2], or as components of a hybrid syntactic foam [3] and novel metal-ceramic composites with low density (1.0–1.8 g/cm3) [4,5]. Examples include polymer-based syntactic foams mostly used in hollow glass micro balloons [6,7] and the metal-matrix syntactic foams used for glass as well as ceramic hollow microspheres [8,9,10]. Following from what was mentioned above, hollow spherical fillers are very attractive for new material design. However, ceramic and glass hollow spheres have a common drawback as they possess fragile destruction behaviors. For this reason, metal hollow spheres, which has elastic-plastic behavior [11], are very attractive for the application.
The metal hollow sphere structure is a type of porous material, which has good acoustic properties [12,13]. The metal hollow sphere composites (MHSCs) belong to the special metal hollow spheres structures, and the acoustic properties of the MHSCs are worthy of study. Owing to the special structures of the MHSCs, the MHSCs have a series of advantageous mechanical properties and functional characteristics, such as low density [14,15], high specific strength [16], high energy absorption [17,18,19,20,21,22,23,24], heat insulation [25], nuclear shielding [26,27,28], and ballistic performance [29,30].
With the development of pressure casting, the MHSCs with special structures [31,32,33] could be produced and designable to achieve the unity of mechanical properties and functional characteristics by controlling the arrangement of the metal hollow spheres (MHSs) in the MHSCs. Recently, some related research [34,35,36] showed that hollow spheres with millimeter or micron sizes had fine sound absorption. The submillimeter or micrometer hollow spheres with opening cell structures are favorable for absorbing low-frequency sound waves. With the development of manufacturing techniques, MHSs with a through-hole could be fabricated by controlling the preparation process parameters [37]. Therefore, it is feasible to manufacture MHSCs with specific acoustic properties through pressure casting using the different diameters and the wall porosity of the MHSs.
In addition, establishing the sound absorption model is an effective way to design porous metals with good sound absorption and study the sound absorption mechanism of porous metals. Rayleigh first proposed the Delany–Bazley model of sound wave propagation in porous materials [38]. Then, Zwikiker and Kosten [39] and Kosten [40] further developed the Delany–Bazley model, and subsequently the Delany–Bazley model has been widely studied and applied due to its simplicity and easy operation. Due to the complexity of pore structures, however, it remains difficult to establish a model for understanding the sound absorption mechanism of porous materials easily and accurately.
Therefore, we studied the sound absorption models and the mechanisms of the porous materials [41,42,43,44,45,46]. The sound absorption mechanism of porous materials is as follows. When the sound waves propagate to the surface of the porous materials, the sound waves will enter the porous materials through the refraction. The sound waves propagating in the porous materials will also cause air vibration in the pores, which will lead the air and the pore walls to fracture. In this way, the sound energy converts into heat energy, which achieves the purpose of reducing the sound energy. However, there are few studies on the acoustic properties and sound absorption mechanism of MHSCs as porous metals.
In order to investigate the acoustic properties of MHSCs, MHSCs with different structures were fabricated. We studied the physical properties and microstructure. The effects of the diameter and arrangement of MHSs on the acoustic performance of the MHSCs were investigated, and the acoustic propagation mechanism of MHSC was analyzed in detail.
2. Materials and Methods
2.1. Materials
A356 alloy was used as the matrix material, and the chemical composition of A356 alloy is listed in Table 1. The 316L stainless steel hollow spheres with two different outer diameters were selected to fabricate the MHSCs according to the requirements, which were manufactured using powder metallurgy [37]. The preparation process of the MHSs is shown in Figure 1. In the automatic coating machine, the metal powder was bonded to the polystyrene spheres using a binder, and then sintered in the high temperature vacuum furnace to fabricate the MHSs. To obtain MHSs with many pores on the wall, the sintering temperature of the MHSs was set as 1100 °C. The sintering process of MHSs is shown in Figure 2. Table 2 shows the wall thickness, the weight, the porosity in the wall of the selected MHSs, and the chemical composition of the 316L stainless steel hollow spheres. The chemical composition of the MHSs is close to that of 316L stainless steel.
2.2. Preparation of MHSCs
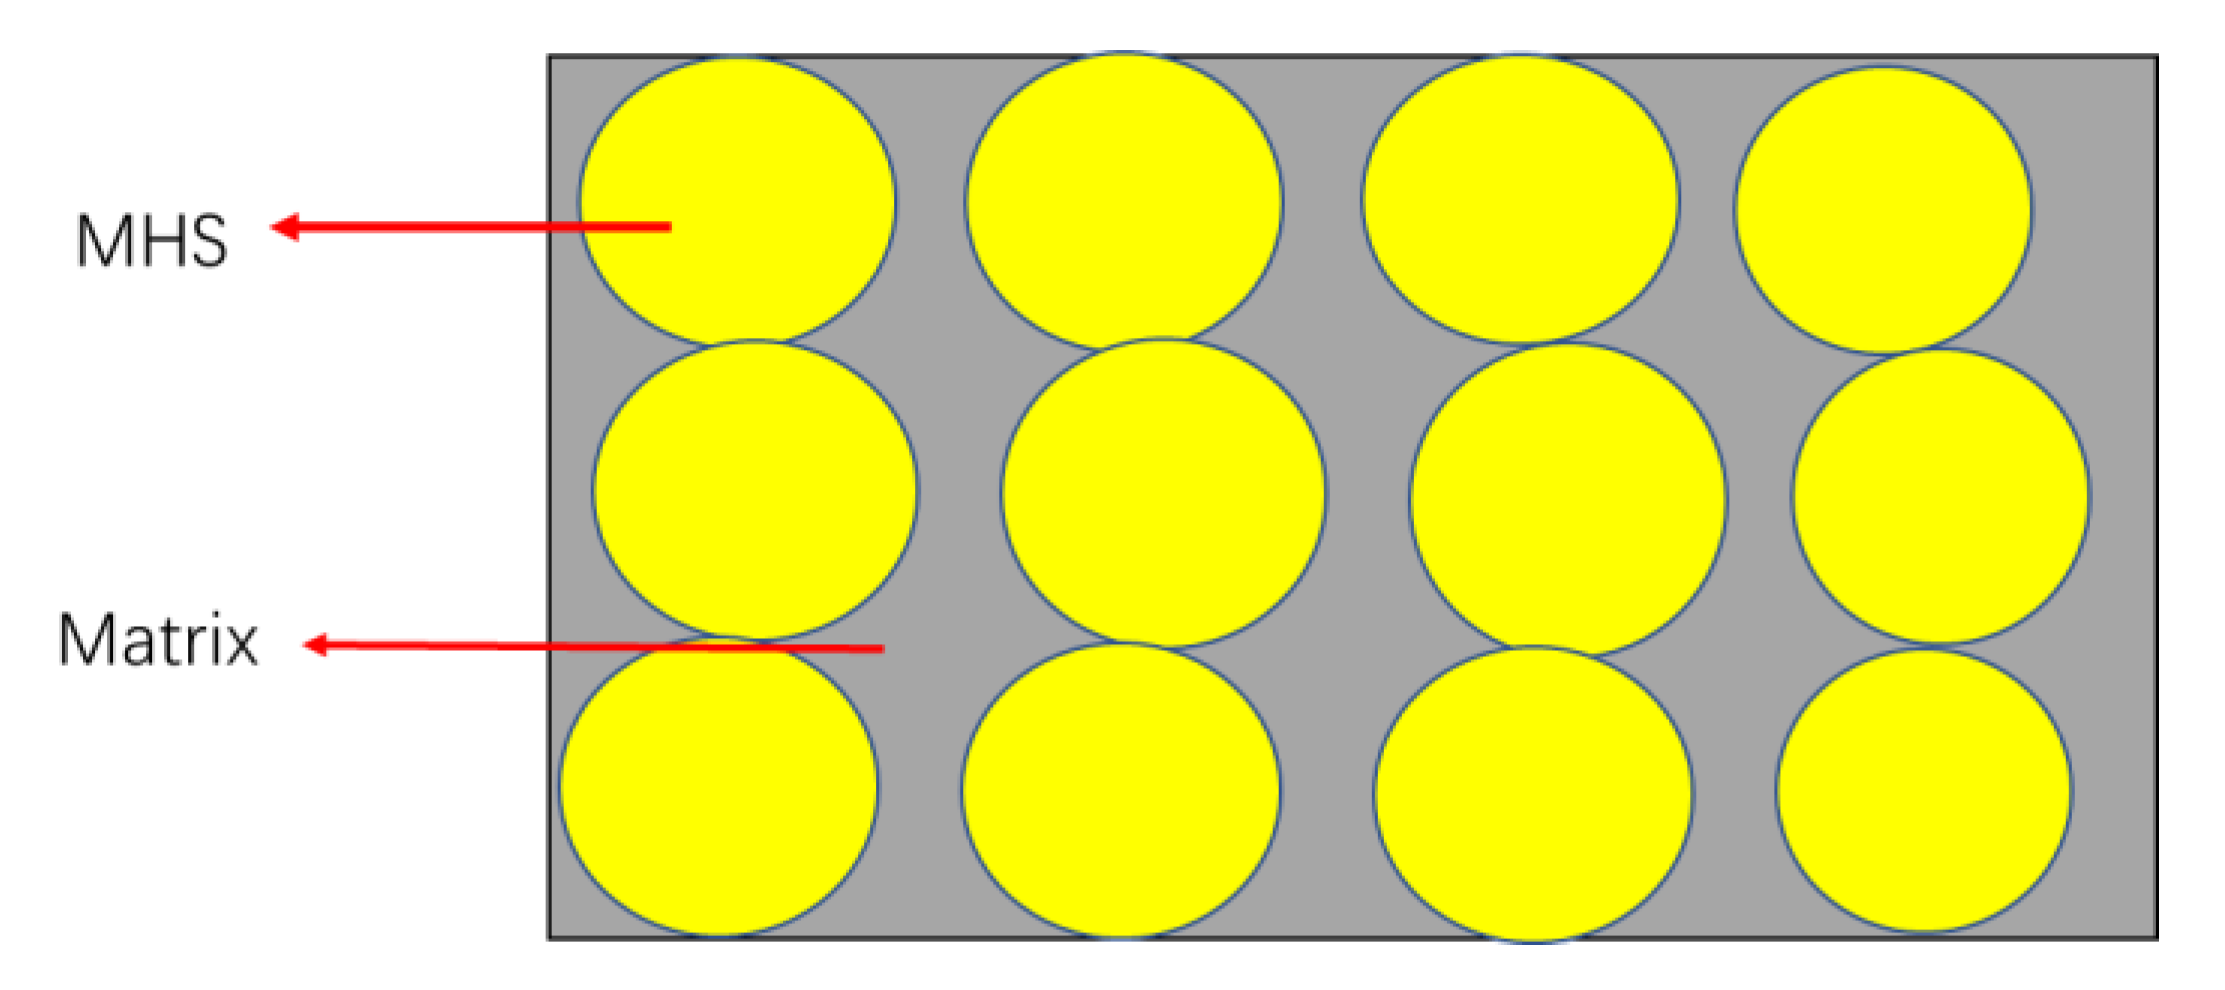
In this study, three types of MHSCs were fabricated by pressure casting (MHSC-3.28, MHSC-5.76, and MHSC with layer structure (MHSCLS)). MHSC-3.28 was the MHSC fabricated by the MHSs with an outer diameter of 3.28 ± 0.002 mm. MHSC-5.76 was fabricated by the MHSs with an outer diameter of 5.76 ± 0.002 mm. In MHSC-3.28 and MHSC-5.76, the distribution of MHSs was random. MHSC-LS is the MHSC with a layered structure of the MHSs fabricated by MHSs with an outer diameter of 3.28 ± 0.002 mm. The distribution of MHSs was uniform in MHSC-LS.
2.2.1. Preparation of MHSC-3.28 and MHSC-5.76
The schematic of fabricating MHSC-3.28 and MHSC-5.76 is shown in Figure 3. In the first step, a certain quantity of MHSs was placed in the forming room after a 316L stainless steel metal fiber grid (MFG) was placed at the narrow open end of the forming room, and then the other MFG was placed on the wide open end of the forming room. Subsequently, the mold was inserted upside down in the crucible, leaving only a tight gap to permit relative motion after the A356 alloy block was placed into the graphite crucible. In the second step, the assembled graphite mold and crucible were placed into the vacuum hot pressing furnace and cast. The casting process adopted in the vacuum hot pressing furnace was as follows: the temperature rose to 710 °C at 10 °C/min and kept for 30 min. Then, the system was cooled down to room temperature, with the pressure kept at 5 MPa through the whole casting process. In the final step, the sample was removed from the mold.
2.2.2. Preparation of MHSC-LS
MHSC-LS was fabricated by the same process parameters and mold as MHSC-3.28 and MHSC-5.76 with some differences. The specific preparation process was as follows: In the first step, MFG was cut into sheets with the size of the forming room in Figure 3 with a wire-electrode cutting machine. In the second step, the MHSs were fixed on the sheets using double-sided adhesive according to the arrangement designed as shown in Figure 4. Then, the layered structures were assembled to form an A-structure using the double-sided adhesive. In the third step, the A-structure was put into the forming room of the mold, and the A356 alloy block was put into a graphite crucible. In the fourth step, the assembled graphite mold and crucible were put into the vacuum hot pressing furnace and cast. The casting process adopted in the vacuum hot pressing furnace was the same as that of MHSC-3.28 and MHSC-5.76. In the final step, the sample was removed from the mold.
2.3. Characterization
2.3.1. Physical Properties of MHSC-3.28 and MHSC-5.76
As the specimens’ shape of the MHSCs is a regular cylinder, this allows for determination of the apparent density by simply weighting specimens in the air and measuring the diameter and height at several locations [47]. The apparent density of the MHSC was calculated after measuring their mass () and volume () according to Equation (1):
The volume fraction of the matrix , MHSs (), and voids in the MHSC were calculated by equations as follows:
where is the mass of the MHSs, is the solid density of the matrix (A356 alloy), and is the density of the single MHS.
2.3.2. Physical Properties of MHSC-LS
The apparent density of MHSC-LS was calculated according to Equation (1). The volume fraction of the matrix and MFGs in MHSC-LS were determined according to the following Equations:
where and are the total mass and volume of MHSC-LS, is the mass of the MFGs, and is the density of the MFGs.
The volume fraction of MHSs can be determined according to Equation (3). Then, the overall void fraction of MHSC-LS () was estimated using Equation (7).
2.3.3. Microstructure Analysis of MHS and MHSCs
To obtain the characteristics of pores on the wall of MHS and the microstructure of MHSCs, the wall of MHS and the microstructure of MHSCs were observed using an optical microscope (DM-IRM275888) manufactured by Shanghai Optical Instrument Factory No. 1, Shanghai, China and a scanning electron microscope (SEM, SU70) manufactured by Hitachi Limited, Beijing, China.
2.3.4. Acoustic Properties of MHSCs
The acoustic properties of MHSC were tested using an impedance tube (SW477) manufactured by Beijing prestige sound and electricity Technology Co., Ltd., Beijing, China. Figure 5 is the schematic diagram of the impedance tube for measuring the sound properties. As shown in Figure 5a, the sound absorption coefficient of the MHSC was measured by a two microphone impedance tube based on the transfer-function method in accordance with BS EN ISO 10534-2:2001 and ASTM E1050-98 standards. As shown in Figure 5b, the sound transmission loss of the MHSC was measured by a four microphone impedance tube based on the transfer matrix method according to the ASTM E2611-09 standard. The measurement frequency range of the sound was 1000–6300 Hz. The dimensions of the tested sample were 30 mm in diameter and 20 mm in thickness. Each sample was tested five times and the average measurement results were obtained.
3. Results and Analysis
3.1. Physical Properties of the MHSCs
The physical properties of MHSC-3.28, MHSC-5.76 and MHSC-LS are listed in Table 3. From Table 3, the densities of MHSC-3.28 (1.74 g/cm3 to 1.77 g/cm3) and MHSC-5.76 (1.74 g/cm3 to 1.76 g/cm3) have a little difference, and are less than that of MHSC-LS (1.93 g/cm3 to 1.97 g/cm3). The results show that the densities of MHSC-LS increased after adding the MFGs. In addition, the void volume fraction of all MHSCs demonstrated differences, and the void volume fraction of MHSC-3.28 (5.08% to 6.20%) and MHSC-5.76 (5.56% to 6.15%) were higher than that of MHSC-LS (3.38% to 4.87%).
3.2. Microstructural Analysis
3.2.1. Microstructural Analysis of the MHSs
The wall microstructures of the MHS with different diameters sintered under 110 °C are shown in Figure 6. We observed from Figure 6a,b that there were many pores between the metal particles on the wall of MHS after sintering. The pores were distributed uniformly on the wall of the MHS. In addition, the microstructures of MHSs with different diameters sintered at the same temperature had little difference. From Figure 6c,d, it was clear that the wall of the MHS was composed of metal particles, pores, and the connections between the metal powder particles. The metal particles and the pores could be seen clearly, and there were few connections between metal powder particles. The pores between the metal particles connected with each other, which connected the inner and outer parts of the MHS.
3.2.2. Microstructural Analysis of the MHSCs
As the composition of the MHSs and the matrix used to fabricate the MHSCs were the same, the products in MHSCs were the same under the same preparation process parameters. The MHSCs were observed by SEM and the results are shown in Figure 7. From Figure 7a,b, there were some pores between the MHSs and matrix in the MHSCs without the alloying reaction. It can be inferred that the combination between the MHSs and the matrix was a simple physical combination. Figure 7c shows the observation results in the matrix. There were also many pores seen in the matrix, except for the needle and block phases.
3.3. Acoustic Performance of the MHSCs
Figure 8 is the sound absorption coefficient–frequency curves of the MHSCs. It can be seen from Figure 8 that the MHSCs resonated with the sound waves and formed the various sound absorption peaks in the different frequency ranges of the sound waves. The sound absorption coefficient of MHSCs was different at off-resonance. From the results of MHSC-3.28 and MHSC-5.76, we found that the resonance frequency of MHSC moved to a higher frequency (from 2500 Hz to 4500 Hz) with increasing diameter of the MHSs, and the peak value of the sound absorption coefficient also increased significantly (from 0.40 to 0.56). However, the sound absorption coefficient of MHSC-3.28 was higher than that of MHSC-5.76 except for the resonance frequency of MHSC (from 4000 Hz to 5000 Hz). From the results of MHSC-3.28 and MHSC-LS, we found that the resonance frequency of MHSC-LS moved to a lower frequency (from 2500 Hz to 1100 Hz) and the peak value of the sound absorption coefficient decreased significantly (from 0.40 to 0.34). The sound absorption coefficient of MHSC-3.28 was higher than that of MHSC-LS apart from the resonance frequency of MHSC-LS (from 1000 Hz to 1800 Hz). Therefore, the diameter and arrangement of MHSs had a great influence on the resonance frequency and sound absorption coefficient of MHSCs.
Figure 9 is the sound transmission loss–frequency curves of the MHSCs. From Figure 9, the curves of MHSC-3.28 and MHSC-5.76 had similar shapes and were different from that of MHSC-LS. From the results of MHSC-3.28 and MHSC-5.76, we found that the sound transmission loss increased gradually with the increasing sound frequency, when the sound frequency ranged from 1000 Hz to 5500 Hz. However, when the sound frequency exceeded 5500 Hz, the sound transmission loss decreased rapidly with the increasing sound frequency. In addition, the sound transmission loss of MHSC-5.76 was somewhat higher than MHSC-3.28. From the results of MHSC-3.28 and MHSC-LS, when the frequency of the sound waves was at a value between 1000 Hz and 3200 Hz, the sound transmission loss of MHSC-LS increased first and then decreased after reaching the peak. Comparing with the curves of MHSC-3.28, MHSC-LS showed a higher value. When the sound frequency surpassed 3200 Hz, the sound transmission loss of MHSC-LS turned to become lower than MHSC-3.28. At this time, the shapes of the MHSCs were similar, and the sound transmission loss of the MHSCs demonstrated some differences. Therefore, the arrangement of MHSs in the MHSCs had great influence on the sound transmission loss of the MHSCs; however, the diameter of the MHSs seemed to have little influence on the transmission loss of the MHSCs.
4. Discussion
4.1. The Propagation Mechanism of Sound Waves in the MHSC
The propagation method of sound waves in porous material is mainly affected by the propagation constant () and characteristic impedance () of the porous material. When the sound waves enter into the porous material from the air, the reflection and refraction will occur at the interface between the material and the air. The sound waves enter into the porous material through the refraction. The related graph is shown in Figure 10.
When the plane sound waves enter the porous material surface perpendicular from the air ( = 0), the surface acoustic impedance of the porous material () is as follows:
Here, is the thickness of the porous material tested.
When the matches the characteristic impedance of air (), the sound waves enter into the porous material by refraction. When the does not match the characteristic impedance of air (), the sound waves are reflected to the air. The MHSC can be considered to be consisting of the porous material (MHSs) and rigid matrix material (Al matrix). As the wall of the MHS has higher porosity (47.87%), the surface acoustic impedance of the MHS () matches with the , and the sound waves easily enter the MHS from the air and propagate. However, the surface acoustic impedance of the rigid matrix materials () do not match with the , and the sound waves find it difficult to enter the rigid matrix material from the air and propagate. As the does not match with the , the sound waves could not enter into the MHS from the rigid matrix material.
The physical process of sound wave propagation in the MHSC can be understood by studying the sound absorption mechanism of MHSC at the microscale. From the microscale, a schematic diagram of the possible propagation process of the sound waves in the MHSC was established under the off-resonance condition and shown in Figure 11a. From Figure 11a, the distribution of the MHSs in the MHSC is random. When the sound waves enter the surface of the MHSC vertically (Pi), they would be reflected back to the air (Pr) at the interface between the matrix and air. The sound waves enter the MHSs through refraction (Pt) from the air at the interface between the MHSs and air.
At this time, the number of MHSs in the surface of the MHSC determines the number of sound waves entering into MHSC. The more MHSs that existed in the surface of the MHSC, the more the sound waves enter into the MHSC through refraction. As the does not match the , the sound waves that enter MHSs (Pt) in the surface of the MHSC cannot propagate to the matrix, and can only propagate to the MHSs contacts. If the MHSs in the surface of the MHSC are surrounded by the matrix, the sound waves entering into MHSs are reflected to the air after propagating in the MHS, and the propagation way of sound waves in MHS is shown in Figure 11b. From Figure 11b, the sound waves entering into the MHS are divided into two parts. One part enters inside the MHS directly through the wall of the MHS by the pores on the wall of the MHS, and the other part propagates through the pores interconnected along the wall of the MHS. These sound waves finally return to the air after propagating in the MHS and reflecting by the interface between the matrix and MHS.
If the MHSs in the surface of the MHSC are closely connected with the other MHSs, the sound waves entering into MHSs continue to propagate down into the other MHSs along the connection between the MHSs. The propagation of sound waves between the MHSs is shown in Figure 11c. From the Figure 11c, the sound waves divide into two parts to propagate and pass through the MHS. When the MHSs are connected closely, the sound waves pass through the MHSC by the channels formed between each MHS. If the MHSs, which are connected closely, cannot form channels passed through the MHSC, the sound waves would be reflected and finally returned to the air.
During the transmission of sound waves by the MHSs, the sound waves propagating in the wall of the MHS would be consumed due to the viscous effects and thermal effects, and the sound waves returned through the MHSs are reduced due to consumption. In addition, there are some MHSs in the MHSC without passing the sound waves. Therefore, the acoustic performance of the MHSC is mainly determined by the distribution of the MHSs in the MHSC under the off-resonance condition. When the MHSC has more MHSs in the surface and more channels of the MHSs through the MHSC, the sound absorption coefficient of the MHSC is higher. At the same time, there are more sound waves passed through the MHSC by the channels, and the sound transmission loss of the MHSC is lower.
When the sound waves resonate with the MHSC, the sound waves mainly enter into the MHSC by resonance, as shown in Figure 12a. The sound waves enter into the matrix at the interface between the matrix and air from the air by resonance, while the access and propagation of sound waves in the MHSs have no change. If the sound waves entering into the matrix propagate to the interface between the MHSs and the matrix in the transmission process, the sound waves could not enter into the MHSs but instead reflect due to the mismatch between the and the , as shown in Figure 12b. From Figure 12b, the transmission direction of sound waves is changed after reflecting. After many instances of reflection, most of the sound waves are reflected to the air, and only few sound waves pass the MHSC along the continuous matrix.
Due to vibrations of the MHSC, some sound waves consumed in the transmission process lead to a reduction of the sound waves, which pass through the MHSC and cause the sound waves to reflect into the air. Thus, the acoustic performance of the MHSC is mainly determined by area of the interface between the MHSs and the matrix under the resonance condition. That is to say, when the MHSC has more interface between the MHSs and the matrix, the sound waves reflect to the air and the absorption coefficient of MHSC becomes lower. At same time, the sound waves passing the MHSC reduce and the sound transmission loss of the MHSC increases.
4.2. The Arrangement of MHSs on the Acoustic Properties of MHSC
As the preparation process of the MHSCs is different, the distribution of MHSs in MHSC-LS was more uniform than in MHSC-3.28. Figure 13 is the structure diagram of MHSC-LS, which shows that the distribution of the MHSs is a uniform and layered structure. However, in MHSC-3.28, the distribution of the MHSs was random and the dense areas and sparse areas appeared irregularly. Therefore, the number of the channels, formed by MHSs, through MHSC-LS, was higher than that of the channels formed by MHSs through MHSC-3.28. In addition, the density of the MHS was lower than that of the A356 melt, making the MHSs concentrate on the top of the MHSC during the casting process (surface of the sound waves entering). Therefore, this led to a rise in the number of the MHSs in the surface of MHSC-3.28, which was higher than for MHSC-LS.
Under the condition that the sound waves did not resonate with MHSC, due to the larger number of the MHSs existing in the surface of MHSC-3.28, the sound absorption coefficient of MHSC-3.28 was higher than that of MHSC-LS. However, the greater channel of the MHSs through MHSC-LS allowed the sound waves to pass MHSC-LS more easily than MHSC-3.28, which made the sound transmission loss of MHSC-LS lower than MHSC-3.28.
When the sound waves resonated with the MHSC, all the sound waves entering the matrix were reflected by the interface of the layered structure in MHSC-LS, and few sound waves passed MHSC-LS by the matrix. However, in MHSC-3.28, there were some sound waves that passed MHSC-3.28 through the continuous matrix, and the sound waves reflected to the air in MHSC-3.28 were lesser than those reflected to the air in MHSC-LS. Thus, the sound absorption coefficient peak of MHSC-LS was lower than that of MHSC-3.28 at resonance frequency.
In addition, the vibration of MHSC-LS also consumed the sound waves propagating in MHSC-LS, which reduced the sound waves that passed through MHSC-LS. In other words, the sound transmission loss of MHSC-LS increased with resonance. In MHSC-3.28, although sound waves passed MHSC-3.28 through the matrix, the sound waves that passed through MHSC-3.28 still reduced slightly under the consumption of vibration. The sound transmission loss of MHSC-3.28 had little change at resonance. Therefore, the sound transmission loss of MHSC-LS at resonance was higher than that of MHSC-3.28.
4.3. The Diameter of MHS on the Acoustic Properties of MHSC
As we know, the MHSs with the diameter of 3.28 mm had larger quantities and surface areas than the MHSs with the diameter of 5.76 mm, when the volume of the MHSs was the same. As the volume fraction of MHSs in MHSC-3.28 and MHSC-5.76 was the same (48.50%), MHSC-3.28 had more quantities of MHSs and interfaces between the MHSs and the matrix than MHSC-5.76. In addition, due to the higher quantities, MHSC-3.28 had more uniform distribution of MHSs, more MHSs in the surface and more channels of the MHSs.
When the sound waves did not resonate with the MHSC, the sound absorption coefficient of MHSC-3.28 was higher than that of MHSC-5.76 due to its larger number of MHSs in the surface and more channels compared with MHSC-5.76. At the same time, there were more sound waves that passed MHSC-3.28 than that passed MHSC-5.76; therefore, the sound transmission loss of MHSC-3.28 was lower than that of MHSC-5.76. When the sound waves resonated with the MHSC, MHSC-3.28 had more interfaces between the MHSs and the matrix than MHSC-5.76, and there were more sound waves reflected to the air in the matrix of MHSC-3.28 than for MHSC-5.76. Thus, the sound absorption coefficient peak value of MHSC-3.28 was lower than that of MHSC-5.76 at the resonance frequency. The number of the channels in MHSC-3.28 were more than the channels in MHSC-5.76; therefore, there were more sound waves passing MHSC-3.28 than passing MHSC-5.76, which made the sound transmission loss of MHSC-3.28 lower than that of MHSC-5.76.
5. Conclusions
In the present work, MHSC-3.28, MHSC-5.76, and MHSC-LS were fabricated using the pressure casting method under a vacuum. We studied the physical properties, microstructure, and the acoustic properties of the MHSCs. The propagation mechanism of sound waves in the MHSC were discussed. The main conclusions drawn from this work are the following:
(1) The densities of MHSC-3.28 (1.74 g/cm3 to 1.77 g/cm3) were nearly the same as the densities of MHSC-5.76 (1.74 g/cm3 to 1.76 g/cm3), and lower than those of MHSC-LS (1.93 g/cm3 to 1.97 g/cm3).
(2) There are pores in the interface regions between the MHSs and the matrix. The combination of the MHSs and the matrix is a simple physical combination without an alloying reaction.
(3) At off-resonance, the acoustic performance of the MHSC was mainly determined by the distribution of the MHSs in the MHSC. At resonance, the interface between the MHSs and the matrix was the main factor that affected the acoustic properties of MHSC.
(4) The uniform distribution of MHSs in the MHSC made the resonant frequency move to the low frequency. Due to the layered structure, the sound absorption coefficient and the sound transmission loss of MHSC-LS were lower than that of MHSC-3.28 at off-resonance, and the sound absorption coefficient peak of MHSC-LS was lower than that of MHSC-3.28, while the sound transmission loss of MHSC-LS was higher than that of MHSC-3.28 at resonance.
(5) Due to the diameter effect of the MHSs, the resonant frequency of MHSC-3.28 moved to the low frequency. At off-resonance, the sound absorption coefficient of MHSC-3.28 was higher than that of MHSC-5.76, and the sound transmission loss of MHSC-3.28 was lower than that of MHSC-5.76. At resonance, the sound absorption coefficient peak value of MHSC-3.28 was lower than that of MHSC-5.76, and the sound transmission loss of MHSC-3.28 was lower than that of MHSC-5.76.
Author Contributions
Conceptualization, F.J.; Data curation, S.S., T.Y. and C.G.; Formal analysis, F.J. and C.G.; Writing—original draft, C.W.; Writing—review and editing, C.W. All authors have read and agreed to the published version of the manuscript.
Funding
The authors gratefully acknowledge the financial support of this study by the National Natural Science Foundation of China (No. 51671065 and 11972128), the tackling the key problems of Double Hundred Technology (No. JCKY2018604C004), Fundamental Research funds for the Central Universities (3072020CFT1003).
Conflicts of Interest
The authors declare no conflict of interest.
References
- Badini, C.; Busse, M.; Kayvantash, K.; Lehmhus, D. Advanced materials in transportation. Adv. Eng. Mater. 2010, 12, 557–652. [Google Scholar]
- Rugele, K.; Lehmhus, D.; Hussainova, I.; Peculevica, J.; Lisnanskis, M.; Shishkin, A. Effect of fly-ash cenospheres on properties of clay-ceramic syntactic Foams. Materials 2017, 10, 828. [Google Scholar] [CrossRef] [Green Version]
- Shishkin, A.; Mironovs, V.; Zemchenkov, V.; Antonov, M.; Hussainova, I. Hybrid syntactic foams of metal-fly ash cenosphere-clay. Key Eng. Mater. 2016, 674, 35–40. [Google Scholar] [CrossRef]
- Shishkin, A.; Hussainova, I.; Kozlov, V.; Lisnanskis, M.; Leroy, P.; Lehmhus, D. Metal-coated cenospheres obtained via magnetron sputter coating: A new precursor for syntactic foams. JOM 2018, 70, 1319–1325. [Google Scholar] [CrossRef]
- Shishkin, A.; Drozdova, M.; Kozlov, V.; Hussainova, I.; Lehmhus, D. Vibration-assisted sputter coating of cenospheres: A new approach for realizing cu-based metal matrix myntactic foams. Metals 2017, 7, 16. [Google Scholar] [CrossRef] [Green Version]
- Gupta, N.; Nagorny, R. Tensile properties of glass microballoon-epoxy resin syntactic foams. J. Appl. Polym. Sci. 2006, 102, 1254–1261. [Google Scholar] [CrossRef]
- Huang, R.; Li, P. Elastic behaviour and failure mechanism in epoxy syntactic foams: The effect of glass microballoon volume fractions. Compos. B Eng. 2015, 78, 401–408. [Google Scholar] [CrossRef]
- Peroni, L.; Scapin, M.; Lehmhus, D.; Baumeister, J.; Busse, M.; Avalle, M. High strain rate tensile and compressive testing and performance of mesoporous invar (FeNi36) matrix syntactic foams produced by feedstock extrusion. Adv. Eng. Mater. 2016, 19, 1600474. [Google Scholar] [CrossRef]
- Weise, J.; Lehmhus, D.; Baumeister, J.; Kun, R.; Bayoumi, M.; Busse, M. Production and properties of 316L stainless steel cellular materials and syntactic foams. Steel Res. Int. 2014, 85, 486–497. [Google Scholar] [CrossRef]
- Gupta, M.; Wong, W.L.E. High performance magnesium based composites containing nano-length scale/amorphous/hollow reinforcements. Mater. Sci. Forum. 2016, 879, 642–647. [Google Scholar] [CrossRef]
- Caty, O.; Maire, E.; Douillar, T.; Bertino, P.; Dejaeger, R.; Bouchet, R. Experimental determination of the macroscopic fatigue properties of metal hollow sphere structures. Mater. Lett. 2009, 63, 1131–1134. [Google Scholar] [CrossRef]
- Arenas, J.P.; Crocker, M.J. Recent trends in porous sound absorbing materials. Sound Vib. 2010, 44, 12–17. [Google Scholar]
- Fallet, A.; Lhuissier, P.; Salvo, L.; Martin, C.L.; Wiegmann, A.; Kabel, M. Multifunctional optimization of random hollow sphere stackings. Scr. Mater. 2013, 68, 35–38. [Google Scholar] [CrossRef]
- Rabiei, A.; Vendra, L.; Reese, N.; Young, N.; Neville, B.P. Processing and characterization of a new composite metal foam. Mater. Trans. 2006, 47, 2148–2153. [Google Scholar] [CrossRef] [Green Version]
- Neville, B.P.; Rabiei, A. Composite metal foams processed through powder metallurgy. Mater. Des. 2008, 29, 388–396. [Google Scholar] [CrossRef]
- Goehler, H.; Jehring, U.; Meinert, J.; Hauser, R.; Quadbeck, P.; Kuemmel, K. Functionalized metallic hollow sphere Structures. Adv. Eng. Mater. 2014, 16, 335–339. [Google Scholar] [CrossRef]
- Sanders, W.S.; Gibson, L.J. Mechanics of hollow sphere foams. Mater. Sci. Eng. A 2003, 347, 70–85. [Google Scholar] [CrossRef]
- Friedl, O.; Motz, C.; Peterlik, H.; Puchegger, S.; Reger, N.; Pippan, R. Experimental investigation of mechanical properties of metallic hollow sphere structures. Metall. Mater. Trans. B 2008, 39, 135–146. [Google Scholar] [CrossRef]
- Vesenjak, M.; Ren, Z.; Fiedler, T.; Öchsner, A. Impact behavior of composite hollow sphere structures. J. Compos. Mater. 2009, 43, 2491–2505. [Google Scholar] [CrossRef]
- Brown, J.A.; Vendra, L.J.; Rabiei, A. Bending Properties of Al-steel and steel-steel composite metal foams. Metall. Mater. Trans. A 2010, 41, 2784–2793. [Google Scholar] [CrossRef]
- Vendra, L.J.; Rabiei, A. Evaluation of modulus of elasticity of composite metal foams by experimental and numerical techniques. Mater. Sci. Eng. A 2010, 527, 1784–1790. [Google Scholar] [CrossRef]
- Vendra, L.J.; Brown, J.A.; Rabiei, A. Effect of processing parameters on the microstructure and mechanical properties of Al-steel composite foam. J. Mater. Sci. 2011, 46, 4574–4581. [Google Scholar] [CrossRef]
- Rabiei, A.; Garcia-Avila, M. Effect of various parameters on properties of composite steel foams under variety of loading rates. Mater. Sci. Eng. A 2013, 564, 539–547. [Google Scholar] [CrossRef]
- Alvandi-Tabrizi, Y.; Whisler, D.A.; Kim, H.; Rabiei, A. High strain rate behavior of composite metal foams. Mater. Sci. Eng. A 2015, 631, 248–257. [Google Scholar] [CrossRef]
- Chen, S.; Marx, J.; Rabiei, A. Experimental and computational studies on the thermal behavior and fire retardant properties of composite metal foams. Int. J. Therm. Sci. 2016, 106, 70–79. [Google Scholar] [CrossRef] [Green Version]
- Chen, S.; Bourham, M.; Rabiei, A. Applications of open-cell and closed-cell metal foams for radiation shielding. Procedia Mater. Sci. 2014, 4, 293–298. [Google Scholar] [CrossRef] [Green Version]
- Chen, S.; Bourham, M.; Rabiei, A. Attenuation efficiency of X-ray and comparison to gamma ray and neutrons in composite metal foams. Radiat. Phys. Chem. 2015, 117, 12–22. [Google Scholar] [CrossRef] [Green Version]
- Chen, S.; Bourham, M.; Rabiei, A. Neutrons attenuation on composite metal foams and hybrid open-cell Al foam. Radiat. Phys. Chem. 2015, 109, 27–39. [Google Scholar] [CrossRef] [Green Version]
- Marx, J.; Portanova, M.; Rabiei, A. A study on blast and fragment resistance of composite metal foams through experimental and modeling approaches. Compos. Struct. 2018, 194, 652–661. [Google Scholar] [CrossRef]
- Marx, J.; Portanova, M.; Rabiei, A. Ballistic performance of composite metal foams. Compos. Struct. 2015, 125, 202–211. [Google Scholar]
- Majlinger, K.; Orbulov, I.N. Characteristic compressive properties of hybrid metal matrix syntactic foams. Mater. Sci. Eng. A 2014, 606, 248–256. [Google Scholar] [CrossRef]
- Orbulov, I.N.; Májlinger, K. Characterisation of hybrid metal matrix syntactic foams. Mater. Sci. Forum. 2015, 812, 219–222. [Google Scholar] [CrossRef] [Green Version]
- Szlancsik, A.; Katona, B.; Bobor, K.; Majlinger, K.; Orbulov, I.N. Compressive behavior of aluminium matrix syntactic foams reinforced by iron hollow spheres. Mater. Des. 2015, 83, 230–237. [Google Scholar] [CrossRef] [Green Version]
- Cochran, J.K. Ceramic Hollow Spheres and Their Applications. Curr. Opin. Solid State Mater. Sci. 1998, 3, 474–479. [Google Scholar] [CrossRef]
- Wang, X.; Lu, T.J. Optimized acoustic properties of cellular solids. Acoust. Soc. Am. 1999, 106, 756–765. [Google Scholar] [CrossRef]
- Wu, G.; Li, R.; Yuan, Y.; Jiang, L.; Sun, D. Sound absorption properties of ceramic hollow sphere structures with micro-sized open cell. Mater. Lett. 2014, 134, 268–271. [Google Scholar] [CrossRef]
- Yu, T.; Jiang, F.; Wang, C.; Cao, M.; Wang, Z.; Chang, Y.; Guo, C. Investigation on fabrication and microstructure of Ti-6Al-4V alloy hollow spheres by powder metallurgy. Met. Mater. Int. 2019. [Google Scholar] [CrossRef]
- Rayleigh, J.W.S. The Theory of Sound; Dover Publications: New York, NY, USA, 1896. [Google Scholar]
- Zwikker, C.; Kosten, C.W. Sound Absorbing Materials; Elsevier: Amsterdam, The Netherlands, 1949. [Google Scholar]
- Komatsu, T. Improvement of the Delany–Bazley and Miki models for fibrous sound-absorbing materials. Acoust. Sci Technol. 2008, 29, 121–129. [Google Scholar] [CrossRef] [Green Version]
- Allard, J.F.; Daigle, G. Propagation of sound in porous media: Modeling sound absorbing materials. J. Acoust. Soc. Am. 1994, 95, 2785. [Google Scholar] [CrossRef] [Green Version]
- Li, Y.; Wang, X.; Wang, X.; Ren, Y.; Han, F.; Wen, C. Sound absorption characteristics of aluminum foam with spherical cells. J. Appl. Phys. 2011, 110, 113525.1–113525.7. [Google Scholar] [CrossRef]
- Bao, H.Q.; Zhang, N.; Hou, X.G. Analysis of the influence of static flow resistance on the sound absorption properties of aluminum foam. Adv. Mater. 2012, 535–537, 1459–1462. [Google Scholar] [CrossRef]
- Sun, J.X.; Duan, C.Y.; Liu, P.S. Sound absorption characterization of aluminum foam made by press infiltration casting multidiscip. Model. Mater. Struct. 2016, 12, 737–747. [Google Scholar] [CrossRef]
- Han, F.; Seiffert, G.; Zhao, Y.; Gibbs, B. Acoustic absorption behaviour of an open-celled aluminium foam. J. Appl. Phys. 2003, 36, 294–302. [Google Scholar] [CrossRef] [Green Version]
- Bao, H.Q.; Zhang, N.; Hou, X.G. Primary investigation on sound absorption performance of highly porous titanium foams. Mater. Des. 2015, 85, 275–281. [Google Scholar]
- Tatarinov, A.; Shishkin, A.; Mironovs, V. Correlation between ultrasound velocity, density and strength in metal-ceramic composites with added hollow spheres. IOP Conf. Ser. Mater. Sci. Eng. 2019, 660, 012040. [Google Scholar] [CrossRef]
Figure 1.
Schematic diagram of the prepared process of metal hollow spheres (MHSs).

Figure 2.
Sintering process of the MHSs.

Figure 3.
The schematic of the metal hollow sphere composite (MHSC) fabrication process.

Figure 4.
The fabrication schematic of MHSs layered structure.

Figure 5.
Schematic diagram of impedance tube for measuring sound properties. (a) Sound absorption coefficient testing; (b) transmission loss testing.
Figure 5.
Schematic diagram of impedance tube for measuring sound properties. (a) Sound absorption coefficient testing; (b) transmission loss testing.
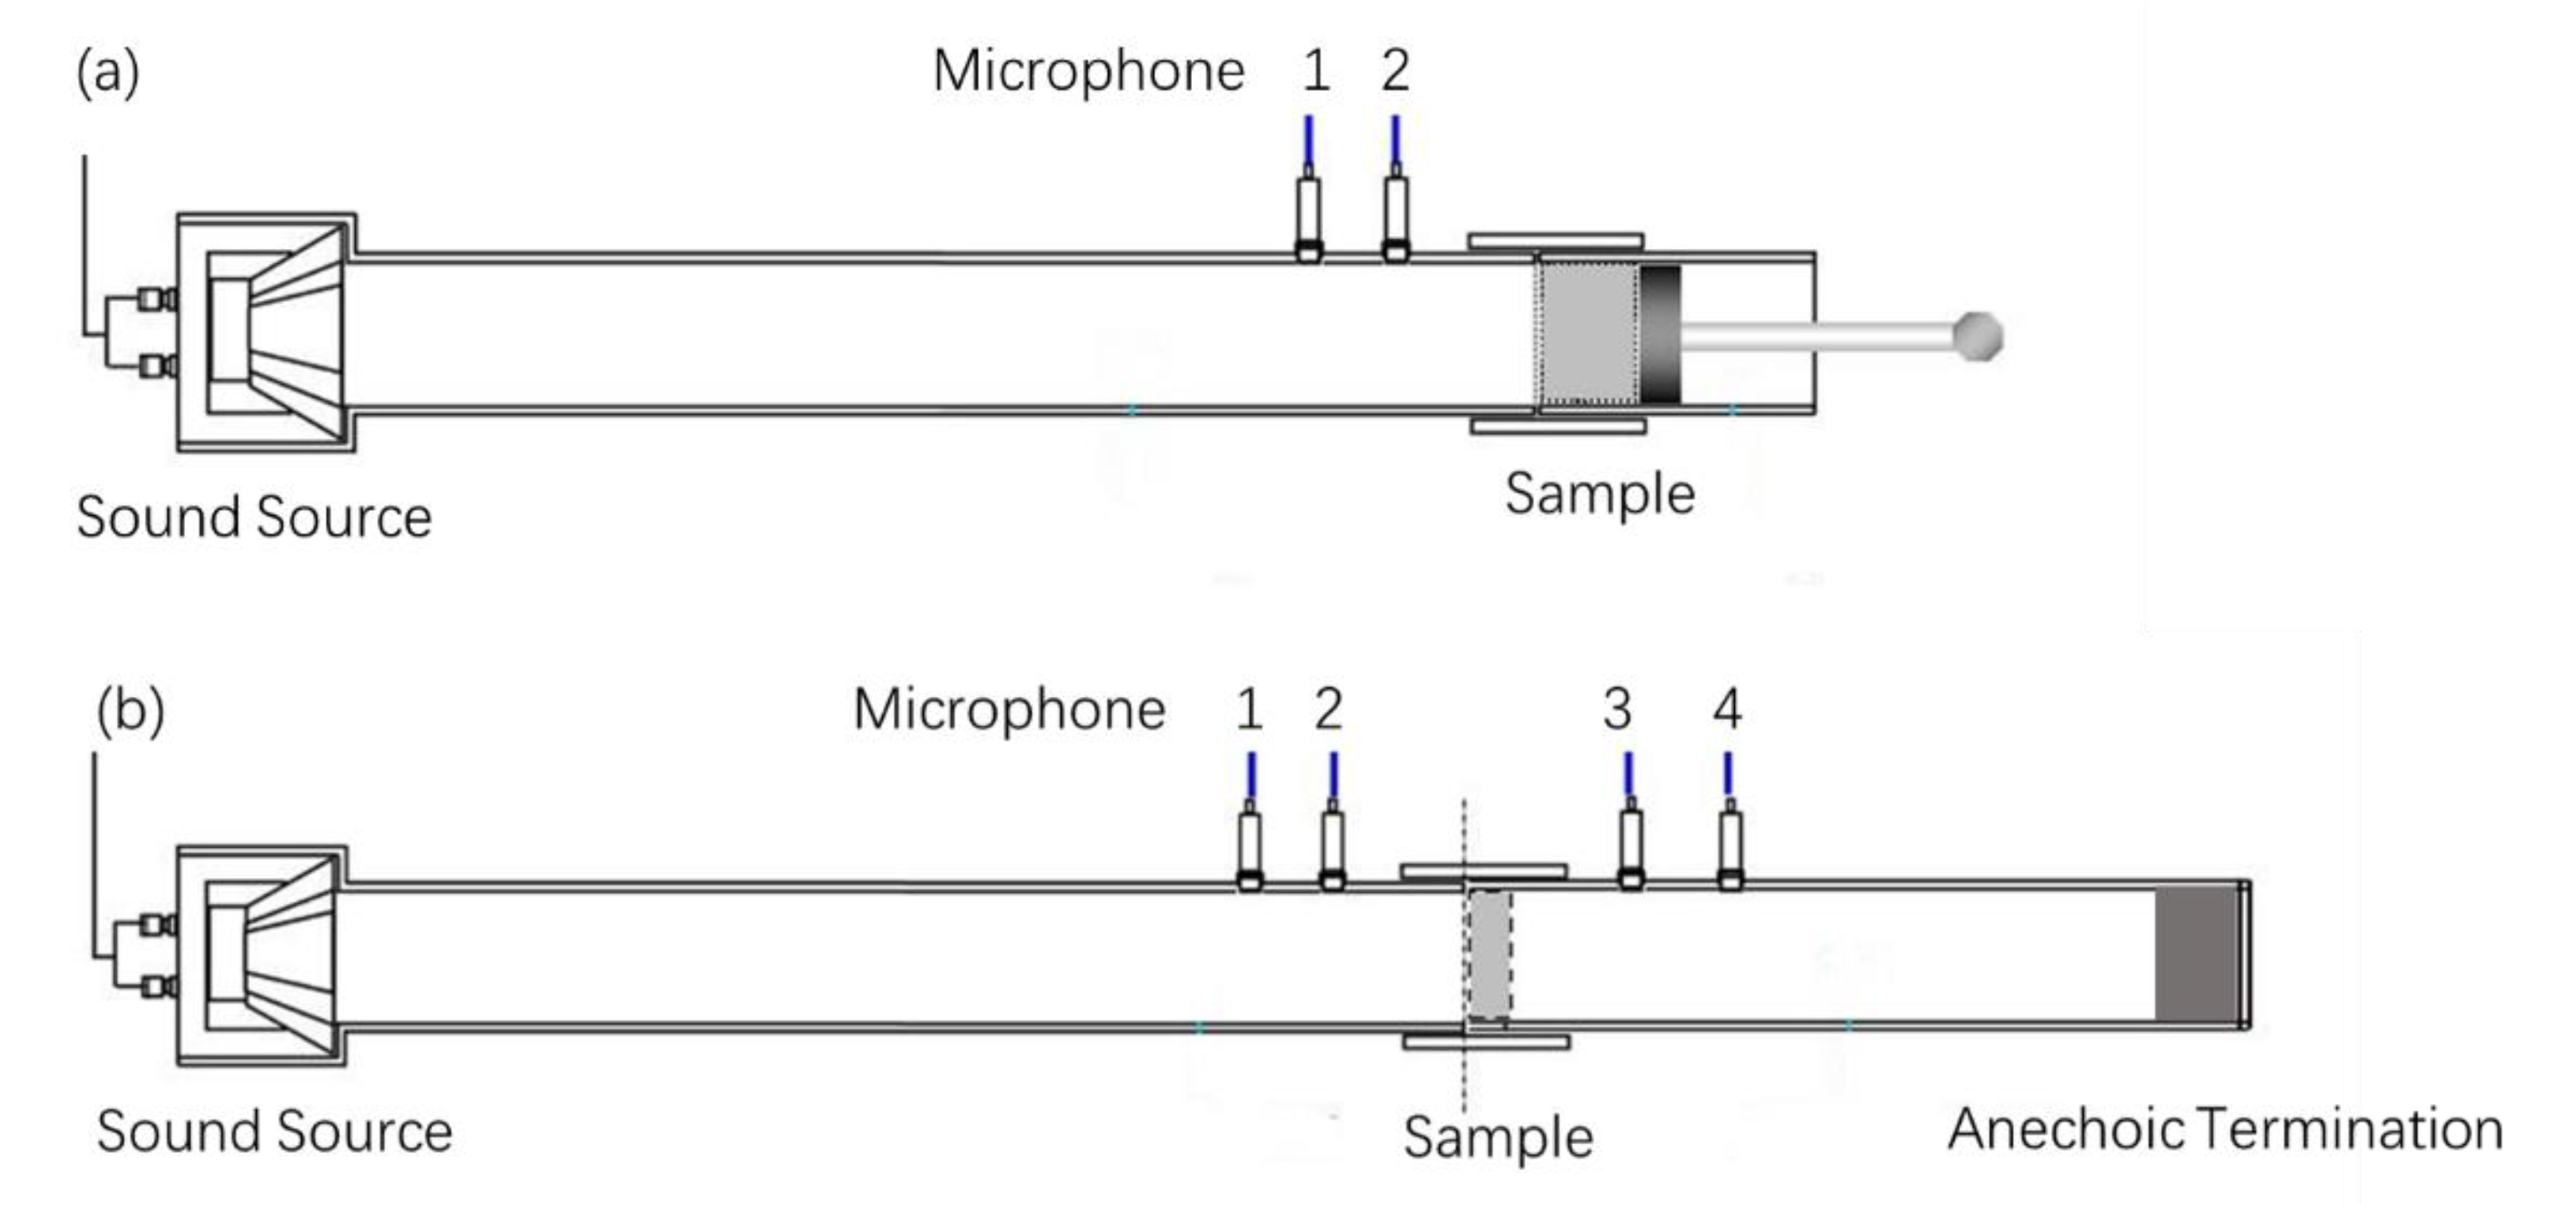
Figure 6.
The wall micromorphology of the MHS with different diameters sintered at 1100 °C: (a–c) d = 3.28 mm; (b–d) d = 5.76 mm.
Figure 6.
The wall micromorphology of the MHS with different diameters sintered at 1100 °C: (a–c) d = 3.28 mm; (b–d) d = 5.76 mm.
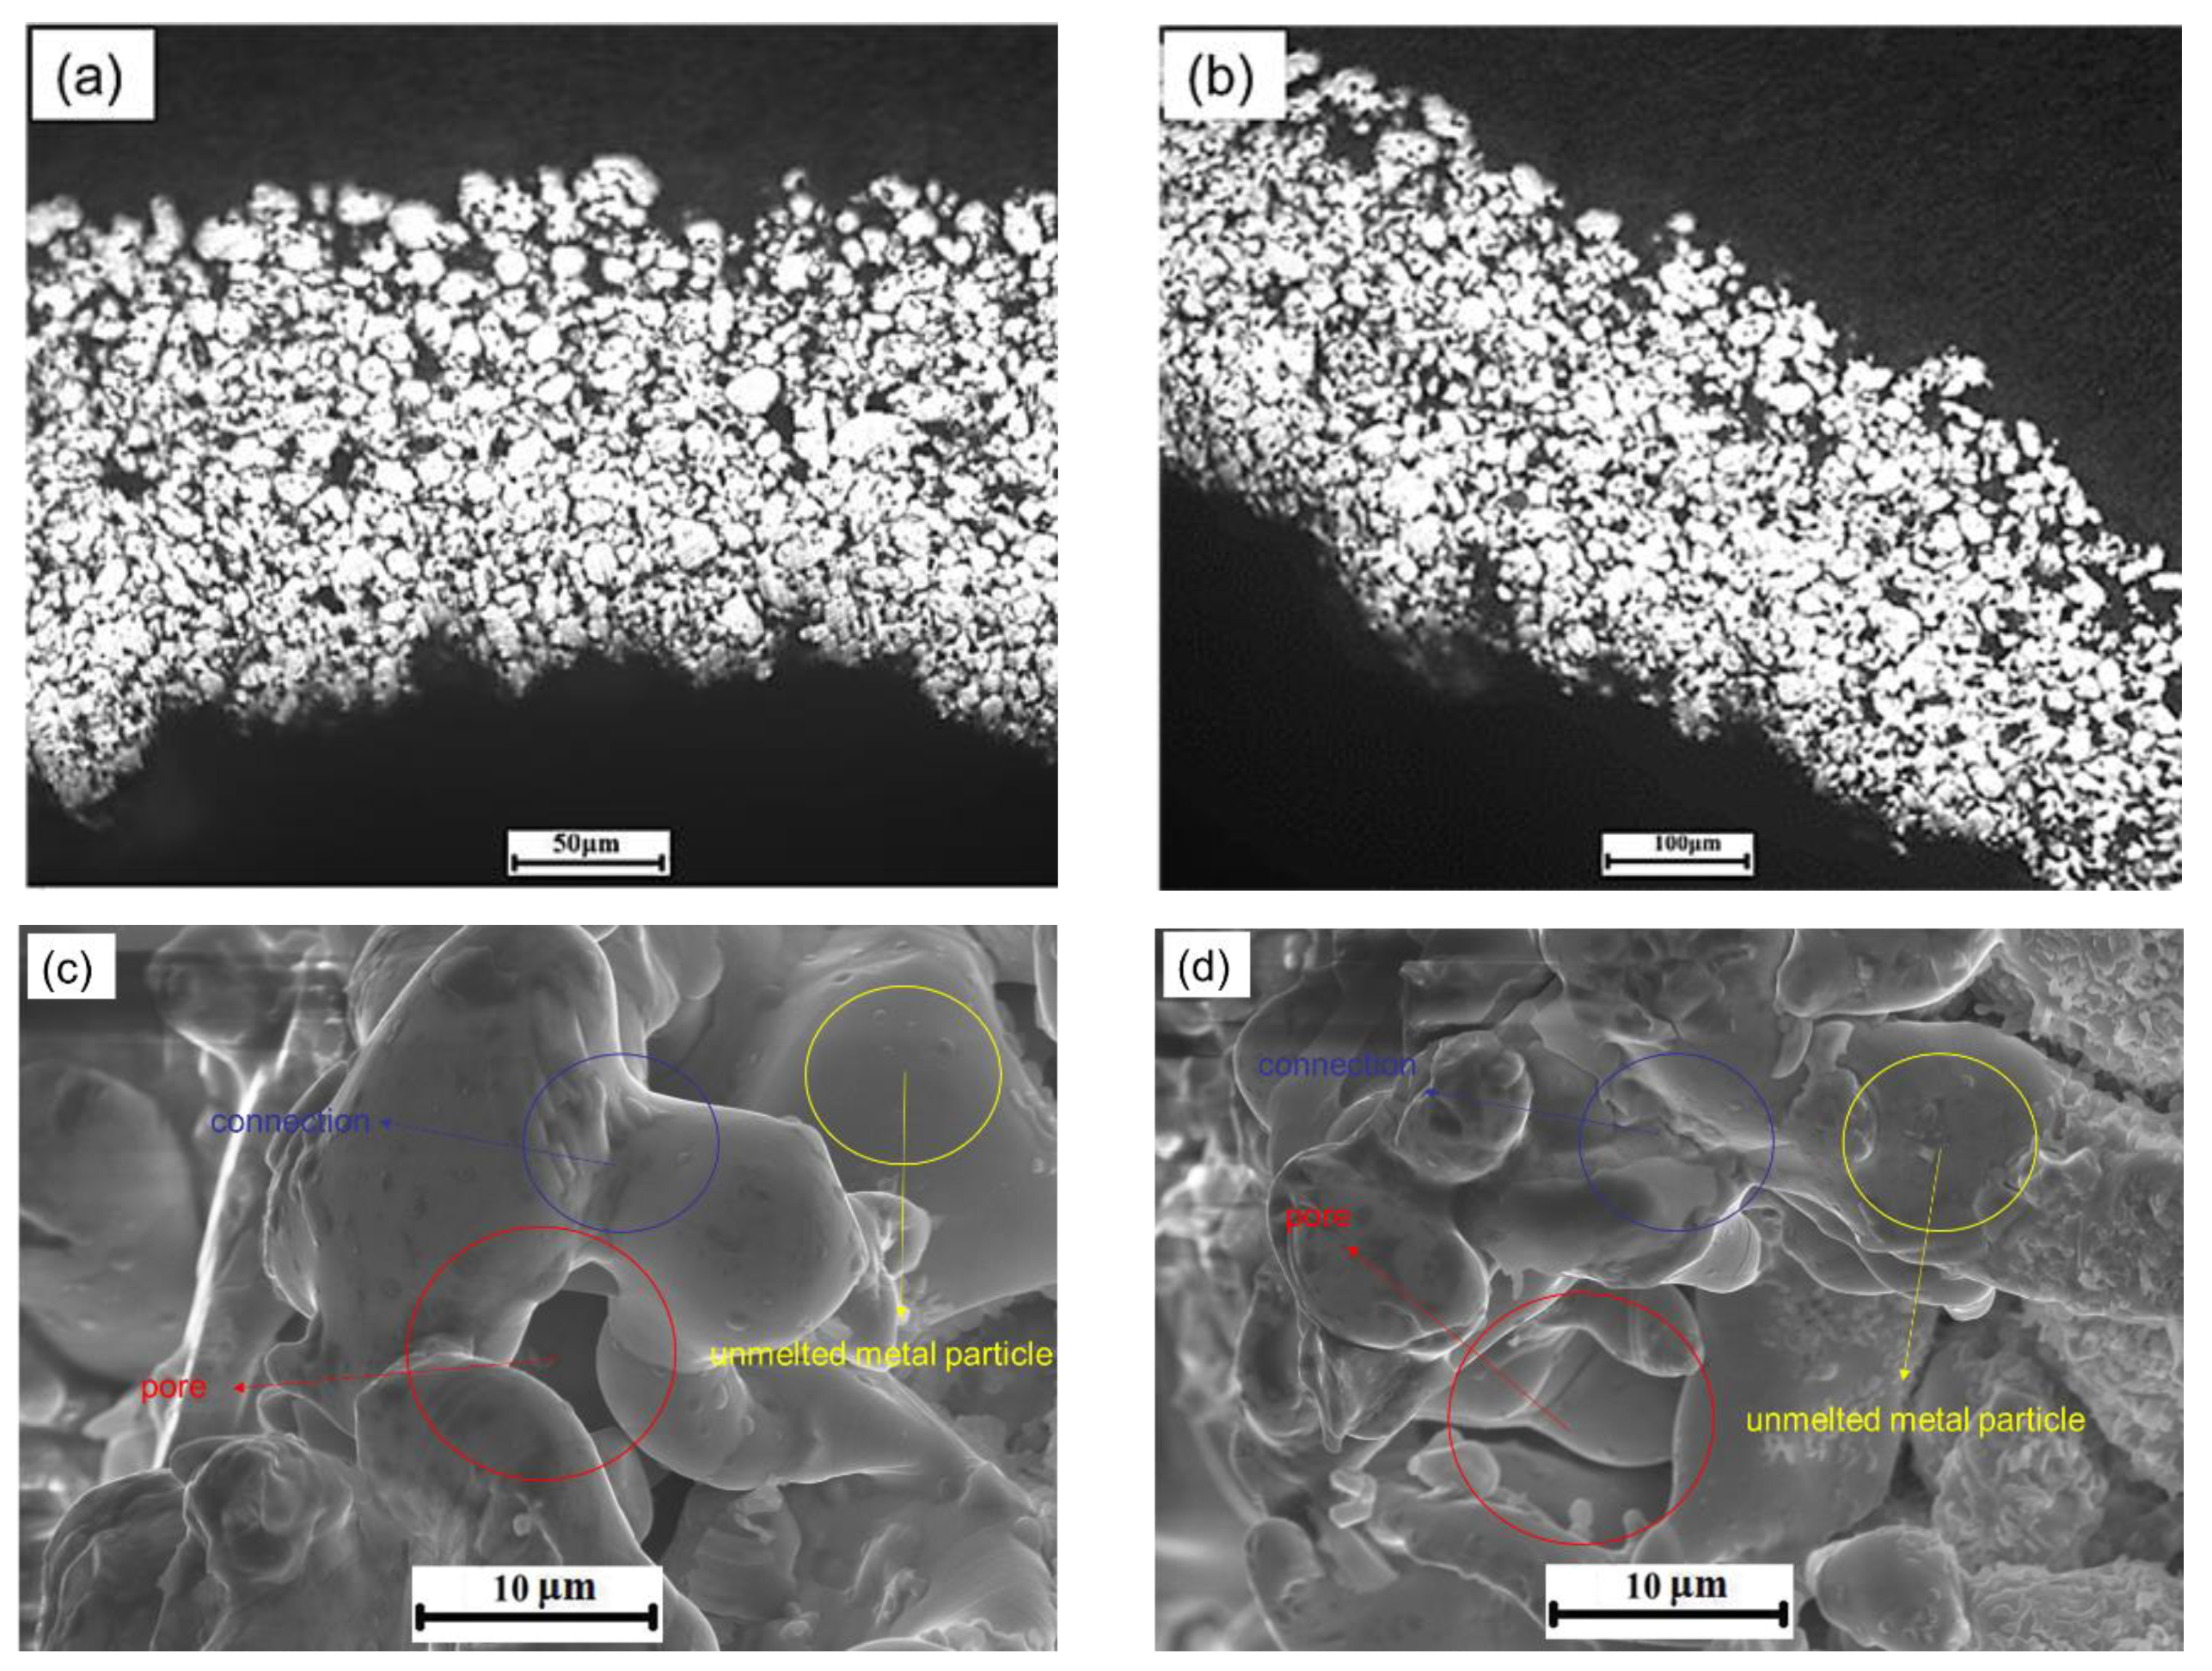
Figure 7.
The interface and matrix in the MHSCs: (a) interface around the MHS, d = 3.28 mm; (b) interface around MHS, d = 5.76 mm; (c) matrix.
Figure 7.
The interface and matrix in the MHSCs: (a) interface around the MHS, d = 3.28 mm; (b) interface around MHS, d = 5.76 mm; (c) matrix.
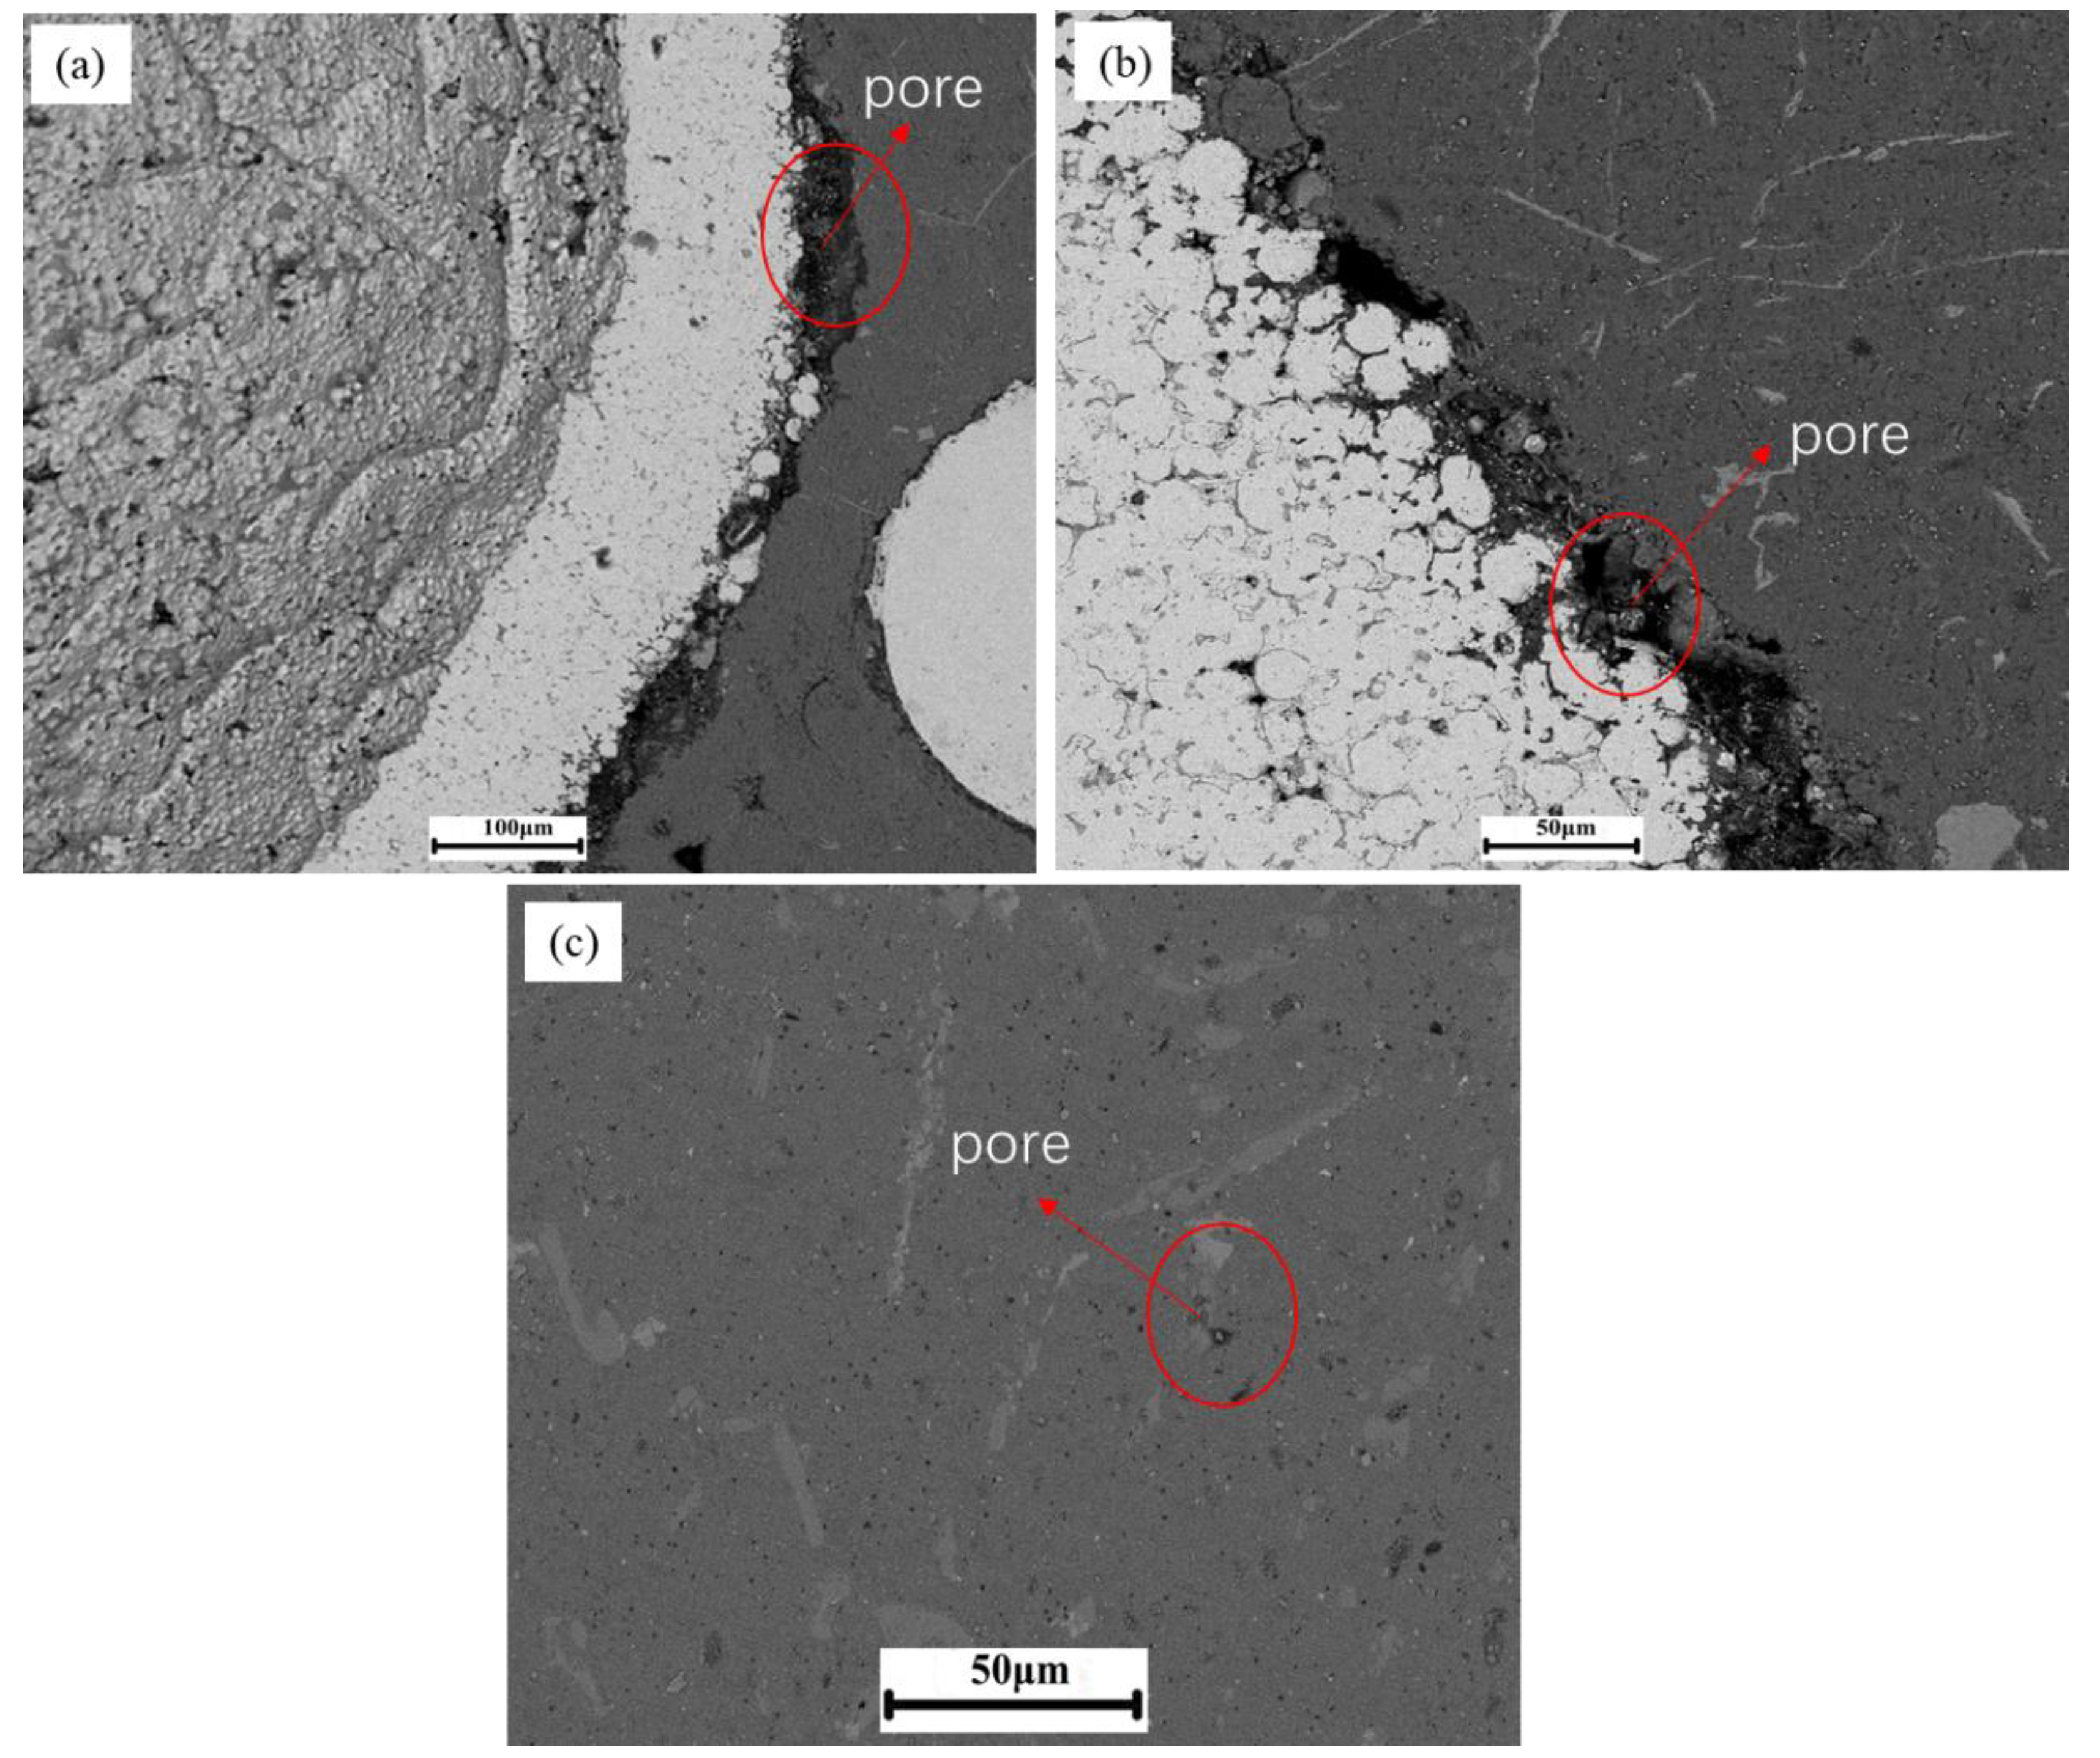
Figure 8.
The sound absorption coefficient of MHSCs.

Figure 9.
The sound transmission loss of the MHSCs.

Figure 10.
The reflection and refraction diagram of plane waves propagating at interface between the air and the porous material.
Figure 10.
The reflection and refraction diagram of plane waves propagating at interface between the air and the porous material.
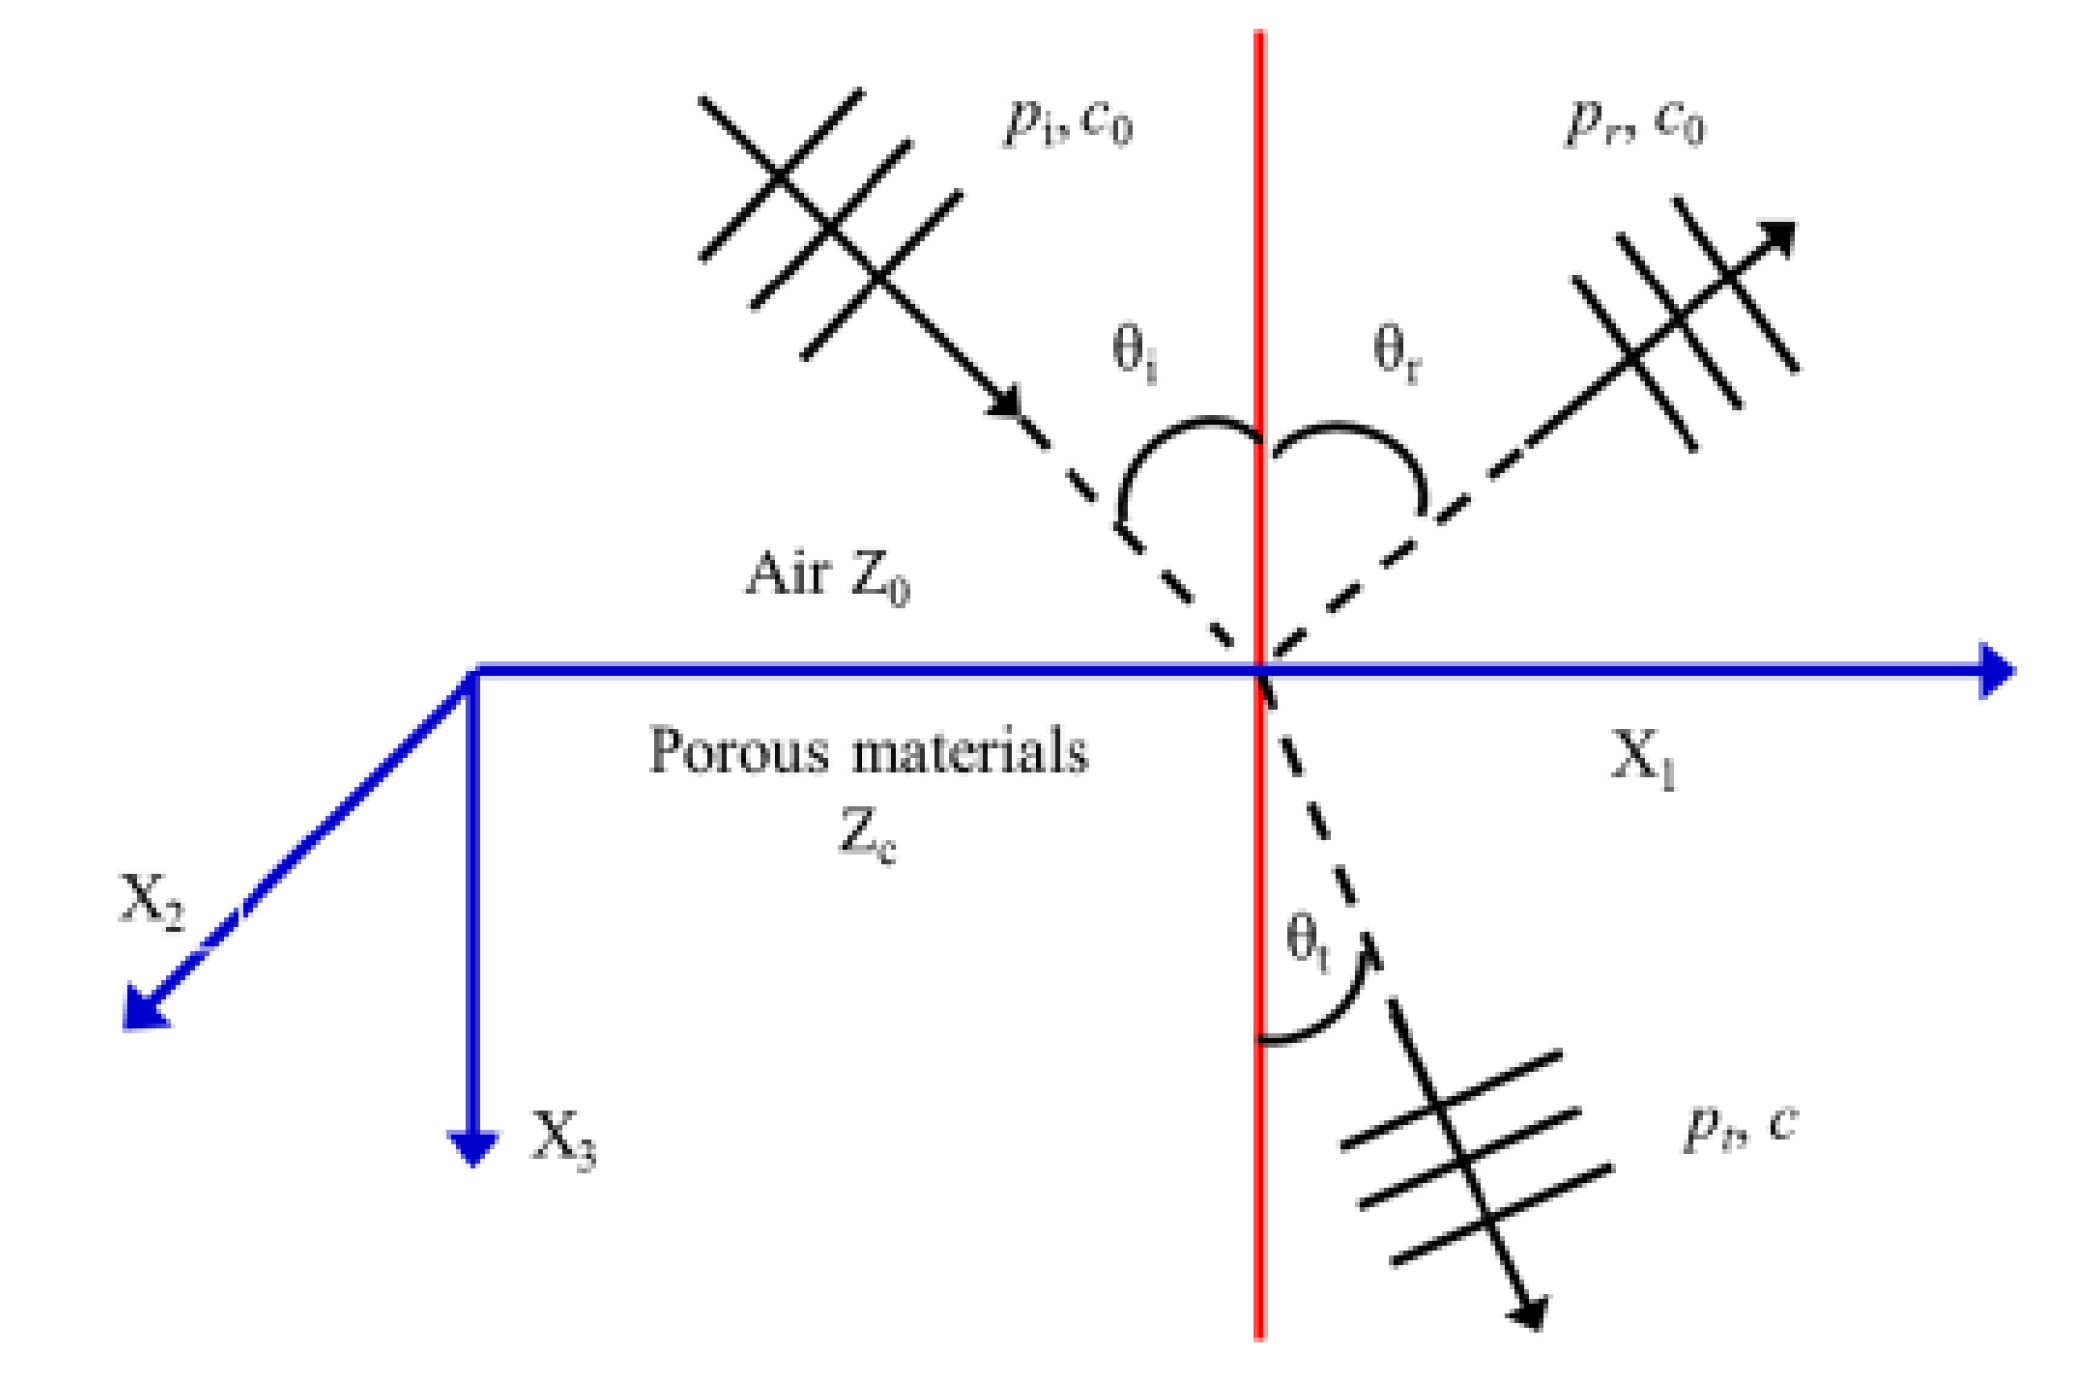
Figure 11.
The schematic diagram of the sound waves propagation under the off-resonance condition: (a) in the MHSC; (b) in the MHS surrounded by the matrix; (c) in the MHSs contacted closely.
Figure 11.
The schematic diagram of the sound waves propagation under the off-resonance condition: (a) in the MHSC; (b) in the MHS surrounded by the matrix; (c) in the MHSs contacted closely.

Figure 12.
The schematic diagram of the sound wave propagation under the resonance condition: (a) in the MHSC; (b) on the MHS.
Figure 12.
The schematic diagram of the sound wave propagation under the resonance condition: (a) in the MHSC; (b) on the MHS.

Figure 13.
The schematic diagram of MHSC-LS.

Table 1.
The chemical composition of the A356 alloy.
| Element | Fe | Si | Cu | Mg | Mn | Zn | Ti | Pb | Ni | Sn | Al |
|---|---|---|---|---|---|---|---|---|---|---|---|
| wt.% | 0.14 | 7.18 | 0.01 | 0.37 | 0.01 | 0.01 | 0.16 | - | - | - | balance |
Table 2.
The physical parameters and chemical composition of the metal hollow spheres (MHSs).
| Sphere Size (mm) | Wall Thickness (μm) | Weight (g) | Wall Porosity (%) | Chemical Composition (%) | ||||||
|---|---|---|---|---|---|---|---|---|---|---|
| C | Mn | Si | Cr | Ni | Mo | Fe | ||||
| 3.28 ± 0.002 | 157 ± 2 | 0.02 ± 0.005 | 47.87 ± 0.003 | 0.01 | 1 | 0.2 | 17 | 12 | 2 | balance |
| 5.76 ± 0.002 | 276 ± 2 | 0.11 ± 0.005 | 47.87 ± 0.003 | |||||||
Table 3.
The physical properties of the MHSCs.
| Sample | Apparent Density (g/cm3) | ||||
|---|---|---|---|---|---|
| MHSC-3.28-1 | 1.74 | 45.30 | 48.50 | - | 6.20 |
| MHSC-3.28-2 | 1.77 | 46.42 | 48.50 | - | 5.08 |
| MHSC-3.28-3 | 1.75 | 45.67 | 48.50 | - | 5.83 |
| MHSC-5.76-1 | 1.74 | 45.35 | 48.50 | - | 6.15 |
| MHSC-5.76-2 | 1.75 | 45.71 | 48.50 | - | 5.79 |
| MHSC-5.76-3 | 1.76 | 45.94 | 48.50 | - | 5.56 |
| MHSC-LS -1 | 1.95 | 44.66 | 48.50 | 2.97 | 3.87 |
| MHSC-LS -2 | 1.93 | 43.66 | 48.50 | 2.97 | 4.87 |
| MHSC-LS -3 | 1.97 | 45.15 | 48.50 | 2.97 | 3.38 |
© 2020 by the authors. Licensee MDPI, Basel, Switzerland. This article is an open access article distributed under the terms and conditions of the Creative Commons Attribution (CC BY) license (http://creativecommons.org/licenses/by/4.0/).
Share and Cite
MDPI and ACS Style
Wang, C.; Jiang, F.; Shao, S.; Yu, T.; Guo, C. Acoustic Properties of 316L Stainless Steel Hollow Sphere Composites Fabricated by Pressure Casting. Metals 2020, 10, 1047. https://doi.org/10.3390/met10081047
AMA Style
Wang C, Jiang F, Shao S, Yu T, Guo C. Acoustic Properties of 316L Stainless Steel Hollow Sphere Composites Fabricated by Pressure Casting. Metals. 2020; 10(8):1047. https://doi.org/10.3390/met10081047
Chicago/Turabian StyleWang, Chunhe, Fengchun Jiang, Shuaiqi Shao, Tianmiao Yu, and Chunhuan Guo. 2020. "Acoustic Properties of 316L Stainless Steel Hollow Sphere Composites Fabricated by Pressure Casting" Metals 10, no. 8: 1047. https://doi.org/10.3390/met10081047
Note that from the first issue of 2016, this journal uses article numbers instead of page numbers. See further details here.