Article

Impact of Al2O3 Particle Size on the Open Porosity of Ni/Al2O3 Composites Prepared by the Thermal Oxidation at Moderate Temperatures

1
Institute of Materials and Machine Mechanics, Slovak Academy of Sciences, Dúbravská Cesta 9, 845 13 Bratislava, Slovakia
2
Institute of Molecular Physiology and Genetics, Centre of Biosciences, Slovak Academy of Sciences, Dúbravská cesta 9, 840 05 Bratislava, Slovakia
3
Institute of Physics, Slovak Academy of Sciences, Dúbravská cesta 9, 845 11 Bratislava, Slovakia
*
Author to whom correspondence should be addressed.
Metals 2021, 11(10), 1582; https://doi.org/10.3390/met11101582
Submission received: 20 August 2021 / Revised: 21 September 2021 / Accepted: 1 October 2021 / Published: 4 October 2021

Abstract

:
The performance of attractive Ni-based composites can be affected by changing their microstructures, e.g., introducing pores. Here, we report a novel, relatively low-cost process to fabricate Ni/Al2O3 composites with open porosity modified by the size of Al2O3 particles. The mixture of powders was subjected to thermal oxidation twice in air after a maximal temperature of 800 °C was reached in a stepwise manner and maintained for 120 min. The oxidation kinetics were determined thermogravimetrically. The open porosity was evaluated by an Archimedes’ principle-based method. Localization and quantification of NiO, newly formed on the Ni particle surface and acting as a mechanical bonding agent, were explored by scanning electron microscopy with energy dispersive X-ray spectroscopy and X-ray diffractometry. Larger ceramic particles prevented merging of NiO layers on adjacent Ni particles more efficiently; therefore, the open porosity increased from 21% to 24.2% when the Al2O3 particle diameter was increased from 5–20 µm to 32–45 µm. Because both Ni/Al2O3 composites exhibited similar flexural strength, the composite with larger Al2O3 particles and the higher open porosity could be a better candidate for infiltration by molten metal, or it can be directly used in a variety of filtration applications.

1. Introduction

Ni-based composites are indispensable material in various industries given their attractive mechanical and physical properties are required for applications in high-temperature and corrosive environments [1]. Among the various composites, Ni matrix composites reinforced with Al2O3 particles have drawn a significant interest because Ni/Al2O3 composites demonstrate various combinations of remarkable thermal, chemical, and mechanical properties of Al2O3 on the one hand and superior tensile strength and toughness of Ni on the other [2,3,4]. These properties make Ni/Al2O3 composites exceptionally useful; Ni/Al2O3 composites are used in advanced protective coatings against corrosion and abrasion, thus becoming an attractive alternative to chromium [5,6,7]. Recently, nano-composite coatings have gained remarkable interest due to a significant improvement in protection performance [8,9,10]. Nickel-based coatings with Al2O3 particles smaller than 100 nm in diameter have appeared and been used to increase the abrasion resistance of metal surfaces, especially in microdevices [11,12,13,14].
Ni/Al2O3 composites are usually prepared by various traditional methods such as sol-gel processing, pressureless sintering, or hot pressing [15,16,17,18,19,20,21]. These approaches are, however, not optimal for the fabrication of open-porous products because of matrix deformation resulting in a blockage of a substantial portion of pores. The open porosity manifested by large, interconnected pores is fundamental for flow-through applications such as filtration, electrochemistry, and acoustic absorption when the required functional and structural properties are designed by the composition and the specific shape and size distribution of pores (reviewed in [22]). Open porosity is also needed to fabricate metal–matrix composites utilizing pressure-assisted or pressureless infiltration of molten metals when all pores should be filled to obtain a homogenous and dense product [23]. In addition to an appropriate open-porous structure, these preforms should display sufficient strength and resistance to a thermal shock. Considering all of these requirements, open-porous Ni/Al2O3 composites appear to be suitable candidates for the aforementioned applications. In line with this, Al2O3 particles make these open-porous composites a promising catalyst for the capture of carbon monoxide (CO) [24] and carbon dioxide (CO2) [25,26]. Since these greenhouse gases contribute to climate change, we require increased efforts to eliminate their accumulation in the atmosphere; open-porous Ni/Al2O3 composites could significantly contribute to these efforts.
In general, open-porous metallic materials are conventionally fabricated using two approaches. One is a replication process when an interconnected porous network is obtained by removing (shaking or dissolution) a porous preform filled with the molten metal once solid [27]. The other is sintering of loose metal powder or fibers when pore-forming agents or space fillers are used [4,28,29]. Although significant progress has been made in controlling pore characteristics over the years (reviewed in [30]), fabrication of open pores still remains challenging. To fully realize the application potential of open-porous composites, novel fabrication technologies have to be developed and optimized.
In this study, open-porous Ni/Al2O3 composites were prepared by a relatively simple and low-cost technology of the thermal oxidation in air when the temperature was increased stepwise up to 800 °C and maintained for 120 min. The size effect of Al2O3 particles on the open porosity, internal microstructure, and flexural strength was evaluated.

2. Materials and Methods

2.1. Powder Samples

High-purity Ni powder (99.99%, Metco 56C-NS, OC Oerlikon Corporation, Pfäffikon, Switzerland) with a particle size of <70 µm was used throughout the investigation. Al2O3 powder (95.50%, Metco Amdry 6060, OC Oerlikon Corporation, Pfäffikon, Switzerland) with a particle size in the range of 5 µm to 45 µm was added into Ni powder samples (12.87 wt.% Al2O3 corresponding to 25 vol.% Al2O3 when solid density was used for conversion). The maximum volume fraction was determined experimentally, because more than 25 vol.% Al2O3 resulted in a substantially weak sample cohesion after thermal oxidation. Al2O3 powder was sieved to gain two fractions with particle sizes of 5–20 µm and 32–45 µm, respectively. Analysis of the particle size distribution (the D50 parameter) was obtained for Ni powder and both Al2O3 fractions by laser diffraction in water using Analysette 22 NanoTec (Fritsch, Germany). The value of mean particle size (D50) was 69.91 µm for the Ni powder, 27.73 µm for the 5–20 µm Al2O3 fraction, and 36.80 µm for the 32–45 µm Al2O3 fraction. Although the morphology of Al2O3 powder exhibited a blocky shape, as stated by Oerlikon Metco company, laser diffraction to evaluate the particle size was used because it has been shown that even for blocky particles the D50 parameter is sufficiently accurate [31]. The particle morphology could also explain a slightly higher value of D50 for the 5–20 µm Al2O3 fraction because narrow blocky-shaped particles with a length of more than 20 µm also passed through a sieve with the mesh size of 20 µm. The Ni/Al2O3 powder mixtures were vigorously blended in a mechanical blender, Turbula type T2F (WAB, Muttenz, Switzerland), for 30 min.

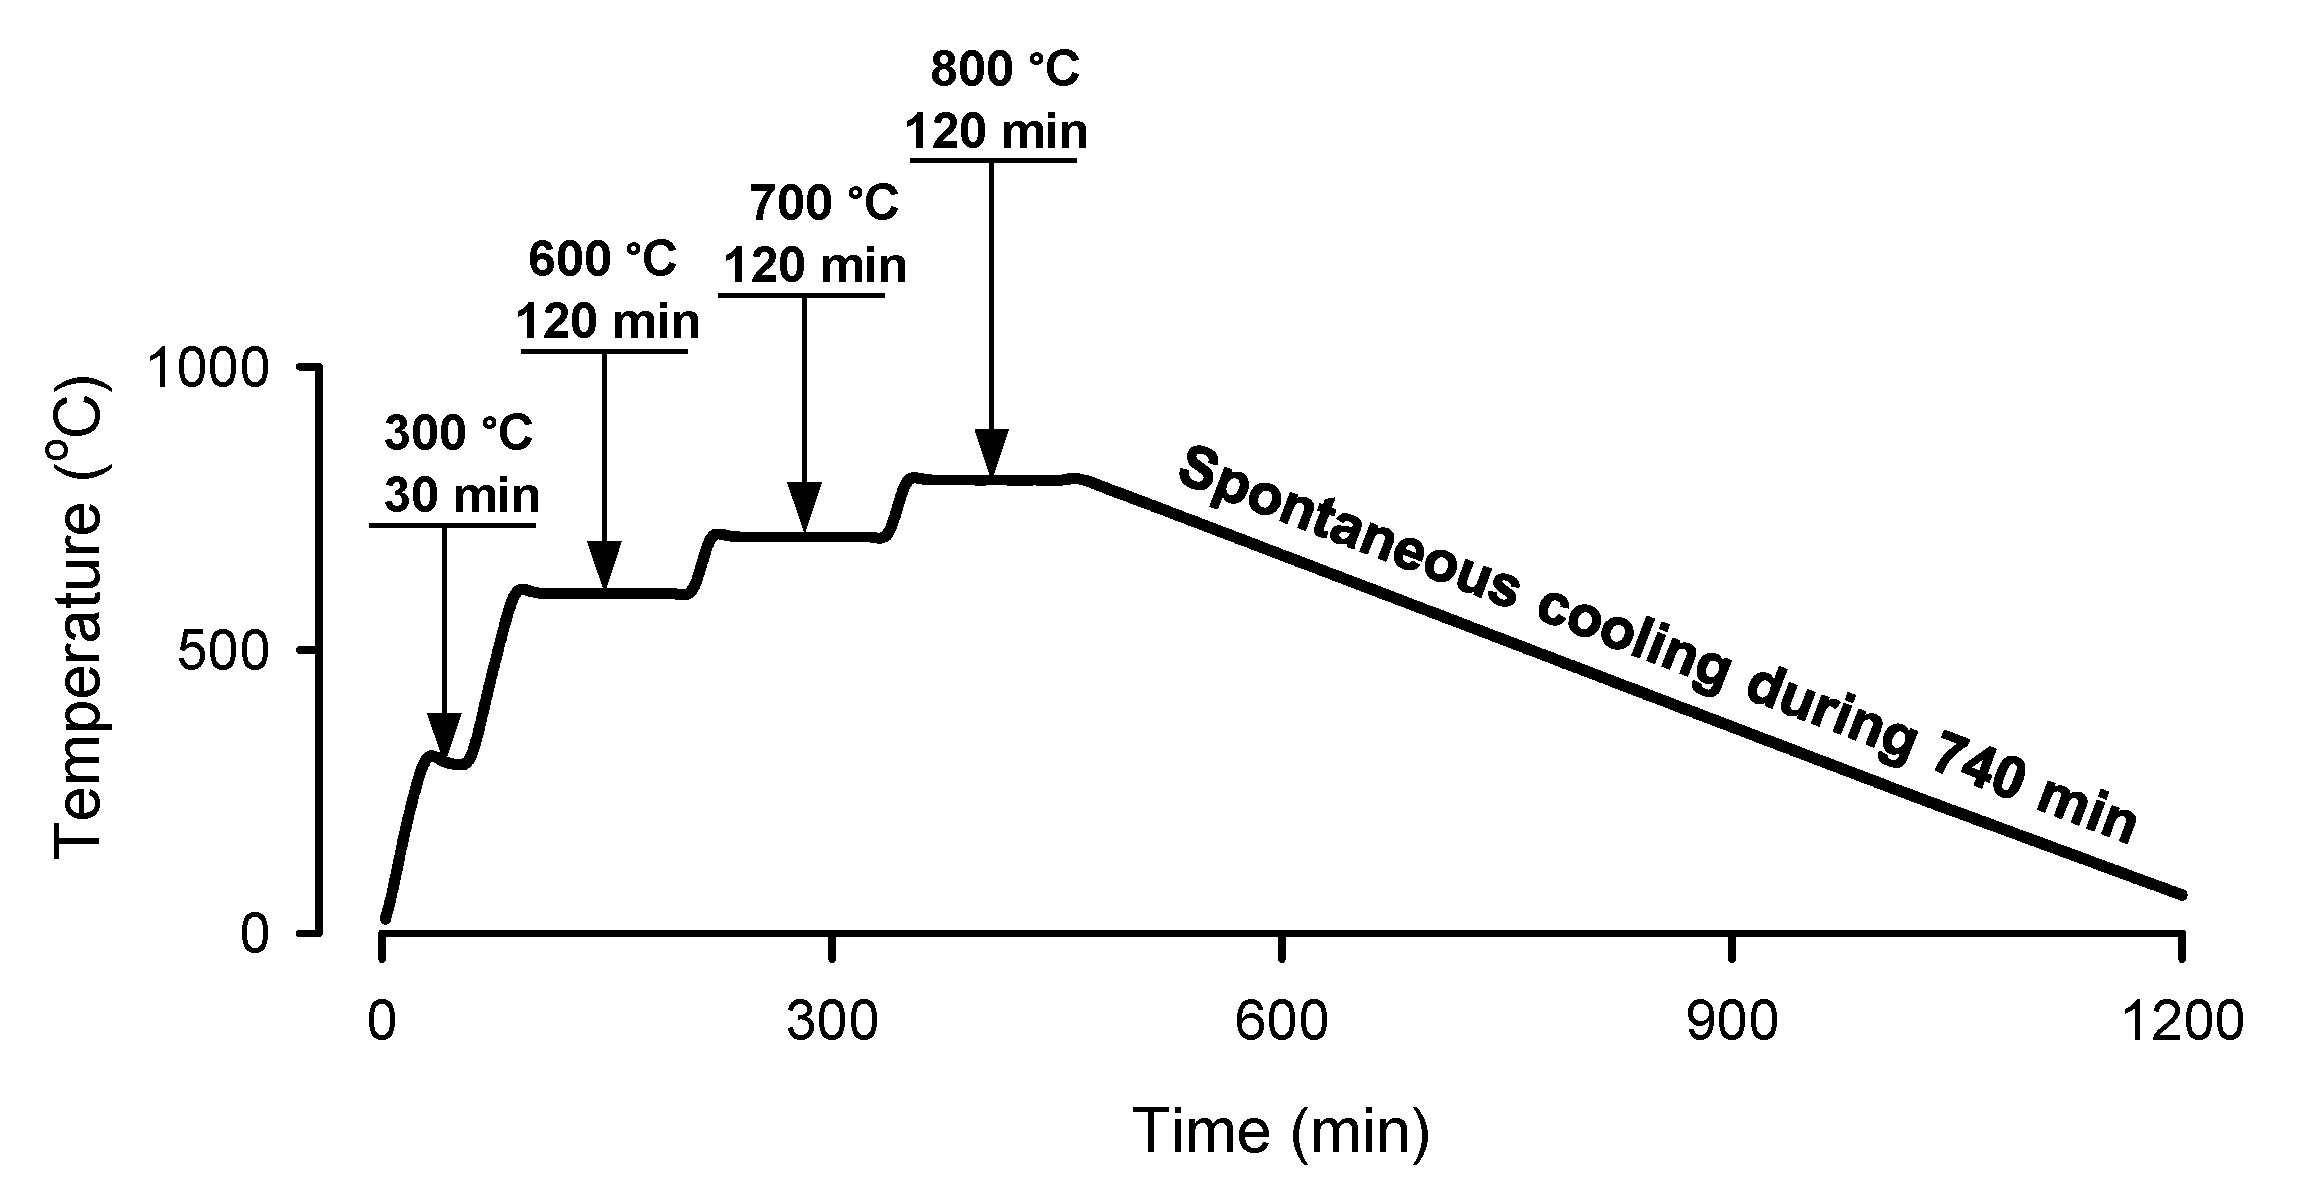
2.2. The Thermal Oxidation of Powder Mixtures

For the first oxidation cycle, 60 g of Ni powder or 60 g of Ni/Al2O3 powder mixtures was loosely added to a conical alumina crucible (height: 50 mm, top diameter: 24 mm, bottom diameter: 20 mm) and heated in a tubular oven Type 018LP (Elektrické pece Svoboda, Světice u Říčan, Czech Republic) in static air. The conical shape of the crucible was critical for smooth removal of the bulky oxidized sample using only gravitational force. After the maximal temperature of 800 °C was reached in a stepwise manner (Figure 1), it was held for 120 min to facilitate the oxidation process. The cooling was spontaneous with a rate of approximately 1 °C/min. Subsequently, the sample was removed from the crucible to allow oxygen diffusion across the whole surface area of the pre-oxidized sample during the second oxidation cycle with the same thermal regime, shown in Figure 1. The weight of the powder samples and the weight gain related to a newly formed NiO phase during the first and second oxidation cycles were determined by the semi micro balance R200D (Sartorius, Goettingen, Germany) with an accuracy of 0.1 mg.

2.3. Thermogravimetric (TG) Measurement

First, 1.2 g of Ni powder or 1.2 g of Ni/Al2O3 powder mixtures, loosely filled into a smaller cylindrical alumina crucible (height: 14 mm, diameter: 6 mm) of a TG apparatus (Linseis Thermal Analyzer L75/L81/2000, Selb, Germany), was subjected into the first oxidation cycle in air using the same thermal regime (Figure 1) as was utilized for the 60 g samples. Keeping the sample in the TG crucible, the second oxidation cycle was run. The sample weight gain (∆m) was measured as the difference between post-treatment weight (m) and initial weight (m0). In addition to the maximal weight gain (∆mmax) reached after each thermal treatment, the oxidation behavior of the samples was monitored in detail. Because the weight gain of all samples depended only on the oxidation of Ni particles (not Al2O3 particles), the weight gain of Ni/Al2O3 samples was related to the initial Ni content (m0,Ni).

2.4. Measurement of the Open Porosity

The open porosity of the 60 g Ni sample and 60 g Ni/Al2O3 sample after each oxidation cycle was assessed by the Archimedes’ principle-based method. Although it is a simple method, it can generate reliable quantitative information on the samples’ open porosity over a wide range of pore sizes. The sample was situated in a container and mounted above the water level. When a vacuum was achieved in the closed container, the sample was immersed into distilled water. The open porosity was deduced from the difference between sample weights before and after water saturated the pores. For this purpose, the semi-micro balance R200D (Sartorius, Goettingen, Germany) with an accuracy of 0.1 mg was utilized.

2.5. Analyses of the Microstructure and Chemical Composition

The microstructures of the 60 g Ni sample and 60 g Ni/Al2O3 sample were determined by scanning electron microscopy (SEM) utilizing JEOL JSM 6610 (Jeol, Tokyo Japan). Specifically, the top, middle, and bottom of the bulky samples were analyzed to evaluate volume heterogeneity. The samples were found to be brittle after the first oxidation cycle; the particles fell out during grinding and polishing. Therefore, detailed microstructure analysis was performed only after the second oxidation cycle (Figure 2). For illustration purpose, SEM images after the first oxidation cycle are shown because the top region of samples was sturdy enough for metallographic preparation. A newly formed NiO phase was identified and localized on the surface of the Ni particles by combining SEM with energy dispersive X-ray spectroscopy (EDS, OI X-max 50 mm, Oxford Instruments, Tubney Woods, Abingdon, UK). NiO thickness was determined from SEM pictures when only Ni particles with a diameter around D50 were selected for measurement. On each Ni particle, one measurement of NiO thickness was performed. In total, more than 30 Ni particles were included in one dataset, characterizing the top, middle, and bottom of the 60 g sample.
The qualitative and semiquantitative phase compositions of samples in three different regions (top, middle, bottom) were studied by SEM-EDS and more specifically by X-ray diffraction (XRD) using Bruker AXS D8 (Bruker AXS GMBH, Karlsruhe, Germany) Advance diffractometer with Cu Kα radiation in parallel beam configuration with a Goebel mirror in the incident beam and a 0.23 deg Soller slit and LiF monochromator in the diffracted beam path. The measurements were performed under a constant incidence angle of 10 degrees with a collection time of 8 s per step in steps of 0.05 deg. Semiquantitative phase analysis was carried out using a TOPAS 3.0 (Bruker AXS, Bruker AXS GMBH, Karlsruhe, Germany) in the Rietveld-like mode; phase content determination accuracy was 1 mass %. To avoid misinterpretation when comparing Ni/Al2O3 samples to the Ni sample, the content of NiO in Ni/Al2O3 samples was expressed as a portion (wt.%) from the post-treatment Ni/NiO content rather than from the Ni/NiO/Al2O3 content. The results are reported as the average ± SEM. Statistical comparisons of differences were made by the one- or two-way ANOVA with Tukey’s post hoc test. Differences were regarded to be statistically significant at p < 0.05.

2.6. Flexural Strength Testing

The strength of samples, which were oxidized twice, was assessed by a three-point bending test [32,33]. Flexural strength testing was carried out on Zwick/Roell Z100 materials testing machine (ZwickRoell, Ulm, Germany) at room temperature with a loading rate of 0.2 mm/min. The flexural strength (σfls) was calculated from the following equation:
σ f l s = F L 4 h 2 12 ( b 1 2 + 4 b 1 b 2 + b 2 2 2 b 1 + b 2 ) ,
where F is the critical load for the fracture, L is the span length of 50 mm, b1 is the base width, b2 is the top width, and h is the height of the specimen with a trapezoidal prism shape (Figure 3). Here, b1 and b2 were 10 mm and 5.5 mm, respectively, and h was 6 mm. The length of the tested specimen was 85 mm.

3. Results and Discussion

3.1. TG Measurement

In 2017, we reported that Al2O3 particles increased the open porosity of the Ni/Al2O3 composite (Ni + 12.87 wt.% Al2O3—corresponding to 25 vol.% Al2O3) fabricated by two cycles of thermal oxidation in air and at temperatures ≤ 800 °C [34]. We found that ceramic particles impeded the formation of a robust NiO network as a result of Ni oxidation. In this case, only Al2O3 particles of 20–32 µm diameter were tested and the powder mixture was placed in a smaller crucible with a 16 mm diameter. Here, as a proof of concept, the role of the Al2O3 particle size in porosity formation was studied in more details. Specifically, two Al2O3 fractions with particle diameters of 5–20 µm and 32–45 µm, respectively, were tested. First, TG measurement was used to assess the sample behavior after the first and the second oxidation cycles (Figure 4). From the qualitative point of view, all three samples exhibited a similar weight-gain profile during the first oxidation cycle (Figure 4a). Using the thermal regime displayed in Figure 1, the weight of all three tested samples increased almost linearly with time when the temperature was elevated stepwise up to 800 °C. Of note, this increase was not terminated immediately when heating was stopped and spontaneous cooling began. It continued during the next 350 min due to heat consumption accumulated during the oxidative exothermic reaction. For the Ni sample, the weight gain after the first oxidation cycle (11.57%) was slightly greater than that for both Ni/Al2O3 samples (10.18% and 10.47%, respectively) because of the steeper increase during the heating and cooling phases (Figure 4a). Almost the same behavior with the similar final weight gain was exhibited by both Ni/Al2O3 samples (Figure 4b). The second oxidation cycle running under the same conditions (the sample kept in a crucible) had a much smaller effect on all three tested samples (Figure 4a). However, there was a larger difference between samples containing Al2O3 particles of various sizes in this case. The larger the particle size, the larger was the weight gain achieved (3.7% for smaller particles vs. 4.56% for larger particles). Notably, the Ni sample exhibited the lowest weight gain. The presence of Al2O3 particles substantially increased the steepness of the TG curve at 800 °C, pointing to acceleration in Ni oxidation. Again, an ongoing increase in the weight gain during the cooling phase for all three samples lasting for 350 min was observed (Figure 4a). When the total weight gain after two subsequent oxidation cycles was calculated, only negligible differences between samples were revealed. Moreover, it is evident that the Al2O3 particle size did not play any significant role in the total weight gain, albeit a slightly stronger impact of the larger particles could be seen (Figure 4b).

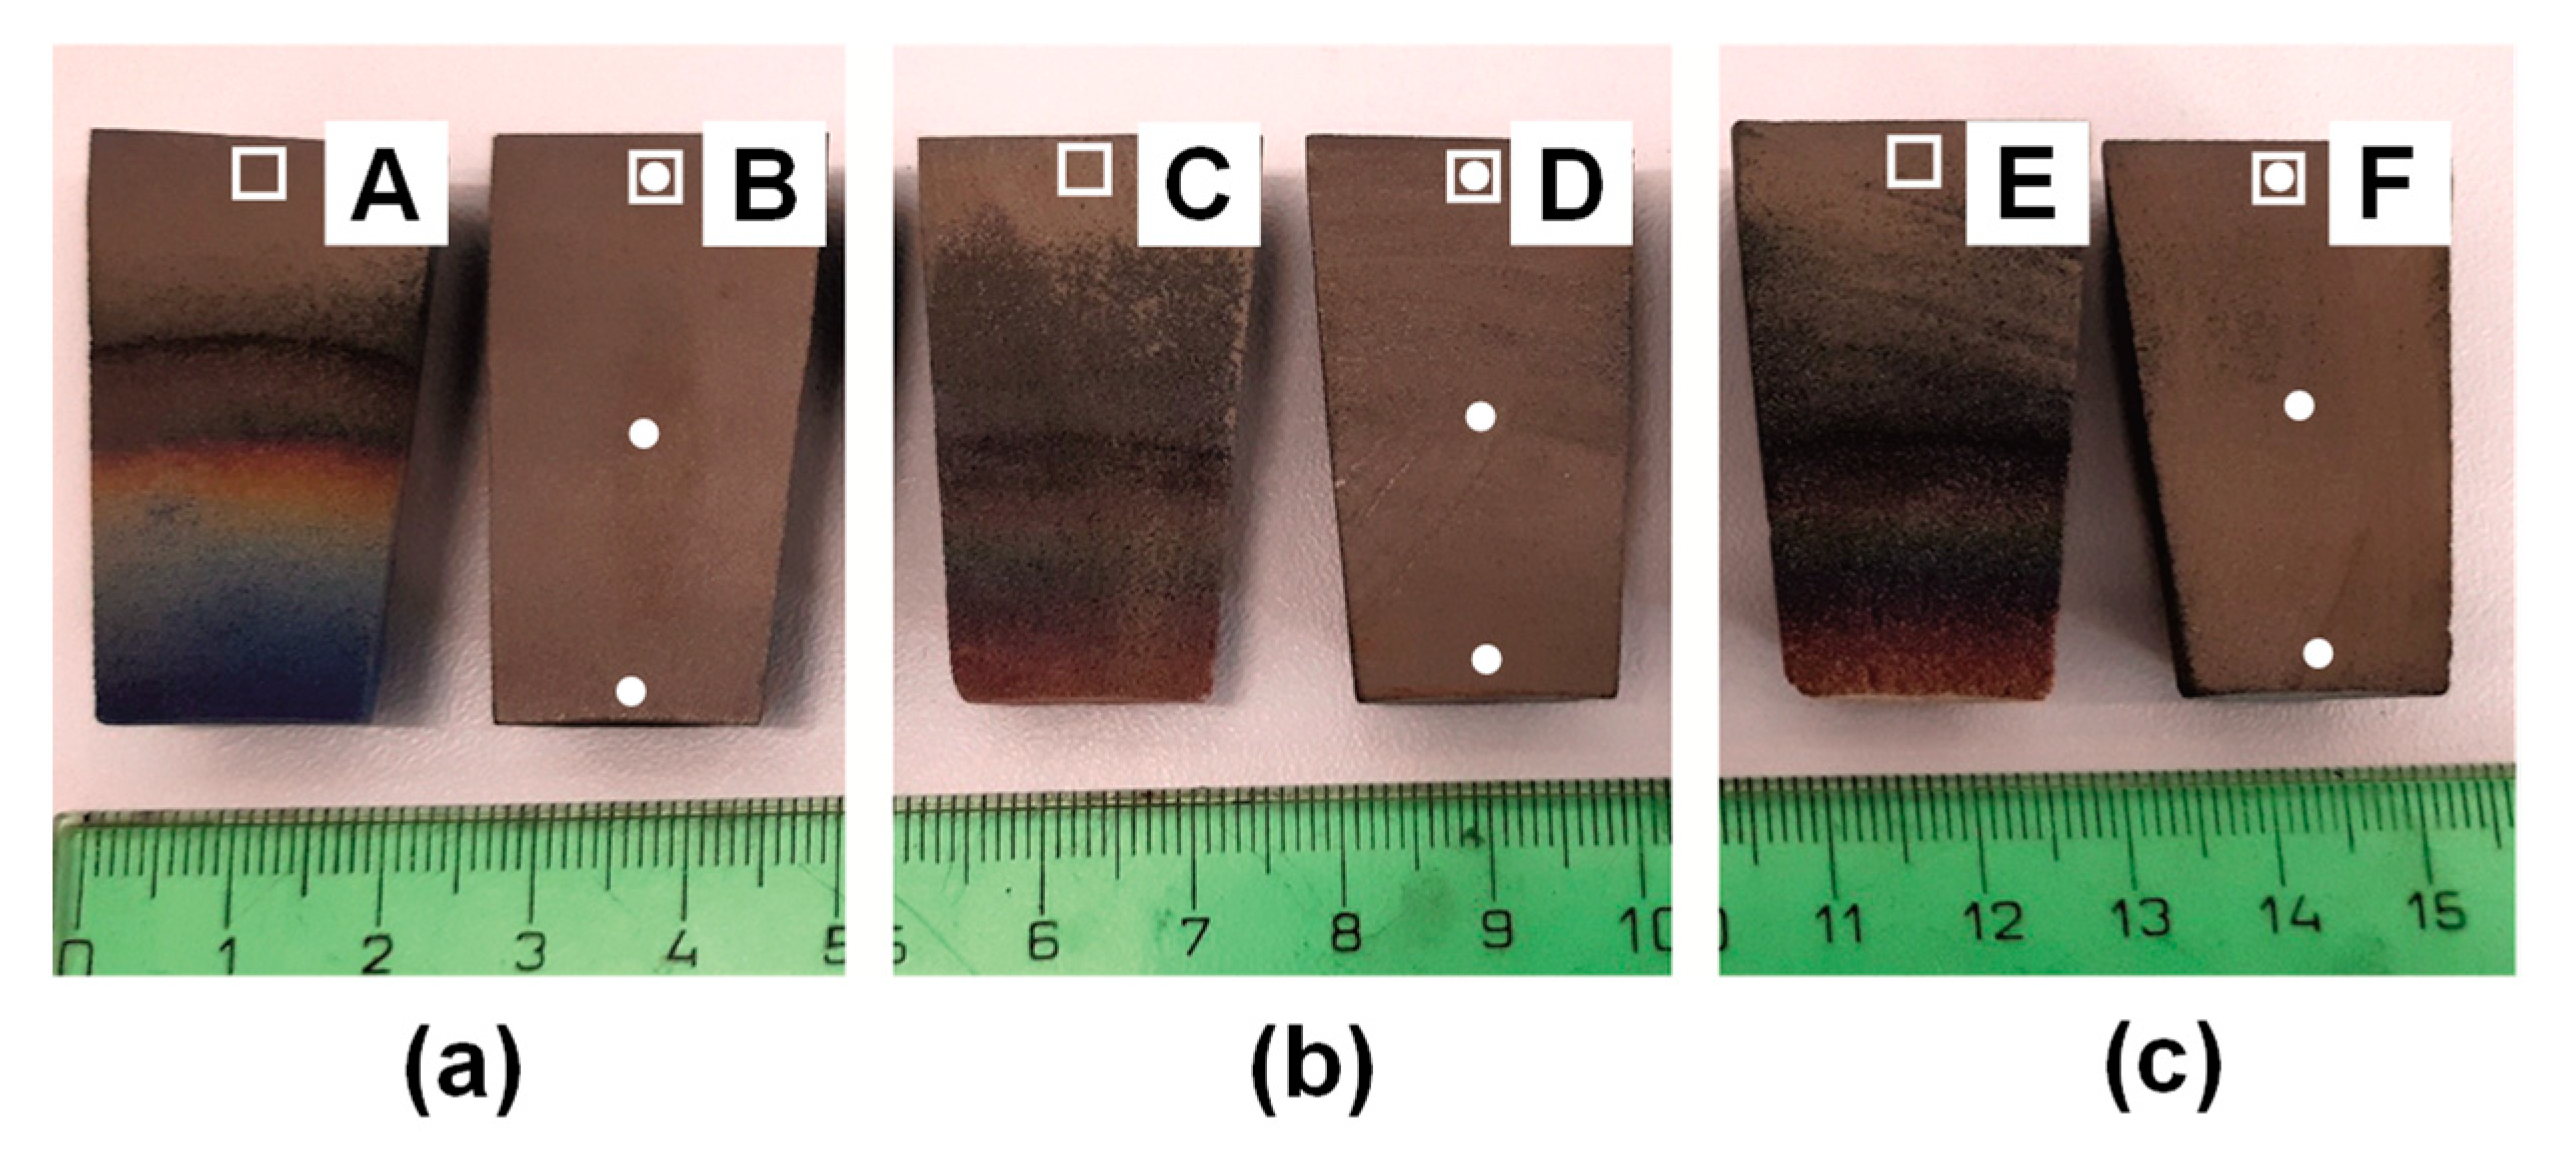
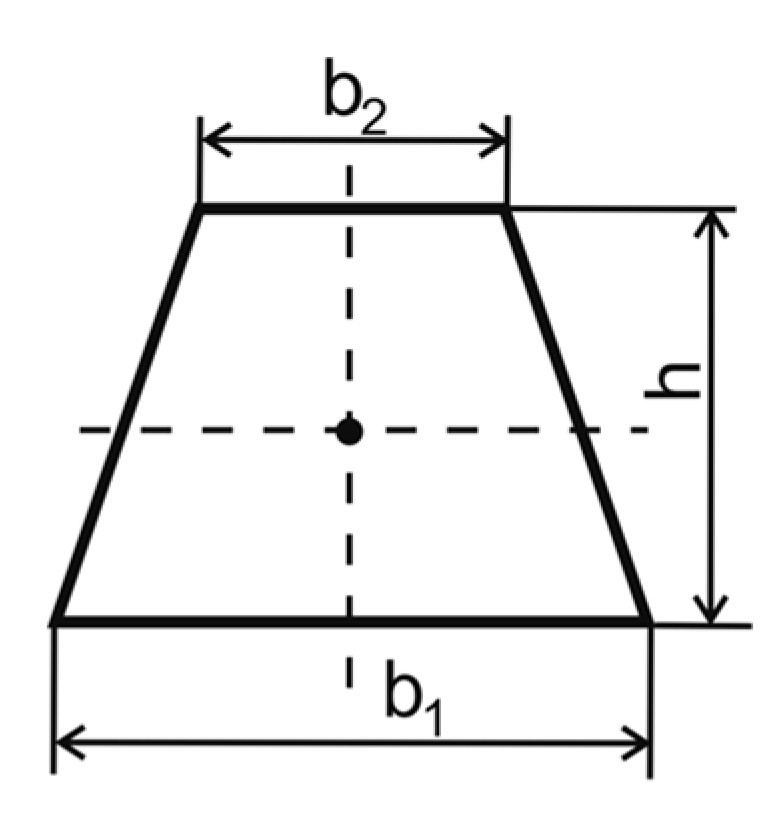
3.2. Impact of the Sample Weight and Dimensions

It has been evidenced in our previous work [34], and in agreement with others [35,36], that the weight gain was caused solely by the formation of NiO layers on the surface of Ni particles as a result of thermal oxidation. Moreover, it has been reported that the NiO growth gave rise to the sample open porosity [34]. In an attempt to understand the role of Al2O3 particle size in pore formation and distribution, the weight gain was associated with the sample porosity determined by the Archimedes’ principal-based method. For this purpose, we used 60 g samples instead of the 1.2 g samples usually used for TG analysis. Samples were heated in a laboratory oven utilizing the same thermal regime (Figure 1) as in the TG apparatus. The final weight gain was assessed by a precise laboratory balance. First, we examined whether such an increase in the sample weight and inevitably dimension could influence the demonstrated weight gain of the 1.2 g samples. Figure 5 summarizes yielded results. Interestingly, after the first oxidation cycle, the weight gain was considerably smaller for the 60 g samples regardless of the Al2O3 particles present (Figure 5). This behavior could be explained by a limited oxygen diffusion towards the bottom of the 60 g samples with a bigger volume. However, the 60 g samples underwent much larger changes after the second oxidation cycle (Figure 5). Obviously, this behavior was a reasonable consequence of releasing the sample from a crucible before the second oxidation. Despite the aforementioned differences, the total weight gain after two oxidation cycles was comparable between the 60 g and 1.2 g samples (Figure 5), pointing to a strong compensatory effect of oxidation, which ran out of a crucible in the case of the bulky sample.

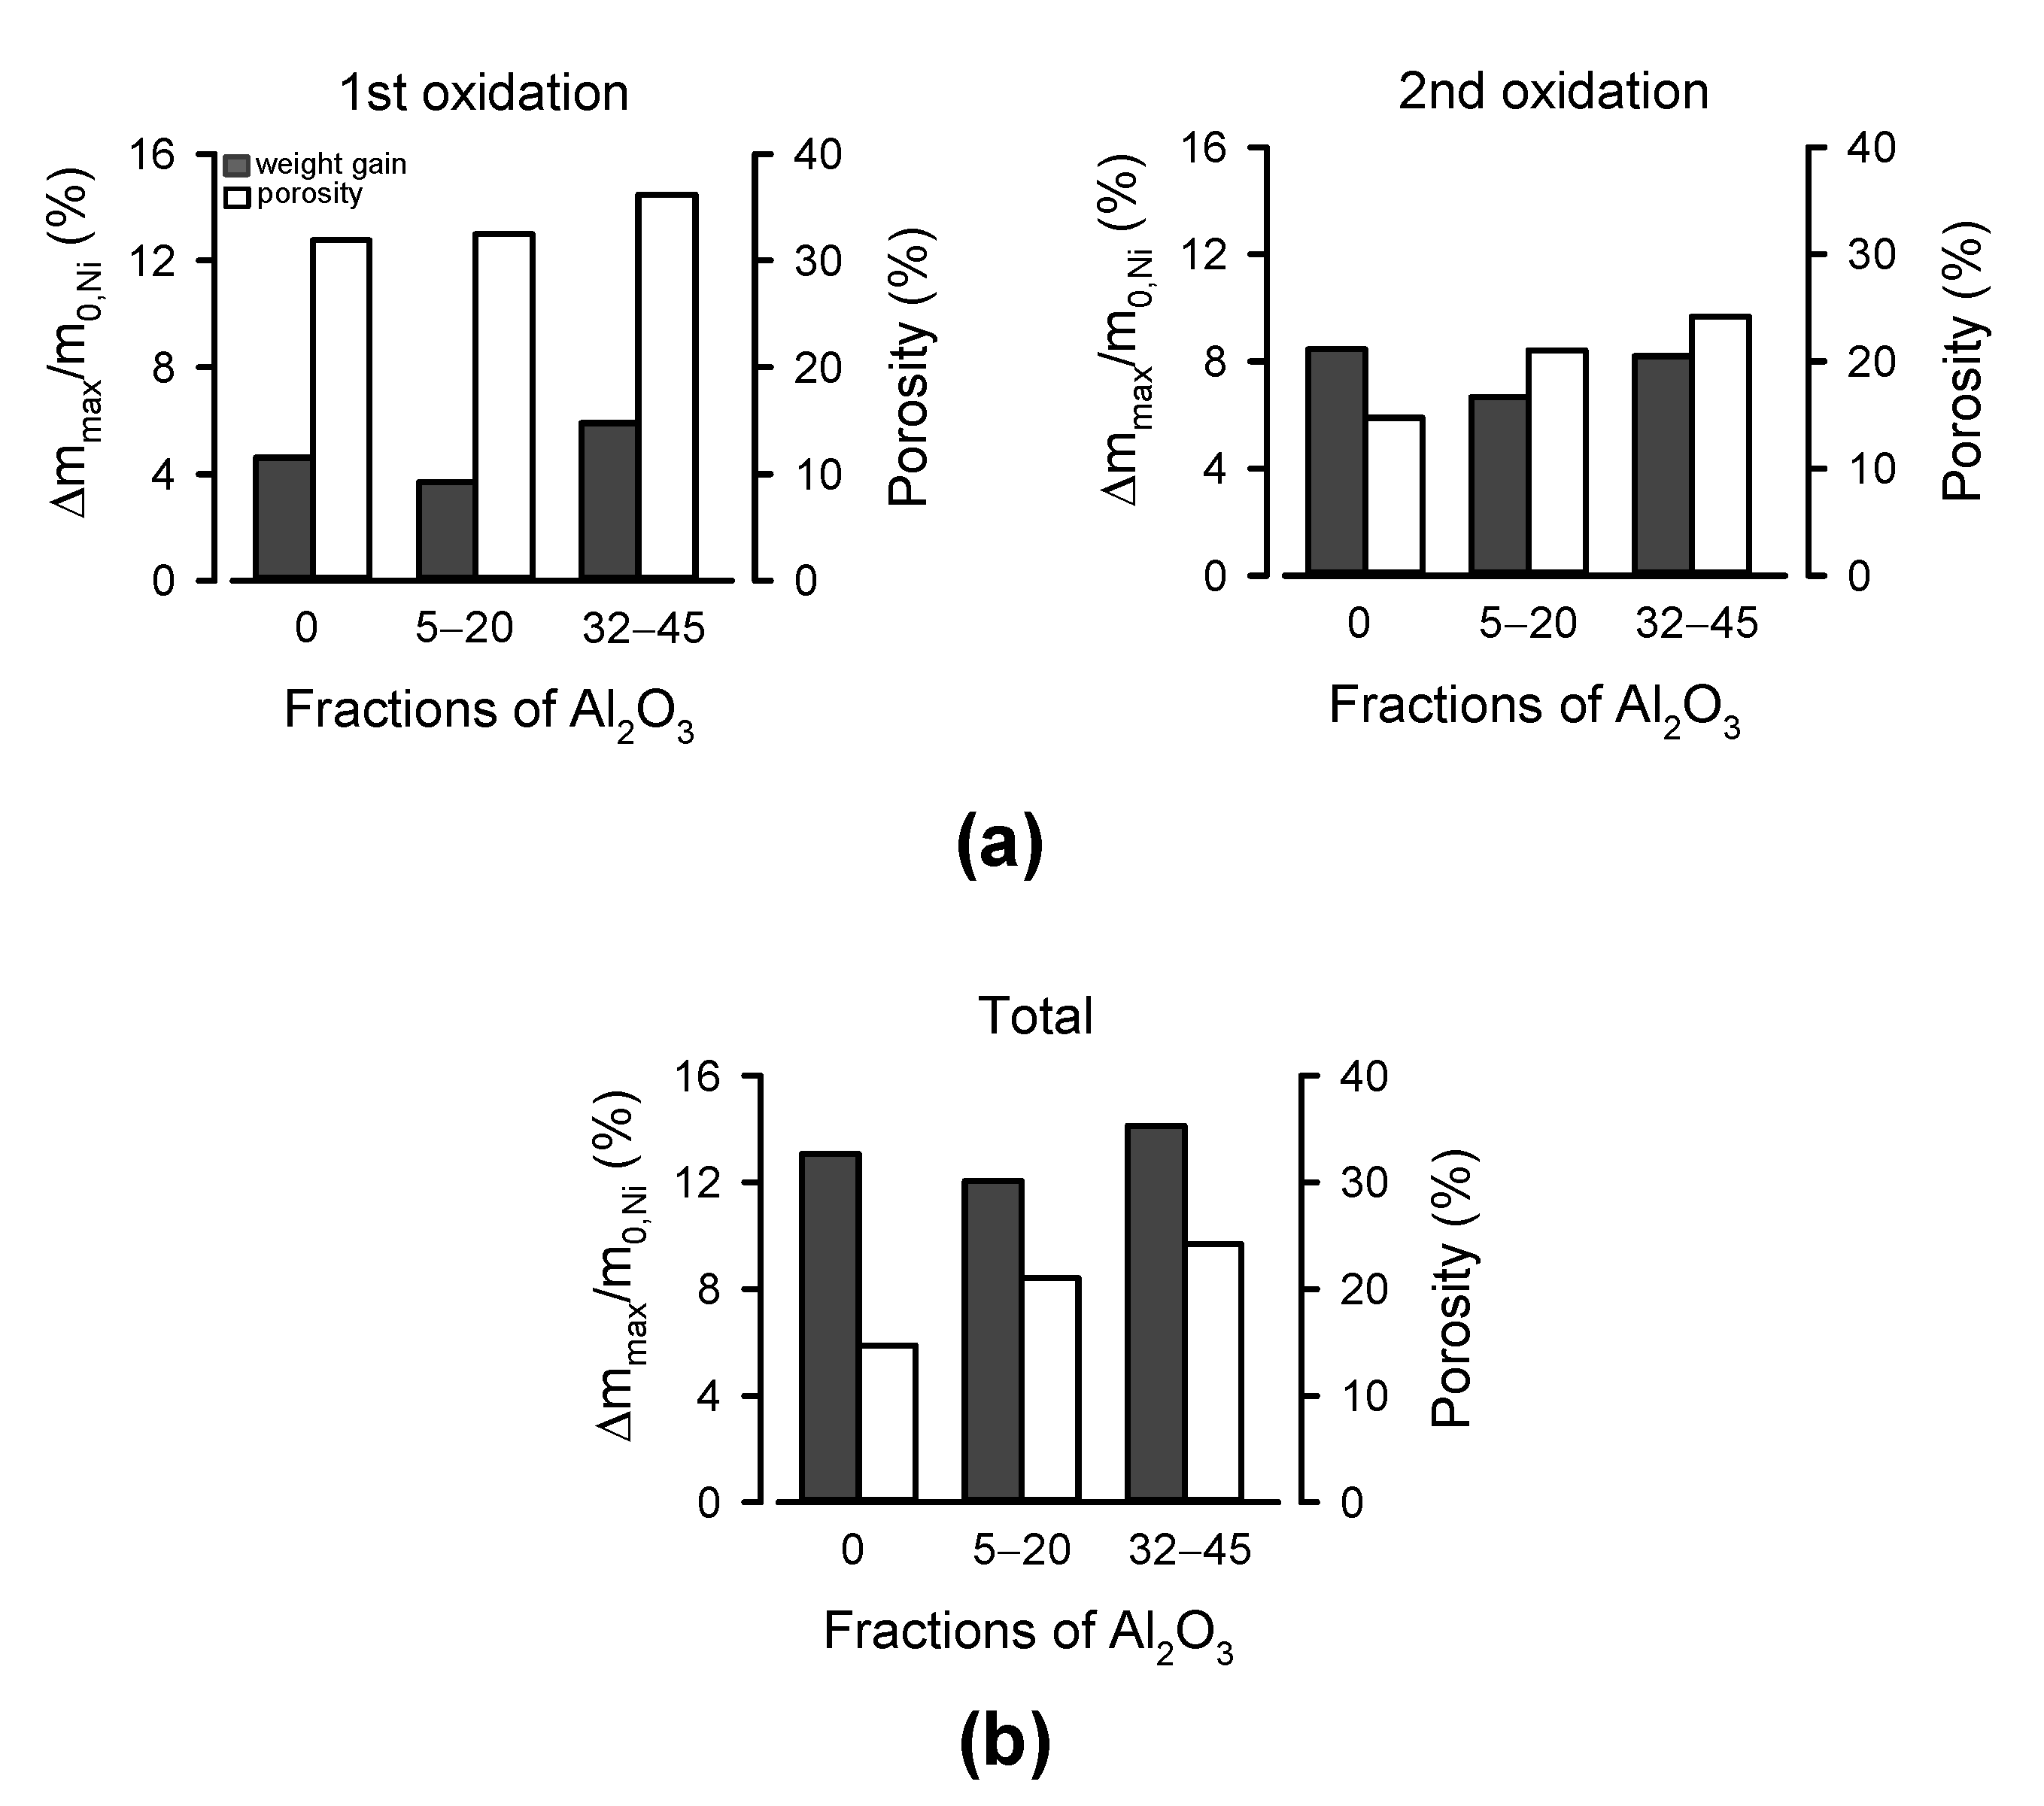
3.3. Correlation between Weight Gain and Open Porosity

It was of our primary interest to validate our hypothesis about the substantial role of Al2O3 particle size in distributing open pores in Ni/Al2O3 composites. As displayed in Figure 6b, the sample with larger Al2O3 particles (32–45 µm) exhibited the highest open porosity after the first and second oxidation cycles (36.2% and 24.2%, respectively). This behavior was accompanied with either a similar or slightly larger increase in the sample weight gain when compared to that of the Ni sample with the lowest open porosity (14.7% after the second oxidation). Comparing oxidation treatments, the open porosity was substantially decreased when all three samples were repeatedly oxidized (Figure 6a). Our results are consistent with the work of Zhao et al. [33] who studied Al2O3 as a porosity agent in Cu-Sn-Ti/Al2O3 composites.
We assumed that some sort of internal NiO network was built by connecting NiO layers formed on the Ni surface. With growing a more robust NiO, a decrease in the level of open porosity could be expected, albeit the role of a porosity agent, in our case Al2O3 particles, has to be also counted. To verify this conclusion at the structural level, the SEM analysis was conducted after each oxidation cycle. Figure 7 shows representative SEM images from the top region of samples. It is evident that much thicker NiO layers were formed in the Ni sample, which became highly interconnected, particularly after the second oxidation (Figure 7, top panels). The presence of Al2O3 particles substantially inhibited NiO networking (Figure 7, middle and bottom panels). The kinetics of the NiO growth has been extensively studied in a wide temperature range [37,38,39,40] because Ni is of a prime interest, displaying one of the highest oxidation rate constants among the corrosion-resistant metals [40]. Jeangros et al. [41] demonstrated that at 300 °C, voids of 5–10 nm width began to be formed at the Ni/NiO interface as a consequence of the Kirkendall effect when Ni2+ diffusion across the NiO layer was faster than the opposite diffusion of O2− [35]. At this stage, new NiO regions began to form outwards at the NiO/O2 interface and made the oxide growth rate faster. In fact, we demonstrated that the TG curves obtained for Ni and Ni/Al2O3 samples had a slower weight gain up to 300 °C during the first oxidation cycle (Figure 4a). Around 300 °C, oxidation kinetics were accelerated for all three samples. In addition, Atkinson et al. [35] and Jeangros et al. [41] evidenced cracking of the NiO layer that resulted in formation of permeation pathways for oxygen to a fresh Ni surface. In such a scenario, a new NiO phase will also be formed directly on the surface of the Ni particles. In SEM images, some voids under the NiO layers after the first oxidation cycle were detected (Figure 7). However, they did not accumulate. Therefore, strong Ni/NiO contacts were maintained in all samples. Even the second oxidation treatment did not lead to the nucleation of multiple voids (Figure 7); thus, the NiO layer stayed in contact with the surface of a not fully oxidized Ni particle. Because we did not measure the closed porosity, the presence of the Kirkendall effect remains to be elucidated.
Although the 20–32 µm Al2O3 fraction was examined in previous work [34], these data cannot be simply combined with those demonstrated in the present work. The main reason likely lies with the different volumes of samples, which could affect the open porosity. The Ni/Al2O3 samples investigated in our previous work [34] were smaller by 36% than those tested here. In line with this, we evidenced that the weight gain of the 1.2 g samples was larger than that of the 60 g samples (Figure 5), which directly points to the larger amount of NiO. This in turn facilitates NiO interconnecting, and lower open porosity could be expected. Indeed, it was found that the Ni/Al2O3 sample, although containing Al2O3 particles of moderate size (20–32 µm), exhibited the lowest open porosity (28.3% after the first oxidation; 19.2% after the second oxidation) in the present study.

3.4. NiO Amount and NiO Thickness Related to Open Porosity

To obtain a quantitative view, the NiO amount and thickness of NiO layers was determined in three regions (top, middle, and bottom) of each twice-oxidized sample. Typical XRD patterns in the middle position of Ni and Ni/Al2O3 samples are presented in Figure 8a. They include intense narrow peaks corresponding to Ni and NiO phases and weak peaks corresponding to Al2O3. Figure 8b summarizes XRD data. Analysis of XRD patterns revealed that Al2O3 particles substantially reduced differences in NiO amount between the individual examined regions, reflecting the higher open porosity of Ni/Al2O3 samples in comparison to that of the Ni sample (Figure 6). The larger Al2O3 particles completely abolished differences between tested regions, pointing to an increased chemical homogeneity in a sample volume. In addition, the averaged NiO amount over the sample volume was the largest when Al2O3 particles of 32–45 µm diameter were added; although, the increase did not reach statistical significance (Figure 8d). To assess an error introduced by the porosity of the samples, XRD data were validated by calculating the NiO amount from EDS analysis. Similarly, the highest heterogeneity regarding the NiO amount was found for the Ni sample (Figure 8c). Both Ni/Al2O3 samples displayed much smaller differences among top, middle, and bottom positions. Comparing averaged XRD and EDS data, a quantitative agreement highlighting a role of the Al2O3 particle size in NiO formation was found, presumably by regulating oxygen delivery (Figure 8d).
The experimentally determined NiO amount was then related to the sample porosity. As shown in Figure 9a, although, Ni/Al2O3 samples displayed increased open porosity when compared to that of the Ni sample, a statistically similar amount of NiO was grown in all three samples. This phenomenon could be explained by the presence of Al2O3 particles, which impeded abrupt synthesis of NiO in the top region—the main pathway for oxygen delivery during the first oxidation cycle (Figure 8b–d)—and thus pore clogging by the interconnection of NiO layers was avoided (Figure 7, left panels). SEM images shown in Figure 7 demonstrate that the presence of Al2O3 particles modified the thickness of NiO layers. Therefore, this parameter has been quantitatively estimated in three regions (top, middle, and bottom) of each twice-oxidized sample (Figure 9c). The presence of larger Al2O3 particles resulted in a volume homogeneity in respect to the NiO amount and NiO thickness. In support of this, the averaged values of these two parameters over the sample volume followed a similar trend and qualitatively correlated to each other (Figure 9b). Although data variability was not low enough to reach statistical significance for both parameters, there is a detectable increasing trend for larger Al2O3 particles. Their presence resulted in the growth of slightly more robust NiO layers while sample porosity was the highest from all tested samples (Figure 9d). These results show that larger Al2O3 particles occupying bigger volumes are more effective in keeping oxidized Ni particles away from each other to prevent their interconnection by, albeit the more robust, NiO layers. Because NiO thickness determined for tens of Ni particles located in the tested sample region was very similar (Figure 9c), it seems reasonable to conclude that the presence of Al2O3 particles did not cause any local heterogeneity to influence NiO growing on Ni particles of the same diameter.

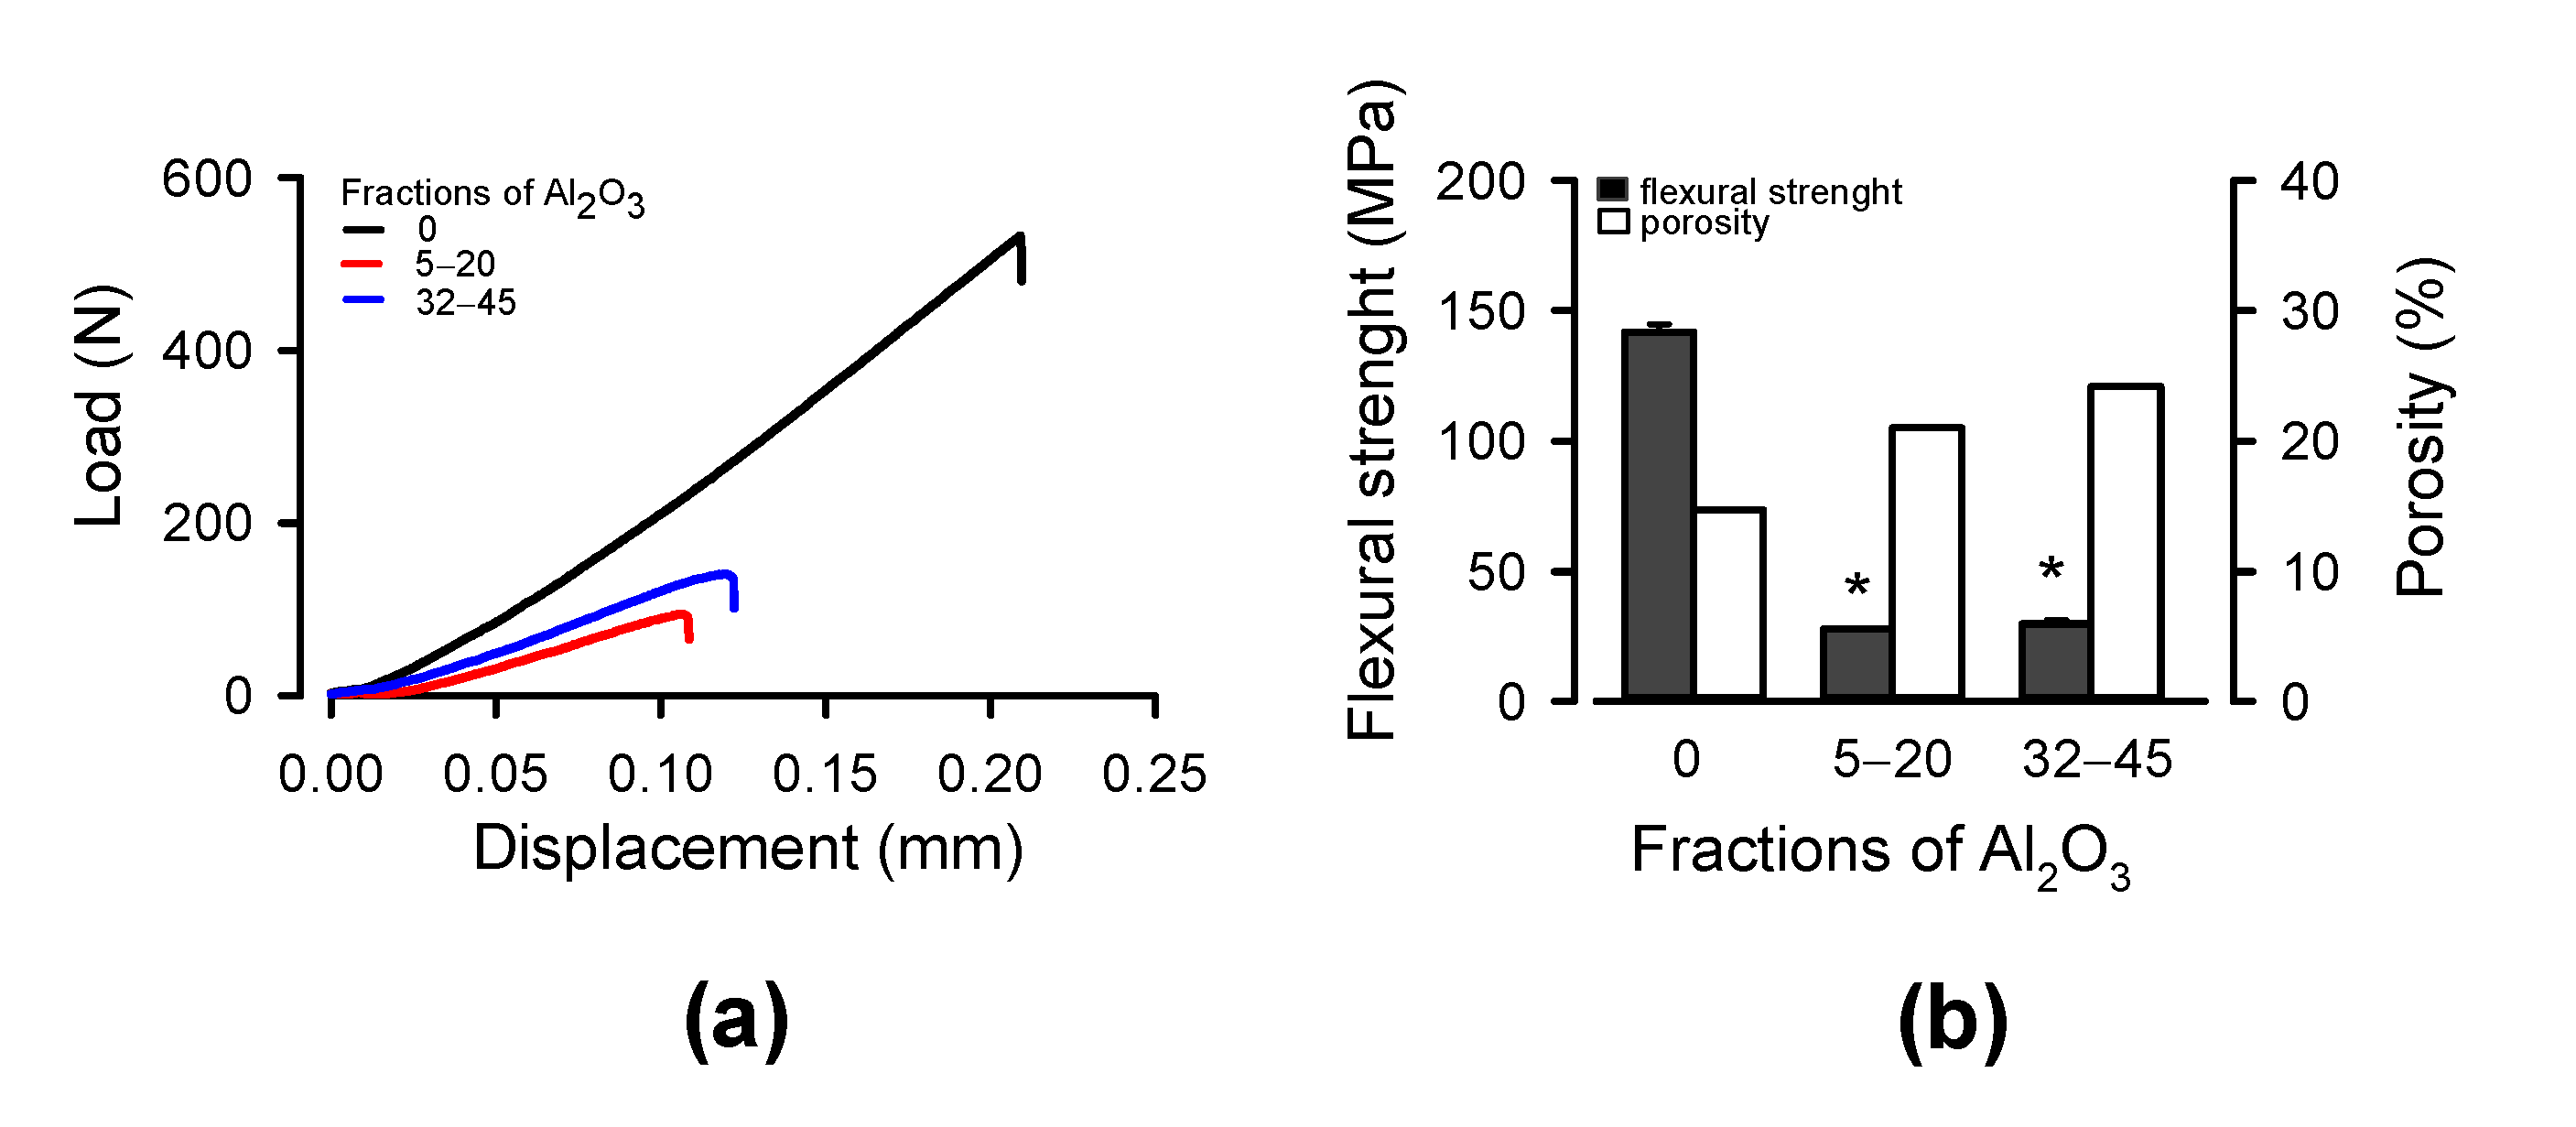
3.5. Flexural Strength

It is well known that mechanical properties substantially vary with the level of porosity. The relationship between porosity and the flexural strength of numerous materials has been widely studied at both experimental and theoretical levels [42,43,44,45]. Understanding this relationship is of great importance because it is necessary for optimizing the application of porous metallic materials when, for example, high open porosity with a maximal possible strength is often needed. Therefore, we tested the flexural strength of Ni and Ni/Al2O3 samples utilizing the 3-point bending test. Figure 10a shows representative load–displacement curves recorded for all three tested samples. The load increased in direct proportion to the deflection up to cracking, and differences between flexural performance were found only in the maximal load. The Ni sample exhibited a superior flexural response cracking at 532.81 N load. In contrast, the failure load for Ni/Al2O3 samples was substantially lower (94.72 N and 140.6 N for Al2O3 particles of 5–20 µm and 32–45 µm, respectively). Figure 10b summarizes data for the flexural strength calculated using Equation (1) and correlates them to open porosity. Expectedly, the highest flexural strength of the Ni sample (141.95 ± 2.81 MPa) corresponds to the lowest open porosity while more porous Ni/Al2O3 samples demonstrated almost fivefold lower flexural strength (27.93 ± 0.25 MPa and 29.77 ± 1.35 MPa for Al2O3 particles of 5–20 µm and 32–45 µm, respectively). Although the size of Al2O3 particles influenced the flexural performance only negligibly, it substantially modified the sample open porosity (Figure 10b). Thus, the addition of larger Al2O3 particles resulted in a more porous Ni/Al2O3 composite while retaining a similar strength to that of a less porous sample with smaller ceramic particles. Because mechanical properties reflect the internal structure [43], this specific behavior of the sample with the bigger Al2O3 particles could be explained by almost absolute homogeneity in respect to NiO amount and NiO thickness (Figure 8b and Figure 9c). In addition, mechanical bonding can be likely achieved by the interlocking of adjacent NiO layers. NiO layers do not grow as ideal smooth surfaces at the microstructural level; instead, there are some preferential orientations of growing oxide. This process greatly depends on the possibility of oxygen penetration into the defined area, the thickness of the already formed NiO layer, and locally available space. The nature of bonding, however, needs to be further explored.

4. Conclusions

Open-porous Ni/Al2O3 composites were fabricated by a method of thermal oxidation in air at a moderate temperature of 800 °C for 120 min. The open porosity was studied in relation to the size of Al2O3 particles and was correlated to weight gain, microstructure, and chemical composition. Our results show that by increasing the size of Al2O3 particles from 5–20 µm to 32–45 µm, the open porosity of the Ni/Al2O3 sample was increased from 21% to 24.2%. Concurrently, the flexural strength was found not to be changed significantly. This specific performance is likely to be a result of volume homogeneity with respect to NiO amount and NiO thickness. While larger Al2O3 particles allowed for a better oxygen supply into a sample volume, stimulating NiO growth on the surface of Ni particles, they concurrently prevented massive NiO interconnecting, which resulted in higher open porosity. Therefore, the composite with larger Al2O3 particles could be an excellent candidate for infiltration by molten metal or it can be directly used in filtration applications requiring a good penetrating porosity, substantial corrosion resistance, and suitable mechanical strength. The conventional production of porous metal, ceramic, or metal-ceramic composites is technologically, energetically, and financially demanding. In most cases, a high melting point of metals, compared to that of ceramics, needs to be reached. In contrast, thermal oxidation at a moderate temperature is a simple and relatively low-cost processing route for open-porous Ni/Al2O3 composites. In addition to being flexible and attractive, it also allows large-size components to be fabricated.

Author Contributions

Conceptualization, A.O.; methodology, A.O. and P.Š. (Pavol Štefánik); formal analysis, A.O., M.G. and P.Š. (Peter Švec); investigation, A.O., P.Š. (Peter Švec), P.Š. (Pavol Štefánik), S.K.J. and M.Š.; writing—original draft preparation, A.O. and M.G.; writing—review and editing, A.O., M.G., P.Š. (Pavol Štefánik) and K.I.; visualization, M.G.; funding acquisition, P.Š. (Peter Švec) and P.Š. (Pavol Štefánik). All authors have read and agreed to the published version of the manuscript.

Funding

This research was funded by the Slovak Scientific Grant Agency, grant number VEGA 2/0135/19; the Slovak Research and Development Agency, grant number APVV-19-0369. This research was performed during the implementation of the project Building-up Centre for advanced material application of the Slovak Academy of Sciences, ITMS project code 313021T081 supported by the Research and Innovation Operational Program funded by the ERDF.

Data Availability Statement

The data presented in this study are available on request from the corresponding author.

Acknowledgments

The authors wish to acknowledge Oto Bajana for performing flexural strength tests.

Conflicts of Interest

The authors declare no conflict of interest. The funders had no role in the design of the study; in the collection, analyses, or interpretation of data; in the writing of the manuscript, or in the decision to publish the results.

References

  1. Li, H.; Liu, R.; Chen, J.; Wang, Z.; Xiong, X. Preparation of nickel porous materials by sintering nickel oxalate and sodium chloride after blending and reduction. J. Mater. Res. Technol. 2020, 9, 3149–3157. [Google Scholar] [CrossRef]
  2. Bhattacharyya, M.; Kumar, A.N.; Kapuria, S. Synthesis and characterization of Al/SiC and Ni/Al2O3 functionally graded ma-terials. Mater. Sci. Eng. A 2008, 487, 524–535. [Google Scholar] [CrossRef]
  3. Yang, S.; Kim, H.; Lee, C.S. Investigation of shrinkage control in Ni–Al2O3 (metal–ceramic) functionally graded materials. Ceram. Int. 2013, 39, 93–99. [Google Scholar] [CrossRef]
  4. Dele-Afolabi, T.T.; Azmah Hanim, M.A.; Norkhairunnisa, M.; Sobri, S.; Calin, R.; Ismarrubie, Z.N. Significant effect of rice husk and sugarcane bagasse pore formers on the microstructure and mechanical properties of porous Al2O3/Ni composites. J. Alloys Compd. 2018, 743, 323–331. [Google Scholar] [CrossRef]
  5. Li, Y.-b.; Yue, W.-x. Study on the Al2O3 contents in Ni–Al2O3 composite coatings predicted by using BP neural network model. J. Synth. Crys. 2017, 8, 1649–1652. [Google Scholar]
  6. Fan, H.; Jiang, J.; Zhao, Y.; Wang, S.; Li, Z. Improvement of microstructure and properties of Ni–Al2O3 composite coating via jet electrodeposition. J. Mod. Phys. B 2020, 34, 2050243. [Google Scholar] [CrossRef]
  7. Alekseeva, E.; Shishkova, M.; Strekalovskaya, D.; Gerashchenkov, D.; Glukhov, P. Ni-Bbsed coatings for oil and gas industry fabricated by cold gas spraying. Mater. Proc. 2021, 3, 2. [Google Scholar] [CrossRef]
  8. Amosov, A.P.; Titova, Y.V.; Timoshkin, I.Y.; Kuzina, A.A. Fabrication of Al-AlN nanocomposites. Key Eng. Mater. 2015, 684, 302–309. [Google Scholar] [CrossRef]
  9. Aryshnskii, E.V.; Bazhin, V.Y.; Kawalla, R. Strategy of refining the structure of aluminum magnesium alloys by complex microalloying with transition elements during casting and subsequent thermomechanical processing. Non-Ferr. Met. 2019, 1, 28–32. [Google Scholar] [CrossRef]
  10. Li, B.; Zhang, W.; Li, D. Synthesis and properties of a novel Ni–Co and Ni–Co/ZrO2 composite coating by DC electrodeposi-tion. J. Alloys Compd. 2020, 821, 153258. [Google Scholar] [CrossRef]
  11. Erler, F.; Jakob, C.; Romanus, H.; Spiess, L.; Wielage, B.; Lampke, T.; Steinhauser, S. Interface behaviour in nickel composite coatings with nano-particles of oxidic ceramic. Electrochim. Acta 2003, 48, 3063. [Google Scholar] [CrossRef]
  12. Bhutta, M.U.; Khan, Z.A.; Garland, N. Wear performance analysis of Ni–Al2O3 nanocomposite coatings under nonconven-tional lubrication. Materials 2019, 12, 36. [Google Scholar] [CrossRef] [PubMed] [Green Version]
  13. Qu, G.; Wang, D.; Wang, Q.; Hua, M. Microstructure and wear resistance of Ni-Al2O3 nanocomposite coating. J. Phys. Conf. Ser. 2021, 1965, 012113. [Google Scholar] [CrossRef]
  14. Na, T.; Jin, L.; Liyan, L.; Guo, J.; Xiufang, C.; Yang, W. Synthesis of Ni/nano-Al2O3 coatings by brush plating with magnetic fields. R. Soc. Open Sci. 2021, 8, 202089. [Google Scholar] [CrossRef]
  15. Breval, E.; Deng, Z.; Chiou, S.; Pantano, C.G. Sol-gel prepared Ni-alumina composite materials. J. Mater. Sci. 1992, 27, 1464–1468. [Google Scholar] [CrossRef]
  16. Tuan, W.; Lin, M.; Wu, H. Preparation of Al2O3Ni composites by pressureless sintering in H2. Ceram. Int. 1995, 21, 221–225. [Google Scholar] [CrossRef]
  17. Chen, R.Z.; Tuan, W.H. Pressureless sintering of Al2O3/Ni nanocomposites. J. Eur. Ceram. Soc. 1999, 19, 463–468. [Google Scholar] [CrossRef]
  18. Theerabornkul, T.; Kangwantrakool, S. Fabrication of Al2O3-Ni composites using ceramic nanoparticles. CMU J. Natur. Sci. 2005, 4, 59–66. [Google Scholar]
  19. Isobe, T.; Daimon, K.; Sato, T.; Matsubara, T.; Hikichi, Y.; Ota, T. Spark plasma sintering technique for reaction sintering of Al2O3/Ni nanocomposite and its mechanical properties. Ceram. Int. 2008, 34, 213–217. [Google Scholar] [CrossRef]
  20. Dawood, N.M. Erosion-corrosion behavior of Al-20%Ni-Al2O3 metal matrix composites by stir casting. Mater. Sci. Forum 2020, 1002, 161–174. [Google Scholar] [CrossRef]
  21. Konopka, K.; Krasnowski, M.; Zygmuntowicz, J.; Cymerman, K.; Wachowski, M.; Piotrkiewicz, P. Characterization of Al2O3 samples and NiAl–Al2O3 composite consolidated by pulse plasma sintering. Materials 2021, 14, 3398. [Google Scholar] [CrossRef] [PubMed]
  22. Lefebvre, L.P.; Banhart, J.; Dunand, D.C. Porous metals and metallic foams: Current status and recent developments. Adv. Eng. Mater. 2008, 10, 775–787. [Google Scholar] [CrossRef] [Green Version]
  23. Gil, R.; Jinnapat, A.; Kennedy, A.R. Pressure-assisted infiltration of molten aluminium into open cell ceramic foams: Ex-perimental observations and infiltration modelling. Compos. Part A Appl. Sci. Manuf. 2012, 43, 880–884. [Google Scholar] [CrossRef]
  24. Mozaffari, N.; Solaymani, S.; Achour, A.; Kulesza, S.; Bramowicz, M.; Nezafat, N.B.; Ţălu, S.; Mozaffari, N.; Rezaee, S. New insights into SnO2/Al2O3, Ni/Al2O3, and SnO2/Ni/Al2O3 composite films for CO adsorption: Building a bridge between mi-crostructures and adsorption properties. J. Phys. Chem. C 2020, 124, 3692–3701. [Google Scholar] [CrossRef]
  25. Zhan, Y.; Wang, Y.; Gu, D.; Chen, C.; Jiang, L.; Takehira, K. Ni/Al2O3-ZrO2 catalyst for CO2 methanation: The role of γ-(Al, Zr)2O3 formation. Appl. Surf. Sci. 2018, 459, 74–79. [Google Scholar] [CrossRef]
  26. Garbarino, G.; Kowalik, P.; Riani, P.; Antoniak-Jurak, K.; Pieta, P.; Lewalska-Graczyk, A.; Lisowski, W.; Nowakowski, R.; Busca, G.; Pieta, I.S. Improvement of Ni/Al2O3 catalysts for low-temperature CO2 methanation by vanadium and calcium oxide addition. Ind. Eng. Chem. Res. 2021, 60, 6554–6564. [Google Scholar] [CrossRef]
  27. Conde, Y.; Despois, J.-F.; Goodall, R.; Marmottant, A.; Salvo, L.; San Marchi, C.; Mortensen, A. Replication processing of highly porous materials. Adv. Eng. Mater. 2006, 8, 795–803. [Google Scholar] [CrossRef]
  28. Herwig, J.; Titus, J.; Kullmann, J.; Wilde, N.; Hahn, T.; Glaser, R.; Enke, D. Hierarchically structured porous spinels via an epoxide-mediated sol-gel process accompanied by polymerization-induced phase separation. ACS Omega 2018, 3, 1201–1212. [Google Scholar] [CrossRef]
  29. Weber, S.; Abel, K.L.; Zimmermann, R.T.; Huang, X.; Bremer, J.; Rihko-Struckmann, L.K.; Batey, D.; Cipiccia, S.; Titus, J.; Poppitz, D.; et al. Porosity and structure of hierarchically porous Ni/Al2O3 catalysts for CO2 methanation. Catalysts 2020, 10, 1471. [Google Scholar] [CrossRef]
  30. Kränzlin, N.; Niederberger, M. Controlled fabrication of porous metals from the nanometer to the macroscopic scale. Mater. Horiz. 2015, 2, 359. [Google Scholar] [CrossRef]
  31. Naito, M.; Hayakawa, O.; Nakahira, K.; Mori, H.; Tsubaki, J. Effect of particle shape on the particle size distribution measured with commercial equipment. Powder Tech. 1998, 100, 52–60. [Google Scholar] [CrossRef]
  32. Cha, S.I.; Lee, K.H.; Ryu, H.J.; Hong, S.H. Effect of size and location of spherical pores on transverse rupture strength of WC-Co cemented carbides. Mater. Sci. Eng. A 2008, 486, 404–408. [Google Scholar] [CrossRef]
  33. Zhao, B.; Yu, T.; Ding, W.; Li, X. Effects of pore structure and distribution on strength of porous Cu-Sn-Ti alumina composites. Chin. J. Aeronaut. 2017, 30, 2004–2015. [Google Scholar] [CrossRef]
  34. Opálek, A.; Štefánik, P.; Beronská, N.; Klimová, A.; Kúdela Jr, S.; Iždinský, K.; Nagy, Š. Ni-NiO porous preform with con-trolled porosity using Al2O3 powder. Mater. Sci. Forum 2017, 891, 533–536. [Google Scholar] [CrossRef]
  35. Atkinson, A. Transport processes during the growth of oxide films at elevated temperature. Rev. Mod. Phys. 1985, 57, 437–469. [Google Scholar] [CrossRef]
  36. Kofstad, P. High Temperature Corrosion; Elsevier Applied Science: London, UK; New York, NY, USA, 1988; p. 546. [Google Scholar]
  37. Huntz, A.M.; Lefevre, B.; Cassino, F. Roughness and oxidation: Application to NiO growth on Ni at 800 °C. Mater. Sci. Eng. A 2000, 290, 190–197. [Google Scholar] [CrossRef]
  38. Haugsrud, R. On the high-temperature oxidation of nickel. Corros. Sci. 2003, 45, 211–235. [Google Scholar] [CrossRef]
  39. Chevalier, S.; Desserrey, F.; Larpin, J.P. Oxygen transport during the high temperature oxidation of pure nickel. Oxid. Met. 2005, 64, 219–234. [Google Scholar] [CrossRef]
  40. Unutulmazsoy, Y.; Merkle, R.; Fischer, D.; Mannhart, J.; Maier, J. The oxidation kinetics of thin nickel films between 250 and 500 °C. Phys. Chem. Chem. Phys. 2017, 19, 9045–9052. [Google Scholar] [CrossRef] [Green Version]
  41. Jeangros, Q.; Hansen, T.W.; Wagner, J.B.; Dunin-Borkowski, R.E.; Hebert, C.; Van Herle, J.; Hessler-Wyser, A. Oxidation mechanism of nickel particles studied in an environmental transmission electron microscope. Acta Mater. 2014, 67, 362–372. [Google Scholar] [CrossRef]
  42. Wagh, A.S.; Poeppel, R.B.; Singh, J.P. Dependence of ceramic fracture properties on porosity. J. Mater. Sci. 1993, 28, 3589–3593. [Google Scholar] [CrossRef]
  43. Nielsen, L.F. On strength of porous material: Simple systems and densified systems. Mater. Struct. 1998, 31, 651–661. [Google Scholar] [CrossRef]
  44. Lu, G.; Lu, G.Q.; Xiao, Z.M. Mechanical properties of porous materials. J. Porous Mat. 1999, 6, 359–368. [Google Scholar] [CrossRef]
  45. Kwan, Y.B.P.; Stephenson, D.J.; Aacock, J.R. The porosity dependence of flexural modulus and strength for capsule-free hot isostatically pressed porous alumina. J. Mater. Sci. 2000, 35, 1205–1211. [Google Scholar] [CrossRef]
Figure 1. The time–temperature cycle of samples thermally treated in air.
Metals 11 01582 g001
Figure 2. Macrostructure of oxidized samples: (a) Ni; (b) Ni with Al2O3 particles with a diameter of 5–20 µm; (c) Ni with Al2O3 particles with a diameter of 32–45 µm. A, C, E after the first oxidation cycle; B, D, F after the second oxidation cycle. The open white squares indicate regions from which SEM images were taken. The white dots represent regions where SEM, EDS, and XRD analyses were performed.
Metals 11 01582 g002
Figure 3. Cross-section of the sample for flexural strength testing.
Metals 11 01582 g003
Figure 4. Relative weight gain of oxidized samples. (a) Ni (black line), Ni with Al2O3 particles with a diameter of 5–20 µm (red line), and Ni with Al2O3 particles with a diameter of 32–45 µm (blue line) during heating in air (dashed line); (b) The final relative weight gain after the first and second cycles and a summary after two oxidation cycles.
Metals 11 01582 g004
Figure 5. Effects of sample weight on maximum weight gain of samples after the first and second oxidation cycles and a summary after two oxidation cycles.
Metals 11 01582 g005
Figure 6. Comparison of the final relative weight gain (black column) of samples and the open porosity (white column): (a) after the first and second oxidation cycles; (b) summary after two oxidation cycles.
Metals 11 01582 g006
Figure 7. SEM images from the top region of the oxidized samples: Ni (A,B), Ni with Al2O3 particles with a diameter of 5–20 µm (C,D), and a sample of Ni with Al2O3 particles with a diameter of 32–45 µm (E,F). A, C, E after the first oxidation cycle; B, D, F after the second oxidation cycle.
Metals 11 01582 g007
Figure 8. Analysis of NiO after two oxidation cycles. (a) X-ray diffraction pattern taken from the middle part of samples; NiO amount derived from (b) XRD and (c) EDS performed in three different regions (top, middle, and bottom); (d) Correlation between averaged XRD and EDS values for NiO.
Metals 11 01582 g008
Figure 9. Correlation between NiO amount derived from XRD analysis and the open porosity (a) and NiO thickness (b); (c) NiO thickness measured in three distinct regions of Ni and Ni/Al2O3 samples; (d) Correlation between NiO thickness and open porosity. NiO amount in (a,b) is related to the Ni content. * Significant versus the top position, significant # versus the middle position.
Metals 11 01582 g009
Figure 10. Flexural strength of oxidized samples. (a) Load–displacement curves recorded during the 3-point bending test for Ni and Ni/Al2O3 samples; (b) Correlation between the flexural strength and open porosity. * Significant versus the Ni sample.
Metals 11 01582 g010
Publisher’s Note: MDPI stays neutral with regard to jurisdictional claims in published maps and institutional affiliations.

