Article

Redistribution of Grain Boundary Misorientation and Residual Stresses of Thermomechanically Simulated Welding in an Intercritically Reheated Coarse Grained Heat Affected Zone

by
Giancarlo Sanchez Chavez
1,*,
Segen Farid Estefen
2,
Tetyana Gurova
3,
Anatoli Leontiev
4,
Lincoln Silva Gomes
5 and
Suzana Bottega Peripolli
5
1
Ingeniería de Materiales, Universidad Nacional de San Agustín de Arequipa, Arequipa 04001, Peru
2
Laboratório de Tecnologia Submarina, Instituto Alberto Luiz Coimbra de Pós-Graduação e Pesquisa de Engenharia, Universidade Federal do Rio de Janeiro, Rio de Janeiro 21941-901, RJ, Brazil
3
Curso de Tecnologia em Construção Naval, Fundação Centro Universitário Estadual da Zona Oeste, Rio de Janeiro 23070-200, RJ, Brazil
4
Instituto de Matemática, Universidade Federal do Rio de Janeiro, Rio de Janeiro 21941-901, RJ, Brazil
5
Inspeção e Integridade, Instituto SENAI de Inovação, Rio de Janeiro 20550-011, RJ, Brazil
*
Author to whom correspondence should be addressed.
Metals 2021, 11(11), 1850; https://doi.org/10.3390/met11111850
Submission received: 13 October 2021 / Revised: 13 November 2021 / Accepted: 15 November 2021 / Published: 18 November 2021
(This article belongs to the Special Issue Mechanical Properties and Microstructure of Forged Steel)

Abstract

:
A study of the migration of the grain boundary misorientation and its relationship with the residual stresses through time immediately after the completion of a thermomechanical simulation has been carried out. After physically simulating an intercritically overheated welding heat affected zone, the variation of the misorientation of grain contours was observed with the electron backscatter diffraction (EBSD) technique and likewise the variation of the residual stresses of welding with RAYSTRESS equipment. It was observed that the misorientation of the grain contours in an ASTM DH36 steel was modified after the thermomechanical simulation, which corresponds to the measured residual stress variation along the first week of monitoring, with compressive residual stresses ranging from 195 MPa to 160 MPa. The changes in misorientation indicate that the stress relaxation phenomenon is associated with the evolution of the misorientation in the microstructure caused by the welding procedure. On the first day, there was a fraction of 4% of the kernel average misorientation (KAM) values at 1° misorientation and on the fourth day, there was a fraction of 7% of the KAM values at 1° misorientation.

1. Introduction

Fusion welding, despite being one of the most used technologies in the merging of metals such as high-strength steels, has a considerable number of drawbacks, among which the internal stresses caused by the transient thermal cycles suffered in welds of various steps—which form part of the procedures for large structures, such as vessels for oil extraction—stand out. Thermal stresses, residual stresses, and distortions can cause fractures in the areas around welds under certain tensile load conditions [1]. In addition to these, stress corrosion and fatigue problems are also related to these residual stresses. Residual stresses and corrosion, which affect the lifetime of structural components working at high temperatures, must be considered [2]. The compressive residual stresses in a 316L stainless steel increase in the resistance to pit initiation [3]. The cavitation erosion pits have higher stress levels which lead to fatigue crack nucleation [4]. When a material has low levels of yield strength, the residual stresses complicate the performance of the welded joint, reducing its strength. Due to the particularity of welding processes, the mechanical properties of welded joint materials, especially the yield strength, are unevenly distributed, which seriously affects the safety performance of welded joints [5]. The heat softening zone has a great reduction in strength compared with the base metal when lap joints of 1180 MPa steel sheets are welded [6]. For example, the magnitude of tensile residual stresses reaches the yield strength of base metal; this is because, during the welding, the filler wire and base metal experience rapid heating and a quick cooling process [7].
By monitoring the residual stresses of weld daily by means of X-ray diffraction, magnetic methods, and vertical displacements of the surface of the welded plate using laser technology equipment, the redistribution of the residual stresses was observed in a relatively short period of up to two weeks following the welding procedure [8,9,10]. This observable stress redistribution, not observed in other research works, is characterized by a reduction in and uniformity of the maximum shear stress values 2 weeks after welding. Microstructural analysis rules out the possibility of stress redistribution owing to the failure of the material.
Changes in residual stresses over time are related to the misorientation of grain boundaries. Internal stresses are related to the microstructure on an atomic scale and are present in areas close to dislocations [1]. Researchers such as Taylor [11], Orowan [12], and Love [13] have related elastic and plastic distortions and/or deformations to the dislocations present in the microstructure of materials. The Volterra process shows that the creation of a dislocation requires energy and the introduction of residual stresses [14]. Fan et al. [15] state that the dislocation glide is a general mode of strain, governing the strength of metals, so there is a dependence on the rate of strain and the density of a dislocation with the dynamics of collective dislocation. When there is plastic strain, the distortion of the crystal lattice is alleviated with the formation of dislocations with a certain concentration of dislocations, with a net Burger vector other than zero, that cause changes in the orientation of the crystal lattice [16]. Relating residual stresses at the atomic and microscopic level, during plastic strain individual grains do not twist as a single element in magnitude and direction; thus, dislocations are located in the grain contours to maintain the continuity of the microstructural network [17]. For metals deformed to moderate strains, the dislocations density increases linearly with plastic strain [18]. In steels, the deformation introduces dislocation boundaries with a small misorientation in austenite [19,20]. The behavior of the dislocations within the microstructure is heterogeneous [21]. Hence, the dislocations are highly heterogeneously distributed, with significant accumulation of high density near the grain boundaries and relatively low density within the interior of the grain [22]. The orientations of the crystals within the grains change due to the accumulation of dislocations and may fluctuate by several degrees, even within the same grain [23]. Therefore, the accumulation of dislocations is expected to change the grain orientation distribution and the grain boundary misorientation angle. This is also based on the fact that the nature of any given grain contour depends on the misorientation of the two adjacent grains and the orientation of the boundary plane with respect to them [24].
The level of deformation can be estimated with misorientation analysis, where the orientation of two or more data points is compared for individual grains or within calculational domains [25]. The nature of any given grain contour depends on the misorientation of the two adjacent grains and the orientation of the boundary plane in relation to them [24]. Misorientation within grains increases with the introduction of plastic strain, which is often used as a quantitative measure to describe the degree of microstructure deformation [26]. However, the introduction of plastic strain can result in substructure formation associated with the rearrangement of dislocations [26]. Because of this, small misorientations are important for understanding the mechanical behavior of materials and it is important that the orientation measurements are precise [27,28]). The yield stress, as well as the flow stress after yielding, increases as the grain boundary misorientation angle increases [29]. When a deformation is applied to a metal, the presence of low-angle grain boundaries (LAGB) is observed [19]. Free dislocations generated during plastic deformation can readily rearrange themselves, leading to the development of low-angle grain boundaries [26]. Further deformation is enabled by the formation of new high-angle grain boundaries [25]. In a work published by Costa et al. [30], for low-angle grain boundaries, samples with higher stress levels have a higher percentage of misorientation, and for high-angle grain boundaries the observed behavior is the opposite. This is due to the fact that the energy of the low-angle grain boundaries is the total energy of the dislocations within the contour area and depends on the spacing of the dislocations and the misorientation angle, whereas, for high-angle grain boundaries, the grain boundary energy is almost independent of the misorientation [24]. Humphreys et al. [31] state that low-angle boundaries are those that are composed of an arrangement of dislocations whose structure and properties vary depending on the misorientation, while high-angle boundaries are those whose structure and properties generally do not depend on misorientation. This suggests that there is a direct relationship between the stress–strain level and the amount of grain boundaries, with the low-angle grain boundaries having a greater influence on the stress–misorientation relationship. From what was discussed in previous paragraphs, a hypothesis was proposed: the stress relaxation phenomenon is associated with the evolution of the misorientation of the microstructure that occurs in the material following the culmination of the welding procedure.

2. Materials and Methods

A 12 mm thick ASTM DH36 steel sheet was used, from which specimens with dimensions of 10 mm × 10 mm × 71 mm were extracted (Figure 1). In the center of this sample was the intercritically reheated coarse grained heat affected zone (IC CGHAZ), and next to it was the fine grain heat affected zone (FGHAZ). The elastic limit of the material is 360 MPa. The chemical composition of the steel was obtained in this investigation with optical emission spectroscopy using a Foundry Master Pro spectrometer from Oxford Instruments (Concord, MA, USA), and is given in Table 1 with a carbon equivalent (CEiiw) of 0.41%, indicating that the solubility is relatively good since it exceeds 0.40% of CEiiw. Steels with CEiiws < 0.40% are considered to have good weldability and do not require special preparation or post-treatment of the weld [32]. The equation for the calculation of the CEiiw was formulated by the International Institute of Welding (IIW) [32].
The thermal welding cycles were carried out with a physical simulation for the determination of the microstructure using Gleeble® 3800 equipment (Dynamic Systems Inc., Poestenkill, NY, USA). The sample was held rigidly in the jaws of the machine, not allowing the jaws to move when the material presented volumetric expansion, as shown in Figure 2. The temperature was measured using a type K thermocouple.
The thermal cycle simulation of double pass welding consisted of the following steps. For the first welding pass simulation, the middle region of the test specimen was heated to 1350 °C with a heat rate of 450 °C/s, was maintained at this temperature for 0.35 s, was cooled down to 800 °C in 20 s with a cooling rate of 27.5 °C/s, and then to 200 °C in t8/5 = 160 s with a cooling rate of 3.75 °C/s. The second pass simulation involved heating from 200 °C to a peak temperature of 800 °C with a heat rate of 266 °C/s, maintaining the specimen at this temperature for 0.35 s, and then cooling it to 200 °C in t8/5 = 160 s with a cooling rate of 3.75 °C/s followed by air free cooling, as shown in Figure 3.
These thermal cycles were designed to obtain the microstructure of a heat affected zone (HAZ) from two welding passes. The first pass reaches a coarse-grained heat affected zone and the second pass pertains to an intercritical zone (IC CGHAZ). The temperature of the second intercritical pass, which was 800 °C, was taken between the temperatures AC1 = 695 °C and AC3 = 830 °C calculated with the Thermo-Calc® (Thermo-Calc Software’s, Pittsburgh, USA) version 1 thermodynamic software based on TCS Steel and Fe-alloys Database (TCFE) data (Figure 4).
For data acquisition, an FEI Quanta 450 scanning electron microscope (SEM, FEI Technologies Inc., Hillsboro, Oregon, USA) with a tungsten filament and a BRUKER E-FLASH EBSD automatic detector (Bruker Nano GmbH, Berlin, Germany) were used. The BRUKER ESPRIT 2.0 package was applied for data processing. The configuration used for the microscope had an acceleration voltage of 23 KV, with a step size of 0.72 μm and an indexing speed (min–max.) of 94.6–97.9%. The samples were prepared using SiC paper with a grain from 100 to 1000 for grinding. Polishing was carried out with a diamond suspension from 6 μm to 1 μm, and finally a fine polishing was applied using a silica colloidal suspension of 0.25 μm.
The residual stress values were measured using a RAYSTRESS instrument (SYNTHESIS Co. ltd, Saint-Petersburg, Russia), which is a portable X-ray machine that employs a double exposure method [8,9]. The principle of the stress measurements via the RAYSTRESS using double exposure is shown in Figure 5. Two cassette windows captured the diffraction lines in 2θ-angular intervals from 148° to 164°. The inclination of the specimen surface of 12° corresponds to measurements for steel specimens using Cr-Kα radiation and the {211} reflection with θ211 = 78°. The experimental accuracy of the stress measurements was 10 MPa. The specimen was maintained at the same measurement position throughout the entire three-week monitoring period. Stress measurements were taken from the center of the specimen in the IC CGHAZ area, and in the area located 5 mm from the center of the specimen, whose microstructure was identified as FGHAZ, which is the fine grain heat affected zone. The measurements on both areas were performed simultaneously using two RAYSTRESS machines. Measurements were started around two hours after the end of the Gleeble simulation and were performed every 12 h.

3. Results

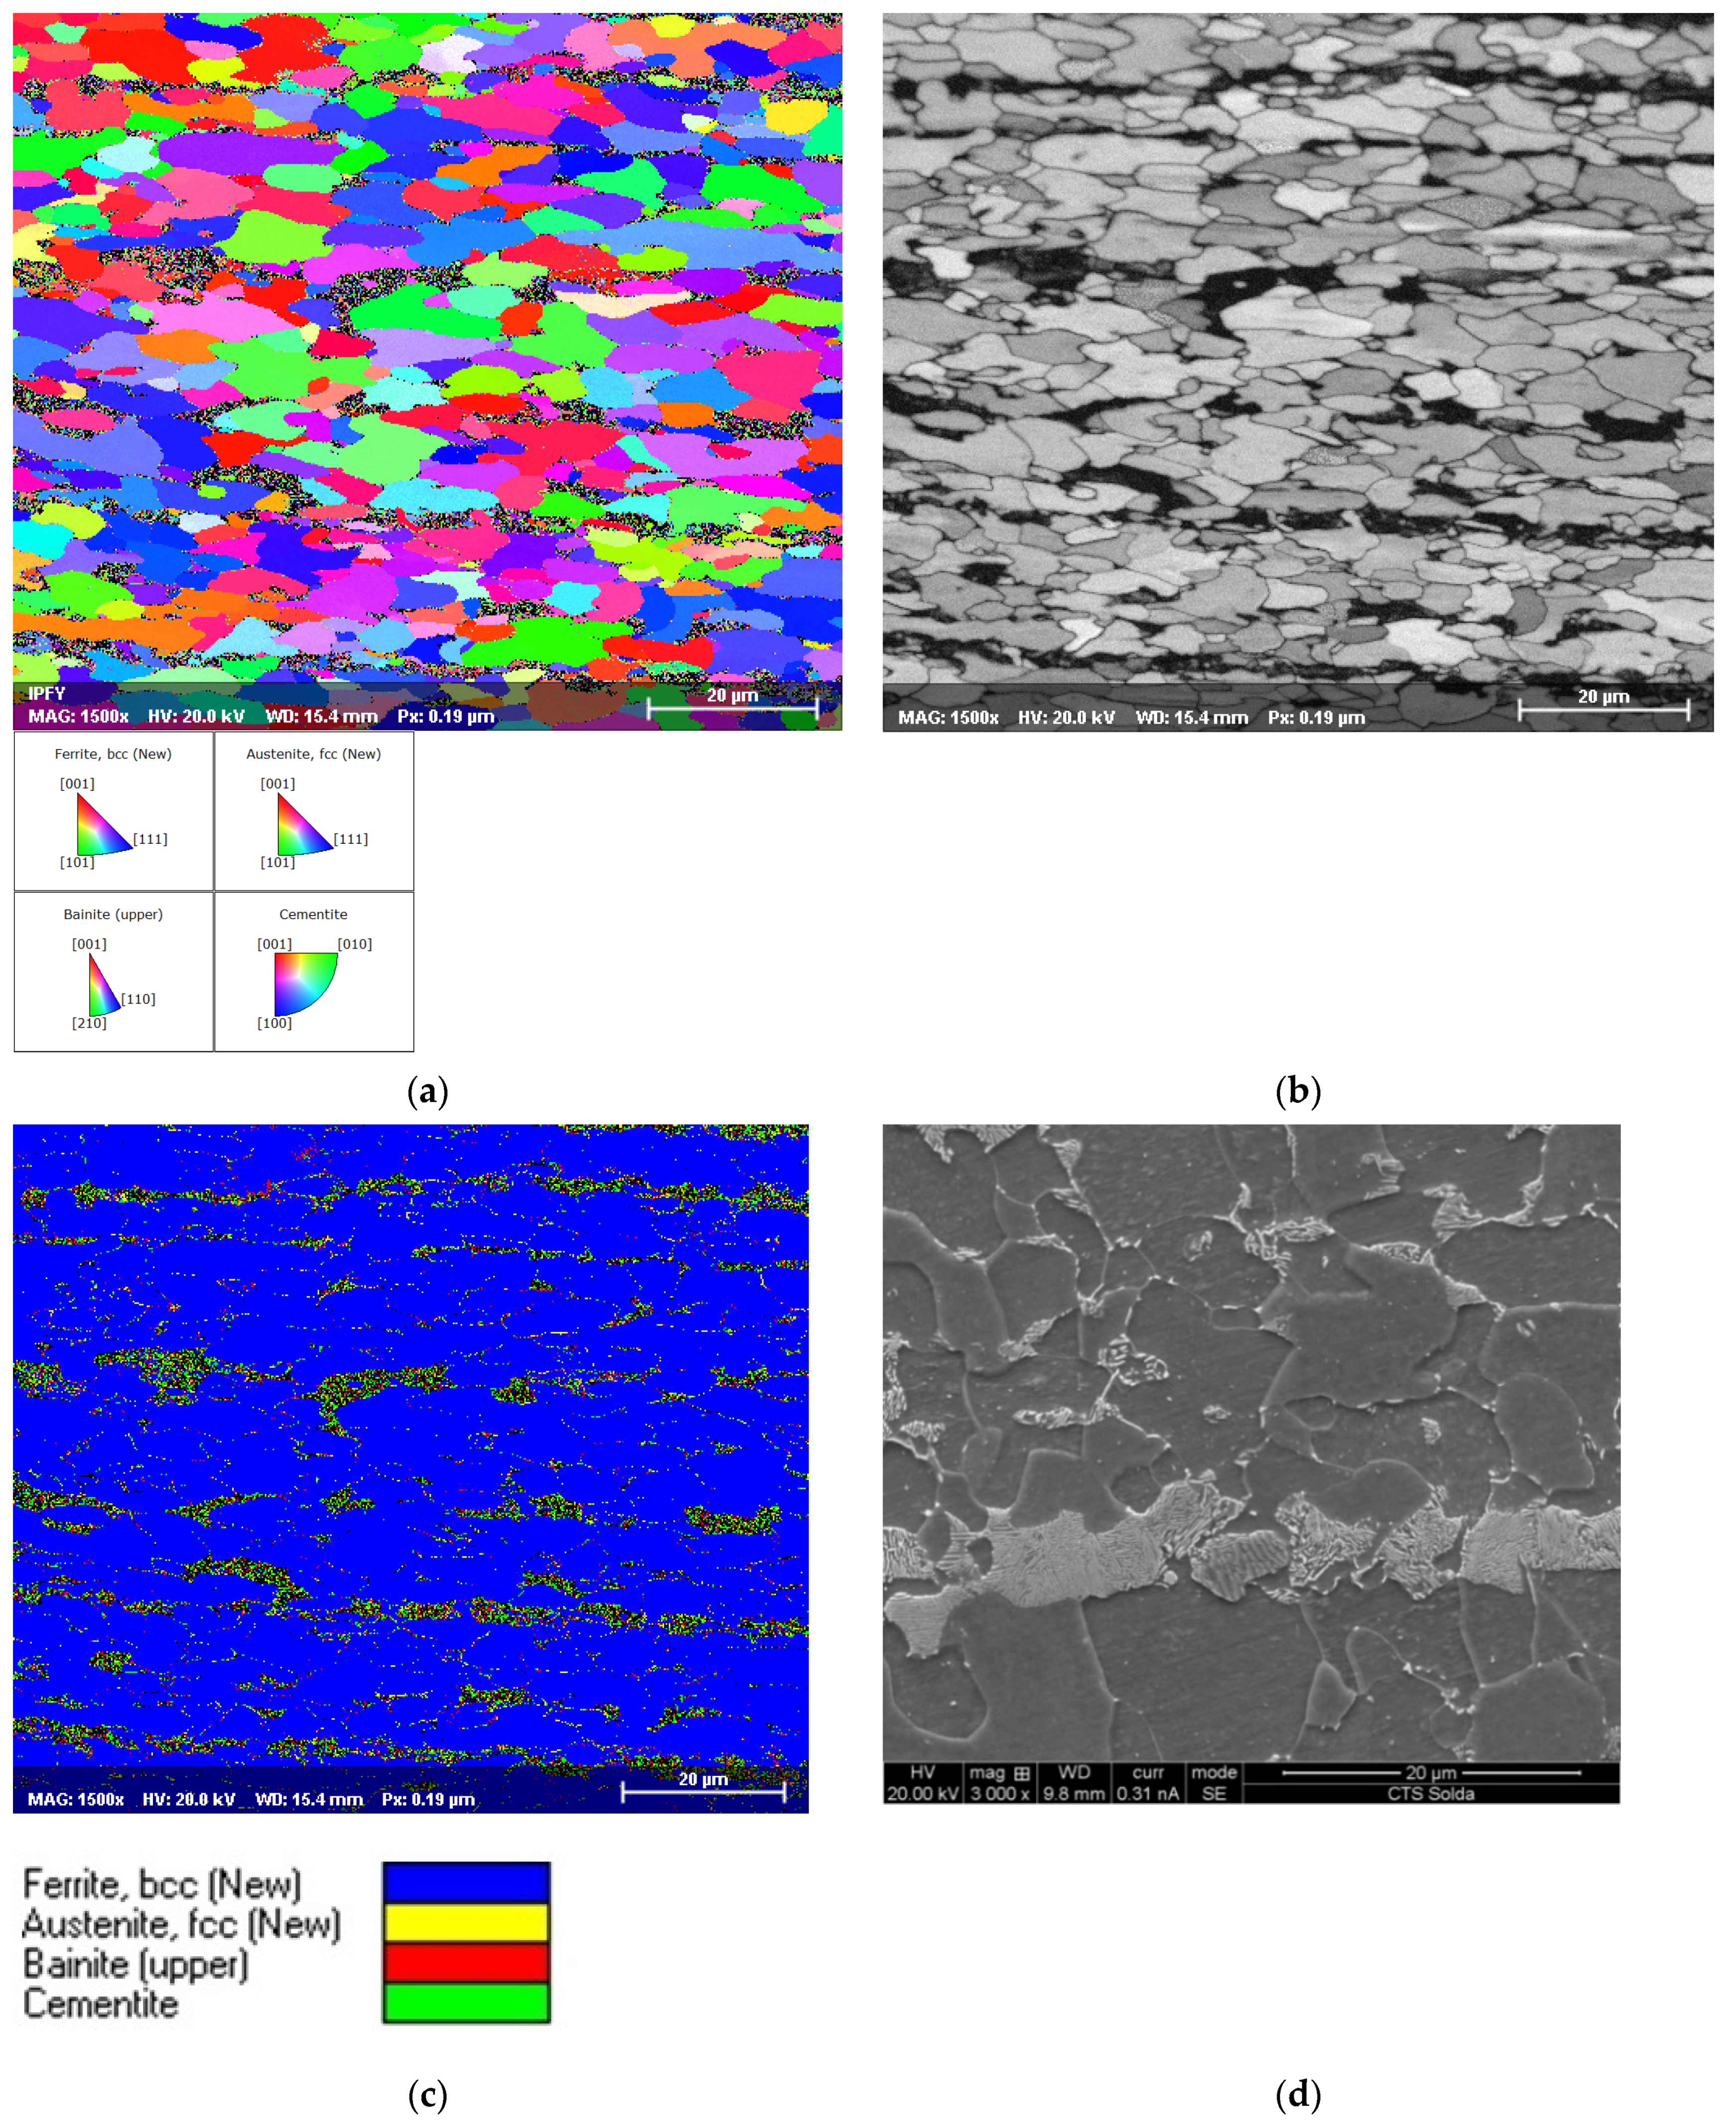
3.1. Microstructure of Base Material Obtained by Thermomechanical Simulation

The microstructure of the base material without thermomechanical simulation obtained with the EBSD technique is shown in Figure 6. Figure 6a shows the inverse pole images (IPF) indicating the crystallographic directions caused by the ferrite, austenite, upper bainite, and cementite. A predominant direction was not evident since orientations of the type 001, 101, 111, and 210 were present throughout the microstructure. In Figure 6b, a predominantly ferritic structure can be observed. The dark regions represent the banding resulting from the thermomechanical treatment of the sheet (Figure 6c), which was composed of phases belonging to bainite, austenite, and cementite as shown in Figure 6b. These phases can also be observed in certain sections of the grain boundaries, but in lesser amounts. The colored areas of the EBSD micrographs in Figure 6a–c that contain the cementite, bainite, and austenite phases are related to the pearlitic and grain boundary zone of Figure 6d. So, it could be said that in the banded areas of the base material, we can find retained austenite that could be forming the martensite–austenite constituent (MA). The microconstituent MA with different morphologies is located mainly in the contours of the anterior austenitic grain, the lathes of other phases, and rarely within the grains [33]. According to the work of Moeinifar et al. [34], the mean diameter of the MA microconstituents in their largest size is, on average, 0.93 µm. MA blocks can be approximately 3 to 5 µm in size according to Davis and King [35] or 1 µm according to You et al. [36].

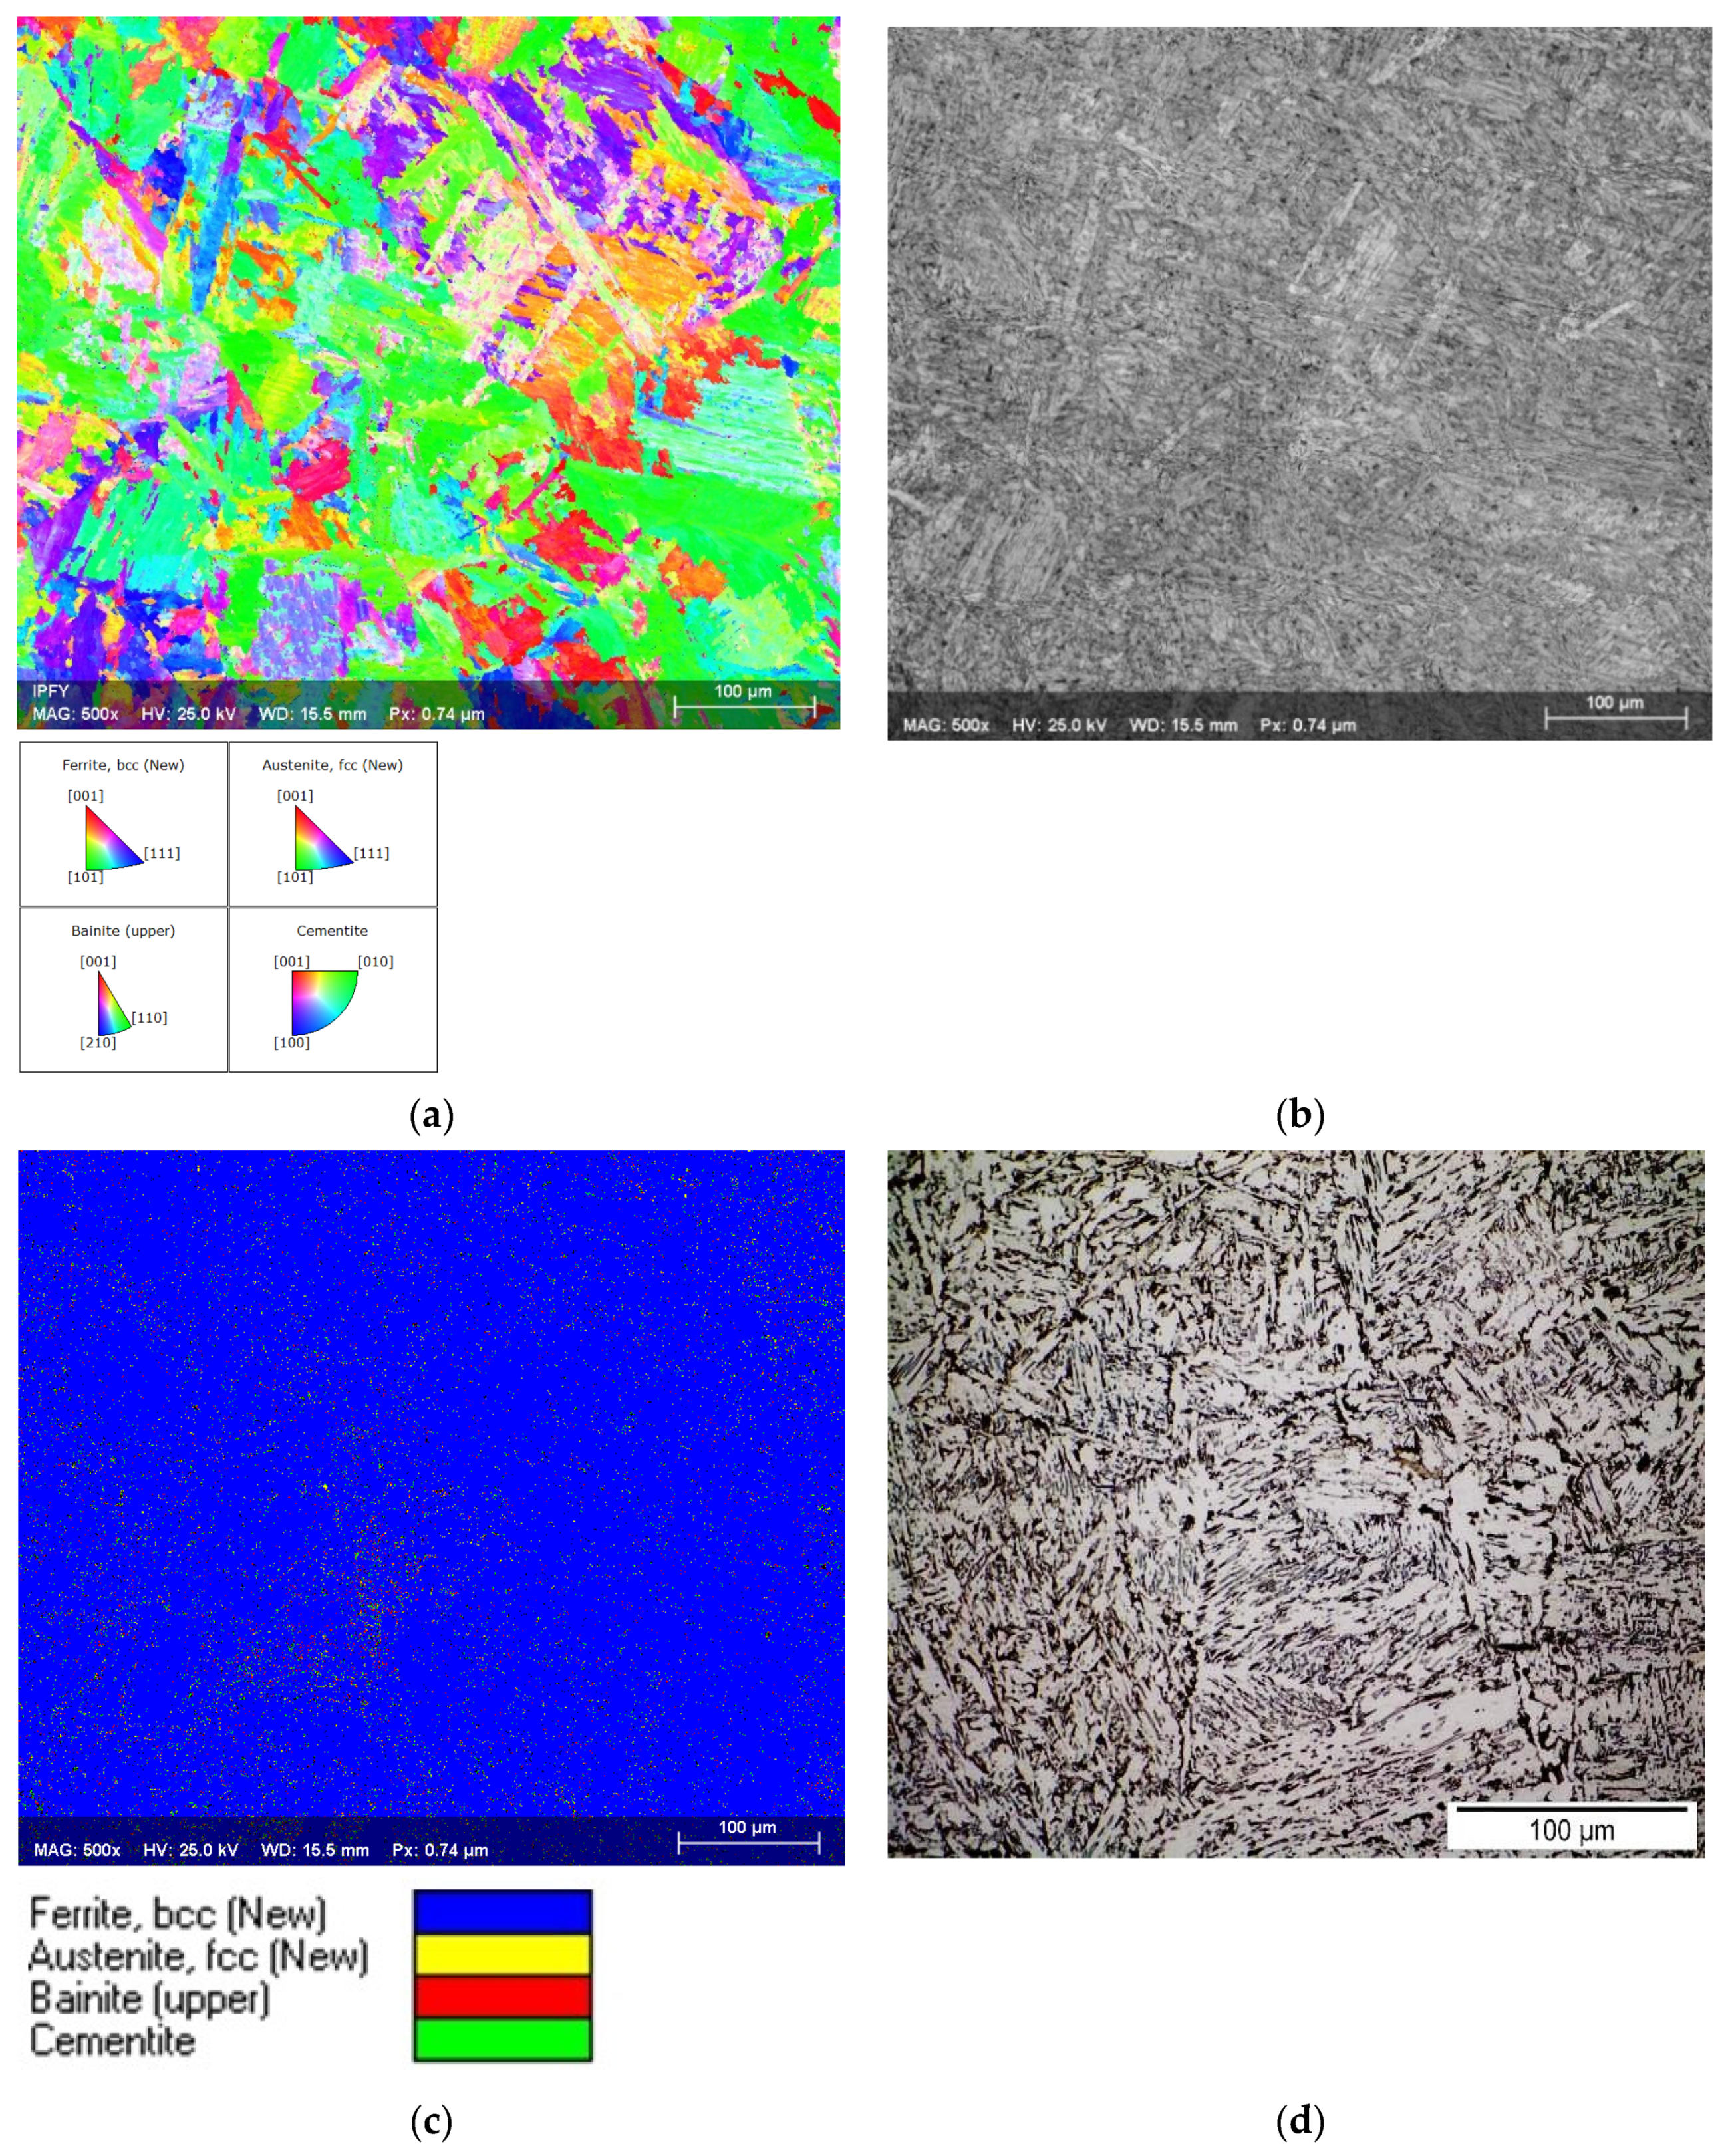
3.2. Microstructure IC CGHAZ Simulated Thermomechanically

The microstructure of the central part of the thermomechanically simulated sample (Figure 1) is a microstructure that would belong to a multipass region of real welding, called IC CGHAZ, which is observed in Figure 7. In the inverse pole figure (Figure 7a), a predominance of crystallographic orientations of 101 for ferrite and austenite, of 110 for upper bainite, and 010 for cementite is observed. In Figure 7a,b, within the initial austenitic grains, phases in elongated lathes are observed oriented according to the crystallographic directions 110 and 210 belonging to a bainitic structure. The phase map of Figure 7c indicates that 95.2% belongs to the ferritic phase. From Figure 7d, we can see that the microstructure belongs to a bainitic structure in the form of blocks with dark phases between the strips of the bainite, phases that belong to austenite, cementite, and bainite as indicated by the phase map in Figure 7c. Steels with low carbon content contain cementite through the matrix as a second dispersed phase [37], due to the excess solubility of carbon in the ferrite.
In Figure 7c, black dots are seen representing 1.37% of zero solutions, which are non-indexed patterns that can indicate an MA microconstituent, precipitates, carbides, or second phases that are located on the edges of the initial austenitic grain and dark phases of a smaller size within them. It was not possible to obtain a good quality of Kikuchi standards from the carbides due to their discontinuities and a high density of dislocations at the respective interfaces [38]. These black areas are regions of higher dislocation density and high residual stresses introduced by significant differences in the coefficient of thermal expansion between the reinforcing particles and the matrix, resulting in a strong dislocation field around the precipitates [39]. These dislocations are regions of greater misorientation that are difficult to index and therefore appear as non-indexed black dots [40].

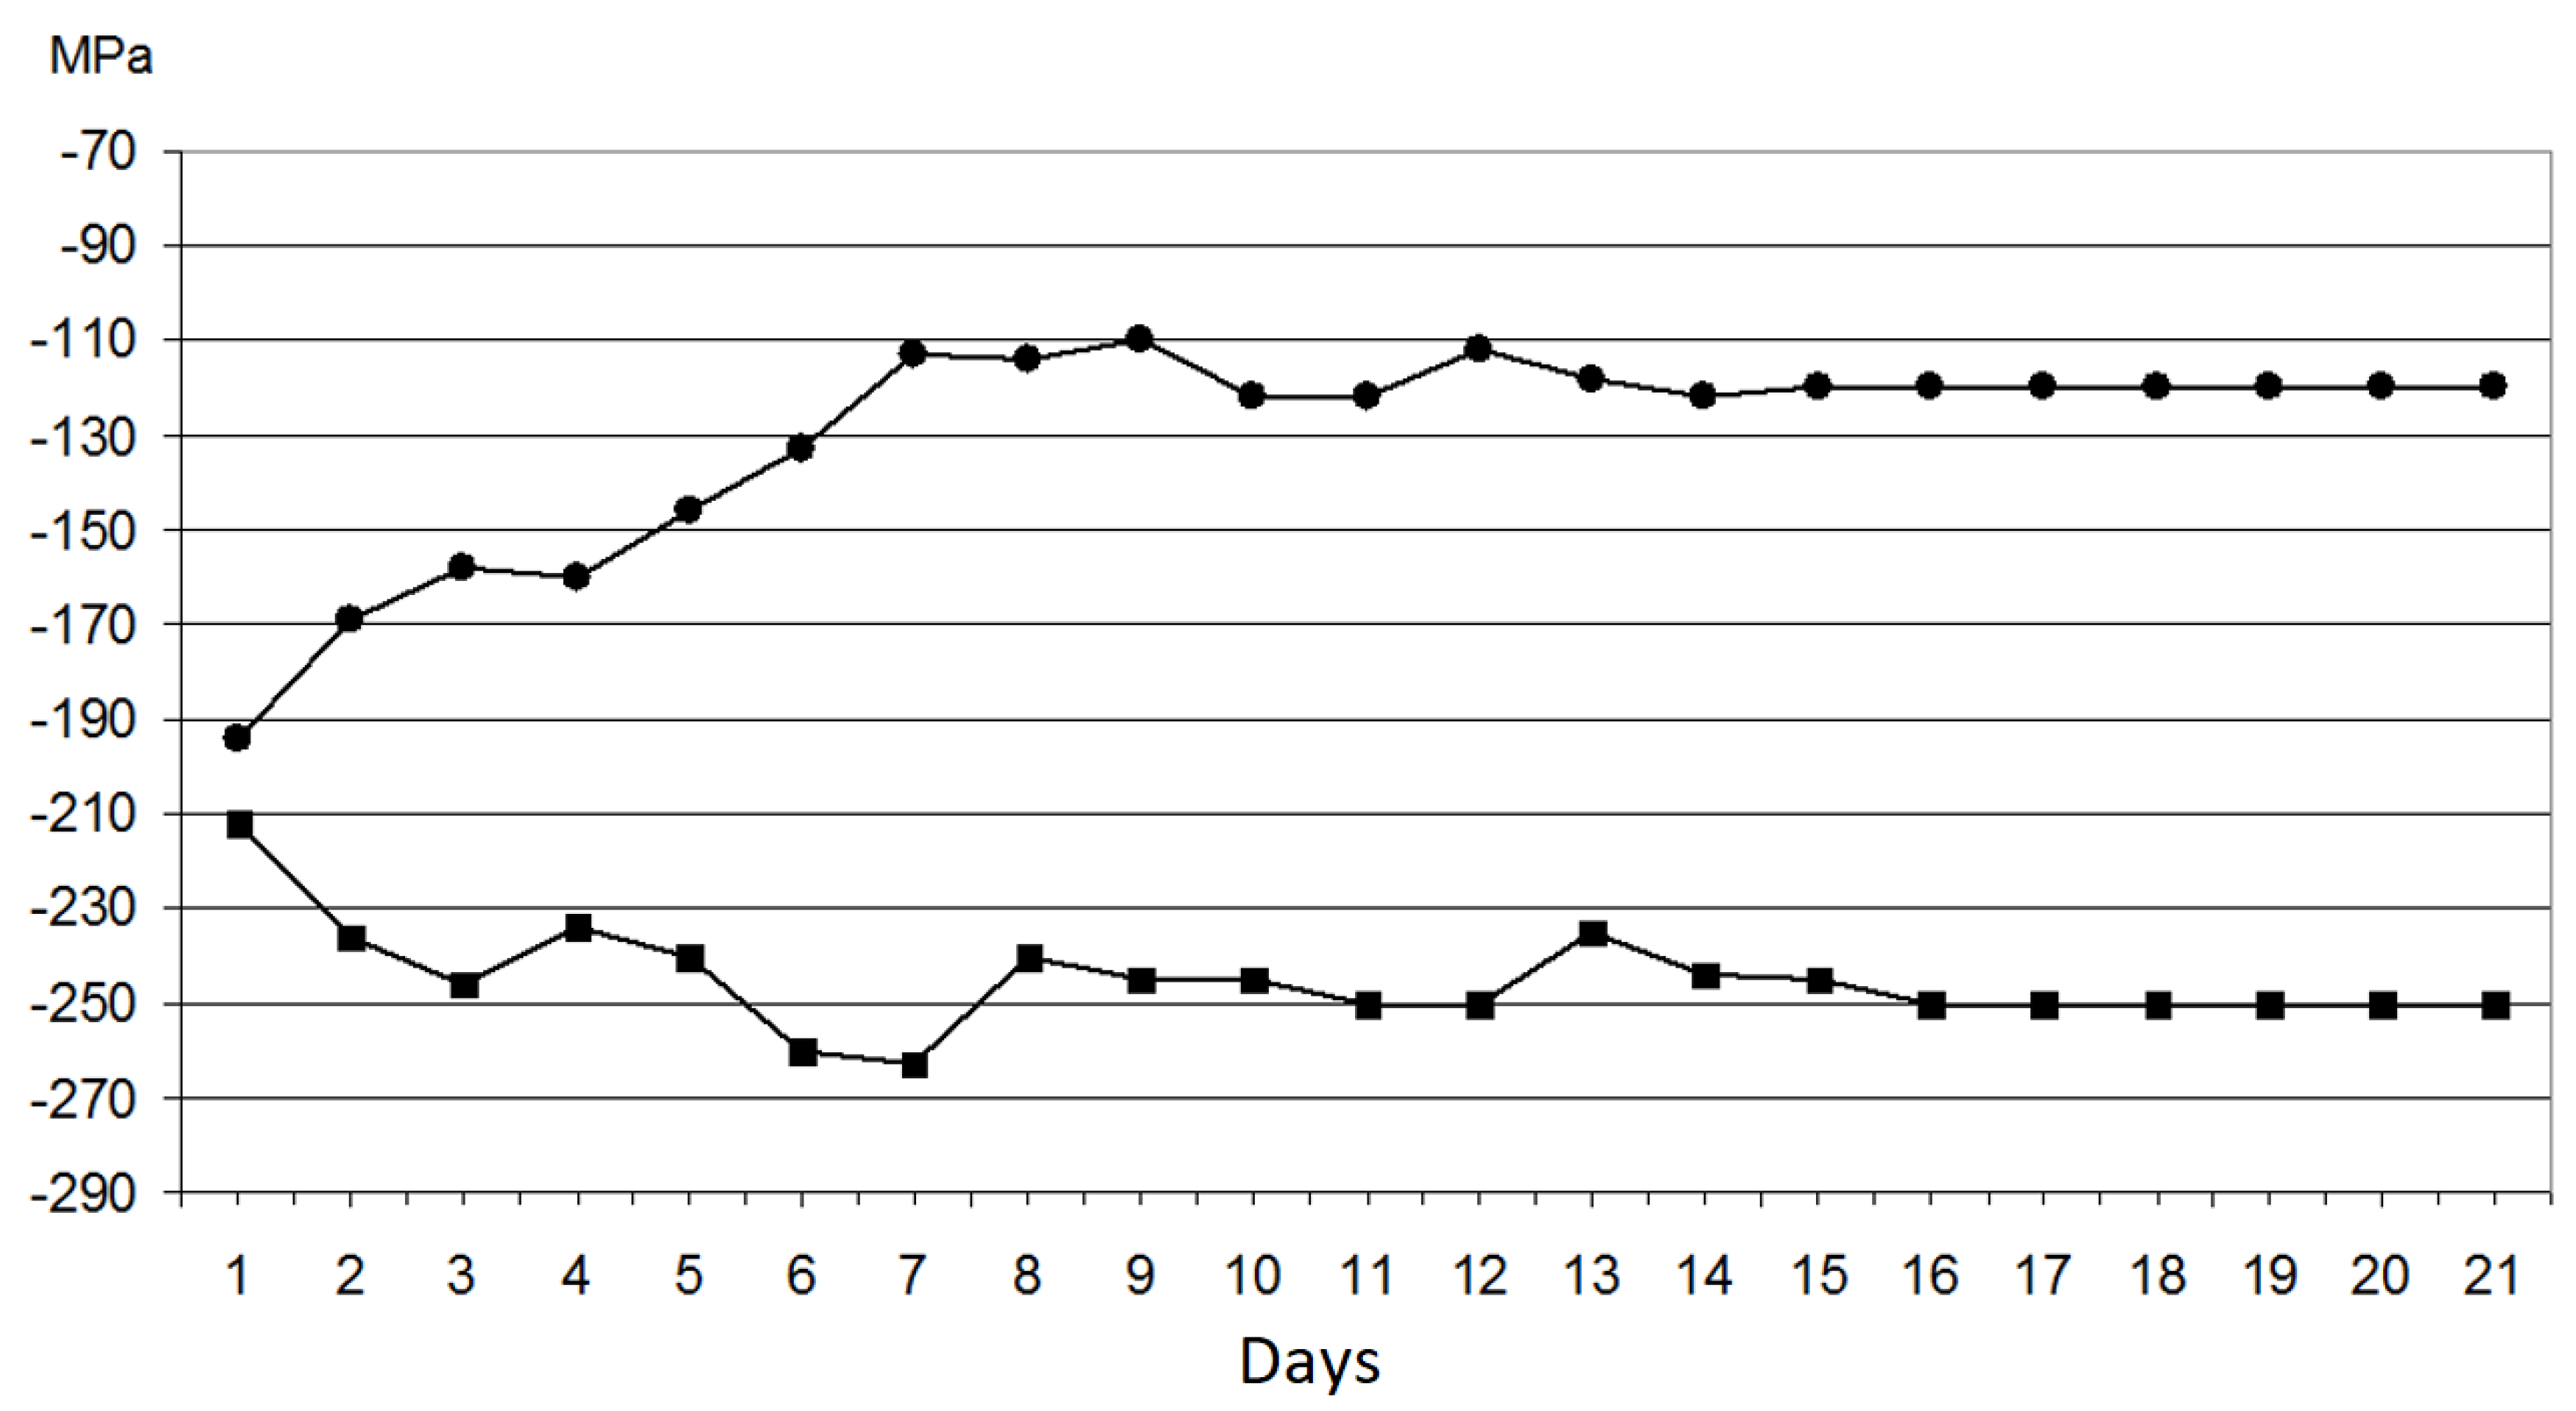
3.3. Redistribution of the Residual Tension

Figure 8 and Table 2 shows the results of residual stress measurements performed on IC CGHAZ and FGHAZ, adjacent to the IC CGHAZ zone areas of the specimen over the 14 monitoring days. Sign “-” denotes compressive stress. The measurements were performed in the longitudinal direction. Although the stress state on the whole is defined as a tensor value, these measurements are sufficient to detect the change of the residual stress state on the analyzed areas for the purposes of this paper.
We observed a decrease in compressive residual stress in the IC CGHAZ area accompanied by an increase of compressive residual stress in the FGHAZ area. This process is not monotonic and has some variations. The initial difference in the values of the stresses on two analyzed areas was 20 MPa, and the final difference was 130 MPa. Stabilization in the process of stress redistribution usually begins from the second week. A two-week stabilization period is normally applied in real welding samples [8,9,10].
In Figure 8, we can see that, in the first days of monitoring, the compressive residual stresses measured in the longitudinal direction in the IC CGHAZ area had a value of 195 MPa and four days later this value became 160 MPa, which represents the absolute value of the residual stress decrease from the first day to the fourth day of observation. In the following sections, we will describe how the fractions of the misorientation values vary from the first to the fourth day after having completed the simulation of the heat affected zone, just as the residual stresses calculated with the X-ray diffraction method vary.

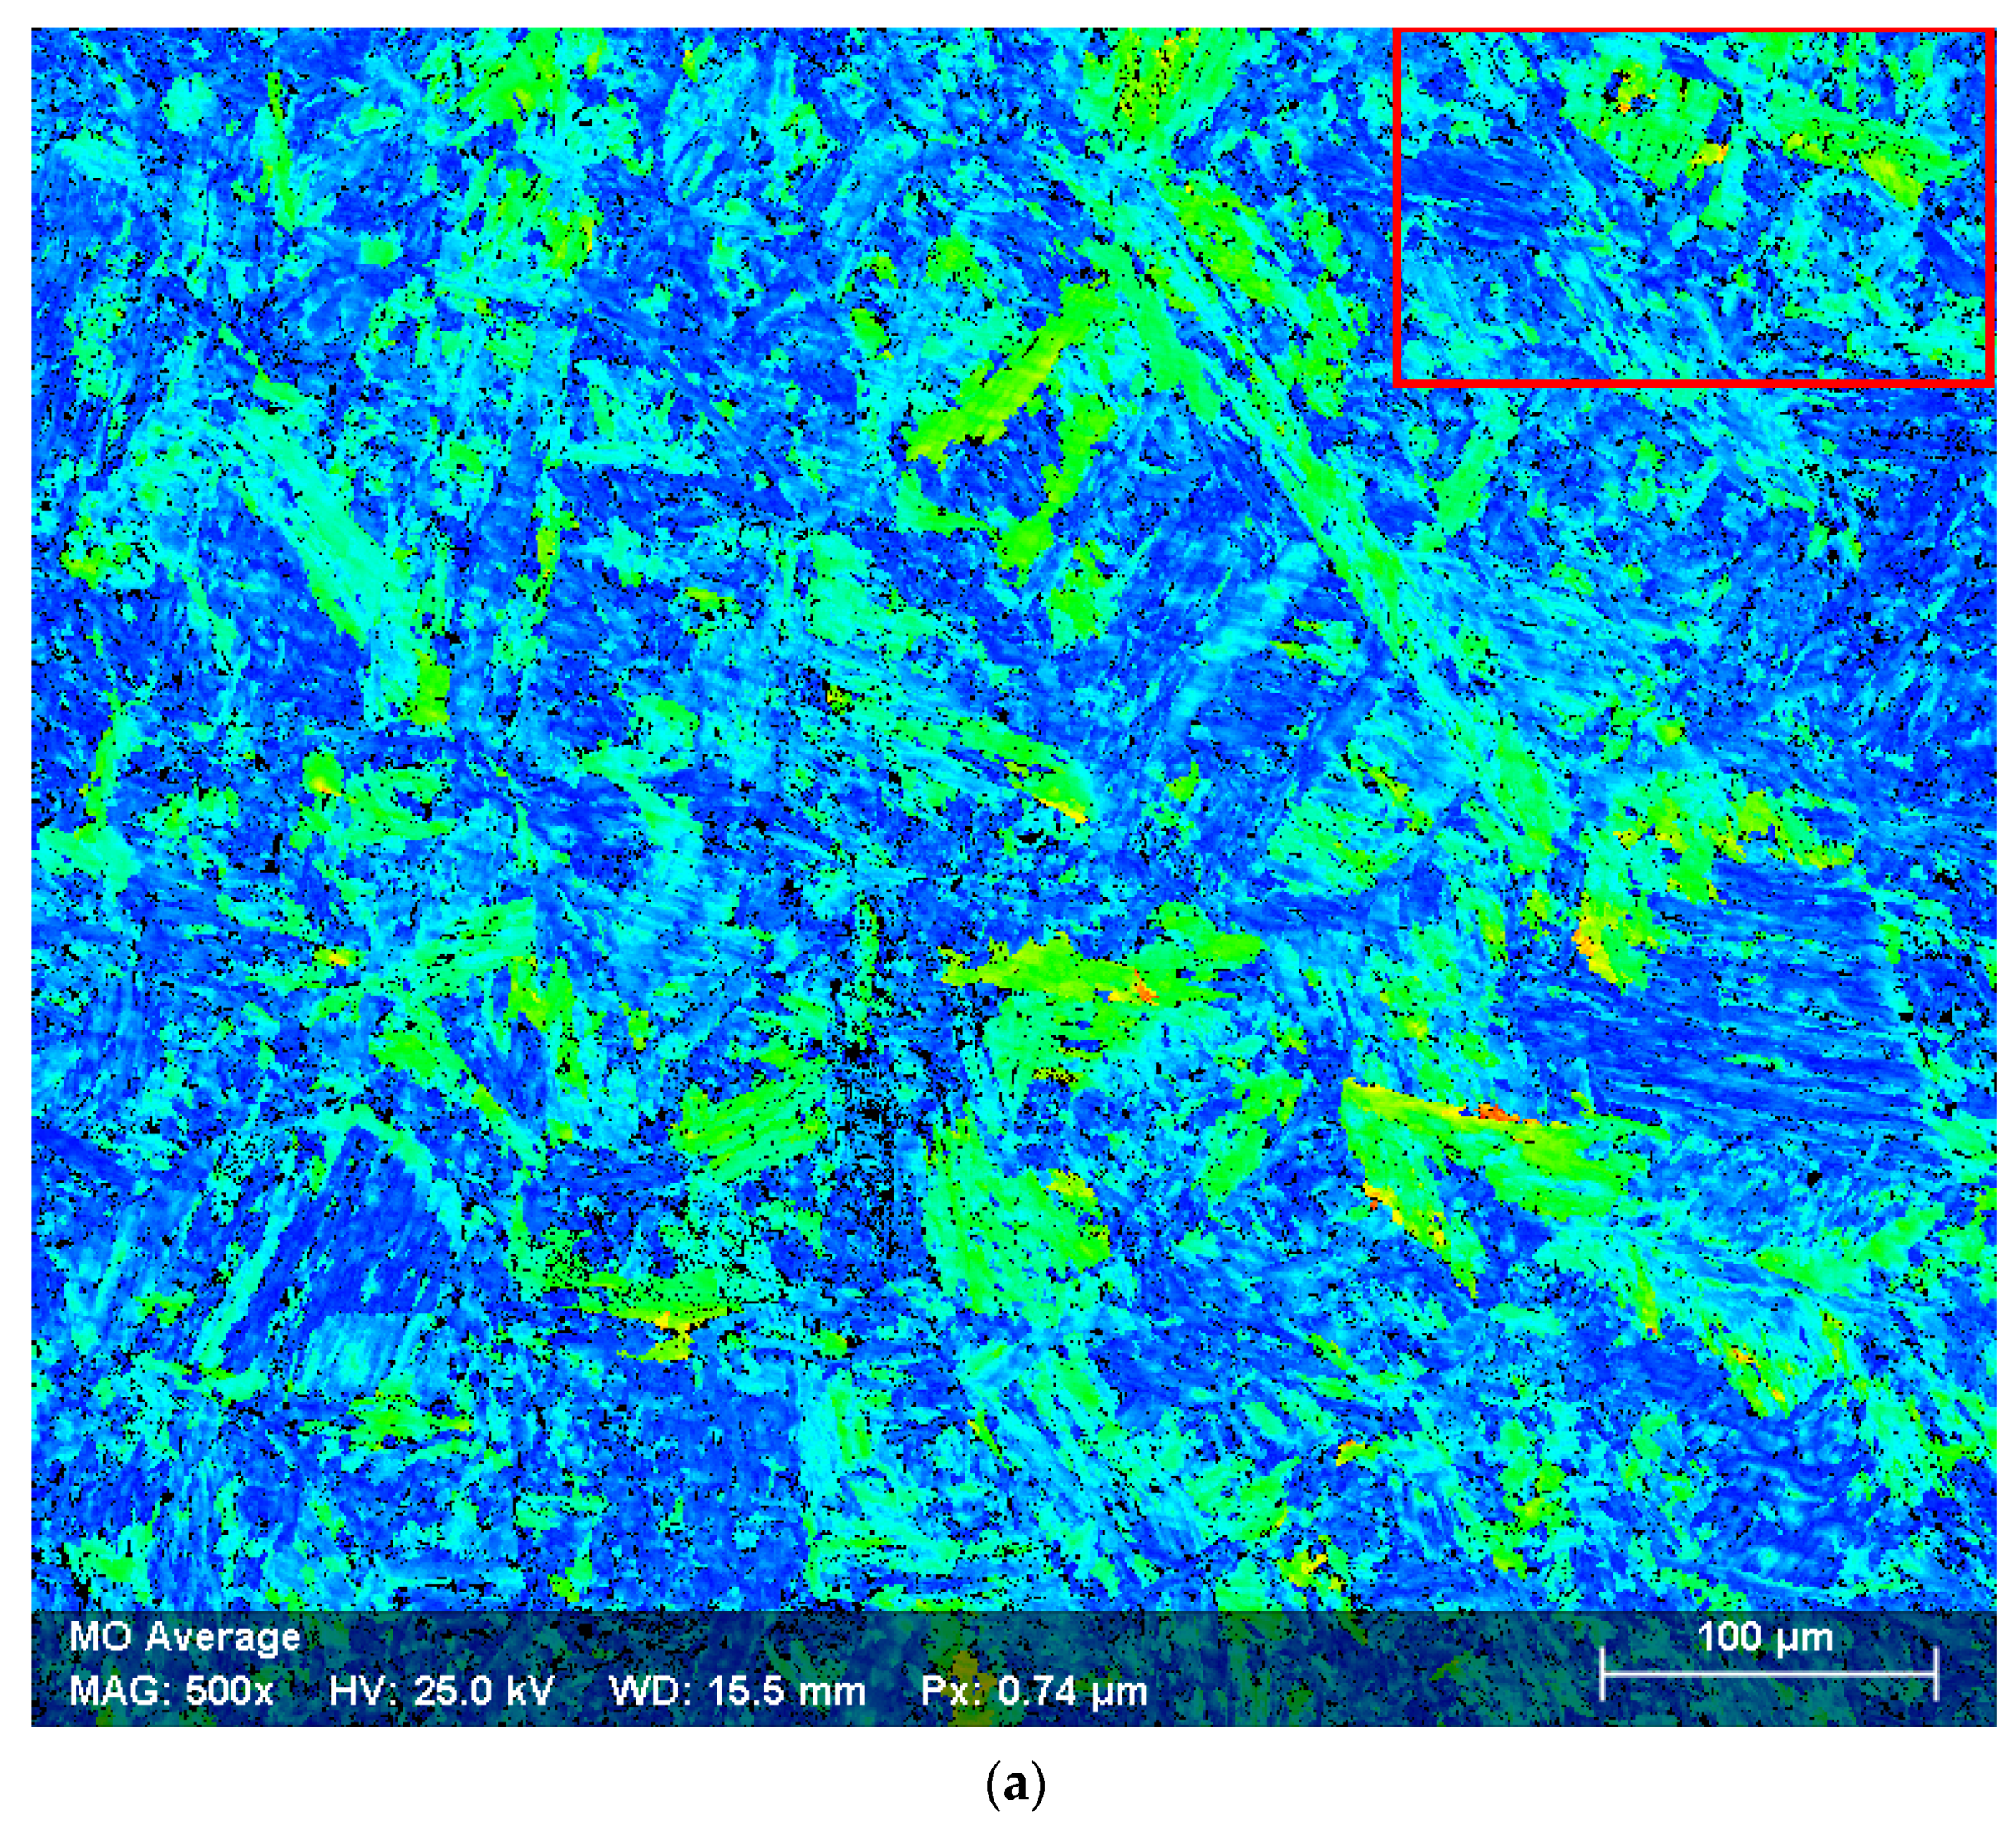
3.4. Redistribution of Misorientation in Microstructure

3.4.1. Redistribution of KAM

The kernel average misorientation (KAM) maps represent the mean misorientation ratio of a given point and the mean orientation of its neighbors with the same grain [41,42]. KAM is designed to show very close local orientation changes. Analysis of the results based on the KAM parameters are presented in Figure 9 and Figure 10. The KAM results give us up to an approximate value of 5 degrees of misorientation and these are considered as low-angle grain contours (LAGBs). This limit on misorientation values was chosen to elucidate the misorientation between the grain boundaries and interior grains [26]. A visible variation of the maximum values of the fraction of the misorientation angles was observed from the first to the fourth day of observation. For example, in Figure 10 it can be seen that, on the first day, there was a fraction of 4% of the KAM values at 1° misorientation and on the fourth day there was a fraction of 7% of the KAM values at 1° misorientation. In heat-affected areas of welded joints, when temperature gradients occur, different internal strains are noticeable, such strains being related to microstructural changes. The presence of LAGB is also considered to be due to incomplete recrystallization [43]. In our case, the redistribution of the residual strain of the IC CGHAZ zone was observed. These areas that are close to the weld beads are subject to higher cooling speeds and consequently large internal strains are present, as seen in Figure 9a, which, after the passage of time, gradually decreased, as can be seen in Figure 9b.

3.4.2. Redistribution of GAM

Grain average misorientation (GAM) maps show the correlated mean misorientation values obtained in a specific grain [44,45] and the degree of intragranular orientation deviation [7]. This means that each measure contained in a grain is assigned the same local misorientation value, but the values vary from one grain to another [16]. GAM excludes some external disturbances and manifests the global orientation deviations within a specific EBSD observational region [46]. This is a typical way to show orientation changes within the grain. Figure 11 and Figure 12 show the results obtained by GAM, and a change in the fraction of the misorientation values can be observed from the first to the fourth day of observation. In Figure 11a, it can be seen in the red box that misorientation angles between values of 12 to 15° dropped to values of 5 to 10° in Figure 11b (according to the GAM color pattern). In Figure 12, we can see that the fraction of GAM values for 2° increased from the first to the fourth day and from 4° the fraction of GAM values decreased from the first to the last day of observation. As mentioned above, these changes in misorientation are related to a change in the concentration of the dislocations over time.

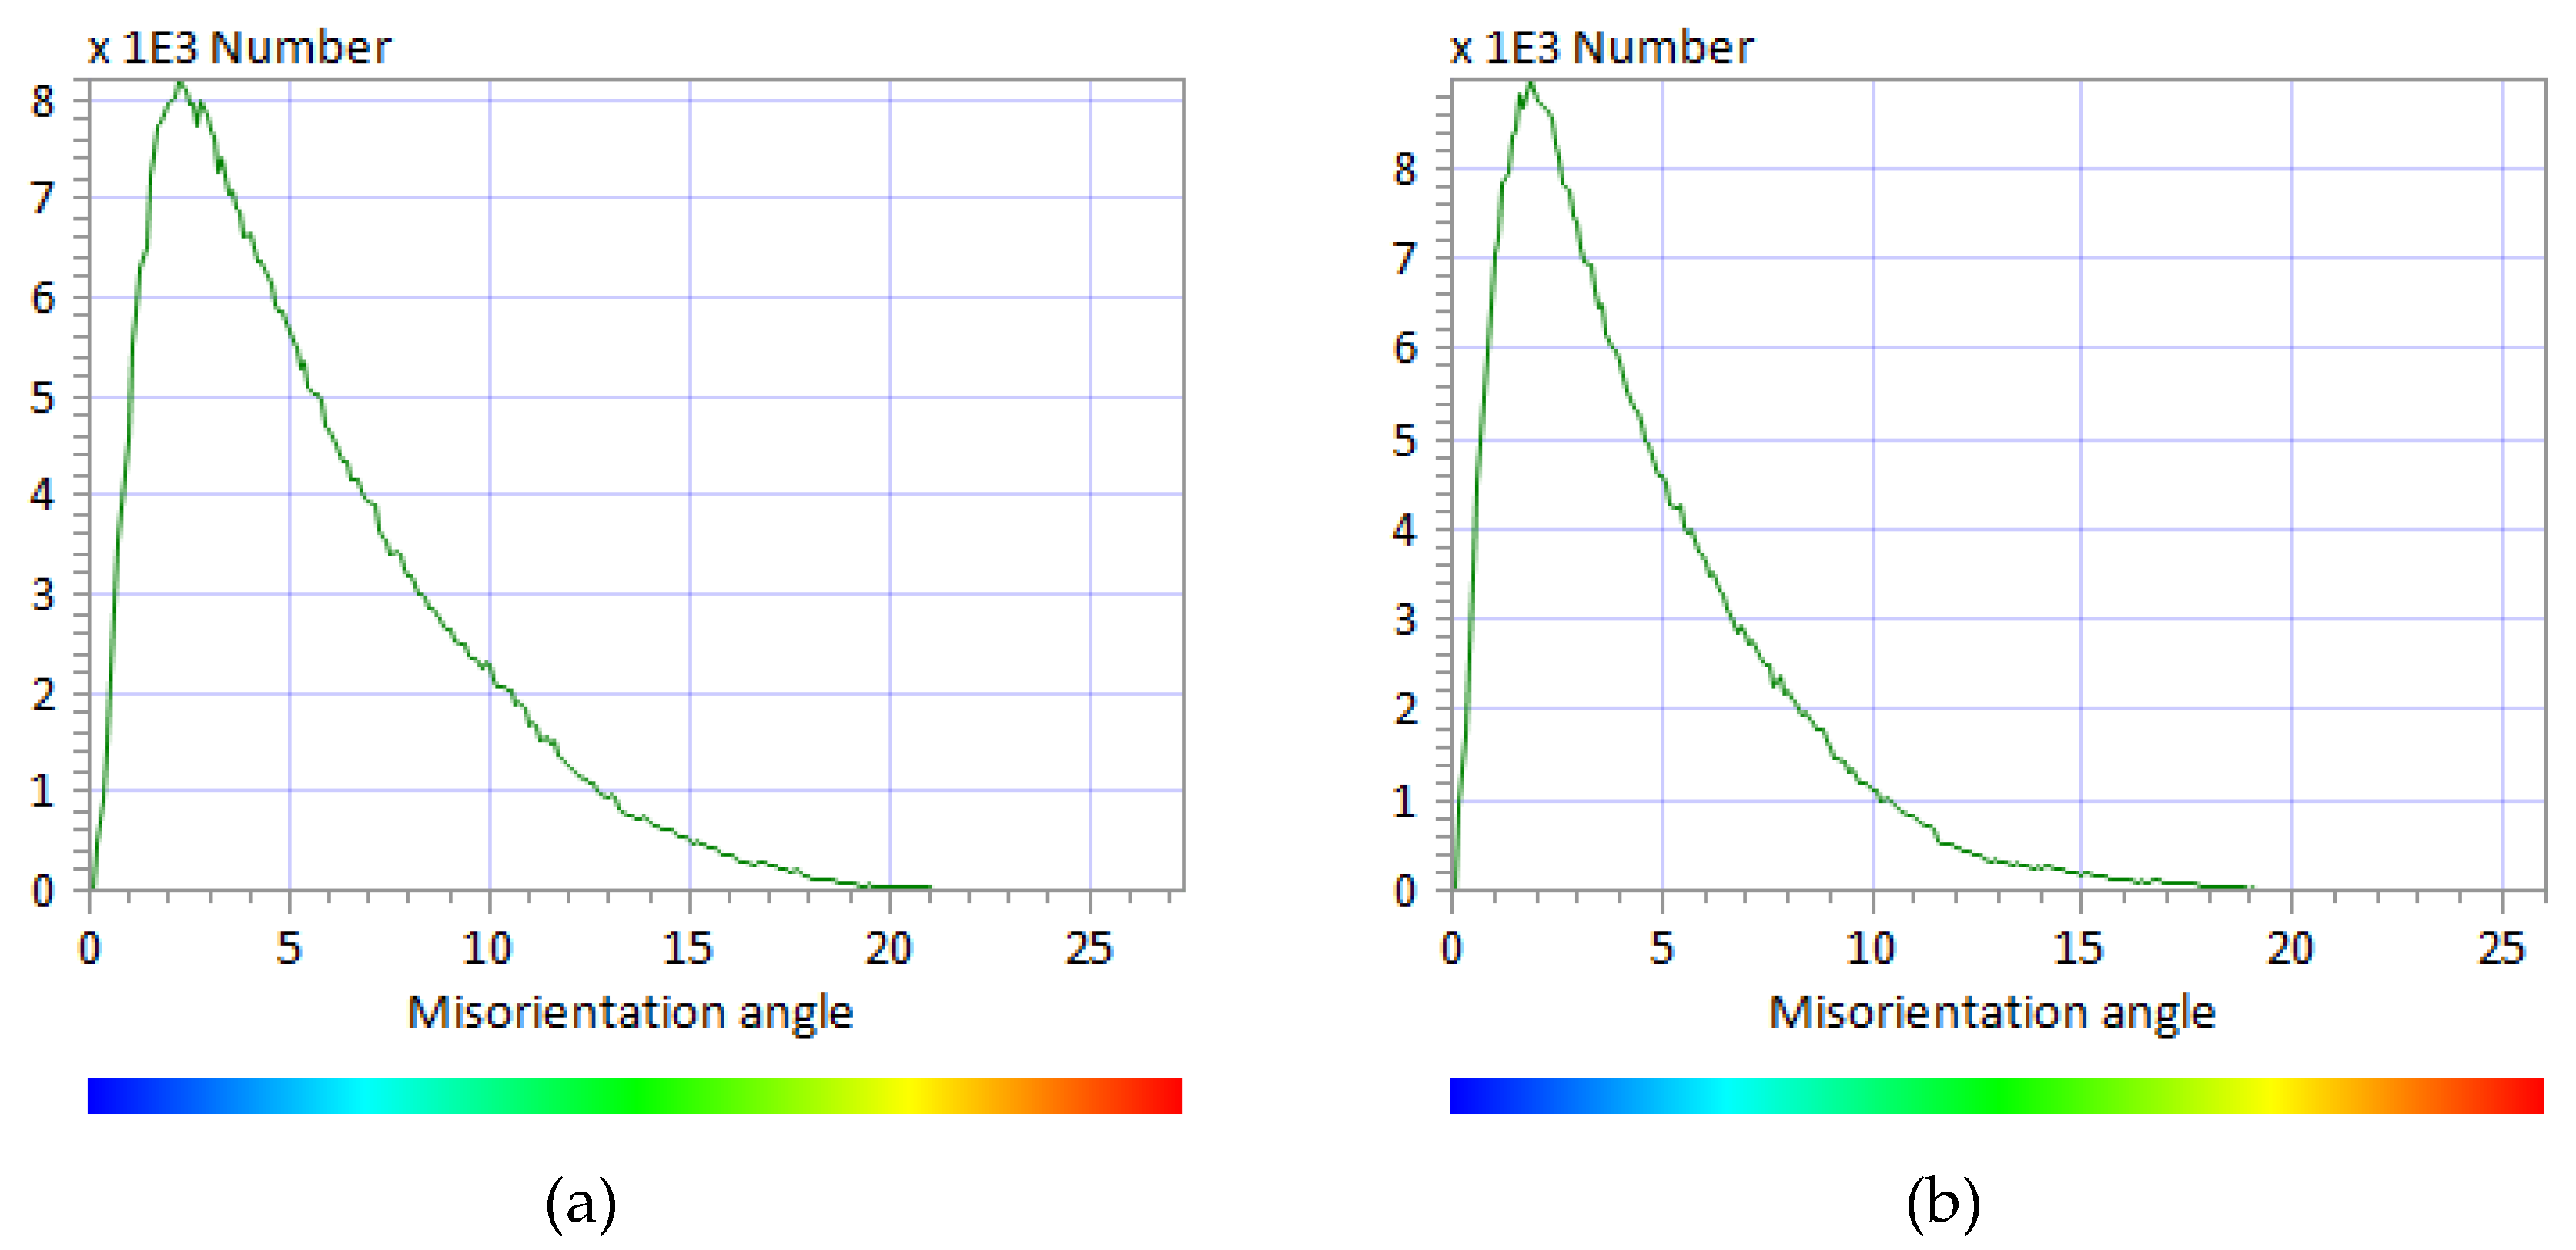
3.4.3. Redistribution of Grain Boundaries

Figure 13 shows the high-angle grain boundaries (HAGBs) in yellow and the low-angle grain boundaries (LAGBs) in blue. Figure 13b shows a greater fraction of the HAGB values > 50° than the fraction of LAGB <15°. The percentage of LAGBs that consist of a series of dislocations decreases at ICHAZ with an increase for the cooling elapsed time, which corresponds to high heat input [22]. The simulated samples of ICHAZ showed a selective orientation of misorientation and an apparently ‘bimodal’ feature [47,48,49]) in the range of 2–15° and 50–62°. The authors of [50] stated that the LAGBs usually distribute between the parallel or thinner grain laths and the HAGBs locate within the prior austenite grain boundaries. It can be determined that the preferred orientation phenomenon occurred during the phase transformation in a different or the same bainite group, which could generate HAGBs or LAGBs at the boundaries of laths, respectively [22]. HAGBs are more mobile than LAGBs due to a higher density of dislocations and a large amount of stored energy [31]. According to Tsuchiyama et al. [51], HAGBs show mobility and a driving force sufficiently large for migration. LAGBs are mobile because their properties depend on the density of dislocations [31].

4. Discussion

4.1. Microstructure of Base Metal and IC CGHAZ

Figure 6, obtained with the EBSD technique, shows us the typical microstructure of a DH36 high-strength steel without physical simulation, which is mainly made up of ferrite accompanied by phases of superior bainite, austenite, and cementite. The black colored zero solutions in Figure 6b,c may represent the martensite of the MA microconstituent, which are smaller than 1 µm in size. In addition to the fact that EBSD may not have indexed microstructures smaller than the step size placed before indexing, microstructures such as martensite that are not present in the EBSD database are also not indexed. Non-indexed regions (represented as dark areas) contain a high density of dislocations [52]. Martensite identification is complicated with EBSD, due to the similar lattice structures of ferrite and martensite [53]. Wright [54] mentions that martensite cannot be indexed using EBSD as martensite has a body centered tetragonal (bct) structure but is only slightly tetragonal. Thus, EBSD cannot reliably identify this tetragonality. The c/a ratio is simply very close to 1, so no information was entered in the data bank to identify martensite. Nowell et al. [55] usually perform this indexing as a body centered cubic (bcc) ferrite structure and then use various approximations to try to differentiate martensite from ferrite based on topographic arguments.
When the two thermal welding cycles were physically simulated, the EBSD technique still detected phases belonging to the ferrite, upper bainite, austenite, and cementite in the same way as was detected for the base material. The difference between these two microstructures is evident: the banding presented in the base material disappeared, the grain size increased, and the distribution of the bainite, cementite, and austenite phases within the ferritic matrix varied (all this can be observed by comparing Figure 6 and Figure 7). In the intercritically reheated coarse grain heat affected zone of an EH36 weld, Tsay et al. [56] observed microstructures such as lower bainite with carbides between those of upper bainite and with retained austenite. In the intercritically reheated heat affected zone of DH36 presented in slab bainite, this type of bainite generally nucleates along the grain boundary of the original austenite and then grows into the interior grain [22]. When the maximum heating temperature is between AC3 and AC1, the superheated austenite decomposes into Widmanstatten ferrite, bainite, and microphases consisting of martensite and retained austenite (MA) [57]. When the cooling time t8/5 is increased, the formation of MA is more pronounced, and due to the semi-diffusive transformation of bainite and a mixture of ferrite and carbide, the formation of granular bainite plays a role in separating slab bainite [22]. Hutchinson et al. [58] obtained, by physical simulation, large grains of polygonal ferrite outlining the contours of the initial austenitic grain and bainitic microstructures with fine cementite particles.

4.2. Redistribution of the Residual Tension vs. the Misorientation

The study of the variation of the crystallographic orientation and the local strain gradient for the prediction of stress relief is crucial [38]. Many studies have shown a good correlation between the degree of misorientation and macroscopic strain in the material [59]. The results of our research work have shown a variation of the residual welding stress (Figure 8) obtained with X-ray diffraction and a variation of the misorientation of grain contours (Figure 9, Figure 10, Figure 11 and Figure 12) obtained with the methods KAM and GAM. Since misorientation relates microstructural deformation to high- and low-angle grain boundary dislocations, and residual stresses are the result of the concentration of dislocations within different regions of the microstructure, there is an obvious relationship for this variation obtained with the experimental methods used, due to the rearrangement of the dislocations after immediately having completed the welding process and through time where the stabilizing of residual stresses occurs, as obtained in the works of Estefen [8] and Gurova [9,10].
According to studies realized by Wright et al. [16], the residual deformation is manifested as a variation in the orientation of the network, and Han et al. [60] indicate that with increasing strain there is an increase in the density of low-angle grain boundaries. Therefore, local misorientations provide an indication of the residual strain distribution in polycrystalline materials and for their characterization KAM-based methods are suitable [16]. Therefore, the KAM is often used as a qualitative measure of plastic deformation localization [25]. Orientation gradients can be correlated with geometrically necessary dislocations (GND) [61], which are generated to accommodate local incompatibilities within crystallographic parameters [16,62] and orientation gradients which are related to plastic deformation [63] and to correspond to the applied macroscopic strain when averaged over multiple grains or entire measurement fields [64]. The development of misorientation within the grain can be attributed to the high density of dislocations [65]. Regions with high concentrations of LAGB correspond to areas with a high concentration of dislocations [66]. The KAMs obtained in Figure 10 show that a large concentration of LAGBs was in the range of 1 to 2° of misorientation and over time the dislocations moved and changed the internal strain. The results indicate that the glide of the dislocations gives way to the reorganization of the LAGBs and HAGBs. When the deformation progresses, the misorientation across a specific sub-structural boundary will increase [25]. Thus, the initial dislocation cell structure created by the low-angle dense dislocation wall will evolve into sub-grain boundaries and eventually into new high-angle grain boundaries [25]; the HAGBs are effective barriers for dislocation motion [67]. Experimental results illustrated high KAM values near grain boundaries at lower strain levels, while a wider distribution in KAM values outside the grain boundaries was observed in larger strains [62]. At high strains, due to highly misoriented grains and the formation of submicron dislocation structures, it is crucial to choose the correct step size [62]. For the four-day observation period inside the SEM chamber, the same step size was used, ruling out that this had influenced the change in the misorientation values of the thermomechanically simulated microstructure.
In the GAM results, large changes in principle were found in the LAGBs from 2° to 10°, and as indicated in the literature, these changes in misorientation are related to a change in the concentration of the dislocations, in this case, over time. As great dislocations densities develop within the material, the residual strain is represented as local variations in the lattice orientation for GAM [68]. GAM maps for misorientations between 0° and 2° can be employed to estimate the internal energy or dislocation density, qualitatively, where the higher GAM values show higher dislocation densities [69]. According to Hou et al. [70], the regions close to the fusion zone, such as coarse-grained ones, present high GAM values. Recrystallization is related to LAGBs, and these values can be obtained using GAM maps [71]. The GAM evolution for the deformed material showed higher values than the initial annealed condition because of the significant number of dislocations [68]. When the deformation occurs and progressively increases, some grains with lower GAM values are distributed around grains with higher values [68]. When the GAM values obtained over many grains of a scanned area are averaged out, they can be correlated with macroscopic values of plastic deformation [72]. The decrease in misorientation obtained with GAM and the residual stresses clearly shows the effect of the role of the microstructure on the mechanical behavior of the welded joints [45]. Research related to GAM indicates that these values are influenced by the step size [72]; for the purposes of the research carried out, the step size remained constant during the 4 days of observation.

5. Conclusions

It was observed that there was a redistribution of residual stresses, as well as a redistribution of misorientation in the IC CGHAZ area, four days after having carried out the thermomechanical simulation. The main results can be summarized as follows:
(a)
For the residual stresses, a decrease in residual compression stresses in the range of 196 MPa to 160 MPa was noted.
(b)
For 1° of misorientation in KAM, on the first day the fraction values were 4% and on the fourth day the fraction values increased to 7%.
(c)
For the misorientation in GAM, the fraction values for 2° increased from the first to the fourth day and for 4° the fraction values decreased from the first to the fourth day.
(d)
The high-angle grain contours and the low-angle grain contours showed rearrangement due to a rearrangement of the dislocations over time; these changes were related to the change in residual stresses that, after two weeks, stabilized.

Author Contributions

The first draft of the paper was written by G.S.C., the analysis of the final results in X-ray diffraction was done by A.L. and T.G., analysis of the equipment of the thermomechanical simulation, SEM, and EBSD was done by L.S.G. and S.B.P., and the final editing was done by S.F.E. and G.S.C. All authors have read and agreed to the published version of the manuscript.

Funding

The authors acknowledge the funding from scholarship PRH03 Petrobras for G.S.C., the Brazilian Research Council (CNPq)—Research Projects 456319/2013-1, PQ 305657/2017-8 funded to S.F.E. and Scholarship nº 124550/2018-5 to T.G., and the funding from the Fundação de Amparo à Pesquisa do Estado do Rio de Janeiro (FAPERJ) to T.G., and the funding from E-26/202.600/2019 (246899) to S.F.E.

Data Availability Statement

Not applicable.

Acknowledgments

The authors are grateful to Stuart I. Wright from EDAX-TSL Company for his comments on microstructure analysis using EBSD techniques. Special thanks to the SENAI Institute of Rio de Janeiro and the GURTEQ Company for providing the use of GLEEBLE, SEM-EBSD, and RAYSTRESS to perform this research work.

Conflicts of Interest

The authors declare no conflict of interest.

References

  1. Masubuchi, K. Analysis of Welded Structures Residual Stresses, Distortion, and Their Consequences, 1st ed.; Pergamon Press: Cambridge, UK, 1980; p. 3. [Google Scholar] [CrossRef]
  2. Pillai, R.; Chyrkin, A.; Quadakkers, W.J. Modeling in High Temperature Corrosion: A Review and Outlook. Oxid. Met. 2021, 96, 385–436. [Google Scholar] [CrossRef]
  3. Cruz, V.; Chao, Q.; Birbilis, N.; Fabijanic, D.; Hodgson, P.; Thomas, S. Electrochemical studies on the effect of residual stress on the corrosion of 316L manufactured by selective laser melting. Corros. Sci. 2020, 164, 108314. [Google Scholar] [CrossRef]
  4. Chai, D.; Ma, G.; Zhou, S.; Jin, Z.; Wu, D. Cavitation erosion behavior of Hastelloy™ C-276 weld by laser welding. Wear 2019, 420, 226–234. [Google Scholar] [CrossRef]
  5. Bi, Y.; Yuan, X.; Lv, J.; Bashir, R.; Wang, S.; Xue, H. Effect of Yield Strength Distribution Welded Joint on Crack Propagation Path and Crack Mechanical Tip Field. Materials 2021, 14, 4947. [Google Scholar] [CrossRef]
  6. Nishimura, R.; Ma, N.; Liu, Y.; Li, W.; Yasuki, T. Measurement and analysis of welding deformation and residual stress in CMT welded lap joints of 1180 MPa steel sheets. J. Manuf. Process. 2021, 72, 515–528. [Google Scholar] [CrossRef]
  7. Wang, Y.; Feng, G.; Pu, X.; Deng, D. Influence of welding sequence on residual stress distribution and deformation in Q345 steel H-section butt-welded joint. J. Mater. Sci. Technol. 2021, 13, 144–153. [Google Scholar] [CrossRef]
  8. Estefen, S.F.; Gurova, T.; Werneck, D.; Leontiev, A. Welding stress relaxation effect in butt-jointed steel plates. Mar. Struct. 2012, 29, 211–225. [Google Scholar] [CrossRef]
  9. Gurova, T.; Estefen, S.F.; Leontiev, A.; Oliveira, F.A.L. Welding residual stresses: A daily history. Sci. Technol. Weld. Join. 2015, 20, 616–621. [Google Scholar] [CrossRef]
  10. Gurova, T.; Estefen, S.F.; Leontiev, A.; Barbosa, P.T.; Oliveira, F.A.L. Time-dependent redistribution behavior of residual stress after repair welding. Weld. World 2017, 61, 507–515. [Google Scholar] [CrossRef]
  11. Taylor, G.I. The mechanism of plastic deformation of crystals. Part II. Comparison with observations. Proc. Roy. Soc. A 1984, 145, 388–404. [Google Scholar] [CrossRef]
  12. Orowan, E. Problems of Plastic Gliding. Proc. Phys. Soc. 1940, 52, 8–22. Available online: http://iopscience.iop.org/0959-5309/52/1/303 (accessed on 23 April 2021). [CrossRef]
  13. Love, A.E.H. A Treatise on the Mathematical Theory of Elasticity, 1st ed.; Cambridge: Cambridge, UK, 1892. [Google Scholar]
  14. François, D.; Pineau, A.; Zaoui, A. Mechanical Behaviour of Materials, Micro and Macroscopic Constitutive Behaviour, 1st ed.; Springer: Dordrecht, The Netherlands, 2012. [Google Scholar] [CrossRef] [Green Version]
  15. Fan, H.; Wang, Q.; El-Awady, J.A.; Raabe, D.; Zaiser, M. Strain rate dependency of dislocation plasticity. Nat. Commun. 2021, 12, 1845. [Google Scholar] [CrossRef] [PubMed]
  16. Wright, S.I.; Nowell, M.M.; Field, D.P. A review of strain analysis using electron backscatter diffraction. Microsc. Microanal. 2011, 17, 316–329. [Google Scholar] [CrossRef] [PubMed]
  17. Merriman, C.C.; Field, D.P.; Trivedi, P. Orientation dependence of dislocation structure evolution during cold rolling of aluminum. Mater. Sci. Eng. A 2008, 494, 28–35. [Google Scholar] [CrossRef]
  18. Kundu, A.; Field, D.P. Geometrically Necessary Dislocation Density Evolution in Interstitial Free Steel at Small Plastic Strains. Metall. Mater. Trans. A 2018, 49, 3274–3282. [Google Scholar] [CrossRef]
  19. Furuhara, T.; Chiba, T.; Kaneshita, T.; Wu, H.; Miyamoto, G. Crystallography and Interphase Boundary of Martensite and Bainite in Steels. Metall. Mater. Trans. A 2017, 48, 2739–2752. [Google Scholar] [CrossRef]
  20. Filho, I.S.; Sandim, M.J.R.; Ponge, D.; Sandim, H.; Raabe, D. Strain hardening mechanisms during cold rolling of a high-Mn steel: Interplay between submicron defects and microtexture. Mater. Sci. Eng. A 2019, 754, 636–649. [Google Scholar] [CrossRef]
  21. Tomota, Y.; Ojima, M.; Harjo, S.; Gong, W.; Sato, S.; Ungár, T. Dislocation densities and intergranular stresses of plastically deformed austenitic steels. Mater. Sci. Eng. 2019, 743, 32–39. [Google Scholar] [CrossRef]
  22. Zhang, S.; Liu, W.; Wan, J.; Misra, R.; Wang, Q.; Wang, C. The grain size and orientation dependence of geometrically necessary dislocations in polycrystalline aluminum during monotonic deformation: Relationship to mechanical behavior. Mater. Sci. Eng. A 2020, 775, 138939. [Google Scholar] [CrossRef]
  23. Shawish, S.E.; Cizelj, L.; Simonovski, I. Misorientation Effects in an Anisotropic Plasticity Finite Element Model of a Polycrystalline under Tensile Loading. In Proceedings of the 21st International Conference Nuclear Energy for New Europe, Ljubljana, Slovenia, 5–7 September 2012; Nuclear Society of Slovenia: Ljubljana, Slovenia, 2012; pp. 602.1–602.8. [Google Scholar]
  24. Porter, D.A.; Easterling, K.E.; Sherif, M.Y. Phase Transformations in Metals and Alloys, 3rd ed.; CRC Press Book: Boca Raton, NY, USA, 2009; pp. 122–126. ISBN 9781420062106. [Google Scholar]
  25. Lehto, P. Adaptive domain misorientation approach for the EBSD measurement of deformation induced dislocation sub-structures. Ultramicroscopy 2021, 222, 113203. [Google Scholar] [CrossRef]
  26. Li, J.-S.; Cheng, G.-J.; Yen, H.-W.; Yang, Y.-L.; Chang, H.-Y.; Wu, C.-Y.; Wang, S.-H.; Yang, J.-R. Microstrain and boundary misorientation evolution for recrystallized super DSS after deformation. Mater. Chem. Phys. 2020, 246, 122815. [Google Scholar] [CrossRef]
  27. Nolze, G.; Winkelmann, A. About the reliability of EBSD measurements: Data enhancement. In IOP Conference Series: Materials Science and Engineering; IOP Publishing: Bristol, UK, 2020; Volume 891, p. 012018. [Google Scholar]
  28. Tong, V.S.; Britton, T.B. TrueEBSD: Correcting spatial distortions in electron backscatter diffraction maps. Ultramicroscopy 2021, 221, 113130. [Google Scholar] [CrossRef]
  29. Zhang, X.; Lu, S.; Zhang, B.; Tian, X.; Kan, Q.; Kang, G. Dislocation–grain boundary interaction-based discrete dislocation dynamics modeling and its application to bicrystals with different misorientations. Acta Mater. 2021, 202, 88–98. [Google Scholar] [CrossRef]
  30. Costa, A.D.S.B.; Abreu, H.F.G.; Miranda, H.; Costa, R.C.S.; Teixeira, L.; Philipov, S. Comparing between residual stresses and grain boundary engineering for tubulations used in hydrodessulfuration systems. In Proceedings of the 4th Congress on P&D Oil and Gas, Campinas, São Paulo, Brazil, 21–24 September 2007; 4o PDPETRO: Campinas, Brazil, 2007; pp. 1–10. [Google Scholar]
  31. Humphreys, J.; Rohrer, G.S.; Rollett, A. Recrystallization and Related Annealing Phenomena, 3rd ed.; Elsevier: Amsterdam, The Netherlands, 2017; ISBN 978-0-08-098235-9. [Google Scholar]
  32. Vervynckt, S.; Verbeken, K.; Lopez, B.; Jonas, J.J. Modern HSLA steels and role of non-recrystallisation temperature. Int. Mater. Rev. 2012, 57, 187–207. [Google Scholar] [CrossRef]
  33. Chavez, G.F.S. Physical Simulation and Characterization on Heat Affected Zones of API 5L Grade x80 Steels. Master’s Thesis, Escola Politecnica da Universidade de São Paulo, São Paulo, Brazil, 7 December 2011. [Google Scholar] [CrossRef] [Green Version]
  34. Moeinifar, S.S.; Kokabi, A.H.; Madaah Hosseini, H.R. Role of Tandem Submerged Arc Welding Thermal Cycles on Properties of the Heat Affected Zone in X80 Microalloyed Pipe Line Steel. J. Mater. Process. Technol. 2011, 211, 368–375. [Google Scholar] [CrossRef]
  35. Davis, C.L.; King, J.E. Cleavage Initiation in the Intercritically Reheated Coarse Grained Heat Affected Zone: Part II. Metall. Mater. Trans. A 1996, 27, 3019–3029. [Google Scholar] [CrossRef]
  36. You, Y.; Shanga, C.; Chen, L.; Subramanian, S. Investigation on the crystallography of the transformation products of reverted austenite in intercritically reheated coarse grained heat affected zone. Mater. Des. 2013, 43, 485–491. [Google Scholar] [CrossRef]
  37. Colpaert, H. Metallography of Steels: Interpretation of Structure and the Effects of Processing, 1st ed.; ASM International: Materials Park, OH, USA, 2018; ISBN 978-1-62708-148-1. [Google Scholar]
  38. Masoumi, M.; Echeverri, E.A.A.; Tschiptschin, A.P.; Goldenstein, H. Improvement of wear resistance in a pearlitic rail steel via quenching and partitioning processing. Sci. Rep. 2019, 9, 7454. [Google Scholar] [CrossRef] [PubMed]
  39. Zhang, Y.; Sabbaghianrad, S.; Yang, H.; Topping, T.D.; Langdon, T.G.; Lavernia, E.J.; Schoenung, J.; Nutt, S.R. Two-Step SPD Processing of a Trimodal Al-Based Nano-Composite. Metall. Mater. Trans. A 2015, 46, 5877–5886. [Google Scholar] [CrossRef]
  40. Jayashree, P.K.; Basu, R.; Sharma, S.S. An electron backscattered diffraction (EBSD) approach to study the role of microstructure on the mechanical behavior of welded joints in aluminum metal matrix composites. Mater. Today Proc. 2021, 38, 490–493. [Google Scholar] [CrossRef]
  41. Badji, R.; Chauveau, T.; Bacroix, B. Texture, misorientation and mechanical anisotropy in a deformed dual pase stainless steel weld joint. Appl. Mater. Sci. Eng. A 2013, 575, 94–103. [Google Scholar] [CrossRef]
  42. Schayes, C.; Bouquerel, J.; Vogt, J.-B.; Palleschi, F.; Zaefferer, S. A comparison of EBSD based strain indicators for the study of Fe-3Si steel subjected to cyclic loading. Mater. Charact. 2016, 115, 61–70. [Google Scholar] [CrossRef]
  43. Mohtadi-Bonab, M.A.; Eskandari, M.; Szpunar, J.A. Texture, local misorientation, grain boundary and recrystallization fraction in pipeline steels related to hydrogen induced cracking. Mater. Sci. Eng. A 2015, 620, 97–106. [Google Scholar] [CrossRef]
  44. Wright, S.I. Quantification of recrystallized fraction from orientation imaging scan. In Proceedings of the 20th International Conference on Textures of Materials, Montreal, QC, Canada, 9–13 August 1999; Szpunar, J.A., Ed.; NRC Research Press: Otawa, ON, Canada, 1999; pp. 104–109. [Google Scholar]
  45. Allain-Bonasso, N.; Wagner, F.; Berbenni, S.; Field, D.P. A study of the heterogeneity of plastic deformation in IF steel by EBSD. Mater. Sci. Eng. A 2012, 548, 56–63. [Google Scholar] [CrossRef]
  46. Rui, S.-S.; Shang, Y.-B.; Fan, Y.-N.; Han, Q.-N.; Niu, L.; Shi, H.-J.; Hashimoto, K.; Komai, N. EBSD analysis of creep deformation induced grain lattice distortion: A new method for creep damage evaluation of austenitic stainless steels. Mater. Sci. Eng. A 2018, 733, 329–337. [Google Scholar] [CrossRef]
  47. Pandey, C.; Mahapatra, M.; Kumar, P.; Saini, N.; Srivastava, A. Microstructure and mechanical property relationship for different heat treatment and hydrogen level in multi-pass welded P91 steel joint. J. Manuf. Process. 2017, 28, 220–234. [Google Scholar] [CrossRef]
  48. Pandey, C.; Mahapatra, M.M.; Kumara, P.; Saini, N. Some studies on P91 steel and their weldments. J. Alloys Compd. 2018, 743, 332–364. [Google Scholar] [CrossRef]
  49. Pandey, C.; Mahapatra, M.M.; Kumar, P.; Thakre, J.; Saini, N. Role of evolving microstructure on the mechanical behaviour of P92 steel welded joint in as-welded and post weld heat treated state. J. Mater. Process. Tech. 2019, 263, 241–255. [Google Scholar] [CrossRef]
  50. Pereira, H.B.; Azevedo, C.R.F. Can the drop evaporation test evaluate the stress corrosion cracking susceptibility of the welded joints of duplex and super duplex stainless steels? Eng. Fail. Anal. 2019, 99, 235–247. [Google Scholar] [CrossRef]
  51. Tsuchiyama, T.; Natori, M.; Nakada, N.; Takakis, S. Conditions for Grain Boundary Bulging during Tempering of Lath Martensite in Ultra-low Carbon Steel. ISIJ Int. 2010, 50, 771–773. [Google Scholar] [CrossRef] [Green Version]
  52. Bozzolo, N.; Bernacki, M. Viewpoint on the Formation and Evolution of Annealing Twins during Thermomechanical Processing of FCC Metals and Alloys. Met. Mater. Trans. A 2020, 51, 2665–2684. [Google Scholar] [CrossRef]
  53. Baghdadchi, A.; Vahid, A.; Karlsson, H.L. Identification and quantification of martensite in ferritic-austenitic stainless steels and welds. J. Mater. Res. Tech. 2021, 15, 3610–3621. [Google Scholar] [CrossRef]
  54. Wright, S.I.; EDAX TSL, California USA. Personal communication, 2016.
  55. Nowell, M.M.; Wright, S.I.; Carpenter, J.O. Differentiating ferrite and martensite in steel microstructures using electron backscatter diffraction. In Proceedings of the Materials Science and Technology (MS&T), Pittsburgh, PA, USA, 25–29 October 2009; Materials Science and Technology (MS&T): Pittsburgh, PA, USA, 2009; pp. 933–943. [Google Scholar]
  56. Tsay, L.W.; Chern, T.S.; Gau, C.Y.; Yang, J.R. Microstructures and fatigue crack growth of EH36 TMCP steel weldments. Int. J. Fatigue 1999, 21, 857–864. [Google Scholar] [CrossRef]
  57. Bhadeshia, H.K.D.H.; Svensson, L.-E.; Gretoft, B. A Model for the Development of Microstructure in Low-Alloy Steel (Fe-Mn-Si-C) Weld Deposits. Acta Met. 1985, 33, 1271–1283. [Google Scholar] [CrossRef]
  58. Hutchinson, W.B.; Komenda, J.; Rohrer, G.S.; Beladic, H. Heat affected zone microstructures and their influence on toughness in two microalloyed HSLA steels. Acta Mater. 2015, 97, 380–391. [Google Scholar] [CrossRef]
  59. Unnikrishnan, R.; Northover, S.M.; Jazaeri, H.; Bouchard, P.J. Investigating plastic deformation around a reheat-crack in a 316H austenitic stainless steel weldment by misorientation mapping. Procedia Struct. Integr. 2016, 2, 3501–3507. [Google Scholar] [CrossRef] [Green Version]
  60. Han, J.H.; Jee, K.K.; Oh, K.H. Orientation rotation behavior during in situ tensile deformation of polycrystalline 1050 aluminum alloy. Int. J. Mech. Sci. 2003, 45, 1613–1623. [Google Scholar] [CrossRef]
  61. Rui, S.-S.; Niu, L.-S.; Shi, H.-J.; Wei, S.; Tasan, C.C. Diffraction-based misorientation mapping: A continuum mechanics description. J. Mech. Phys. Solids. 2019, 133, 103709. [Google Scholar] [CrossRef]
  62. Subedi, S.; Pokharel, R.; Rollet, A.D. Orientation gradients in relation to grain boundaries at varying strain level and spatial resolution. Mater. Sci. Eng. A 2015, 638, 348–356. [Google Scholar] [CrossRef] [Green Version]
  63. Kamaya, M.; Wilkinson, A.J.; Titchmarsh, J.M. Measurement of plastic strain of polycrystalline material by electron backscatter diffraction. Nucl. Eng. Des. 2005, 235, 713–725. [Google Scholar] [CrossRef]
  64. Kamaya, M. Assessment of local deformation using EBSD: Quantification of accuracy of measurement and definition of local gradient. Ultramicroscopy 2021, 111, 1189–1199. [Google Scholar] [CrossRef] [PubMed]
  65. Jiang, J.; Britton, T.B.; Wilkinson, A.J. Measurement of geometrically necessary dislocation density with high resolution electron backscatter diffraction: Effects of detector binning and step size. Ultramicroscopy 2013, 125, 1–9. [Google Scholar] [CrossRef] [PubMed]
  66. Gottstein, G.; Shvindlerman, L.S. Grain Boundary Migration in Metals: Thermodynamics, Kinetics, Applications, 2nd ed.; Taylor and Francis Group: Boca Raton, NY, USA, 2010. [Google Scholar] [CrossRef]
  67. Wilson, D.; Wan, W.; Dunne, F.P.E. Microstructurally-sensitive fatigue crack growth in HCP, BCC and FCC polycrystals. J. Mech. Phys. Solids. 2019, 126, 204–225. [Google Scholar] [CrossRef]
  68. Muñoz, J.A.; Higuera, O.F.; Benito, J.A.; Bradai, D.; Khelfa, T.; Bolmaro, R.E.; Jorge, A.M.; Cabrera, J.M. Analysis of the micro and substructural evolution during severe plastic deformation of ARMCO iron and consequences in mechanical properties. Mater. Sci. Eng. A 2019, 740, 108–120. [Google Scholar] [CrossRef]
  69. Heidarzadeh, A.; Radi, A.; Yapici, G. Formation of nano-sized compounds during friction stir welding of CueZn alloys: Effect of tool composition. J. Mater. Res. Technol. 2020, 9, 15874–15879. [Google Scholar] [CrossRef]
  70. Hou, J.; Shoji, T.; Lu, Z.; Peng, Q.; Wang, J.; Han, E.-H.; Ke, W. Residual strain measurement and grain boundary characterization in the heat-affected zone of a weld joint between alloy 690TT and alloy 52. J. Nucl. Mater. 2010, 397, 109–115. [Google Scholar] [CrossRef]
  71. Mirzadeh, H.; Cabrera, J.M.; Najafizadeh, A.; Calvillo, P.R. EBSD study of a hot deformed austenitic stainless steel. Mater. Sci. Eng. A 2012, 538, 236–245. [Google Scholar] [CrossRef]
  72. Guglielmi, P.O.; Ziehmer, M.; Lilleoddena, E.T. On a novel strain indicator based on uncorrelated misorientation angles for correlating dislocation density to local strength. Acta Mater. 2018, 150, 195–205. [Google Scholar] [CrossRef]
Figure 1. Simulated specimen with dimensions of 10 mm × 10 mm × 71 mm presenting the IC CGHAZ zone that is located in the central part of the sample with a width of approximately 8 mm.
Metals 11 01850 g001
Figure 2. Specimen (in the center of the image) attached to the Gleeble® 3800 equipment.
Metals 11 01850 g002
Figure 3. Thermal cycles simulating two welding passes to generate the IC CGHAZ zone.
Metals 11 01850 g003
Figure 4. Intercritical zone of DH36 steel calculated with Thermo-Calc®.
Metals 11 01850 g004
Figure 5. Schematics of the stress measurements using the RAYSTRESS machine.
Metals 11 01850 g005
Figure 6. Micrographs of the base material obtained with EBSD: (a) inverse pole figure (IPF) normal to the Y axis, (b) map of the quality standard, and (c) phase distribution map. Magnitude of 1500×. (d) Electron microscopy micrograph with magnitude of 3000×.
Metals 11 01850 g006
Figure 7. IC CGHAZ micrographs obtained with EBSD: (a) inverse pole figures (IPFs) normal to the Y axis, (b) quality pattern map (PQ), and (c) phase distribution maps. (d) Light microscopy micrograph. Magnitude of 500×.
Metals 11 01850 g007
Figure 8. Change in residual stress over time. Plot with ● corresponds to the residual stresses measured on IC CGHAZ area; plot with ■ corresponds to the residual stresses measured on FGHAZ area.
Metals 11 01850 g008
Figure 9. Maps of kernel average misorientation (KAM): (a) first day of monitoring KAM map and (b) fourth day of monitoring KAM map. EBSD with magnitude of 500×.
Metals 11 01850 g009aMetals 11 01850 g009b
Figure 10. KAM changes on IC CGHAZ area during the four days of monitoring: (a) first day of monitoring and (b) fourth day of monitoring.
Metals 11 01850 g010
Figure 11. Grain average misorientation (GAM): (a) first day of monitoring GAM map and (b) fourth day of monitoring GAM map. EBSD 500×.
Metals 11 01850 g011aMetals 11 01850 g011b
Figure 12. GAM changes on IC CGHAZ area during the four days of monitoring: (a) first day of monitoring and (b) fourth day of monitoring.
Metals 11 01850 g012
Figure 13. (a) Maps of boundary grain and (b) fraction of misorientation of boundaries grain.
Metals 11 01850 g013
Table 1. Chemical composition of the ASTM DH36 steel in wt.%.
C%Mn%Si%Cr%Cu%Ni%Mo and Ti%V%Nb%P%S%CEiiw%
0.1411.490.1790.0220.01060.0071<0.00050.04290.03220.02240.01020.41
Table 2. Values of the change in residual stress over time.
Days1234567891011121314
IC CGHAZ (MPa)−194−169−158−160−147−132−112−114−110−123−123−111−118−122
FGHAZ (MPa)−212−238−247−234−242−262−264−242−246−246−250−250−235−244
Publisher’s Note: MDPI stays neutral with regard to jurisdictional claims in published maps and institutional affiliations.

