
Thermal Decomposition Kinetics of Rare Earth Minerals in Tailings with Addition of MgO
by
 ,
,
Yan Zhou
1,2 ,
,
Shizhe Song
1,2,
Jianxing Liu
1,2,
Gongjin Cheng
1,2,
He Yang
1,2 and
Xiangxin Xue
1,2,* 1
School of Metallurgy, Northeastern University, Shenyang 110169, China
2
Liaoning Key Laboratory of Metallurgical Resources Recycling Science, Shenyang 110169, China
*
Author to whom correspondence should be addressed.
Metals 2021, 11(5), 701; https://doi.org/10.3390/met11050701
Submission received: 23 March 2021
/
Revised: 13 April 2021
/
Accepted: 22 April 2021
/
Published: 25 April 2021
(This article belongs to the Special Issue Advances in Valuable Metal Recycling)
Abstract
:Due to the advantage in deactivating fluorine and enhancing the decomposition of rare earth (RE) minerals, MgO was applied to the magnetizing roasting of Bayan Obo tailings in this work. The effects of MgO dosages, roasting temperature, and holding time on the decomposition rate of RE minerals were experimentally studied. With a MgO dosage of 10 wt.%, the decomposition rate of RE minerals reached 98.09% at 750 °C. The phase composition of roasted samples was characterized by XRD and SEM-EDS. The incomplete decomposition rate was investigated with the observation of leaching residual by SEM-EDS. The decomposition kinetics of the RE minerals with the addition of MgO was analyzed with the Ginstling-Brundshtein model, where the reaction rate was controlled by chemical reaction.
1. Introduction
Rare earth (RE) elements, namely lanthanum (Ln), scandium (Sc), and yttrium (Y), are irreplaceable strategic resources for innumerable applications owing to their chemical, catalytic, electrical, magnetic, and optical properties [1,2,3,4]. The Bayan Obo ore deposit, located in Inner Mongolia, China, which is a well-known polymetallic ore with more than 40 million tons of RE reserves (count as RE oxides) [5], was initially developed as an iron ore mine in 1927 and did not begin RE production until decades later [6]. Unfortunately, the utilization rate of mined RE elements is only 10–15% [1], and approximately 150 million tons of tailings with an average RE oxides content of 8.85% have been abandoned in a tailings dam [7]. The tailings occupy an area of 11.5 km2 and cause extensive waste and serious environmental pollution [8]. As the global demand for RE elements increasing, the environmental and economic benefits of recycling RE elements from the tailings attracts great interests.
The RE minerals in Bayan Obo tailings, composed primarily of bastnaesite (RECO3F) and monazite (REPO4), are recognized as intractable minerals in hydrometallurgy [9]. Commercially, the technologies of roasting with sulfuric acid and treatment in sodium hydroxide are mainly applied to decompose the RE minerals in concentrate, but are uneconomical for processing the tailings [2,9]. These methods also lead to environmental pollution, such as emissions of HF and SO2, plenty of waste-water [2]. In order to extract RE directly from tailings, numerous clean methods have been proposed by researchers to decompose the RE minerals. In our previous study [6], the method combining magnetizing roasting and (NH4)2SO4 activation roasting was developed to recover Fe and RE elements from the Bayan Obo tailings. However, the recovery rate of RE reached 76–83% since REPO4 in tailings was not completely decomposed. According to the study of Yuan et al. [10], 99.87% of RE minerals in tailings were decomposed at 750 °C via adding CaO. Meanwhile, the addition of CaO suppressed the emission of F-containing waste-gas during roasting.
Meanwhile, MgO was initially used as an additive to deactivate fluorine prior to chloride roasting and to improve the recovery of RE [11]. In the presence of MgO, F was fixed in form of MgF2, which also suppresses the emission of F-containing waste-gas. The studies [12,13] reported a technique that the mixed concentrate of RECO3F and REPO4 was roasted with MgO and RE elements were subsequently recovered via chlorination roasting, and it was found that MgO could enhance the decomposition of RE concentrates. However, the effect of MgO on the decomposition of RE minerals has not been studied in depth, then its application to process RE tailings was rarely reported.
In this work, the magnetizing roasting process which has been studied in our previous work [6] was improved by adding MgO and by increasing roasting temperature. The effects of MgO dosages, roasting temperature, and holding time on the decomposition rate were investigated. The phase compositions of the roasting products were characterized by X-ray diffusion (XRD) and scanning electron microscopy & energy dispersive X-ray spectroscopy (SEM-EDS). Subsequently, the kinetics and activation energy of thermal decomposition of RE minerals were analyzed based on the experimental data. This study is expected to provide a clean method for the recovery of RE minerals in tailings.
2. Experimental
2.1. Materials
The starting material in this study is the Bayan Obo tailing, from the Ore-Dressing Plant, Baotou Steel (Group) Co. (Baotou, Inner Mongolia, China). Its main chemical composition is listed in Table 1. The volume fraction of the particles with sizes lower than 74 μm is 65.66%. The pulverized coal with a carbon content of 83 wt. % was used as reducing agent, and the analytical reagents of MgO, HCl, and H2O2 were purchased from Sinopharm Chemical Reagent Co., Ltd. (Shanghai, China). All the solutions in the experiments were prepared with distilled water.
2.2. Procedures and Characterization
The flowchart of the roasting procedure is shown in Figure 1a. Firstly, 10 g of tailings, 0.067 g of pulverized coal, and MgO powder with a mass ratio varying between 0–25 wt.% were mixed in a sealed tank for 5 h. Subsequently, the mixtures were pressed into cylinders with a diameter of 25 mm under a compressive force of 58.8 kN. The cylindrical sample were sealed in a capped graphite crucible and heated to a preset temperature in a muffle furnace (Shenyang Metallurgical Graphite Factory, Shenyang, China) with a heating rate of 10 °C/min. After reaching the preset temperature, the samples were held for different time then cooled to room temperature in air. The roasted samples were crushed and ground into powders using a vibration grinding mill. The phase composition of the samples was identified by XRD (X Pertpro, PANalytical B.V., Almelo, The Netherlands) with the (Cu Kα) radiation of 40 kV and 40 mA. The mineralogical phases of samples were investigated using SEM-EDS (ULTRA PLUS, Carl Zeiss AG, Jena, Germany). It should be noted that the roasting condition in this work was designed according to magnetic separation, since the Bayan Obo tailing contains 13.1% Fe. So the roasting temperature was adjusted below 800 °C to avoid the formation of non-magnetic FeO.
The flowchart of the leaching procedure is shown in Figure 1b. The leaching experiments were carried out in a three-necked flask shown in Figure 2 with a boiling water bath (100 °C). A condensing return tube, an electronically controlled agitator, and a glass thermometer were attached to the three-necked flask, as shown in Figure 2. The roasted sample powders (1 g), 40 mL of HCl solution (6 mol/L), and 10 mL of H2O2 solution (30 wt.%) were mixed in the flask and then stirred for 30 min. The leachate was separated by vacuum filtration and cooled to room temperature. Subsequently, the leachate was diluted to 500 mL. The leaching residues were collected after drying. The contents of RE ions in the leachate were determined by inductively coupled plasma optical emission spectrometry (ICP-OES, model: Optima 8300DV, Perkin Elmer Co., Waltham, MA, USA). Since only the decomposed RE minerals could be leached out, the decomposition rate of RE minerals in the roasted samples was calculated using Equation (1):
where η is the decomposition rate (%), C is the concentration of RE elements in leachate (g/mL), V is the volume of leachate (500 mL), m is the mass of the roasted samples before leaching (1 g), and ω is the content of RE elements in the roasted samples (wt.%).
3. Results and Discussion
3.1. Effect of MgO Dosage on Decomposition Rate
The effect of MgO dosage on the decomposition rate of RE minerals was investigated with a constant roasting temperature of 750 °C and hold time of 120 min, the results were summarized in Figure 3. As the dosage of MgO raising from 0 to 10 wt.%, the decomposition rate increased from 95.1% to 98.1%. Further increase in the MgO dosage beyond the stoichiometric requirement did not enhance decomposition rate, but increased the cost. Therefore, the dosage of MgO in the following experiments was fixed to 10 wt.%.
3.2. Phase Characterization
The XRD patterns of the raw tailings and the samples roasted at different temperature are shown in Figure 4.
As shown by Figure 4a, the RE minerals in the tailings are primarily composed of bastnaesite (RECO3F) and monazite (REPO4). Besides, minerals such as fluorite (CaF2), hematite (Fe2O3), dolomite (CaMg(CO3)2), barite (BaSO4), apatite (Ca5(PO4)3F), and pyroxene (Na(Fe, Sc)Si2O6) were detected in the tailings. Figure 4b,c show no diffraction peaks of RECO3F, indicating the complete decomposition of RECO3F. This is consistent with the decomposition temperature of RECO3F reported in the literatures [10,14], which is in the range of 400–600 °C.
The diffraction peaks of REPO4 shown in Figure 4b disappeared after rising to 750 °C in Figure 4c, indicating the decomposition temperature of REPO4 is in the range of 600–750 °C. Due to the similar crystalline structure, the peaks of CaF2 and REO in Figure 4b,c are overlapped, but could be distinguished at a magnified view, as shown by the inset in Figure 4. This is consistent with the data reported in the literature [10]. The REO here represents Ce2O3, Ce0.75Nd0.25O1.875, LaPrO3 + x, Pr2O3, or CeO2. As shown in Figure 4, Fe2O3 was reduced to Fe3O4 by the carbon from coal, and CaMg(CO3)2 was thermally decomposed at 600–750 °C. The phases of CaF2, BaSO4, Ca5(PO4)3F, and NaFeSi2O6 could be still detected after roasting, showing relatively high thermal stability.
Figure 5 shows the results of thermogravimetry and differential scanning calorimetry (TG-DSC) analysis (model: STA449, NETZSCH, Selb, Germany) and differential thermogravimetry (TG-DTG) results for the tailings without and with addition of MgO. It shows two main peaks in both DSC and DTG curves of the two samples. The first endothermic peaks at 525.9 °C shown in Figure 5a are attributed to the decomposition of RECO3F [14]. The second endothermic peaks at 705.5 °C were caused by the decomposition of REPO4 [10,15]. For the sample with 10 % MgO addition, the first endothermic peak was broadened, indicating that MgO addition lowers the decomposition temperature of RECO3F. The DTG curves shown in Figure 5b exhibit an apparent peak shift, from 523 °C to 467−520 °C.
Figure 6 and Figure 7 and Table 2 show the SEM-EDS results of the sample with 10 wt.% MgO roasted at 700 °C for 120 min. Figure 6a shows that RE oxides (marked as “C”) were attached to CaF2 particles (marked as “A”). The EDS analysis results of points “B” and “C” exhibit the presence of Mg and F, which may be due to the reaction shown in Equation (2) [11,16]. The particle shown in Figure 5b is the aggregation of MgO and RE oxides. P and F were detected at points “D” and “F”, which are from the reactions shown in Equations (3) and (4) [12,16]. Also, CaO from the decomposition of CaMg(CO3)2, as shown by Equation (5) [17], led to the reactions shown as Equations (6)–(8) [10,17,18]:
2RECO3F + MgO = MgF2 + RE2O3 + 2CO2
2REPO4 + 3MgO = RE2O3 + Mg3(PO4)2
MgF2 + Mg3(PO4)2 = 2Mg2PO4F
CaMg(CO3)2 = CaO + MgO + 2CO2
2RECO3F + CaO = CaF2 + RE2O3 + 2CO2
2REPO4 + 3CaO = RE2O3 + Ca3(PO4)2
CaF2 + Ca3(PO4)2 = 2Ca2PO4F
3.3. Effect of Roasting Temperature on Decomposition Rate
The effects of roasting temperature and holding time on the decomposition rate of RE minerals were investigated with a constant MgO mass ratio of 10 wt.%. The holding time for roasting varied in the range of 0–120 min. The results are presented in Figure 8, showing that the decomposition rate increased with the temperature and holding time, respectively.
With the hold time of 120 min, the maximum decomposition rates at 600 °C, 650 °C, 700 °C, and 750 °C reached 76.45%, 81.97%, 92.44%, and 98.09%, respectively. It should be noted that the decomposition rates for all the cases exceeded 60% during the temperature-rising stage. The SEM-EDS results of the leaching residues are shown in Figure 9 and Figure 10 and Table 3. The BaSO4 particles (marked as “H”, “L” and “N” in Figure 9) and the Na(Fe, Sc)Si2O6 particles (marked as “J” and “K” in Figure 9) were detected in all leaching residues. The particles marked as “G” and “M” in Figure 9 contain Nb, Ti, Fe, Ce, Nd, and Ca, which belong to niobium minerals such as pyrochlore-group(Ce2Nb2O6(OH)2), ilmenorutile ((Ti, Nb, Fe)O2), and eschynite (CeTiNbO6), according to the study of Zhang et al. [19]. These undecomposed niobium minerals are the reasons for the decomposition rate of RE minerals not reaching 100% at 750 °C. While the reason for the low decomposition rate before 750 °C is the undecomposed REPO4, which was observed in the sample roasted at 600 °C, as shown by the particles marked “I” in Figure 9b.
3.4. Kinetics Analysis of Mixed RE Mineral Decomposition
The thermal decomposition of RE minerals in the tailings relates to polyphase solid-state reaction, which could be explained by Ginstling-Brundshtein model [20]. The kinetic mode is expressed as Equation (9):
where x is the decomposition rate of RE minerals, k represents the rate constants, and t is holding time (namely reaction time).
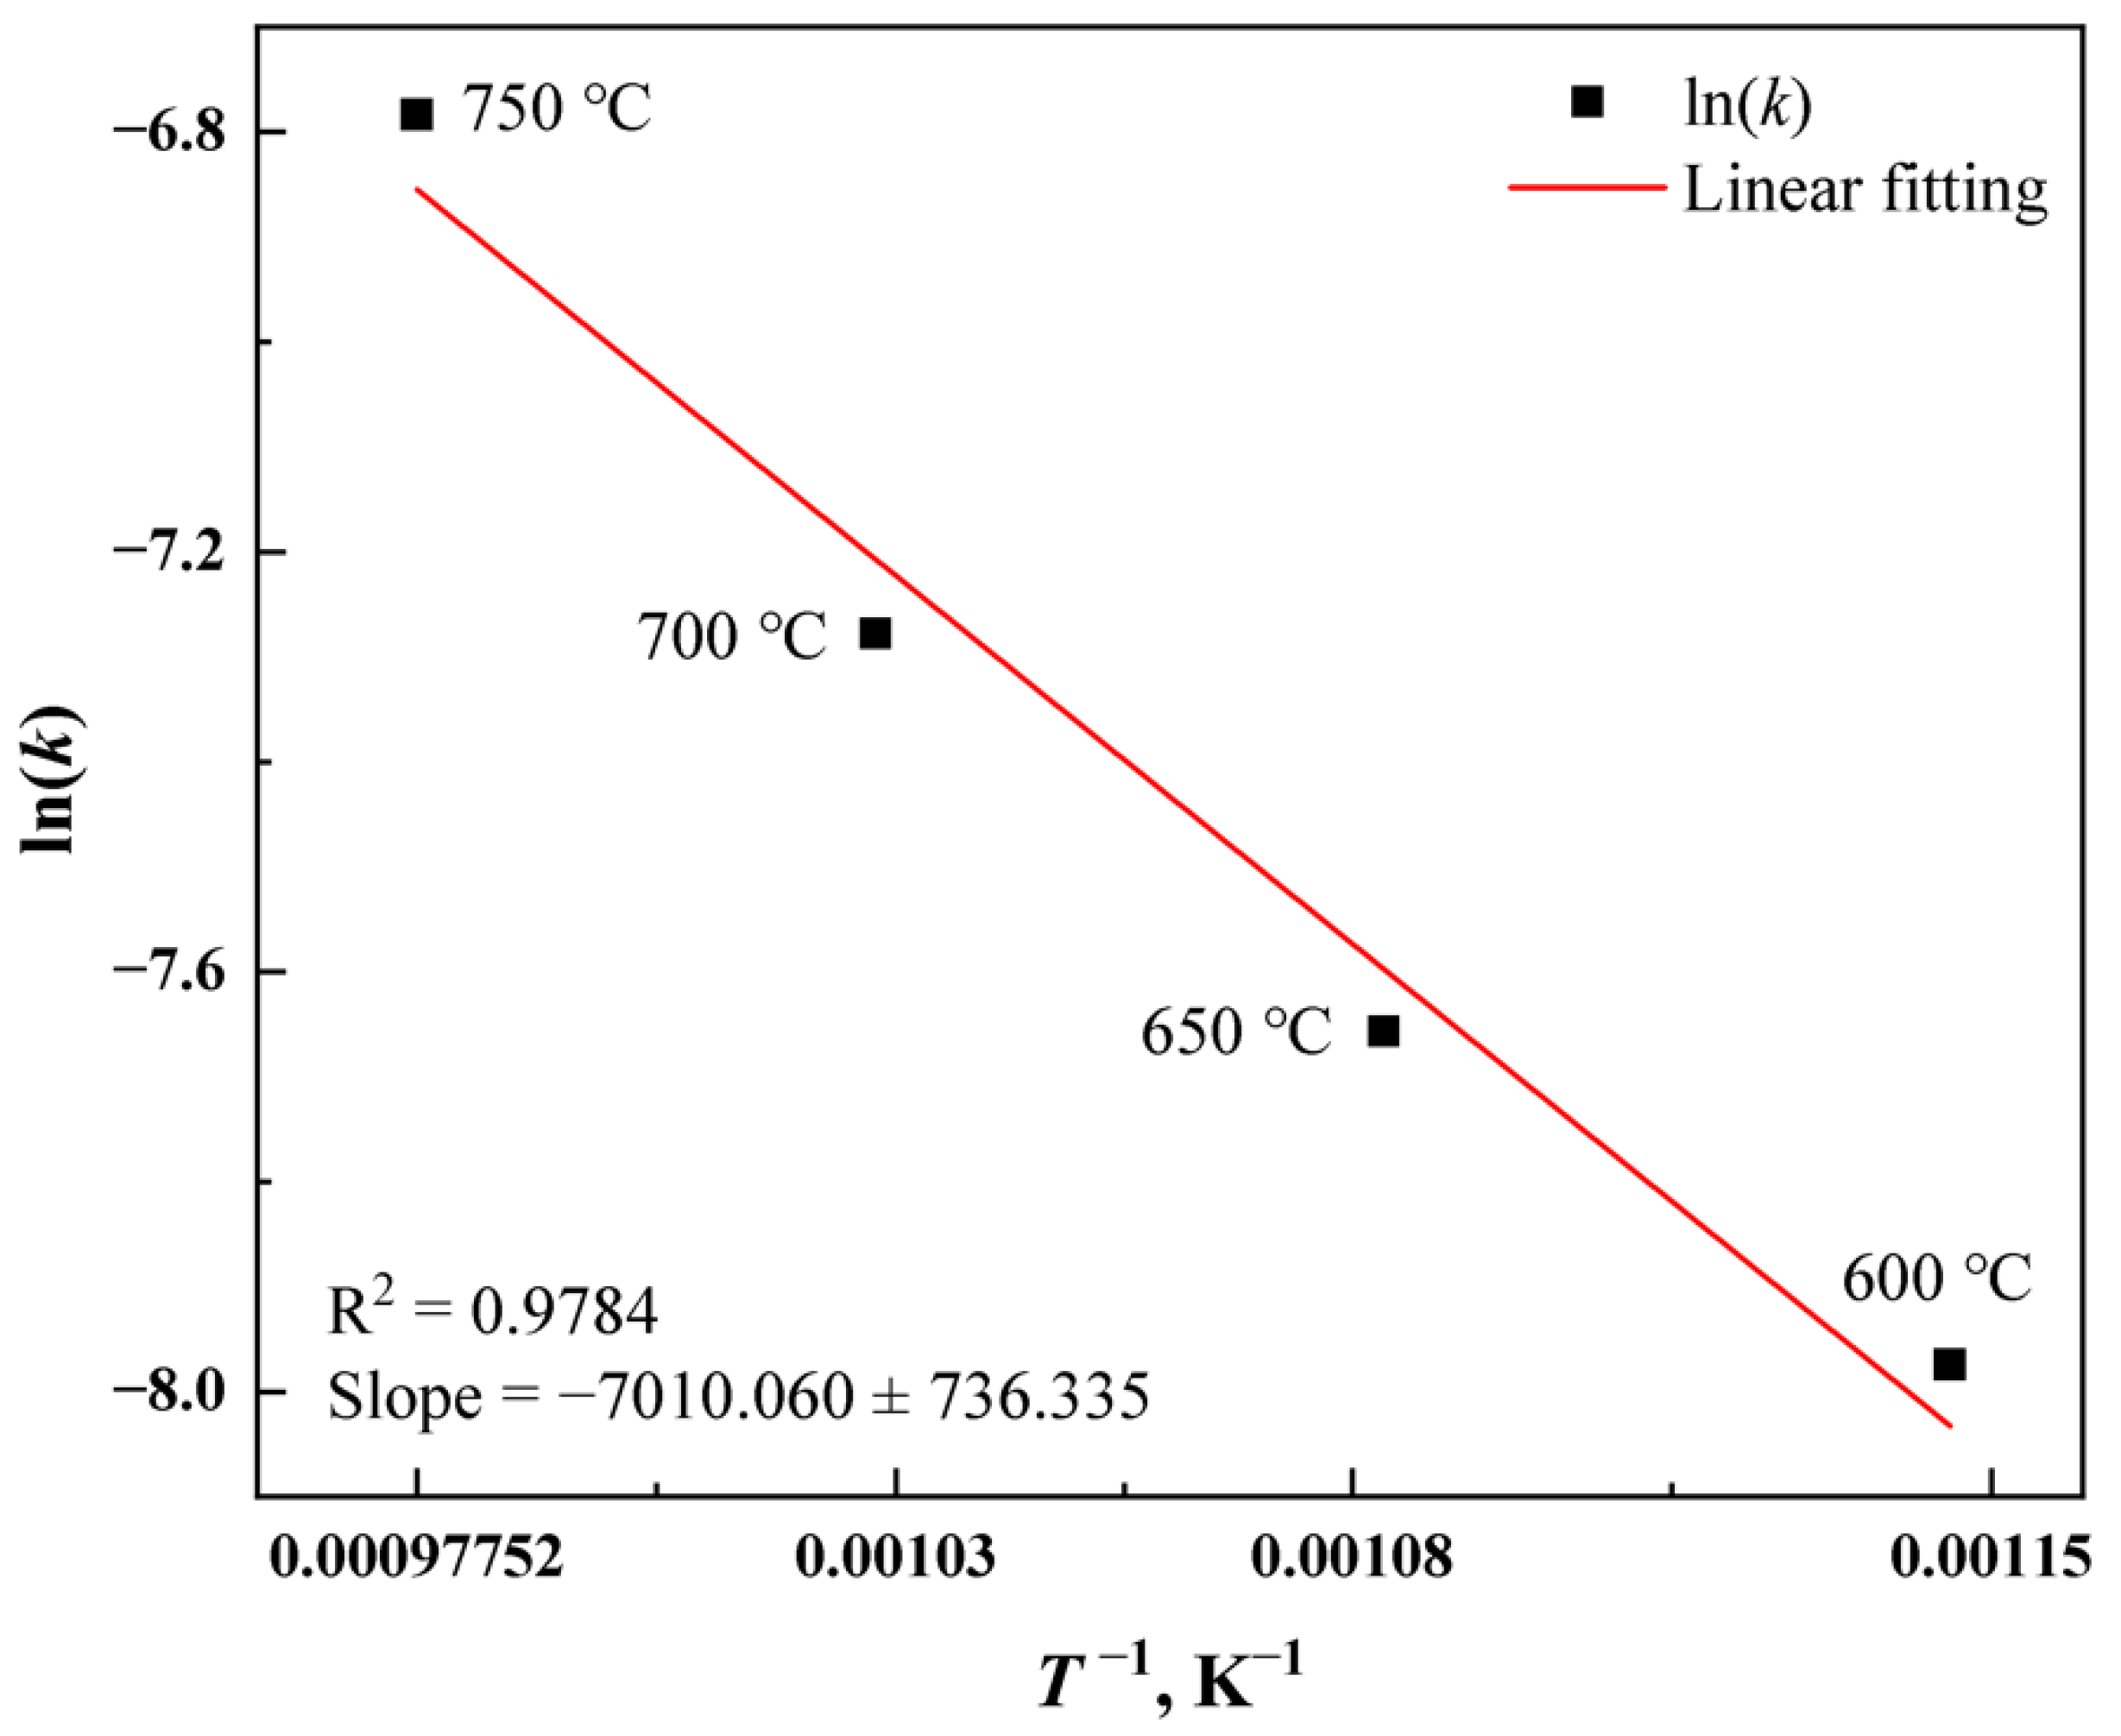
The experimental data from Figure 7 were used for the calculation with Equation (9), and the results were plotted in Figure 11. The linear results with the fit coefficients closing to 1.0 suggest that the thermal decomposition process of the RE minerals in tailings follows Ginstling-Brundshtein model. The values of k were equal to the slope of the fitted line in Figure 11. Subsequently, the activation energy Ea was determined via plotting ln(k) versus inverse temperature 1/T according to the Arrhenius relationship given in Equation (10):
where k is the rate constants, k0 is the Arrhenius constant, Ea is the activation energy (kJ/mol), R is the universal gas constant (8.314 J/(K·mol)), T is the reaction temperature (K).
As deduced from Figure 12, the apparent activation energy Ea was calculated as 58.28 ± 6.12 kJ/mol. Empirically, the activation energy of the process controlled by diffusion is less than 13 kJ/mol. While the activation energy of the process controlled by chemical reaction is higher than 42 kJ/mol.
For the process mutually controlled by diffusion and chemical reaction, the activation energy is in the range of 13–42 kJ/mol [10,15]. Apparently, the thermal decomposition of RE minerals in tailings with the addition of MgO is controlled by chemical reaction. This is consistent with the control mode between 600 and 700 °C for the decomposition of RE minerals in tailings with the addition of CaO demonstrated by Yuan et al. [10].
4. Conclusions
The effect of MgO on the thermal decomposition of RE minerals in tailings was experimentally investigated in this study. With the MgO dosage of 10 wt.%, the decomposition rate of RE minerals increased to 98.09% at 750 °C. The decomposing products were mainly RE oxides, thereby facilitating RE leaching process. The niobium minerals are not decomposed at all as the temperature rising to 750 °C, resulting in the incomplete decomposition rate. The apparent activation energy was calculated as 58.28 ± 6.12 kJ/mol, suggesting the decomposition of RE minerals with the addition of MgO was controlled by chemical reaction.
Author Contributions
Conceptualization, X.X. and Y.Z.; methodology, Y.Z. and S.S.; software, J.L. and G.C.; validation, G.C., J.L. and Y.Z.; formal analysis, Y.Z.; investigation, Y.Z. and S.S.; resources, X.X. and H.Y.; data curation, Y.Z. and S.S.; writing—original draft preparation, Y.Z.; writing—review and editing, Y.Z. and J.L.; visualization, Y.Z.; supervision, X.X. and H.Y.; project administration, X.X. and H.Y.; funding acquisition, X.X. and H.Y. All authors have read and agreed to the published version of the manuscript.
Funding
National Natural Science Foundation of China [grant number 51274061]; National Program on Key Basic Research Project of China [grant number 2012CBA01205].
Acknowledgments
Special thanks are due to the instrumental from Analytical and Testing Center, Northeastern University.
Conflicts of Interest
The authors declare no conflict of interest.
References
- Huang, X.; Zhang, Y.; Li, H. Development Trend and Research Progress of Rare Earth Extraction in China. Bull. Natl Nat. Sci. Found. China 2011, 25, 134–137. [Google Scholar]
- Xu, G.X. Rare Earths, 2nd ed.; Metallurgical Industry Press: Beijing, China, 2012; Volume 1, ISBN 7-5024-1678-1. [Google Scholar]
- Resende, L.V.; Morais, C.A. Study of the Recovery of Rare Earth Elements from Computer Monitor Scraps–Leaching Experiments. Miner. Eng. 2010, 23, 277–280. [Google Scholar] [CrossRef]
- Savel’eva, I.L. The Rare-Earth Metals Industry of Russia: Present Status, Resource Conditions of Development. Geogr. Nat. Resour. 2011, 32, 65–71. [Google Scholar] [CrossRef]
- Li, K.; Liang, T.; Wang, L.; Yang, Z. Contamination and Health Risk Assessment of Heavy Metals in Road Dust in Bayan Obo Mining Region in Inner Mongolia, North China. J. Geogr. Sci. 2015, 25, 1439–1451. [Google Scholar] [CrossRef] [Green Version]
- Zhou, Y.; Yang, H.; Xue, X.; Yuan, S. Separation and Recovery of Iron and Rare Earth from Bayan Obo Tailings by Magnetizing Roasting and (NH4)2SO4 Activation Roasting. Metals 2017, 7, 195. [Google Scholar] [CrossRef] [Green Version]
- Yu, X.-L.; Bai, L.; Wang, Q.-C.; Liu, J.; Chi, M.-Y.; Wang, Z.-C. Recovery of Rare Earths, Niobium, and Thorium from the Tailings of Giant Bayan Obo Ore in China. Metall. Materi. Trans. B 2012, 43, 485–493. [Google Scholar] [CrossRef]
- Wang, L.; Liang, T. Accumulation and Fractionation of Rare Earth Elements in Atmospheric Particulates around a Mine Tailing in Baotou, China. Atmos. Environ. 2014, 88, 23–29. [Google Scholar] [CrossRef]
- Xiaowei, H. Development Status and Research Progress in Rare Earth Hydrometallurgy in China. J. Chin. Rare Earth Soc. Chin. Ed. 2006, 24, 129. [Google Scholar]
- Yuan, S.; Yang, H.; Xue, X.-X.; Zhou, Y. Kinetics of Roasting Decomposition of the Rare Earth Elements by CaO and Coal. Metals 2017, 7, 213. [Google Scholar] [CrossRef]
- Chi, R.; Zhang, X.; Zhu, G.; Zhou, Z.A.; Wu, Y.; Wang, C.; Yu, F. Recovery of Rare Earth from Bastnasite by Ammonium Chloride Roasting with Fluorine Deactivation. Miner. Eng. 2004, 17, 1037–1043. [Google Scholar] [CrossRef]
- Shi, W.; Zhu, G.; Hua, J.; Xu, S.; Chi, R. Recovery of RE from Baotou rare earth concentrate with chlorination roasting. Trans. Nonferrous Metals Soc. China 2003, 13, 438–442. [Google Scholar]
- Zhu, G.; Chi, R.; Shi, W.; Xu, Z. Chlorination Kinetics of Fluorine-Fixed Rare Earth Concentrate. Miner. Eng. 2003, 16, 671–674. [Google Scholar] [CrossRef]
- Cen, P.; Wu, W.; Bian, X. Thermodynamic Mechanism Analysis of Calcification Roasting Process of Bastnaesite Concentrates. Metall. Mater. Trans. B 2017, 48, 1539–1546. [Google Scholar] [CrossRef]
- Xue, B.; Fengyun, Z.; Wenyuan, W. Kinetics of Mixed Rare Earths Minerals Decomposed by CaO with NaCl-CaCl2 Melting Salt. J. Rare Earths 2010, 28, 5. [Google Scholar]
- Sadri, F.; Nazari, A.M.; Ghahreman, A. A Review on the Cracking, Baking and Leaching Processes of Rare Earth Element Concentrates. J. Rare Earths 2017, 35, 739–752. [Google Scholar] [CrossRef]
- Carrillo García, A.; Latifi, M.; Chaouki, J. Kinetic Study of Calcination of a Rare Earth Ore. Hydrometallurgy 2021, 200, 105557. [Google Scholar] [CrossRef]
- WU, W.; BIAN, X.; WU, Z.; SUN, S.; TU, G. Reaction Process of Monazite and Bastnaesite Mixed Rare Earth Minerals Calcined by CaO-NaCl-CaCl2. Trans. Nonferrous Metals Soc. China 2007, 17, 864–868. [Google Scholar] [CrossRef]
- Zhang, B.; Xue, X.; Huang, X.; Yang, H.; Chen, G. Study on Recycling and Leaching Valuable Elements from Bayan Obo Tailings. Metall. Res. Technol. 2019, 116, 114. [Google Scholar] [CrossRef]
- Espenson, J.H. Chemical Kinetics and Reaction Mechanisms; Citeseer: Princeton, NJ, USA, 1995; Volume 102. [Google Scholar]
Figure 1.
Flowchart of the experimental procedure. (a) roasting procedure, (b) leaching procedure.
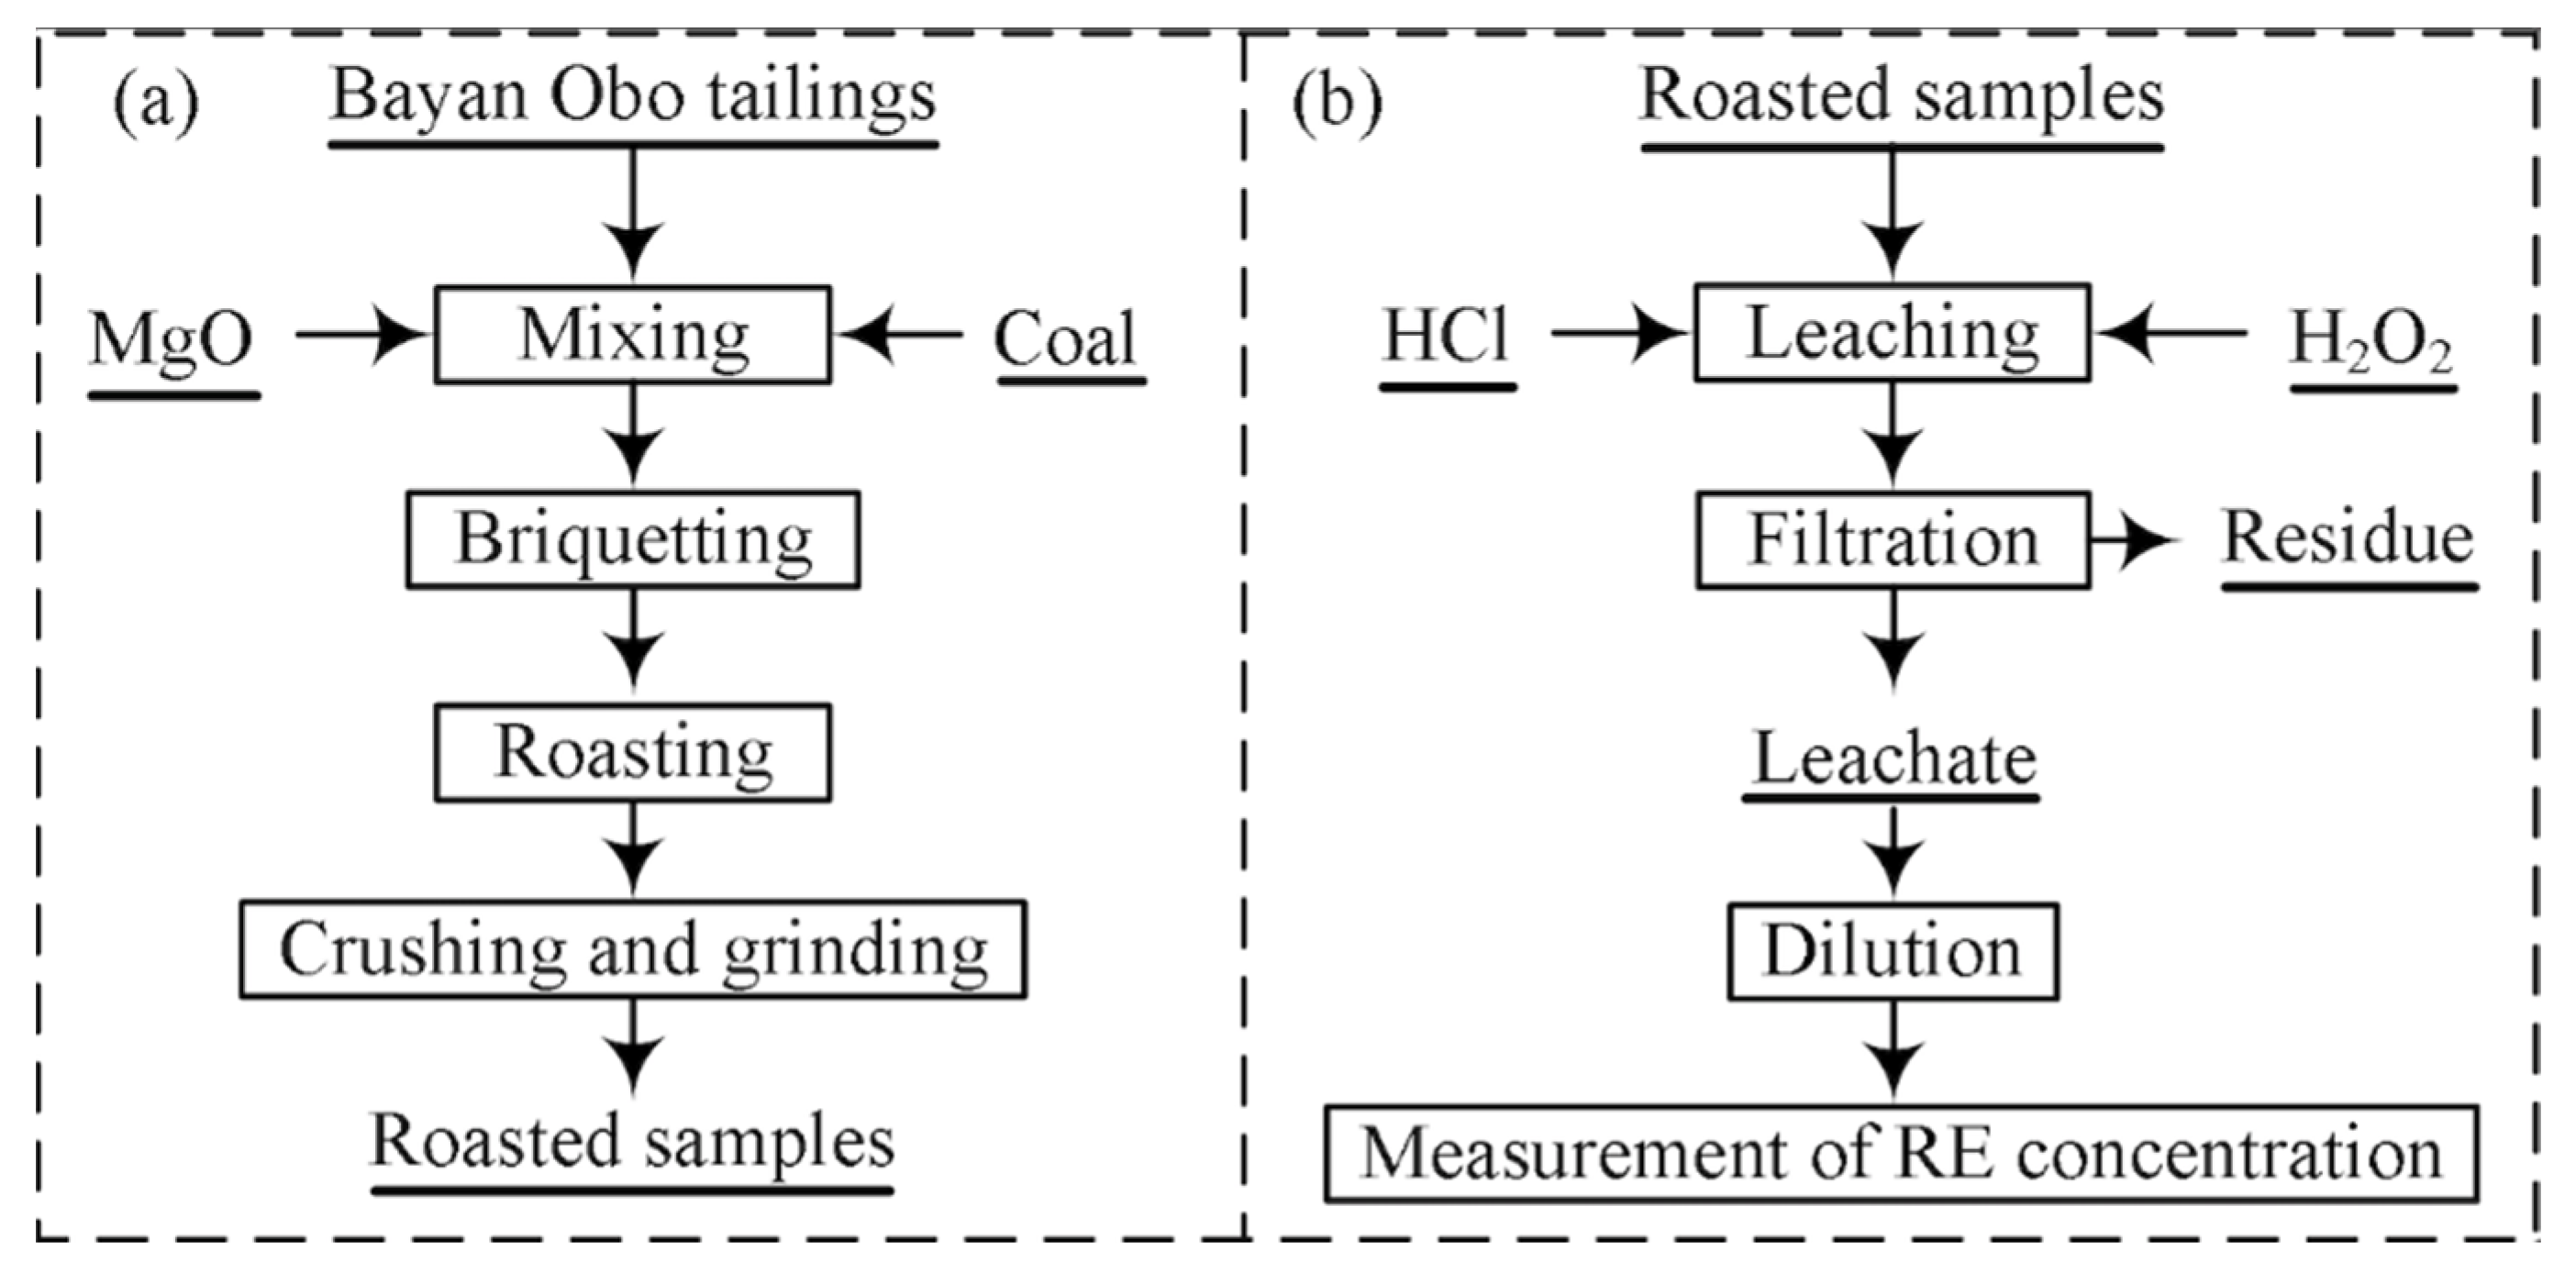
Figure 2.
Schematic diagram of the three-necked flask for leaching. 1-three-necked flask, 2-condensing return tube, 3-glass thermometer, 4-agitator, 5-electric motor, 6-plug.
Figure 2.
Schematic diagram of the three-necked flask for leaching. 1-three-necked flask, 2-condensing return tube, 3-glass thermometer, 4-agitator, 5-electric motor, 6-plug.

Figure 3.
Effect of MgO dosages on the decomposition rate of RE minerals.
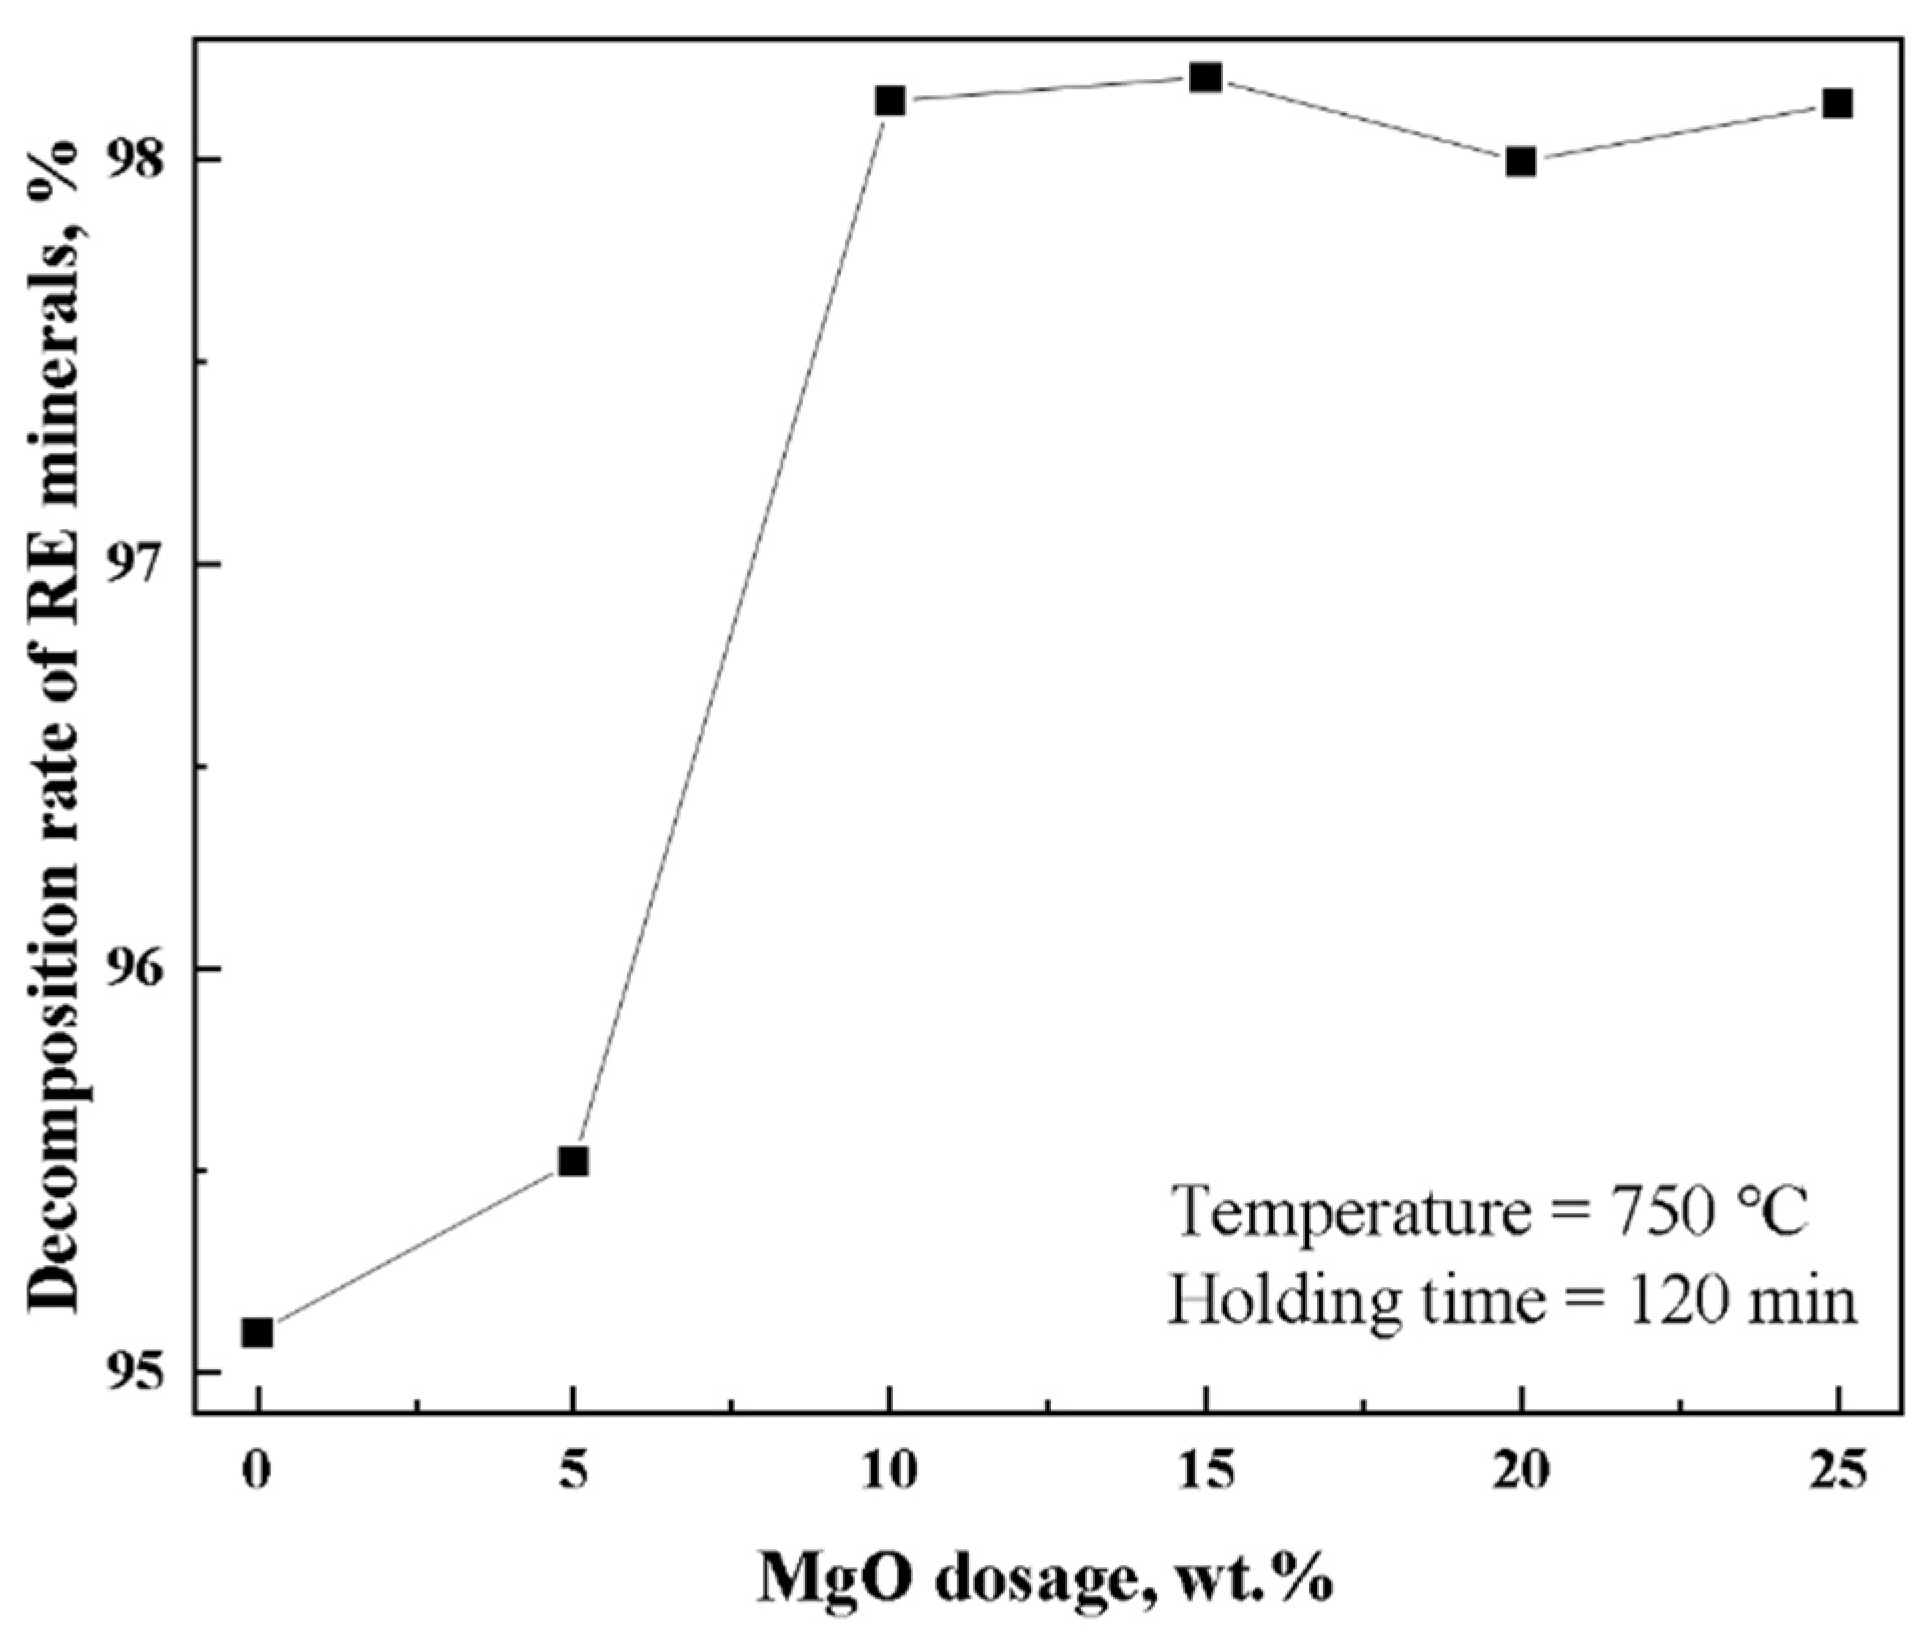
Figure 4.
XRD pattern of samples under different conditions: (a)raw tailings, (b) sample of tailings with addition of 10 wt.% MgO roasted at 600 °C for 120 min, (c) sample of tailings with addition of 10 wt.% MgO roasted at 750 °C for 120 min. 1-RECO3F, 2-REPO4, 3-CaF2, 4-Fe2O3, 5-CaMg(CO3)2, 6-BaSO4, 7-Ca5(PO4)3F, 8-Na(Fe, Sc)Si2O6, 9-MgO, ◆-Fe3O4, ●-REO.
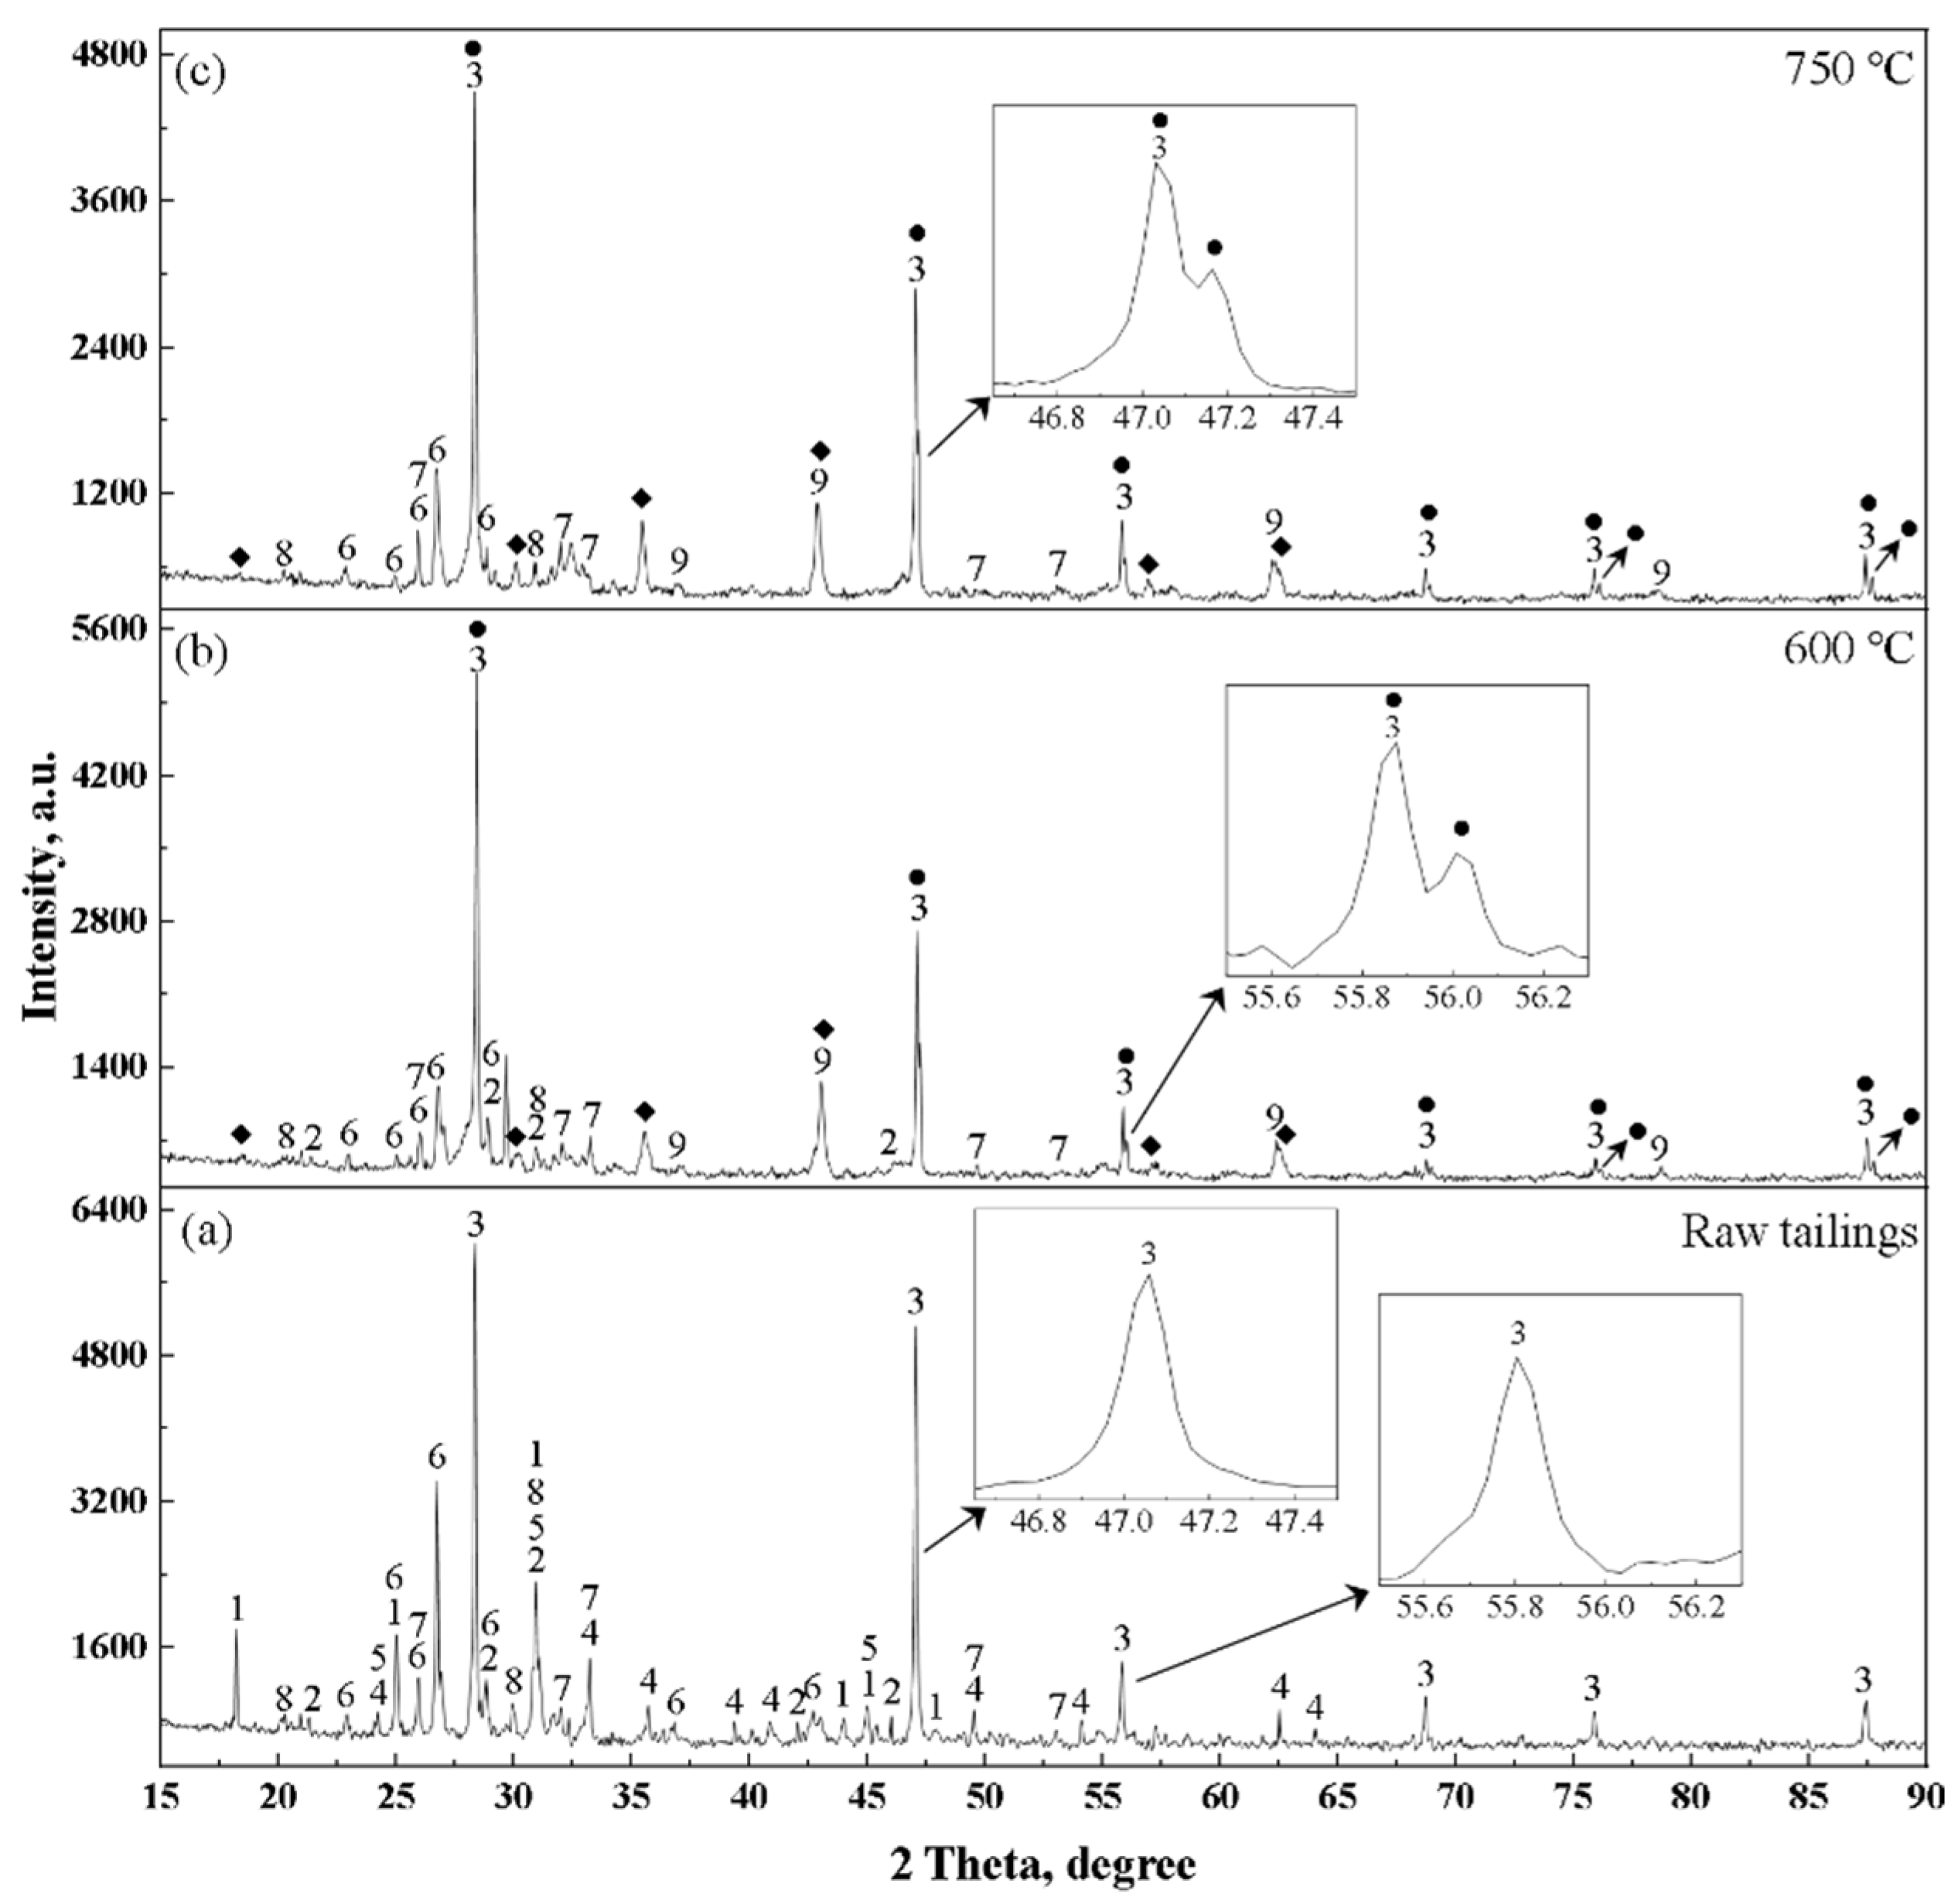
Figure 5.
TG-DSC analysis of the samples without and with addition of MgO: (a) TG-DSC curves, (b) TG-DTG curves.
Figure 5.
TG-DSC analysis of the samples without and with addition of MgO: (a) TG-DSC curves, (b) TG-DTG curves.

Figure 6.
SEM images of the roasted sample of tailings with 10 wt.% MgO addition at 700 °C for 120 min (a,b).
Figure 6.
SEM images of the roasted sample of tailings with 10 wt.% MgO addition at 700 °C for 120 min (a,b).

Figure 7.
EDS analysis results of points in Figure 6.
Figure 7.
EDS analysis results of points in Figure 6.

Figure 8.
Effect of roasting temperature and holding time on the decomposition rate of RE minerals.
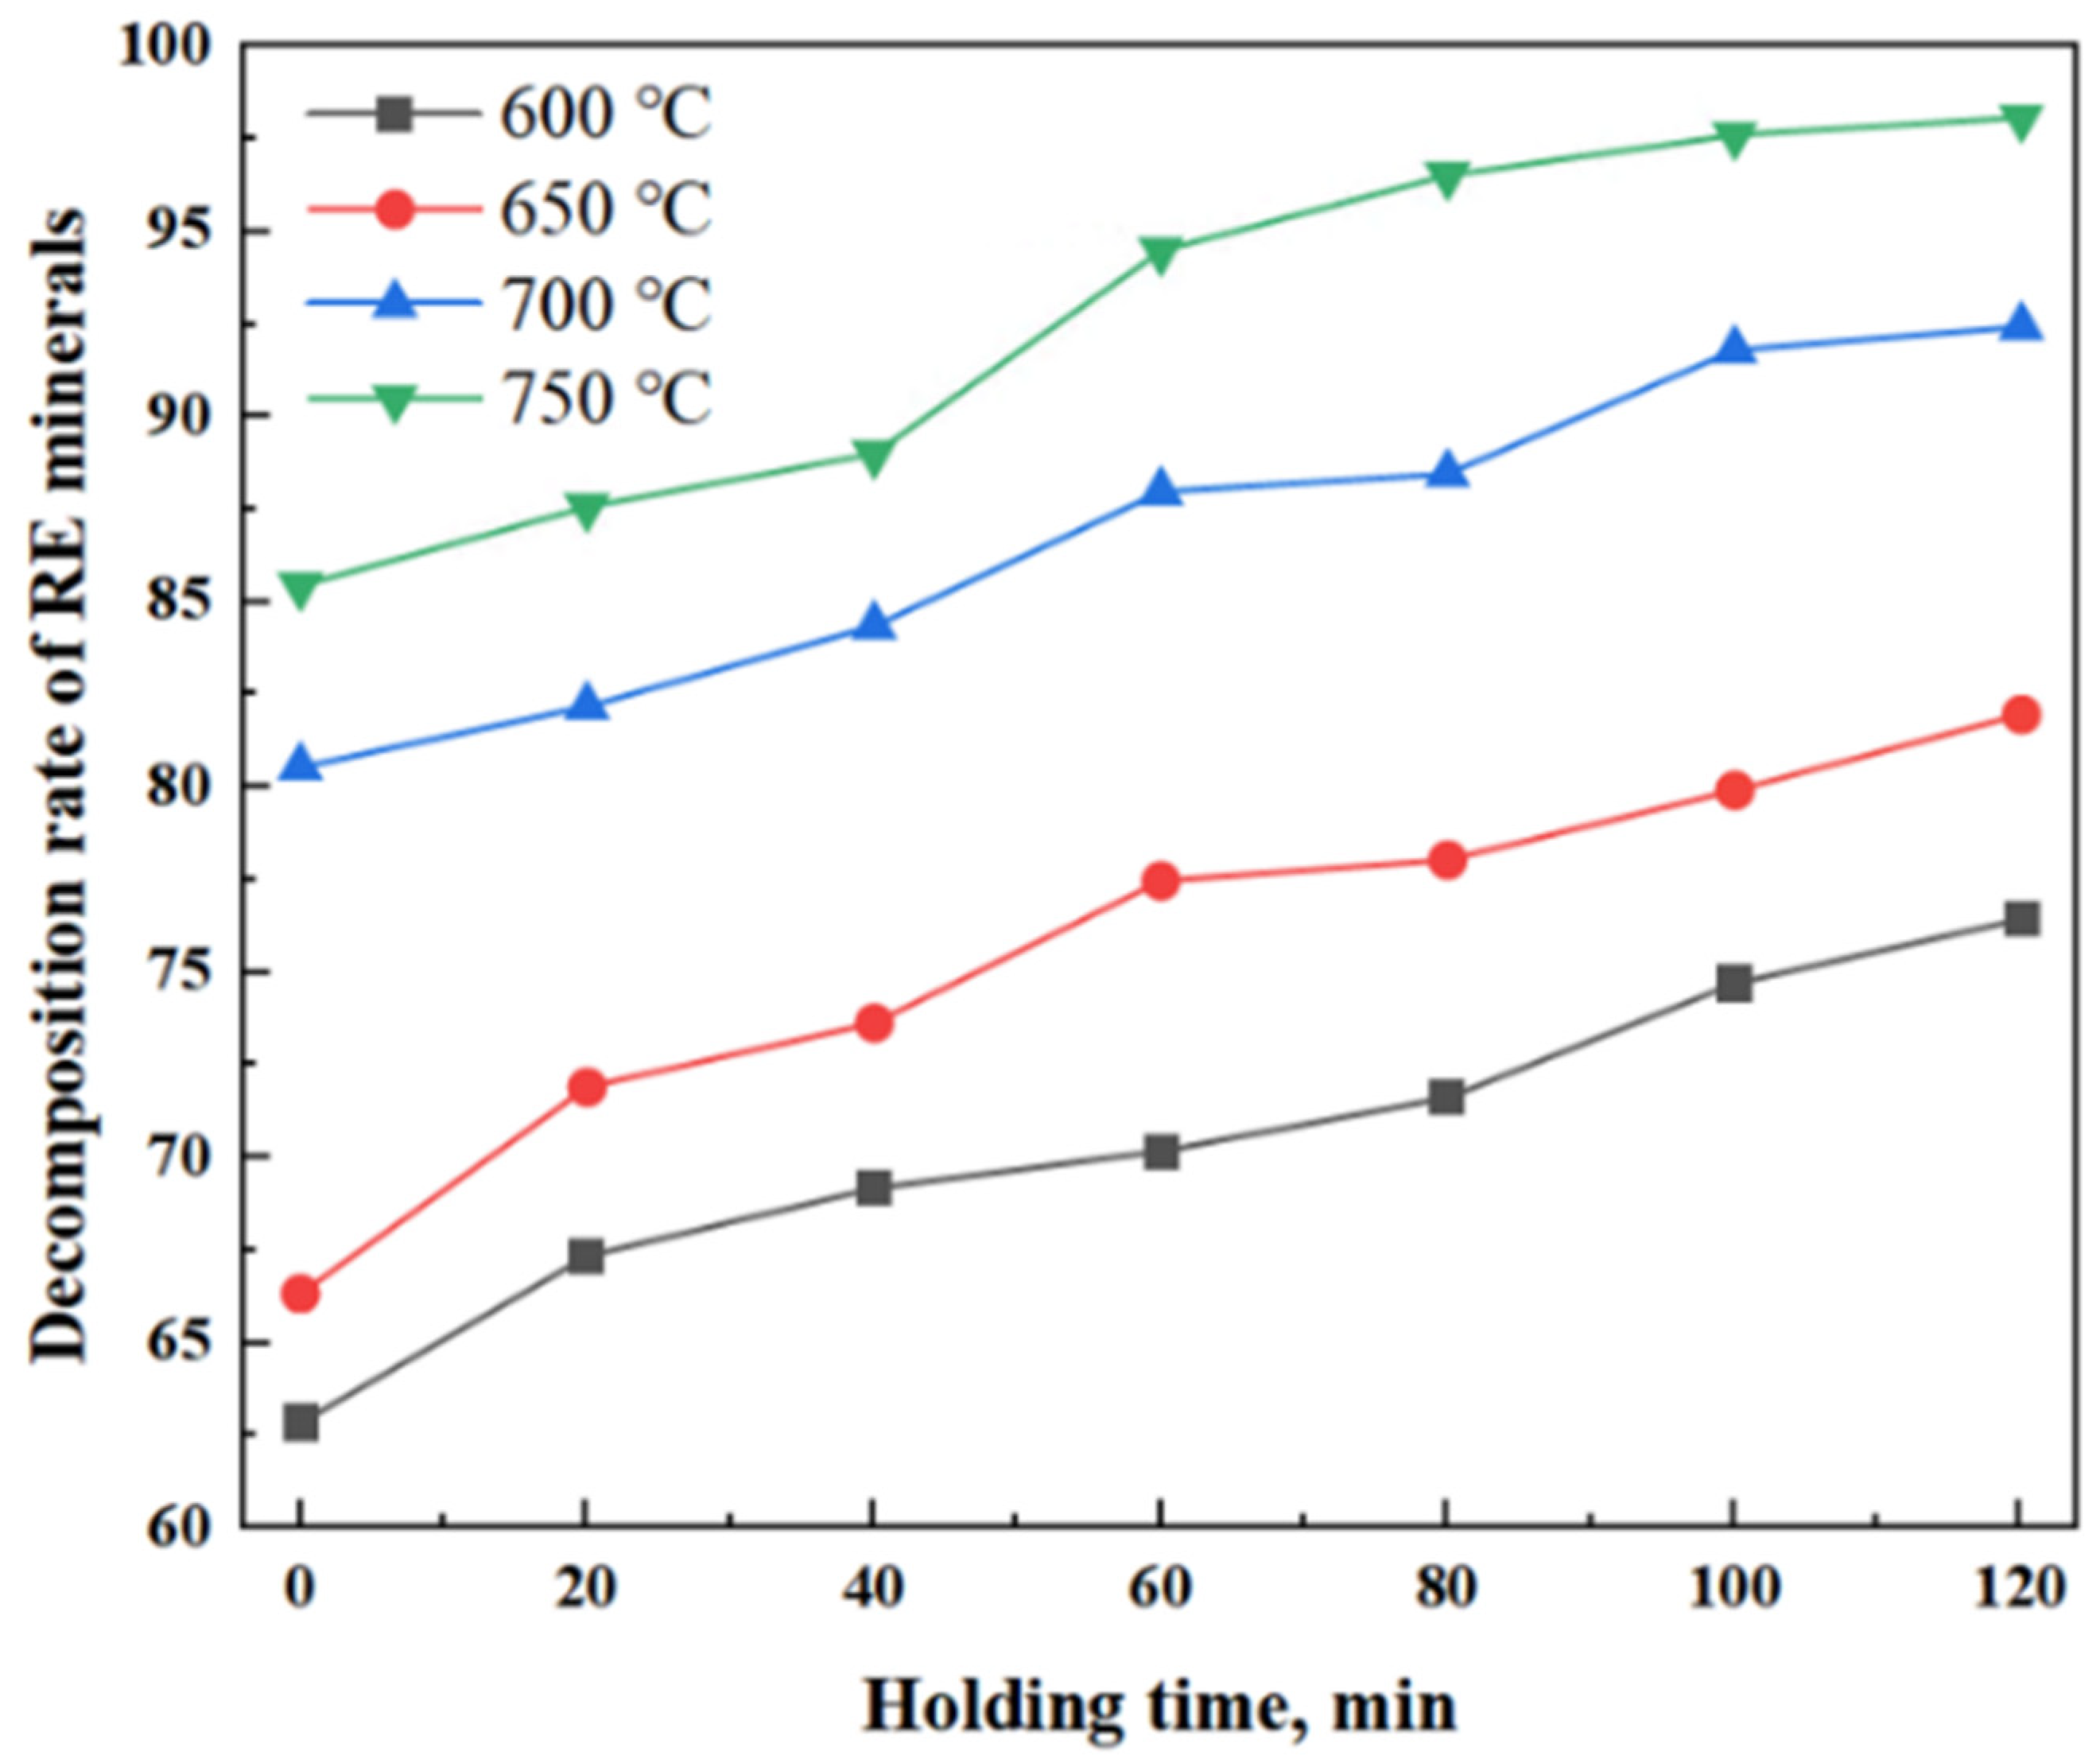
Figure 9.
SEM image of the leaching residues of samples roasted at different temperatures for 120 min: (a,b) 600 °C, (c,d) 750 °C; H, L, and N are BaSO4; J and K are Na(Fe, Sc)Si2O6; G and M are niobium minerals; I is REPO4.
Figure 9.
SEM image of the leaching residues of samples roasted at different temperatures for 120 min: (a,b) 600 °C, (c,d) 750 °C; H, L, and N are BaSO4; J and K are Na(Fe, Sc)Si2O6; G and M are niobium minerals; I is REPO4.
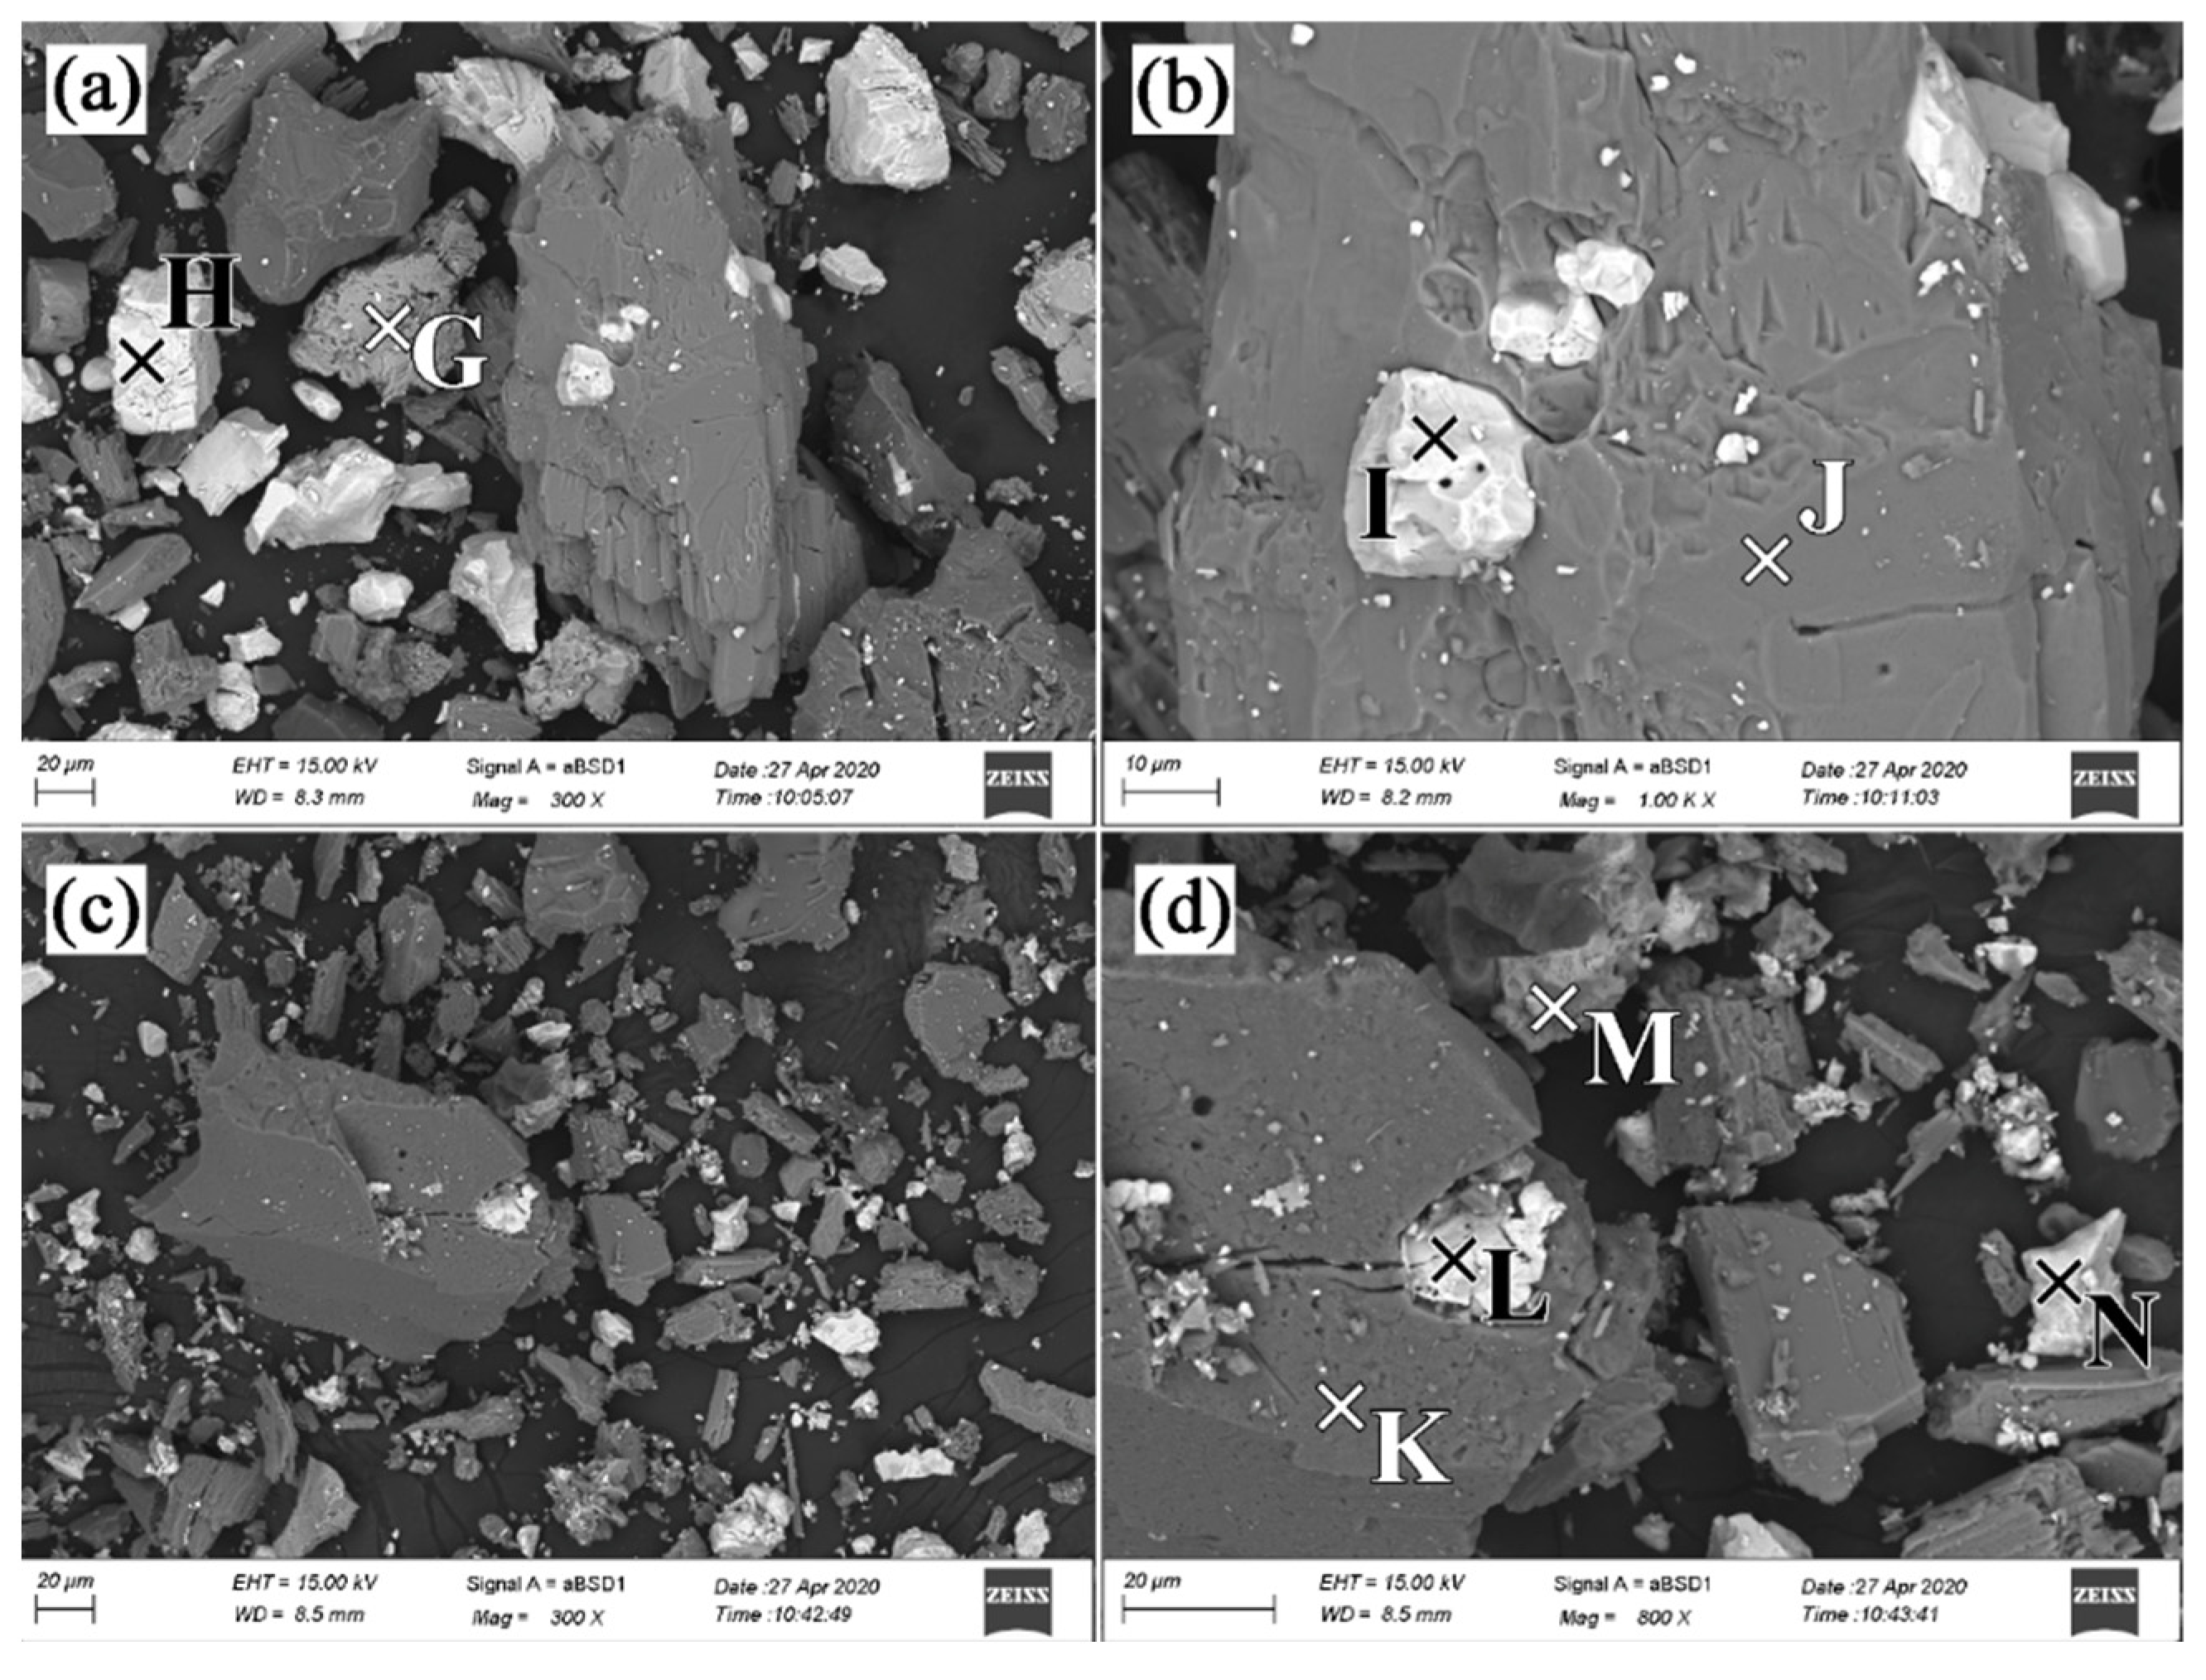
Figure 10.
EDS analysis results of points in Figure 9.
Figure 10.
EDS analysis results of points in Figure 9.

Figure 11.
1 − 2/3x − (1−x)2/3 with respect to holding time for decomposition rate of RE minerals at various roasting temperature.
Figure 11.
1 − 2/3x − (1−x)2/3 with respect to holding time for decomposition rate of RE minerals at various roasting temperature.

Figure 12.
Arrhenius plot for decomposition rate of RE minerals.

Table 1.
Chemical composition of the tailing sample (wt.%).
| Fetotal | REO | Nb2O5 | Sc | CaO | SiO2 | BaO | MgO |
| 13.06 | 7.09 | 0.11 | 0.01 | 30.34 | 11.71 | 4.13 | 3.32 |
| Al2O3 | MnO | TiO2 | F | S | P | Na2O | K2O |
| 1.39 | 1.15 | 0.80 | 12.50 | 1.66 | 1.39 | 1.03 | 0.52 |
Table 2.
EDS analysis results of points in Figure 6 (wt.%).
Table 2.
EDS analysis results of points in Figure 6 (wt.%).
| Element | Point A | Point B | Point C | Point D | Point E | Point F |
|---|---|---|---|---|---|---|
| C | 3.49 | 4.68 | 1.23 | 5.64 | 3.90 | 4.40 |
| O | 8.10 | 24.56 | 5.25 | 30.06 | 40.18 | 34.51 |
| F | 42.98 | 4.05 | 3.57 | - | - | - |
| Mg | 3.38 | 9.85 | 1.97 | 10.87 | 47.81 | 17.26 |
| Si | - | - | - | 1.23 | - | 5.89 |
| P | - | - | - | - | 1.18 | 1.55 |
| S | - | - | - | - | - | 2.12 |
| Ca | 37.95 | 6.04 | 10.50 | 5.62 | 3.05 | 10.76 |
| Fe | 0.63 | 11.78 | 1.07 | 14.74 | 1.76 | 6.64 |
| Mn | - | - | - | - | - | 0.57 |
| Ba | - | - | - | - | 0.99 | 3.86 |
| La | - | 19.41 | 23.01 | 14.75 | - | 5.42 |
| Ce | - | 14.12 | 40.05 | 7.86 | 1.15 | 3.05 |
| Pr | - | 2.19 | 3.70 | 3.19 | - | 1.21 |
| Nd | - | 3.33 | 9.66 | 6.05 | - | 2.75 |
Table 3.
EDS analysis results of points in Figure 9 (wt.%).
Table 3.
EDS analysis results of points in Figure 9 (wt.%).
| Element | Point G | Point H | Point I | Point J | Point K | Point L | Point M | Point N |
|---|---|---|---|---|---|---|---|---|
| C | 1.38 | 4.63 | 3.60 | 3.78 | - | 0.86 | - | 2.38 |
| O | 10.78 | 25.00 | 17.32 | 25.65 | 45.41 | 5.56 | 27.28 | 17.92 |
| F | - | - | - | - | - | - | 2.69 | - |
| Na | - | - | - | 7.34 | 11.21 | 0.33 | 2.74 | 1.01 |
| Al | - | - | - | - | - | 0.59 | - | 0.29 |
| Si | 0.45 | - | - | 26.02 | 23.81 | 5.65 | 3.02 | 2.85 |
| P | - | - | 11.68 | - | - | - | - | - |
| S | - | 12.93 | - | - | - | 5.99 | - | 12.32 |
| Ca | - | - | - | 0.40 | 0.41 | - | 16.70 | - |
| Sc | - | - | - | - | 0.57 | - | - | - |
| Ti | 20.90 | - | - | - | - | 3.07 | - | |
| Fe | 64.39 | - | - | 36.80 | 18.59 | 0.69 | 0.73 | 1.23 |
| Nb | 2.11 | - | - | - | - | - | 41.29 | - |
| Ba | - | 57.39 | - | - | - | 80.32 | - | 62.01 |
| La | - | - | 13.80 | - | - | - | - | - |
| Ce | - | - | 36.37 | - | - | - | 1.59 | - |
| Pr | - | - | 4.91 | - | - | - | - | - |
| Nd | - | - | 12.32 | - | - | - | 0.89 | - |
Publisher’s Note: MDPI stays neutral with regard to jurisdictional claims in published maps and institutional affiliations. |
© 2021 by the authors. Licensee MDPI, Basel, Switzerland. This article is an open access article distributed under the terms and conditions of the Creative Commons Attribution (CC BY) license (https://creativecommons.org/licenses/by/4.0/).
Share and Cite
MDPI and ACS Style
Zhou, Y.; Song, S.; Liu, J.; Cheng, G.; Yang, H.; Xue, X. Thermal Decomposition Kinetics of Rare Earth Minerals in Tailings with Addition of MgO. Metals 2021, 11, 701. https://doi.org/10.3390/met11050701
AMA Style
Zhou Y, Song S, Liu J, Cheng G, Yang H, Xue X. Thermal Decomposition Kinetics of Rare Earth Minerals in Tailings with Addition of MgO. Metals. 2021; 11(5):701. https://doi.org/10.3390/met11050701
Chicago/Turabian StyleZhou, Yan, Shizhe Song, Jianxing Liu, Gongjin Cheng, He Yang, and Xiangxin Xue. 2021. "Thermal Decomposition Kinetics of Rare Earth Minerals in Tailings with Addition of MgO" Metals 11, no. 5: 701. https://doi.org/10.3390/met11050701
Note that from the first issue of 2016, this journal uses article numbers instead of page numbers. See further details here.