
Effects of Microstructure on the Low-Temperature Toughness of an X80 × D1422 mm Heavy-Wall Heat-Induced Seamless Bend


1
National Engineering Research Center for Equipment and Technology of Cold Strip Rolling, Yanshan University, Qinhuangdao 066004, China
2
China Petroleum Pipeline Engineering Corp, Langfang 065000, China
3
School of Materials Science and Engineering, Hebei University of Technology, Tianjin 300130, China
*
Author to whom correspondence should be addressed.
Metals 2021, 11(7), 1055; https://doi.org/10.3390/met11071055
Submission received: 19 May 2021
/
Revised: 25 June 2021
/
Accepted: 28 June 2021
/
Published: 30 June 2021
Abstract
:The relationship between the microstructure and the low-temperature toughness of an X80 × D1422 mm heavy-wall heat-induced seamless bend was investigated, including the influence of microstructure on crack initiation and crack propagation. Using optical microscopy, scanning electron microscopy, transmission electron microscopy, and electron backscattered diffraction, the microstructure and crystallographic orientation characteristics were studied. An instrumented impact tester was used to investigate the impact toughness. The results showed that during the hot bending process, there was a difference in the induction heating temperature and the cooling rate results in the uneven microstructure of the inner surface, center position, and outer surface of the bend. The center position was mainly composed of granular bainite and exhibited the best combination of strength and toughness. The ductile–brittle transition temperatures of the inner surface, center position, and outer surface were −88, −85, and −60 °C, respectively. In the process of impact deformation, the non-uniformly distributed strain concentration regions are likely to cause uneven distribution of plastic deformation and the nucleation of microcracks. The high ratio of high-angle grain boundaries and the smaller effective grain size of the inner surface and center position lead to higher crack growth absorption energy. The low crack propagation energy of the outer surface is attributed to the fact that the high-angle grain boundary does not effectively deviate or arrest the crack propagation, and multiple microcracks are connected to one another and cause fracture failure.
1. Introduction
The average annual growth rate of oil and natural gas consumption is increasing rapidly in an accelerated manner. In order to ensure that the supply of oil and natural gas meets the huge demand, high pressure, large diameter, large transmission volume, and long-distance transportation have become the inevitable development trends of natural gas pipelines [1,2]. Pipeline steel must not only have excellent mechanical properties but also have good weldability. In particular, high-grade pipeline steel and steel pipes must have a balance of strength, toughness, and plasticity [3].
As an important part of a long-distance pipeline, the bend can not only change the direction of the pipeline but can also buffer the tensile, compressive stress and torque attached to the pipeline. At present, the bending process usually adopts two methods: Cold bending and heat-induced bending. For large-diameter and heavy-wall pipes, the heat-induced bending process is usually adopted, which can reduce the cost of the bending process and can effectively ensure the control of the pipe shape. In the heat-induced bending process, in order to ensure the quality of the bend and to reduce the formation of stress, the induction heating temperature is often higher than the phase transition temperature of the parent pipe. However, for a longitudinally welded pipe that adopts the controlled rolling and controlled cooling processes to ensure good strength and toughness during the hot bending process, it is inevitable that the microstructure of the parent pipe and the weld will be severely deteriorated, resulting in a serious decrease in low-temperature toughness, so that it cannot meet the design requirements. Therefore, it is urgent to develop a new type of seamless bend that meets the requirements of large diameter and heavy wall, which can effectively ensure its low-temperature toughness as the development direction of the bend [4,5,6,7]. In the process of heat-induced bending, after the steel pipe is heated by an induction coil, the heating zone gradually deforms under the action of the propulsion force. Because the heating and propulsion process is continuous, induction heating can meet the requirements of working conditions, and its fast heating speed also determines the uneven heating temperature of a large heavy-wall bend [8,9]. For a heavy-wall bend, the heating and cooling of the inner surface must rely on heat conduction from the outside to the inside. Therefore, the inner surface, center position, and outer surface of a heavy-wall bend must have differences in microstructure and performance, especially in terms of strength and toughness.
Impact toughness, as one of the most important properties of materials, depends on the microstructure of the material and directly reflects the resistance of the material to crack propagation [10,11,12,13]. It is generally believed that in the process of brittle fracture, the nucleation and propagation of cleavage cracks have an influence on the impact absorption energy. There is a large number of models or fracture mechanisms to describe the nucleation and propagation of cleavage cracks [14,15,16]. The nucleation of cracks usually includes nucleation at the grain boundaries through dislocation slip accumulation, the fracture of second-phase particles or martensite–austenite constituents (M–A constituents) to form microcracks, and the separation of M–A constituents from the matrix structure. Crack propagation is manifested as the principal stress at the crack tip exceeding the fracture strength of the material, which leads to unstable propagation of the crack or the formation of multiple microcracks at the crack tip, which leads to rapid propagation failure through the interconnection of microcracks. Both high-angle grain boundaries and effective grain size in the microstructure have an important influence on crack propagation. Zhao et al. reported the influence of an ultra-low carbon bainite steel microstructure on low-temperature impact properties, indicating that high-angle grain boundaries can deflect the crack from extending and efficiently hinder the crack propagation [17]. Lan et al. reported that the effect of microstructural characteristics on the toughness of the simulated coarse-grained heat-affected zone of high-strength, low-carbon bainitic steel, indicating that M–A constituents are primarily responsible for the low toughness of the simulated coarse-grained heat-affected zone (CGHAZ). The lath martensite formed at a high cooling rate has a small effective grain size and a high-density high-orientation boundary, which plays an important role in improving the crack propagation energy [18].
A large number of studies have reported the influence of the heat-induced bending process on the microstructure and mechanical properties of the inner arc side, the neutral axis, and the outer arc side of a hot bending pipe, as well as on the microstructure evolution of the welding heat-affected zone after heat-induced bending. Wang et al. studied the influence of the hot bending parameters of an X80 hot bending pipe on the microstructure, mechanical properties, and toughness [6]. Zhou et al. reported the influence of the tempering process on the microstructure and mechanical properties of heavy-wall hot bending [19]. Wang et al. reported the microstructure evolution of an X90 heat-induced bend, including the influence of grain orientation, grain boundary, texture, and recrystallization on the mechanical properties of the inner arc side, neutral axis, and outer arc side [7]. Wang et al. reported the microstructure evolution and mechanical properties of X100Q seamless bracing pipe steel subjected to quenching, tempering treatment, and welding [20,21]. Godeforid et al. reported the influence of the manufacturing process and heat treatments on the resulting microstructures and mechanical properties of an API 5L seamless steel pipe and found that the quenching and tempering process increased the tensile mechanical properties and fracture toughness but combined to give a significant decrease in fatigue crack growth resistance [22]. However, there are few reports on the microstructure inhomogeneity of an X80 × D1422 mm heavy-wall seamless bend during the induction heating process and its influence on the mechanical properties and low-temperature toughness.
In this paper, an X80 × D1422 mm heavy-wall heat-induced seamless bend was prepared, and the reasons for microstructure inhomogeneity of the heavy-wall seamless bend and its influence on the mechanical properties and impact toughness were studied. The microstructural parameters, including grain boundary misorientation distribution, effective grain size, and strain concentration, were systematically observed, and their effects on low-temperature toughness were studied. In addition, secondary crack paths underneath the fracture surface of specimens were also observed. The microscopic mechanism of the initiation and propagation of cleavage cracks at different positions of the heavy-wall seamless bend is discussed.
2. Experiment
2.1. Materials and the Heat-Induced Bending Process
The material used in this study was an X80 × D1422 mm heavy-wall heat-induced seamless bend with a wall thickness of 38.5 mm, an outer diameter of 1422 mm, and a pipe length of 6220 mm. The chemical composition of the heat-induced seamless bend is listed in Table 1.
From the continuous cooling transformation curve, the starting temperature (Ac1) and the completion temperature (Ac3) for austenitization of the alloy steel were 776 and 863 ℃, respectively. The alloy adopts a composite strengthening and toughening mechanism of Nb+Ti+V. Micro-alloying elements such as Nb, V, and Ti can precipitate in the ferrite matrix and on the dislocations, refining the grain and providing high strength. The addition of Ni to pipeline steel can improve its strength and low-temperature toughness, and can also refine ferrite grains. The heat-induced bending process uses induction heating, online rapid cooling, and subsequent tempering. The heat-induced bending process, such as the heating temperature, pushing velocity, and tempering temperature, for the X80 × D1422 mm heavy-wall heat-induced seamless bend are shown in Table 2. A schematic diagram of the heat-induced bending process is shown in Figure 1a–c. Figure 1e,f show the parent pipe of the bend and a production site diagram of industrial induction heating bending, respectively. The parent pipe was induction-heated to 1050 °C at a medium frequency, which is higher than the austenitizing temperature, and was pushed to plastic deformation at this temperature. In order to ensure the strength after hot bending, online water-cooling must be performed and the bend must then be tempered at 580 °C to ensure a good combination of strength and toughness. Normally, the wall thickness on the outer arc side of the bend is slightly reduced, the wall thickness on the inner arc side is slightly increased, and the wall thickness of the neutral axis is almost unchanged. The main purpose of this paper was to study the influence of the large differences in microstructure caused by the inhomogeneous temperature distribution of the heavy-wall bend during the hot bending process on the mechanical properties, and a smaller bending angle and a larger bending radius were used in this experiment. Therefore, the test sample was located on the outer arc side without considering the deformation factors during the bending process, as shown in Figure 1d, named as the inner surface (designated as S1), the center position (designated as S2), and the outer surface (designated as S3).
2.2. Testing the Mechanical Properties
All tensile and impact samples were separated from the transverse direction of S1, S2, and S3. Testing of the tensile property was carried out with the ASTM E-8 standard on an 810 Materials Testing System (MTS810) with a strain rate of 1.3 × 10⁻³/s at room temperature. The standard tensile specimens with a diameter of 8 mm and gauge length of 25 mm were machined according to the ASTM E-8 specification. The low-temperature toughness was determined on a Zwick/Roell 450 J impact tester (Zwick, Ruhr Industrial Area, North Rhine Westphalia, Germany) with a test Xpert® II data acquisition system, which can record the impact load–time curve. The standard size of the samples was a V-shaped notch of 10 mm × 10 mm × 55 mm. A lower temperature was obtained by controlling the mixing ratio of liquid nitrogen and ethanol. The sample was incubated at the test temperature for 15 min before testing. The test temperatures were 20, 0, −20, −40, −60, −80, −100, −120, −160, and −196 ℃. All tensile and impact samples were measured repeatedly three times, and the average value was taken.
2.3. Microstructure Analysis
The samples for optical microscopy (OM) and scanning electron microscopy (SEM) observation were prepared by mechanical polishing and etching (4% nital). Standard metallographic techniques were adopted to observe the microstructure using a Zeiss optical microscope (Zeiss, Jena, Germany) and a scanning electron microscope Quanta 450 (Hitachi Ltd., Tokyo, Japan) field emission gun operating at 20 kV. Transmission electron microscopy (TEM) (JEOL, Tokyo, Japan) specimens of 0.4 mm in thickness were mechanically polished to 40 μm and punched into Φ3 mm discs; then, they were twin-jet electrolytically polished in a solution containing 10% perchloric acid and 90% glacial acetic acid at 50 V/−30 ℃ for approximately 2 min. The observation position of SEM and TEM was located in the center of each sample, and the observation surface was perpendicular to the radial direction. Electron back-scattering diffraction (EBSD) (Oxford Instruments Group, Oxford, United Kingdom) with an orientation imaging microscope system was employed on a Hitachi S-3400N SEM (Hitachi Ltd., Tokyo, Japan) operated at an acceleration voltage of 20 kV to investigate the grain boundary characteristics and the grain misorientation distribution. The positions of the specimens were the same as those of the mechanical property tests. The dimension of the scan area was approximately 473 μm × 355 μm with a step size of 0.3 μm. Channel5-Oxford Instruments software (Oxford Instruments Group, Oxford, United Kingdom) was used for the post-processing of the collected EBSD patterns. Fracture surface observation was also conducted using an SEM Quanta 450 field emission gun operating at 30 kV. To study the correlation between microcrack initiation, crack propagation, and microstructure, the cross-sectional section beneath the impact fracture surface of the Charpy impact specimens was investigated, as illustrated in Figure 1g.
3. Results
3.1. Microstructure Properties
Figure 2 shows the microstructure of the different sampling positions of the X80 heavy-wall heat-induced seamless bend, including S1, S2, and S3. The microstructure inhomogeneity is attributed to the different heating temperatures and cooling rates at different positions of the heavy wall during the hot bending process. The heating temperature and cooling rate from high to low were S3, S2, and S1. S1 was mainly composed of polygonal ferrite (PF) and partly of degenerate pearlite (DP), as shown in Figure 2a,d. Polygonal ferrite, at a slower cooling rate and a high transformation temperature, preferentially nucleated from the austenite grain boundary and had a regular grain shape. Degraded pearlite was mainly distributed between the ferrite matrix. Due to the low cooling rate, when carbon-rich austenite transformed at a higher temperature than Ms, it transformed into the degraded structure of the M–A constituents during the subsequent cooling process. The degraded pearlite showed a black block under an optical microscope, and a white spot area under a scanning electron microscope, as shown in Figure 2a,d. The small grain size of S1 is attributed to the lower heating temperature, the austenite grains not growing, the carbonitride pinning the austenite grain boundary during the austenitizating process, and the austenite grain boundary providing a large number of nucleation sites. S2 was mainly composed of granular bainite (GB), as shown in Figure 2b,e. The transformation temperature of granular bainite was the highest in the bainite transformation process and was formed at a faster cooling rate. Observed under an optical microscope, it showed irregular blocks. Observed under a scanning electron microscope, the bright white grain boundaries outlined the shape of granular bainite. The grain size of S2 was larger than that of S1 and smaller than that of S3. S3 was mainly composed of lath bainite (LB), as shown in Figure 2c,f. The formation temperature of lath bainite was lower than that of granular bainite, and it was formed under rapid cooling. The ferrite laths are clearly visible under an optical microscope. Observed under a scanning microscope, the matrix ferrite exhibited a parallel arrangement. Due to the higher heating temperature of S3, the original austenite grains grew and the number of austenite grains decreased, the density of the carbonitrides rich in Nb and V pinning the original austenite grain boundaries decreased, and the solid solubility of the elements that stabilize austenite increased, which increased the thermodynamic stability of the austenite phase, decreased Ar3, and increased the thermodynamic driving force for the nucleation and growth of lath bainite. Obvious prior austenite grain boundaries were observed in S3, and the original austenite grain size was larger.
In order to further reveal the substructure of the investigated steel at different positions, a transmission electron microscope was used for a detailed observation. The polygonal ferrite with an approximately the equilibrium structure had a lower dislocation density. No obvious substructure was found in S1, and a large number of discontinuous lamellar cementite (Fe3C) were presented, as shown in Figure 3a,b. Figure 3c,d presented a typical granular bainite microstructure, which showed that the elongated ferrite laths had a lath profile and were arranged in bundles. The ferrite lath had a high density of dislocations. The dark black massive or strip-shaped M–A constituents were distributed between the ferrite laths or on the irregular ferrite. The diffusion coefficient of C was large, and C can diffuse in austenite over long distances. The ferrite phase (α) was formed in the low-C zone, and C was concentrated in the small untransformed austenite area. With the continuous precipitation of ferrite, the C content in the austenite structure increased. As the temperature further decreased, part of the carbon-rich austenite transformed into martensite and bainite, and the other part remained austenite at room temperature, and then transformed into M–A constituents. Figure 3e,f showed the microscopic morphology of lath bainite. The lath-shaped ferrites were arranged in parallel, with clear and straight laths, and formed packets. There was a high density of dislocations in the laths. Between the ferrite laths, there were film-like M–A constituents, which were been characterized by electron diffraction patterns, and the results were inserted in Figure 3f. The result was consistent with the above analysis, indicating that the retained austenite phase existed in it. S3 had more M-A components than S2, but its size was smaller than S2.
3.2. Mechanical Properties
Figure 4 shows the tensile properties of the X80 heavy-wall heat-induced seamless bend at different sampling positions. The yield strengths of S1, S2, and S3 were 563, 596, and 637 MPa, respectively, while their tensile strengths were 686, 745, and 829 MPa, respectively. Meanwhile, their total elongation was 17.2%, 17.7%, and 14.2%, respectively. Although the dislocation density of S1 was low, due to the low heating temperature, the austenite grain size was small, and the grain refinement resulted in the low tensile strength and good uniform elongation of S1. The tensile strength of S2 was lower than that of S3; this is because the dislocation density of granulated bainite was lower than that of bainite ferrite, and its dislocation strengthening effect was lower than that of S3. However, its grains were finer than those of S3, and the combined effect of fine grain and dislocation strengthening resulted in S2 exhibiting a better combination of strength and toughness, as well as a higher uniform elongation. S3 exhibited the highest tensile strength, due to the fact that during tensile deformation, the high density of dislocations in the lath bainite were entangled and the carbonitrides precipitated by tempering hindered the movement of the dislocations.
3.3. Impact Toughness and Fracture Morphology
Figure 5 shows the average value of the impact absorption energy of S1, S2, and S3 at different temperatures. At room temperature, the impact absorption energy of S1, S2, and S3 was 245, 235, and 197 J, respectively. Corresponding to the upper platform of the impact curve, the impact energy of the lath structure S3 was slightly lower than that of S2 and S1, while S1 and S2 were relatively close. As the test temperature decreased, the impact energy of S1, S2, and S3 decreased and the difference between the impact energy of S1, S2, and S3 gradually increased, showing ductile–brittle transition behavior at higher temperatures. At −60 °C, this was 174, 185, and 109 J in sequence. When the test temperature was further reduced, at −120 ℃, the corresponding impact energy of S1, S2, and S3 was 13, 8, and 6 J, respectively. According to the experimental data, Boltzmann function fitting was performed, and a curve of the impact energy with the test temperature was obtained. The Boltzmann function [23] is described in Equation (1):
where A1 and A2 are the parameters representing the lower platform value and the upper platform value of the ductile–brittle transition curve, respectively; x0 is the center value of the ductile–brittle transition curve, that is, the ductile–brittle transition temperature (DBTT); x represents the abscissa of the fitted curve, which reflects the change of temperature. The goodness of fit of all curves indicates that the fitting function better reflects the trend of impact energy changes. The ductile–brittle transition temperatures were estimated as the temperature corresponding to half of the sum of the upper and lower shelf energy. The DBTT of S1, S2, and S3 was −88, −85, and −60 ℃, respectively. In order to compare the impact of different microstructures on the impact toughness, an instrumented impact tester was used to record the relationship between impact load (or impact absorption energy) and displacement during the impact test. According to the typical load–time curve, the whole impact process can be divided into four stages: elastic deformation stage, plastic deformation stage, crack propagation stage, and ductile fracture stage [24,25,26]. When the test temperature is in the ductile–brittle transition temperature range of the material, the load–displacement curve can completely show the four stages of the impact process. When the test temperature is close to the upper or lower platform of the ductile–brittle transition curve, part of the transition stage may disappear. It is generally believed that in the impact process, the stage before the load reaches the peak is considered the stage of crack initiation, and there will be no cracks in the material. The integral area enclosed by the loading curve from the beginning to the peak value is the energy consumed in the crack initiation process, that is, the crack initiation work (Wi). The stage from the peak load to the fracture is the crack propagation stage, and the integral area from the peak to the fracture area of the corresponding load curve is the energy consumed by the crack propagation process, that is, the crack propagation work (Wp). According to the different manifestations of the load–displacement curve, combined with the characteristics of the microstructure, the influence of the microstructure of the material on the impact fracture behavior can be analyzed. Figure 6 shows the relationship curve between the impact load (impact energy) and displacement of S1, S2, and S3 at −60 ℃. The specific impact toughness results are shown in Table 3. S1, S2, and S3 correspond to the total impact absorption energies of 174, 185, and 109 J, respectively. The single value of impact toughness fluctuated to a certain extent, showing a certain degree of dispersion, which may be related to the distribution of high-angle grain boundaries and brittle particles in the structure near the notch. As shown in Table 3, the crack initiation work corresponding to the crack initiation stages of S1, S2, and S3 were relatively similar, being 70, 67, and 65 J, respectively. The crack propagation absorption energy of S3 was 44 J, while the crack propagation absorption energies of S1 and S2 were 114 and 118 J, respectively. The main difference in the total energy absorbed by the impact came from the crack propagation energy corresponding to the crack propagation stage. The ratio of the crack propagation absorption energy of S1 and S2 to the total impact absorption energy (59.8% and 63.8%) was significantly higher than that of S3 (40.4%). According to the microstructure of the sample, the bainitic ferrite of S3 exhibited poor low-temperature impact toughness, while S1 and S2 exhibited good low-temperature impact toughness.
Figure 7 shows the morphological characteristics of the impact fractures of S1, S2, and S3 at −60 ℃. The cleavage facets of S1 and S2 appeared to contain high-density cleavage river patterns, accompanied by some ductile tear bands, which contained a large number of small dimples beneficial for consuming energy in crack propagation. The ductile tear zone was due to the deflection of crack propagation by high-angle grain boundary (HAGB); in particular, when the crack passed through the twisted grain boundary, a tearing edge formed between two intersecting cleavage planes. S1 and S2 showed smaller cleavage facet sizes. In the ductile–brittle transition interval, the quasi-cleavage fracture was mainly controlled by crack propagation behavior. S3 showed a complete cleavage fracture morphology, with high-density cleavage river patterns on the surface of the fracture and a large cleavage facet size. The crack propagation resistance on the large cleavage plane was lower, as was the crack propagation energy consumption. The path length of the straight-line propagation of the cleavage crack was related to the effective grain size.
3.4. Grain Orientation Image Maps and Grain Boundary Misorientation Distribution
Figure 8 presents a grain orientation distribution map and a grain boundary misorientation distribution map of S1, S2, and S3. As can be seen in Figure 8a–c, the color distribution is uneven, which means the direction of the grain orientation distribution is significantly different. The prior austenite grains of S3 were divided into many packets, with each packet composed of several blocks, and each block composed of several laths. The packets were composed of laths with the same habit plane, while the blocks were composed of laths in the same or similar orientation. The packet boundaries of the different orientations were high-angle grain boundaries, and the lath boundaries with similar orientations were small-angle grain boundaries [27,28,29]. It is generally believed that for the low-carbon bainite transformation mechanism, LB has an orientation distribution relationship with prior austenite, which is the N–W (Nishiyama–Wassermann) relationship and the K–S (Kurdjumov–Sachs) relationship, corresponding to the misorientation distribution in 10.53°–21.06° and 47.11°–60°, respectively [30,31,32]. In Figure 8d–f, the black line represents the high-angle grain boundary, and the difference in orientation between adjacent grains is considered to be more than 15°; the green line represents a low-angle grain boundary (LAGB), and the difference in adjacent grain orientation is considered to be less than 15°.
4. Discussion
4.1. Effect of the High-Angle Grain Boundary on Crack Propagation
In order to investigate the influence of high-angle grain boundaries on crack growth, the distribution of the misorientation angles was analyzed with the help of EBSD. High-angle grain boundaries are defined as grain boundaries with misorientation greater than 15°, while low-angle grain boundaries are defined as grain boundaries with misorientation of 2°–15°. The prior austenite grain boundaries in S3 are considered to be high-angle grain boundaries. Due to the complex arrangement of atoms in the grain boundaries, the structure of the high-angle grain boundaries was both tilted and twisted. When a crack meets a high-angle grain boundary, the crack propagation not only changes direction, but sometimes suddenly increases, and sometimes suddenly decreases or disappears, so that it cannot pass continuously [33,34]. Therefore, a high-angle grain boundary can deviate or arrest propagation path, which hinders crack propagation, consumes more energy, and improves the toughness of the material. Low-angle grain boundaries are composed of dislocation substructures, which are generally considered to only affect the strength of the material, and the arrest and deflection of crack propagation is not obvious. The distributions of grain boundary misorientations from 0° to 62° of the specimens are represented in Figure 9, which reveals the LAGBs and HAGBs were composed of two-peak distributions, mainly in the ranges of 2°–20° and 50°–62°. The corresponding statistical results of the angular distribution of the grain boundary misorientation are shown in Table 4. The proportions of high-angle grain boundaries of S1, S2, and S3 were 41.1%, 38.3%, and 29.1%, respectively. The characteristics of crack propagation and crack arrest can be further explained by observing the morphological characteristics of secondary cracks under the fracture surface, as shown in Figure 10. In the S1 and S2 specimens, the crack encountered the grain boundaries during the propagation process, and the crack propagation direction obviously deviated or the cracks were arrested at the grain boundaries, indicating that the high-angle grain boundaries had strongly hindered crack growth. There was no obvious crack propagation hindrance in the grain boundary of S3. When the crack encountered a high-angle grain boundary, a large number of dislocations accumulated at the crack tip, resulting in concentrated stress, and dislocations began to move in adjacent grains, while dislocation slip caused the direction of the crack propagation to change. Therefore, the greater the difference in orientation between grains, the greater the retardation of the crack propagation process. The more high-angle grain boundaries, the more energy consumed by crack propagation, and the more beneficial it is to improve toughness [18].
4.2. Effect of Efficient Grain Size on Toughness
EBSD is suitable for defining and quantifying the characteristics of microstructures, particularly irregular grain boundaries. In the field of crystallography, the HAGBs obtained from EBSD can reveal the effective grain size (EGS). The effective grain size is a very important indicator to measure the toughness of a material, and the grain boundaries with a grain orientation greater than 15° can be used to calculate the effective grain size. In order to quantify EGS, the line tracing method was used on the misorientation imaging (Figure 8). Alloy steel with a lath structure exists in a crystallographic unit structure, with a unit structure size between a material’s original austenite grain size and the lath size, and it has an important relationship with the mechanical properties of the material. The size of the structural unit is the effective grain size. Refining the grains can not only increase the strength of the material but can also significantly increase the toughness. The effective grain sizes of S1, S2, and S3 were 6.8, 8.4, and 13.7 μm, respectively, which is related to the original austenite grain size. Due to the heat-induced bending process, the heating temperature of S3 was higher. The smaller the effective grain size, the more high-angle grain boundaries that hindered crack propagation, which increased the energy consumption during the crack propagation process and improved the toughness of the material. Based on the Griffith fracture theory [35], the critical fracture stress σ of the material can be expressed in Equation (2):
where E represents the elastic modulus, d is the least control unit on the fracture microstructure, and λ is the effective surface energy of the fracture. It can be seen that refining the effective grain size can effectively increase the fracture stress. According to previous research, the DBTT [36] of steel is usually described in inverse proportion to the root square of the EGS presented in Equation (3):
where Tt depends on the tensile properties, K is a constant, which slightly differs depending on different microstructures, and d is the effective grain size. The finer the effective grain size, the lower the TDBTT. Therefore, the low-temperature toughness can be effectively improved by reducing the effective grain size [37].
4.3. The Relationship between the Microstructure and he Micromechanism of Cleavage Fracture
In order to reveal the crack initiation and propagation mechanism of microcracks in different microstructures, the local misorientation distribution map and the local misorientation frequency distribution are shown in Figure 11. The higher strain in the crystal lattice can be reflected by the local misorientation angle. The distribution of local misorientation in some areas is obviously uneven [17]. Dark blue represents smaller local misorientation, while green represents medium local misorientation. Very few areas have a high local misorientation value and appear yellow. Larger local misorientation positions represent the strain concentration and a higher dislocation density.
The average local misorientation angles of S1, S2, and S3 were 0.57°, 0.69°, and 0.81°, respectively. The strain concentration area of S1 was mainly located at the grain boundary. Compared to the microstructure, this area was mainly degraded pearlite in the structure. This is because degraded pearlite belongs to the hard and brittle phase compared to the polygonal ferrite matrix structure. The high local misorientation positions of S2 were mainly located in some grain boundaries or grains, and these positions correspond to the M–A constituents located in the grain boundaries and grains. The higher local misorientation distribution of S3 occurred mainly near the laths, which may be related to the M–A constituents and the high dislocation density between the laths. In the process of impact deformation, these strain-concentrated areas are likely to cause dislocation slip accumulation, resulting in non-uniformly distributed plastic deformation and initiation of microcracks. Non-uniformly distributed strain concentration regions are not conducive to energy dissipation during impact deformation. Although the M–A constituents of S3 were smaller in size, its number was larger. In addition, the matrix structure had a higher dislocation density, which is more likely to produce dislocation accumulation during impact deformation, resulting in higher strain concentration and leading to crack initiation in multiple locations that meet the strain conditions. The cleavage fracture nucleation mechanism proposed by Knott [38] is that dislocations accumulate at the front end of the slip zone, resulting in a tensile normal stress, which causes stress concentration at the second phase particles and causes microcracks nucleation. Margolin [39], Lambert-Perlade [40], and Chen J [41] agreed that cleavage fracture is divided into three stages. In the first stage, fracture plastic strain produces effective shear stress to drive dislocation plugging, causing cleavage cracks to nucleate in the second phase or in the hard and brittle phase. In the second stage, the combined action of the external tensile normal stress and the tensile normal stress caused by the dislocation plugging drives the microcracks through the grain boundaries of the matrix grains. In the third stage, the external normal stress drives the grain size cracks to further propagate into adjacent grains, which eventually leads to failure. Figure 12 shows a schematic diagram of the initiation and propagation of cracks in S1, S2, and S3. S1 and S2 had a relatively large proportion of high-angle grain boundaries, which arrested the crack propagation or deviated the direction of crack propagation, which indicates that high-angle grain boundaries play an important role in effectively improving the absorption energy of crack propagation, as shown in Figure 9a,b. In S3, many microcracks were initiated and then rapidly expanded and connected to one another. The load on the impact process dropped rapidly, leading to the occurrence of cleavage fractures. In this process, the high-angle grain boundaries did not effectively hinder the cracks, resulting in lower energy absorption in the crack propagation process in S3.
5. Conclusions
This study investigated the microstructure inhomogeneity of an X80 × D1422 mm heavy-wall heat-induced seamless bend and its influence on low-temperature toughness. The main research conclusions are as follows.
In the heat-induced bending process of an X80 × D1422 mm heavy-wall seamless bend, due to the difference in the heating temperature and cooling rate of the inner and outer surfaces, the microstructure of the outer surface, center position, and inner surface of the bend was mainly lath bainite, granular bainite, and polygonal ferrite, respectively. The tensile strength was 637, 596, and 563, respectively.
The total impact absorption energy can be separated into crack initiation energy and crack propagation energy according to the maximum load value. The crack initiation absorption energy of the inner surface, the center position, and the outer surface were relatively similar. The difference in the total impact absorption energy is due to the larger difference in the absorption energy of crack propagation. The ductile brittle transition temperature was −88, −85, and −60 °C, respectively.
The effective grain sizes of the inner surface, the center position, and the outer surface were in the order 6.8, 8.4, and 13.7 μm, respectively. The effective grain size was refined, the fracture stress increased, the impact toughness improved, and the ductile brittle transition temperature lowered.
In the process of impact deformation, the strain-concentrated area easily caused dislocation slip accumulation, which led to non-uniformly distributed plastic deformation and caused the nucleation of microcracks. In the process of crack propagation, the high-angle grain boundaries of the inner surface and center position played an important role because they effectively deviated and/or arrested the crack propagation and improved the crack propagation absorption energy. On the outer surface, multiple microcracks connected to one another to cause fracture failure. The high-angle grain boundary did not effectively arrest the crack propagation, so the crack propagation absorption energy was low.
Author Contributions
Conceptualization, J.H. and Q.L.; methodology, J.H.; validation, J.H. and Y.L.; formal analysis, J.H. and G.W.; investigation, J.H. and Y.L.; resources, J.H.; data curation, J.H.; writing—original draft preparation, J.H. and G.W.; writing—review and editing, J.H.; visualization, J.H.; supervision, G.W. and Q.L.; project administration, Q.L.; funding acquisition, G.W. All authors have read and agreed to the published version of the manuscript.
Funding
This research and the APC were funded by the National Natural Science Foundation of China (grant no. 51761030).
Institutional Review Board Statement
Not applicable.
Informed Consent Statement
Not applicable.
Data Availability Statement
The data presented in this study are available in this article.
Conflicts of Interest
The authors declare no conflict of interest.
References
- Sharma, S.K.; Maheshwari, S. A review on welding of high strength oil and gas pipeline steels. J. Nat. Gas Sci. Eng. 2017, 38, 203–217. [Google Scholar] [CrossRef]
- Zhao, M.-C.; Yang, K.; Shan, Y. The effects of thermo-mechanical control process on microstructures and mechanical properties of a commercial pipeline steel. Mater. Sci. Eng. A 2002, 335, 14–20. [Google Scholar] [CrossRef]
- Bott, I.; Souza, L.; Teixeira, J.; Rios, P.R. High-strength steel development for pipelines: A brazilian perspective. Metall. Mater. Trans. A 2005, 36, 443–454. [Google Scholar] [CrossRef]
- Wang, X.; Zhou, J.; Liang, Q. Multi-objective optimization of medium frequency induction heating process for large diameter pipe bending. Procedia Eng. 2014, 81, 2255–2260. [Google Scholar]
- Kathayat, T.S.; Hill, R.T.; Goyal, R.K.; Dhar, S. Behaviour of Mechanical Properties of High Wall Thickness and Grade in Hot Induction Bending. In Proceedings of the Offshore Technology Conference, Houston, TX, USA, 30 April–3 May 2012. 22906. [Google Scholar]
- Wang, X.; Xiao, F.-R.; Fu, Y.-H.; Chen, X.-W.; Liao, B. Material development for grade X80 heavy-wall hot induction bends. Mater. Sci. Eng. A 2011, 530, 539–547. [Google Scholar] [CrossRef]
- Wang, B.; Wang, L.; Jiang, Y.; Xu, M.; Lei, B.-B.; Hu, Y.; Wu, D.; Luo, Z.; Liu, L. Microstructure and Mechanical Behavior of X90 Bend Using Local Induction Bending. Trans. Indian Inst. Met. 2016, 70, 115–124. [Google Scholar] [CrossRef]
- Wang, Z.T.; Zhong, H. Theory of pipe-bending to a small bend radius using induction heating. J. Mater. Process. Technol. 1990, 21, 275–284. [Google Scholar]
- Wang, X.; Liao, B.; Wu, D.-Y.; Han, X.-L.; Zhang, Y.-S.; Xiao, F.-R. Effects of Hot Bending Parameters on Microstructure and Mechanical Properties of Weld Metal for X80 Hot Bends. J. Iron Steel Res. Int. 2014, 21, 1129–1135. [Google Scholar] [CrossRef]
- Zhao, Y.; Xu, S.; Li, J.; Zhang, J.; Sun, L.; Chen, L.; Sun, G.; Peng, S.; Zhang, Z. Enhancement of low temperature toughness of nanoprecipitates strengthened ferritic steel by delamination structure. Mater. Sci. Eng. A 2017, 691, 162–167. [Google Scholar] [CrossRef]
- Powar, A.; Gujar, A.; Manthani, N.; Pawar, V.; Singh, R. Effect of Secondary Phase Precipitation on Impact Toughness of Duplex Stainless Steel. Mater. Sci. Forum 2017, 889, 138–142. [Google Scholar] [CrossRef]
- Gao, G.; Zhang, H.; Gui, X.; Luo, P.; Tan, Z.; Bai, B. Enhanced ductility and toughness in an ultrahigh-strength Mn–Si–Cr–C steel: The great potential of ultrafine filmy retained austenite. Acta Mater. 2014, 76, 425–433. [Google Scholar] [CrossRef]
- Huda, N.; Midawi, A.; Gianetto, J.A.; Gerlich, A.P. Continuous cooling transformation behaviour and toughness of heat-affected zones in an X80 line pipe steel. J. Mater. Res. Technol. 2021, 12, 613–628. [Google Scholar] [CrossRef]
- Thompson, A.W.; Knott, J.F. Micromechanisms of brittle fracture. Metall. Trans. A 1993, 24, 523–534. [Google Scholar] [CrossRef]
- Bouyne, E.; Flower, H.M.; Lindley, T.C.; Pineau, A. Use of EBSD technique to examine microstructure and cracking in a bainitic steel. Scr. Mater. 1998, 39, 295–300. [Google Scholar] [CrossRef]
- Fairchild, D.P.; Howden, D.G.; Clark, W. The mechanism of brittle fracture in a microalloyed steel: Part I. Inclusion-induced cleavage. Metall. Mater. Trans. A 2000, 31, 641–652. [Google Scholar] [CrossRef]
- Zhao, Y.; Tong, X.; Wei, X.H.; Xu, S.S.; Lan, S.; Wang, X.L.; Zhang, Z.W. Effects of microstructure on crack resistance and low-temperature toughness of ultra-low carbon high strength steel. Int. J. Plast. 2019, 116, 203–215. [Google Scholar] [CrossRef]
- Lan, L.; Qiu, C.; Zhao, D.; Gao, X.; Du, L. Microstructural characteristics and toughness of the simulated coarse grained heat affected zone of high strength low carbon bainitic steel. Mater. Sci. Eng. A 2011, 529, 192–200. [Google Scholar] [CrossRef]
- Zhou, T.; Yu, H.; Hu, J.; Wang, S. Study of microstructural evolution and strength–toughness mechanism of heavy-wall induction bend pipe. Mater. Sci. Eng. A 2014, 615, 436–446. [Google Scholar] [CrossRef]
- Wang, H.B.; Wang, F.L.; Shi, G.H.; Sun, Y.; Liu, J.C.; Wang, Q.F.; Zhang, F.C. Effect of welding heat input on microstructure and impact toughness in CGHAZ of X100Q steel. J. Iron Steel Res. Int. 2019, 26, 637–646. [Google Scholar] [CrossRef]
- Wang, H.; Wang, F.; Shi, G.; Sun, Y.; Liu, J.; Wang, Q.; Zhang, F. Effect of quenching temperature on microstructure and yield strength of Q-T-treated X100Q bainitic steel. Mater. Res. Express 2018, 5, 066509. [Google Scholar] [CrossRef]
- Godefroid, L.B.; Sena, B.M.; Trindade Filho, V.B.D. Evaluation of Microstructure and Mechanical Properties of Seamless Steel Pipes API 5L Type Obtained by Different Processes of Heat Treatments. Mater. Res. 2017, 20, 514–522. [Google Scholar] [CrossRef] [Green Version]
- Sakai, Y.; Tamanoi, K.; Ogura, N. Application of tanh curve fit analysis to fracture toughness data of Japanese RPVS. Nucl. Eng. Des. 1989, 115, 31–39. [Google Scholar] [CrossRef]
- Cvetkovski, S. Instrumented testing of simulated Charpy specimens made of microalloyed MnNiV steel. Eur. Struct. Integr. Soc. 2002, 30, 95–102. [Google Scholar]
- Thompson, S.W. Interrelationships between yield strength, low-temperature impact toughness, and microstructure in low-carbon, copper-precipitation-strengthened, high-strength low-alloy plate steels. Mater. Sci. Eng. A 2018, 711, 424–433. [Google Scholar] [CrossRef]
- Tanguy, B.; Besson, J.; Piques, R.; Pineau, A. Ductile to brittle transition of an A508 steel characterized by Charpy impact test: Part II: Modeling of the Charpy transition curve. Eng. Fract. Mech. 2005, 72, 413–434. [Google Scholar] [CrossRef] [Green Version]
- Niels, H. Hall-Petch relation and boundary strengthening. Scr. Mater. 2004, 51, 801–806. [Google Scholar]
- Wang, C.; Wang, M.; Shi, J.; Hui, W.; Dong, H. Effect of microstructural refinement on the toughness of low carbon martensitic steel. Scr. Mater. 2008, 58, 492–495. [Google Scholar] [CrossRef]
- Kitahara, H.; Ueji, R.; Tsuji, N.; Minamino, Y. Crystallographic features of lath martensite in low-carbon steel. Acta Mater. 2006, 54, 1279–1288. [Google Scholar] [CrossRef]
- Miyamoto, G.; Iwata, N.; Takayama, N.; Furuhara, T. Mapping the parent austenite orientation reconstructed from the orientation of martensite by EBSD and its application to ausformed martensite. Acta Mater. 2010, 58, 6393–6403. [Google Scholar] [CrossRef]
- Wang, C.; Qiu, H.; Kimura, Y.; Inoue, T. Morphology, crystallography, and crack paths of tempered lath martensite in a medium-carbon low-alloy steel. Mater. Sci. Eng. A 2016, 669, 48–57. [Google Scholar] [CrossRef]
- Kitahara, H.; Ueji, R.; Ueda, M.; Tsuji, N.; Minamino, Y. Crystallographic analysis of plate martensite in Fe–28.5 at.% Ni by FE-SEM/EBSD. Mater. Charact. 2005, 54, 378–386. [Google Scholar] [CrossRef]
- Pineau, A.; Benzerga, A.A.; Pardoen, T. Failure of metals I: Brittle and ductile fracture. Acta Mater. 2016, 107, 424–483. [Google Scholar] [CrossRef] [Green Version]
- Pineau, A. Development of the Local Approach to Fracture over the Past 25 years: Theory and Applications. Int. J. Fract. 2006, 138, 139–166. [Google Scholar] [CrossRef]
- Griffiths, J.R.; Owen, D. An elastic-plastic stress analysis for a notched bar in plane strain bending. J. Mech. Phys. Solids 1971, 19, 419–431. [Google Scholar] [CrossRef]
- Dáz-Fuentes, M.; Iza-Mendia, A.; Gutiérrez, I. Analysis of different acicular ferrite microstructures in low-carbon steels by electron back scattered diffraction. Study of their toughness behavior. Metall. Mater. Trans. A 2003, 34, 2505–2516. [Google Scholar] [CrossRef]
- Lu, J.; Yu, H.; Yang, S.F. Mechanical behavior of multi-stage heat-treated HSLA steel based on examinations of microstructural evolution. Mater. Sci. Eng. A 2021, 803, 140493. [Google Scholar] [CrossRef]
- Knott, J.F. Local approach concepts and the microstructures of steels. Eng. Fract. Mech. 2008, 75, 3560–3569. [Google Scholar] [CrossRef]
- Margolin, B.Z.; Shvetsova, V.A.; Karzov, G.P. Brittle fracture of nuclear pressure vessel steels—I. Local criterion for cleavage fracture. Int. J. Press. Vessel. Pip. 1997, 72, 73–87. [Google Scholar] [CrossRef]
- Lambert-Perlade, A.; Sturel, T.; Gourgues, A.; Besson, J.; Pineau, A. Mechanisms and modeling of cleavage fracture in simulated heat-affected zone microstructures of a high-strength low alloy steel. Metall. Mater. Trans. A 2004, 35, 1039–1053. [Google Scholar] [CrossRef]
- Chen, J.H.; Wang, G.Z.; Wang, Q. Change of critical events of cleavage fracture with variation of microscopic features of low-alloy steels. Metall. Mater. Trans. A 2002, 33, 3393–3402. [Google Scholar] [CrossRef]
Figure 1.
Heat-induced bending process and sample location: (a–c) the schematic diagram of the heat-induced bending process, (d) the location of the test sample, (e) the parent pipe of the bend, (f) the production site diagram of industrial induction heating bending, and (g) the schematic diagram of secondary crack observation.

Figure 2.
OM and SEM of the different sampling positions of the X80 heavy-wall heat-induced seamless bend: (a,d) S1, (b,e) S2, and (c,f) S3.
Figure 2.
OM and SEM of the different sampling positions of the X80 heavy-wall heat-induced seamless bend: (a,d) S1, (b,e) S2, and (c,f) S3.
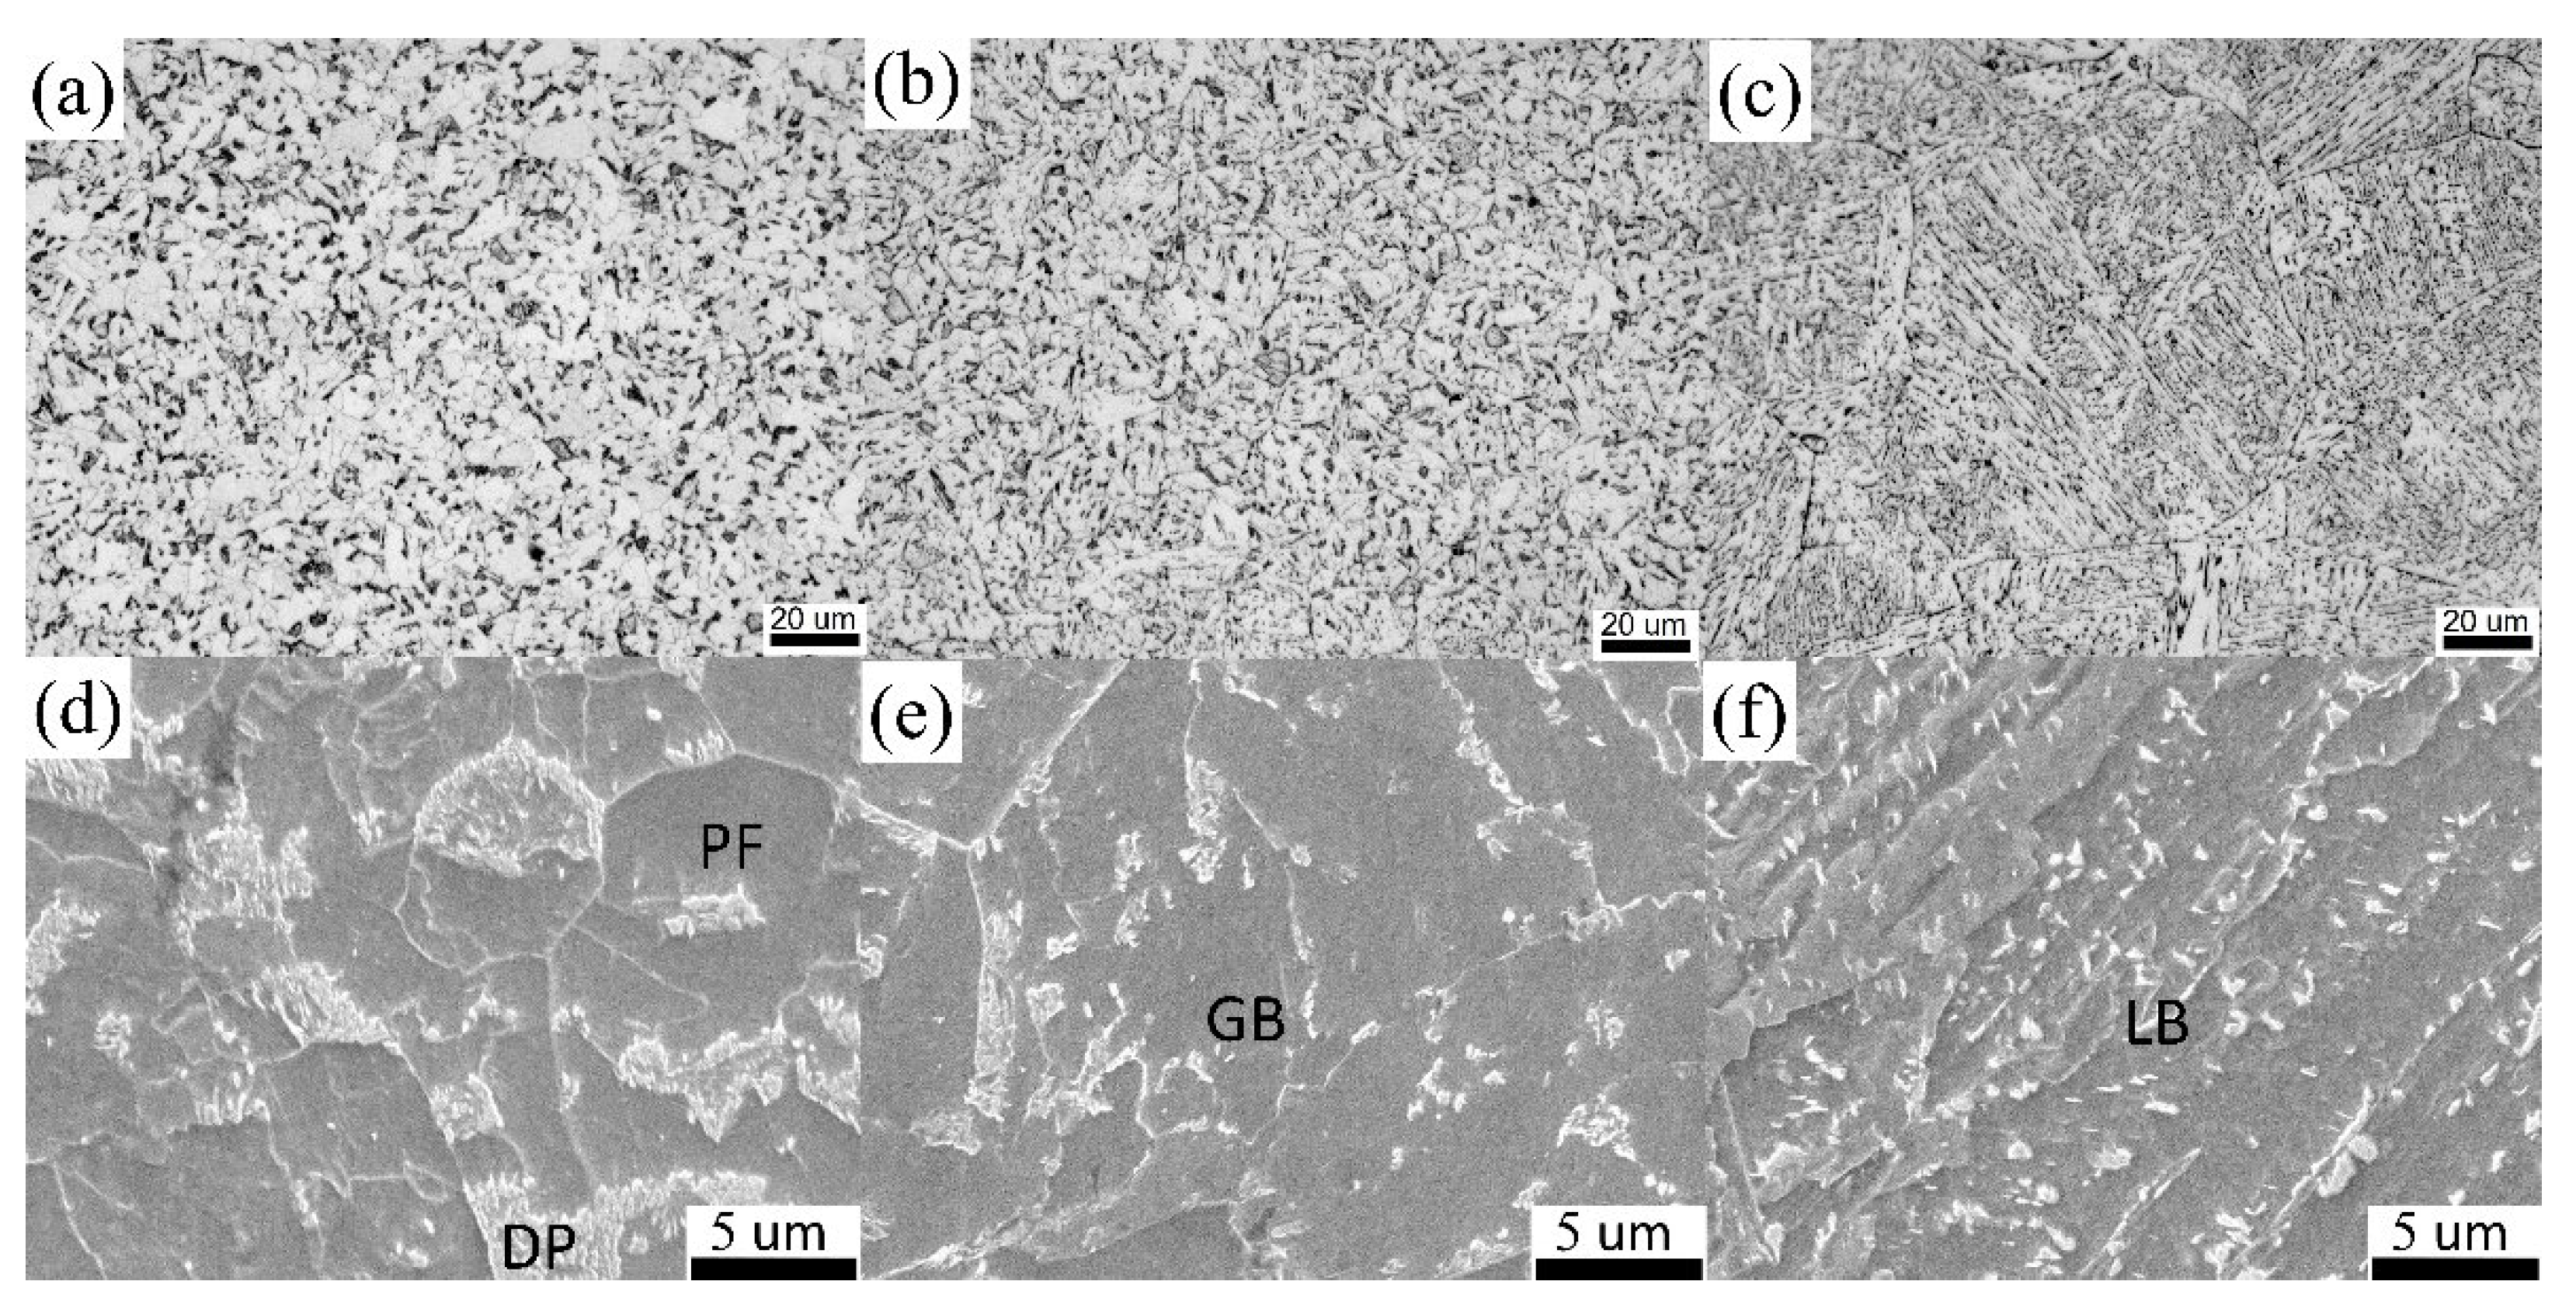
Figure 3.
TEM of the X80 heavy-wall heat-induced seamless bend: (a,b) S1, (c,d) S2, and (e,f) S3.

Figure 4.
Tensile engineering stress–strain curves.
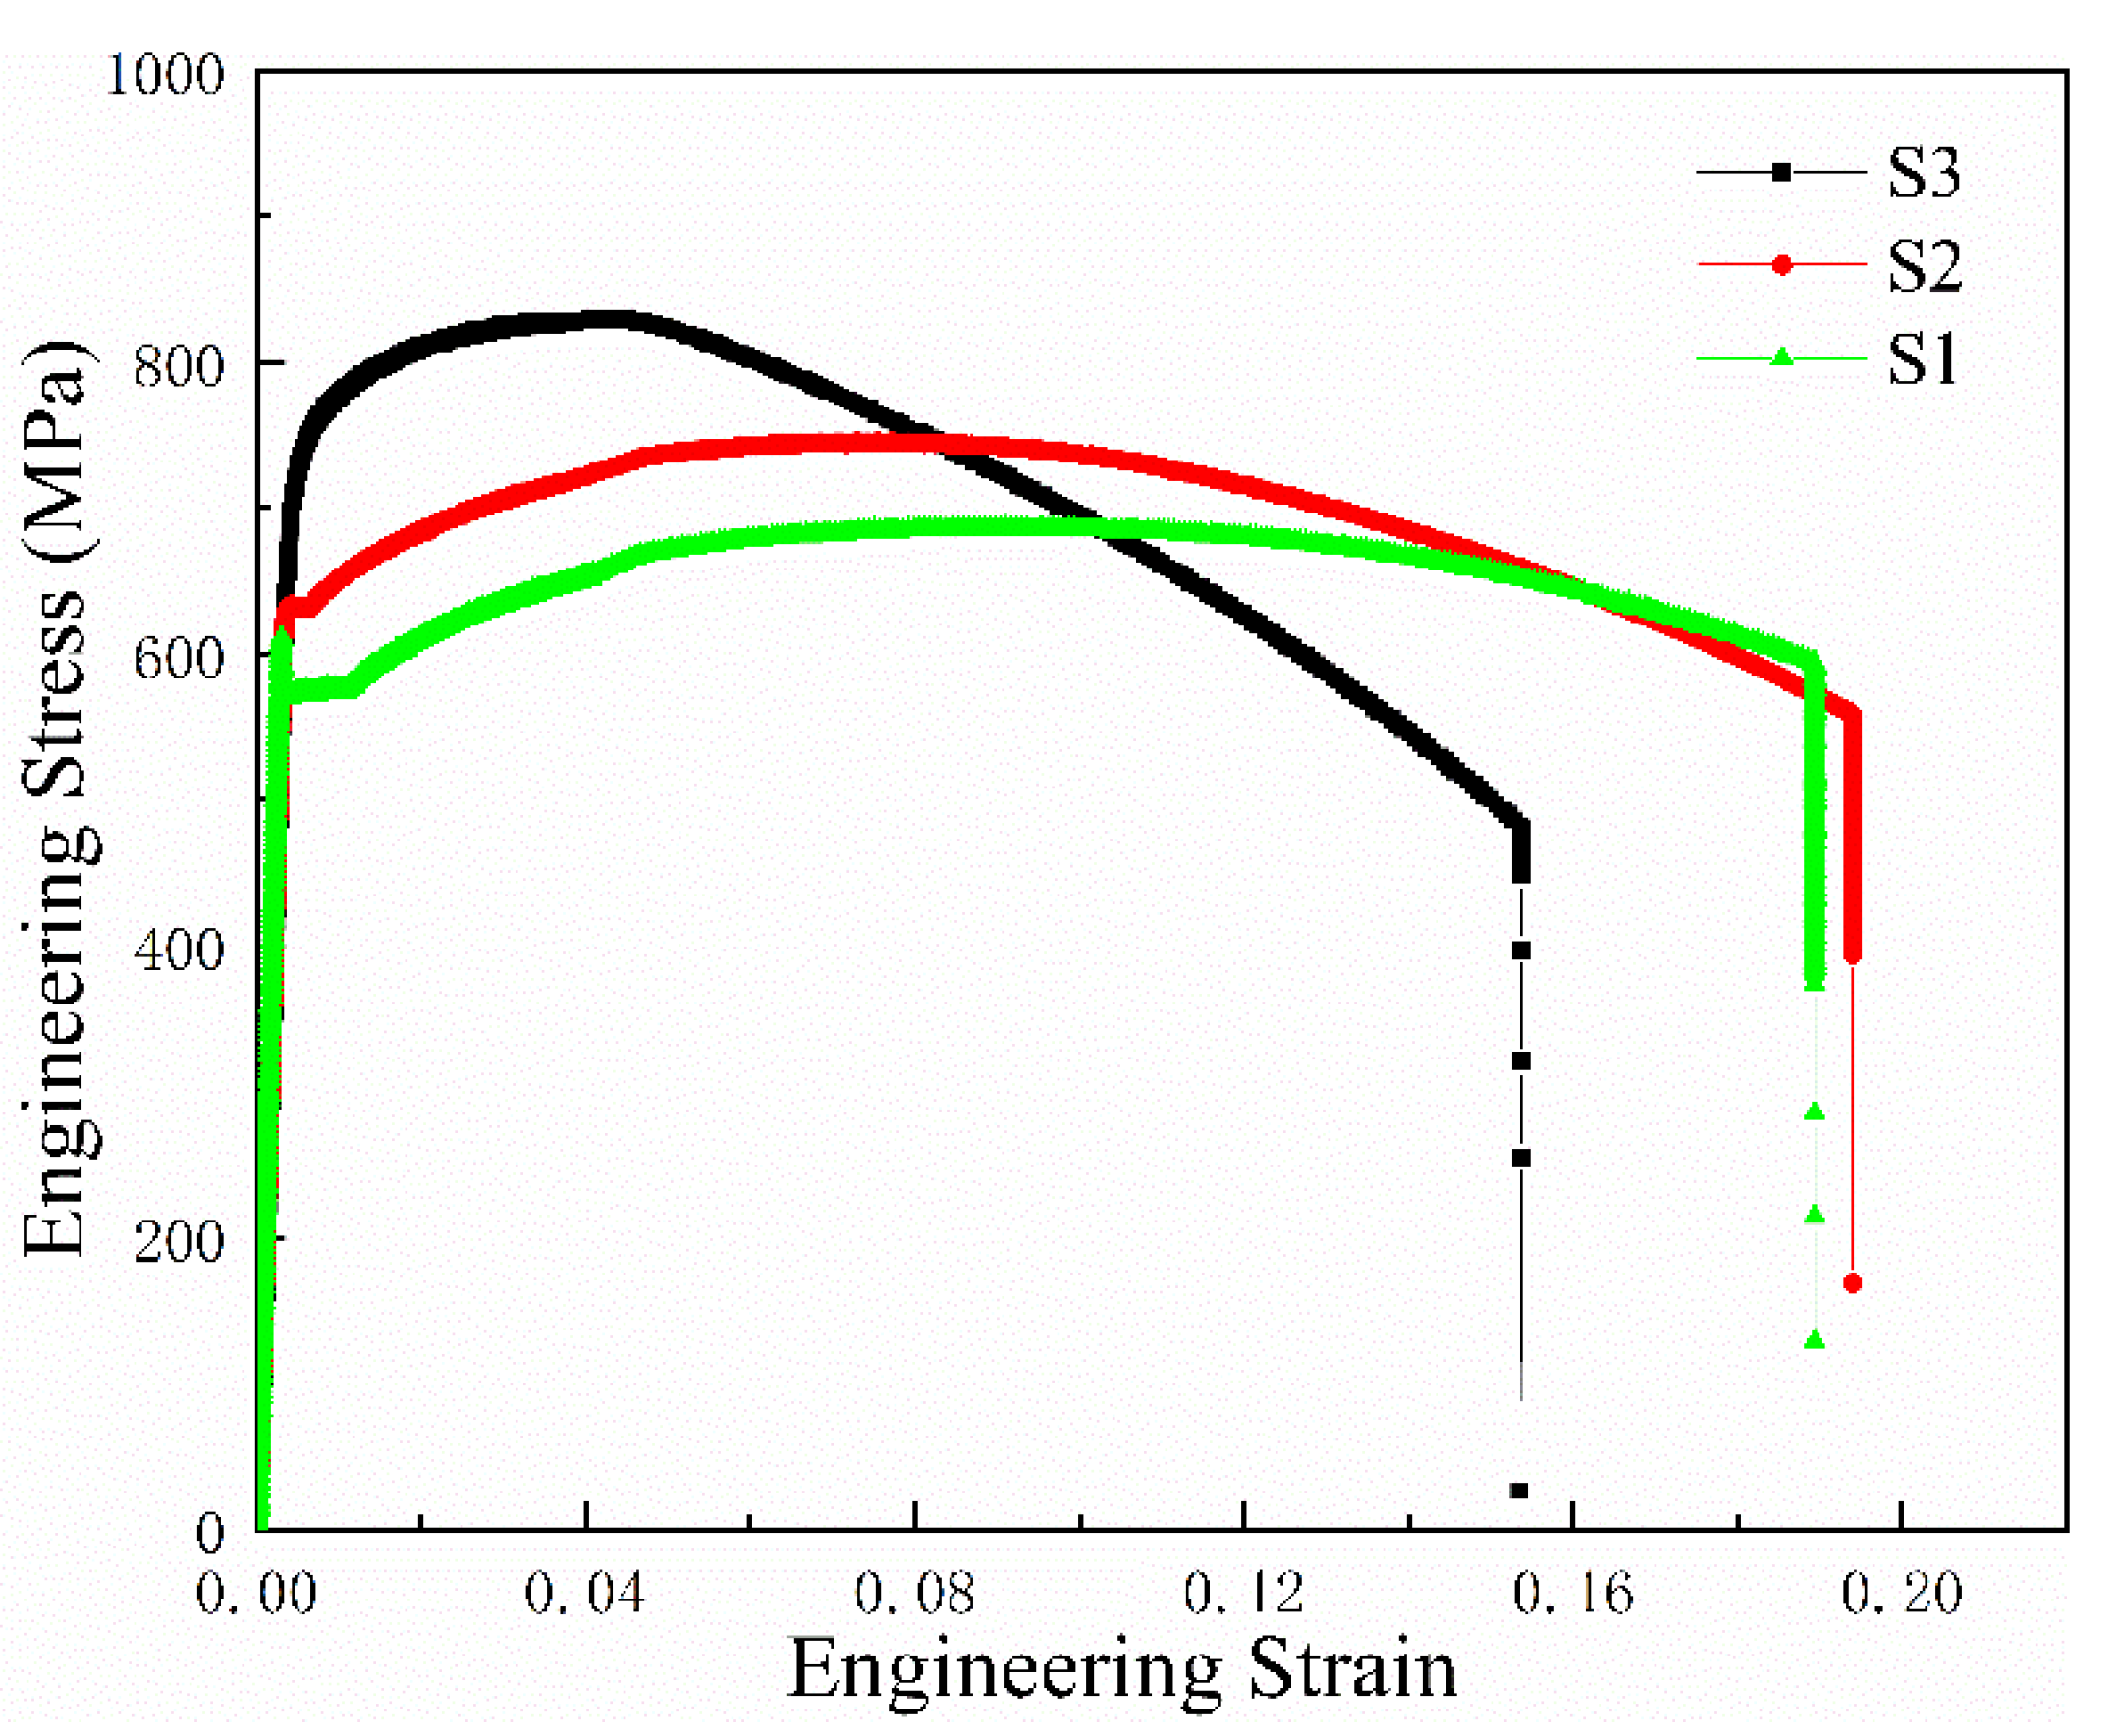
Figure 5.
The impact absorption energy–test temperature along with the Boltzmann function fitting based on the experimental data.
Figure 5.
The impact absorption energy–test temperature along with the Boltzmann function fitting based on the experimental data.
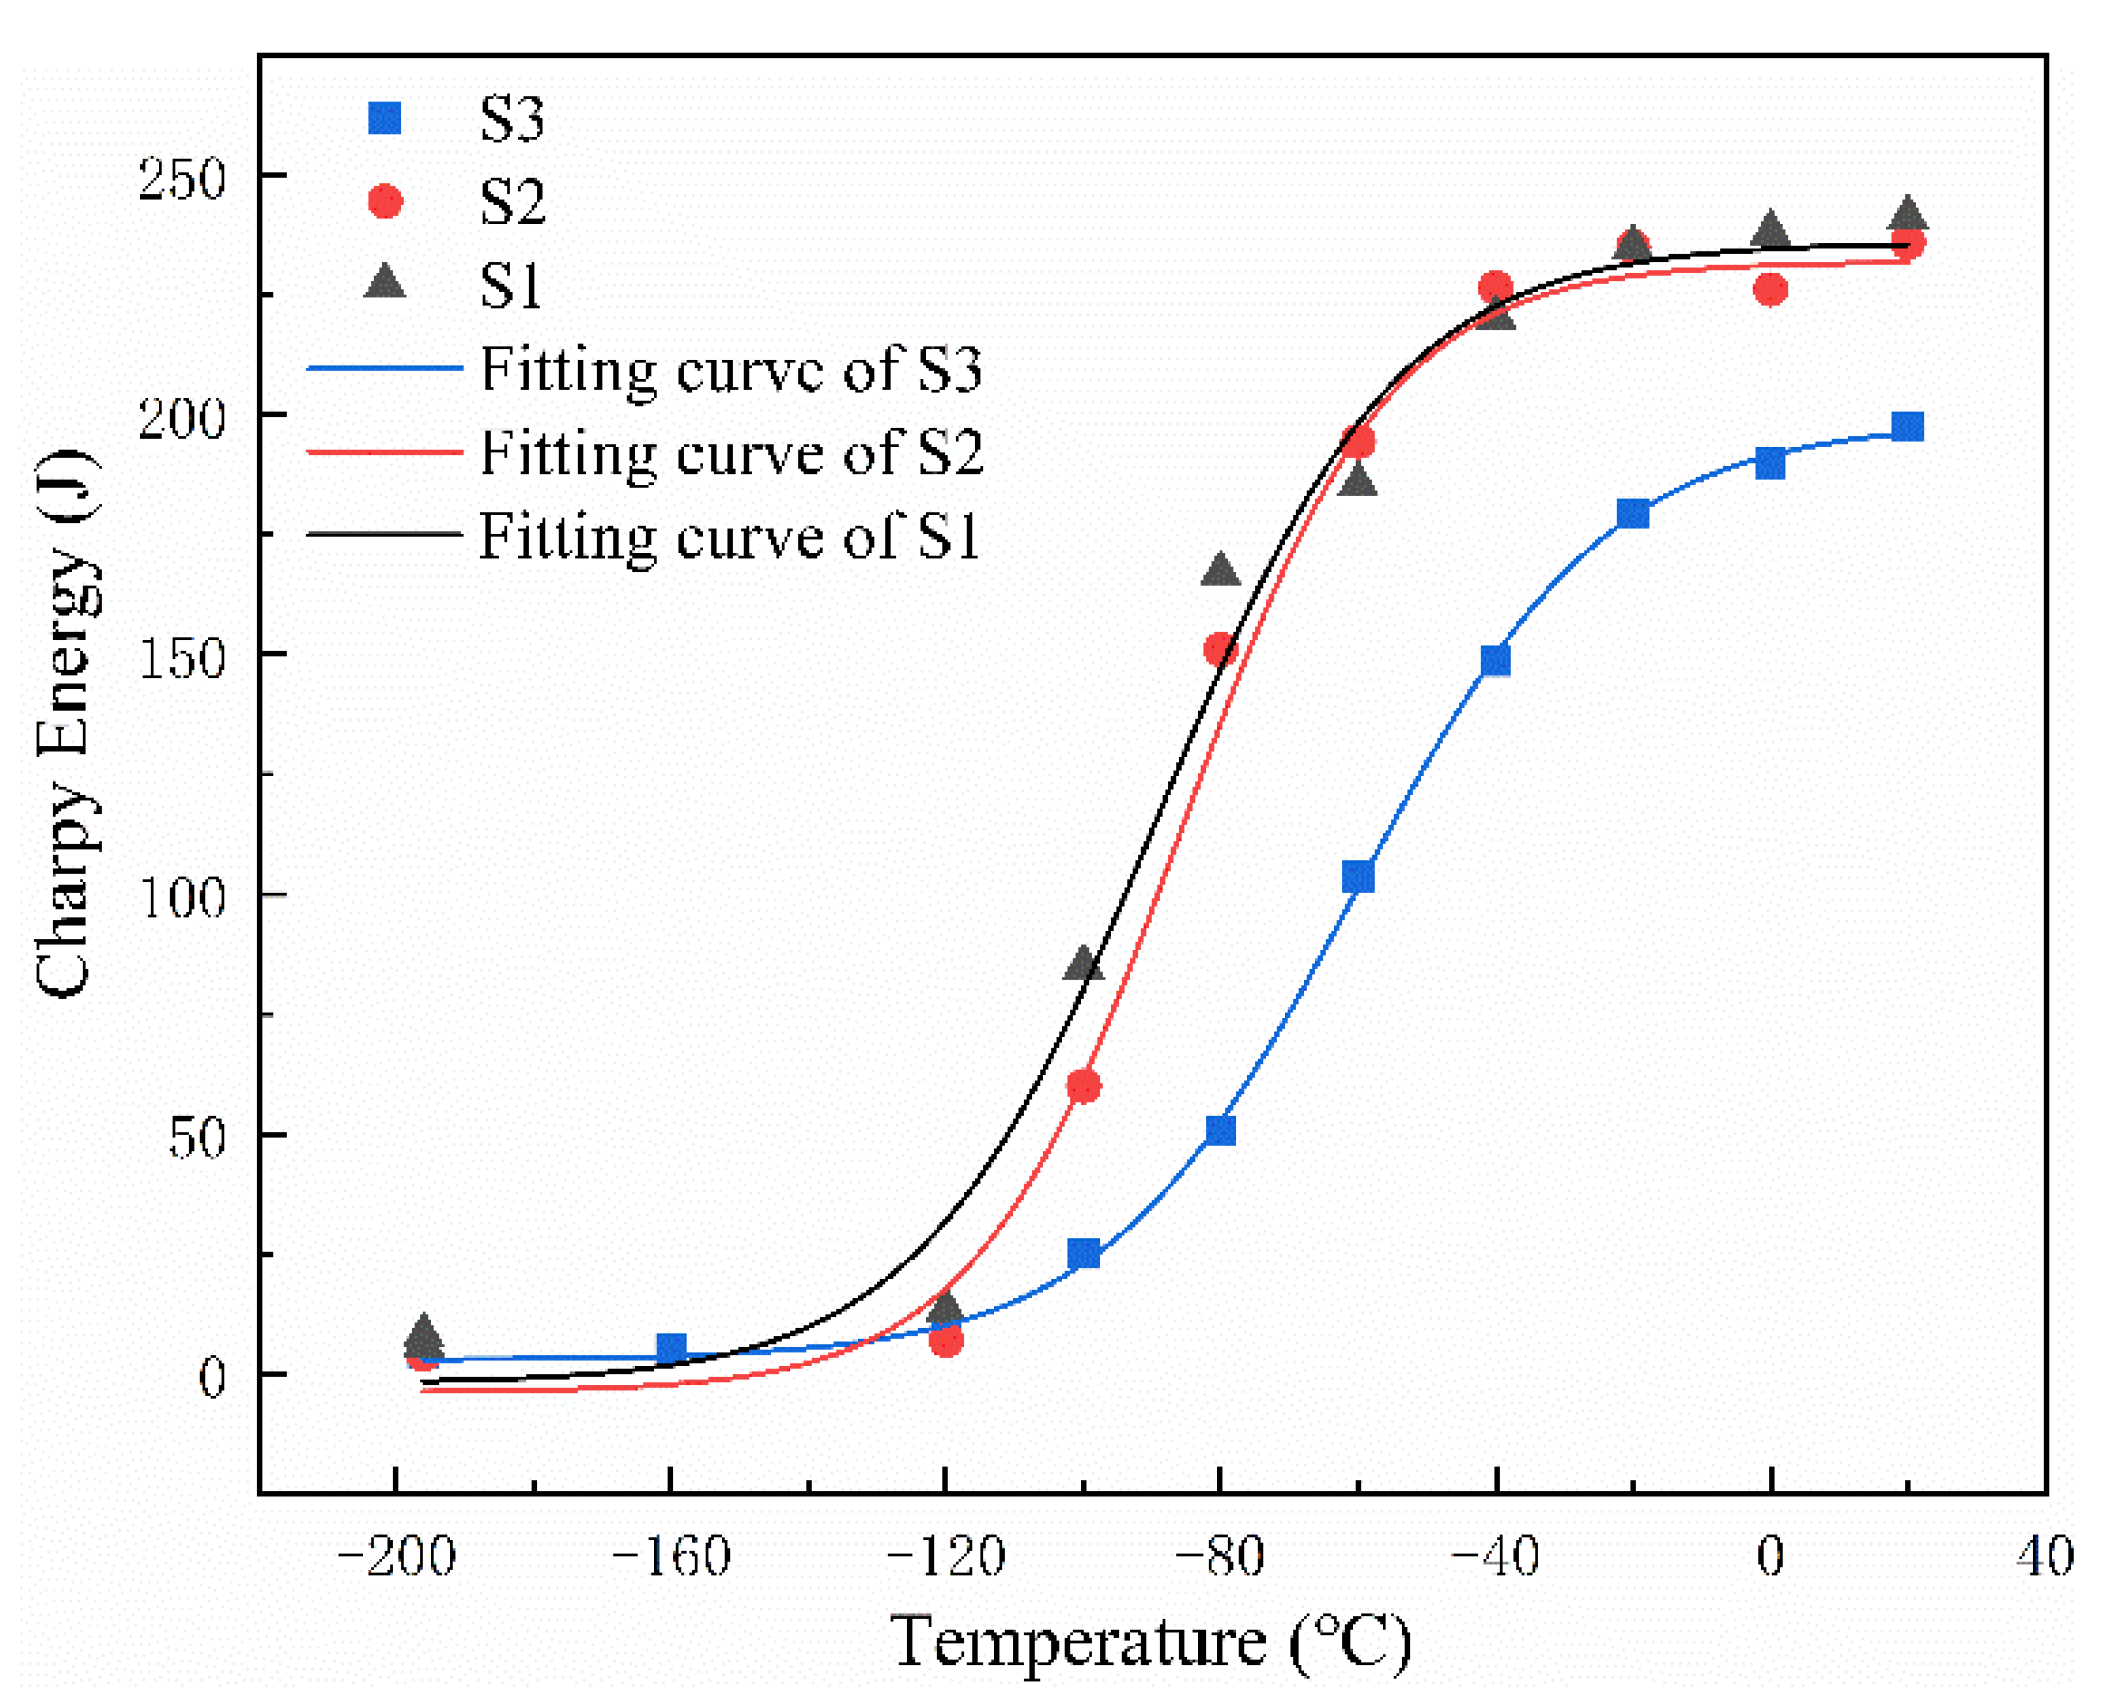
Figure 6.
The impact load and impact absorption energy curves versus the displacement obtained from instrumented impact experiments at −60 °C: (a) S1, (b) S2, and (c) S3.
Figure 6.
The impact load and impact absorption energy curves versus the displacement obtained from instrumented impact experiments at −60 °C: (a) S1, (b) S2, and (c) S3.
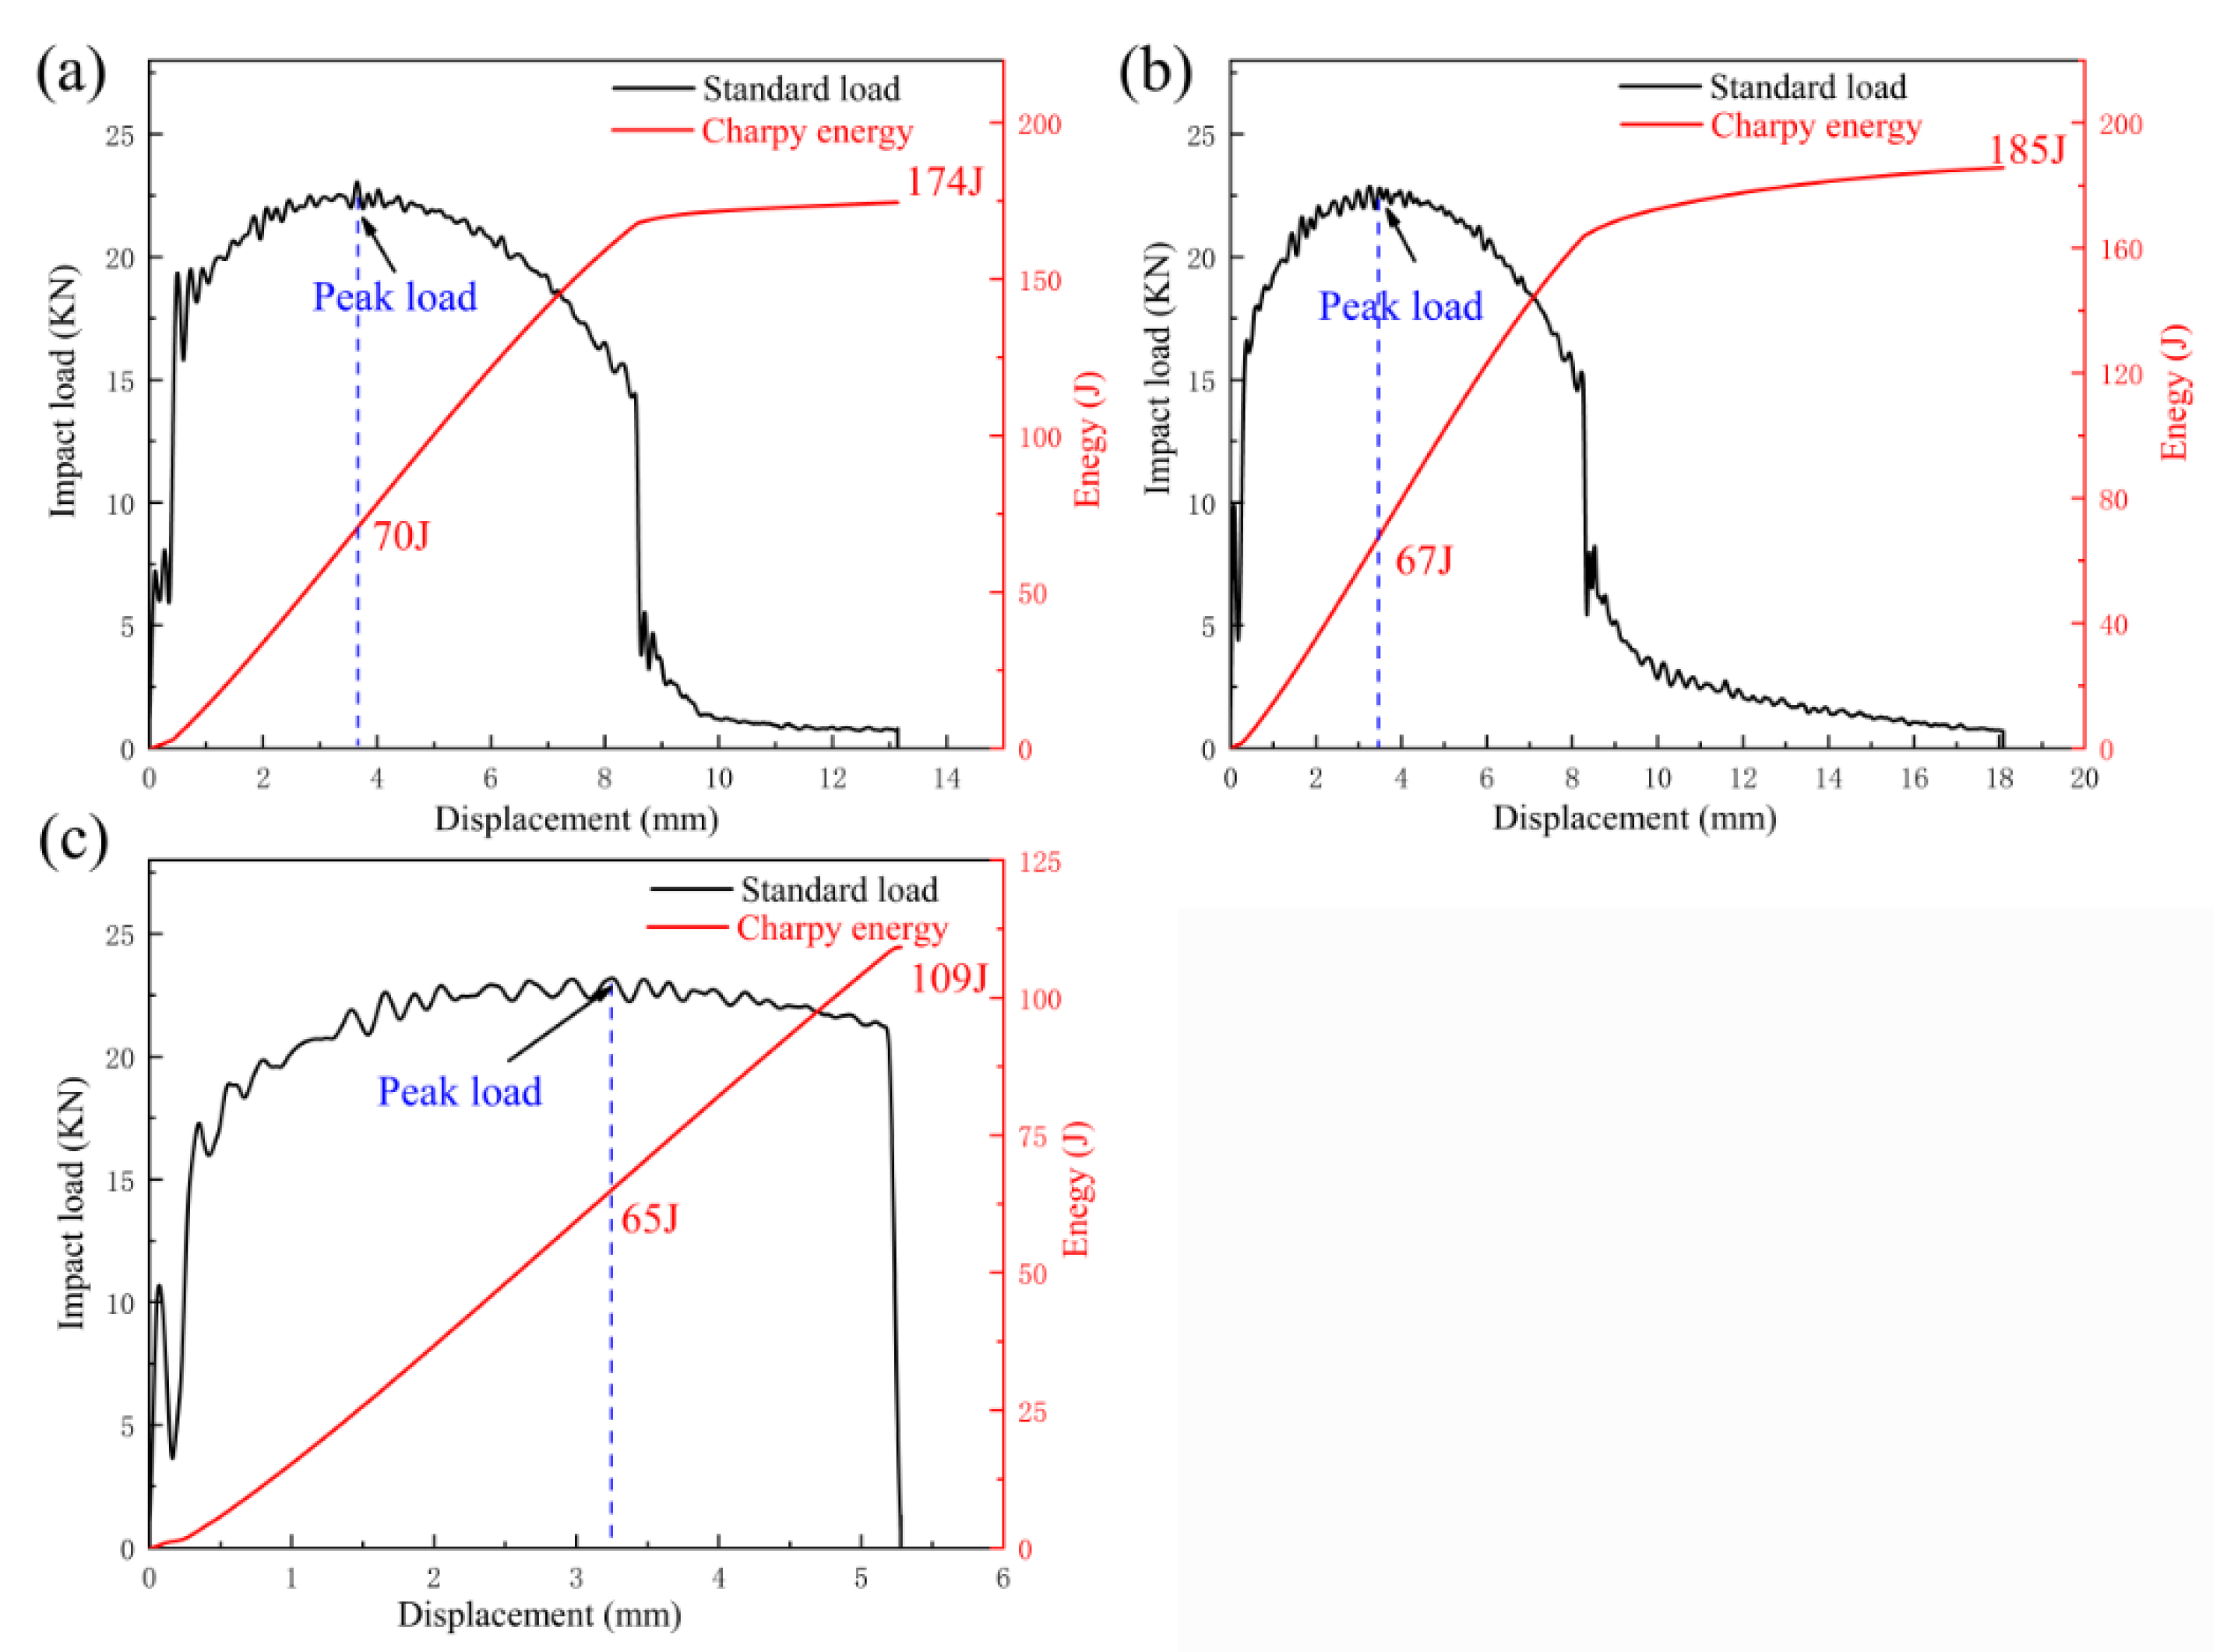
Figure 7.
Fracture morphologies of the X80 heavy-wall heat-induced seamless bend at −60 °C: (a) S1, (b) S2, and (c) S3.
Figure 7.
Fracture morphologies of the X80 heavy-wall heat-induced seamless bend at −60 °C: (a) S1, (b) S2, and (c) S3.
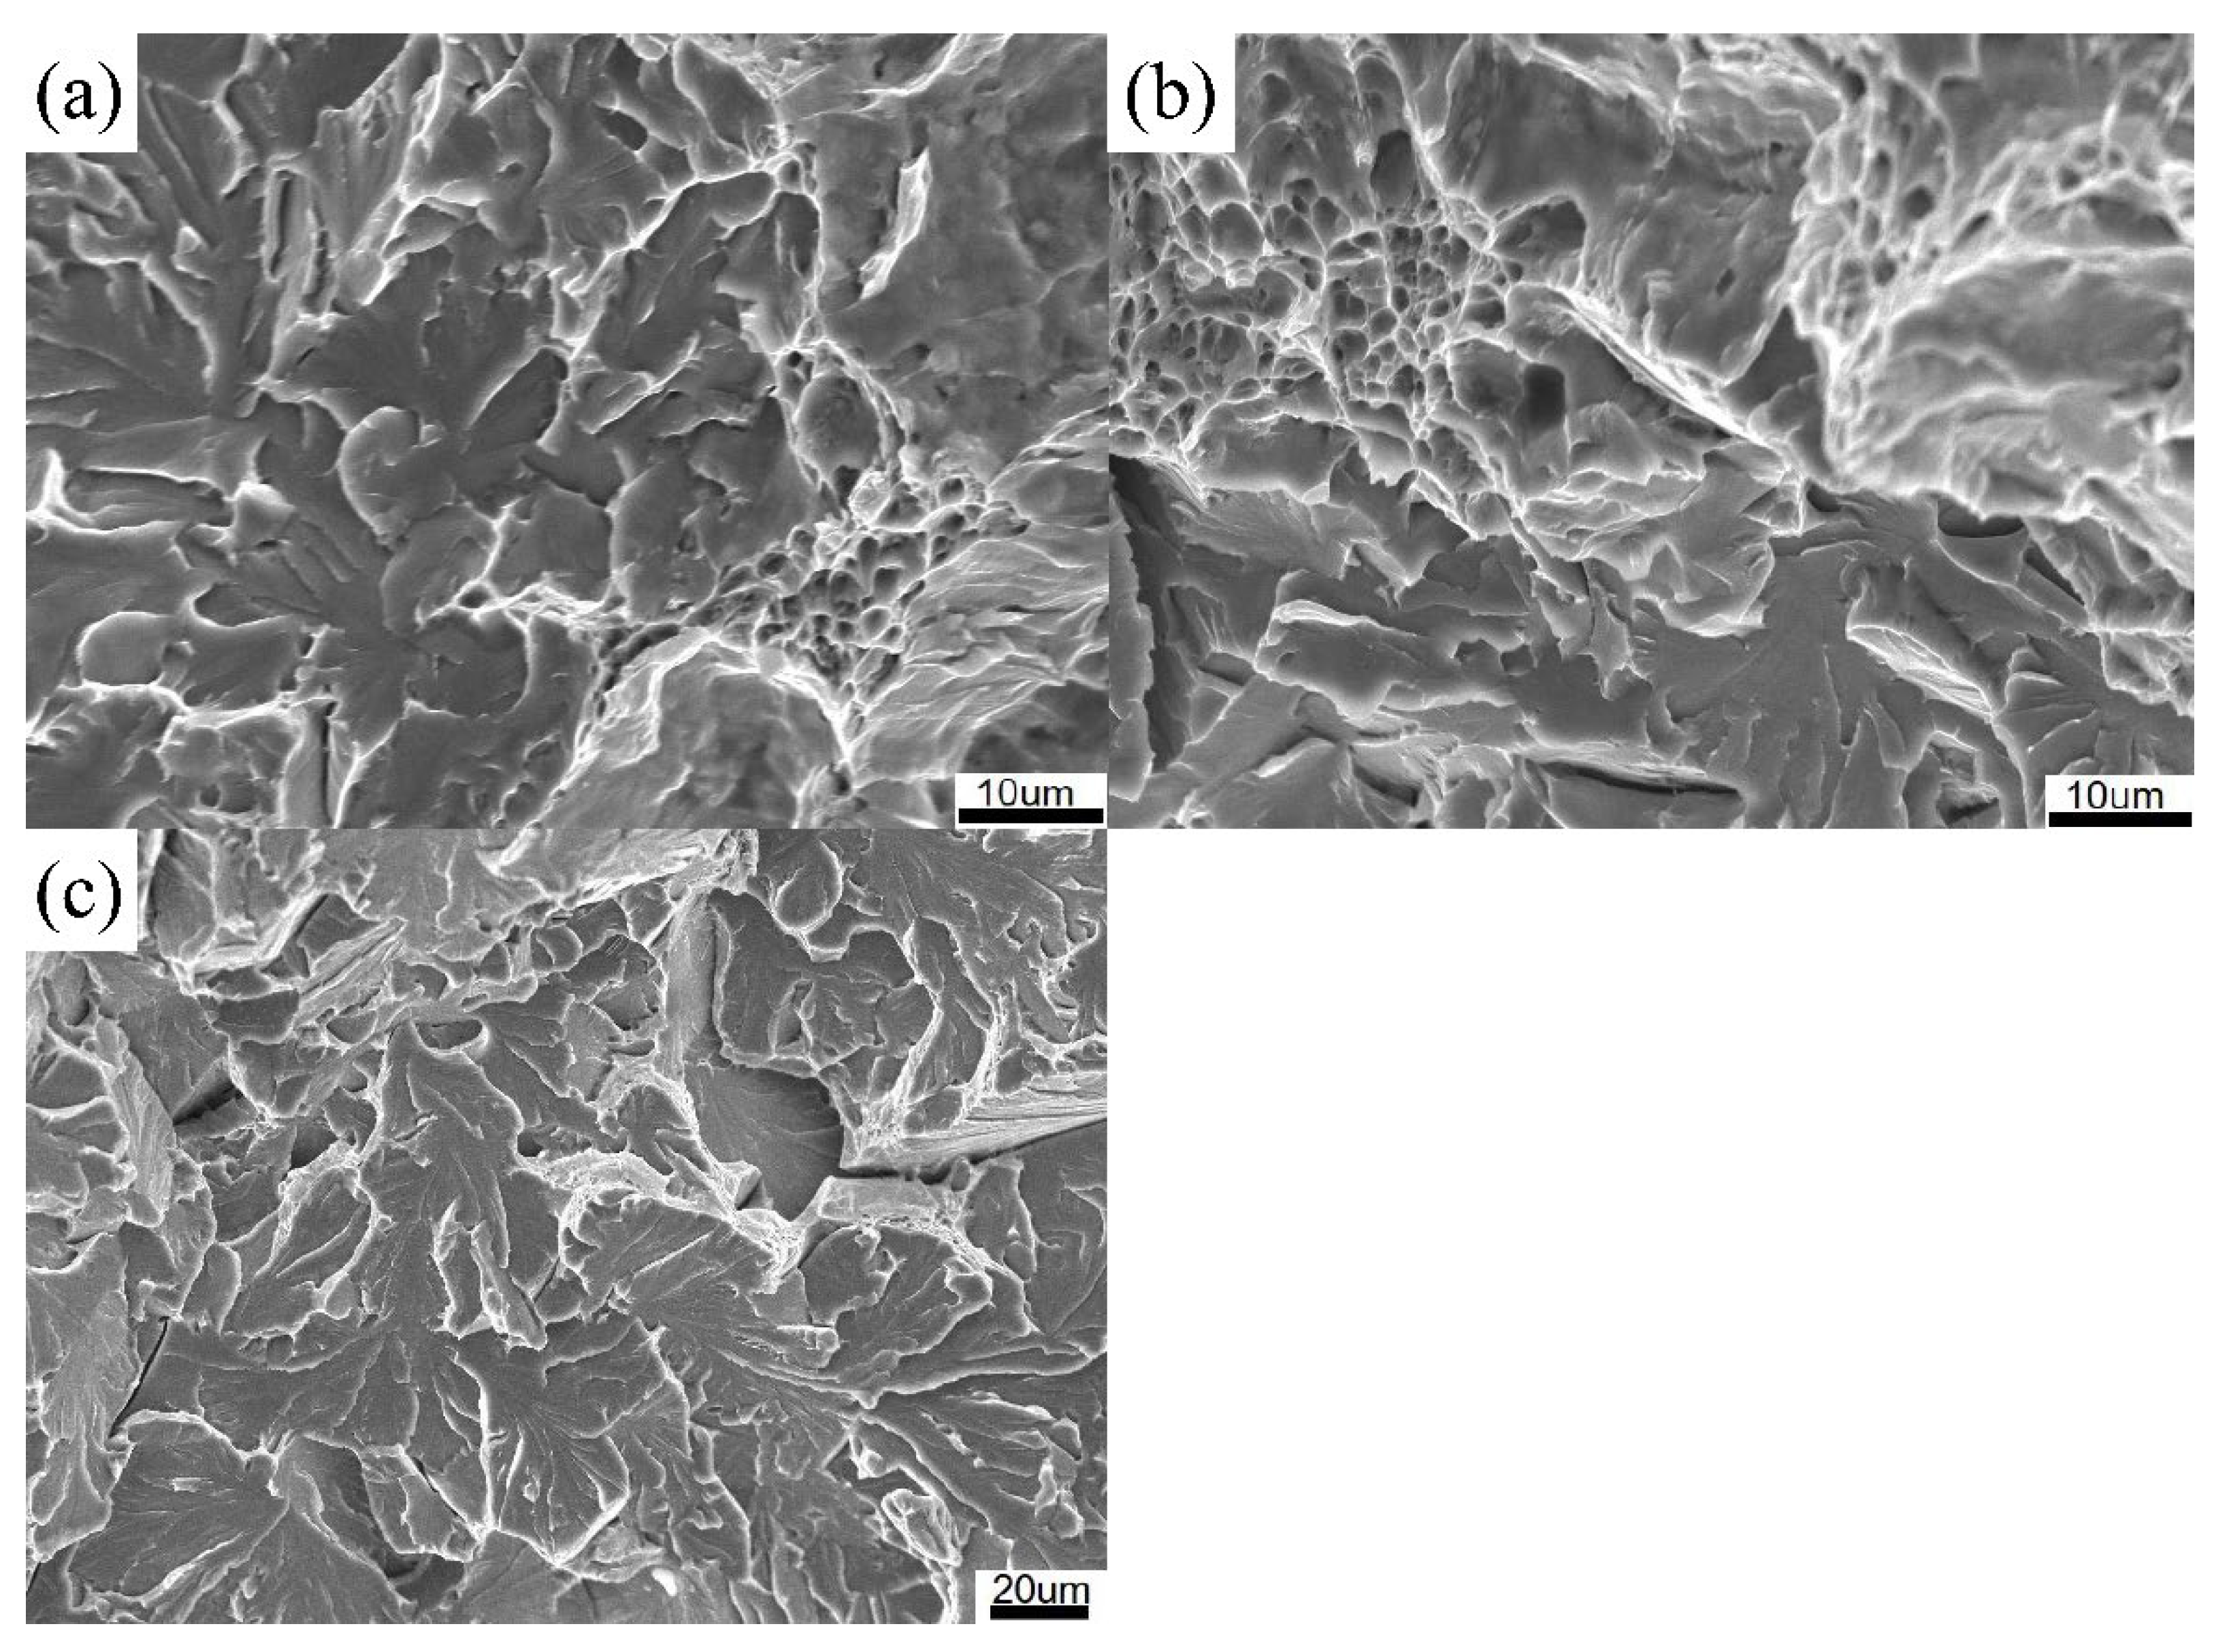
Figure 8.
Grain orientation image maps (a–c) and grain boundary misorientation distribution (d–f): (a,d) S1, (b,e) S2, and (c,f) S3.
Figure 8.
Grain orientation image maps (a–c) and grain boundary misorientation distribution (d–f): (a,d) S1, (b,e) S2, and (c,f) S3.

Figure 9.
Misorientation angle distribution: (a) S1, (b) S2, and (c) S3.

Figure 10.
SEM showing the morphologies of secondary cracks underneath the fracture surface of specimens: (a,b) S1, (c,d) S2, and (e,f) S3.
Figure 10.
SEM showing the morphologies of secondary cracks underneath the fracture surface of specimens: (a,b) S1, (c,d) S2, and (e,f) S3.

Figure 11.
Local misorientation distribution map and the local misorientation frequency distribution: (a,d) S1, (b,e) S2, and (c,f) S3.
Figure 11.
Local misorientation distribution map and the local misorientation frequency distribution: (a,d) S1, (b,e) S2, and (c,f) S3.

Figure 12.
Schematic diagram of cleavage microcrack initiation and propagation: (a) S1, (b) S2, and (c) S3.
Figure 12.
Schematic diagram of cleavage microcrack initiation and propagation: (a) S1, (b) S2, and (c) S3.


Table 1.
Chemical composition of the X80 heavy-wall heat-induced seamless bend (wt%).
| C | Si | Mn | P | S | Nb | V | Ti | Cr | Ni | Cu | Mo |
|---|---|---|---|---|---|---|---|---|---|---|---|
| 0.10 | 0.22 | 1.06 | 0.005 | 0.002 | 0.03 | 0.07 | 0.003 | 0.29 | 1.0 | 0.09 | 0.39 |
Table 2.
Heat-induced bending parameters of the X80 × D1422 mm heavy-wall heat-induced seamless bend.
Table 2.
Heat-induced bending parameters of the X80 × D1422 mm heavy-wall heat-induced seamless bend.
| Heating Temperature (°C) | Push Speed (mm/s) | Cooling Water Flow (m3/h) | Bending Angle (°) | Tempering Temperature (°C) | Holding Time (min) | Cooling |
|---|---|---|---|---|---|---|
| 1050 | 0.3 | 50 | 4 | 580 | 90 | Air Cooling |
Table 3.
Comparison of crack initiation energy and crack propagation energy of the X80 × D1422 mm heavy-wall heat-induced seamless bend.
Table 3.
Comparison of crack initiation energy and crack propagation energy of the X80 × D1422 mm heavy-wall heat-induced seamless bend.
| Samples | Total Absorbed Energy (J) | Crack Initiation Energy (J)/Percentage | Crack Propagation Energy (J)/Percentage |
|---|---|---|---|
| S1 | 174 | 70 (40.2%) | 104 (59.8%) |
| S2 | 185 | 67 (36.2%) | 118 (63.8%) |
| S3 | 109 | 65 (59.6%) | 44 (40.4%) |
Table 4.
The relative frequency of the HAGBs and LAGBs of an X80 × D1422 mm heavy-wall heat-induced seamless bend.
Table 4.
The relative frequency of the HAGBs and LAGBs of an X80 × D1422 mm heavy-wall heat-induced seamless bend.
| Samples | HAGBS | LAGBS |
|---|---|---|
| S1 | 41.1 (%) | 58.9 (%) |
| S2 | 38.3 (%) | 61.7 (%) |
| S3 | 29.5 (%) | 70.5 (%) |
Publisher’s Note: MDPI stays neutral with regard to jurisdictional claims in published maps and institutional affiliations. |
© 2021 by the authors. Licensee MDPI, Basel, Switzerland. This article is an open access article distributed under the terms and conditions of the Creative Commons Attribution (CC BY) license (https://creativecommons.org/licenses/by/4.0/).
Share and Cite
MDPI and ACS Style
Hu, J.; Liu, Y.; Wang, G.; Li, Q. Effects of Microstructure on the Low-Temperature Toughness of an X80 × D1422 mm Heavy-Wall Heat-Induced Seamless Bend. Metals 2021, 11, 1055. https://doi.org/10.3390/met11071055
AMA Style
Hu J, Liu Y, Wang G, Li Q. Effects of Microstructure on the Low-Temperature Toughness of an X80 × D1422 mm Heavy-Wall Heat-Induced Seamless Bend. Metals. 2021; 11(7):1055. https://doi.org/10.3390/met11071055
Chicago/Turabian StyleHu, Juntai, Yu Liu, Ge Wang, and Qiang Li. 2021. "Effects of Microstructure on the Low-Temperature Toughness of an X80 × D1422 mm Heavy-Wall Heat-Induced Seamless Bend" Metals 11, no. 7: 1055. https://doi.org/10.3390/met11071055
Note that from the first issue of 2016, this journal uses article numbers instead of page numbers. See further details here.