Article

Effect of As-Built and Ground Surfaces on the Fatigue Properties of AlSi10Mg Alloy Produced by Additive Manufacturing

1
Institut Pprime, ENSMA-CNRS-Université de Poitiers, 1 Avenue Clément Ader, Téléport 2, 86960 Chasseneuil-Futuroscope, France
2
SAFRAN Seats, 61 Rue Pierre Curie, 78370 Plaisir, France
*
Author to whom correspondence should be addressed.
Metals 2021, 11(9), 1432; https://doi.org/10.3390/met11091432
Submission received: 13 July 2021 / Revised: 1 September 2021 / Accepted: 6 September 2021 / Published: 10 September 2021
(This article belongs to the Special Issue Fatigue Behaviour of Additive Manufactured Metallic Materials)

Abstract

:
The present work concerns the influence of surface (machined, as-built) on the fatigue resistance of AlSi10Mg produced by a powder-bed laser process. The competition between defects and surface roughness is assessed by using Kitagawa-type diagrams. Samples are printed along three directions: 0°, 45° and 90°. After axial fatigue tests with a load ratio of R = −1, all the fracture surfaces are carefully analysed. The initiation sites can be (i) a defect, (ii) the surface roughness, (iii) the surface ripple. The results indicate that ground surfaces lead to the same fatigue life as as-built surfaces. It is also shown that T6 treatment improves the fatigue resistance. However, when specimen surfaces are as-built or ground, it is difficult to correlate the fatigue results with ‘isolated defect size analysis’ neither roughness parameter for an as-built surface. Therefore, microstructure, residual stresses or multiple initiation should be further analysed to understand the results.

1. Introduction

Additive manufacturing processes are innovative and disruptive technologies, because they offer attractive prospects in the manufacturing of parts with a complex geometry while reducing the number of fabrication steps and the quantity of raw material. In the case of metals, for example, those used in the aircraft industry, the optimisation of parts can furthermore offer significant weight saving [1,2,3,4,5]. Among the existing technologies, the powder bed laser fusion method is receiving increasing attention, but the definition of their limits still constitutes a real industrial and scientific challenge [6,7]. Indeed, the control of such processes requires a sound knowledge of laser-material interactions and their consequences in terms of the local microstructure, the material health in the bulk and at the surface of the produced parts, and the associated mechanical properties. A literature analysis shows that several studies explored the microstructure of additive manufactured aluminium. This paper focusses on the specific case of AlSi10Mg. For this alloy, different scales are exhibited in the material structure, such as melt-pools, dendritic structure, grains in the sense of crystallography as well as defects [8,9,10,11,12,13,14]. Regarding the tensile or fatigue resistance, the impact of conventional T6 heat treatment has also been assessed. This heat treatment homogenises the melt-pools and the dendritic structure by producing silicon wafers randomly distributed in the matrix [14,15,16,17,18]. Several works carried out on specimens machined from bars revealed anisotropy effects in tensile properties [9,12,14,19]. This anisotropy is related to the building direction [20], which itself induces a pronounced microstructural anisotropy. By modifying the microstructure through a T6 treatment, the effects of anisotropy on tensile properties are limited and improvement both in the yield stress and in the elongation at failure can be noted [14].
In addition, the aluminium parts produced by ALM must also generally meet specifications in terms of mechanical properties. Regarding the fatigue properties more specifically, the point is that most of the studies so far were focused on machined specimens. Some papers [20,21,22,23] indicate that the effect of anisotropy on fatigue life is hardly noticeable prior to T6 treatment. However, differences in fatigue life are noted, depending on the process parameters such as the temperature of the building platform, the layer thickness, or other parameters related to the laser beam [22,24]. Recent works from Romano et al. [25], as well as a previous study by Domfang et al. [14], notably made it possible to uncouple, through an analysis based on Kitagawa diagrams, the effect of the defect size from those of the other microstructural parameters on the fatigue strength of machined specimens.
However, as previously mentioned, differences in terms of surface finishing are expected to be the sources of significant variations in the fatigue strength. In order to address this issue, some studies have been devoted the specific influence of the as-built surface on fatigue behaviour [21,22,26,27,28]. According to Maskery et al. [21], the observed reduction in fatigue strength of as-built samples is mainly due to the surface roughness. Gianni [27] confirms this effect and proposes a notch approach to analyse the results. In this study, the contribution of residual stresses is also discussed. Yang et al. [28] attribute the observed drop in fatigue properties to the presence of sub-surface defects. For the same ALM process, the analysis of the fracture surfaces carried out by [27] shows that, even in the presence of a rough as-built surface, fatigue crack initiation may mainly be due to the presence of internal or sub-surface defects.
As previously mentioned, one should acknowledge the possible competition between defects and different surface preparation, including ground surfaces, in the degradation of the fatigue strength. In fact, the point is that data in the literature concerning the effect of such locally ground areas on fatigue are still quite sparse.
Given that, the objectives of the present study are detailed below:
-
Assess the impact of ground and as-built surfaces on the fatigue life.
-
Evaluate the potential of a T6 treatment to improve fatigue strength in the presence of as-built surfaces.
-
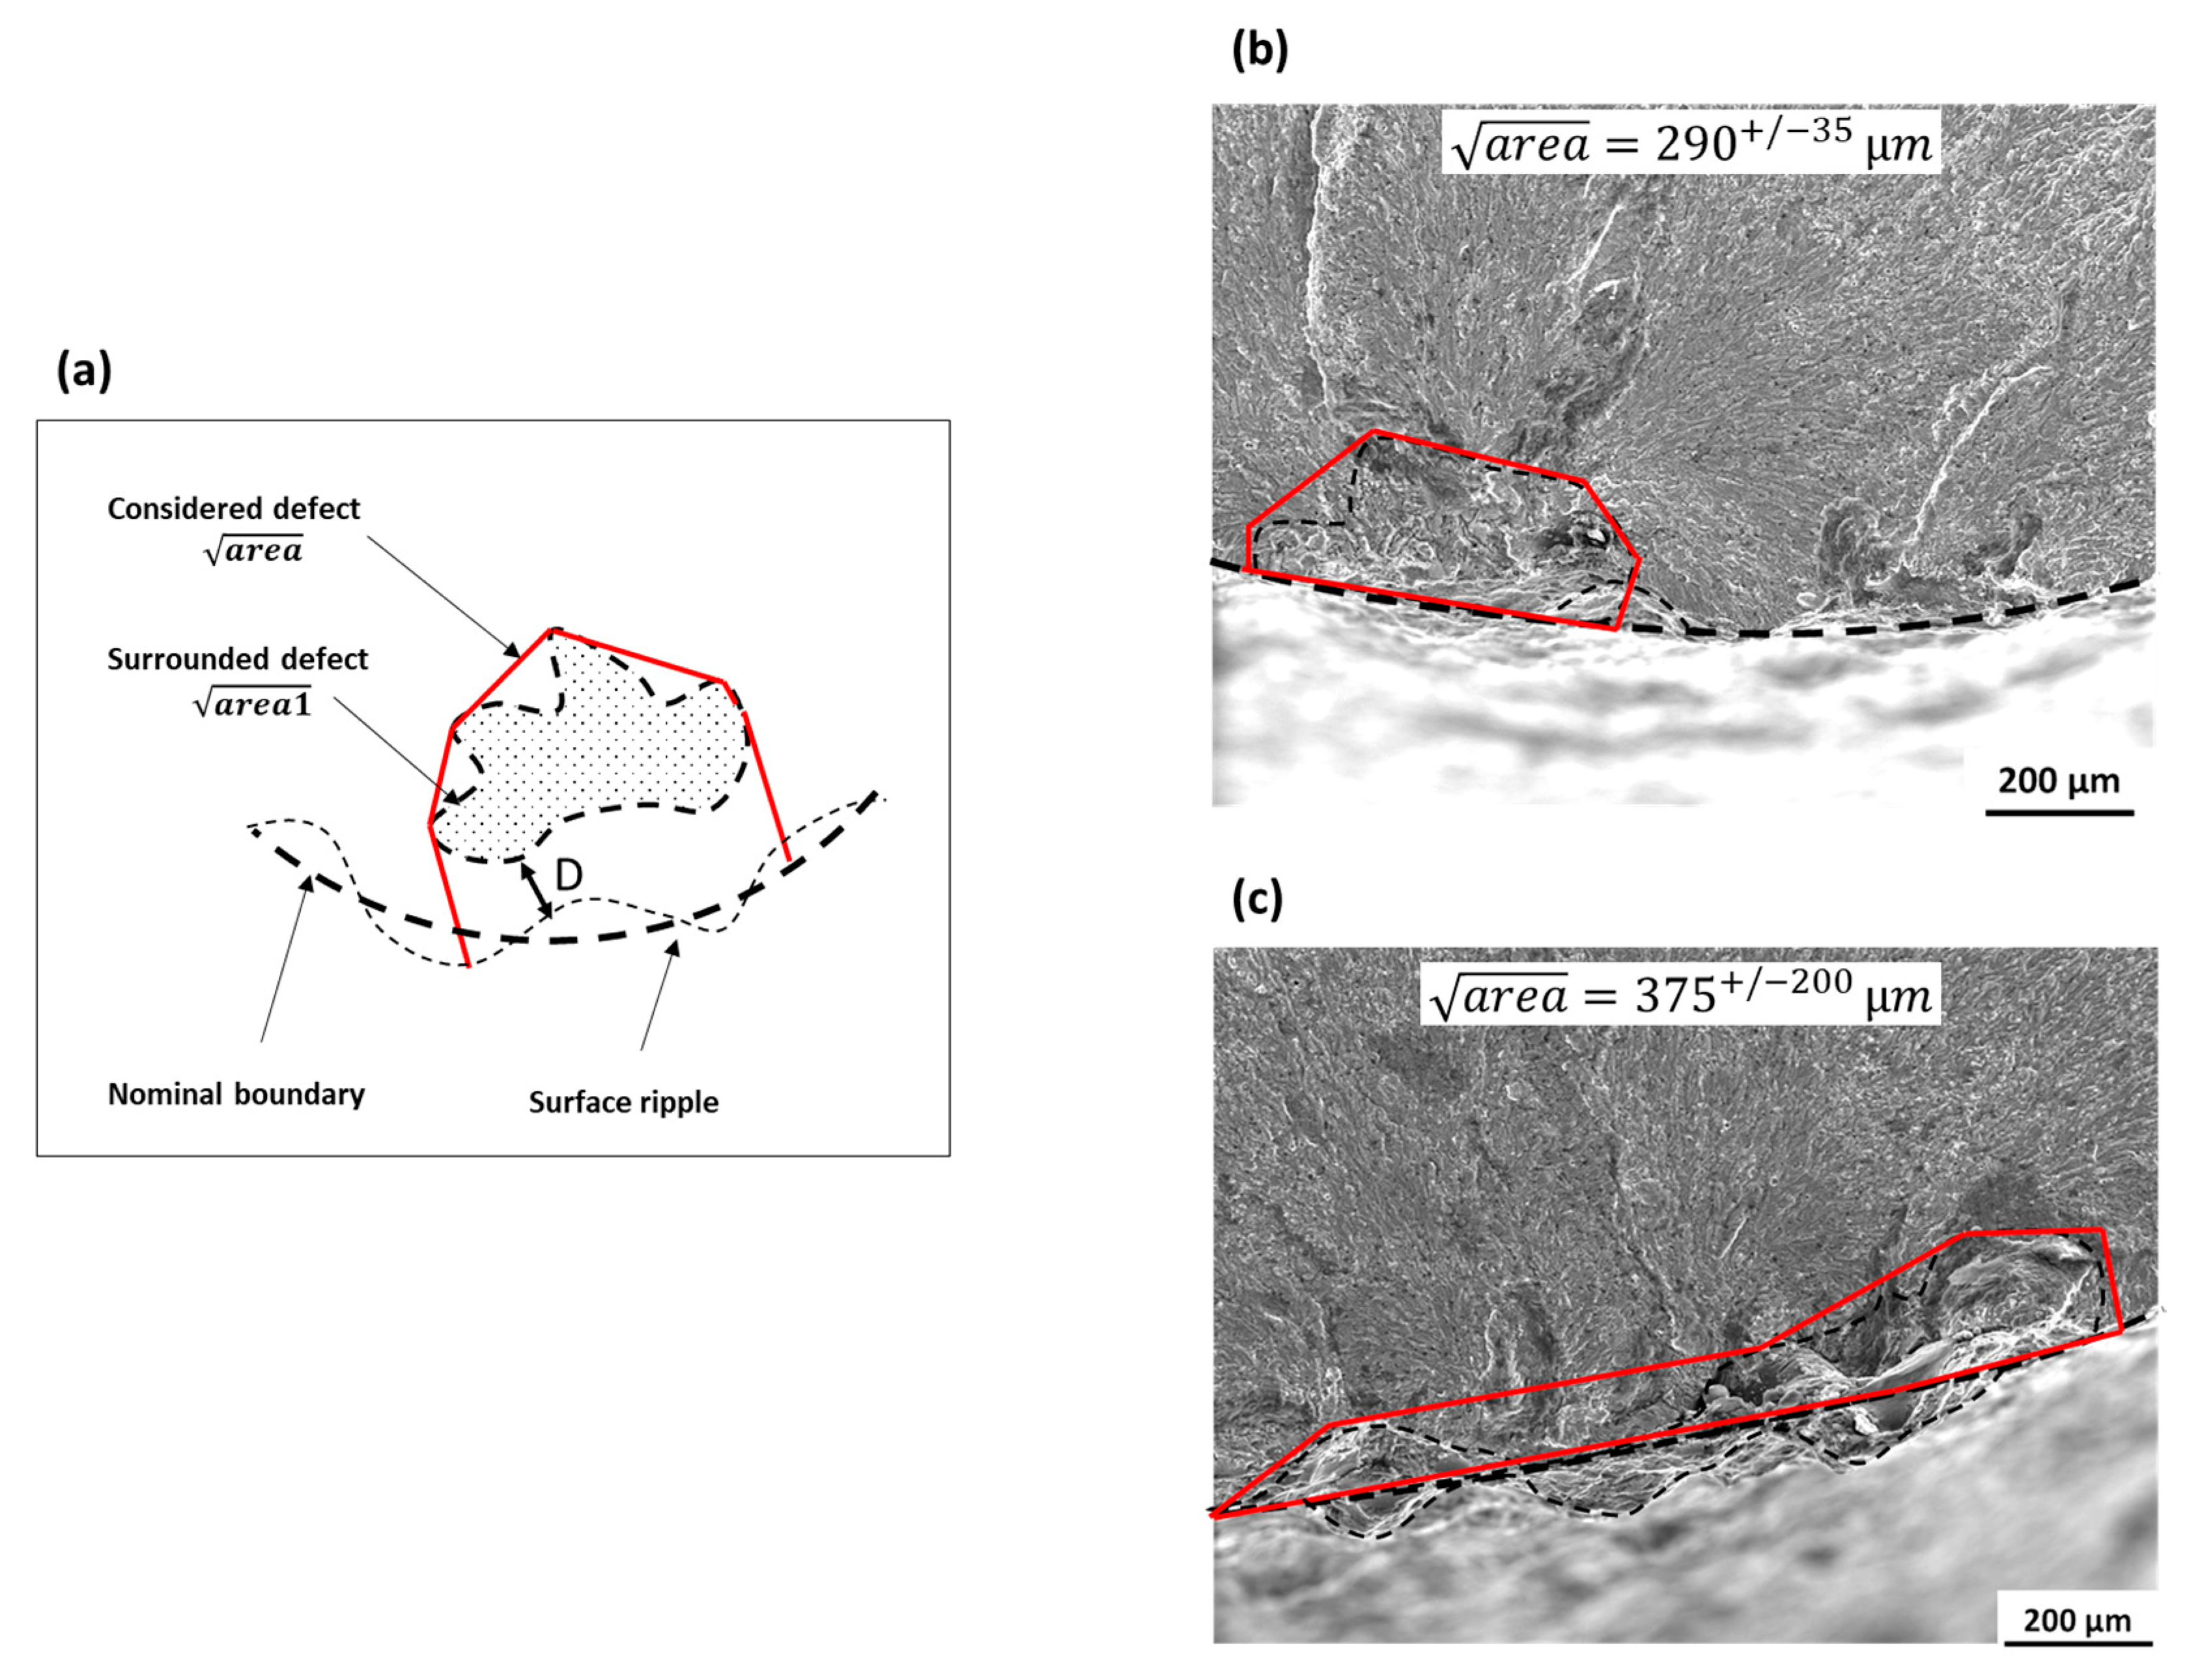
Analyse the data by considering the defect size effect by means of Kitagawa diagrams. This will help us to find out if, even in presence of as-built surfaces, it is possible to uncouple the defect size effect from those of the other material parameters. In that purpose, after test completion of different sets of specimens, all the fracture surfaces are analysed to clearly define the initiation site.
In order to access the objectives, an experimental test plan on additively manufactured specimen of AlSi10Mg alloy is proposed. All the fatigue tests are performed with R = −1 load ratio, under tension loading.

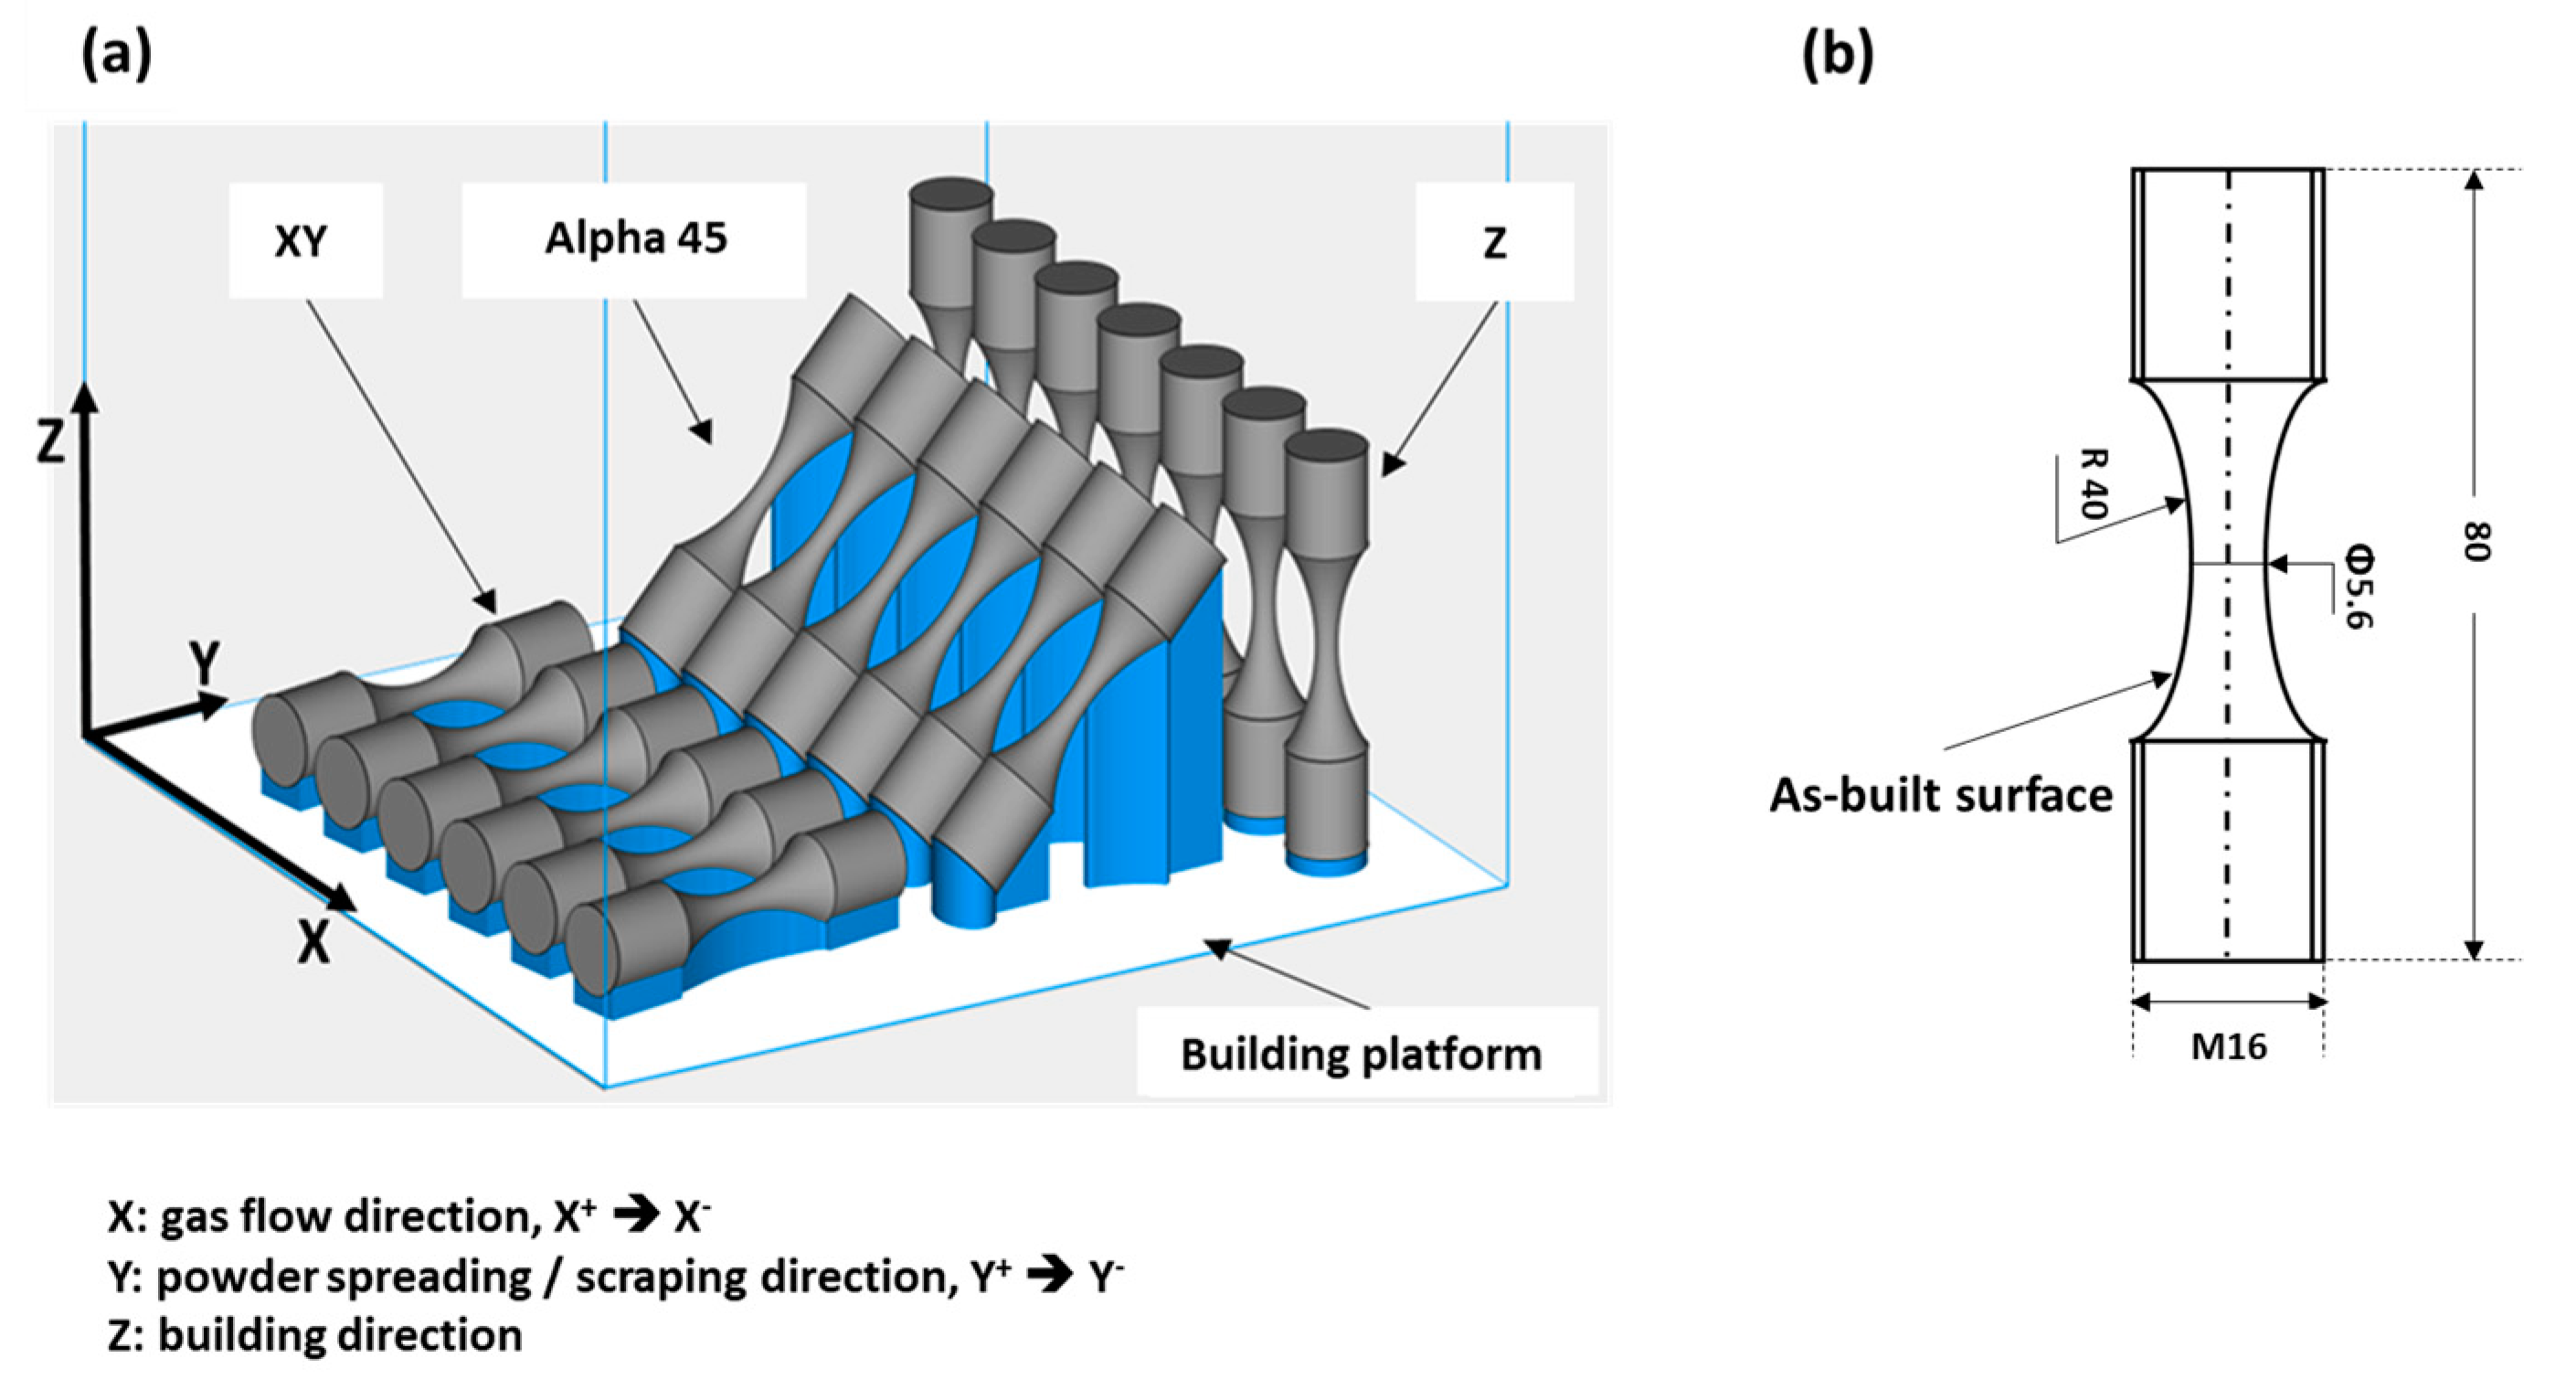
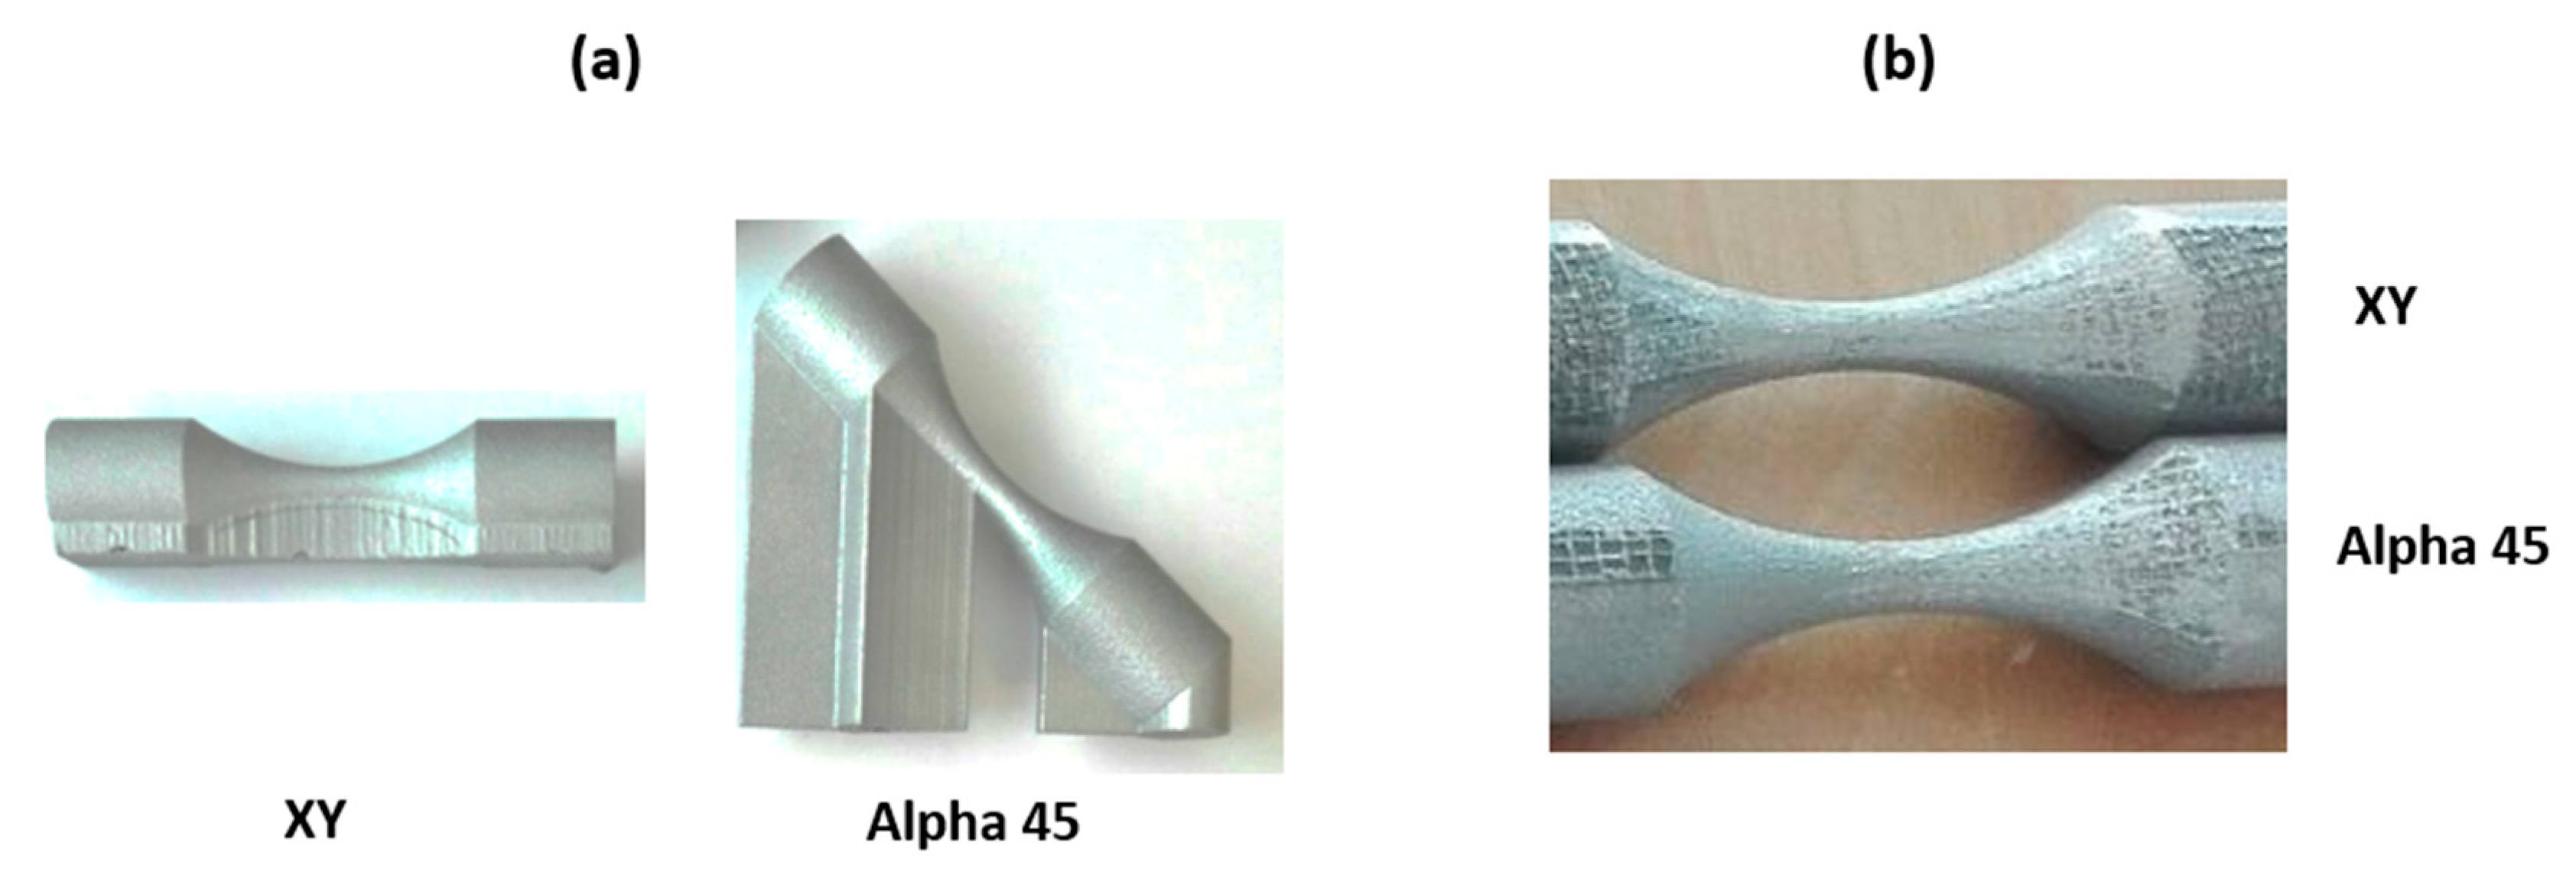
2. Materials and Experimental Methods

Specimens were fabricated on an EOS M90 machine (at Liebherr group, Toulouse, France) using a pre-alloyed powder with an average particle size of 30 µm. The powder has a chemical composition in accordance with the DIN EN 1706:2010 standard. Samples were produced in three directions with respect to the building platform and the powder spreading or scraping direction according to Figure 1a, namely XY for bars produced on the plan of the platform, alpha45 for those built along a 45° inclined direction and Z in the case where the building direction is perpendicular to the platform. The layering was performed by means of a scraper. Bars were built on a platform heated at 200 °C and a stress relaxation treatment was performed during 2 h at 300 °C under air environment. Fatigue specimens were machined according to the drawing in Figure 1b. In Figure 2a, one can note that XY and alpha45 specimens were produced with construction supports that needed to be removed before testing. In this study, these supports were manually removed using pliers in the first step, followed by a grinding wheel. This manual process is not calibrated on a machine and could be strongly dependent on the operator. There is no specific procedure to check symmetry or quantity of removed material. The way it was conducted in this study is representative of the way it is conducted in some industrial contexts. The fatigue test specimens, as presented on Figure 2b, have a partially as-built (AB) gauge length surface, with a raw surface and a ground area. The specimen was completed by the machining of the threads. Before any further words, it must be reminded that the fabrication of the bars is controlled by many parameters, and particularly by those related to the laser beam (power, speed and hatch distance) and by the layer thickness. The value of process parameters used for the fabrication are given in Table 1. Two passes (set 1 and set 2) of the laser were made to achieve the contours. Consequently, when one considers a cross section in the gauge length according to Figure 3, different areas can be distinguished according to the building strategy. Energy density (Ev) was calculated using the following equation:
E v = P S · s · t
where P, S and t are the laser power, the scanning speed and the layer thickness, respectively, and s is the laser spot diameter ( s = 80   µ m ) . Results are reported in Table 1. The broad range of values suggests that the resulting microstructure can be affected, for instance, at the scale of grains, which is known to be dependent on the solidification rate, in turn depending on Ev.
Samples were tested with and without T6 heat treatment (presented in Table 2) on a AMSLER 10 HFP 422 machine. As described in a previous study [14], fatigue tests were conducted at room temperature on a resonance machine at a frequency of 80 Hz and with a load ratio of R = −1. A 5 Hz, a drop in frequency was considered as the criterion for failure detection; the final crack covered half of the sample section so that it was extremely close to full separate sample failure. S-N curves plotted used only failed samples; run-out points at 106 were not considered. The fatigue limit is defined as the amplitude of the load; in the present study, tests are conducted at R = −1 so that amplitude and maximum are identical, that is to say, the maximum load minus the average load. Based on previous studies [14,29,30], a step-by-step method was used to determine the fatigue limit at 106 cycles. It is noteworthy that this is the only way to evaluate the fatigue limit in presence of natural defects. As demonstrated by Roy et al. [31], one can consider that there are no significant loading history effects introduced by the loading steps applied prior to the step leading to failure for AlSi cast material. In this study, the fatigue limit was calculated after one or several loading steps using the following equation [32]:
σ D 1 t e = N f 10 6 ( σ n σ n 1 ) + σ n 1
The microstructure achieved before and after T6 for the bulk material were analysed in a previous paper [14]. Here, it is worth noticing that after T6 heat treatment, the melt-pools boundaries, that reflect scanning strategy, disappear. Therefore, the T6 microstructure seems more homogeneous, with many silicon precipitates randomly distributed all over the matrix. In the same paper by Domfang et al. [14], emphasis is placed on the surface roughness characterisation. Two parameters, Ra and Rv, representing the average roughness and the deepest valley with respect to a neutral line, respectively, are used as surface roughness indexes. Accordingly, the surface roughness measurements were performed by means of a linear roughness meter along about 15 mm of the gauge length with a 2.5 mm cut off, according to the ISO4287 standard. In fact, as the additive manufacturing process involves many layers inducing the formation of ripples on the external surface, it seems important to assess the roughness by using a cut-off value of the order of the layer thickness. For instance, a 2.5 mm cut-off value corresponds to at least 80 layers, and consequently many ripples. The results reported in Table 3 confirm a significantly higher roughness of as-built surfaces as compared with machined surfaces. However, one can note a difference in Ra and Rv values between alpha45 and XY specimens that probably results from interaction between molten zones and particles. It has to be emphasised that the construction supports were manually removed with a grinding wheel, so that the inherited roughness is of the same order size of the tool wear particles and depends on the grinding orientation.

3. Results

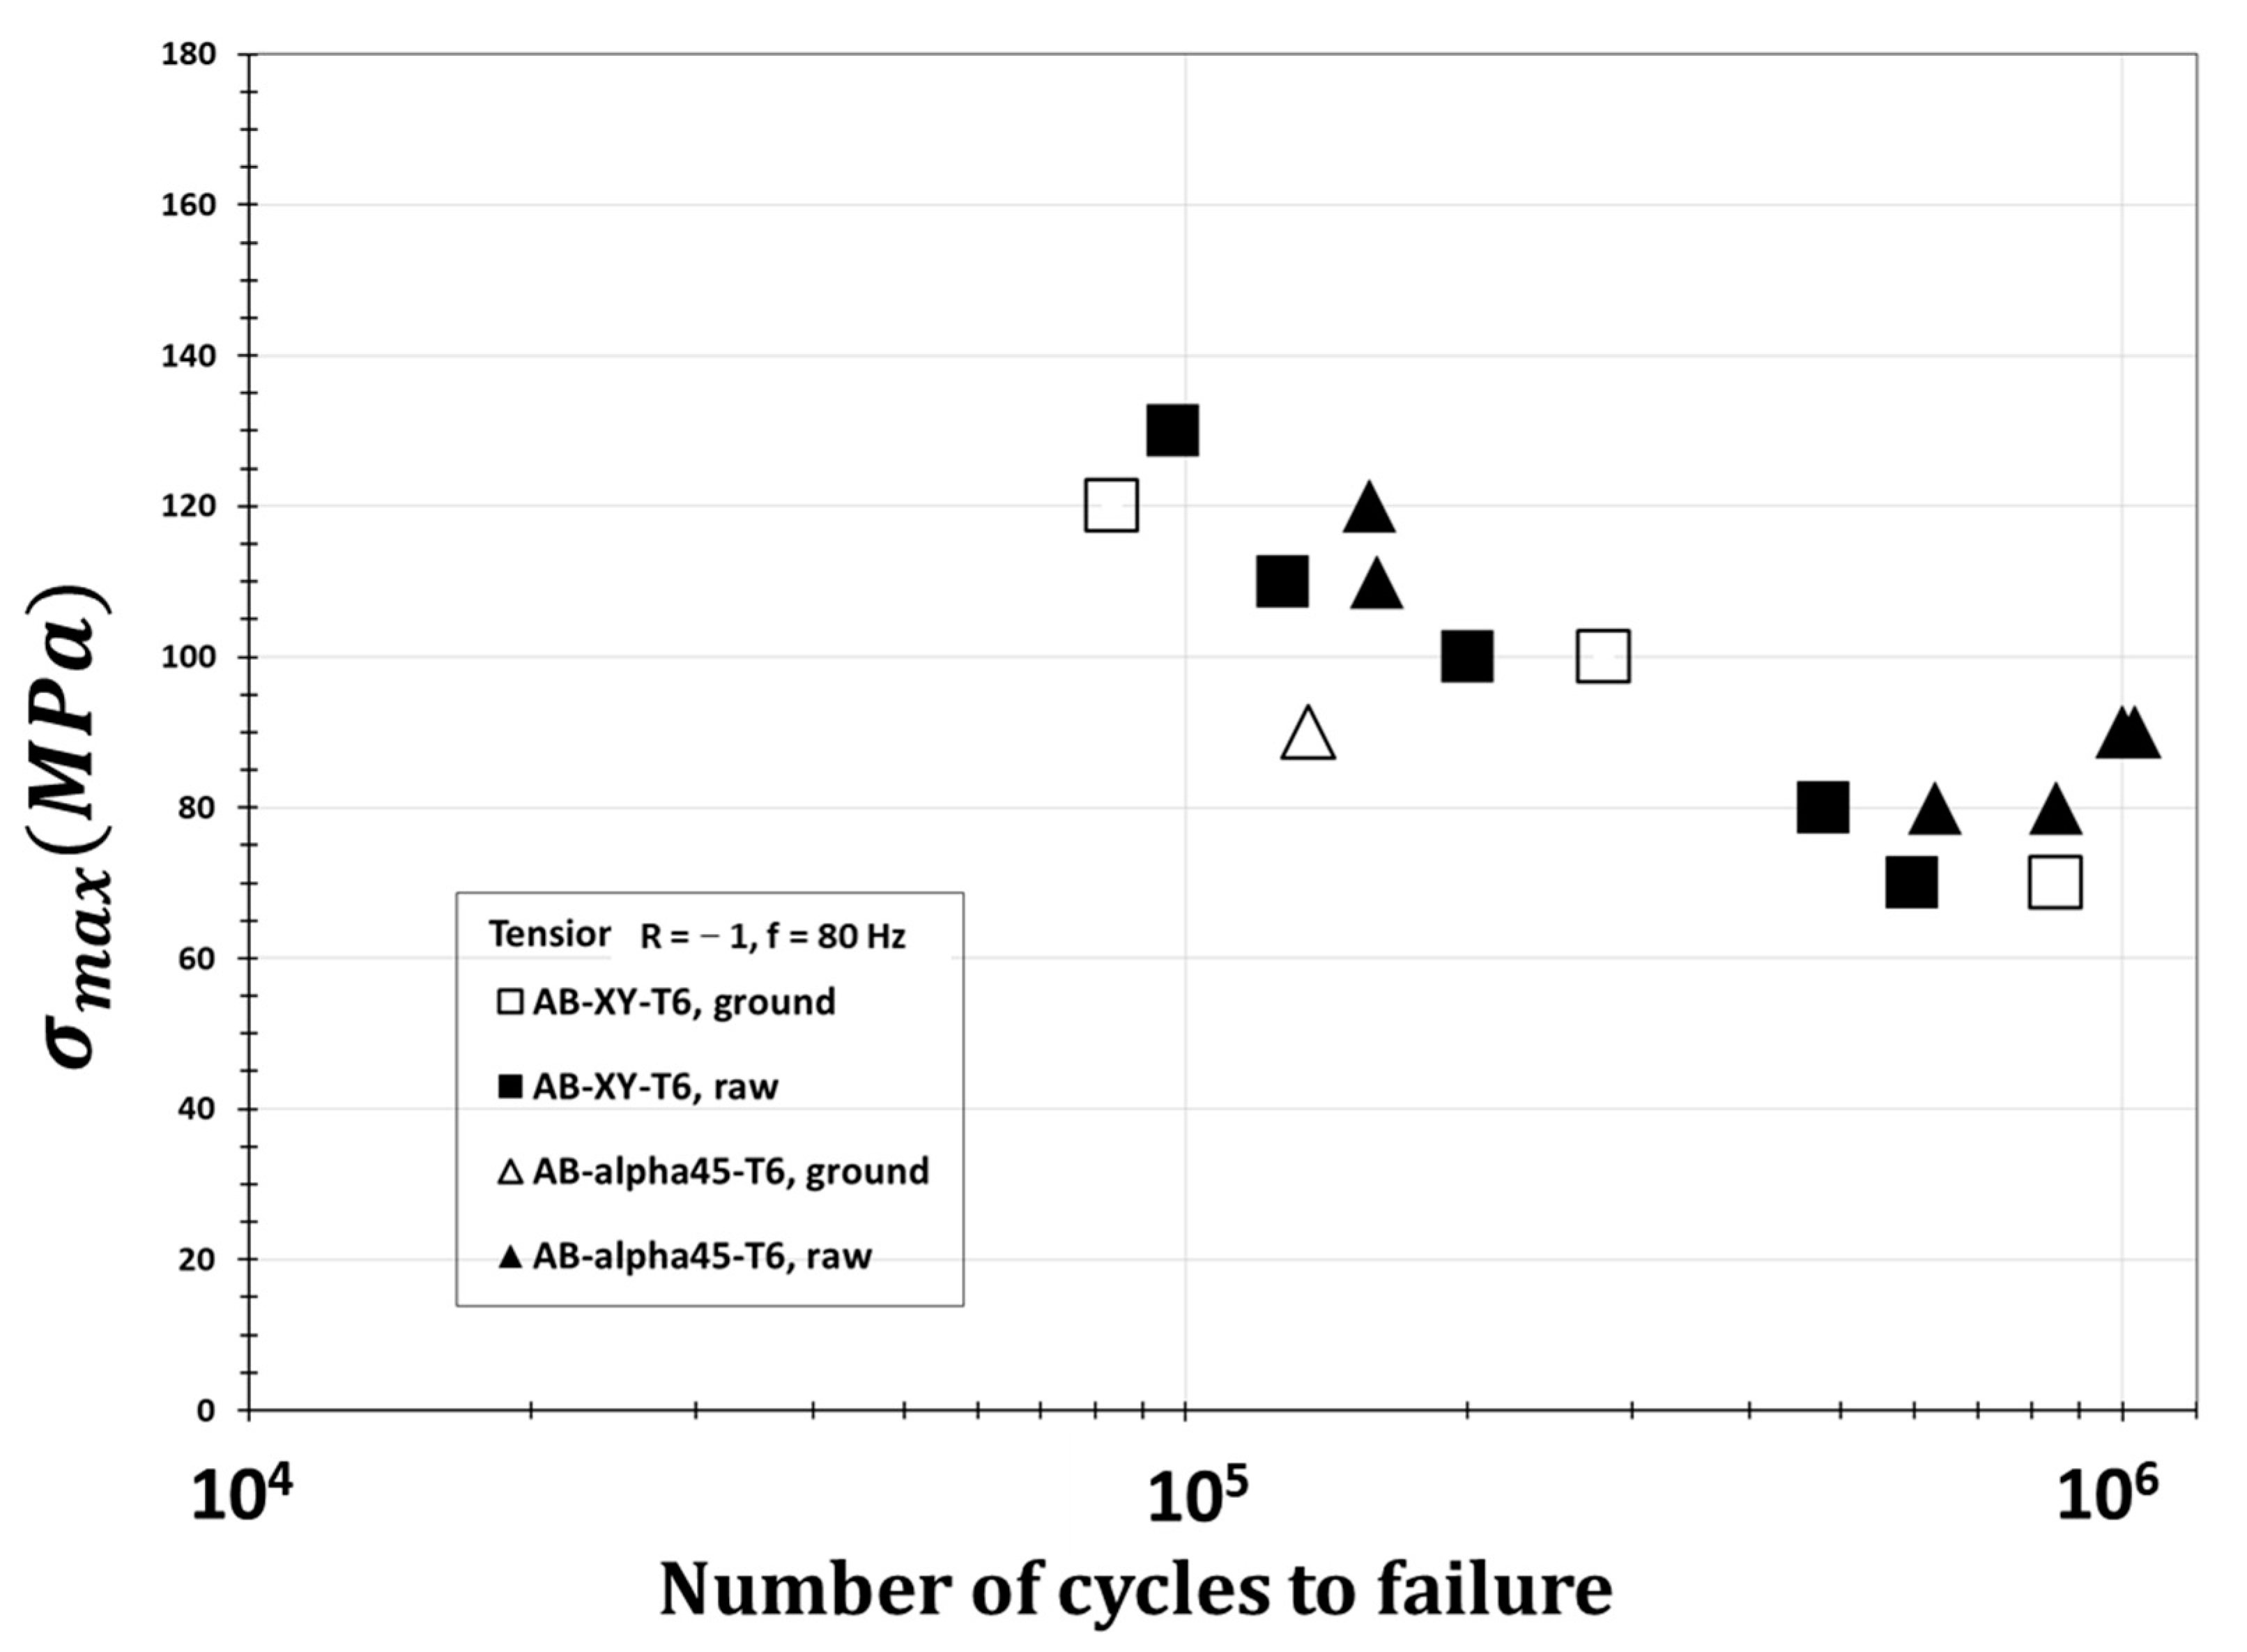
3.1. Influence of Support Grinding

The influence of support grinding on the fatigue resistance of T6 material is quantified in Figure 4. In that purpose, specimens with alpha45 and XY orientations were tested. Open symbols correspond to specimens that failed from an initiation site located in the ground area, while filled symbols are associated with an initiation from the as-built surface. Three of the eight fractured XY specimens (square symbols) exhibited a failure in the grinding areas, while this type of failure origin was observed only once among the seven alpha45 specimens tested (diamond symbols). One can furthermore notice in Figure 4 that open symbols, representing the failures from ground areas, are almost in the same scatter band as full symbols denoting failure initiated on as-built surfaces. Therefore, it can be concluded that the manual process used to remove the construction supports does not seem to influence the fatigue strength drastically. Additional information on the fracture surface will be presented to support this first conclusion on the effect of ground surfaces.

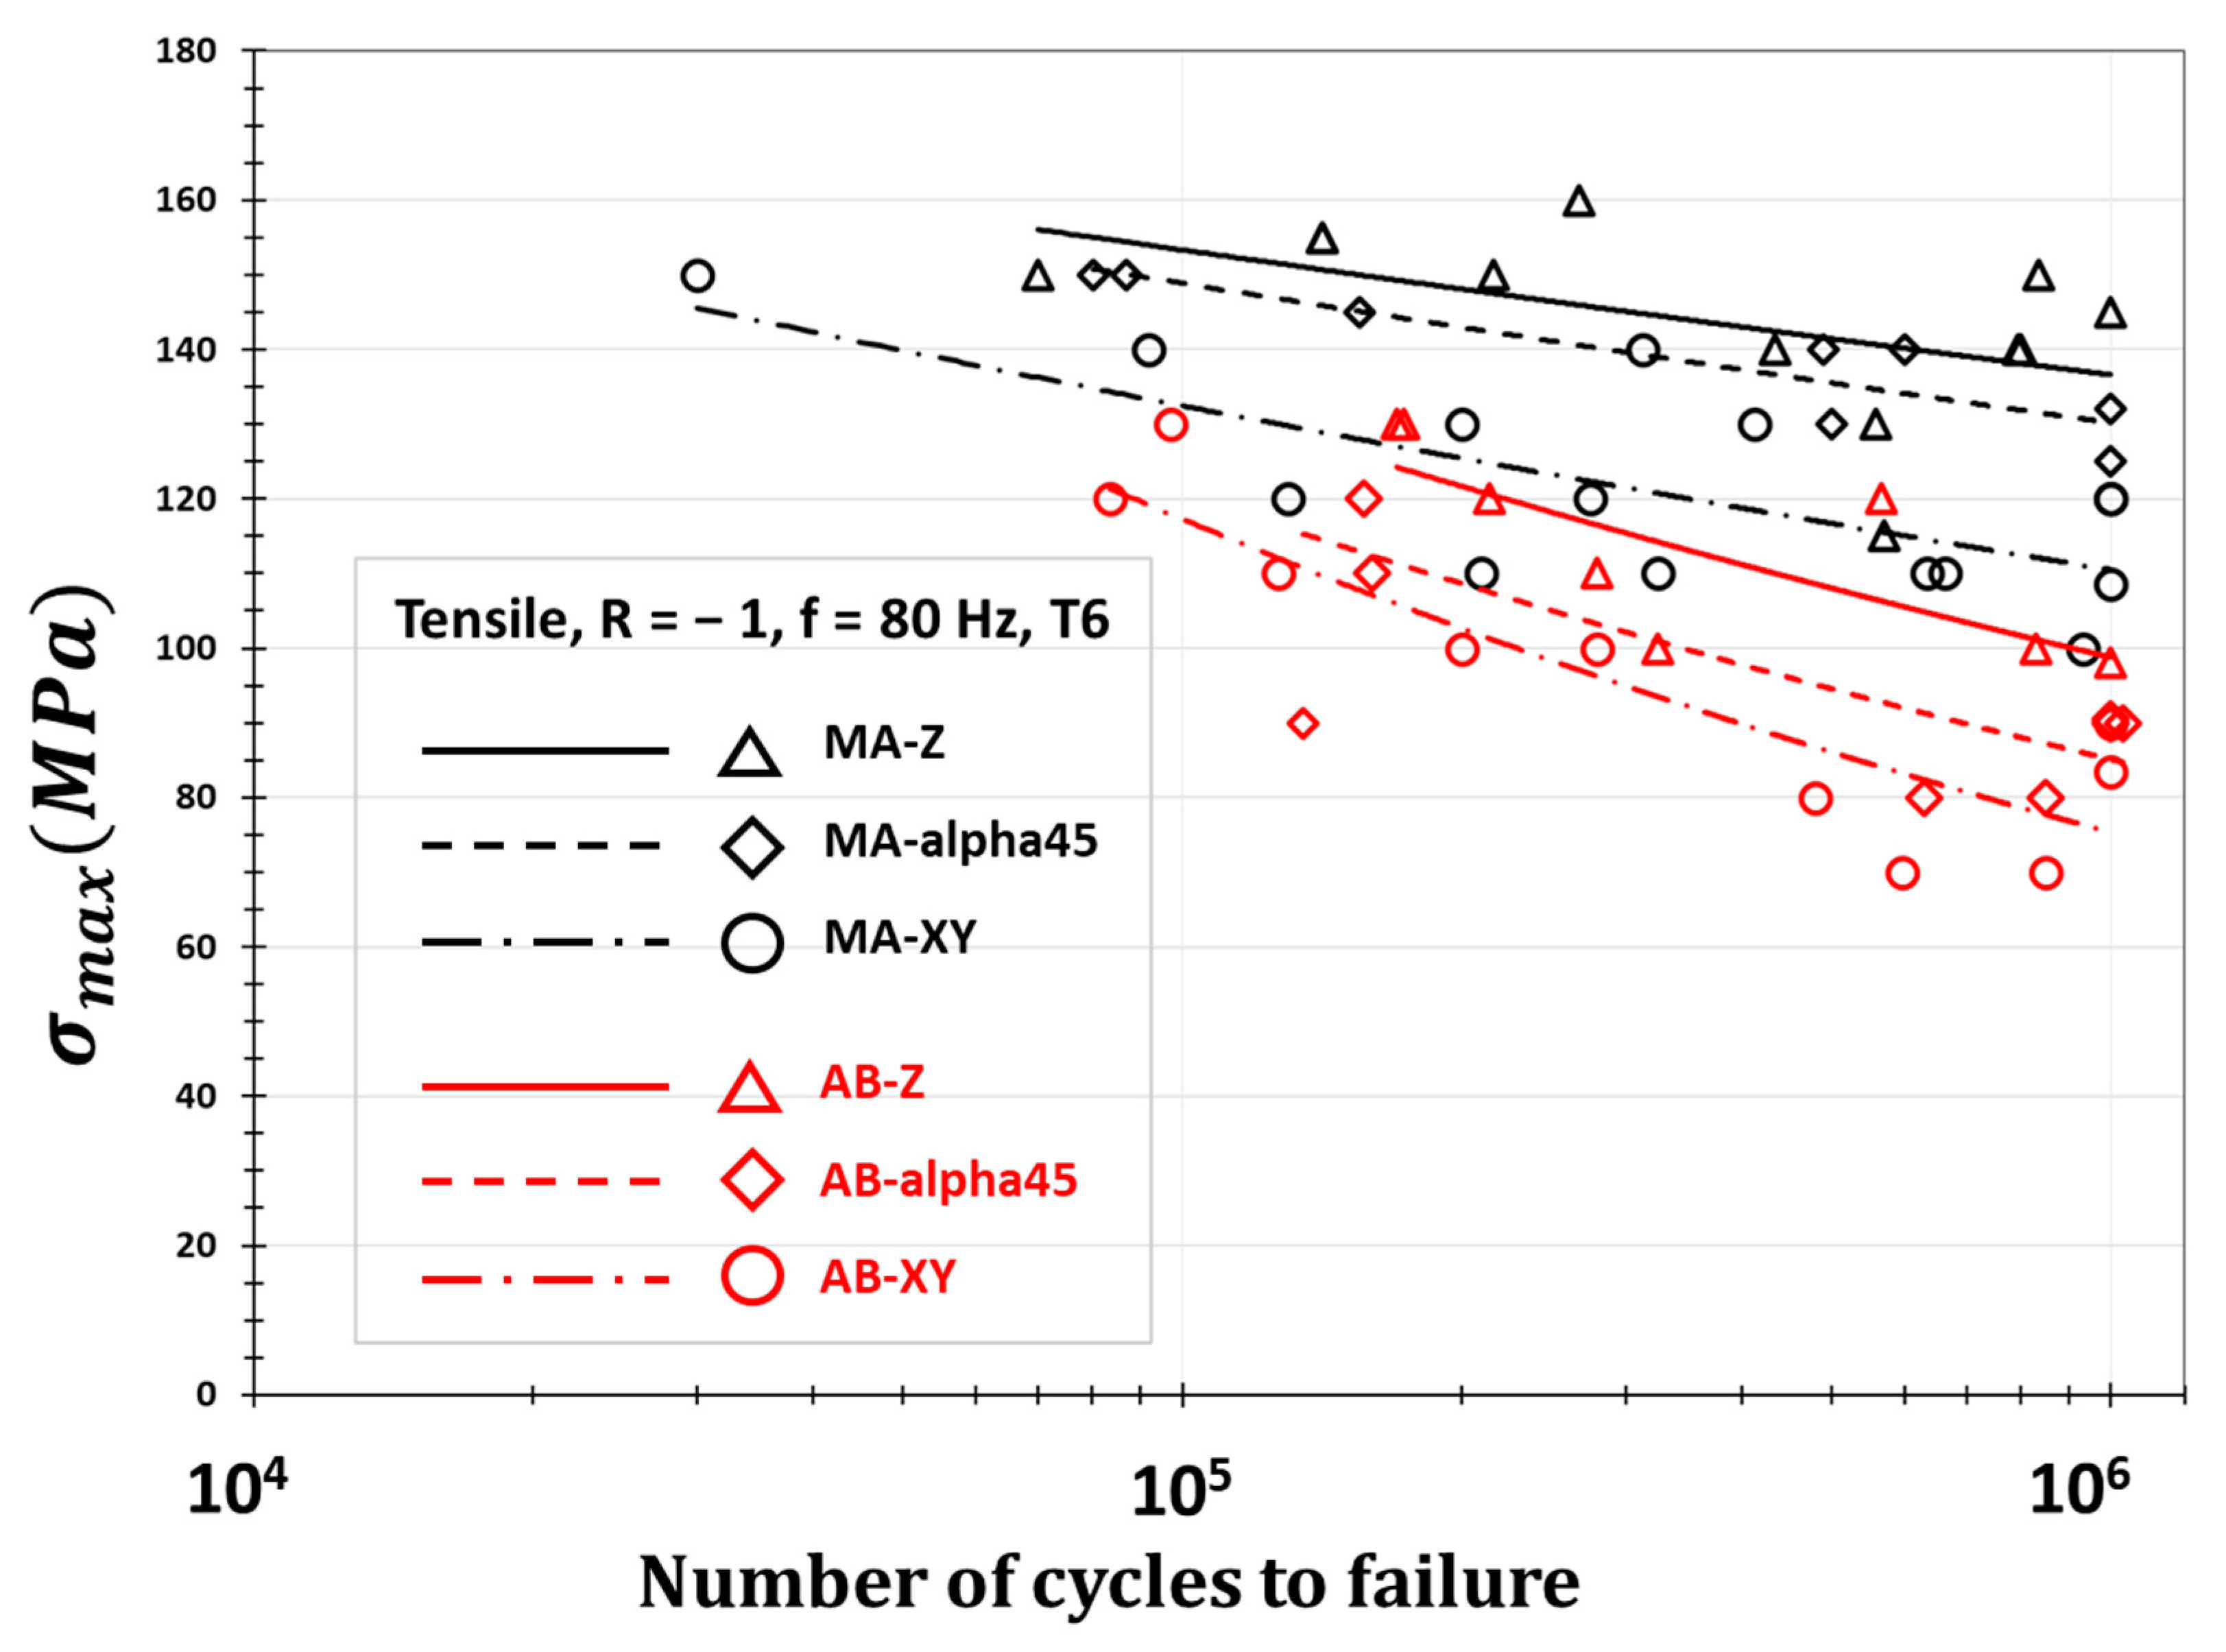
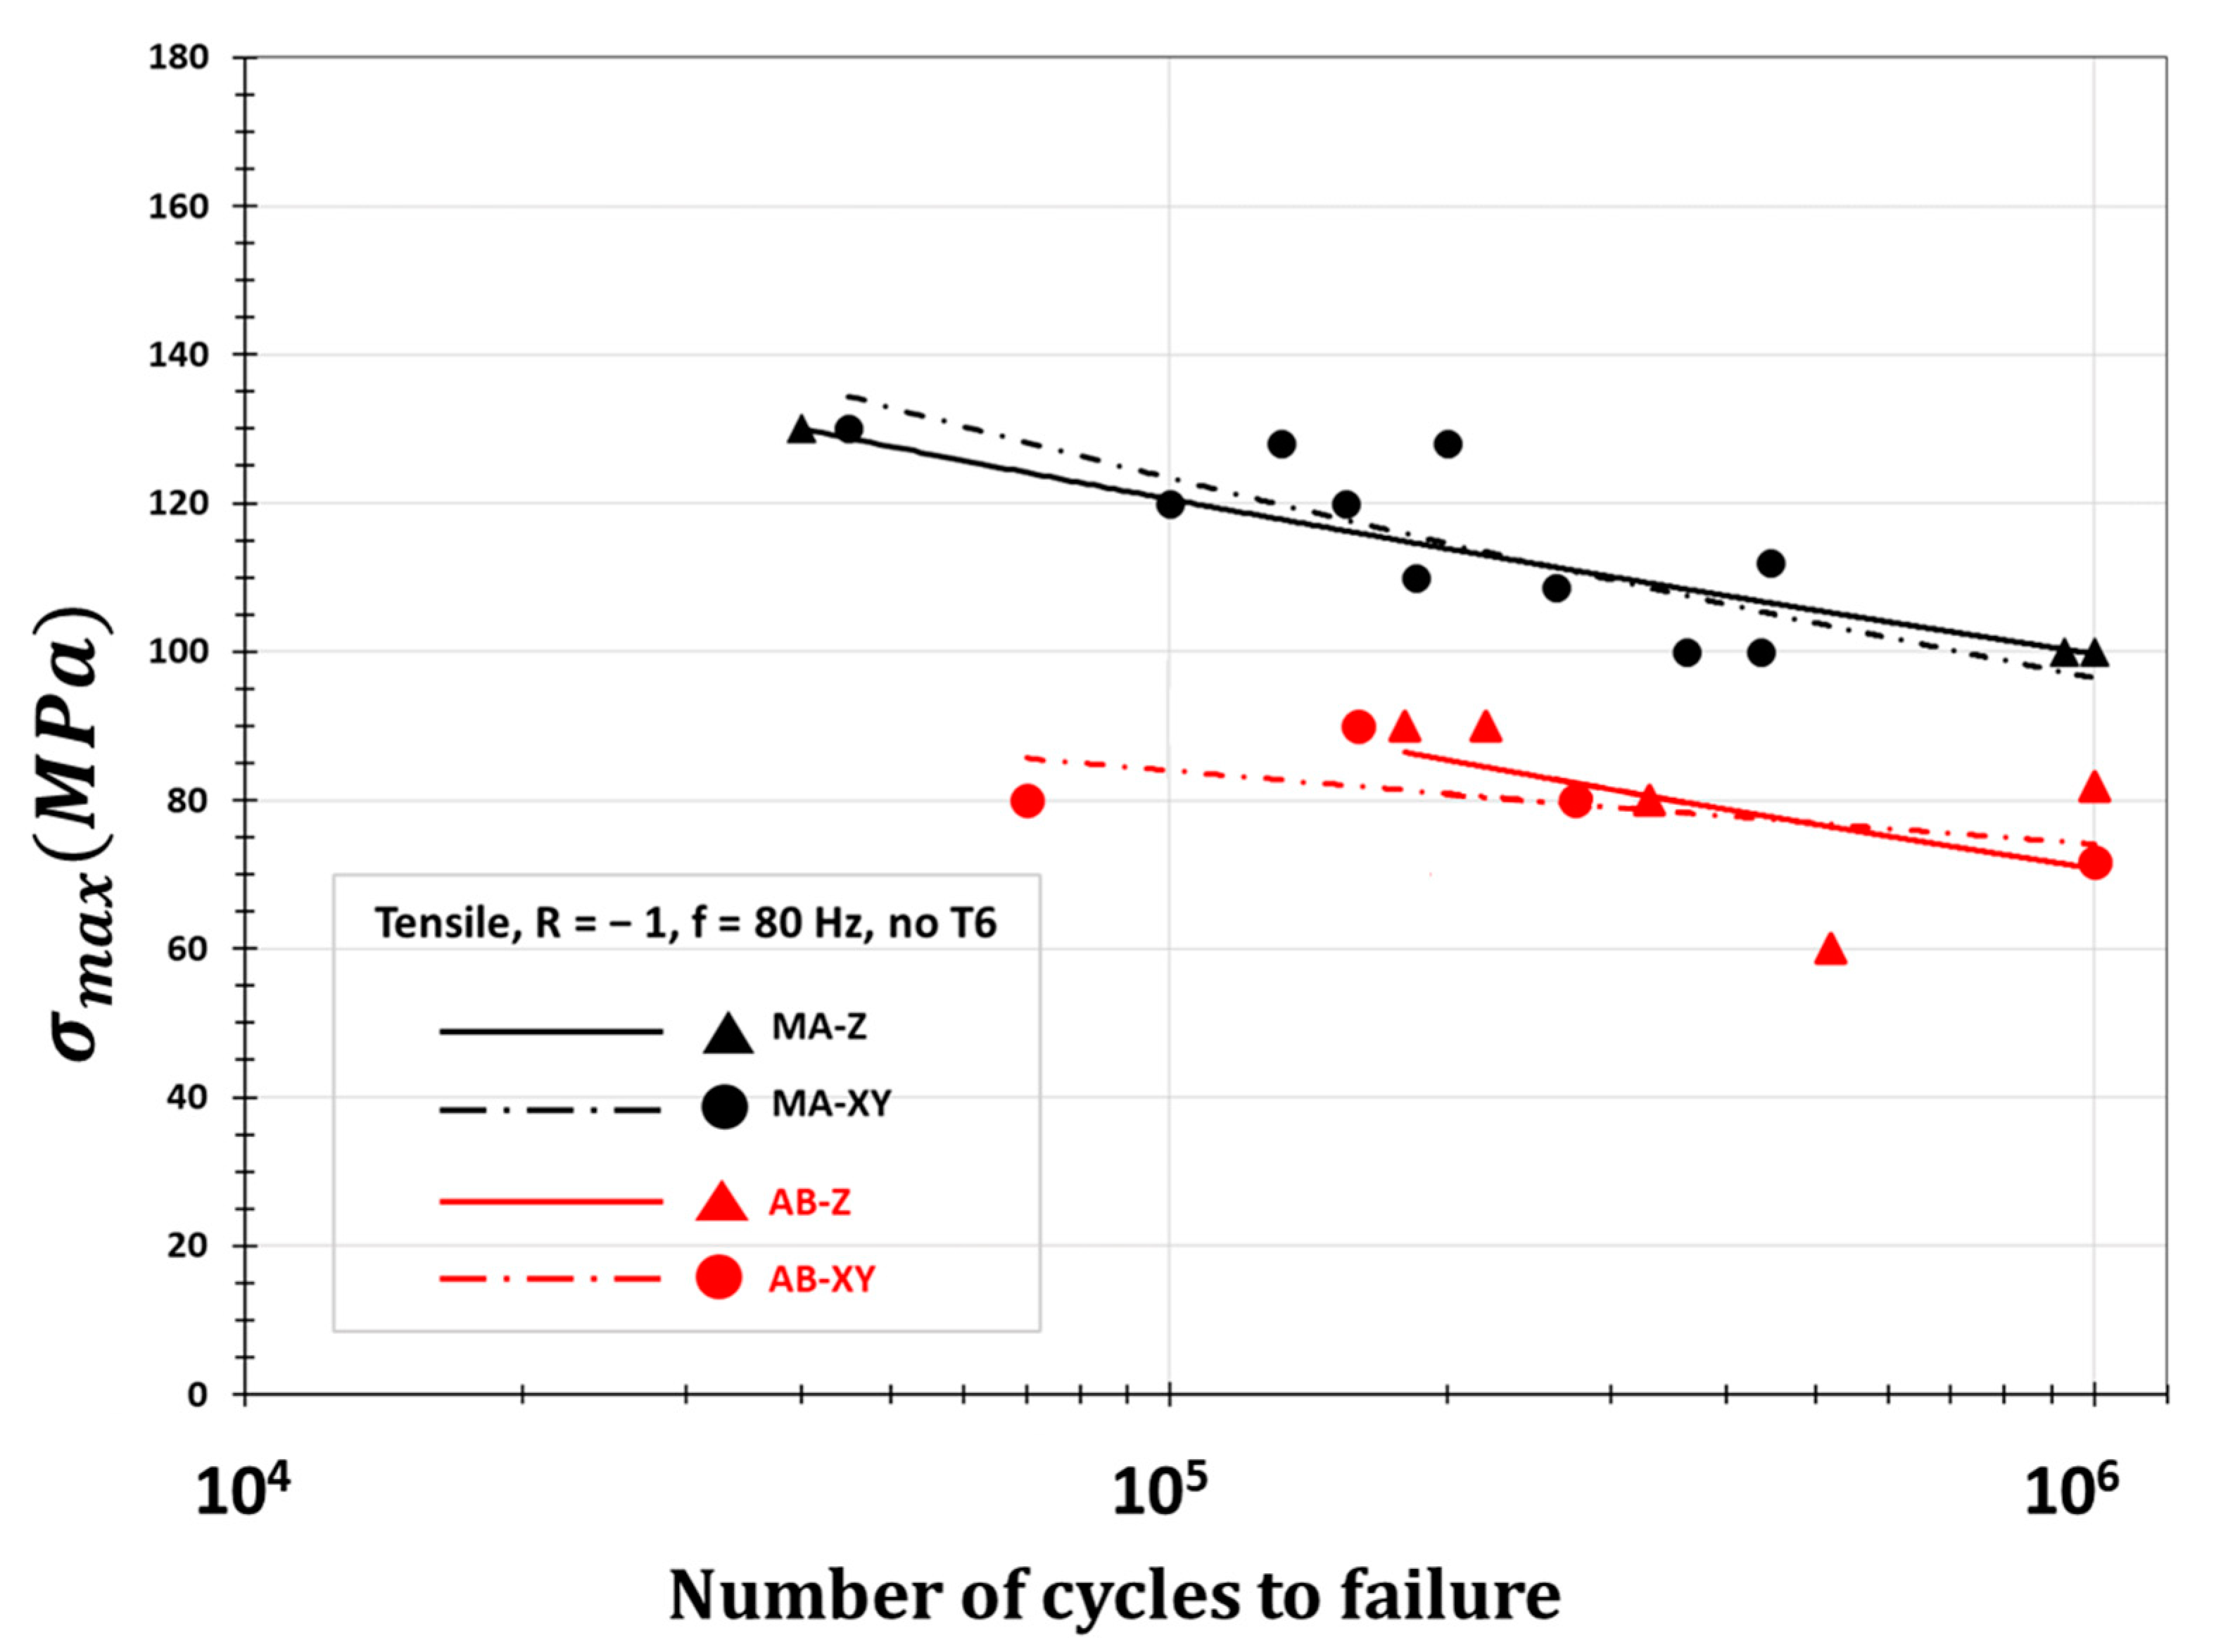
3.2. Influence of Building Direction

First of all, it is important to clarify that the results associated with the as-built condition are probably underestimated because of the section definition. Indeed, the external diameter of the specimen is here considered in the stress calculation, which certainly underestimates the actual stress compared with the inner diameter, due to the surface ripple. Typically, for a specimen with the measured section of 5.6 m, the formation of a ripple of 100 µm in depth will result into an internal diameter of 5.4 mm. This corresponds to the circle which is co-axial with the specimen axis and tangent to the bottom of ripples. In that previous case, a 100 µm-deep ripple will result in an underestimation of around 3% of the stress actually applied. It is also important to mention that the residual stresses possibly present in specimens were not quantified. In fact, the high level of surface roughness (cf. Table 3) spreads X-rays and make the measure of residuals stresses, as classically performed on machined specimen, difficult [14]. However, considering the values of the volume energy density involved in the specimen fabrication (Table 1), the presence of residuals stresses that could affect the fatigue resistance cannot be excluded, although this would need to be assessed by considering that the heating of the building platform could contribute to reduce this residual stress effect.
On the basis of the S-N curves presented in Figure 5, the respective influence of as-built surfaces and building direction are quantified for both T6 and non-T6 materials. The results are compared with those obtained on machined specimens in a previous study [14]. For T6 material, one can observe a marked decay in fatigue strength due to the as-built surface. In addition, a certain anisotropy due to the building direction, and similarly, the one observed in machined samples, can be noticed in specimens with as-built surfaces, according to the following ranking: Z > alpha45 > XY. This is consistent with a sketch proposed in [14] that correlates the fatigue behaviour to the grain size, all other parameters being kept equal.
The S-N results for non-T6 material are provided in Figure 6. Only two directions are compared here. Despite to the limited number of specimens tested, it seems that there is no significant influence of the building direction. A similar observation was made on machined specimen in a previous study [14]. Therefore, it comes out that, even in the presence of an as-built surface, the fatigue behaviour of the non-T6 material does not exhibit a strong anisotropy. By comparing T6 and non-T6 results in Figure 5 and Figure 6, one can see that the fatigue strength of non-T6 material is lower than the T6 heat-treated one. This confirms that, even in presence of an as-built surface, the improvement of material matrix, induced by a T6 peak-hardening heat treatment, leads to a significant improvement of the fatigue strength. However, given the limited data and the scatter, this analysis needs to be supported by additional observations. In the same way, it is important to analyse carefully the fractured surfaces to identify the nature of the fatigue initiation site.

4. Analysis and Discussion

Regarding the fatigue limit, a previous paper [14] shows the efficiency of the Kitagawa approach to uncouple the effect of defects from other material parameters. Therefore, it seems natural to analyse the fracture surfaces firstly, in order to find out if the fatigue crack initiates on a defect, and if so, to quantify its size so as to establish a Kitagawa diagram.

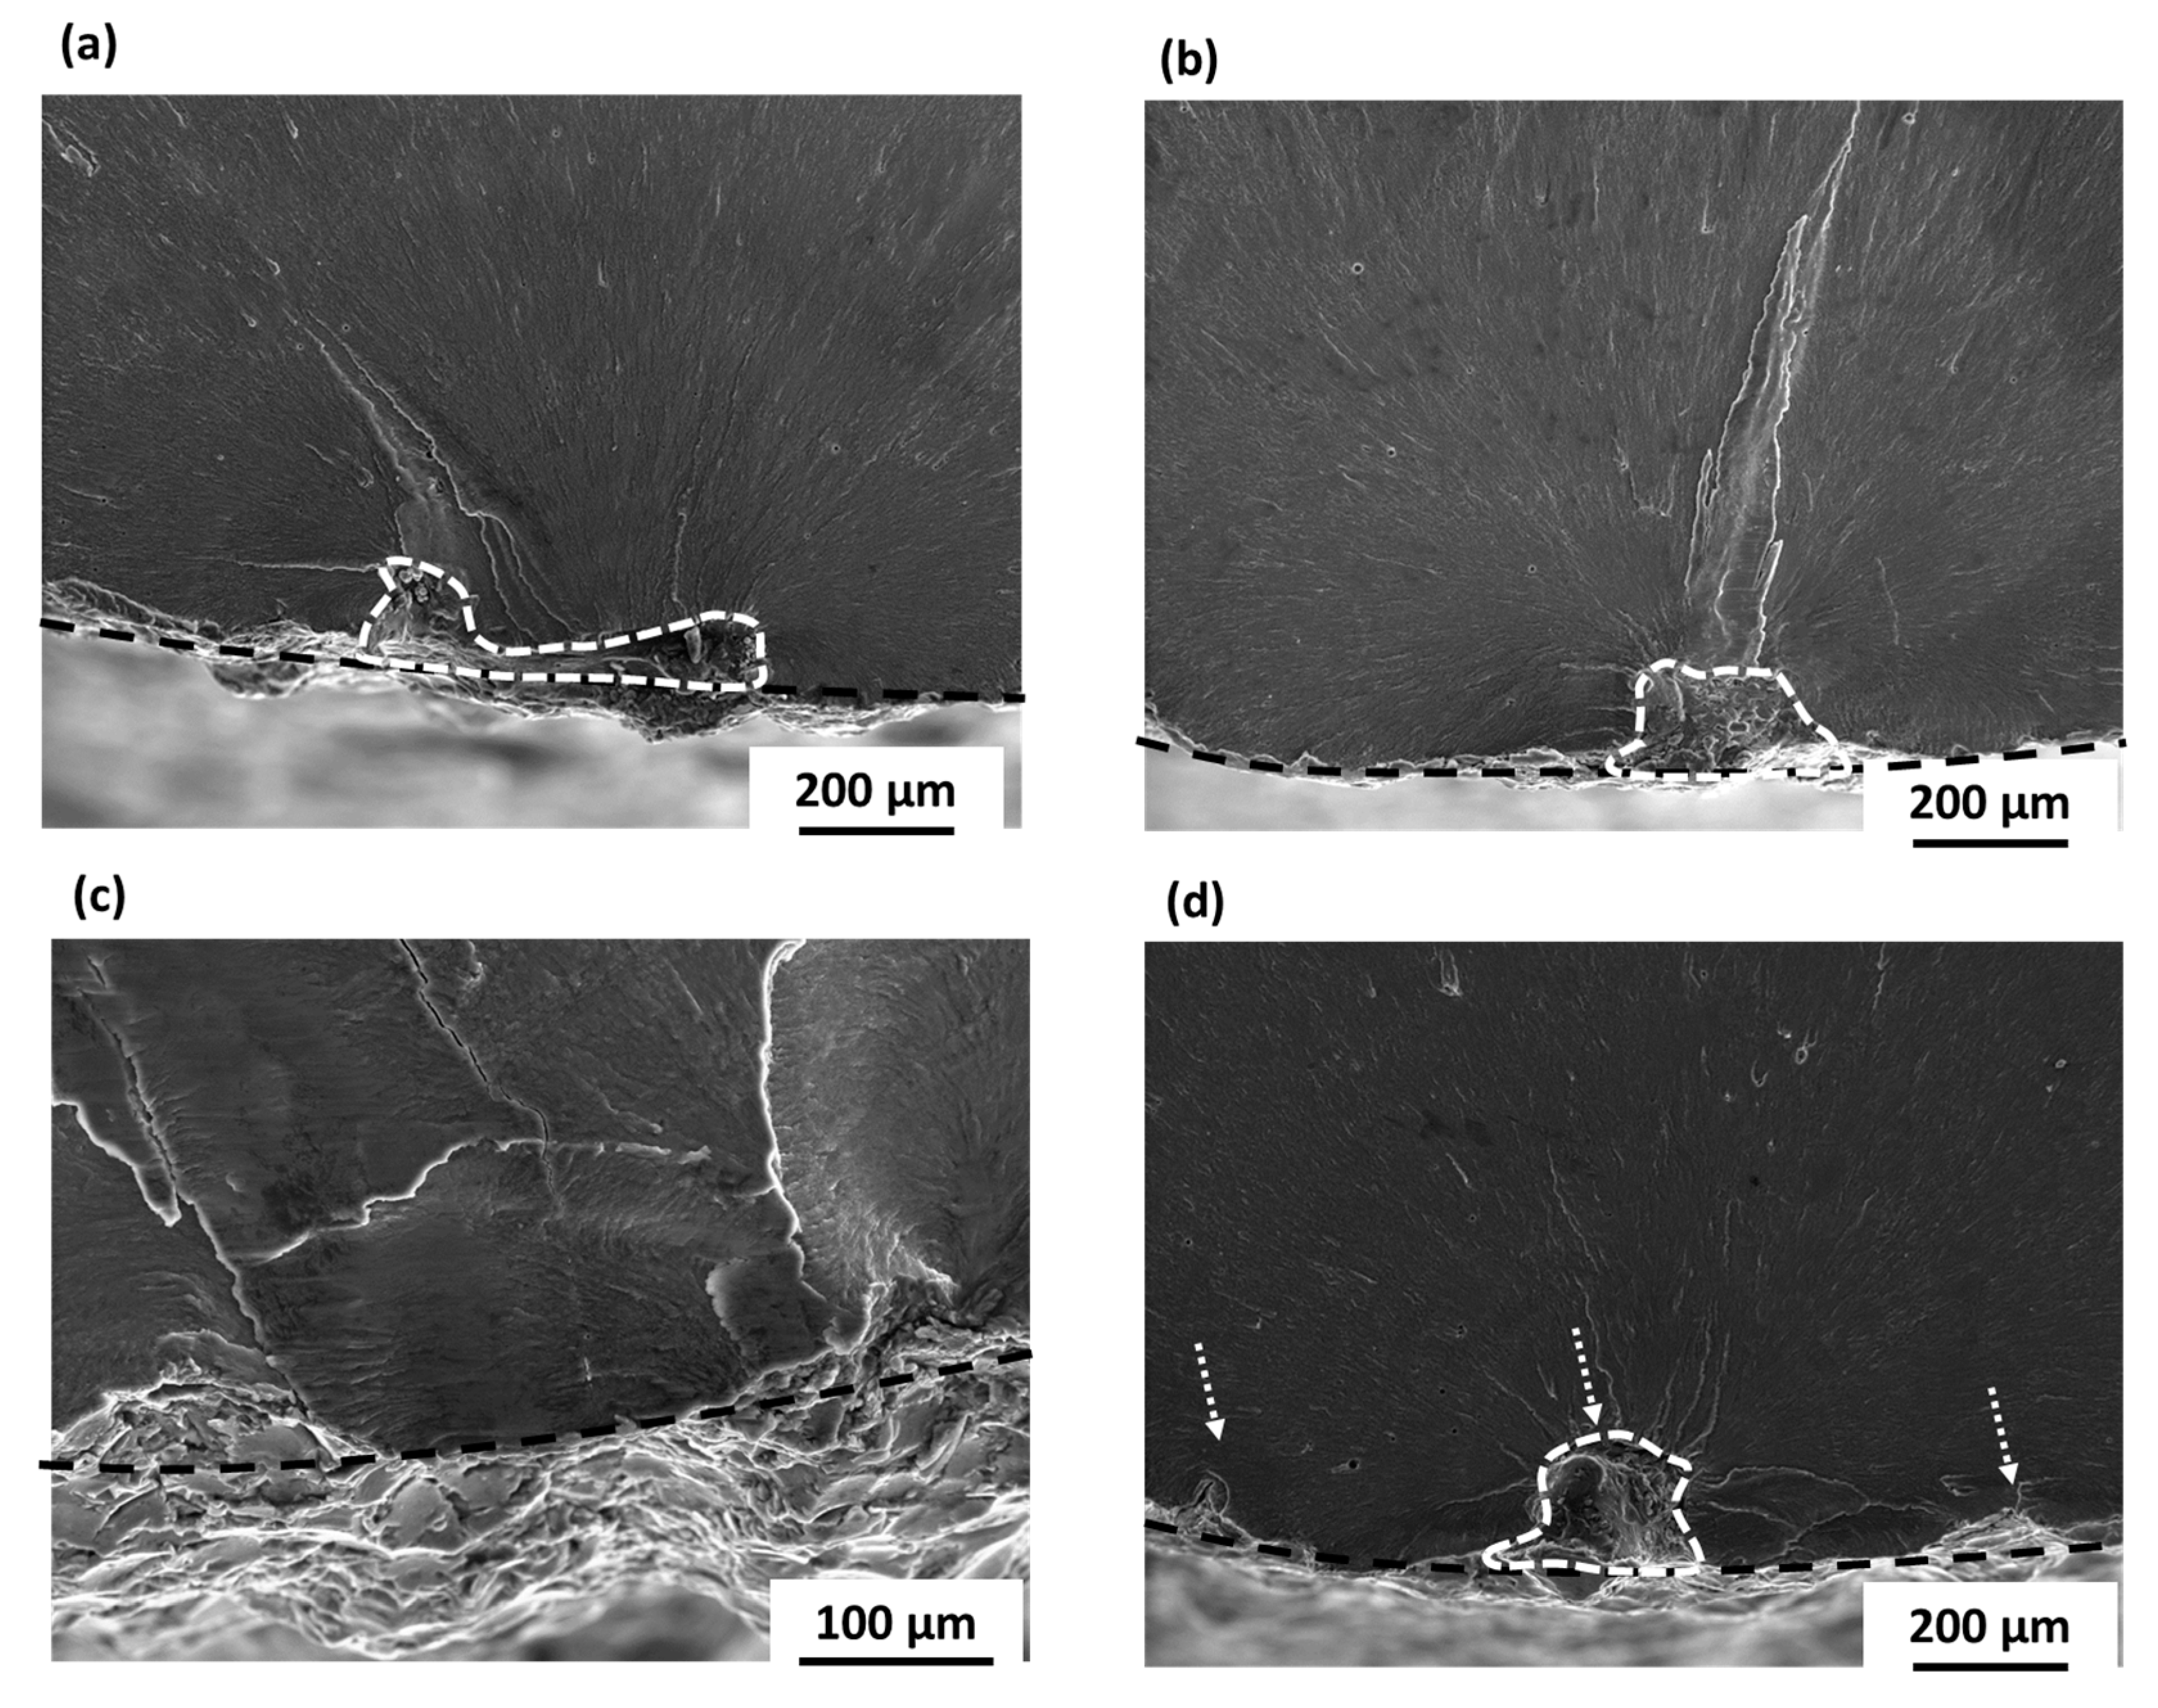
4.1. Fracture Surface Analysis

SEM fracture surface observations of non-T6 and T6 material are presented in Figure 7 and Figure 8 which show the fatigue initiation sites. The nominal contours of each specimen, that means the circle that circumscribed the ripples, are indicated by black broken lines. If the initiation related to the presence of porosity, lack-of-fusion or even isolated defect is generally well characterised in machined samples [14,22,25,26,27,28,29,30,31,32,33], it seems difficult to clearly identify such initiation sites in of the case of such rough surfaces. In Figure 7a,b, and Figure 8b,d, the convergence of river lines makes it possible to surround an area that can be used as the initiation site. In Figure 7c, the crack seems to initiate from a surface at the scale of a particle, while in Figure 7d, one can clearly identify three initiation sites close to a single porosity defect. However, Figure 8a,c show examples of initiation on a surface ripple. Therefore, the next step in the fracture surface analysis consists of the quantification of the initiation site size, when considered as defect.
The characteristic defect size is quantified from its contour by using the a r e a parameter as defined by Murakami and Endo [34]. This parameter corresponds to the square root of the surface resulting from the defect projection onto a plane perpendicular to the loading direction. This criterion was extended by Iben Houria et al. [29], who included the defect concavity and the ligament between the defect and the free surface. This definition of the defect size is extended to the case of surface ripple, as presented in Figure 9a, that is an example of a sub-surface defect, with a size equal to a r e a 1 . When a r e a 1 is smaller than the ligament length D, the considered a r e a size encompasses the convexity, the ligament and the surface ripple. The defect size is assessed from fracture surface observations using this approach and quantification examples are given in Figure 9b,c. The error mentioned in Figure 9b comes from the ripple position. In Figure 9c, the error comes from the consideration or not of the ripple outside the nominal contour.

4.2. Kitagawa-Type Diagram

Once the defect size is assessed for each failure, the Kitagawa diagram can be plotted (Figure 10) with the fatigue limit as a function of the defect size. The curves are given for machined samples extracted from a previous study on the same material [14]. Experimental points correspond to fatigue limit obtained, according to Equation (2). One has to notice that this Kitagawa diagram contains less experimental points than the S-N curves as only XY and Z specimen are considered here.
The experimental points are labeled from 1 to 5 for T6 material and 6 to 10 for non-T6.
A large scatter is noticed for the case of the non-T6 material, with a defect size around 250 µm. Two Z specimens exhibit highly different fatigue limits, while for two other specimens the results are in agreement with those obtained on machined surfaces, even though point number 10 is difficult to place on the graph because of the uncertainty in the surrounding of the defect. Regarding the fracture surface, one can observe that fatigue cracks initiate on surface particles, even in the presence of ripples.
In the case of the T6 material, the results obtained with XY samples match with the tendency curve established for machined samples, while Z-specimens exhibit quite surprising results in that sense that their fatigue strength is superior to the one of machined samples. These unexpected results could be explained by a probable refining of sub-surface grain resulting from the production with extremely low energy density, as presented in Table 1. In fact, this extremely low energy implies higher solidification rates, and thus finer grains that contribute to improve the fatigue strength. The possible contribution of residual stresses should also be considered. Therefore, even if the analysis is enriched by the quantitative assessment of the defect size, in the case of as-built surfaces, one can consider that the sole a r e a parameter is not sufficient to uncouple the influence of defects from the other parameters such as the building direction or the T6 heat treatment. The local microstructure, the multiple initiation sites and the residual stresses are probably additional important parameters that need to be taken into account in a more comprehensive approach. As explained in a previous section, the roughness is measured for each as-built sample. A possible correlation between the values of the fatigue limit with the roughness parameter Rv has been investigated without success, probably due to the fact that Rv varies from 60 to 90 µm, which is quite a small range.
In order to receive further insights into the impact of defects characterised by the a r e a parameter in the presence of an as-built surface, an artificial defect was introduced in six Z specimens (three with T6 and three without) by electro discharge manufacturing (EDM) with three wire diameters: 400 µm, 250 µm and 150 µm. The EDM process parameters were monitored to achieve hemi-spherical defects with a target value of the a r e a parameter of 400 µm, 250 µm and 100 µm. As observed in Table 4, some artificial defects are not quantified. In fact, this was impossible because the wire deep monitoring is not enough to dig the sample because of high roughness.
As listed in Table 4, fatigue tests of both T6 and non T6 materials reveal failures on ALM process-inherited defects, despite the presence of artificial defects with at least the same size or even larger. On the one hand, for T6 specimens, a case of failure initiating on a natural defect of 290 µm in size is noticed despite the presence of an artificial defect of 370 µm. On the other hand, the non-T6 specimens exhibit a case of failure on a natural defect in presence of an artificial defect of the same size. This confirms that the a r e a parameter has to be used with extreme care when analysing the data obtained in the presence of as-built surface roughness. Fracture surfaces of as-built broken specimens are presented in Figure 11. One can notice that contrary to the artificial defects in Figure 11a,e, with quite a regular or homogeneous shape, natural defects are more tortuous.
Figure 12 is restricted to the analysis of Z specimens. The results of machined samples correspond to a previous study [14], supporting the use of the a r e a parameter to analyse the effect of a single defect and to quantify the effect of a microstructure modification due to T6 heat treatment when the surface is regular. For as-built samples, the fatigue strength is particularly low when the specimen contains an artificial defect; one can also remark on some extremely low points for the T6 material. As previously mentioned, the vertical placement of points is certainly inaccurate due to the overestimation of the load-bearing section, but with only 3% underestimation. For the horizontal placement, the meaning of the error bar has been previously explained by the quantification of defects in presence of the surface ripples.
Let us now analyse the points labelled with (a) to (f). Specimens (a), (b) and (c) are not heat-treated, contrary to (d), (e) and (f) samples. Fracture surface analysis make it possible to confidentially quantify the defect size for all specimens. For specimen (d), for example, failure is due to the presence of a 290 µm defect inherited from the process, regardless of the prior introduction of an artificial 370 µm defect with a spherical shape. Similarly, for specimen (b), in the presence of both artificial and process-inherited defects with the same size, the fracture surface analysis indicates a failure initiating from a natural defect. This confirms that the a r e a size parameter is not the first order parameter controlling the fatigue limit of as-built surfaces. However, the failure of specimen (a) compared with (d) probably illustrates a competition between defect size and type, with or without prior T6 heat treatment.

5. Conclusions

This study is dedicated to the characterisation and analysis of the fatigue strength of as-built and grounded surfaces in an ALM AlSi10Mg alloy. Tests were conducted under tension loading with a load ratio R = −1, leading to fatigue lives ranging from 100,000 to 1,000,000 cycles to failure. From the experimental results associated with fracture surface analysis of each sample tested we can make the following conclusions:
-
The influence of ground surfaces, related to the removal of supports, is similar to the one of as-built surfaces on fatigue life.
-
T6 treatment improves the fatigue properties for as-built surfaces, similarly to the results obtained on machined surfaces.
-
The orientation of the sample has an effect on the fatigue strength for both as-built and machined material, with the Z orientation exhibiting a superior resistance to the 45°, which in turn is superior to XY.
-
As long as the present data are concerned, it is not possible to correlate the fatigue limit of the as-built material with the roughness of the as-built surface.
-
When initiation is due to an isolated defect close to the as-built surface, it was not possible to account for the result by using Kitagawa diagrams established on machined samples. This result suggests that microstructure, residual stresses, or multiple initiation sites should be further analysed to receive a comprehensive description of fatigue failure in ALM parts.

Author Contributions

Conceptualization, all authors; writing—original draft preparation, J.N.D.N.; writing—review and editing, all authors; funding acquisition, L.R. All authors have read and agreed to the published version of the manuscript.

Funding

This research was funded by SAFRAN group.

Institutional Review Board Statement

Not applicable.

Informed Consent Statement

Not applicable.

Data Availability Statement

Not applicable.

Acknowledgments

The authors gratefully acknowledge Smith Ndongla for his precious comments and reviews in this article. The authors thankfully appreciate funding provided by Safran (ex-Zodiac Aerospace) and French National Research and Technology Association (ANRT). This work was supported by the CPER FEDER project of Région Nouvelle Aquitaine.

Conflicts of Interest

The authors declare no conflict of interest.

Abbreviations

D length of the ligament between a subsurface defect and the free surface [µm]
E v energy density involved in powder melting [MJ/mm3]
s diameter of the laser spot [µm]
Hdhatching distance [µm]
Plaser power [W]
N f number of cycles to failure
Rload ratio R = σminmax
Raaverage roughness [µm]
Rvdeepest valley with respect to a neutral line, respectively [µm]
Sscanning speed [mm/s]
a r e a defect size defined as the square root of the area of the defect perpendicular to the direction of the maximum principal stress [µm]
σ D 1 t e fatigue limit at 1 million cycles, under tensile loading and R = −1 [MPa]
σ n applied stress at step to failure n [MPa]
σ n 1 applied stress at step just before to failure n−1 [MPa]
tlayer thickness [µm]

References

  1. Eyers, D.R.; Potter, A.T. Industrial Additive Manufacturing: A manufacturing systems perspective. Comput. Ind. 2017, 92, 208–218. [Google Scholar] [CrossRef]
  2. Romano, S.; Brandão, A.; Gumpinger, J.; Gschweitl, M.; Beretta, S. Qualification of AM parts: Extreme value statistics applied to tomographic measurements. Mater. Des. 2017, 131, 32–48. [Google Scholar] [CrossRef] [Green Version]
  3. Marchesi, T.R.; Lahuerta, R.D.; Emlio, C.; Barari, A.; Wood, I. Topologically Optimized Diesel Engine Support Manufactured Additive Support Manufactured with Additive Manufacturing. IFAC-PapersOnLine 2015, 48, 2333–2338. [Google Scholar] [CrossRef]
  4. Chalvin, M.; Campocasso, S.; Hugel, V.; Baizeau, T. Layer-by-layer generation of optimized joint trajectory for multi-axis robotized additive manufacturing of parts of revolution. Robot. Comput.-Integr. Manuf. 2020, 65, 101960. [Google Scholar] [CrossRef]
  5. Gardan, N.; Schneider, A. Topological optimization of internal patterns and support in additive manufacturing. J. Manuf. Syst. 2015, 37, 417–425. [Google Scholar] [CrossRef]
  6. Olakanmi, E.O.; Cochrane, R.F.; Dalgarno, K.W. A review on selective laser sintering/melting (SLS/SLM) of aluminium alloy powders: Processing, microstructure, and properties. Prog. Mater. Sci. 2015, 74, 401–477. [Google Scholar] [CrossRef]
  7. Seifi, M.; Dahar, M.; Aman, R.; Harrysson, O.; Beuth, J.; Lewandowski, J.J. Correction to: Evaluation of Orientation Dependence of Fracture Toughness and Fatigue Crack Propagation Behavior of As-Deposited ARCAM EBM Ti-6Al-4V. Jom 2015, 67, 597–607. [Google Scholar] [CrossRef]
  8. Thijs, L.; Kempen, K.; Kruth, J.-P.; van Humbeeck, J. Fine-structured aluminium products with controllable texture by selective laser melting of pre-alloyed AlSi10Mg powder. Acta Mater. 2013, 61, 1809–1819. [Google Scholar] [CrossRef] [Green Version]
  9. Ming, T. Inclusion, porosity, and Fatigue of AlSi10Mg Parts Produced by Selective Laser Melting. Ph.D. Thesis, Canergie Melon University Pittsburg, Pittsburgh, PA, USA, 2017. [Google Scholar]
  10. Fiocchi, J.; Tuissi, A.; Bassani, P.; Biffi, C.A. Low temperature annealing dedicated to AlSi10Mg selective laser melting products. J. Alloy. Compd. 2017, 695, 3402–3409. [Google Scholar] [CrossRef]
  11. Kang, N.; Coddet, P.; Ammar, M.R.; Liao, H.; Coddet, C. Characterization of the microstructure of a selective laser melting processed Al-50Si alloy: Effect of heat treatments. Mater. Charact. 2017, 130, 243–249. [Google Scholar] [CrossRef]
  12. Hao, W.; Nadot, Y.; Foley, M.; Ridosz, L.; Proust, G.; Cairney, J.M. Factors that a ff ect the properties of additively-manufactured AlSi10Mg: Porosity versus microstructure. Addit. Manuf. 2019, 29, 100805. [Google Scholar]
  13. Liu, S.; Zhu, H.; Peng, G.; Yin, J.; Zeng, X. Microstructure prediction of selective laser melting AlSi10Mg using finite element analysis. Mater. Des. 2018, 142, 319–328. [Google Scholar] [CrossRef]
  14. Ngnekou, J.N.D.; Nadot, Y.; Henaff, G.; Nicolai, J.; Kan, W.H.; Cairney, J.; Ridosz, L. Fatigue properties of AlSi10Mg produced by Additive Layer Manufacturing. Int. J. Fatigue 2018, 119, 160–172. [Google Scholar] [CrossRef]
  15. Tradowsky, U.; White, J.; Ward, R.M.; Read, N.; Reimers, W.; Attallah, M.M. Selective laser melting of AlSi10Mg: Influence of post-processing on the microstructural and tensile properties development. Mater. Des. 2016, 105, 212–222. [Google Scholar] [CrossRef] [Green Version]
  16. Fousová, M.; Dvorský, D.; Michalcová, A.; Vojtěch, D. Changes in the microstructure and mechanical properties of additively manufactured AlSi10Mg alloy after exposure to elevated temperatures. Mater. Charact. 2018, 137, 119–126. [Google Scholar] [CrossRef]
  17. Bagherifard, S.; Beretta, N.; Monti, S.; Riccio, M.; Bandini, M.; Guagliano, M. On the fatigue strength enhancement of additive manufactured AlSi10Mg parts by mechanical and thermal post-processing. Mater. Des. 2018, 145, 28–41. [Google Scholar] [CrossRef]
  18. Takata, N.; Kodaira, H.; Sekizawa, K.; Suzuki, A.; Kobashi, M. Change in microstructure of selectively laser melted AlSi10Mg alloy with heat treatments. Mater. Sci. Eng. A 2017, 704, 218–228. [Google Scholar] [CrossRef]
  19. Kempen, K.; Thijs, L.; Van Humbeeck, J.; Kruth, J.-P. Mechanical Properties of AlSi10Mg Produced by Selective Laser Melting. Phys. Procedia 2012, 39, 439–446. [Google Scholar] [CrossRef] [Green Version]
  20. Laurençon, M.; de Rességuier, T.; Loison, D.; Baillargeat, J.; Ngnekou, J.N.D.; Nadot, Y. Materials Science & Engineering A effects of additive manufacturing on the dynamic response of AlSi10Mg to laser shock loading. Mater. Sci. Eng. A 2019, 748, 407–417. [Google Scholar]
  21. Maskery, I.; Aboulkhair, N.T.; Tuck, C.; Wildman, R.D.; Ashcroft, I.A.; Everitt, N.M.; Hague, R.J.M. Fatigue performance enhancement of selectively laser melted aluminium alloy by heat treatment. In Proceedings of the 26th Annual International Solid Freeform Fabrication Symposium, Austin, TX, USA, 10–12 August 2015; pp. 1017–1025. [Google Scholar]
  22. Aboulkhair, N.T.; Maskery, I.; Tuck, C.; Ashcroft, I.; Everitt, N. Improving the fatigue behaviour of a selectively laser melted aluminium alloy: Influence of heat treatment and surface quality. Mater. Des. 2016, 104, 174–182. [Google Scholar] [CrossRef]
  23. Ngnekou, J.N.D.; Henaff, G.; Nadot, Y.; Nicolai, J.; Ridosz, L. Fatigue resistance of selectively laser melted aluminum alloy under T6 heat treatment. Procedia Eng. 2018, 213, 79–88. [Google Scholar] [CrossRef]
  24. Brandl, E.; Heckenberger, U.; Holzinger, V.; Buchbinder, D. Additive manufactured AlSi10Mg samples using Selective Laser Melting (SLM): Microstructure, high cycle fatigue, and fracture behavior. Mater. Des. 2012, 34, 159–169. [Google Scholar] [CrossRef]
  25. Romano, S.; Brückner-Foit, A.; Brandão, A.; Gumpinger, J.; Ghidini, T.; Beretta, S. Fatigue properties of AlSi10Mg obtained by additive manufacturing: Defect-based modelling and prediction of fatigue strength. Eng. Fract. Mech. 2017, 187, 165–189. [Google Scholar] [CrossRef]
  26. Beretta, S.; Romano, S. A comparison of fatigue strength sensitivity to defects for materials manufactured by AM or traditional processes. Int. J. Fatigue 2017, 94, 178–191. [Google Scholar] [CrossRef]
  27. Gianni, N. Influence of rough as-built surfaces on smooth and notched fatigue behavior of L-PBF AlSi10Mg. Addit. Manuf. 2020, 34, 101251. [Google Scholar]
  28. Yang, K.V.; Rometsch, P.; Jarvis, T.; Rao, J.; Cao, S.; Davies, C.; Wu, X. Porosity formation mechanisms and fatigue response in Al-Si-Mg alloys made by selective laser melting. Mater. Sci. Eng. A 2018, 712, 166–174. [Google Scholar] [CrossRef]
  29. Houria, M.I.; Nadot, Y.; Fathallah, R.; Roy, M.; Maijer, D.M. Influence of casting defect and SDAS on the multiaxial fatigue behaviour of A356-T6 alloy including mean stress effect. Int. J. Fatigue 2015, 80, 90–102. [Google Scholar] [CrossRef]
  30. Rotella, A.; Nadot, Y.; Piellard, M.; Augustin, R. Influence of natural defects on the fatigue limit of a cast Al-Si alloy. Procedia Struct. Integr. 2017, 7, 513–520. [Google Scholar] [CrossRef]
  31. Roy, M.; Nadot, Y.; Nadot-Martin, C.; Bardin, P.-G.; Maijer, D. Multiaxial Kitagawa analysis of A356-T6. Int. J. Fatigue 2011, 33, 823–832. [Google Scholar] [CrossRef] [Green Version]
  32. Maxwell, D.C.; Nicholas, T. A rapid method for generation of a Haigh diagram for high cycle fatigue. In Fatigue and Fracture Mechanics; Panontin, T.L., Sheppard, S.D., Eds.; ASTM STP 1332; ASTM International: West Conshohocken, PA, USA, 1999; pp. 626–641. [Google Scholar]
  33. Nadot, Y.; Mendez, J.; Ranganathan, N. Influence of casting defects on the fatigue limit of nodular cast iron. Int. J. Fatigue 2004, 26, 311–319. [Google Scholar] [CrossRef]
  34. Murakami, Y.; Endo, M. Effects of defects, inclusions and inhomogeneities on fatigue strength. Int. J. Fatigue 1994, 16, 163–182. [Google Scholar] [CrossRef]
Figure 1. (a) Position and orientation of fatigue samples on the building platform showing the building supports (in blue), (b) fatigue test specimen. Units in mm.
Metals 11 01432 g001
Figure 2. (a) Raw sample extracted from the platform, (b) fatigue sample after support removal and before thread machining.
Metals 11 01432 g002
Figure 3. Contour scanning strategy, (a) XY sample, (b) Alpha45 sample, (c) Z sample.
Metals 11 01432 g003
Figure 4. Influence of support grinding on fatigue life (AB: As-built surface); 106: run-out samples.
Metals 11 01432 g004
Figure 5. Influence of as-built surfaces and building direction; T6 heat treated material (AB: As-Built; MA: machined [14]); 106: run-out samples.
Metals 11 01432 g005
Figure 6. Influence of as-built surfaces and building direction, non-T6 material, comparison with machined [14]; 106: run-out samples.
Metals 11 01432 g006
Figure 7. SEM observations (a) Z sample, as-built surface roughness and lack-of-fusion-type defect, σmax = 80 MPa, Nf = 330,000 cycles, (b) Z sample, lack-of-fusion-type defect, 90 MPa, 180,000 cycles, (c) XY sample, as-built surface roughness, 80 MPa, 275,000 cycles and (d) alpha45, sub-surface surface defect, 90 MPa, 90,000 cycles.
Metals 11 01432 g007
Figure 8. SEM observations of initiation sites (a) Z sample, surface ripple and lack-of-fusion-type defect, 100 MPa, 800,000 cycles, (b) Z sample, lack-of-fusion-type defect, 110 MPa, 300,000 cycles, (c) XY sample, surface ripple, 90,MPa, 135,000 cycles and (d) alpha45, lack-of fusion-type defect, 100 MPa, 1 million cycles.
Metals 11 01432 g008
Figure 9. (a) Estimation of the defect size depending on its location relative to the free surface, (b,c) quantification of defect size on fracture surfaces of AB-Z-T6, (b) 110 MPa, 300,000 cycles and (c) 100 MPa, 800,000 cycles.
Metals 11 01432 g009
Figure 10. Kitagawa-type diagram showing the impact of defect size of the fatigue limit for as-built material and two building directions, XY and Z, in comparison with machined [14].
Metals 11 01432 g010
Figure 11. Data presented on Table 4. SEM observations of initiation sites for AB-Z (ac) and AB-Z-T6 (df) specimen. For non-T6 cases: (a) direct rupture at 30 MPa after 800,000 cycles, (b,c) fatigue limit at 1 million cycles of 60 and 53 MPa, respectively. For T6 cases: fatigue limits at 1 million cycles of 37 MPa, 59MPa and 71 MPa, respectively, for (df).
Metals 11 01432 g011
Figure 12. Kitagawa-type diagram showing the impact of defect size and morphology on the fatigue limit of as-built surfaces compared with machined samples in the Z building direction.
Metals 11 01432 g012
Table 1. Process parameters related to the building strategy and evaluation of the energy density (contour performed in two passes: set 1 and set 2).
Process ParametersInteriorContours
Upskin Set 1Upskin Set 2Down-Skin Set 1Down-Skin Set 2Standard Set 1Standard Set 2
P (W)370808560708085
s 80
S (mm/s)1300900900500400900900
Hd (µm)19020
t (µm)30303030303030
Ev (MJ/mm3)119373950733739
Table 2. T6 heat-treatment conditions.
StepsTemperature (°C)Duration (h)Environment
Solid solution5408Air
Quenching20-Water
Tempering 12024Air
Tempering 2
Cooling to room temperature
16010Air
Table 3. Surface roughness measurements (3 measurements per sample).
Type of SurfaceOrientationRa (µm)Rv,max (µm)
Machined surface XY, Z, Alpha450.7 to 1.22 to 4
As-built surface
Metals 11 01432 i001
Z1980
XY, side2580
XY, top1660
alpha45, upskin2290
Alpha45, downskin2282
Table 4. Fatigue limits obtained on AB-Z with and without T6 heat treatment, containing different size of artificial defects.
Heat Treatment σ D t e 1 ( 1 ^ 6   c y c l e s )   ( in   MPa ) Critical Defect Size in µm and Type (Natural or Artificial)Artificial Defect (Size in µm)
T637290 µm, Natural~370
59196 µm, Artificial196
71322 µm, NaturalNot quantified
No T6<30367 µm, Artificial 367
60198 µm, Natural~200
53247 µm, NaturalNot quantified
Publisher’s Note: MDPI stays neutral with regard to jurisdictional claims in published maps and institutional affiliations.

