Article

Effect of Ni Doping on the Embrittlement of Liquid Zinc at Σ5 Fe Austenite Grain Boundary

1
School of Materials Science and Engineering & State Key Laboratory of Advanced Special Steel & Shanghai Key Laboratory of Advanced Ferrometallurgy, Shanghai University, Shanghai 200072, China
2
School of Materials Science and Engineering, Shanghai Dianji University, Shanghai 201306, China
3
Shougang Research Institute of Technology, Shougang Group Co., Ltd., Beijing 100043, China
*
Authors to whom correspondence should be addressed.
Metals 2022, 12(1), 27; https://doi.org/10.3390/met12010027
Submission received: 10 November 2021 / Revised: 9 December 2021 / Accepted: 16 December 2021 / Published: 23 December 2021
(This article belongs to the Section Computation and Simulation on Metals)

Abstract

:
In this study, first-principles computational tensile tests have been performed for the Σ5 symmetrically tilted grain boundaries of the face-centered cubic (fcc) Fe to investigate the effects of Zn and Zn-Ni doping on the boundary energy and electronic structure. The obtained results indicate that the mismatch between the sizes of Zn and Fe atoms at the Zn-doped grain boundary causes its expansion, which increases the lengths of Fe-Fe bonds, leading to their weakening, and reduces the overall boundary strength. After the Zn doping of the Fe grain boundary, Zn atoms form covalent bonds with Fe atoms, that decreases the charge density of Fe-Fe bonds and their strength. Meanwhile, the strength of the newly formed Fe-Zn covalent bonds oriented at a certain angle with respect to the grain boundary direction is very low. The breakage of Fe-Fe bonds that occurs under tensile loading rapidly decreases the boundary strength. Finally, after the Zn-Ni co-doping of the Fe grain boundary, Ni atoms form metallic bonds with Fe atoms, thus increasing both the charge density of Fe-Fe bonds (as compared with that of the Fe-Fe bonds at the Zn-doped grain boundary).

1. Introduction

High-strength steel can be effectively manufactured by hot forming technology, which prevents its oxidation and decarburization during production and significantly increases the corrosion resistance. However, the macro and micro cracks formed in the high-strength steel structure due to the low melting point of zinc-based coatings and liquid zinc-induced embrittlement considerably limit the applications of hot forming processes [1,2,3,4].
By optimizing the austenite processing or forming conditions, it is possible to avoid the occurrence of matrix cracking [5,6,7,8]. Although many researchers examined the related experimental parameters, they have not investigated the effect produced by the liquid metal-induced brittleness on a microscopic scale, which can be achieved by performing first-principles calculations. Bauer et al. [9] established Σ3 [110] 60° and Σ5 [100] 36.8° symmetrically tilted grain boundary (GB) models of the body-centered cubic (bcc) Fe structure to evaluate the changes in the grain boundary and surface energies before and after zinc doping. Furthermore, two thermodynamic models (the Rice-Wang and Griffith models) were developed to estimate the energy of the grain boundary embrittlement caused by doping the bcc Fe structure with Zn atoms.
In addition to the energy characterizations of the embrittlement and strengthening effects produced by the presence of impurities at grain boundaries, first-principles tensile test of the grain boundaries doped with impurities were performed to study the influences of the chemical bonds and electronic structures of these impurities on the boundary properties [10,11,12,13]. Thus, Yuasa et al. [14,15] used first-principles stretching methods to identify the causes of the brittle fracture of a Σ3 (111) grain boundary in the bcc Fe lattice doped with P and Cu elements. They found that the tensile strength and elongation of this boundary decreased after doping, indicating significant deterioration of its mechanical characteristics. Miyazawa et al. [10] conducted first-principles fully relaxed tensile tests that were performed on a C-segregated Fe Σ3 (111)/[1 1 ¯ 0] symmetrical tilt grain boundary to investigate the breaking behaviour of C-Fe bonds during tensile straining. The results revealed that the C-Fe bonds showed a high bond mobility.
To determine the effect of austenite grain boundaries on the diffusion of zinc atoms, these boundaries were examined in detail. According to the results of previous studies, the original austenitized grain boundaries can be reconstructed from electron backscatter diffraction (EBSD) data by two methods, including a complex algorithm of Nyyssönen et al. [16] and a simpler method developed by Hutchinson et al. [17] In the second method, the grain boundaries of the martensite structure after the phase transformation contain low-angle grain boundaries (LABs) or 50–63° grain boundary [18]. Before the martensite phase transformation that occurs during the cooling cycle of a welding process, the liquid metal-induced embrittlement (LMIE) cracks propagate along the high-angle grain boundaries (HABs) of the original austenite structure and not along martensitic grain boundaries. However, after the martensite formation, LMIE cracks tend to propagate along the martensitic grain boundaries because of the stress concentration at the crack tip [19].
Twinning-induced plasticity steel contains a large number of twins with the Σ3 (60° [111]) orientational relationship [20,21]. Zinc diffusion through cracks occurs only at HABs, and cracks are not formed at LABs. In addition, the statistical results of the grain orientation difference of zinc penetrating the original grain boundary also show that 60° is the main crack location. Therefore, it can be hypothesized that Σ3 HABs play an important role in the diffusion of zinc atoms along the grain boundary [22].
The mechanism of the liquid zinc-induced embrittlement in steels has not been elucidated yet. The obtained experimental data suggested that the developed fracture model was applicable only to the cracking of the ferrite phase formed by the presence of Zn atoms near the austenite grain boundaries [23,24,25]. However, multiple theoretical studies on the cracking of ferrite grain boundaries have been conducted by first-principles calculations. Peng et al. [26] used the first-principles computational tensile test (FPCTT) to study the liquid-zinc-induced embrittlement in the Σ5 [100] 36.8° symmetric tilt grain boundary (STGB) of bcc Fe. The result reveals that the strength and ductility of the grain boundary (GB) decrease after zinc doping. In addition, the effect of zinc on the chemical bond and electronic structure of the GB is investigated. However, Peng et al. [26] only considers the infiltration process of liquid zinc at the ferrite grain boundary, and in fact, austenite grain boundary also plays an important role in grain boundary embrittlement. Bhattacharya et al. [27] reported that twinning-induced plasticity (TWIP) steels, having an austenitic microstructure, exhibit greater LMIE susceptibility compared to TRIP-assisted bainitic ferrite (TBF) or ferrite-martensite dual phase (DP) steels. Cho et al. [28] analyzed the microstructure of the intergranular liquid-metal-induced cracks and proposed a new model for crack formation. Intergranular cracking is due to the grain boundary penetration of a liquid Zn alloy phase along a crack tip propagating on prior austenite grain boundaries weakened by the Zn diffusion-mitigated phase transformation to ferrite. Kang et al. [29] believed that during high temperature processing of austenitic TWIP steel, As a result of Zn accumulation in the grain boundary, Zn content exceeds the maximum solubility limit in austenite. Over the maximum solubility limit, liquid-Zn starts to form along the austenite grain boundaries. Afterwards, as a consequence of liquid-Zn film presence along grain boundaries, the metallic bond weakening takes place, and subsequently, the initial LMIE crack opens up. Thus, the importance of austenite grain boundary in the embrittlement induced by liquid zinc is obvious. However, there are few studies on the embrittlement of austenite grain boundaries induced by liquid zinc.
Therefore, in this study, first-principles computational tensile tests were performed on Zn-embrittled austenite grain boundaries. Using the Σ5 [001] (210) 53.6° face-centered cubic (fcc) Fe symmetrically tilted grain boundary model and the corresponding doped grain boundary models, the effects produced by introducing Zn and Zn-Ni elements were analyzed. In particular, the changes in the atomic and electronic structures caused by grain boundary doping were determined to elucidate the Zn-assisted embrittlement mechanism and influence of Ni atoms on the grain boundary properties after Zn replacement.

2. Experimental Methods

2.1. Grain Boundary Models

The match between the calculated and experimental results determines the accuracy of a utilized simulation method. Hence, combining theory with experiment can help better explain experimental phenomena. The most important aspect of first-principles calculations is the establishment of a suitable model and selection of calculation parameters. In this section, using the grain boundary characteristics obtained from the literature and by the EBSD scanning of the crack tip region [18,19], an appropriate grain boundary model is established to further explain the brittle fracture induced by liquid zinc.
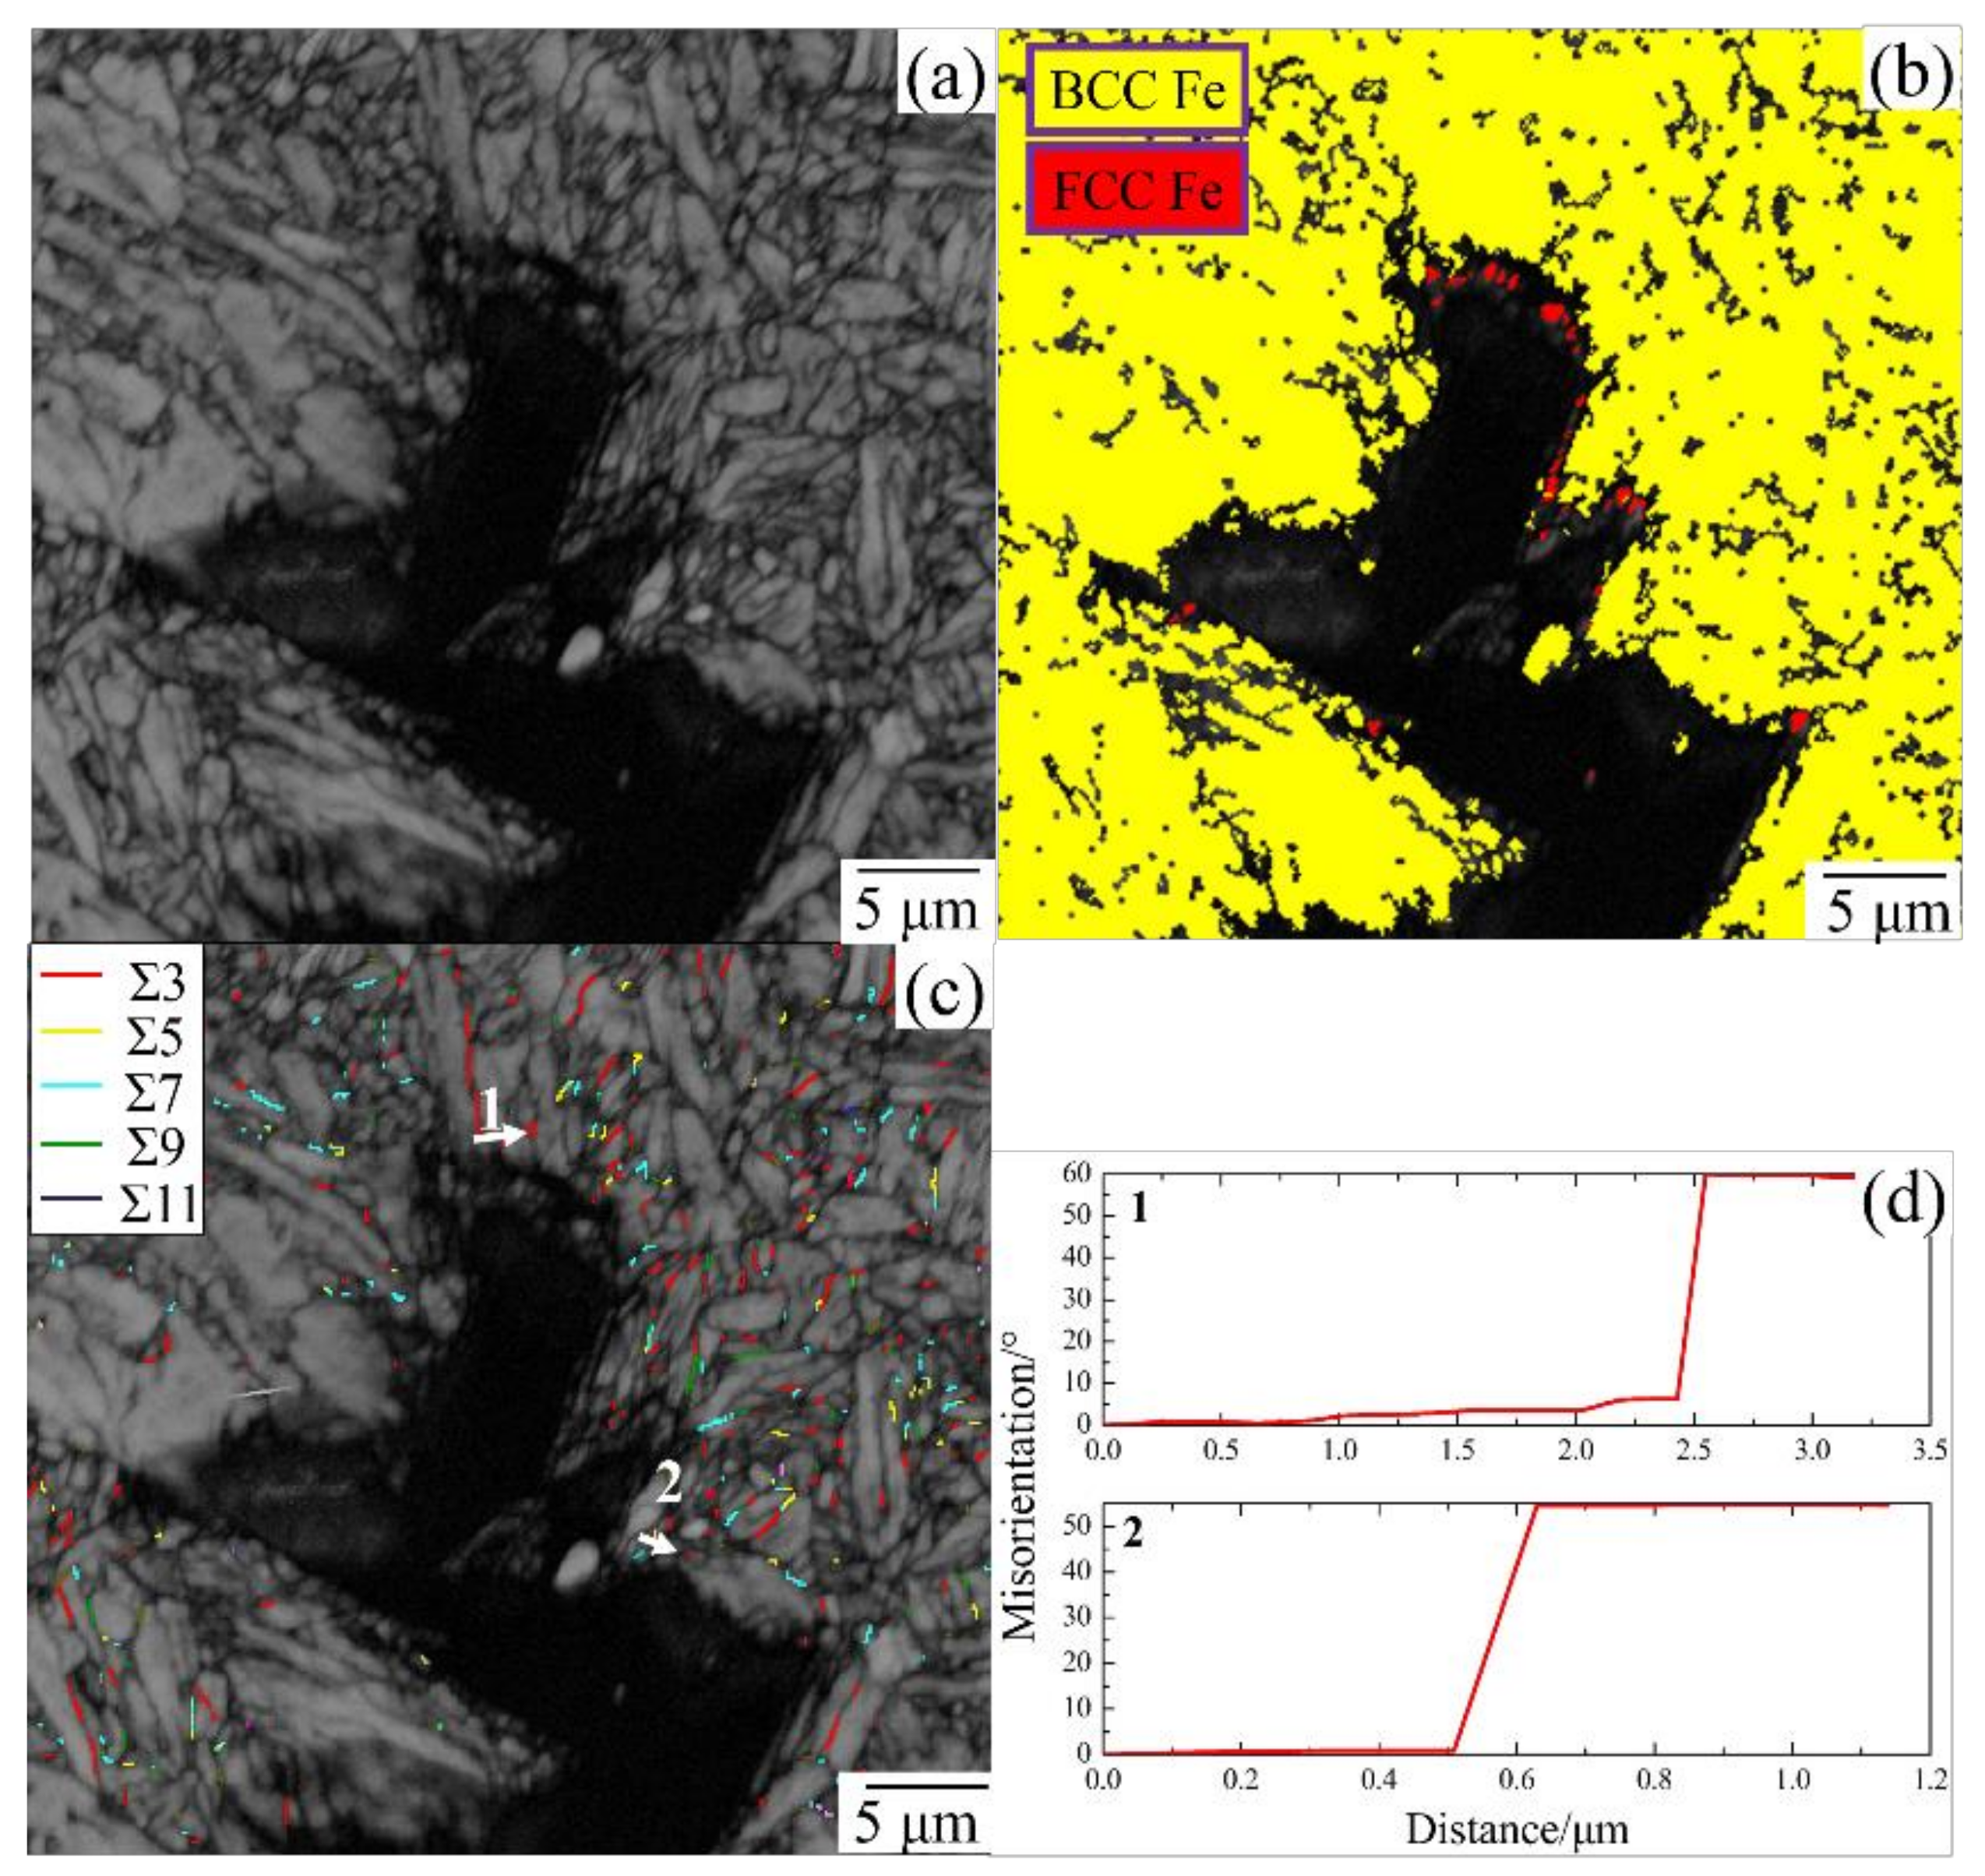
The zinc-based coating hot-formed steel QP1180 was selected and heated to the target temperature of 900 °C at a heating rate of 20 °C· s - 1 in the Gleeble 3500 thermomechanical simulator, and kept for 10 min. Then the strain was performed at a strain rate of 0.5 s−1. After the strain is over, compressed air is used to quench the steel plate at a cooling rate exceeding 50 °C· s - 1 . To determine the Fe grain boundary type near the crack tip, EBSD (Zeiss Gemini SEM 450, Germany) scannings were performed in the vicinity of the side crack on the substrate (see Figure 1). The acceleration voltage of the scanning electron microscope was 25 kV, and the spot size was 5. A hexagonal grid with a step size of 250 nm was used during scanning. The obtained image of the boundary lattice near the crack is shown in Figure 2.
A small amount of the fcc Fe (austenite) phase was detected at the crack tip, and the substrate matrix mainly consisted of the bcc Fe (ferrite) phase. The region near the crack tip mainly included Σ3, Σ5, Σ7, Σ9, and Σ11 boundaries. Some of these boundaries were analyzed to determine their misorientation angles (see positions 1 and 2 in Figure 2 containing Σ3–60° and Σ5–55° grain boundaries, respectively). Because the 55–60° grain boundaries were part of the original austenite structure [18], the studied substrate was austenitic at high temperatures. Therefore, from the obtained EBSD images and literature data [23], the accuracy of the model proposed in this section was verified, and the Σ5 [001] (210) 53.6° fcc Fe symmetrical grain boundary model was established for the subsequent first-principles calculations.

2.2. Calculation Method and Parameter Setting

We performed spin-polarized first-principles calculations using the Vienna Ab-initio Simulation Package (VASP) [24,25,26,30,31]. The generalized gradient approximation (GGA) and PAW-PBE pseudopotential [32,33,34,35] were employed in density-functional theory simulations. The cutoff energy restricting the number of plane waves in the basis set was 500 eV. The total energy tolerance was set to 5 × 10⁻⁶ eV/atom, and the convergence criterion for geometrical optimizations was less than 0.01 eV/Å per atom. Brillouin-zone integration was performed with the Monkhorst-Pack scheme [36,37] using a uniform 3 × 3 × 1 mesh. Spin polarization was considered for the bcc Fe structure because it represented a typical magnetic transitional metal.
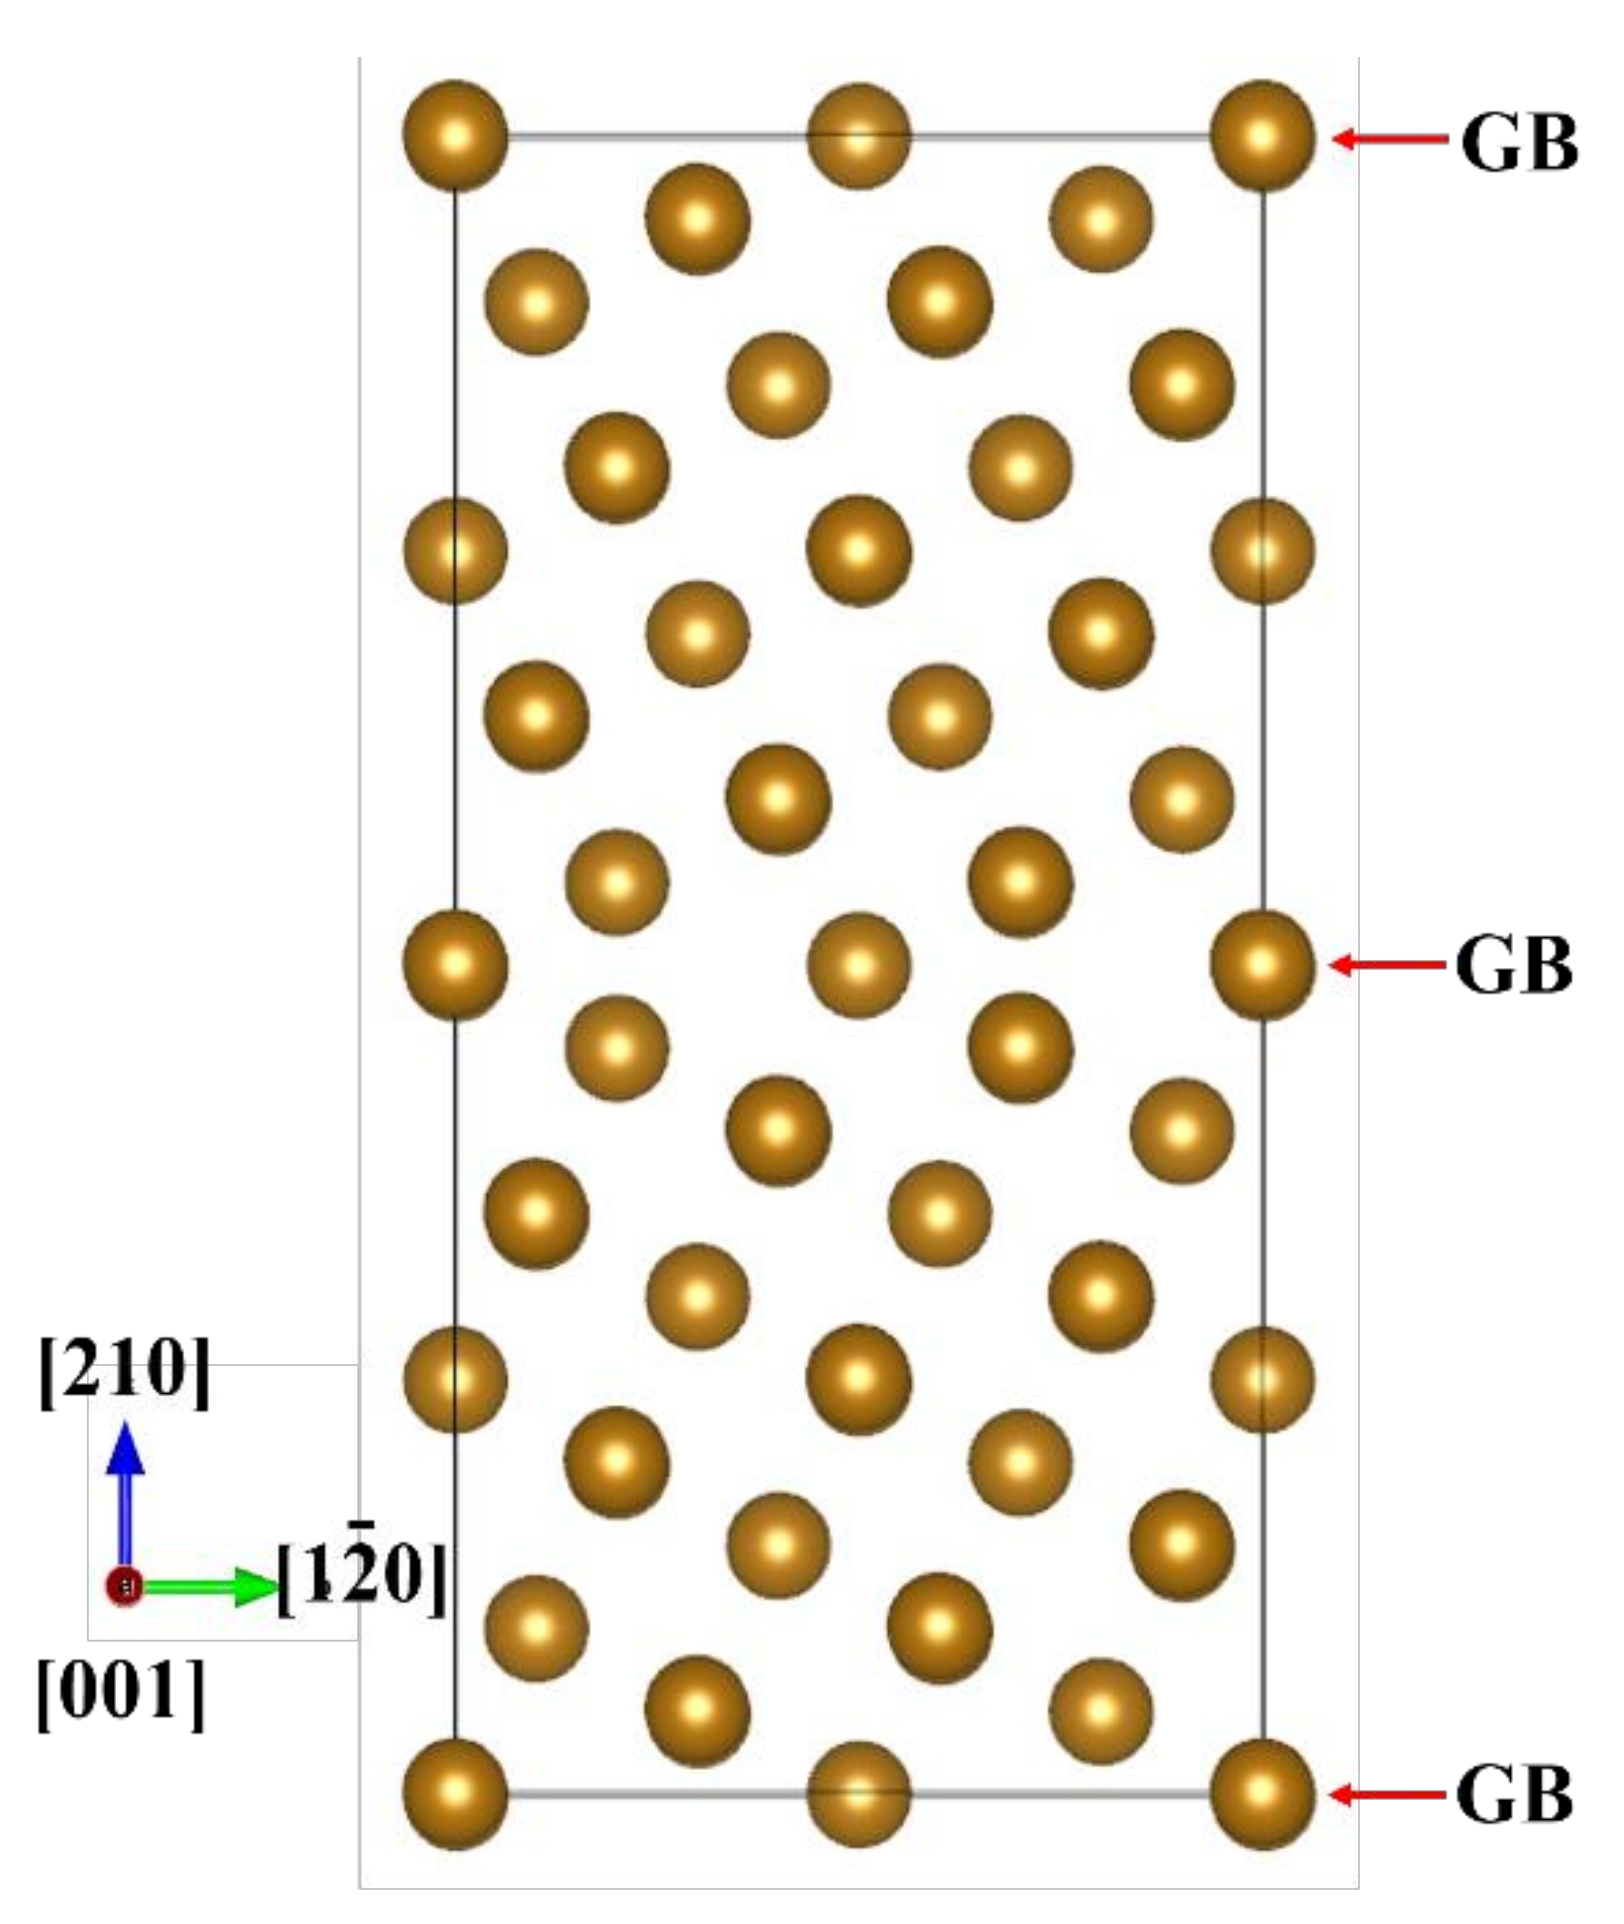
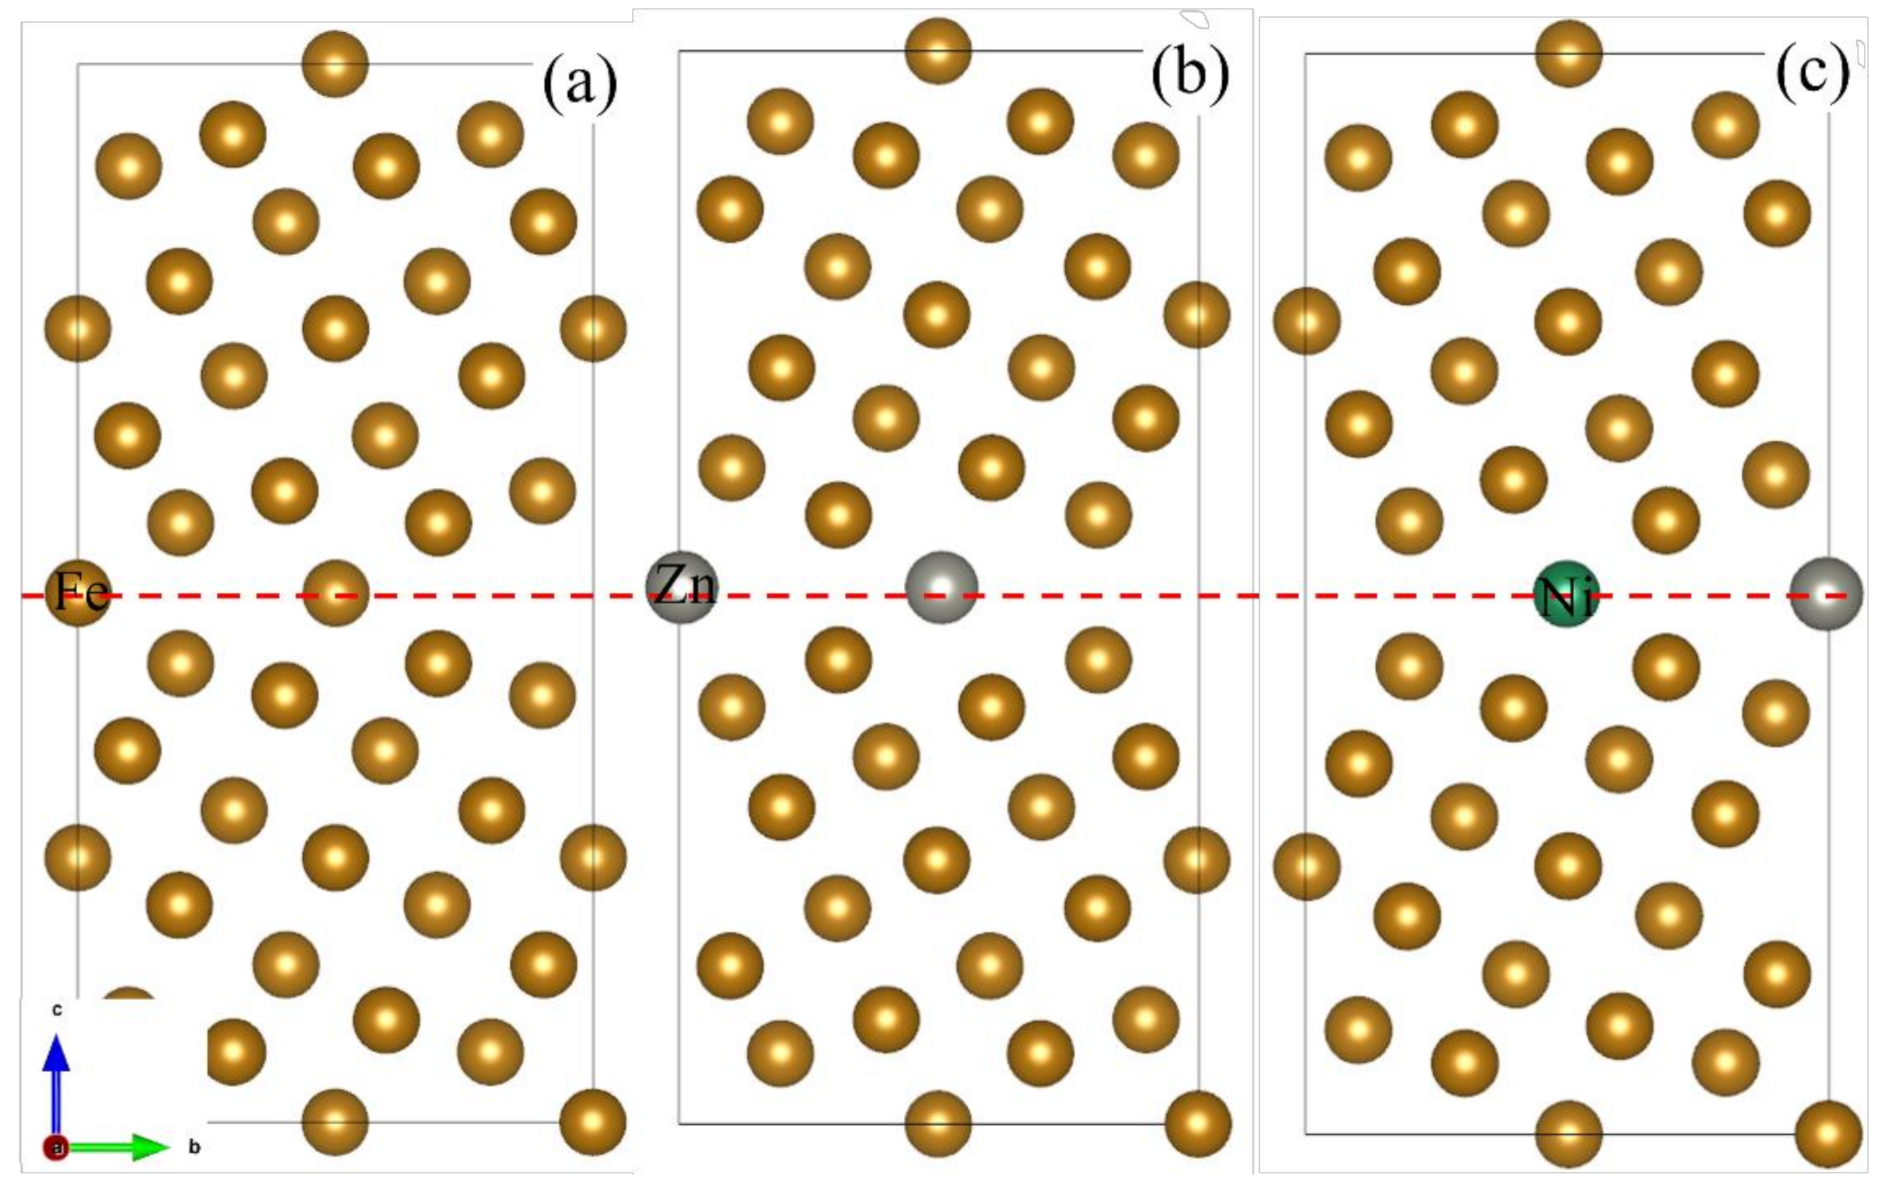
The grain boundary model used in the calculations was established based on the results presented in Figure 3 [24]. In the Zn-Ni co-doped grain boundary model, the Fe atoms in the intermediate layer were replaced with Zn or Ni atoms. The simulated grain boundaries are shown in Figure 4, and their corresponding codes are provided as references below. The utilized grain boundary models were subjected to complete geometric optimizations before simulations. During the grain boundary stretching, ion relaxation was performed after each simulation step. In the constructed models, each grain boundary was composed of two atoms (the middle atom was unique for a particular model, and the four atoms on the edge occupied a quarter). The Ni and Zn atoms in the Zn-Ni co-doped grain boundary model equally accounted for 50% of the grain boundary atoms.
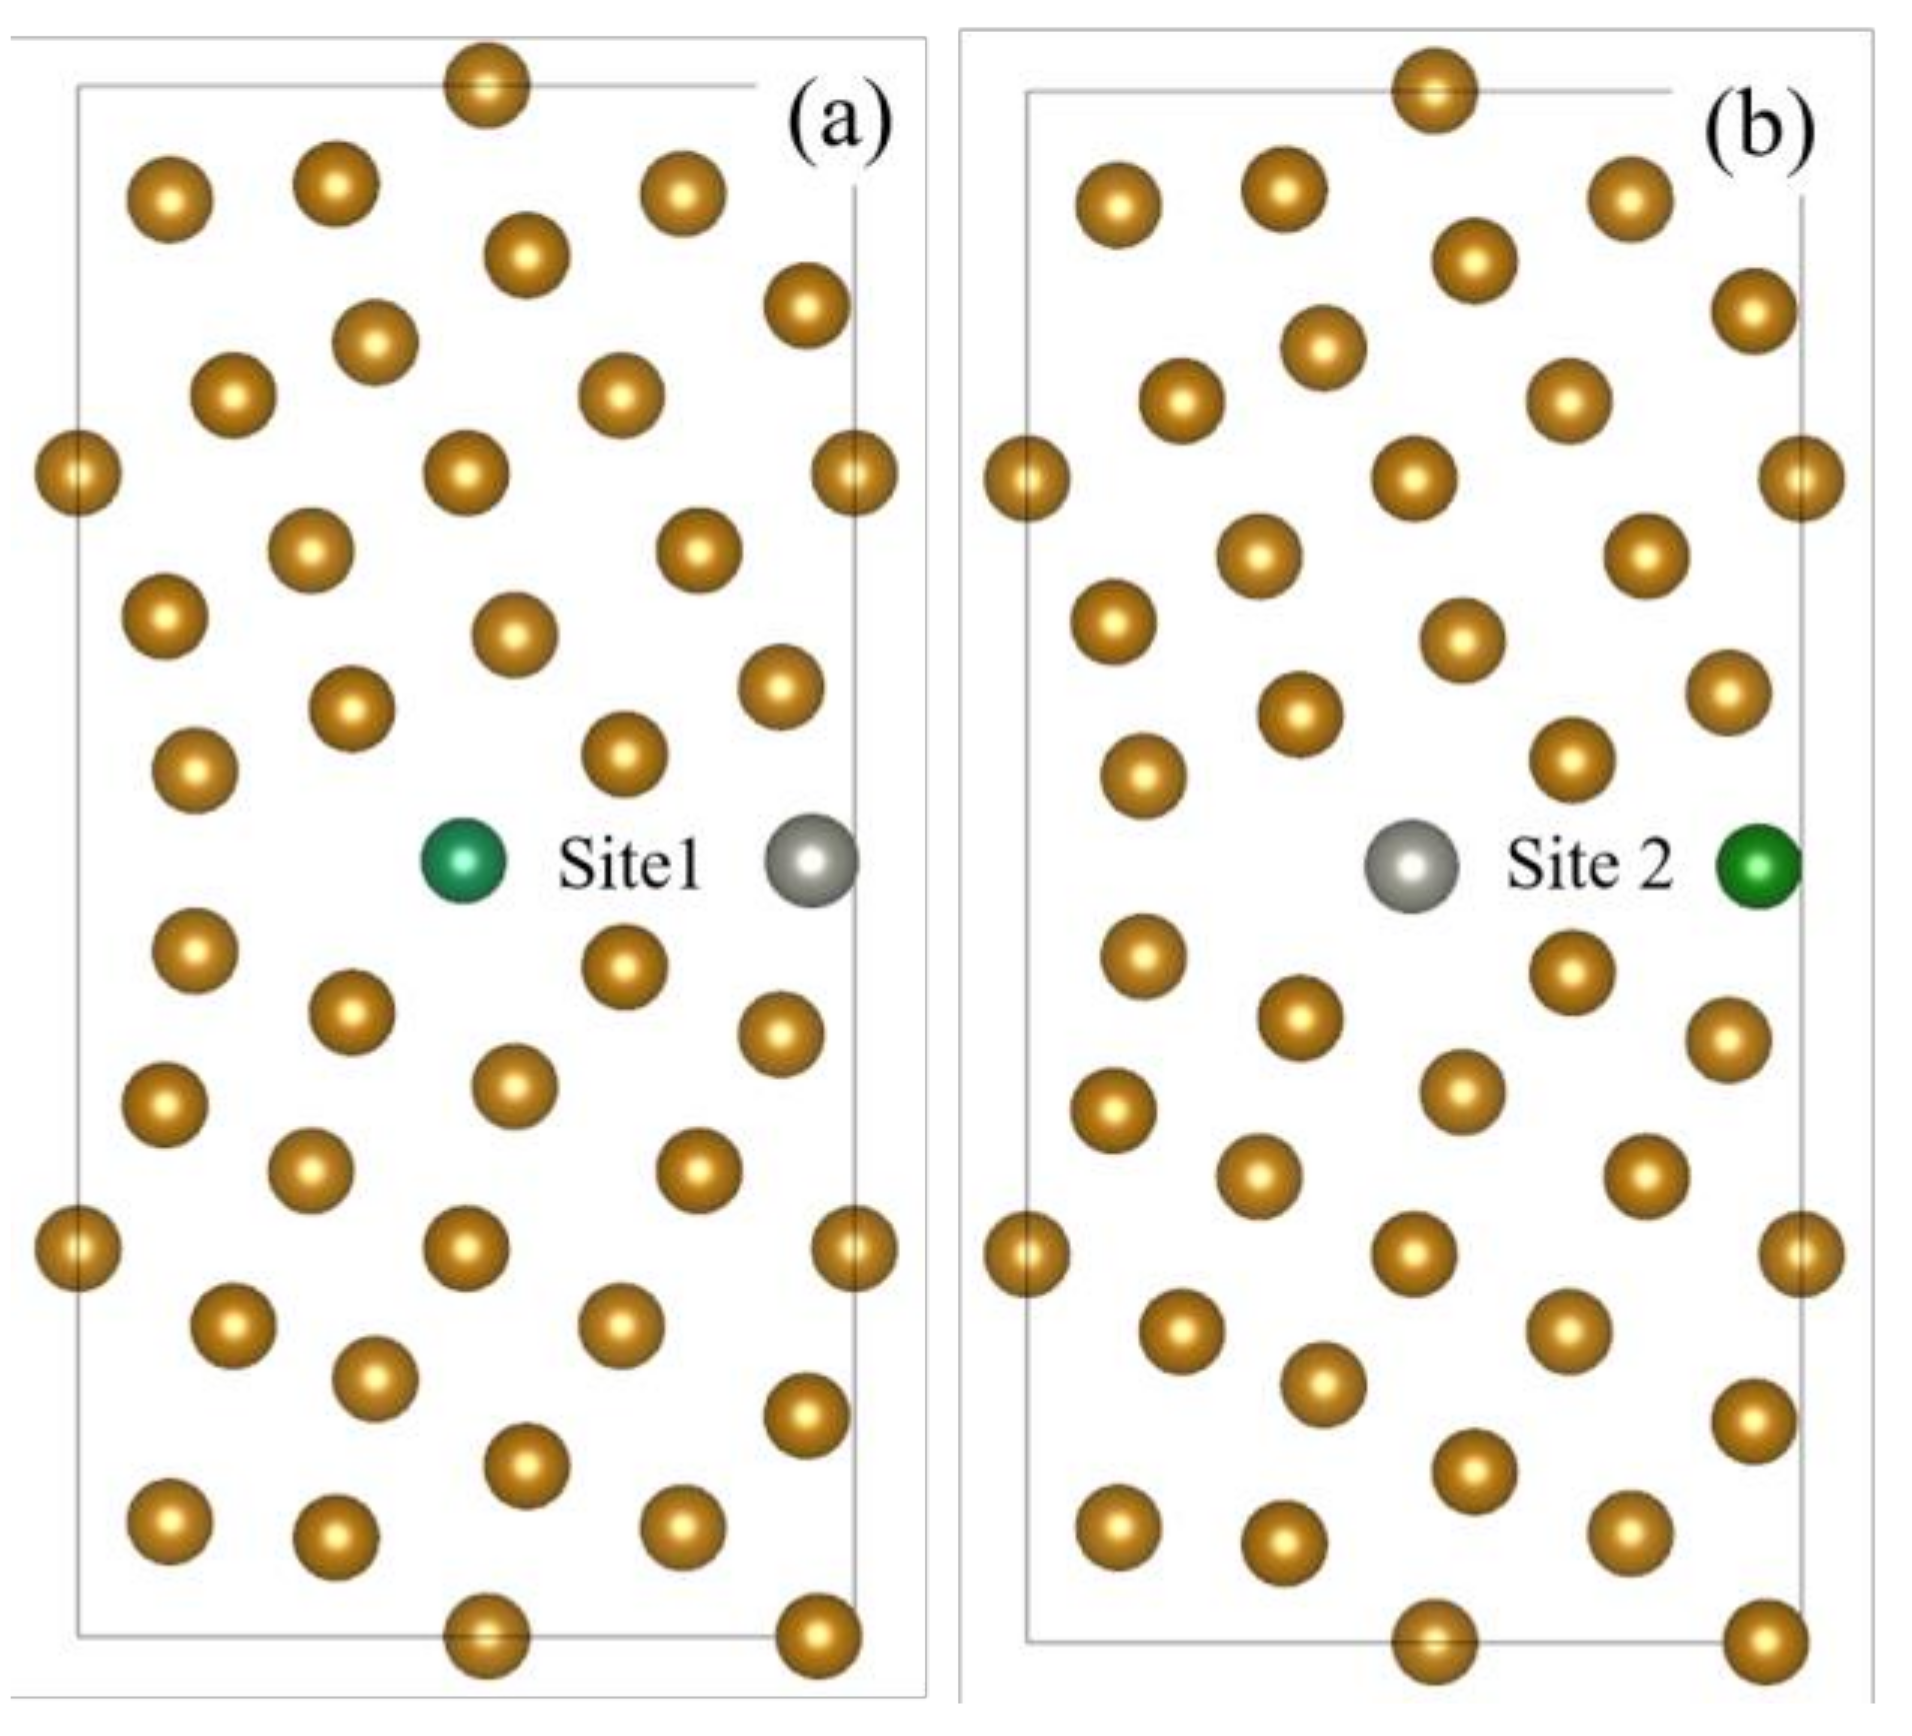
As shown in the Figure 5, by calculating the total free energy of the Ni atom at the center of the grain boundary (Site 1) and on the edge (Site 2) of the grain boundary model, the total free energy of the Ni atom in the center position model and the model on the edge are determined to be −305.129 eV and −305.128 eV, respectively (Table 1). This indicates that the energy of the grain boundary model is lower when the Ni atom is in the central position, which means that the model is more stable.

2.3. Model Optimization

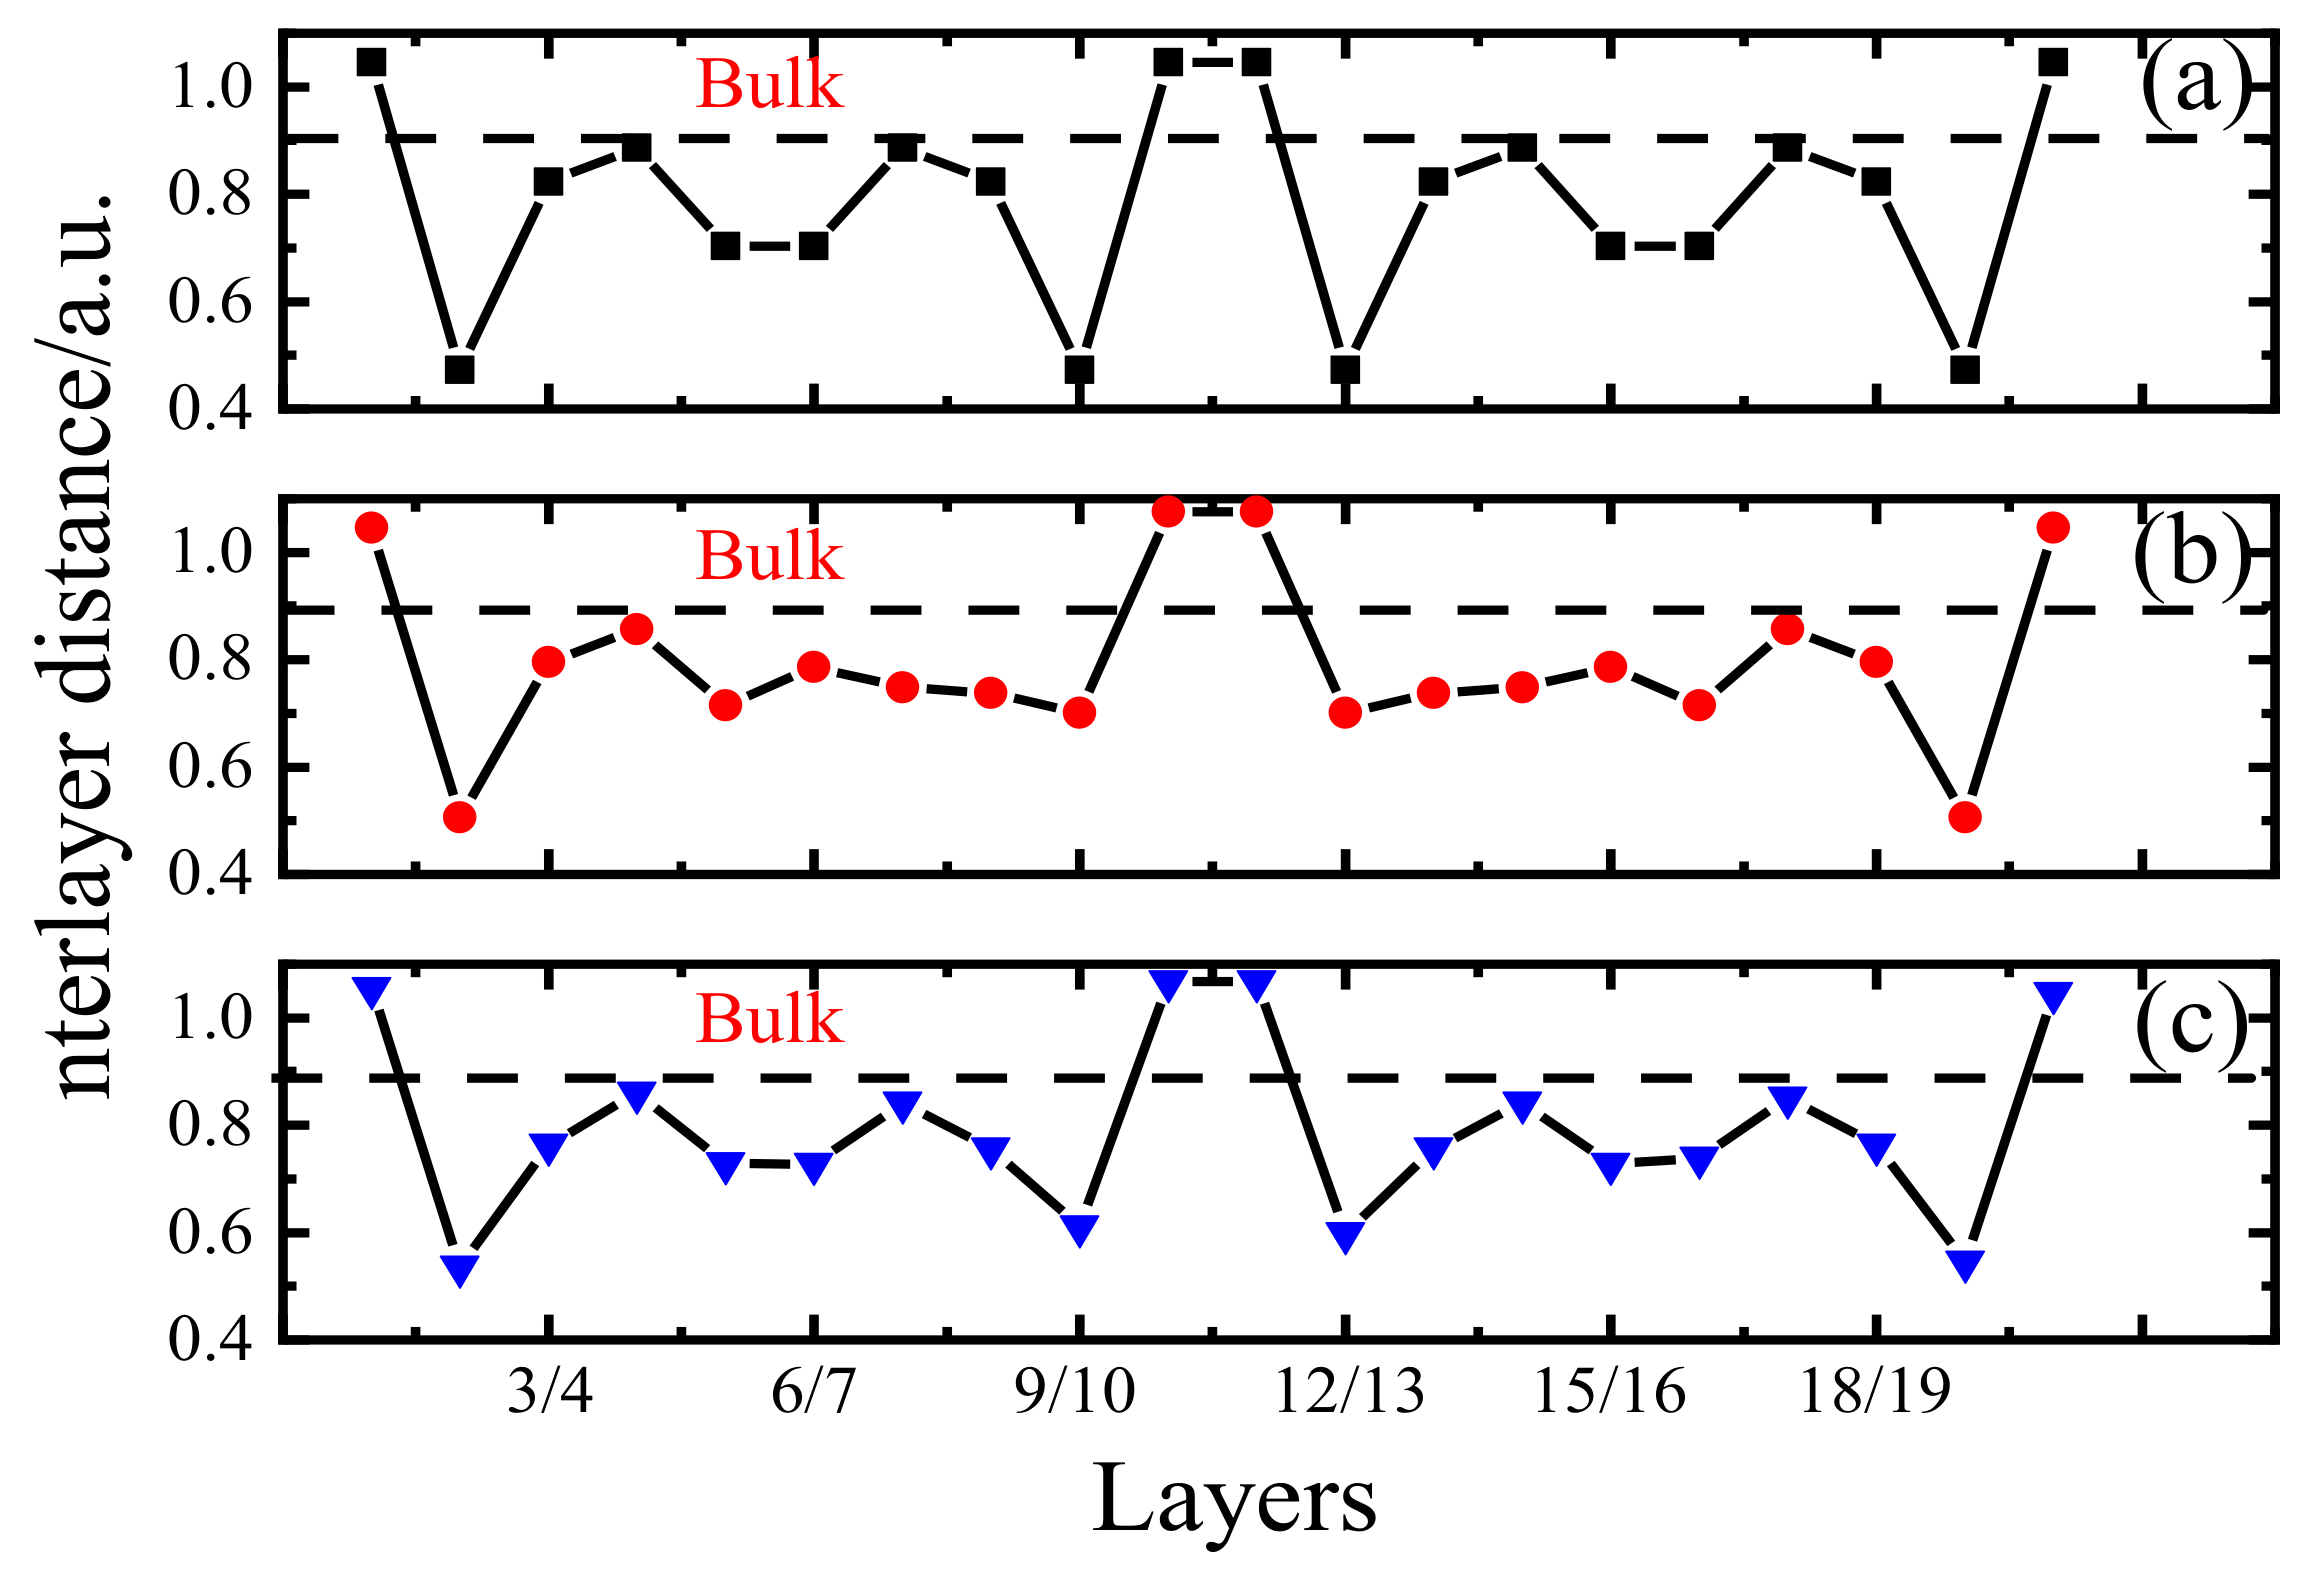
First, the equilibrium lattice constant of the fcc Fe structure was optimized. The obtained magnitude was a = 3.446 Å, and the corresponding experimental value was a = 3.648 Å [38]. The optimized lattice constant was subsequently used to establish suitable grain boundary models followed by the optimizations of their bulk structures, which were required due to the misalignment of boundary atoms. Figure 6 displays the changes in the interlayer spacings caused by the optimizations of the grain boundary models described in Figure 4a–c. It shows that the arrangements of atoms in the three models after the oscillations of the four interlayer spacings are very close to the bulk arrangement, indicating that the numbers of atomic layers utilized in these models were sufficient. In addition, variations of the Fe-Fe, Fe-Zn, and Fe-Ni bond lengths in the grain boundary models were observed as well (see the related discussions in the following sections). After optimizing the three grain boundary models, it was found that (a) the supercell size of the undoped Fe grain boundary model was 3.449 × 7.712 × 15.424 Å3; (b) the supercell size of the Zn-doped grain boundary model was 3.489 × 7.670 × 15.722 Å3; and (c) the supercell size of the grain boundary model co-doped with zinc and nickel was 3.475 × 7.675 × 15.852 Å3.
The POSCAR file containing information on the strained structure was constructed based on the following assumptions:
  • The Poisson’s ratio was ignored as suggested in previous studies [39]. In other words, the material was not deformed along the vertical strain direction (z-axis), and the unit cell parameters along the x and y-directions remained unchanged.
  • The atom at the fixed twin boundary did not move. In fact, the unit cell contained two twin boundaries (z = 0 (1) and z = 0.5), and only the z = 0 (1) boundary was fixed during calculations. There were no restrictions for the movements of the two atoms with z = 0.5; however, they did not produce any displacements during the calculation process.
  • The structure with a strain of 0% was fully relaxed as the initial stable configuration. The applied strain changed the c value of the unit cell parameter according to the following formula:
    ε = ( c ε     c 0 ) / c 0 ,
    where   ε is the magnitude of strain equal to 2%, 4%, 6% …; c ε is the c-axis unit cell parameter of the POSCAR file corresponding to strain; and c 0 is the c-axis unit cell parameter at a strain of 0%.
Therefore, Formula (1) can be rewritten as
c ε = c 0 ( 1 + ε ) .
The atomic positions, total energy, and stress of the relaxed system were directly obtained from the OUTCAR output file generated by the VASP software package, and its charge density distribution was provided in the CHGCAR file to ensure continuity of the strain path.

3. Results and Discussion

3.1. Total Energy and Theoretical Tensile Strength

The stability of a grain boundary is quantified by the total energy of its ground state. The theoretical tensile strength is a physical parameter that characterizes the mechanical properties of materials, and the total energy and theoretical tensile strength of each grain boundary in a studied system can be obtained at different tensile strains by conducting first-principles calculations.
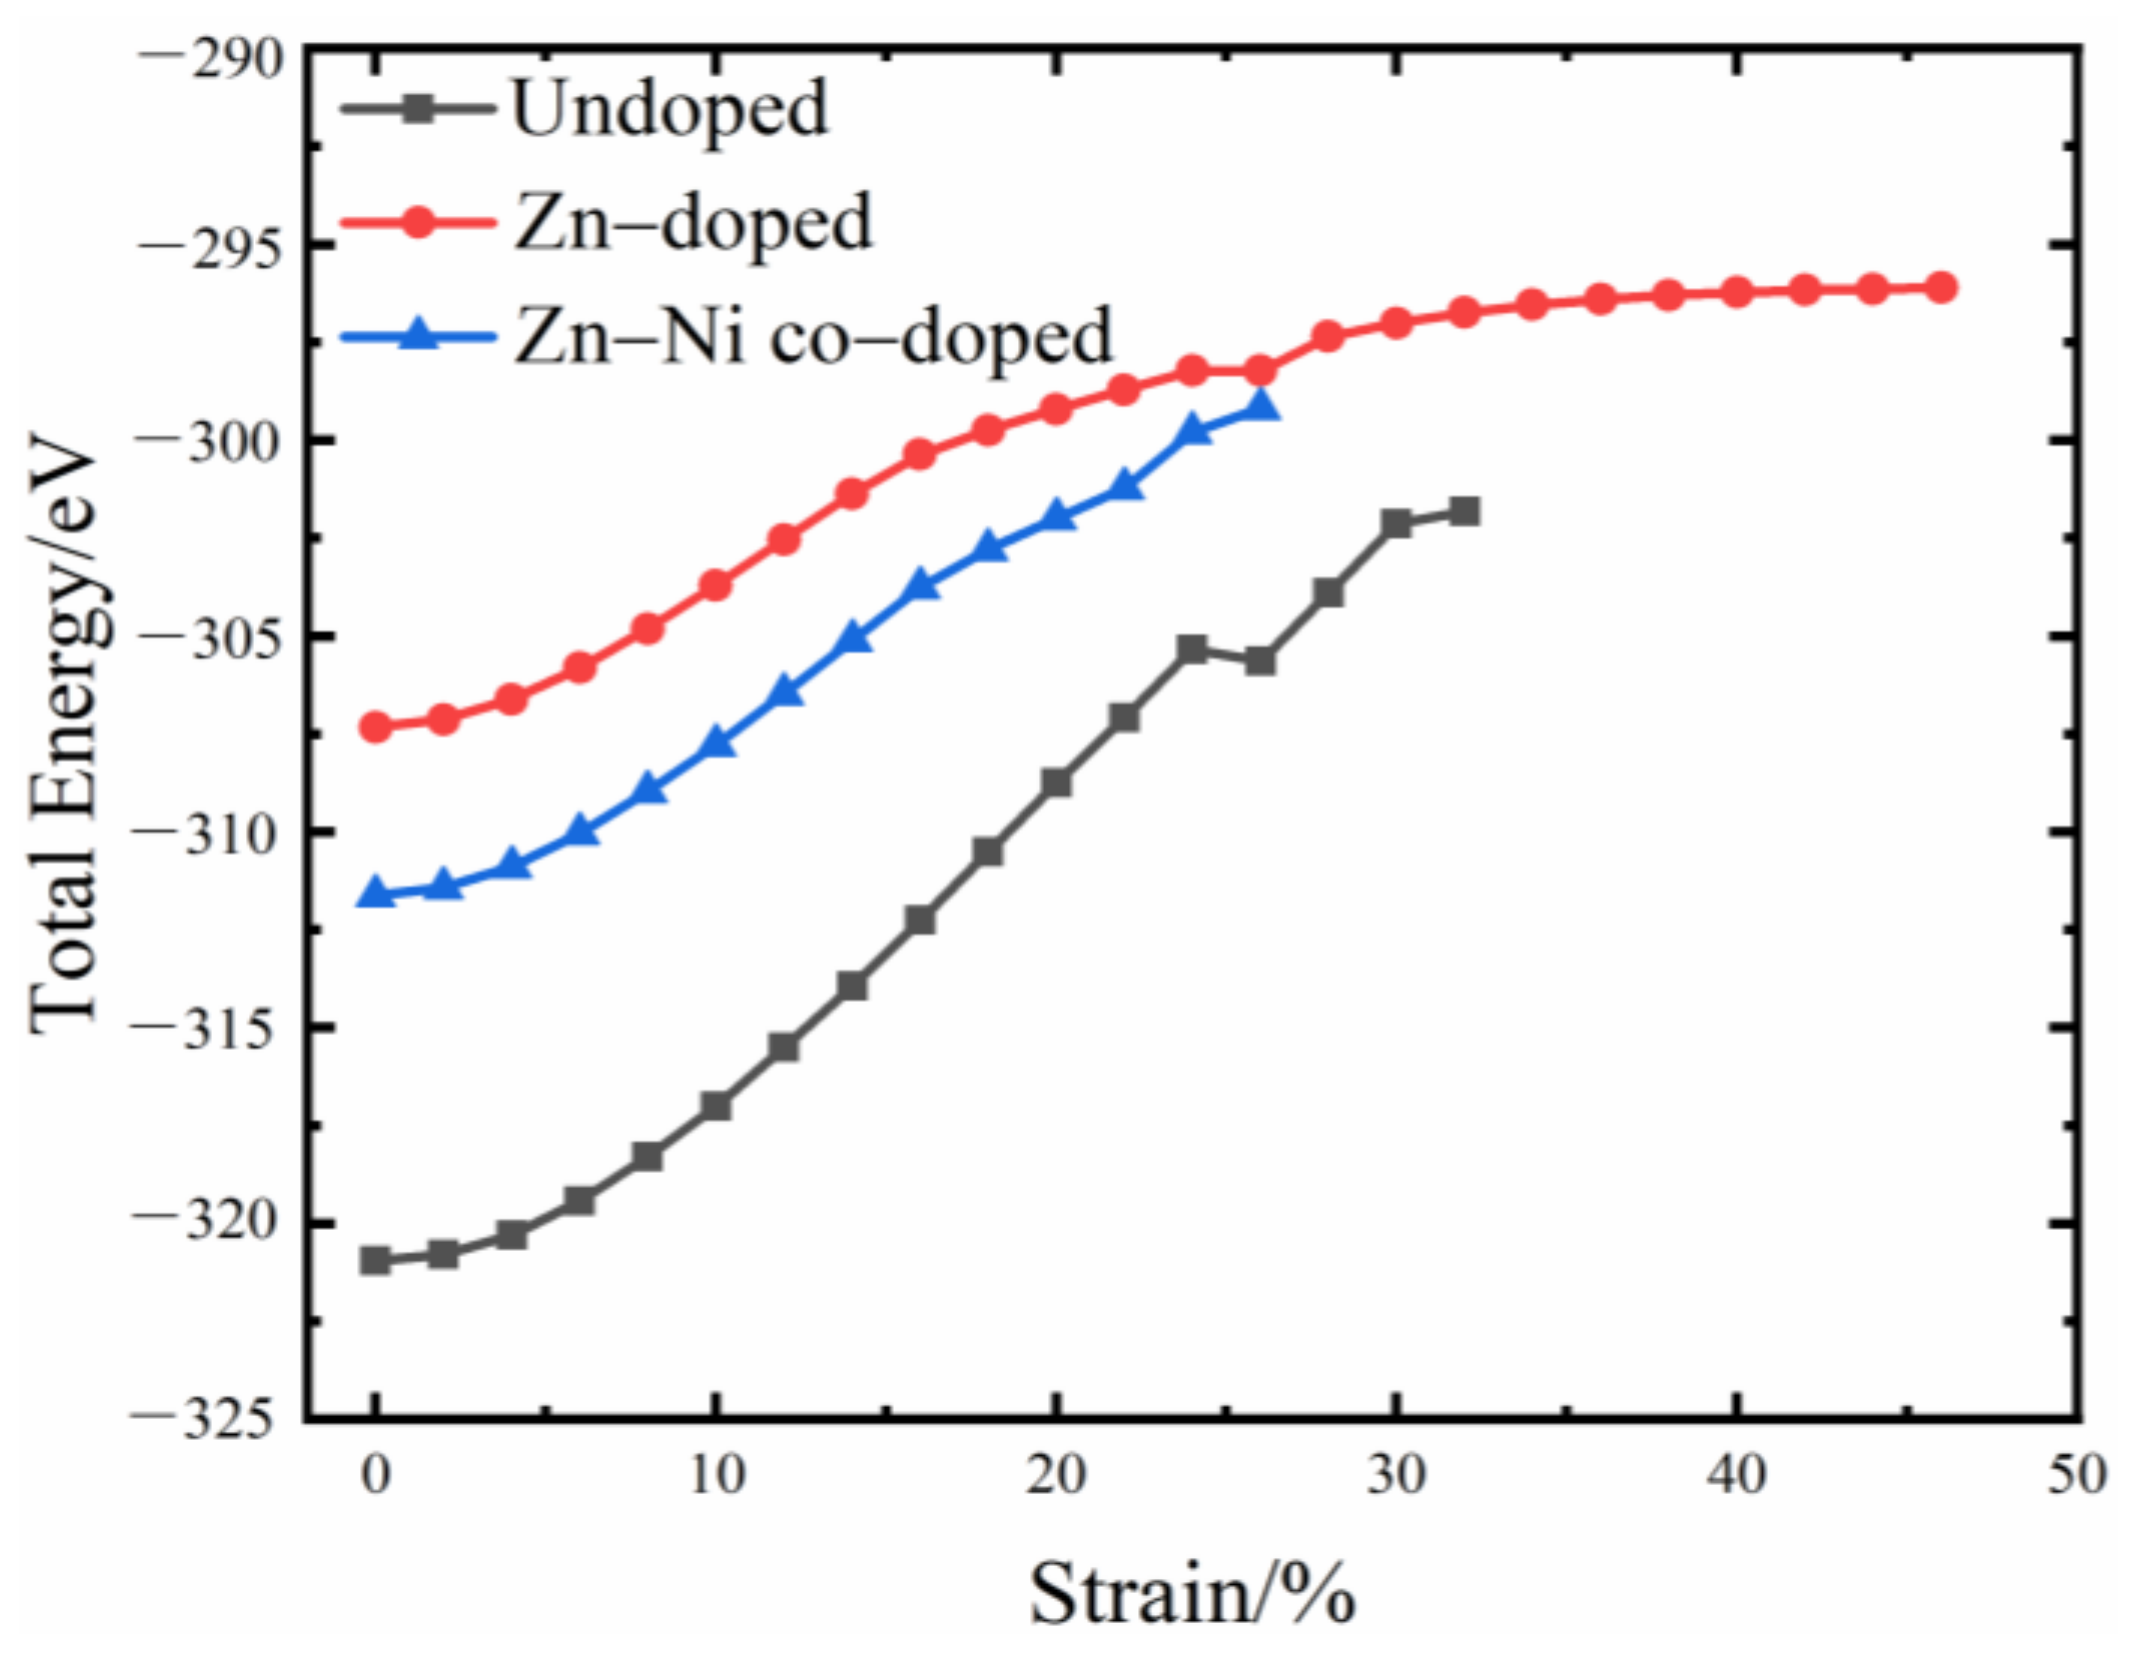
The total energies of the undoped, Zn-doped, and Zn-Ni co-doped Fe grain boundaries are plotted as functions of strain in Figure 7. It shows that the increase in the tensile strain increases the total energy of each grain boundary, indicating that the utilized grain boundary models gradually become unstable under loading. When the strain of the undoped grain boundary equals 24%, the energy of the system reaches a maximum, after which its magnitude decreases, and the pure Fe grain boundary remains in a relatively stable state. Because the total energy of the grain boundary of a non-fractured material gradually increases with an increase in strain, its energy entropy decreases after the fracture. Therefore, it can be concluded that the fracture of the undoped Fe grain boundary model occurs at a strain of 24%. The fracture of the Zn-doped grain boundary model is also observed after reaching a strain of 24%. However, according to the corresponding plot of the total energy versus strain, the cracking of the Zn-doped grain boundary occurs earlier than the cracking of the pure Fe grain boundary. For the Zn-Ni co-doped grain boundary model, the energy continuously increases with increasing strain, as the cracking of grain boundary occurs between undoped and Zn-doped.
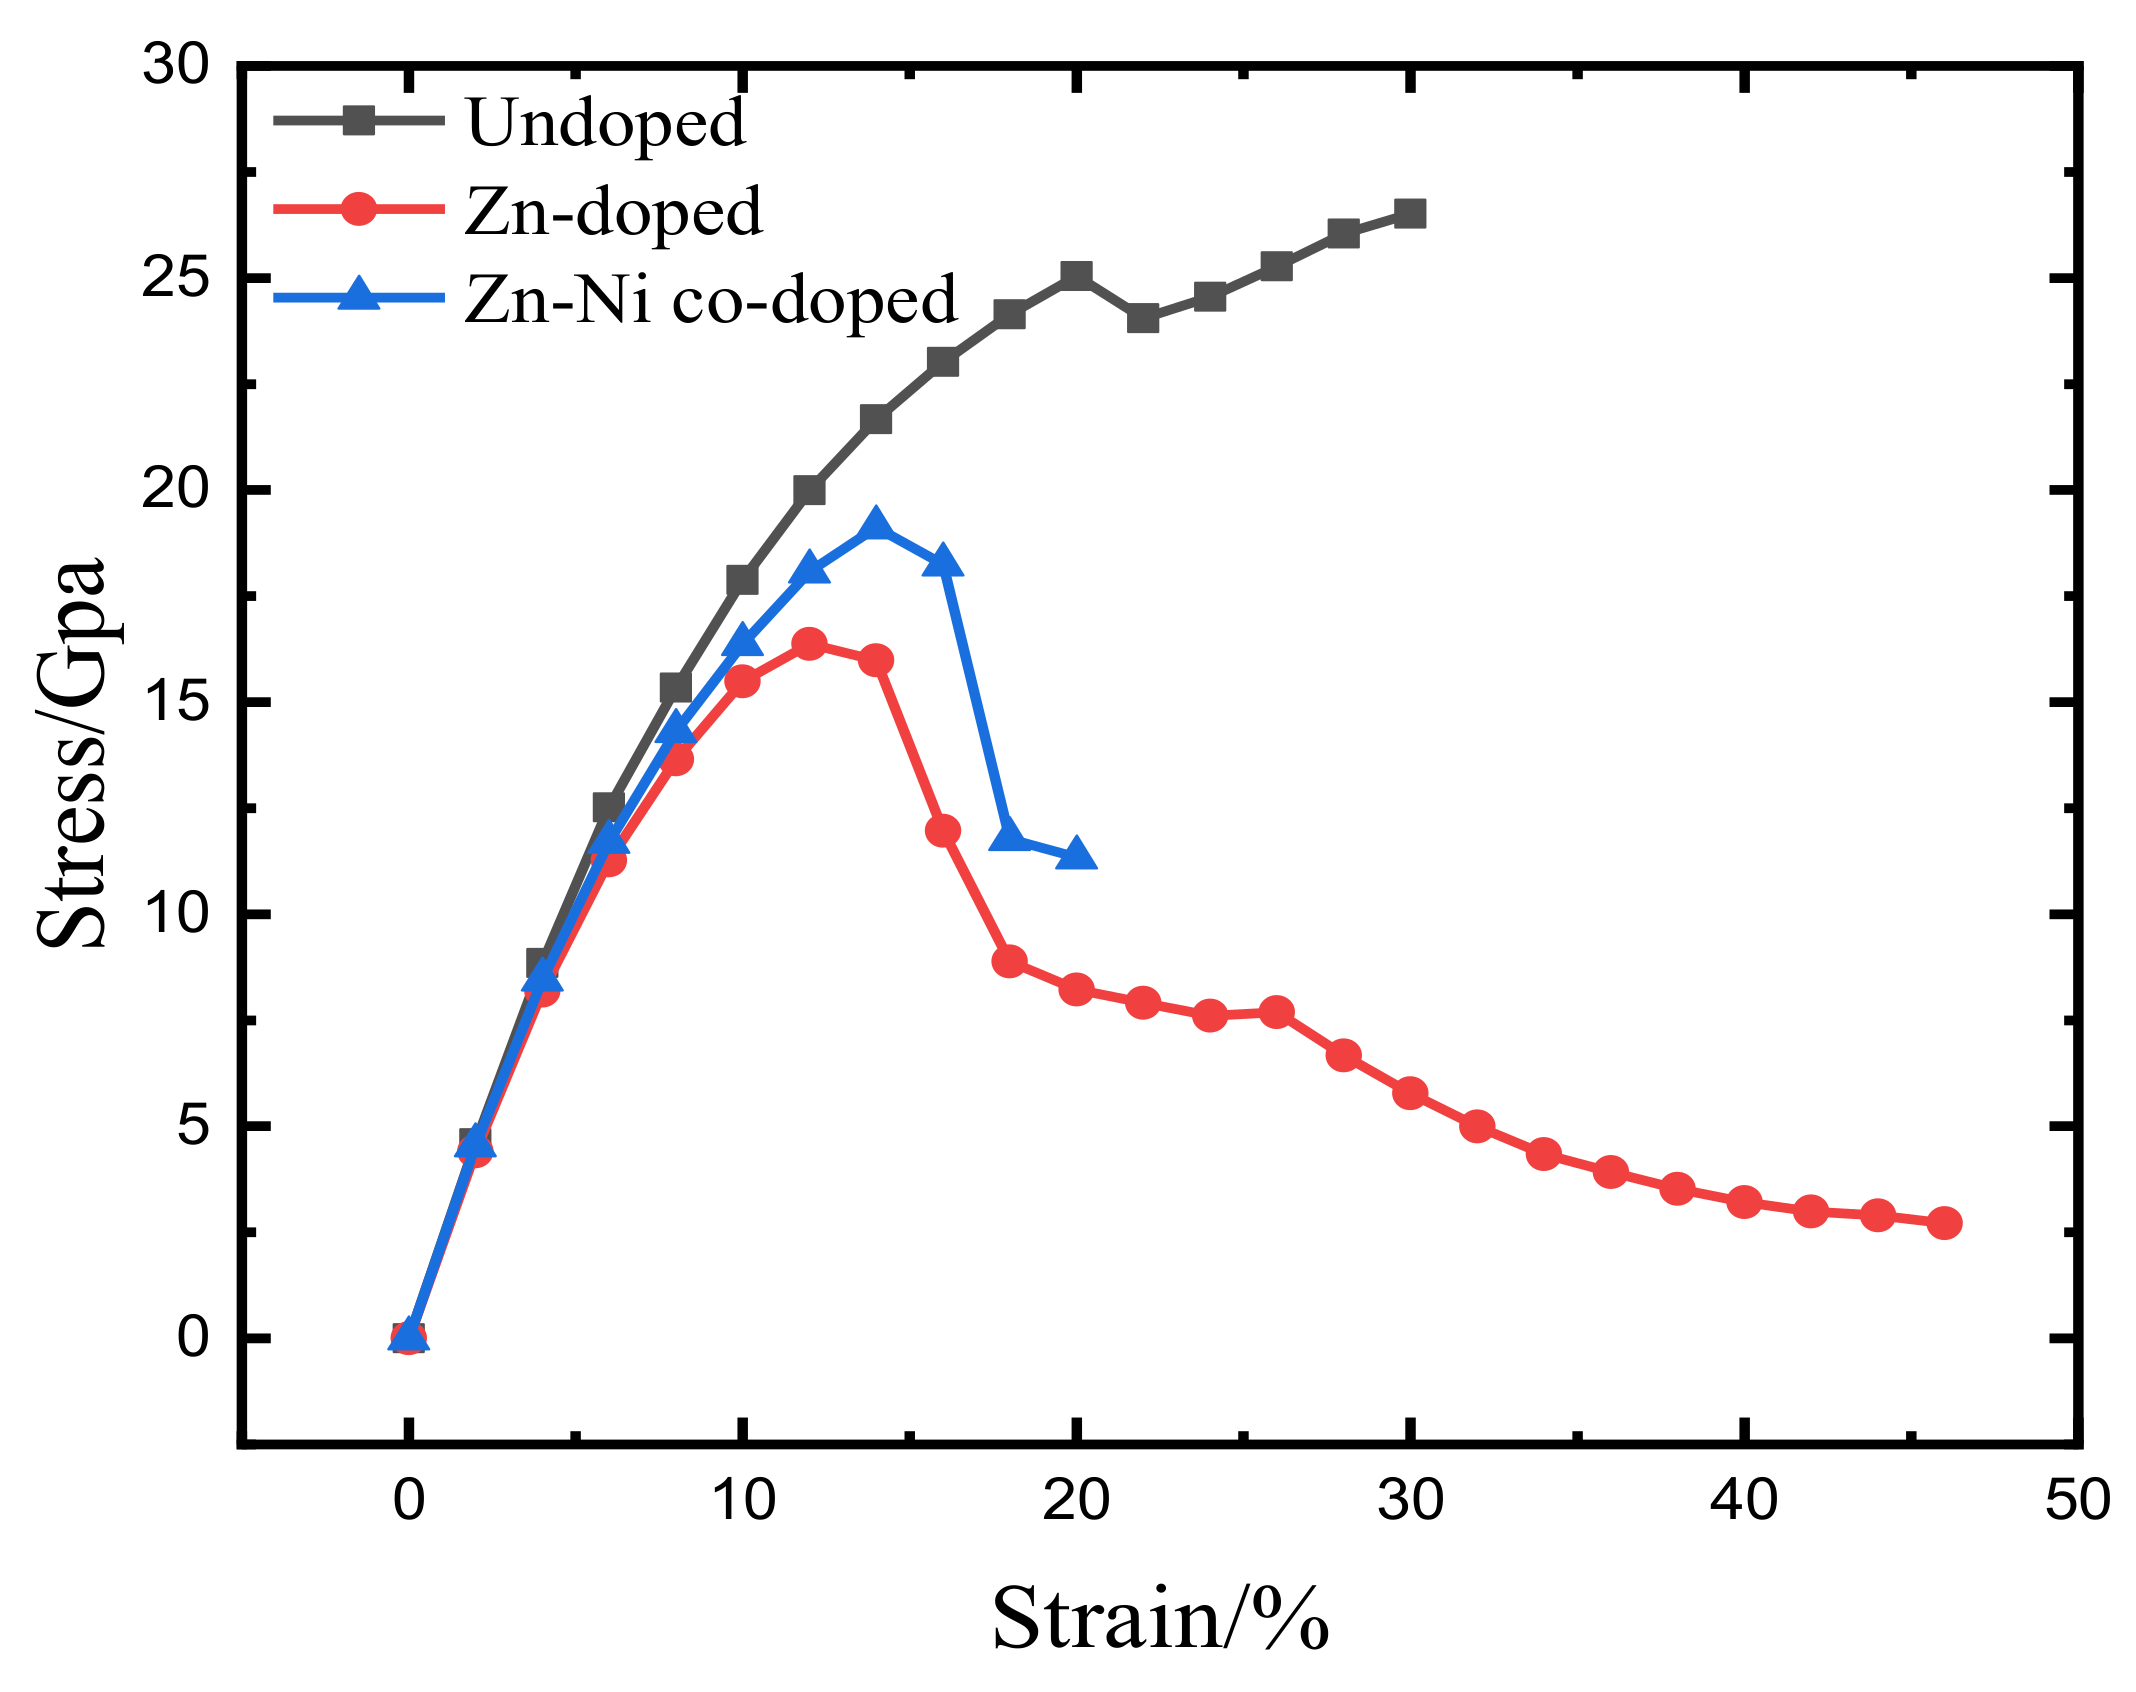
In order to determine the main reasons for the grain boundary embrittlement caused by zinc doping, first-principles computational tensile tests were performed on the studied models. The first principle tensile test is to calculate the average stress acting on the system by using the first principle method and Nielsen Martin stress calculation theory [40]. Figure 8 shows the stress-strain curves obtained for the pure Fe, Zn-doped, and Zn-Ni co-doped grain boundaries (here, a sudden drop in stress indicates that the entire grain boundary or one of its bonds is broken). When the Fe grain boundary is doped with zinc, its tensile strength and strain rate are significantly reduced. The pure Fe grain boundary breaks after stretching to 22%, and its tensile strength is equal to approximately 25.04 GPa. The Zn-doped grain boundary fractures after stretching to 14%, and its tensile strength is approximately 16.37 Gpa. Meanwhile, replacing Zn atoms with Ni in the Zn-doped grain boundary model increases both its tensile strength and strain rate. As a result, the Zn-Ni co-doped grain boundary fractures after stretching to 16%, and its tensile strength is equal to approximately 19.12 Gpa. However, these values are still lower than the tensile strength and strain rate of the undoped Fe grain boundary. Therefore, introducing Ni atoms into the Zn-doped Fe structure provides a basis for the suppression of its liquid zinc-induced embrittlement.

3.2. Chemical Bond Structure

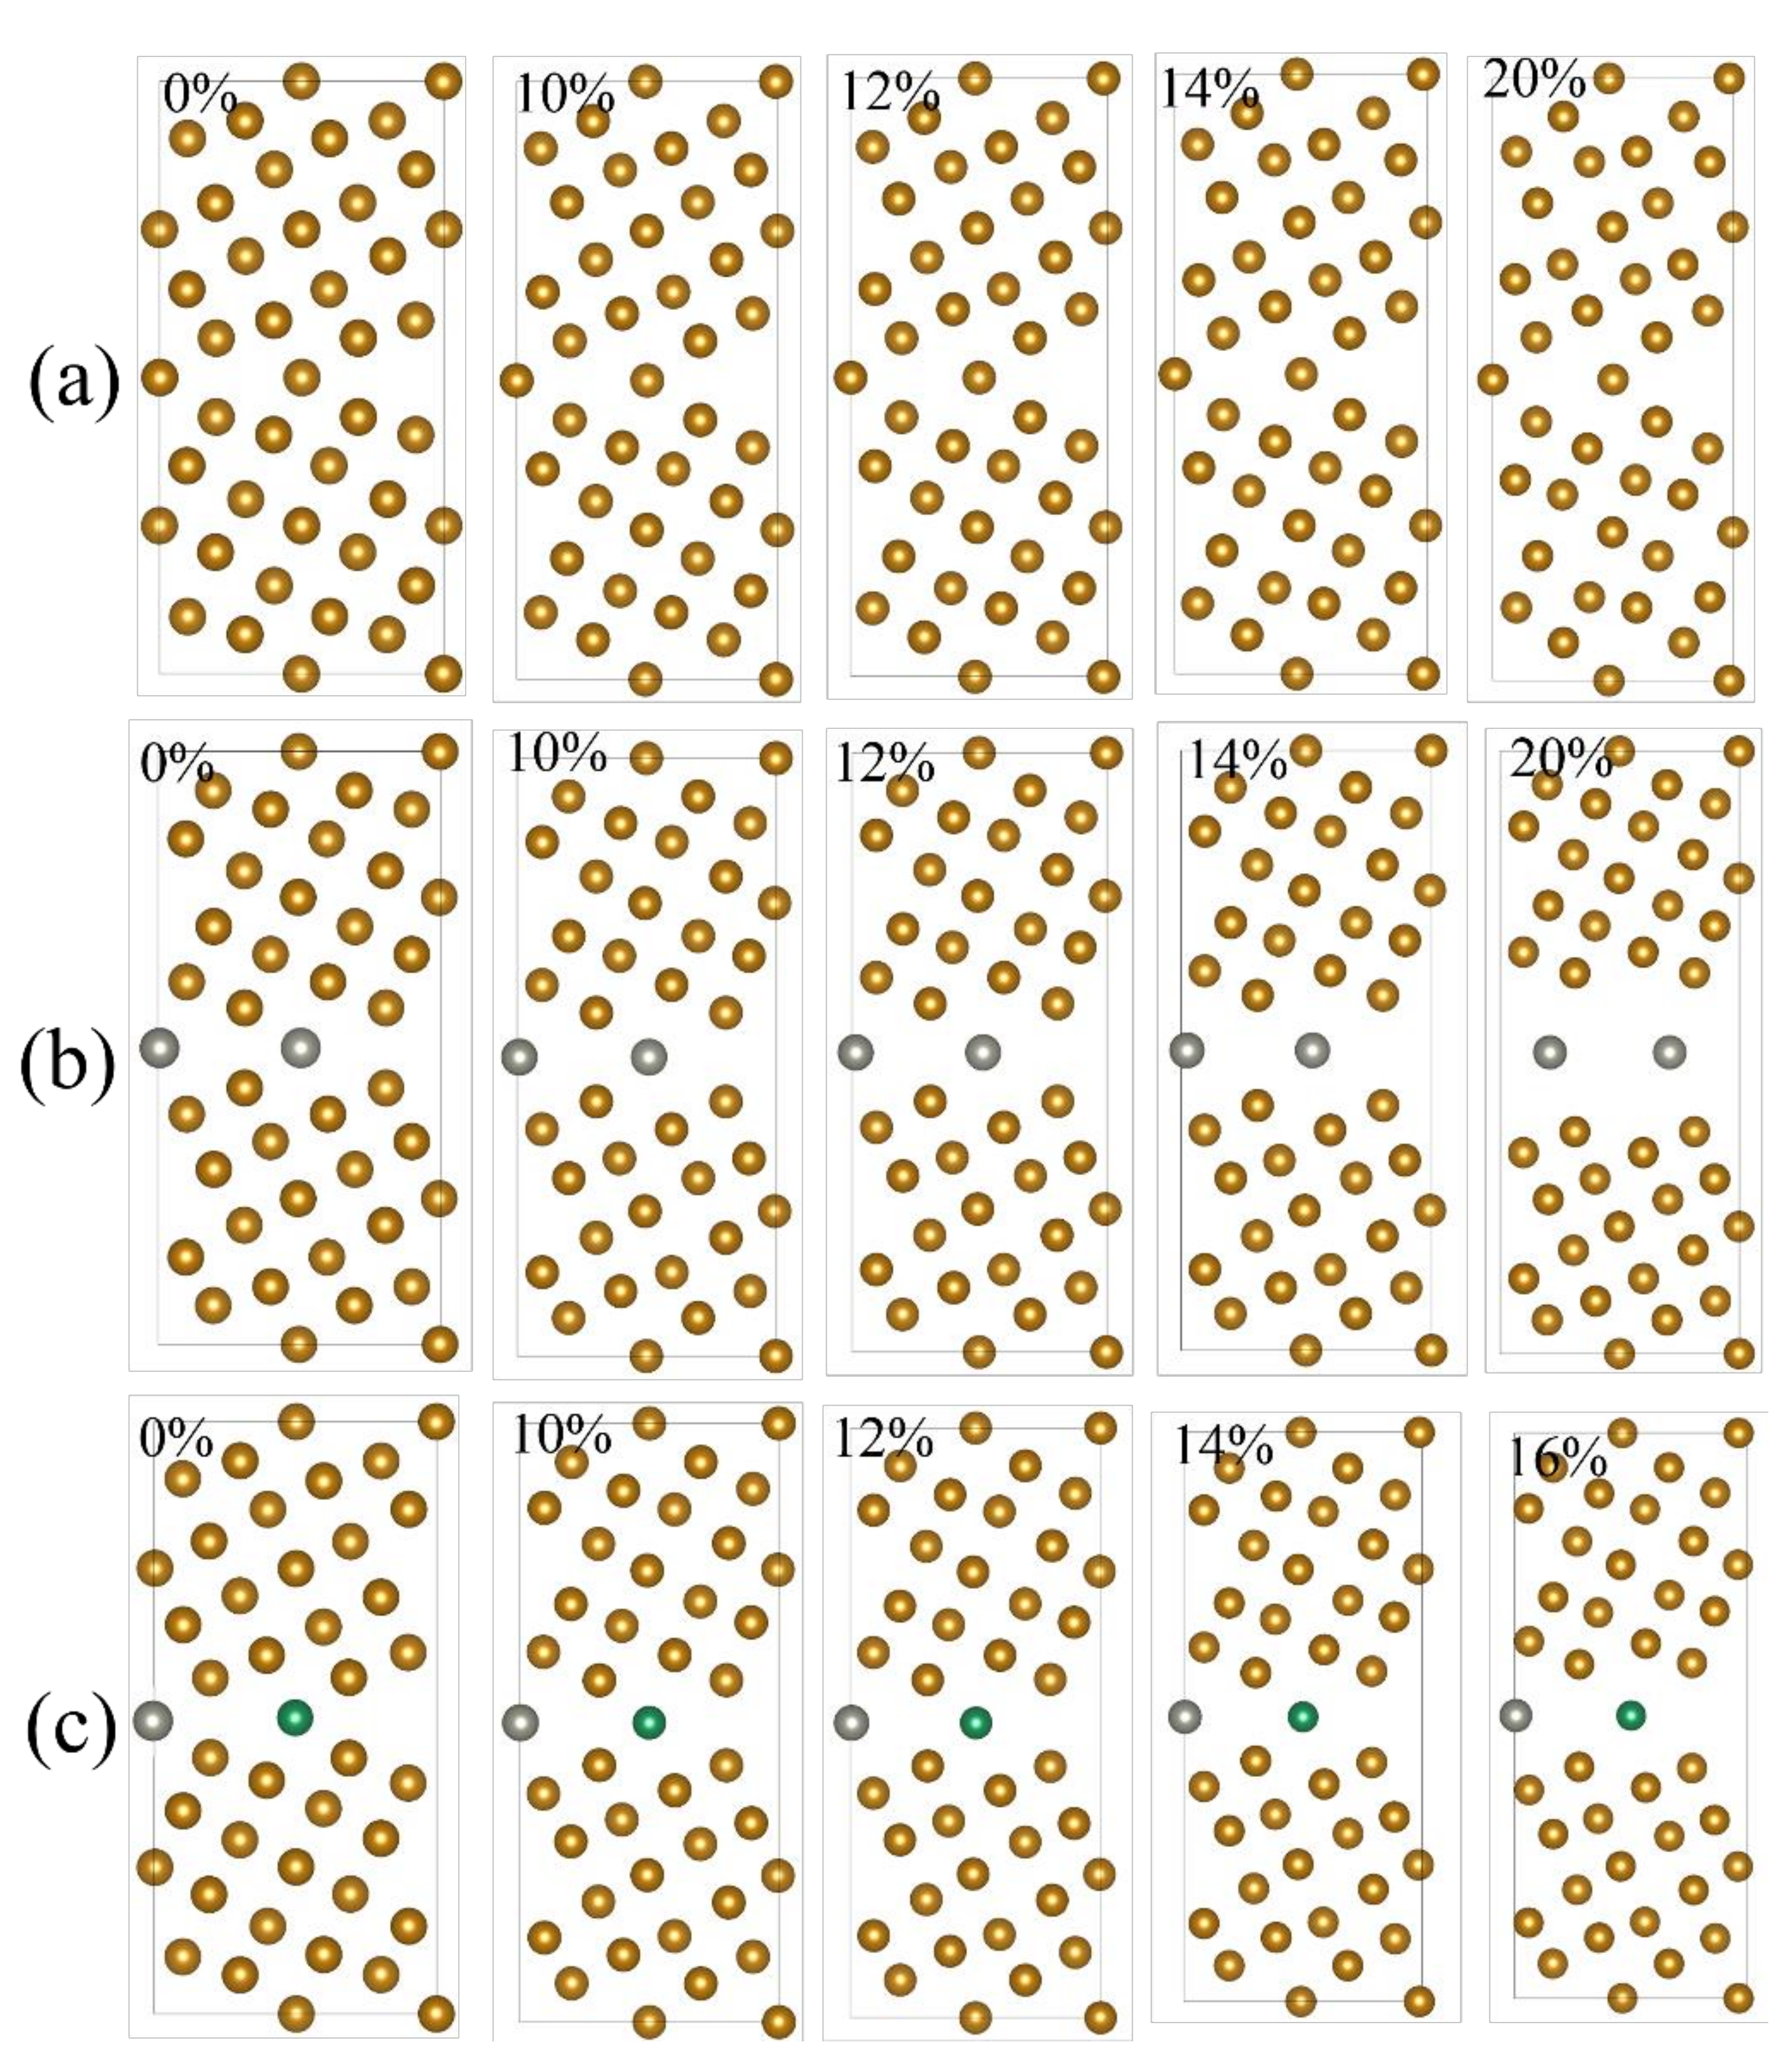
To determine the fracture points of the studied grain boundaries, their specific fractures that occurred during the stretching process are shown in Figure 9. For the pure Fe grain boundary, the interlayer spacing between the several atomic layers located near the boundary changes significantly during stretching, and the symmetrical tilt characteristics of this model after stretching are no longer observed. This indicates that the strength of Fe-Fe bonds in the undoped Fe grain boundary model is relatively high, and that this boundary is not prone to fracture. At strains between 0% and 12%, the atomic configuration of the Zn-doped grain boundary is close to that of the undoped boundary. When the Zn-doped grain boundary is stretched to 12%, its structure breaks due to the cleavage of Fe-Zn bonds. The atomic configuration of the Zn-Ni co-doped grain boundary at strains between 0% and 14% is also very close to those of the undoped and Zn-doped grain boundaries. However, the former boundary breaks after stretching to 16%, owing to the cleavages of Fe-Zn or Ni-Fe bonds.
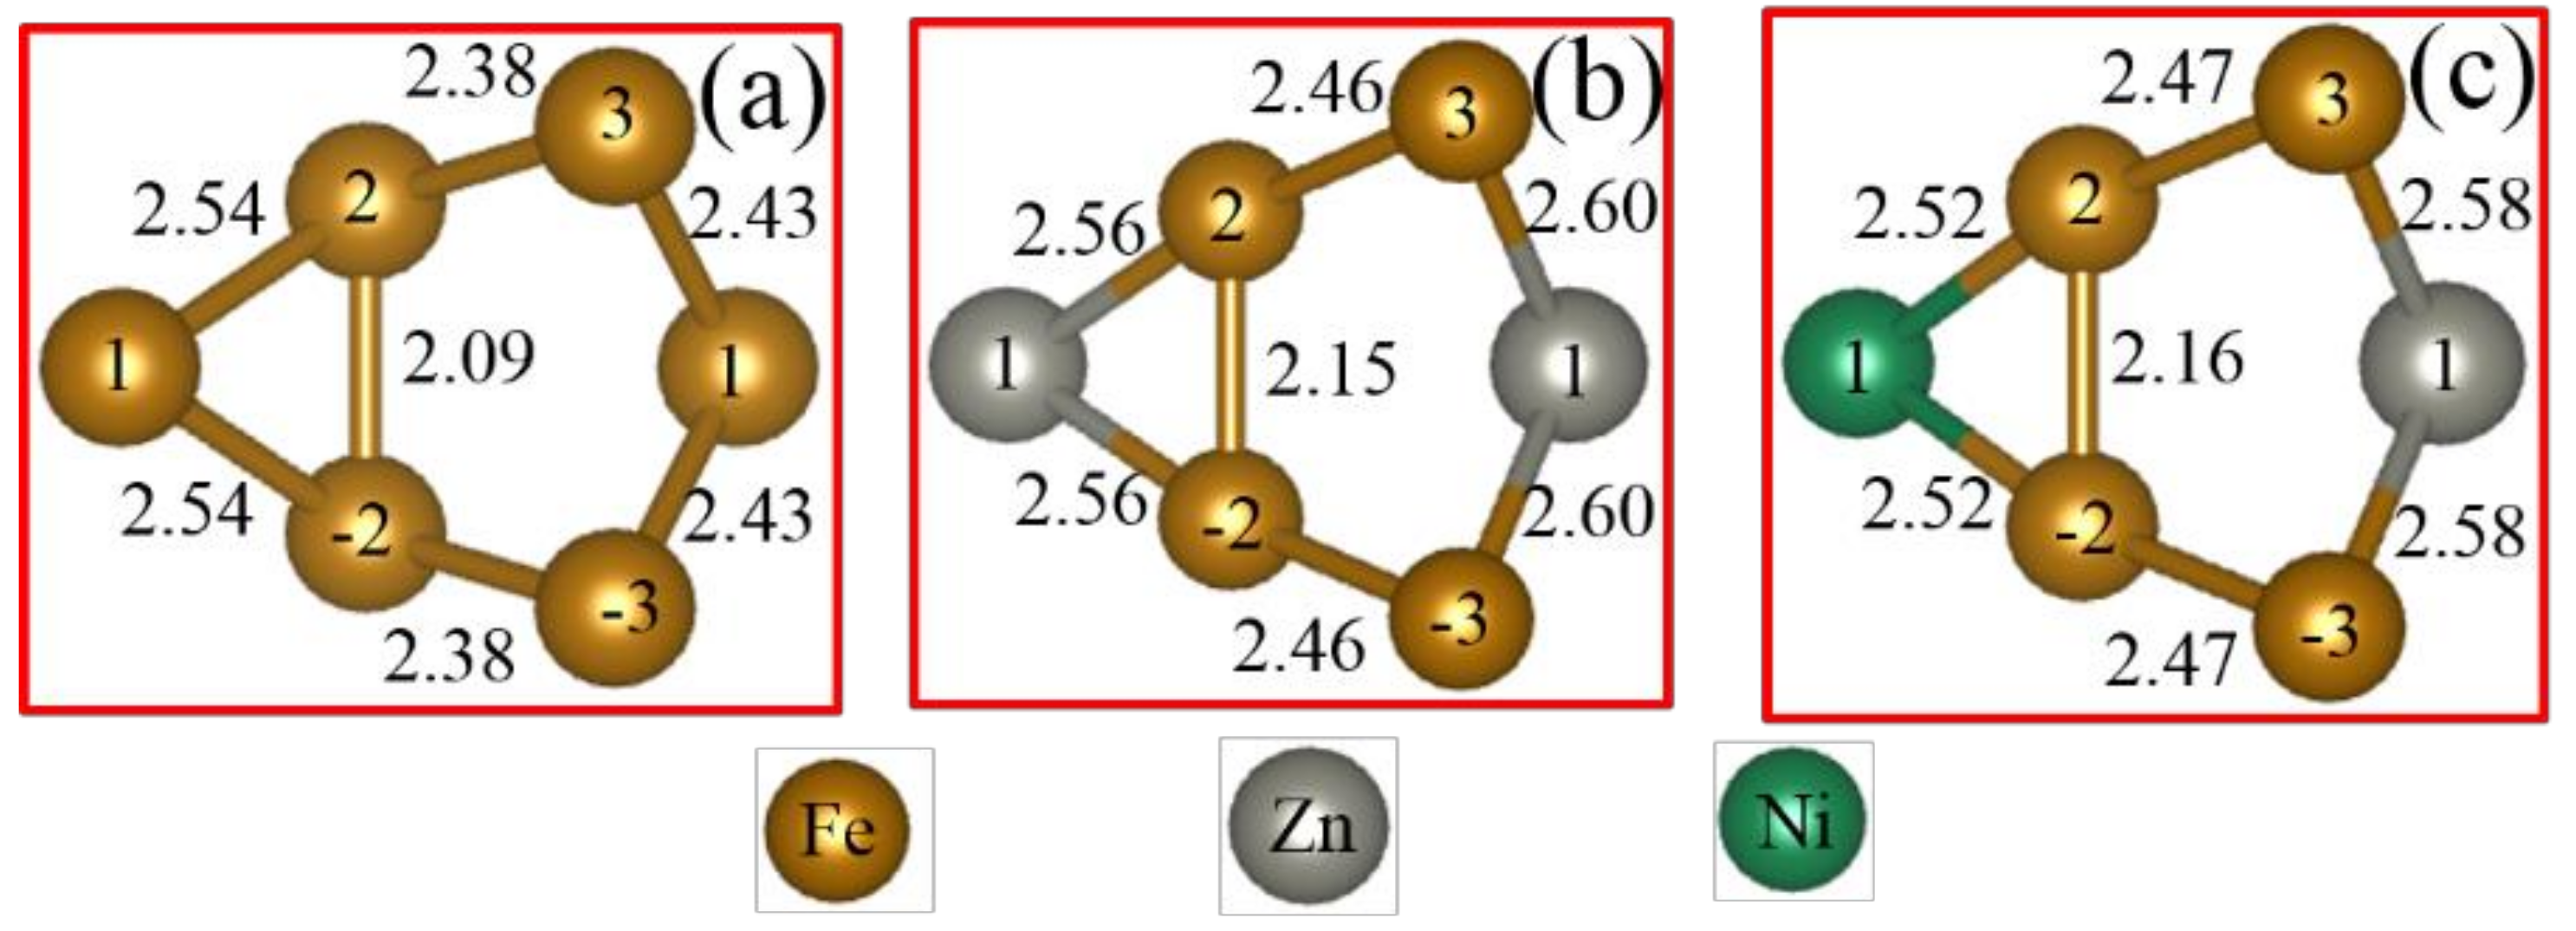
To explore the specific fractures of the three grain boundary models, their Fe-Fe, Fe-Zn, and Ni-Fe bonds were examined in detail. Figure 10 shows the chemical structures of these bonds at a zero strain (it also contains the locations of the corresponding atoms and specific Fe-Fe, Fe-Zn, and Ni-Fe bond lengths). The brown balls in the model represent Fe atoms; the gray balls denote Zn atoms; and the green balls represent Ni atoms.
According to Figure 10, the main bonds affecting the strength of the pure Fe grain boundary are the Fe(2)-Fe(-–2), Fe(1)-Fe(3), and Fe(1)-Fe(2) bonds; the main bonds affecting the strength of the Zn-doped grain boundary are the Fe(2)-Fe(–2), Zn(1)-Fe(3), and Zn(1)-Fe(2) bonds; and the main bonds affecting the strength of the Zn-Ni co-doped grain boundary are the Fe(2)-Fe(–2), Zn(1)-Fe(3), and Ni(1)-Fe(2) bonds. Among these three types of bonds, the Fe(2)-Fe(–2) bond parallel to the stretching direction has the greatest influence on the grain boundary strength followed by the Fe(1)-Fe(3) and Zn(1)-Fe(3) (oriented at an angle of approximately 30° with respect to the stretching direction) and the Fe(1)-Fe(2), Zn(1)-Fe(2), and Ni(1)-Fe(2) bonds (oriented at an angle of approximately 60° with respect to the stretching direction). Figure 10 also shows that the lengths of the three types of bonds in the Zn-doped grain boundary exceed those in the undoped grain boundary model by 0.06 Å, 0.17 Å, and 0.02 Å, respectively. Among them, the greatest increase was observed for the Zn(1)-Fe(3) bond. The lengths of the Fe(2)-Fe(3) bonds located in the second and third layers also increased by 0.08 Å. The atomic radius of Fe is 1.24 Å, the atomic radius of Zn is 1.33 Å, and the atomic radius of Zn is slightly larger than that of Fe; therefore, Zn doping at the grain boundary causes its expansion accompanied by the increase in the bond length. Because the bond length is closely related to the bond strength, the increase in the bond length caused by the grain boundary expansion reduces the grain boundary strength. In particular, the largest increase is observed for the Fe(1)-Fe(3) bond length, indicating that the strength of the grain boundary is significantly reduced. This type of grain boundary expansion caused by the atomic size mismatch and weakening of grain boundary bonding is one of the reasons for the observed grain boundary embrittlement. Compared with the Zn-doped grain boundary model, the corresponding bond lengths in the Zn-Ni co-doped grain boundary model increased by 0.01 Å, decreased by 0.04 Å, and decreased by 0.02 Å, respectively. This shows that after Ni atoms partially replace Zn atoms, the Fe(2)-Fe(–2) bond expands, while the Ni(1)-Fe(2) and Zn(1)-Fe(3) bonds contract.
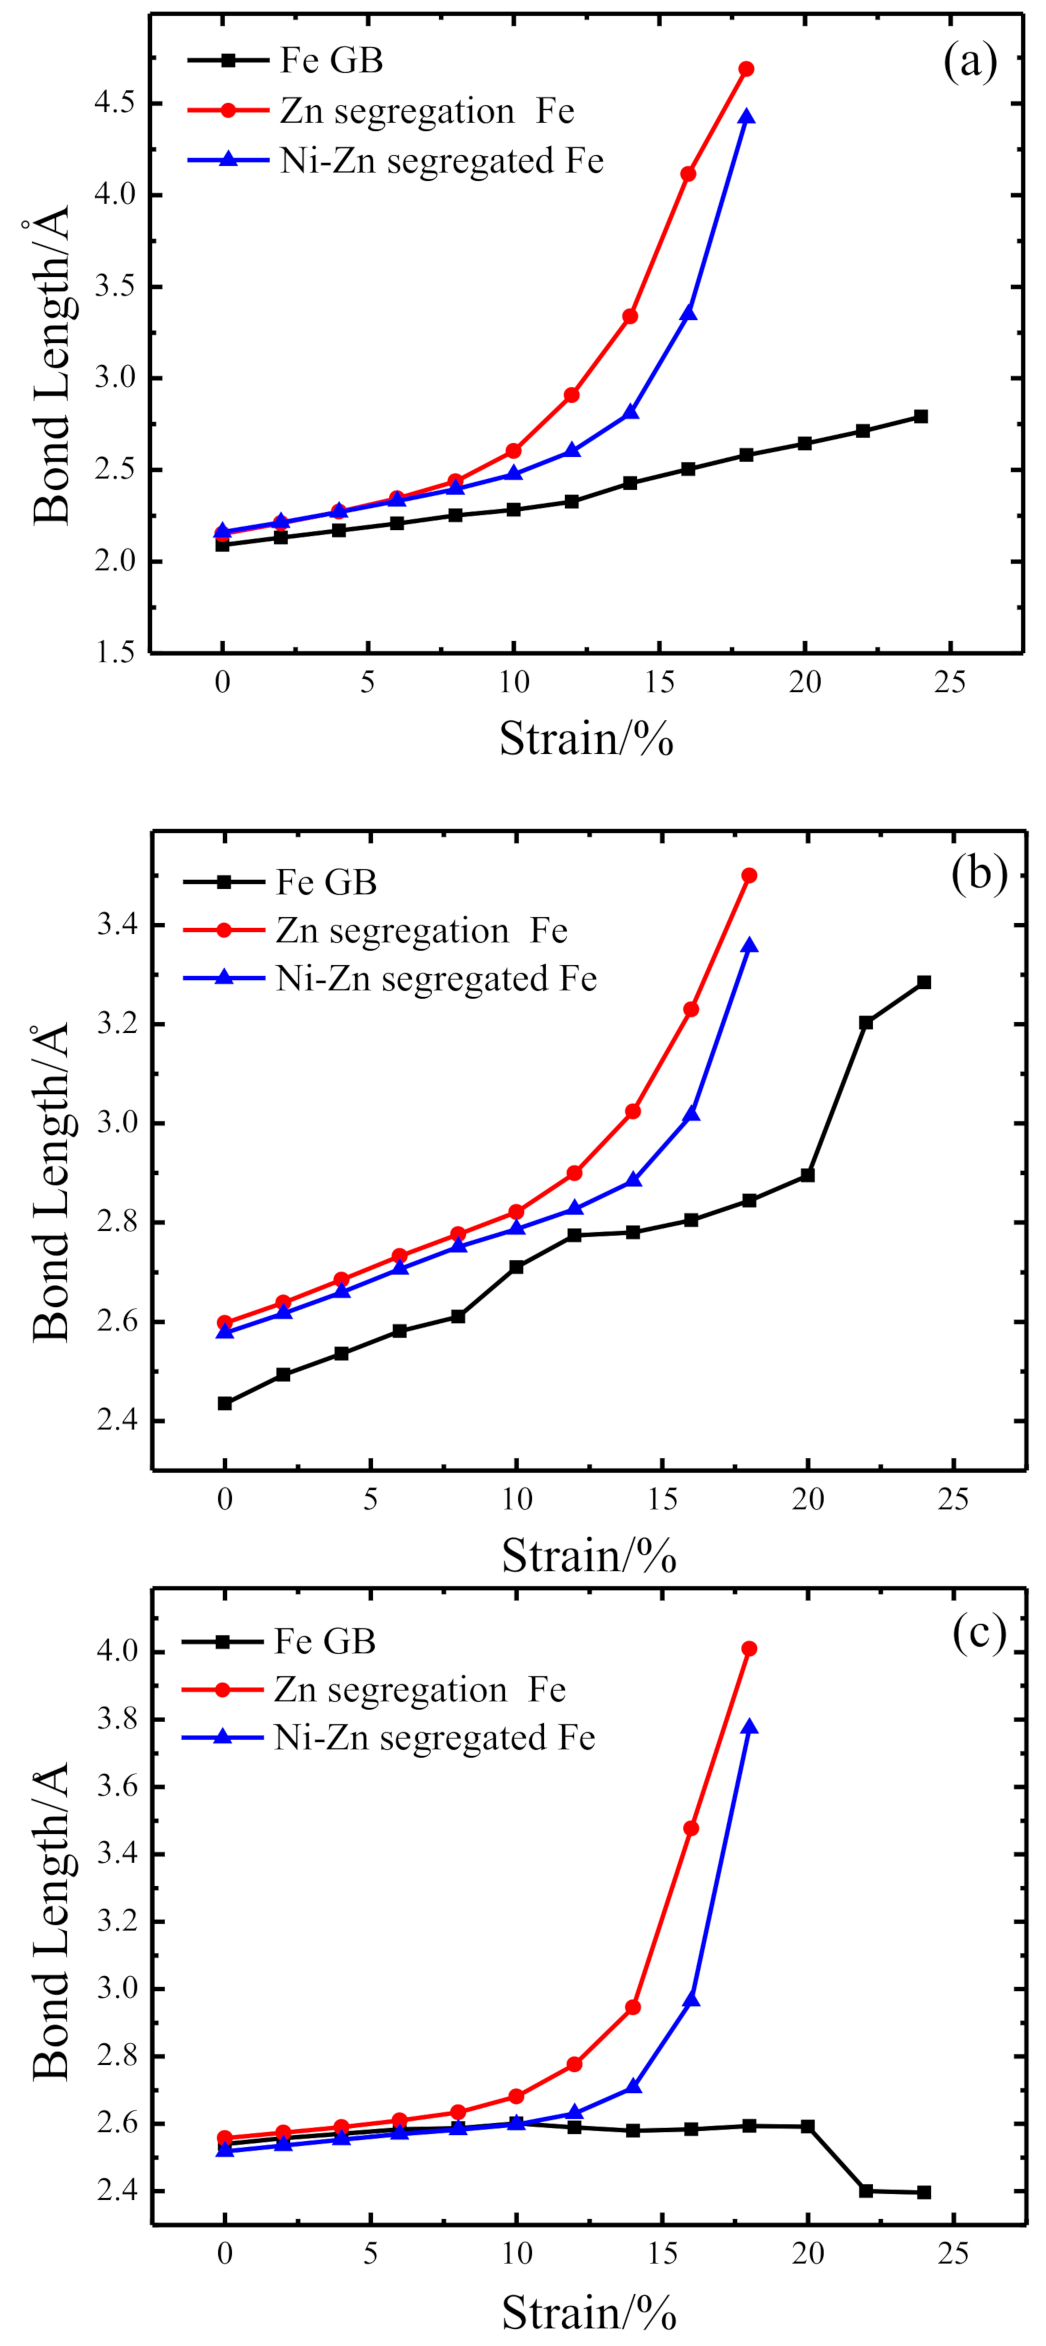
According to Figure 11a–c, the increase in the bond length caused by grain boundary expansion always occurs during the stretching process. In Figure 11a, the Fe(2)-Fe(–2) bond length of the Zn-doped grain boundary is larger than those of the pure Fe and Zn-Ni co-doped grain boundaries. In Figure 11b,c, the same trends are observed for the changes in the bond lengths of the Zn-doped and Zn-Ni co-doped grain boundary models. After stretching to 10%, the lengths of the Fe(2)-Fe(–2), Zn(1)-Fe(3), and Zn(1)-Fe(2) bonds at the Zn-doped grain boundary suddenly increase due to their cleavages.

3.3. Electronic Structure

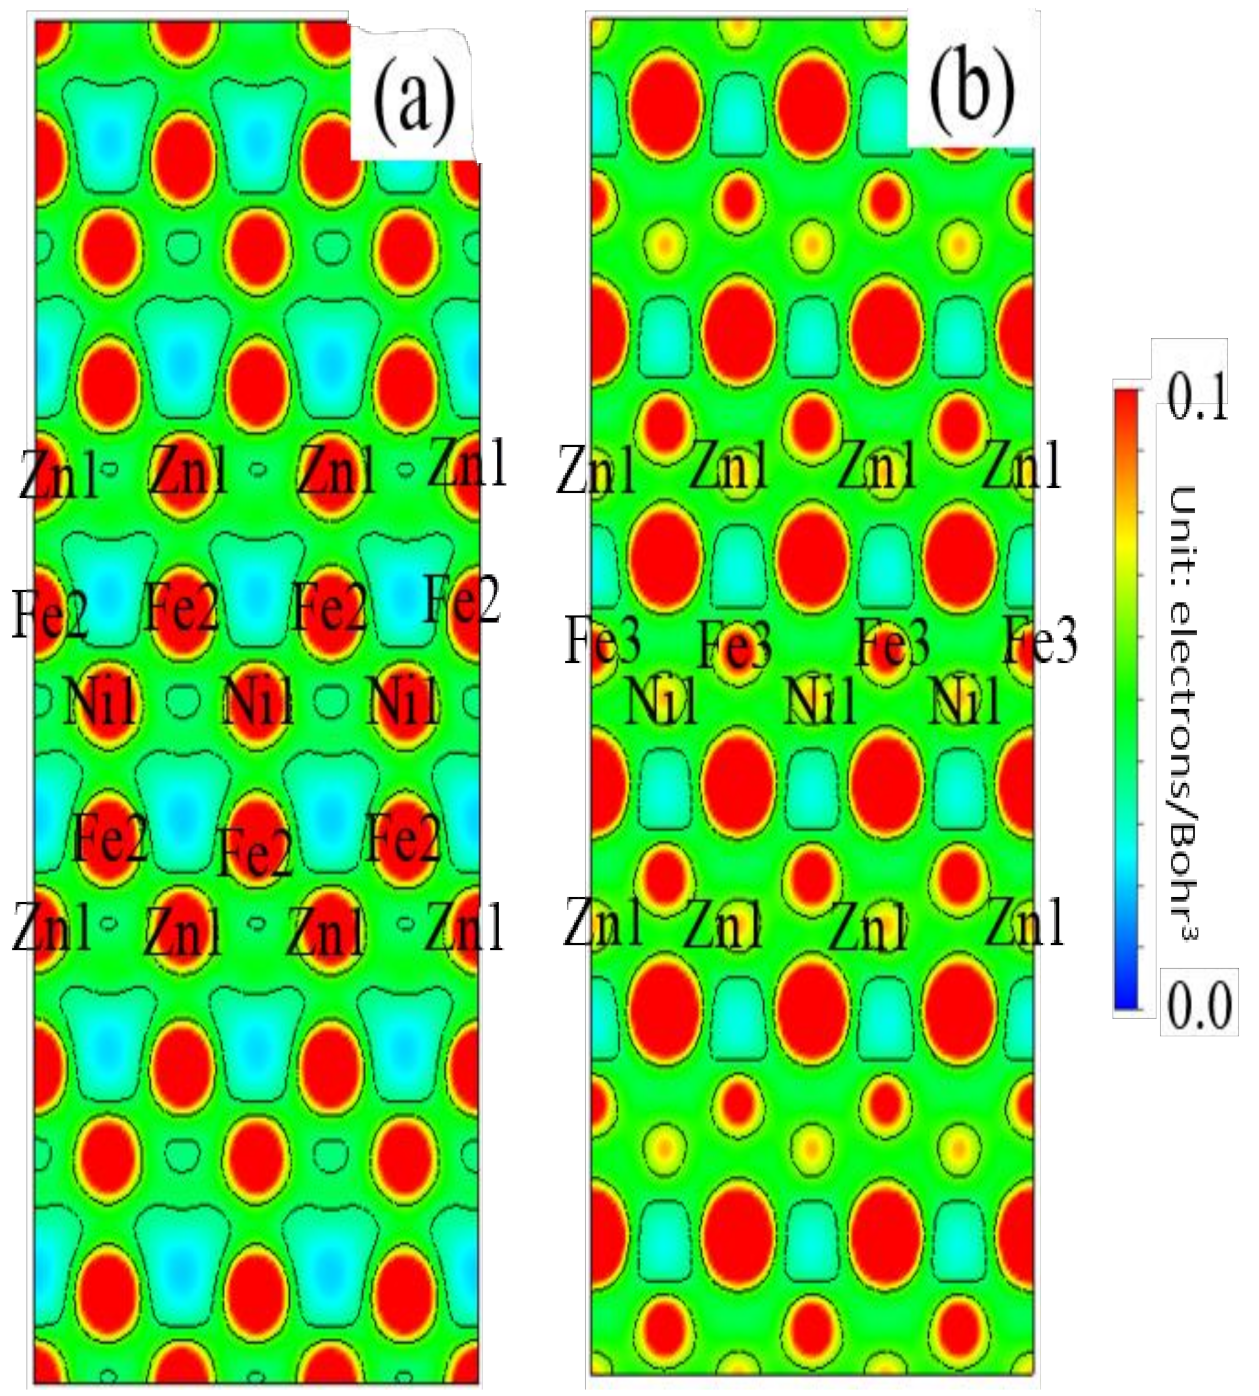
Figure 12 compares the charge density distributions of the Fe(2)-Fe(–2) bonds located on the (002) plane that were obtained for the undoped, Zn-doped, and Zn-Ni co-doped grain boundaries. It shows that at a strain of 0%, the charge density of the Fe(2)-Fe(–2) bonds in the Zn-doped grain boundary model is lower than those of the Fe(2)-Fe(-2) bonds in the other two models, indicating that the strength of these bonds decreases after zinc doping. After replacing Zn atoms with Ni atoms, the charge density of the Fe(2)-Fe(–2) bonds at the Zn-Ni co-doped grain boundary increases, owing to the increase in the Fe(2)-Fe(–2) bond strength.
When the models are stretched to 12%, the charge density of the Fe(2)-Fe(–2) bonds in the Zn-doped grain boundary model becomes much lower than those in the pure Fe and Zn-Ni co-doped models; however, it does not reach zero. Therefore, according to the obtained tensile curves, both boundaries exhibit the same tensile strengths. When the tensile strain reaches 14%, a slight difference is observed between the tensile strengths of the two models, which corresponds to the tiny blue area in Figure 12b 14% (the charge density in this area ranges from 0 to 0.02 electrons/Bohr3, which is very close to zero). When the tensile strain increases to 20%, the tensile strength of the Fe(2)-Fe(–2) bond in the Zn-doped grain boundary model becomes significantly lower than the values obtained for the undoped and Zn-Ni co-doped grain boundary models (see Figure 12b 20%). Here, the charge density of the Fe(2)-Fe(–2) bond basically approaches zero (indicating that this bond is almost broken), while the same bonds in Figure 12a,c 20% still retain high charge densities. When the Zn-doped grain boundary is stretched to 14%, it fractures; as a result, the blue area expands to a maximum value, and the charge density becomes zero.
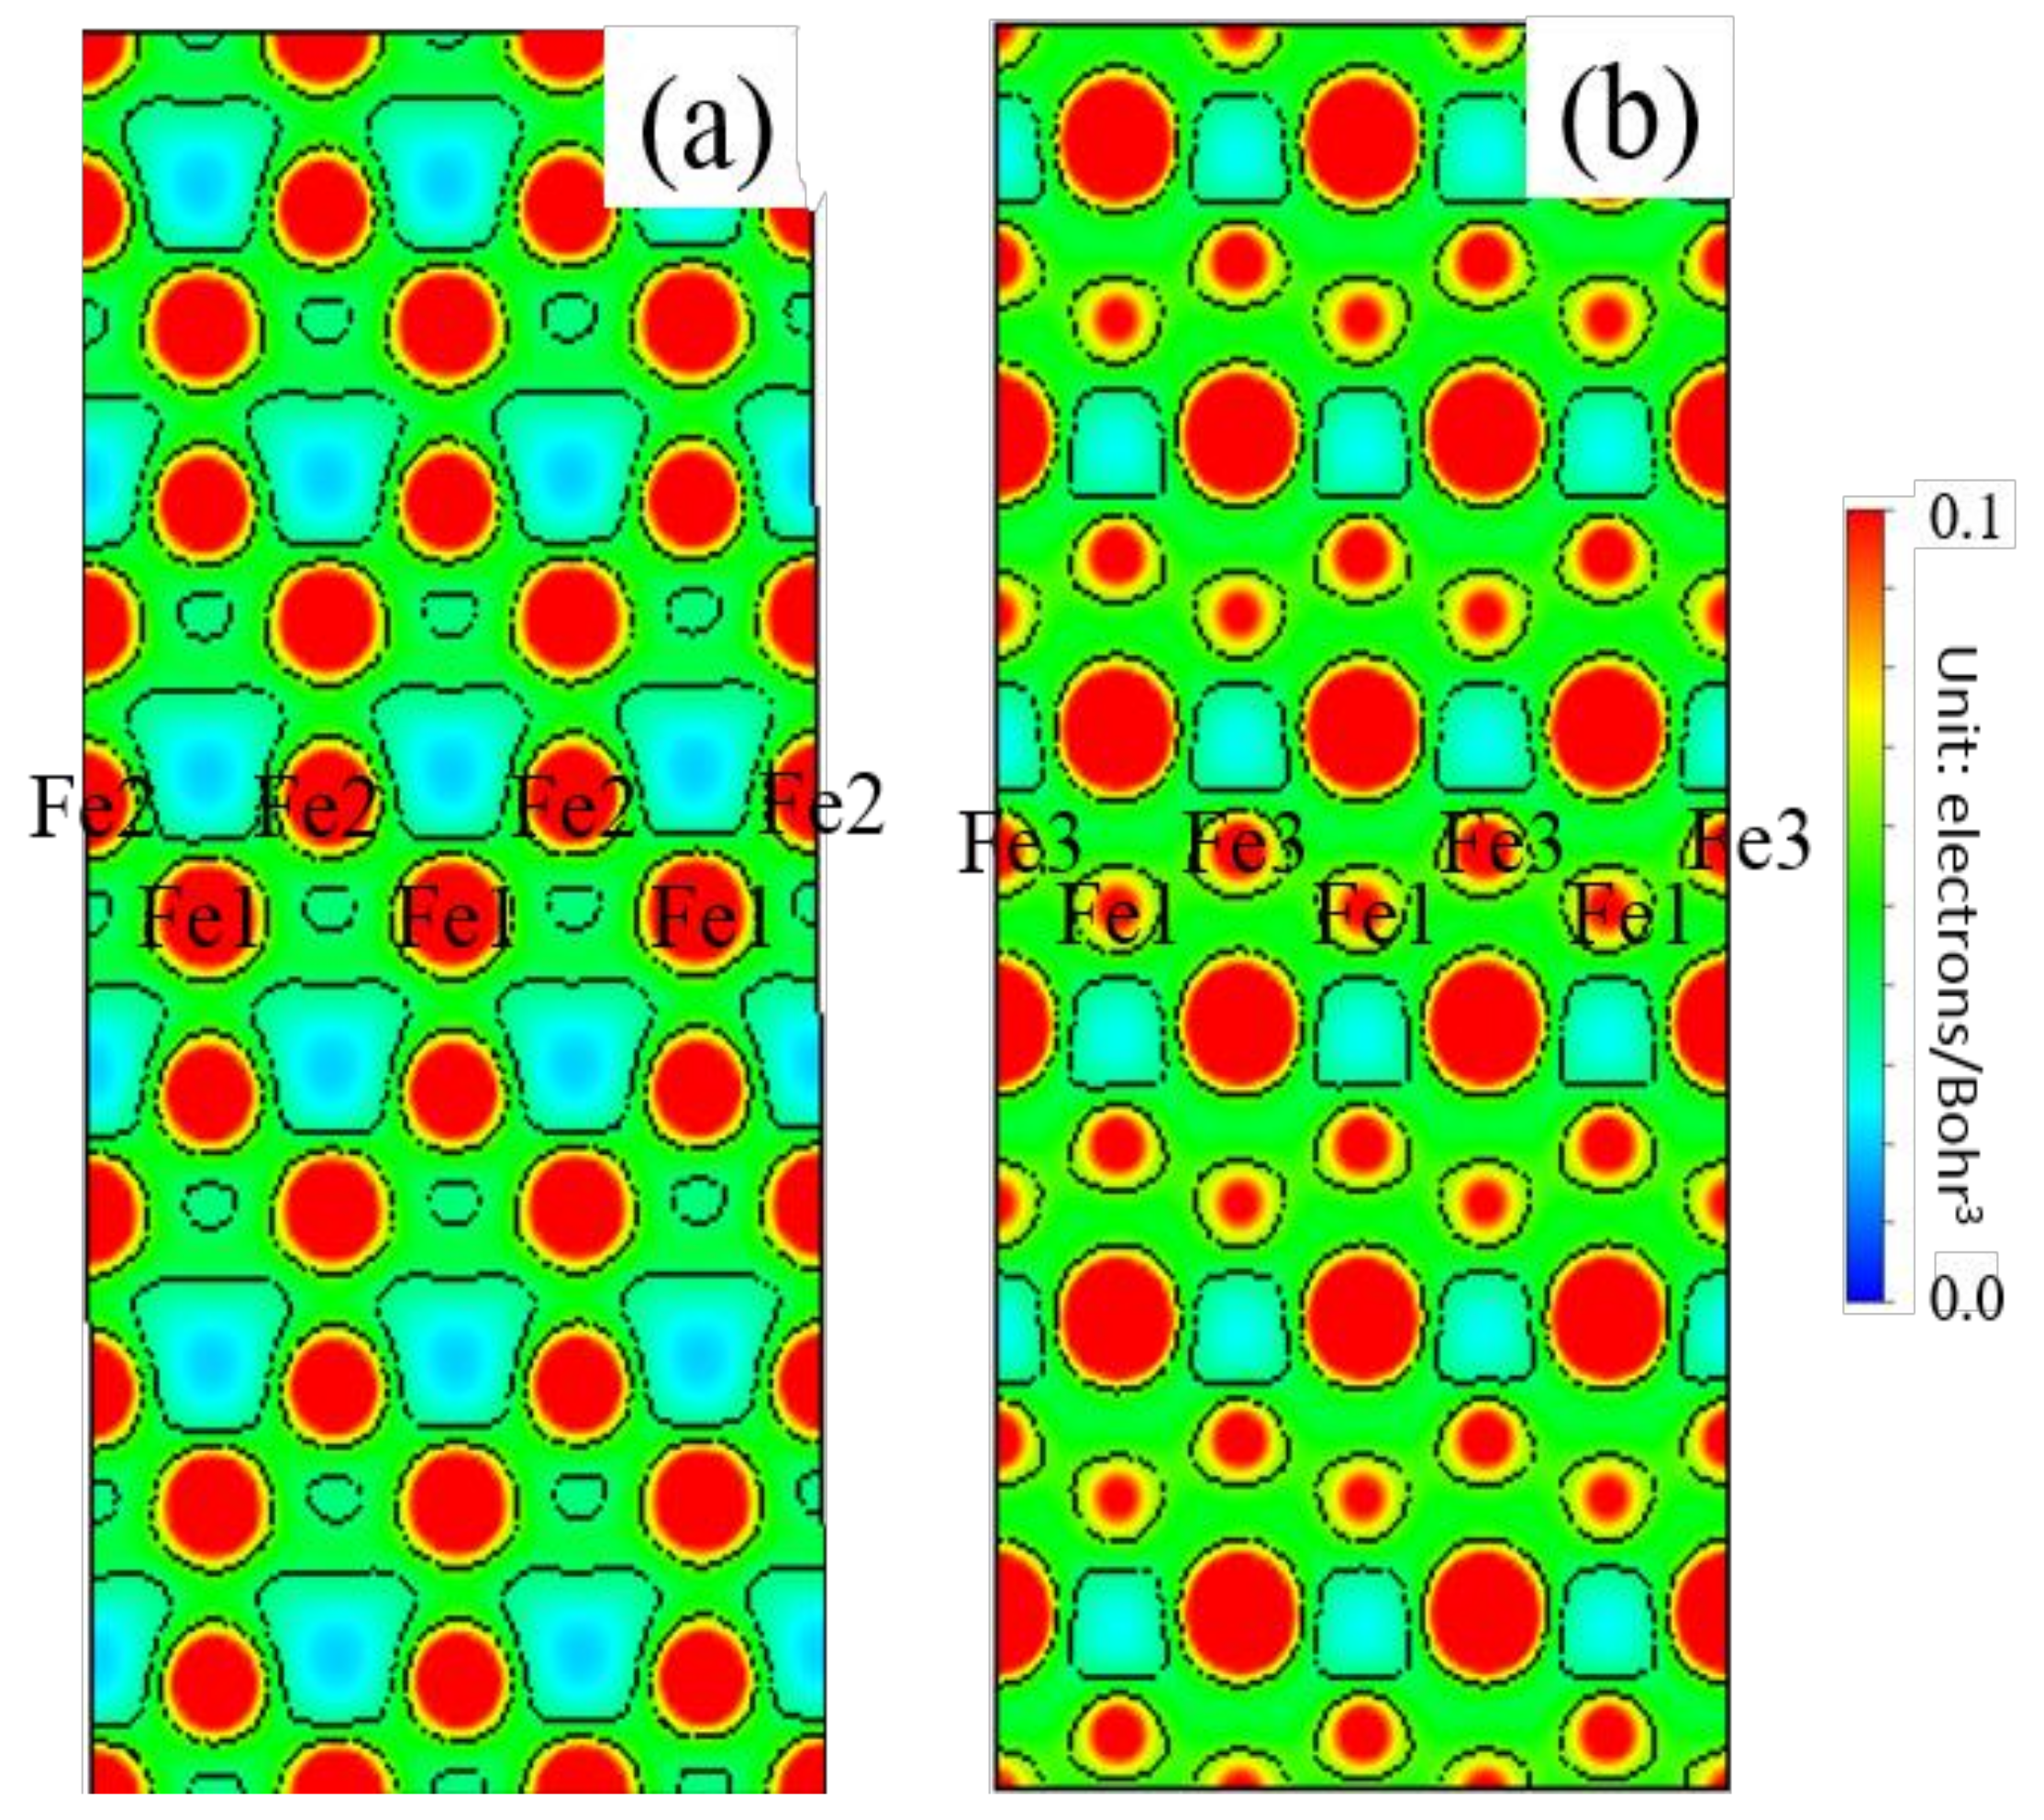
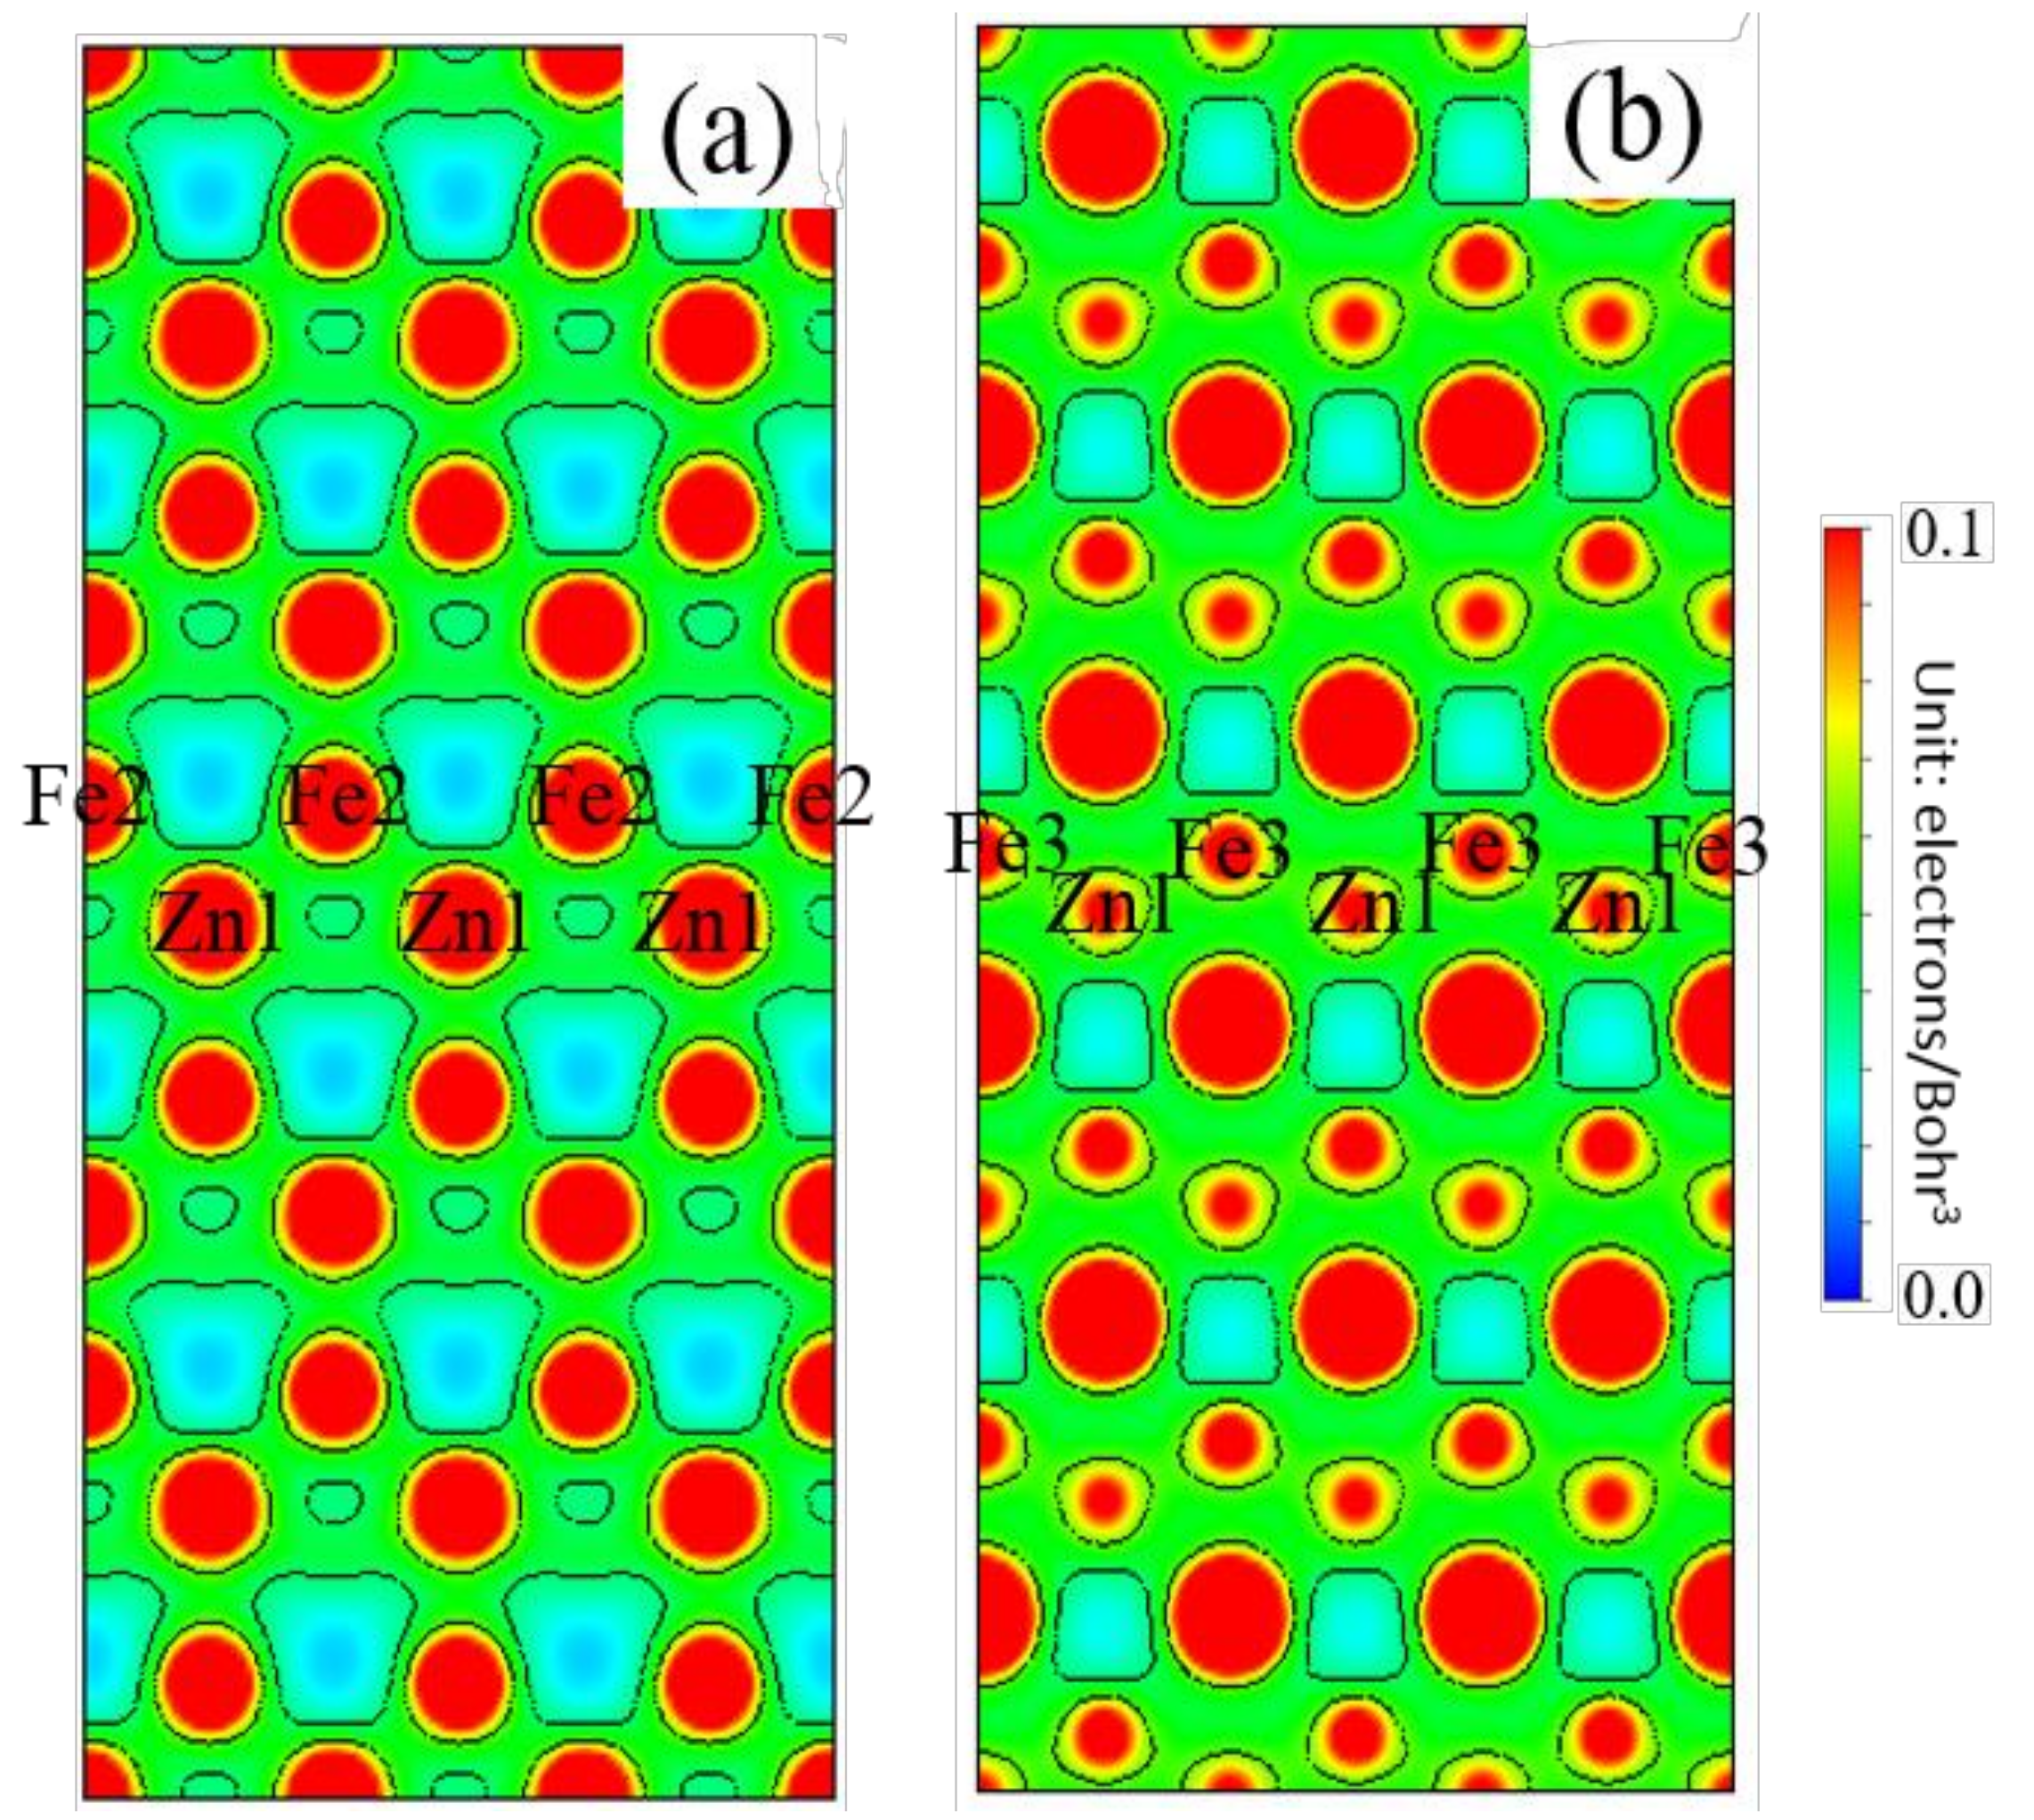
Figure 13, Figure 14 and Figure 15 compare the charge densities of the Fe(1)-Fe(2) and Fe(1)-Fe(3) bonds, Zn(1)-Fe(2) and Zn(1)-Fe(3) bonds, and Ni(1)-Fe(2) and Ni(1)-Fe(3) bonds, which were obtained for the three different models stretched to 0%. The numbers of atomic layers and Fe, Zn, and Ni atoms at the grain boundaries are marked in these figures accordingly. The charge density of the Fe-Ni bonds is lower than that of the Fe-Fe bonds and is slightly higher than the charge density of the Fe-Zn bonds, indicating that the strength of Fe-Ni bonds is lower than that of the Fe-Fe bonds and higher than the strength of the Fe-Zn bonds. The valence electron structures of Fe, Zn, and Ni atoms are 3d64s2, 3d104s2, and 3d84s2, respectively. Although Zn has a larger number of valence electrons than Fe and Ni atoms, its 3d orbital is full and, therefore, does not participate in the bonding process (in fact, only the two electrons of the Zn 4s orbital form bonds with other atoms). Hence, the Fe-Zn bond is weaker than the Fe-Ni and Fe-Fe bonds, and the latter determine the boundary strength. The charge density of the Fe(2)-Fe(–2) bonds at the Zn-doped grain boundary is lower than those of the same bonds at the pure Fe and Zn-Ni co-doped boundaries, which will be explained in more detail below.

3.4. Density of States

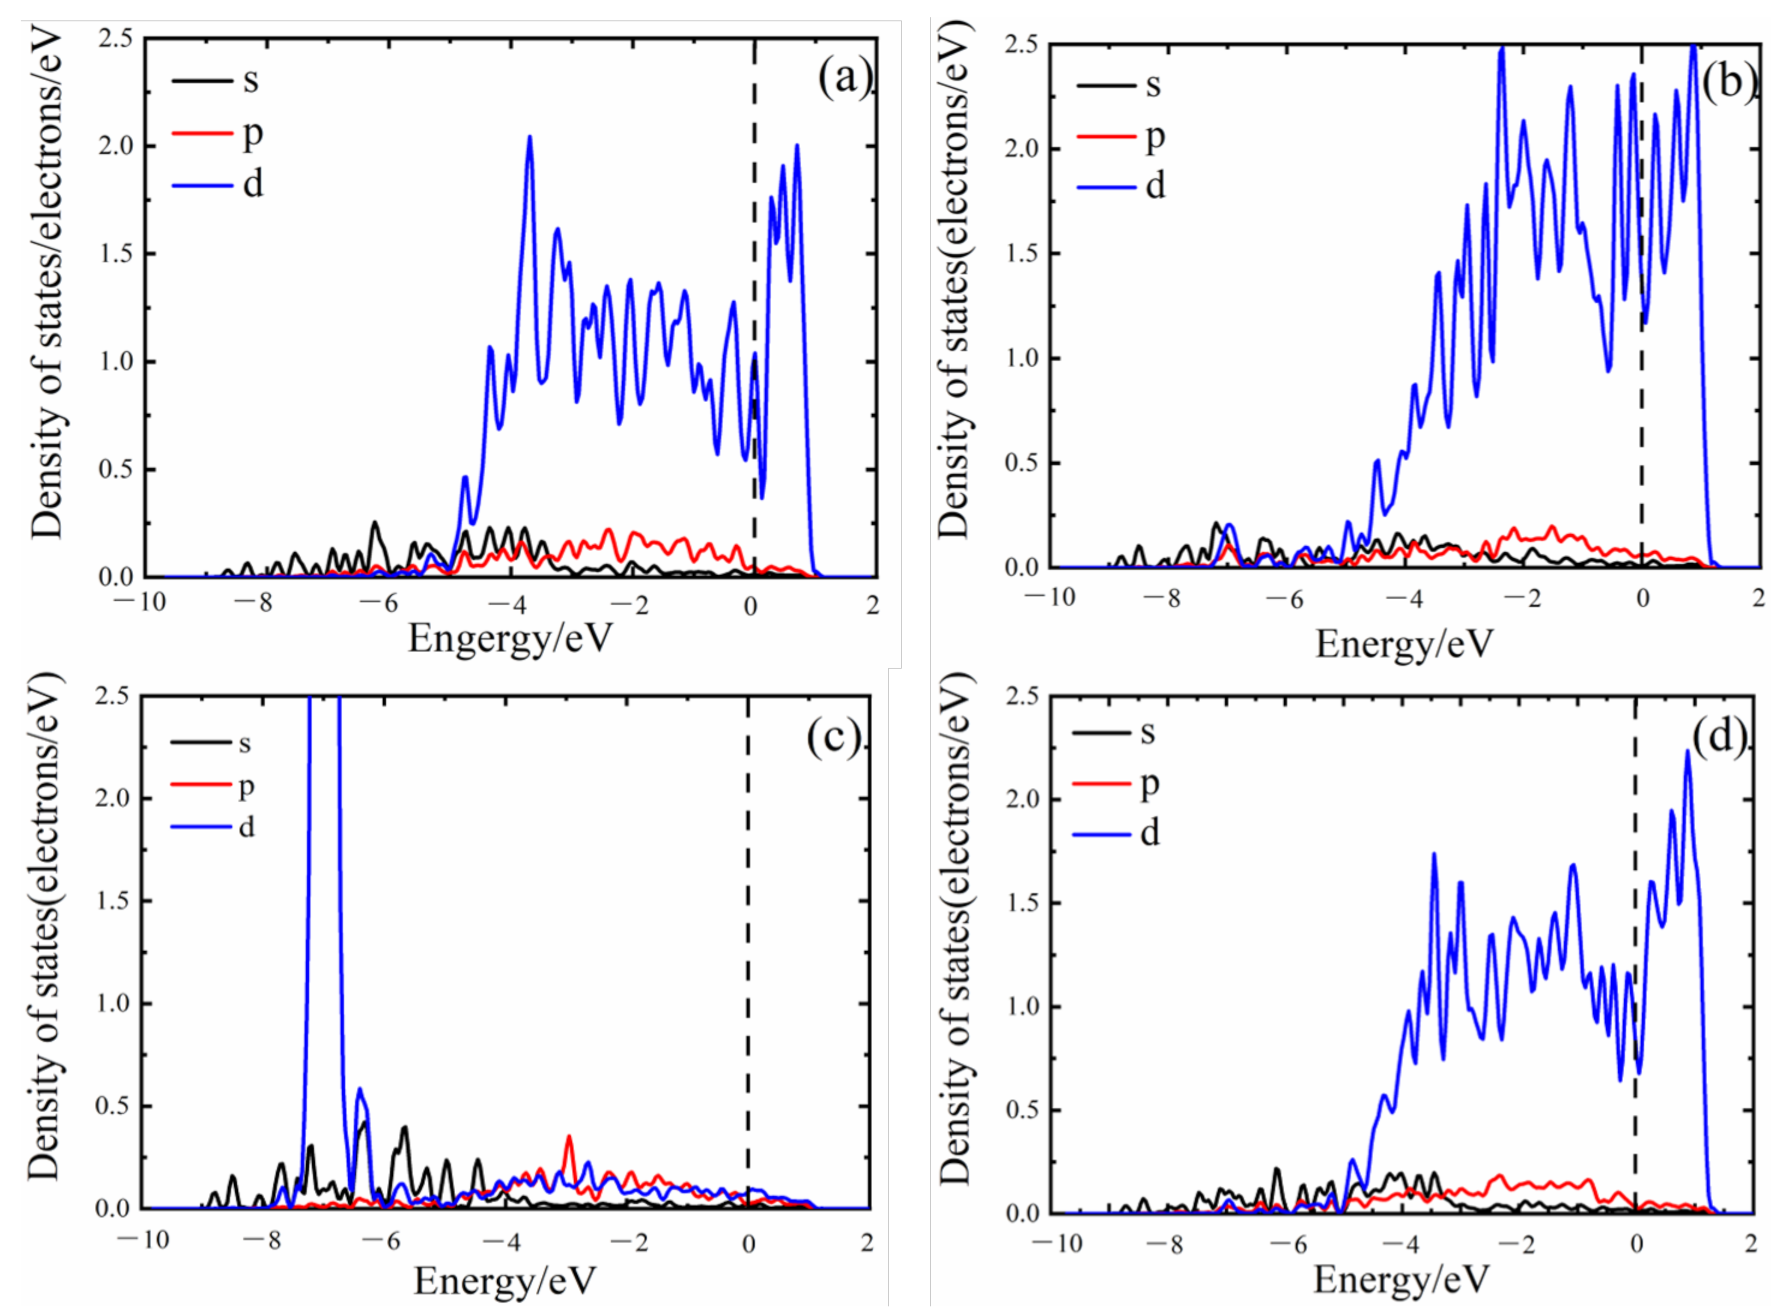
Figure 16 shows the partial wave densities of states of the Fe(2) atoms in the undoped, Zn-doped, and Zn-Ni co-doped Fe grain boundary models stretched to 0%. In the energy region between −4.0 eV and 1.5 eV, the density of states obtained for the d electrons of the Fe(2) atoms in the Zn-doped grain boundary model is higher than that of the d electrons of the Fe(2) atoms in the pure Fe grain boundary model. Hence, the d electrons located between the Fe(2) and Zn(1) atoms at the Zn-doped grain boundary exhibit a hybrid resonance, which increases the density of states, indicating that the chemical bonds formed between these atoms are covalent bonds. One the one hand, the d electrons of the Fe(2) atoms at the Zn-doped grain boundary are more localized than the d electrons of the Fe(2) atoms in the undoped Fe grain boundary model. On the other hand, the d electrons of the Fe(2) and Zn(1) atoms in the Zn-doped grain boundary model produce hybrid peaks at an energy of approximately −7 eV. Because the electron localization and electron hybridization processes are characteristic of covalent bonds, the produced Fe-Zn bonds represent not typical metal bonds, but covalent bonds with covalent properties. However, Ni doping considerably decreases the degree of electronic localization of Fe atoms. In order to describe the nature of Fe-Zn covalent bonding in more detail, a differential charge density map constructed for the Fe(1), Zn(1), and Ni(1) atoms on the (002) planes of the studied grain boundaries is investigated in the next section.

3.5. Differential Charge Density

The differential charge density map is obtained by subtracting bond charge densities from atomic charge densities at the corresponding points. By calculating and analyzing the resulting differential charge densities, it is possible to determine the charge transfer parameters and polarization direction of a particular bond during the bonding and electron coupling processes. In this work, the differential charge density was calculated by the following formula [41]:
ρ = ρ A B ρ A ρ B ,
where ρ AB represents the total charge density after optimizing the AB structure, while ρ A and ρ B are the charge densities of structures A and B, respectively. The last two parameters were subtracted to obtain the charge density changes of A and B after bonding and analyze the charge movements that occurred during this process.
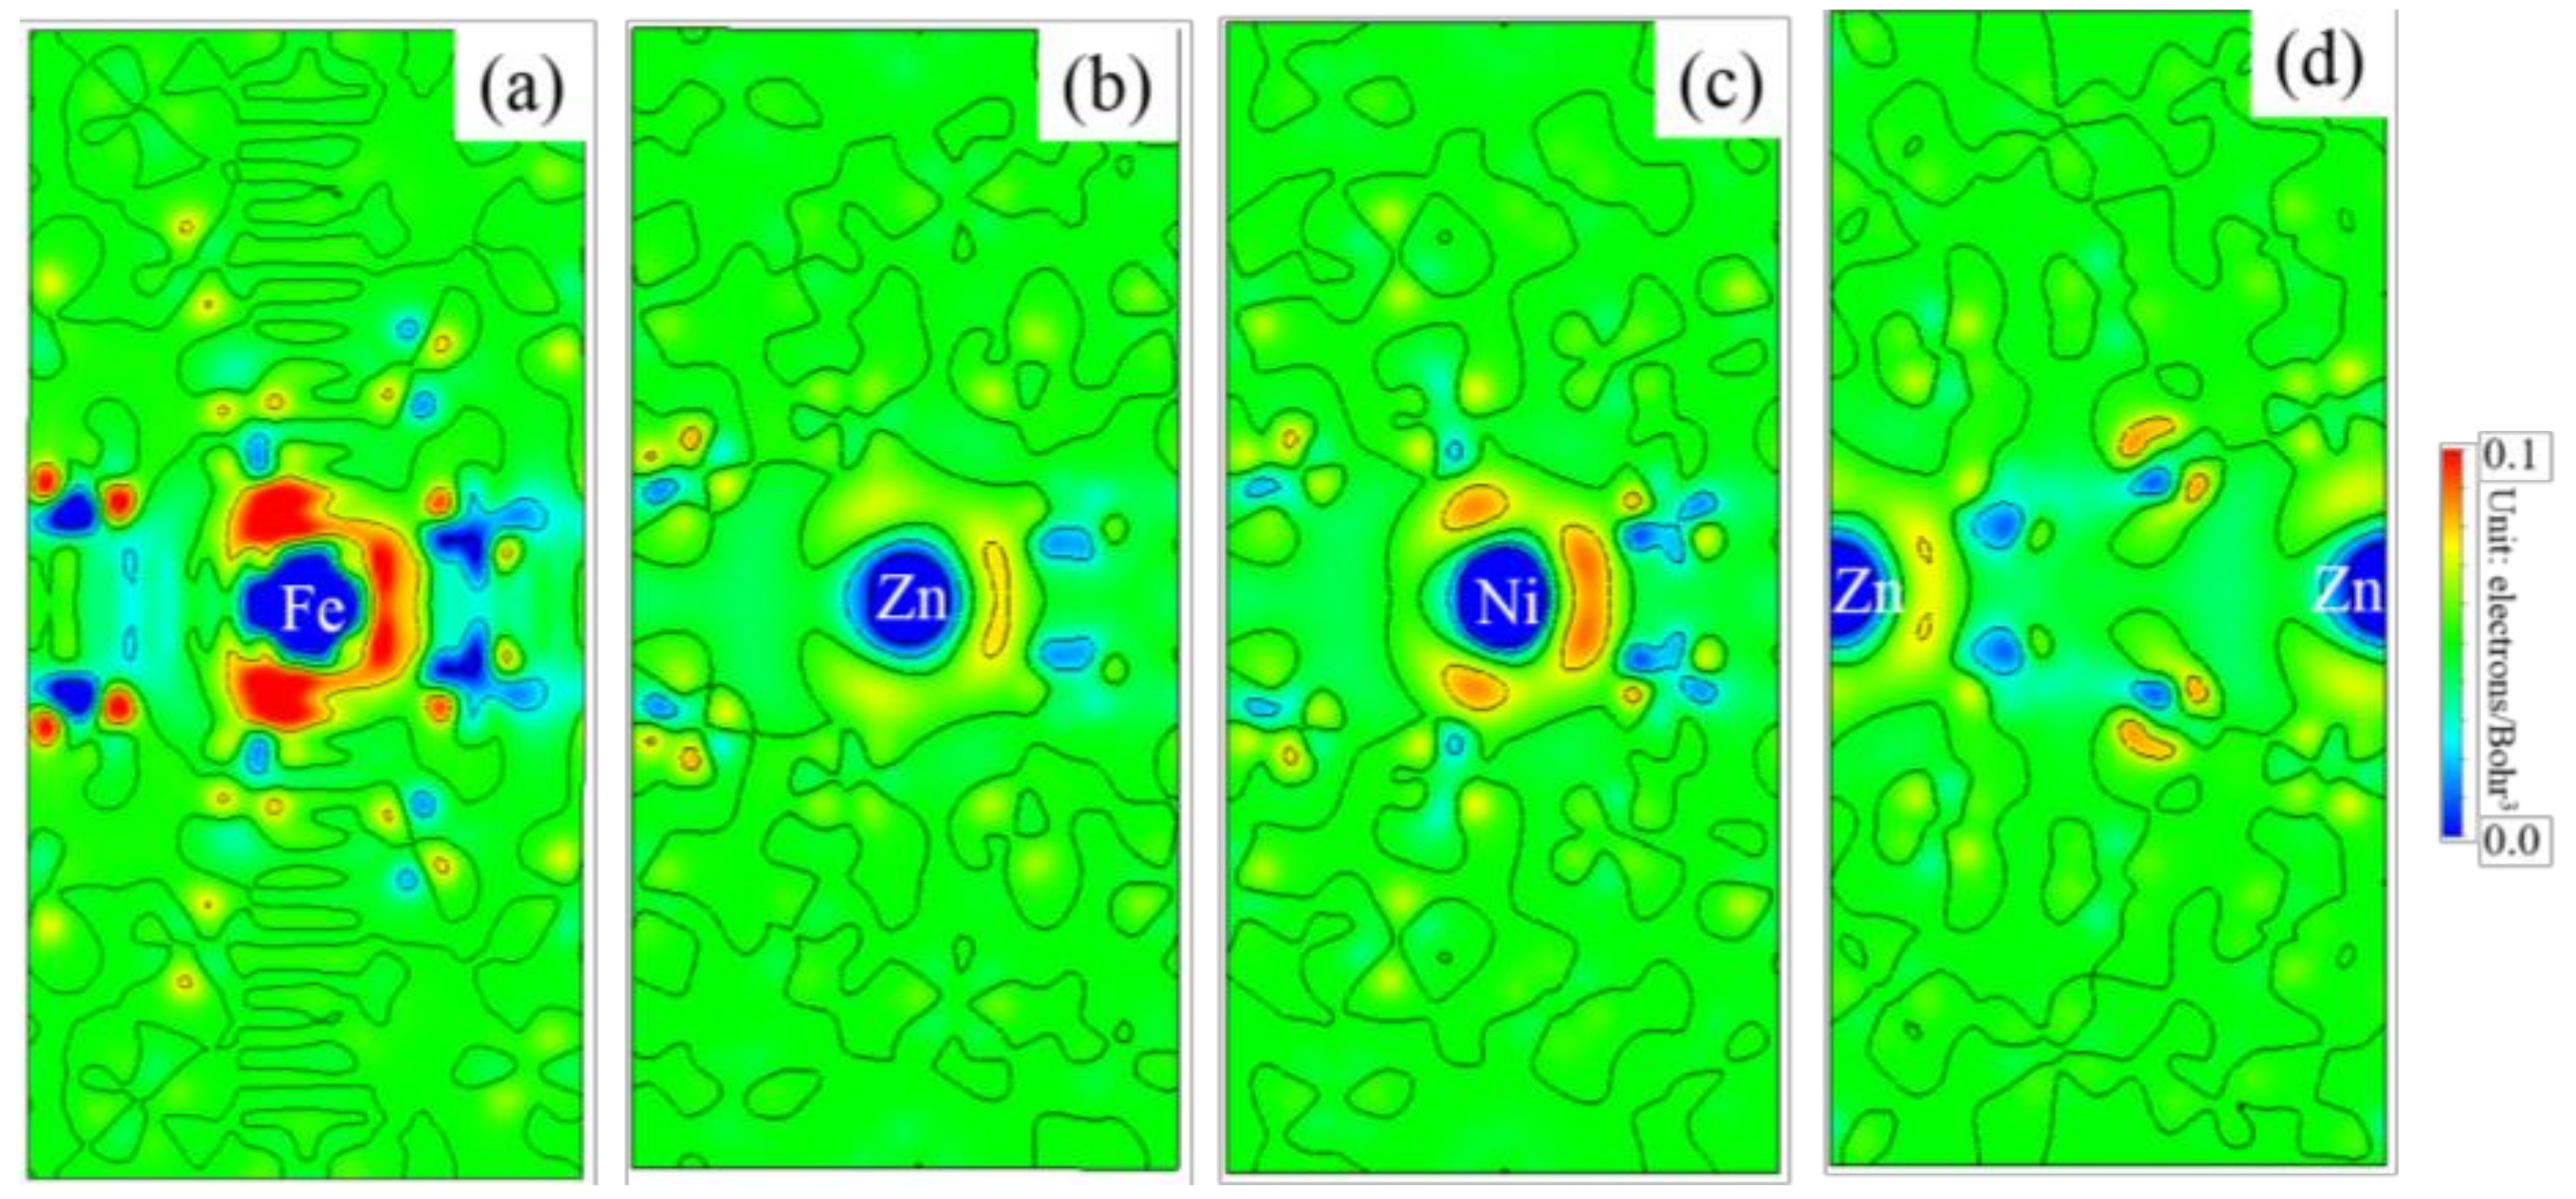
Figure 17 shows the differential charge densities on the (002) plane determined for the Fe(1) atoms at the pure Fe grain boundary, Zn(1) atoms at the Zn-doped grain boundary, and Ni(1) and Zn(1) atoms at the Zn-Ni co-doped grain boundary. The charge accumulations around Fe and Ni atoms are denoted by almost the same colors, indicating the absence of directionality and the metallic nature of their bonds. In contrast, the charges accumulated around Zn atoms are directional (the right yellow charges differ in energy from the upper and lower yellow charges, suggesting the formation of covalent bonds). After Ni addition, the directionality of the accumulated charges around Zn atoms is improved, and the upper, lower, and right yellow charges have almost the same energies. The Fe(1) atoms at the pure Fe grain boundary form metallic bonds with other Fe atoms, leading to charge accumulation. Because metallic bonds are not directional, the accumulated charge is relatively large. The Zn(1) atoms at the Zn-doped grain boundary also form bonds with Fe atoms; however, because these bonds are covalent (and, therefore, directional), the accumulated charge around Zn atoms is relatively small. Finally, the Ni(1) atoms at the Zn-Ni co-doped grain boundary form metallic bonds with Fe atoms, resulting in the charge accumulation around the latter. Because metallic bonds have no directionality, the accumulated charge is relatively large. However, in the same grain boundary model, charge accumulation also occurs between the Fe(2) and Fe(–2) atoms in the Zn-doped areas, and the charge density around Ni(1) atoms is higher than that before the doping. From these results, it can be concluded that the charge accumulated between Fe(2) and Fe(–2) atoms has been transferred to the vicinities of Ni(1) atoms.
In general, after the zinc doping of the Fe grain boundary, its mechanical properties deteriorate, leading to premature cracking. This phenomenon is caused by the grain boundary expansion accompanied by the weakening of Fe(2)-Fe(–2) bonds, which in turn embrittles the boundary. When Ni atoms replace Zn atoms in the Zn-doped Fe grain boundary, its mechanical properties improve, and the cracking process is suppressed because Ni-Fe metallic bonds are stronger than Fe-Zn covalent bonds.

4. Conclusions

After the Zn-Ni co-doping of the Fe grain boundary, Ni atoms form metallic bonds with Fe atoms, thus increasing both the charge density of Fe-Fe bonds (as compared with that of the Fe-Fe bonds at the Zn-doped grain boundary). The produced Fe-Ni bonds are stronger than Fe-Zn bonds, suggesting that Ni addition can inhibit the fracture of the fcc Fe grain boundary.
In this study, the main reasons for the liquid zinc-induced embrittlement and its subsequent suppression process are identified, and first-principles calculations are performed to determine the influences of Zn doping and Zn-Ni co-doping on the properties of the Σ5 [001] (210) 53.6° fcc Fe grain boundary. From the obtained results, the following conclusions have been drawn:
  • EBSD was used to establish an appropriate grain boundary model to further explain the brittle fracture induced by liquid zinc.
  • Because the sizes of Zn and Fe atoms are not the same, doping the pure Fe grain boundary leads to its expansion, which increases the lengths of Fe-Fe bonds, leading to their weakening, and reduces the overall boundary strength.
  • The Zn doping of the grain boundary results in the formation of Zn-Fe covalent bonds, which decrease the charge density of Fe-Fe bonds and weakens them. Meanwhile, the Fe-Zn bonds are oriented at a certain angle with respect to the grain boundary direction and possess very low strengths. After the weakened Fe-Fe bonds are broken, the strength of the grain boundary drops significantly.
  • After the Zn-Ni co-doping of the grain boundary, Ni atoms form metallic bonds with Fe atoms, which increase the charge density and strength of Fe-Fe bonds with respect to that of the Fe-Fe bonds in the Zn-doped grain boundary.
  • The Fe-Ni bonds at the Zn-Ni co-doped grain boundary are stronger than the Fe-Zn bonds and, therefore, can potentially suppress the fcc Fe grain boundary fracture.

Author Contributions

C.D.: Writing—original draft. W.P.: Investigation. Z.M.: Formal analysis. Y.Z.: Funding acquisition, Methodology. H.T.: Resources. G.W.: Funding acquisition, Methodology, Project administration, Supervision, Writing—review & editing. All authors have read and agreed to the published version of the manuscript.

Funding

This research was funded by National Natural Science Foundation of China (Grant Nos. 51771226); Science and Technology Committee of Shanghai (Grant No. 21ZR1423600) and Central Government Guides the Development of Local Science and Technology Special Fund of China (Grant No. 216Z1004G).

Data Availability Statement

Data presented in this article is available on request from the corresponding author.

Acknowledgments

The author Zhao would like to thank the support from National Natural Science Foundation of China (Grant Nos. 51771226) and author Wu would like to thank the support from the Science and Technology Committee of Shanghai (Grant No. 21ZR1423600) and Central Government Guides the Development of Local Science and Technology Special Fund of China (Grant No. 216Z1004G).

Conflicts of Interest

The authors declared that they have no conflict of interest to this work. We declare that we do not have any commercial or associative interests that represent a conflict of interest in connection with the work submitted.

References

  1. Drillet, P.; Grigorieva, R.; Leuillier, G.; Vietoris, T. Study of cracks propagation inside the steel on press hardened steel zinc based coatings. La Metall. Ital. 2012. [Google Scholar] [CrossRef] [Green Version]
  2. Kondratiuk, J.; Kuhn, P.; Labrenz, E.; Bischoff, C. Zinc coatings for hot sheet metal forming: Comparison of phase evolution and microstructure during heat treatment. Surf. Coat. Technol. 2011, 205, 4141–4153. [Google Scholar] [CrossRef]
  3. Lee, C.W.; Choi, W.S.; Cho, L.; Cho, Y.R.; De Cooman, B.C. Liquid-metal-induced embrittlement related microcrack propagation on Zn-coated press hardening steel. ISIJ Int. 2015, 55, 264–271. [Google Scholar] [CrossRef] [Green Version]
  4. Lee, C.W.; Fan, D.W.; Sohn, I.R.; Lee, S.J.; De Cooman, B.C. Liquid-metal-induced embrittlement of Zn-coated hot stamping steel. Metall. Mater. Trans. A 2012, 43, 5122–5127. [Google Scholar] [CrossRef] [Green Version]
  5. Peng, H.; Peng, W.; Lu, R.; Wu, G.; Zhang, J. Diffusion and cracking behavior involved in hot press forming of Zn coated 22MnB5. J. Alloys Compd. 2019, 806, 195–205. [Google Scholar] [CrossRef]
  6. Chang, J.K.; Lin, C.S.; Wang, W.R.; Cheng, W.J. Microstructural evaluation and property change of 5 wt pct Al-Zn coating on press hardening steel during austenitization. Metall. Mater. Trans. A 2018, 49, 3715–3728. [Google Scholar] [CrossRef]
  7. Chang, J.K.; Lin, C.S. Microstructural Evolution of 11Al-3Mg-Zn Ternary Alloy-Coated Steels During Austenitization Heat Treatment. Metall. Mater. Trans. A Phys. Metall. Mater. Sci. 2017, 48, 3734–3744. [Google Scholar] [CrossRef]
  8. Schino, A. Di Manufacturing and Applications of Stainless Steels. Metals 2020, 10, 327. [Google Scholar] [CrossRef] [Green Version]
  9. Bauer, K.D.; Todorova, M.; Hingerl, K.; Neugebauer, J. A first principles investigation of zinc induced embrittlement at grain boundaries in bcc iron. Acta Mater. 2015, 90, 69–76. [Google Scholar] [CrossRef]
  10. Miyazawa, N.; Hakamada, M.; Mabuchi, M. Atomic bond-breaking behaviour during grain boundary fracture in a C-segregated Fe grain boundary. Philos. Mag. Lett. 2017, 97, 311–319. [Google Scholar] [CrossRef] [Green Version]
  11. Lu, G.H.; Deng, S.; Wang, T.; Kohyama, M.; Yamamoto, R. Theoretical tensile strength of an Al grain boundary. Phys. Rev. B 2004, 69, 134106. [Google Scholar] [CrossRef]
  12. Lu, G.H.; Zhang, Y.; Deng, S.; Wang, T.; Kohyama, M.; Yamamoto, R.; Liu, F.; Horikawa, K.; Kanno, M. Origin of intergranular embrittlement of Al alloys induced by Na and Ca segregation: Grain boundary weakening. Phys. Rev. B 2006, 73, 224115. [Google Scholar] [CrossRef] [Green Version]
  13. Zhang, Y.; Lu, G.H.; Wang, T.; Deng, S.; Kohyama, M.; Yamamoto, R. Effects of segregated Ga on an Al grain boundary: A first-principles computational tensile test. Mater. Trans. 2006, 47, 2678–2681. [Google Scholar] [CrossRef] [Green Version]
  14. Yuasa, M.; Mabuchi, M. Bond mobility mechanism in grain boundary embrittlement: First-principles tensile tests of Fe with a P-segregated Σ 3 grain boundary. Phys. Rev. B 2010, 82, 94108. [Google Scholar] [CrossRef]
  15. Yuasa, M.; Mabuchi, M. Effects of segregated Cu on an Fe grain boundary by first-principles tensile tests. J. Phys. Condens. Matter 2010, 22, 505705. [Google Scholar] [CrossRef]
  16. Nyyssönen, T.; Isakov, M.; Peura, P.; Kuokkala, V.T. Iterative determination of the orientation relationship between austenite and martensite from a large amount of grain pair misorientations. Metall. Mater. Trans. A 2016, 47, 2587–2590. [Google Scholar] [CrossRef]
  17. Hutchinson, B.; Hagström, J.; Karlsson, O.; Lindell, D.; Tornberg, M.; Lindberg, F.; Thuvander, M. Microstructures and hardness of as-quenched martensites (0.1–0.5% C). Acta Mater. 2011, 59, 5845–5858. [Google Scholar] [CrossRef]
  18. Ryde, L. Application of EBSD to analysis of microstructures in commercial steels. Mater. Sci. Technol. 2006, 22, 1297–1306. [Google Scholar] [CrossRef]
  19. Razmpoosh, M.H.; Macwan, A.; Biro, E.; Chen, D.L.; Peng, Y.; Goodwin, F.; Zhou, Y. Liquid metal embrittlement in laser beam welding of Zn-coated 22MnB5 steel. Mater. Des. 2018, 155, 375–383. [Google Scholar] [CrossRef]
  20. Martin, S.; Wolf, S.; Martin, U.; Krüger, L.; Rafaja, D. Deformation mechanisms in austenitic TRIP/TWIP steel as a function of temperature. Metall. Mater. Trans. A 2016, 47, 49–58. [Google Scholar] [CrossRef] [Green Version]
  21. Kim, J.; Estrin, Y.; De Cooman, B.C. Application of a dislocation density-based constitutive model to Al-alloyed TWIP steel. Metall. Mater. Trans. A 2013, 44, 4168–4182. [Google Scholar] [CrossRef] [Green Version]
  22. Razmpoosh, M.H.; Biro, E.; Chen, D.L.; Goodwin, F.; Zhou, Y. Liquid metal embrittlement in laser lap joining of TWIP and medium-manganese TRIP steel: The role of stress and grain boundaries. Mater. Charact. 2018, 145, 627–633. [Google Scholar] [CrossRef]
  23. Bhattacharya, D.; Cho, L.; Van der Aa, E.; Ghassemi-Armaki, H.; Pichler, A.; Findley, K.O.; Speer, J.G. Transgranular cracking in a liquid Zn embrittled high strength steel. Scr. Mater. 2020, 175, 49–54. [Google Scholar] [CrossRef]
  24. Li, Y.; Han, C.; Zhang, C.; Jia, K.; Han, P.; Wu, X. Effects of alloying on the behavior of B and S at Σ5 (2 1 0) grain boundary in γ-Fe. Comput. Mater. Sci. 2016, 115, 170–176. [Google Scholar] [CrossRef] [Green Version]
  25. Kresse, G.; Hafner, J. Ab initio molecular dynamics for liquid metals. Phys. Rev. B 1993, 47, 558. [Google Scholar] [CrossRef]
  26. Peng, W.; Peng, H.; Wu, G.; Zhang, J. Effect of zinc-doping on tensile strength of Σ5 bcc Fe symmetric tilt grain boundary. Comput. Mater. Sci. 2020, 171, 109204. [Google Scholar] [CrossRef]
  27. Bhattacharya, D.; Cho, L.; Van Der Aa, E.; Pichler, A.; Pottore, N.; Ghassemi-Armaki, H.; Findley, K.O.; Speer, J.G. Influence of the starting microstructure of an advanced high strength steel on the characteristics of Zn-Assisted liquid metal embrittlement. Mater. Sci. Eng. A 2021, 804, 140391. [Google Scholar] [CrossRef]
  28. Cho, L.; Kang, H.; Lee, C.; De Cooman, B.C. Microstructure of liquid metal embrittlement cracks on Zn-coated 22MnB5 press-hardened steel. Scr. Mater. 2014, 90, 25–28. [Google Scholar] [CrossRef]
  29. Kang, H.; Cho, L.; Lee, C.; De Cooman, B.C. Zn penetration in liquid metal embrittled TWIP steel. Metall. Mater. Trans. A 2016, 47, 2885–2905. [Google Scholar] [CrossRef]
  30. Kresse, G.; Furthmüller, J. Efficient iterative schemes for ab initio total-energy calculations using a plane-wave basis set. Phys. Rev. B 1996, 54, 11169. [Google Scholar] [CrossRef]
  31. Perdew, J.P.; Burke, K.; Ernzerhof, M. Generalized gradient approximation made simple. Phys. Rev. Lett. 1996, 77, 3865. [Google Scholar] [CrossRef] [PubMed] [Green Version]
  32. Kresse, G.; Furthmüller, J. Efficiency of ab-initio total energy calculations for metals and semiconductors using a plane-wave basis set. Comput. Mater. Sci. 1996, 6, 15–50. [Google Scholar] [CrossRef]
  33. Ramíarez, R.; Böhm, M.C. Simple geometric generation of special points in brillouin-zone integrations. Two-dimensional bravais lattices. Int. J. Quantum Chem. 1986, 30, 391–411. [Google Scholar] [CrossRef]
  34. Perdew, J.P.; Chevary, J.A.; Vosko, S.H.; Jackson, K.A.; Pederson, M.R.; Singh, D.J.; Fiolhais, C. Atoms, molecules, solids, and surfaces: Applications of the generalized gradient approximation for exchange and correlation. Phys. Rev. B 1992, 46, 6671. [Google Scholar] [CrossRef] [PubMed]
  35. Makov, G.; Shah, R.; Payne, M.C. Periodic boundary conditions in ab initio calculations. II. Brillouin-zone sampling for aperiodic systems. Phys. Rev. B 1996, 53, 15513. [Google Scholar] [CrossRef]
  36. Blöchl, P.E. Projector augmented-wave method. Phys. Rev. B 1994, 50, 17953. [Google Scholar] [CrossRef] [Green Version]
  37. Monkhorst, H.J.; Pack, J.D. Special points for Brillouin-zone integrations. Phys. Rev. B 1976, 13, 5188. [Google Scholar] [CrossRef]
  38. Basinski, Z.S.; Hume-Rothery, W.; Sutton, A.L. The lattice expansion of iron. Proc. R. Soc. Lond. Ser. A Math. Phys. Sci. 1955, 229, 459–467. [Google Scholar]
  39. Zhang, Y.; Lu, G.-H.; Deng, S.; Wang, T.; Xu, H.; Kohyama, M.; Yamamoto, R. Weakening of an aluminum grain boundary induced by sulfur segregation: A first-principles computational tensile test. Phys. Rev. B 2007, 75, 174101. [Google Scholar] [CrossRef]
  40. Nielsen, O.H.; Martin, R.M. Quantum-mechanical theory of stress and force. Phys. Rev. B 1985, 32, 3780. [Google Scholar] [CrossRef]
  41. Sun, S.N.; Kioussis, N.; Lim, S.P.; Gonis, A.; Gourdin, W.H. Impurity effects on atomic bonding in Ni 3 Al. Phys. Rev. B 1995, 52, 14421. [Google Scholar] [CrossRef] [PubMed]
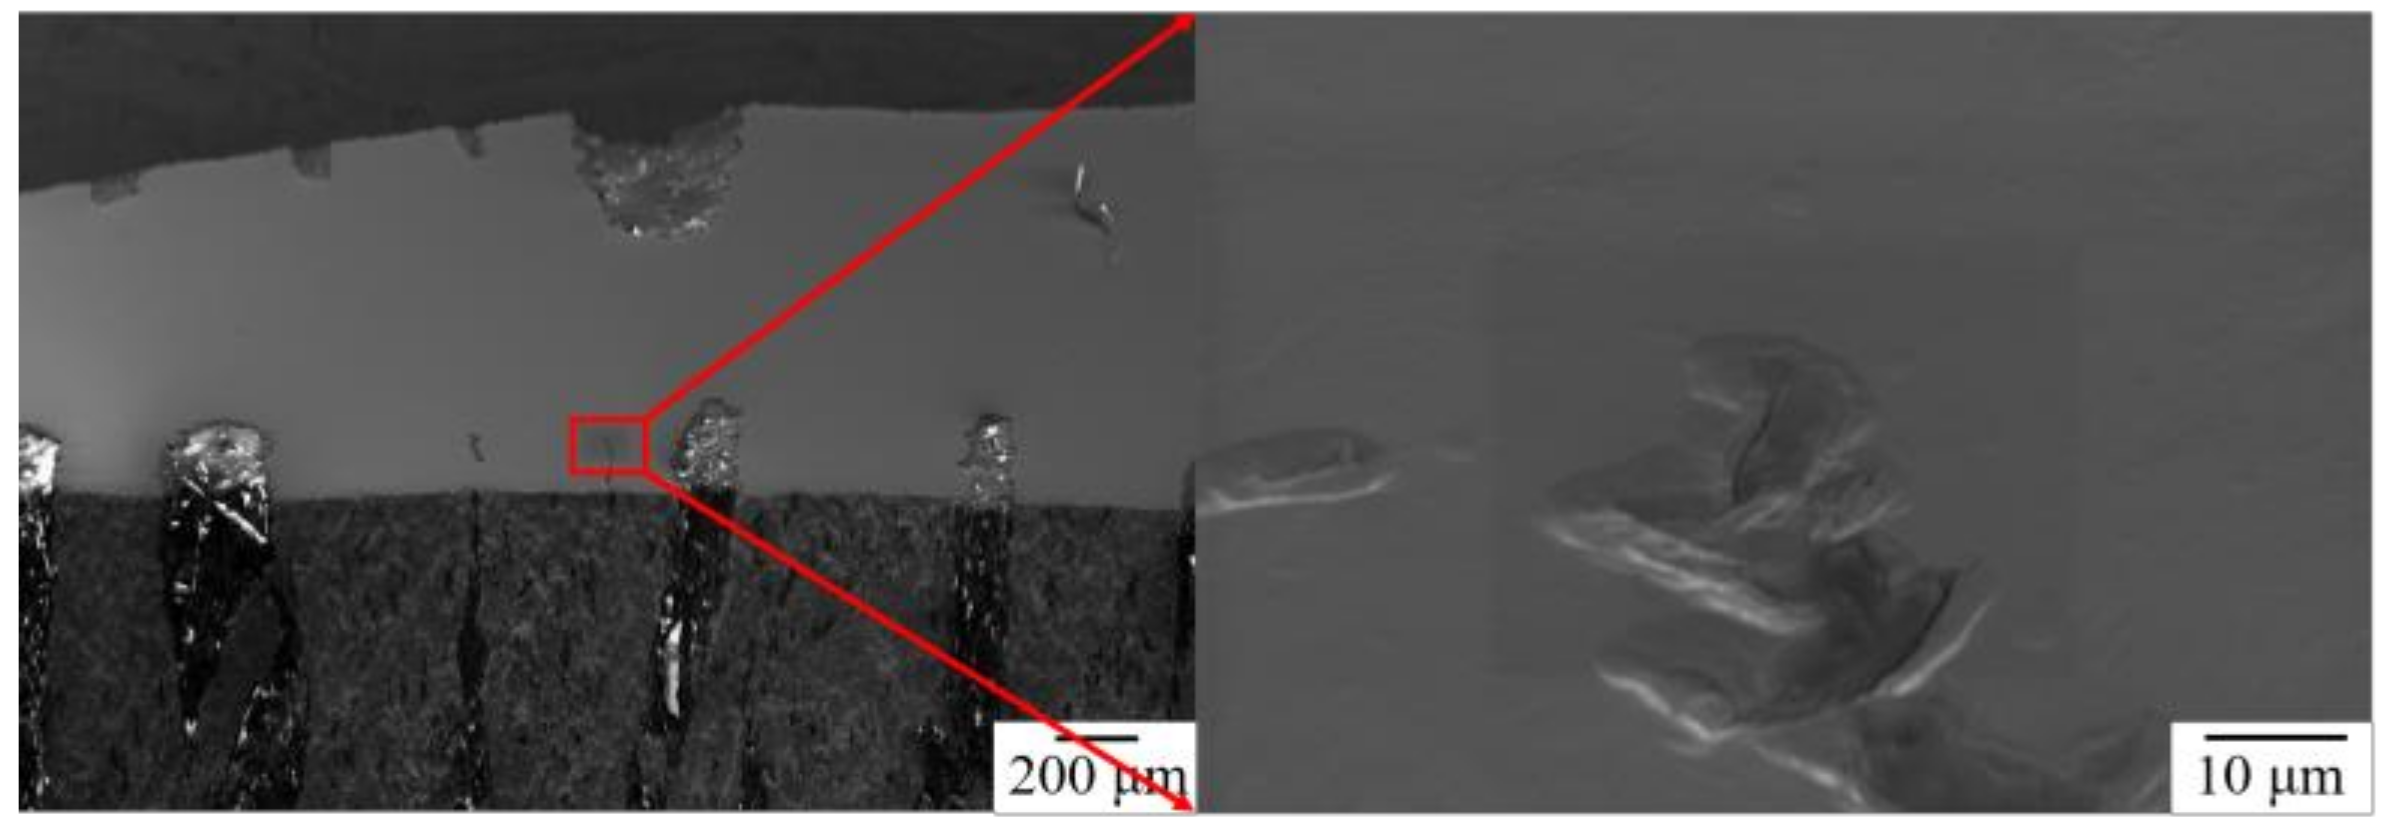
Figure 1. Analysis region of electron backscattering diffraction (EBSD).
Metals 12 00027 g001
Figure 2. EBSD grain boundary analysis results: (a) morphology of grain, (b) phase proportion, (c) coincidence lattice GB, and (d) misorientation of grain boundary at positions 1 and 2 in (c).
Metals 12 00027 g002
Figure 3. Fcc Fe Σ5 [001] (210) 53.6° symmetric tilt grain boundary model, GB (Grain Boundary) is grain boundary surface of the GB model, a total contains two layers of GB surface, the size of initial super cell of GB model is 3.44900 × 7.71210 × 15.42420 Å3.
Metals 12 00027 g003
Figure 4. Grain boundary model based on the fcc Fe Σ5 [001] (210) 53.6° symmetric tilt boundary model of Figure 3: (a) Undoped GB, (b) Zn-doped GB, and (c) Zn-Ni co-doped GB.
Metals 12 00027 g004
Figure 5. GB model of Ni atom at different sites: (a) The central position of the Ni atom, (b) Position of Ni atom on edge.
Metals 12 00027 g005
Figure 6. Interlayer spacing of grain boundary before and after doping Zn and Ni: (a) Undoped GB, (b) Zn-doped GB, and (c) Zn-Ni co-doped GB.
Metals 12 00027 g006
Figure 7. Relationship of total energy with strain of different GB.
Metals 12 00027 g007
Figure 8. Stress-strain curve calculated by first-principles.
Metals 12 00027 g008
Figure 9. Grain boundaries under different strains: (a) Undoped GB, (b) Zn-doped GB, and (c) Zn-Ni co-doped GB.
Metals 12 00027 g009
Figure 10. Chemical bond structures of Fe-Fe, Fe-Zn and Ni-Fe bonds in different GB models: (a) Undoped GB, (b) Zn-doped GB, and (c) Zn-Ni co-doped GB, unit: Å.
Metals 12 00027 g010
Figure 11. Variation of bond length of Fe-Fe, Fe-Zn and Ni-Fe bonds in the GB model at different strain: (a) Fe(2)-Fe(–2) bond of undoped GB, Zn-doped GB, and Zn-Ni co-doped GB, (b) Fe(1)-Fe(3) bond of undoped GB, Zn(1)-Fe(3) bond of Zn-doped GB and Zn-Ni co-doped GB, (c) Fe(1)-Fe(2) bond of undoped GB, Zn(1)-Fe(2) bond of Zn-doped GB, Ni(1)-Fe(2) bond Zn-Ni co-doped GB.
Metals 12 00027 g011
Figure 12. Charge distribution of Fe(2)-Fe(–2) bond on (002) plane under different strains: (a) Undoped GB, (b) Zn-doped GB, and (c) Zn-Ni co-doped GB.
Metals 12 00027 g012
Figure 13. Charge distribution of (a) Fe(1)-Fe(2) bond and (b) Fe(1)-Fe(3) bond on (002) plane of undoped GB at 0% stain.
Metals 12 00027 g013
Figure 14. Charge distribution of (a) Zn(1)-Fe(2) bond and (b) Zn(1)-Fe(3) bond on (002) plane of Zn-doped GB at 0% stain.
Metals 12 00027 g014
Figure 15. Charge distribution of (a) Ni(1)-Fe(2) bond and (b) Ni(1)-Fe(3) bond on (002) plane of Zn-Ni co-doped GB at 0% stain.
Metals 12 00027 g015
Figure 16. Partial Density of States: (a) Fe(2) atom in undoped GB, (b) and (c) Fe(2) and Zn(1) atom in Zn-doped GB, and (d) Fe(2) atom in Zn-Ni co-doped GB.
Metals 12 00027 g016
Figure 17. (a) Differential charge of Fe(1) atom on (100) plane of undoped GB, (b) Differential charge of Zn(1) atom on (100) plane of Zn-doped GB, (c) Differential charge of Ni(1) atom on (100) plane of Zn-Ni co-doped GB, and (d) Differential charge of Zn(1) atom on (100) plane of Zn-Ni co-doped GB.
Metals 12 00027 g017
Table 1. The total free energy of grain boundaries at different sites of Ni atom.
SiteSite 1Site 2
Total Free Energy/eV−305.129−305.128
Publisher’s Note: MDPI stays neutral with regard to jurisdictional claims in published maps and institutional affiliations.