
Enhancing the Lifetime of the Pneumatic Cylinder in Automatic Assembly Line Subjected to Repeated Pressure Loading


1
Manufacturing Technology, Mechanical Technology Faculty, Ethiopian Technical University, Addis Ababa P.O. Box 190310, Ethiopia
2
Department of Mechanical Engineering, School of Engineering and Computer Science, Baylor University, Waco, TX 76798-7356, USA
*
Author to whom correspondence should be addressed.
Metals 2022, 12(1), 35; https://doi.org/10.3390/met12010035
Submission received: 29 November 2021
/
Revised: 21 December 2021
/
Accepted: 21 December 2021
/
Published: 24 December 2021
(This article belongs to the Special Issue Advances in Fracture, Fatigue and Structural Integrity Analyses of Metals)
Abstract
:This study demonstrates the application of parametric accelerated life testing (ALT) as a procedure to identify design deficiencies and correct them in generating a reliable quantitative (RQ) specification. It includes: (1) a system BX lifetime that X% of a product population fails with a parametric ALT scheme, (2) fatigue design, (3) ALTs with alternations, and (4) judgement as to whether the design(s) secures the desired BX lifetime. A (generalized) life–stress model through the linear transport process and a sample size formulation are suggested. A pneumatic cylinder in a machine tool was used as a case study. The cylinder was failing in a flexible manufacturing system. To reproduce the failure and modify the design, a parametric ALT was performed. At the first ALT, the metal seal made of nickel-iron alloy (36% Ni) partially cracked and chipped and had a crisp metal sound. It was modified by changing the seal from a metal to a polymer (silicone rubber). At the second ALT, the piston seal leaked due to seal hardening and wear. The failure modes of the silicone seal in the laboratory tests were similar to those returned from the field. For the third ALT, the seal material was changed from silicone rubber to (thermoset) polyurethane. There were no concerns during the third ALT and the lifetime of the pneumatic cylinder was shown to have a B1 life of 10 years.
1. Introduction
Because of competitive requirements in the market, mechanical systems must be designed to have good performance and high reliability. After the key design factors of a product are evaluated in the design phase, new features are often incorporated quickly into a product and brought to the marketplace. With either limited testing or no clear understanding of how a new design may be employed by the consumer, product launches with high failures can negatively influence the manufacturer’s brand [1].
A pneumatic cylinder is a mechanical component that can be utilized in an automatic assembly line in a flexible manufacturing system. It can also be used in a tool-changing device of a machine tool. To prevent a pneumatic cylinder from failing in the field before its anticipated lifetime, a manufacturer should verify the newly designed cylinder coupled with appropriate ISO Standards [2] and/or perform necessary reliability testing before the product is released.
The Space Shuttle Challenger disaster was a deadly mishap in the United States’ space program which took place on 28 January 1986 [3]. The disaster was caused by the failure of O-ring seals utilized in the booster joints which were improperly designed to endure the exceptionally cold winter weather which prevailed at the time of launch. As a result, the Challenger explored 73 s into its flight and all crew members were killed. The consequence of this failure was a halting of shuttle launches for two years until corrections were made in the O-ring design. To ensure a product does not fail in the field, flawed components need to be identified and redesigned using a testing methodology such as parametric ALT, which can produce reliability quantitative (RQ) specifications before the system is introduced into the market [4,5].
Material faults, such as extremely small voids and contacts when subjected to repeated loads, may begin to fail because of fatigue. Fatigue is the chief source of failure in metallic elements, explaining roughly 80–95% of all constructional failures [6]. Fatigue in ductile metals appears in the shape of cracks which grow in areas where stress can concentrate, such as holes, sharp edges, grooves, etc. Those failures can affect the reliability of mechanical systems such as automobiles, airplanes, ships, engines, and atomic reactors. A fatigue test procedure includes some fluctuating stress/time modes: (1) fluctuating stresses, (2) repeated stresses, (3) reversed stresses, and (4) random stress cycles. Fatigue may also be affected by the cyclic stress amplitude, mean stress or stress ratio, R (=σmin/σmax), which can be stated as the proportion of the minimum cyclic stress to the maximum cyclic stress [7]. For periodical shapes, the peaks at both the maximum (high side) and the minimum (low side) are crucial. When employing an elevated load which can be stated as an accelerated factor (AF), accelerated life testing (ALT) can be used to identify the design defects such as a stress raiser in the structure.
The ALT combined with the reliability block diagram was investigated as another method [8]. It included a test plan for the system, identifying failure mechanics such as fatigue, and using a sample size equation, accelerated loads, etc. Elsayed [9] categorized statistical, physics/statistics, and physics/experimental-established prototypes for examination. Meeker [10] suggested numerous practical ways to organize an ALT. Carrying out an ALT [11,12] necessitates many concepts such as the BX life for the system test scheme, a simplified life-stress description, sample size formulation, and fracture mechanics [13,14,15] because failure may suddenly occur because of fragile components in a product. Contemporary test techniques [16,17,18,19,20] might not be able to replicate the design flaws of components in a multi-module system because the procedures evaluate insufficient component samples and do not identify the fatigue(s) which actually occur to the components by users in the marketplace.
To obtain a robust design of a mechanical product, designers have employed traditional techniques such as fracture mechanics and strength of materials [21]. Engineers have used quantum mechanics to help identify which failures originated from micro-void coalescence (MVC) in many metallic alloys and some engineering plastics. To find the fatigue source of a mechanical product, a life-stress model can be used with traditional design procedures and related techniques to help identify the failure of electronic components due to material flaws or small cracks when the parts are subjected to (mechanical) stresses. Finite element methods (FEMs) may not identify the source of failure [22,23,24,25]. As an alternative, there are other methods such as structural health monitoring (SHM) that allow for the detection of the source of the failure [26]. However, it is difficult to obtain experimental data for multi-module products because extensive testing would have been required, which could be too costly due to time and sample size.
To show the effectiveness of identifying and altering the design defects of a mechanical product, a parametric ALT can be used as a systematic reliability method that can create the RQ specifications such as mission cycles. It covers: (1) a system BX lifetime created on the ALT scheme, (2) a load examination, (3) tailored ALTs with the alterations, and (4) an estimation of whether the product design(s) accomplishes the objective BX lifetime. The derivation of the sample size equation, time-to-failure, and BX lifetime is provided. To reaffirm ALT consequences in real life and contrast the present design with previous ones, it would then be necessary to monitor the introduction of the new design in the market to ensure it reached the targeted lifetime and failure rate. A pneumatic cylinder in a machine tool subjected to repeated pressure loading is used to illustrate this methodology.
2. Parametric ALT for Mechanical Product
2.1. BX Lifetime Target of New System in a Mechanical System
In mechanical products, power can be used to a mechanical advantage to provide a function that requires forces and movement by system mechanisms. As products are subjected to repeated loads, they should have a proper lifetime for the expected stresses in the system. An example is a machine tool that is used to machine metal or other hard materials by cutting, boring, grinding, shearing, or other shapes of deformation. One of the components of some machine tools is the pneumatic cylinder. A machine tool can also include a range of modules—tool (or pellet) changing device, spindle/drive unit, hydropower unit, tilting index table, turret head, cooler unit, and CNC controller. The lifetime of the machine tool is decided by the (random or wear-out) failure of the new module such as the pneumatic cylinder which has design flaws (Figure 1).
To perform an ALT, the BX life or “Bearing Life”, LB, should be set up as a measure of the product lifetime. The BX life metric started from the ball and roller bearing industry but has grown to be a product lifetime standard utilized across a variety of industries today. The ALT can identify the accumulative failure rate and meet the market needs for the lifetime requirements of the product. BX life thus is the elapsed time for which X% of a population of a product fails. A “BX life Y years” is a way of expressing the system lifetime. If a product has a B20 life of 10 years, it means that 20% of the population will be unsuccessful during 10 years of functioning.
For example, the required system lifetime of a machine tool depends on approximately 2000 components, including the pneumatic cylinder. If a new pneumatic cylinder has design faults, it can impact the potential life of the machine tool. If a target for a machine tool’s lifetime is a B20 life of 10 years, the lifetime of each unit should be designed to have a B1 life of 10 years because the machine tool is made of 20 units and each unit has 100 components.
2.2. Placing an Entire Parametric ALT Scheme
The reliability of a mechanical system can be evaluated as the capacity needed to continue performing the intended function under specified environmental/operational conditions for a specified period of time [27].
As seen in Figure 2, if T is a random variable indicating the time to failure, the reliability function, the fraction still surviving at time t, might be defined as:
The cumulative distribution function (CDF), , is . The failure rate on the bathtub curve in Figure 2 may be stated as:
where λ is the failure rate, f is the failure density function, R is the reliability, and F is the unreliability of the product.
If Equation (2) is integrated until T = LB, the X% cumulative failure, F(LB), can be obtained:
If product reliability is illustrated using the traditional “bathtub curve”, there is composed of three regions: (1) in the first region, during the early product life, there is some reduction in the failure rate, (2) in the second region, during its middle life, there is a relatively constant failure rate, and (3) in the third region, there is a growing failure rate until the final life of the product is reached. Assuming that T1 will be the time of the first failure in the second region, we can find reliability function R(t). That is:
As the design of a mechanical product is improved, its failure rate in the field should decrease, and the system lifetime increase. For such situations, the reliability of a mechanical system could be stated as the multiplication of lifetime LB and failure rate λ:
This relationship is acceptable below about 20% of the cumulative failure [28]. Tool changing requires a straightforward mechanical procedure: (1) The machine picks out the tool to be switched out; and (2) it then exchanges the needed tool. The data for the unsuccessful (failed) products in the market were critical for understanding and characterizing the usage patterns of customers and helping to identify design flaws that needed to be made in the product. Based on the market data, the root cause(s) of the troublesome pneumatic cylinder was identified. After targeting the lifetime, LB, the mechanical product could then be redesigned by identifying the troublesome structures and altering them using a parametric ALT (Figure 3).
To target the lifetime of a mechanical system such as a machine tool through a parametric ALT that consists of nine modules (See Figure 1a), there are the following possible system modules: (1) modified independent units, (2) newly designed independent units, and (3) similar independent units to the earlier design based on a request in the field. The modified pneumatic cylinder in the machine tool inspected here is used as a case study. It was originally redesigned to focus on the pneumatic cylinder and make the machine tool more competitive in the marketplace. However, the redesigned pneumatic cylinder had design faults that needed to be altered because of failures in the field.
The new module A from the field data shown in Table 1 had a failure rate of 0.24% per year and a B1 life of 4.2 years. Based on data from the field, the lifetime of the machine tool including the pneumatic cylinder had an expected B1 life of 0.83 years because they had a failure rate of 1.2% per year. To satisfy consumer demands, a new lifetime target for the mechanical system such as a tool change device including a pneumatic cylinder was set to have a B1 life of 10 years with 0.1 percent per year.
2.3. Generalized Time to Failure and Sample Size Equation for Parametric ALT
Mechanical products usually transfer power (or energy) from one position to another by adapting an appropriate mechanism, such as a pneumatic cylinder. As the pressure difference between the two chambers of the cylinder push (or pull), the piston rod extends (or retracts). This pressure difference due to loading leads a piston through a linear-path movement to the desired destination in a cylinder. It is subjected to repeated stresses because of (pressure) loading/unloading dependent on masses which are various with the applications. If there is a design defect in the structure which creates an insufficient strength (or stiffness) when the loads are applied, the mechanical product can abruptly fail before its expected lifetime. With the failure, the product will require maintenance and needs to be fixed or replaced (Figure 4).
Metal fatigue can be used to express the unanticipated failure of product components that develop fractures in their lifetime. Fatigue is related to the number of stress cycles experienced by a component and the amount of stress exerted on the component. The S–N curve shows that an infinite life is possible for a metal component if the stresses in the component remain below a clearly defined lower stress boundary. Metal fatigue grows if there is a stress raiser such as a notch in a component (or improper material). An engineer should identify these design flaws using appropriate analysis or testing. There is also a correlation between a metal component’s ultimate tensile strength and hardness and its capability to endure fatigue loads. The loftier the tensile strength and hardness, the more probability it will fatigue if subjected to higher fluctuating loads.
Fatigue failure due to design deficiencies can be characterized by the following components: (1) the stress due to loads on the constructional system and (2) the type of materials (or shape) employed on the structure. In recognizing the product failure by a parametric ALT, an engineer could then design parts with better shapes and acceptable materials to extend the expected life of the product. The system could then endure enough repeated loads or cycles to achieve its design lifetime target (Figure 5).
The main problem for reliability testing is to determine how quickly the potential failure mode can be identified. To complete it, it is necessary to successfully formulate a simplified failure description and determine the correct coefficients for the model. A life-stress (LS) model can be developed, which contains stresses and reaction parameters. This model can include a variety of mechanical failures such as structural fatigue. Fatigue failures can not only occur due to stresses in a part but also due to the defects within or small cracks on the exterior of a component.
Fatigue, in other words, may originate from material flaws–electron/void–that are created on a macro or microscopic scale. From such a theoretical point of view, it can be explained as transport processes such as the diffusion of shallow level dopants of silicon in semiconductors, which are called non-equilibrium thermodynamics. As a driving force such as an electric magneto-motive force, ξ, is exerted, the impurities such as voids in materials, created by electronic movement, are effortlessly migrated because the barriers of junction energy are reduced and distorted/phase-shifted (Figure 6).
At that time linear transport processes are described by expressions of the generic form:
where J is a flux vector which is recognized with the transport of some physical property such as mass, momentum, energy, charge, etc. X is expressed as a (driving or thermodynamic) force which is recognized with disequilibrium in some physical properties such as gradients of electrical potential, temperature, concentration, fluid velocity, etc. L is a phenomenological transport coefficient that relates between fluxes and forces.
Transport processes are dissipative in nature, which when occurring within some physical system, proceed to establish the system in equilibrium at which time any net transport comes to a halt.
For instance, it can employ the procedures for solid-state diffusion of impurities in silicon, which is commonly utilized in semi-conduct materials. These procedures include electro-migration-induced voiding, growth of chloride ions, and catching of electrons or holes. Solid-state diffusion of impurities in silicon J might be summarized as [29,30]:
where C is the concentration, q is the magnitude of electric charge, ν is the frequency, B is a constant, a is the interval between atoms, ξ is the applied field, k is the Boltzmann’s constant, T is the temperature, and Q is the energy.
The reaction process, which depends on speed, might also be summarized as:
where K is the reaction rate, S is the (chemical) effect, T is the temperature, k is Boltzmann’s constant, E is the (activation) energy, and Δ is the difference.
The junction function J from Equations (7) and (8) might be represented as:
If Equation (9) takes an inverse function, the life-stress (LS) model might be stated as:
The sine hyperbolic expression in Equation (10) can be stated as (Figure 7):
- at first has a little linear result;
- has what is judged as a medium result;
- at end is large.
Figure 7.
Sine hyperbolic stress expression versus S-N curve from a viewpoint of stress range.
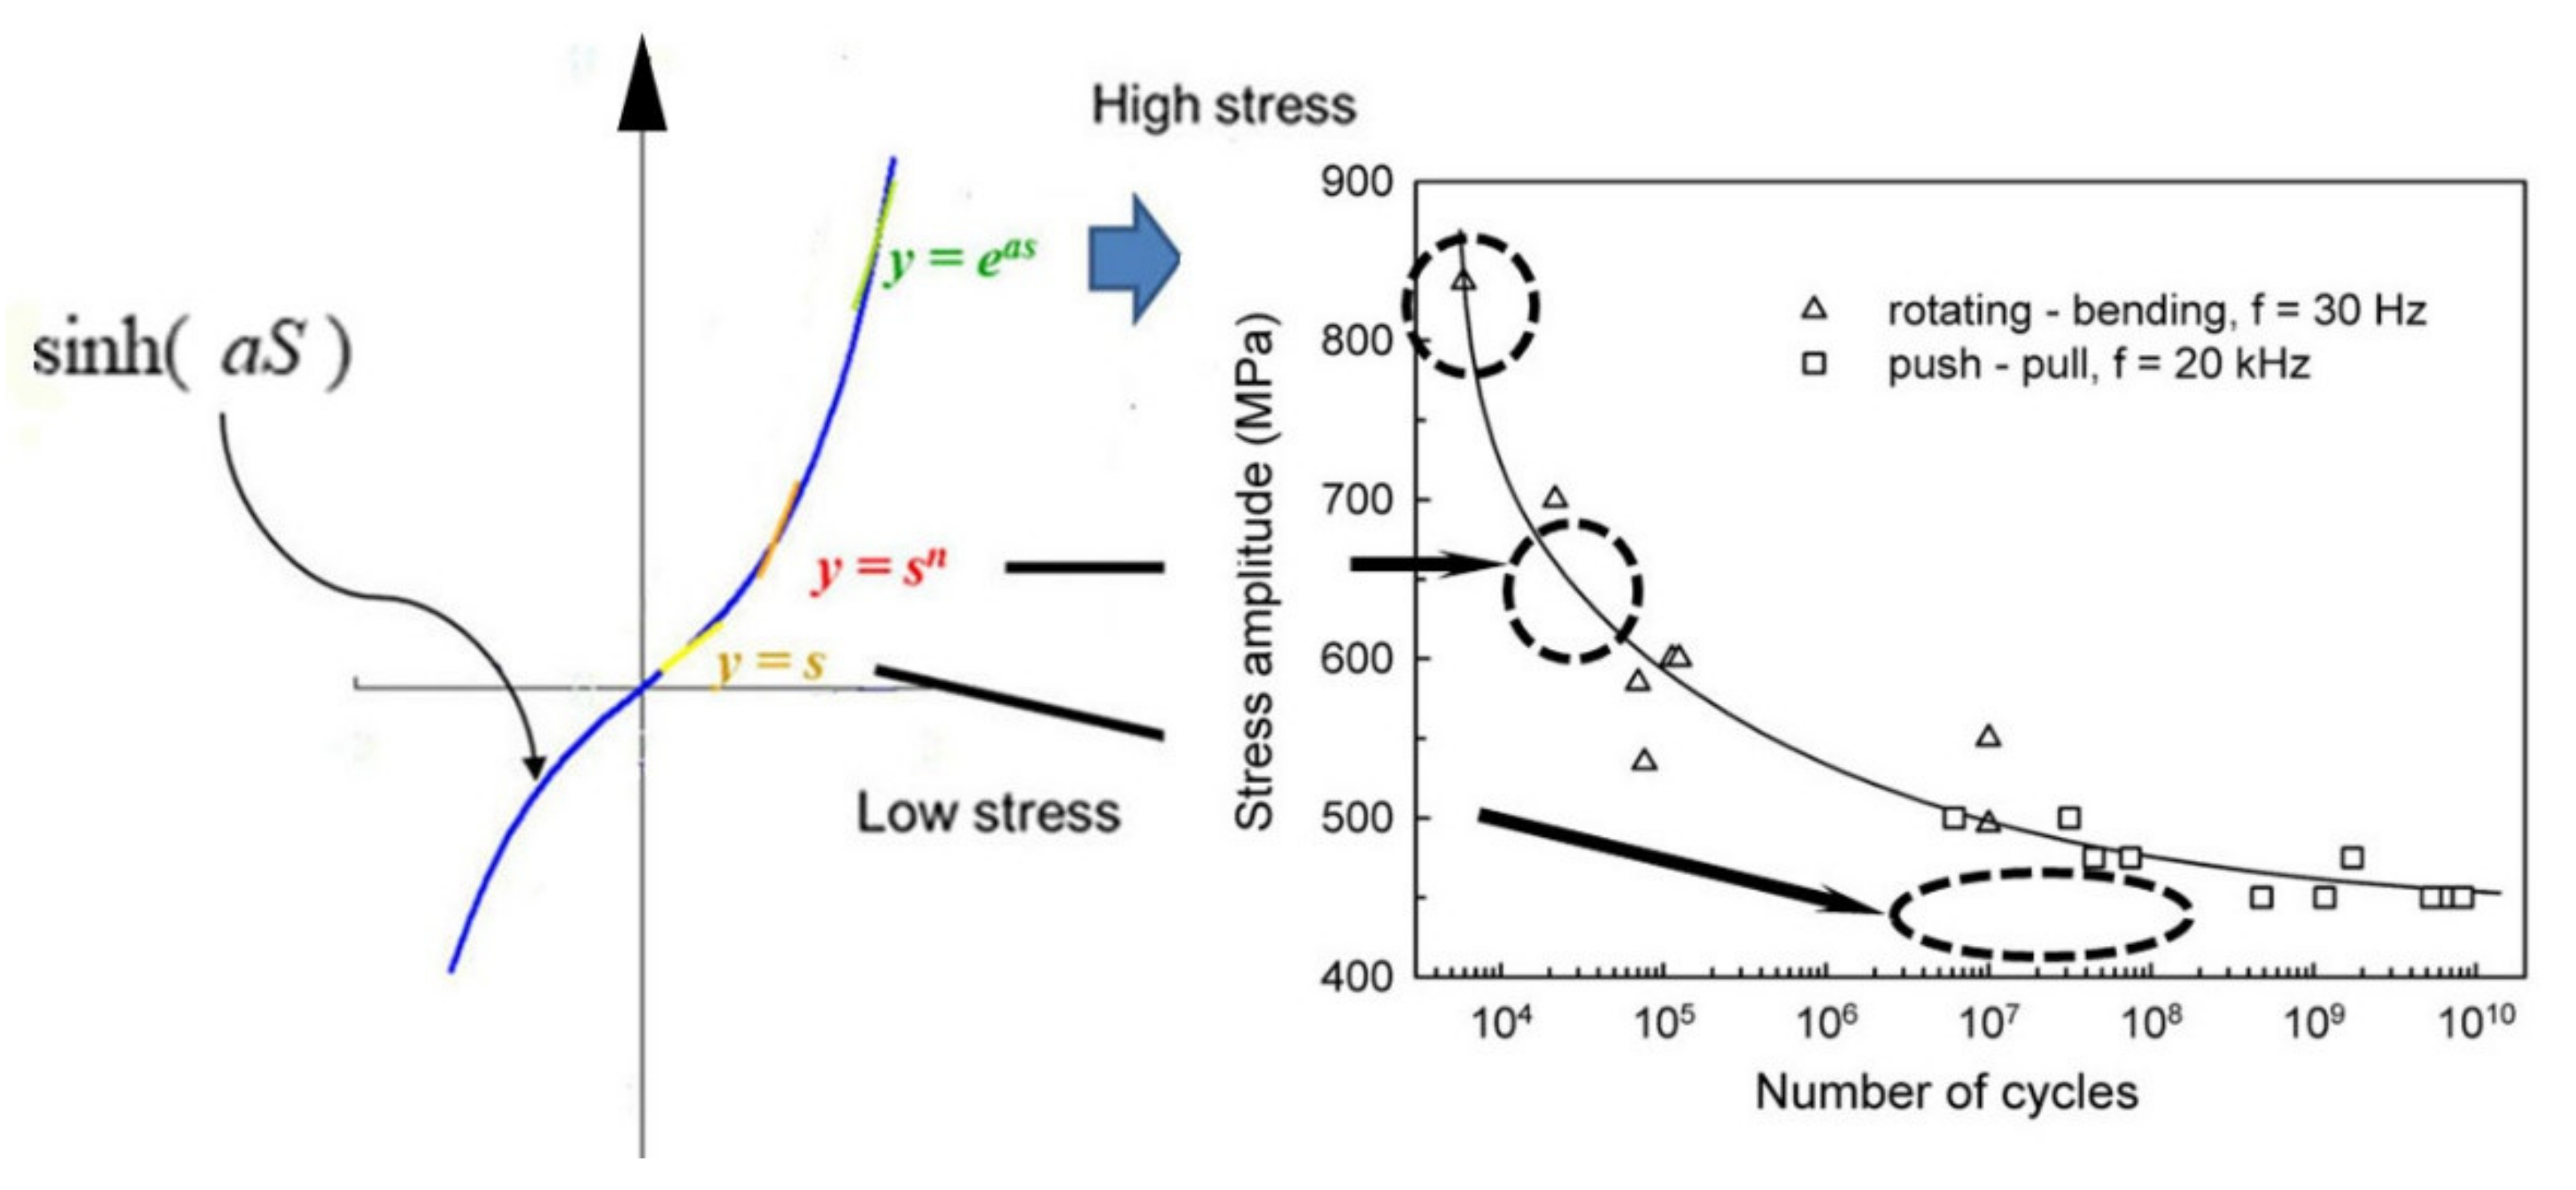
An ALT is usually conducted in the medium scope, and Equation (10) might be stated as:
Because the stress level in a mechanical system is difficult to compute during ALT, Equation (11) needs to be restated. As the power due to a variety of energy fields in Equation (6) is stated as the product of flows and effort, stresses may originate from effort in a multi-port product (Table 2) [31].
Stress is a material quantity that specifies the inner forces that adjoining particles of a continuum material exert on each other. For a mechanical system, because stress originates from effort, Equation (11) might be stated as:
where A and B are constants.
To attain the acceleration factor (AF), which can mostly affect the evaluation of fatigue strength in a product, AF might be stated as the ratio between the proper elevated stress levels and standard working conditions. AF might be altered to integrate with the effort notion:
Because most accelerated testing is performed at normal (room) temperatures for pneumatic cylinders, Equation (13) can be rewritten as:
To acquire the mission cycle of parametric ALTs from the targeted BX lifetime on the test plan in Table 1, the sample size equation combined with the AF in Equation (13) might be attained (See Appendix A).
where the sample size equation can be stated as n ~ (failure numbers + 1)·(1/cumulative failure rate)·((target lifetime/(plan testing time)) ^ β + r.
Equations (15) and (A11) also can be verified as [32].
For , sample size equation can be expressed as:
where
On the other hand, for , the sample size equation can be expressed as:
where
If the targeted lifetime of a mechanical system, such as the pneumatic cylinder, is desired to have a B1 life of 10 years, the mission cycles can be acquired for an allocated set of samples subjected to (impact) loading. In parametric ALTs, the design defects of a new product might be identified to help satisfy the lifetime target.
2.4. Case Study—Lifetime of a Localized Designed Pneumatic Cylinder in an Automatic Assembly Line
Engineers often utilize pneumatics because they are quiet, clean, and do not require large volumes for fluid storage. The pneumatic cylinder is a comparatively straightforward mechanical structure and can be employed in a variety of end–user mechanisms of a mechanical product. When manufacturers utilize machine tools in an automatic assembly line, they want their personnel to be able to comfortably change the tools by just pushing them (Refer to the red-colored mechanism in Figure 4). Pneumatic cylinders can be used in equipment to help move or open mechanical devices. A new pneumatic cylinder incorporated into a machine tool might be designed with a specific, anticipated lifetime.
To transport a load along a linear path to the required destination, some mechanical structural components in the pneumatic cylinder are required. They consist of a rod cap, piston, head cap, etc. Relying on the expected customer usage conditions, the pneumatic cylinder in machine tools was frequently subjected to repeated mechanical pressure loads during normal operations. There were design faults in a newly designed pneumatic cylinder that shortened its expected lifetime, but it was not known initially which parts in the cylinder were failing. To identify and correct them, it required application of the reliability methodology (Figure 8).
According to the field data, as the pneumatic cylinder was subjected to repeated impact pressure loads over its lifetime during regular end–user usage, the fractured (or harden and worn) piston seal caused the pneumatic cylinder to leak and quit functioning. The market data from the failed pneumatic cylinders due to the wrong-chosen material rubber or polyurethane were significant for understanding the usage patterns of consumers and helping to determine design defects that needed to be corrected in the product. Based on the field data, it was desired to reproduce and identify the root cause(s) of the failure of the troublesome pneumatic cylinder [33]. If the targeted lifetime were set, it would be possible to identify which component(s) in the pneumatic cylinder should be corrected to enhance its lifetime by parametric ALT.
When field data were extensively assessed, the problematic products showed leakage around the piston. After the pneumatic cylinder was subjected to repeated pressure loading, it experienced the assumed failure mechanisms: (1) overheating of the piston seal; (2) hardening and wear of the piston seal; and (3) exceeding Minimum Operation Pressure (MOP) and Stroke Time (ST) due to leakage.
Because the automatic assembly line, including the pneumatic cylinder, had to be halted, manufacturers would call to immediately have the failed product exchanged. To address the problem, it was crucial to reproduce the failure mode(s) of the pneumatic cylinder in simulated conditions in a room or building equipped for engineering experiments. The troublesome pneumatic cylinders that came from the field had design flaws–improper seal (metal) material (or type) (Figure 9).
Originally, to provide endurance of loads of the pneumatic cylinder, a new metal seal made of nickel-iron alloy (Fe-36Ni Invar Alloy) containing 36% Ni in the pneumatic cylinder were used because of their good sealing attributes. Due to their hardness and relatively high oxidation resistance at high temperatures, nickel alloys have been used for decades for making gas turbines, rocket engines, propellers in boats, desalination, stainless steel cutlery, nickel-cadmium battery, coins, jewelry, and household utensils. It is also easy to work and can be drawn into wire. After the fatigue strength of nickel alloys in the current design of a pneumatic cylinder was evaluated through parametric ALT, design alternatives can be found for achieving the targeted lifetime.
The pressure of the pneumatic cylinder due to loading can be defined as:
where ∆Fint = force difference in a pneumatic cylinder due to load.
Under accelerated conditions, the life-stress model (LS model) in Equation (11) can be stated as:
where A and B is constant, k is Boltzman’s constant, Ea is the activation energy, T is the absolute temperature, n is the quotient, and λ is the cumulative damage exponent in Palmgren–Miner’s rule.
Because most accelerated testing is performed at normal (room) temperatures for pneumatic cylinders, the acceleration factor (AF) from Equation (14) might be stated as:
where S1 (or ∆P1) is mechanical stress (or pressure difference) under accelerated conditions, and S0 (or ∆P0) is mechanical stress (or pressure difference) under representative conditions.
For a pneumatic cylinder in a machine center, the typical operating temperatures ranged from 0 °C to 43 °C with relative humidity ranging from 0% to 95%. Vibration conditions assumed for working the pneumatic cylinder ranged from 0.2 to 0.24 g of acceleration. When the pneumatic cylinder operated, the piston moved a load along a linear path to the required destination. Changing a tool in a machine tool was expected to occur an average of 10 to 30 times per day. Under the worst instances, the pneumatic cylinder working for 10 years may undergo approximately 109,500 usage cycles.
The pneumatic cylinder is usually made of (carbon, cast, stainless, alloy, etc.) steel. The allowable stresses are stated as a function of the yield stress (Fy) or tensile stress (Fu) of the structural material. For steel, the range of yield strength, Fy, and ultimate or tensile strength, Fu, normally employed are 248–345 MPa and 400–483 MPa, separately [34]. The pneumatic cylinder needed to transport a load along a linear path to the required destination, which was usually operated at 0.63 MPa, 23 °C.
To determine the stress level for ALT, based on the allowable usage range of pneumatic cylinder in bench-marked data that were obtained from other major companies, we utilized the step-stress life test which could evaluate the lifetime under constant used-condition for numerous elevated loads (or load masses) [35]. As the different stress level due to loads was changed, we could observe the failure times of the pneumatic cylinder at particular stress levels such as 0.8 MPa, 1.2 MPa, and 1.4 MPa that relied on load masses in a variety of applications. For a parametric ALT, the pressure difference was finally elevated to be 0.8 MPa with an accumulative damage exponent, λ, of 2. The total AF computed from Equation (16) was 1.6 (Table 3).
The test cycles of the ALTs calculated from Equation (15) were 200,000 cycles for 10 samples if the shape parameter, β, was presumed to be 2.0. The parametric ALT was designed to reassure a lifetime target—B1 life of 10 years—with an approximate 60% level of confidence that it would fail less than once during 200,000 cycles at the required pressure difference.
As seen in Figure 10, to assess the design of the pneumatic cylinder, reliability testing was performed for 10 samples. Test instructions for pneumatic cylinders are 160 mm (stroke) and 32 mm (bore size). To exert the pressure loading, we regulated the lumped mass hung at the end. It takes one second to finish a cycle that the pneumatic cylinder slides to and from stroke (160 mm). The control panel was utilized to run the testing apparatus and control the number of tests, the testing time, and the starting or stopping of the equipment. As the start button on the controller panel was pressed, the pneumatic cylinder in the test apparatus pushes the adapted lumped mass and is subjected to the pressure loading of 0.8 MPa.
3. Results and Discussion
To set the stress level by the step-stress life test, we checked the failure time at the following stress level–0.8 MPa, 1.2 MPa, and 1.4 MPa that can be obtained from load mass. For 0.8 MPa, the pneumatic cylinder made noise near 6000 cycles and 10,000 cycles. For 1.2 MPa, the pneumatic cylinder made noise near 4000 cycles and 8000 cycles. On the other hand, for 1.4 MPa, the pneumatic cylinder made noise near 1000 cycles. So, we decided the stress level as 0.8MPa for parametric ALT because it has a comparatively good data-linearity, compared to other stress levels.
Initially, when 0.8 MPa as the elevated pressure in a pneumatic cylinder was loaded, the pneumatic cylinder (n = 10) made noise at 6000 cycles, 10,500 cycles, and 11,000 cycles that have a 70 dB (maximum) and cause moderate-to-severe hearing loss. After disassembling three problematic samples, one was a partially cracked sample and two were chipped due to the repeated pressure loading. The fractured surfaces were examined using scanning electron microscopy (SEM). The location of the multiplicative crack initiation and the microscopic growth at the right beginning of the crack due to repeated loading were identified. We thus recognized that loading was possibly the most common cause of failures for the partly cracked seal in pneumatic cylinders. That is, as pressure loading was repeatedly applied to the seal along the axial direction of the cylinder, it could lead to conditions that resulted in such a failure–chipped and partially cracked samples. It was determined that this failure came from an improper seal material such as Fe-36Ni Invar Alloy. Although this metal (Fe-36Ni Invar Alloy) had good sealing attributes, it eventually failed under repeated loading. The seal material in the pneumatic cylinder was modified from Fe-36Ni Invar Alloy to a silicone rubber, composed of silicone—itself a polymer—containing silicon together with carbon, hydrogen, and oxygen (C1) (Figure 11).
Some pneumatic cylinders in the second ALT (n = 10) failed at 50,000 cycles (one sample), 100,000 cycles (two samples), 110,000 cycles (one sample), and 115,000 cycles (one sample). The failure mode of the samples was over the minimum working pressure and piston stroke time. As the problematic pneumatic cylinders were disassembled, the hardening and wear of piston seals were like samples returned from the market. The failure mechanism happened as follows: (1) repetitive operating stress, (2) friction heat in seal, (3) lube vaporization in seal, (4) accelerating seal hardening, and (5) accelerating seal wear. The shapes and places of the failure in the samples obtained from the second ALT and the field (or normal condition) were indistinguishable (Figure 12).
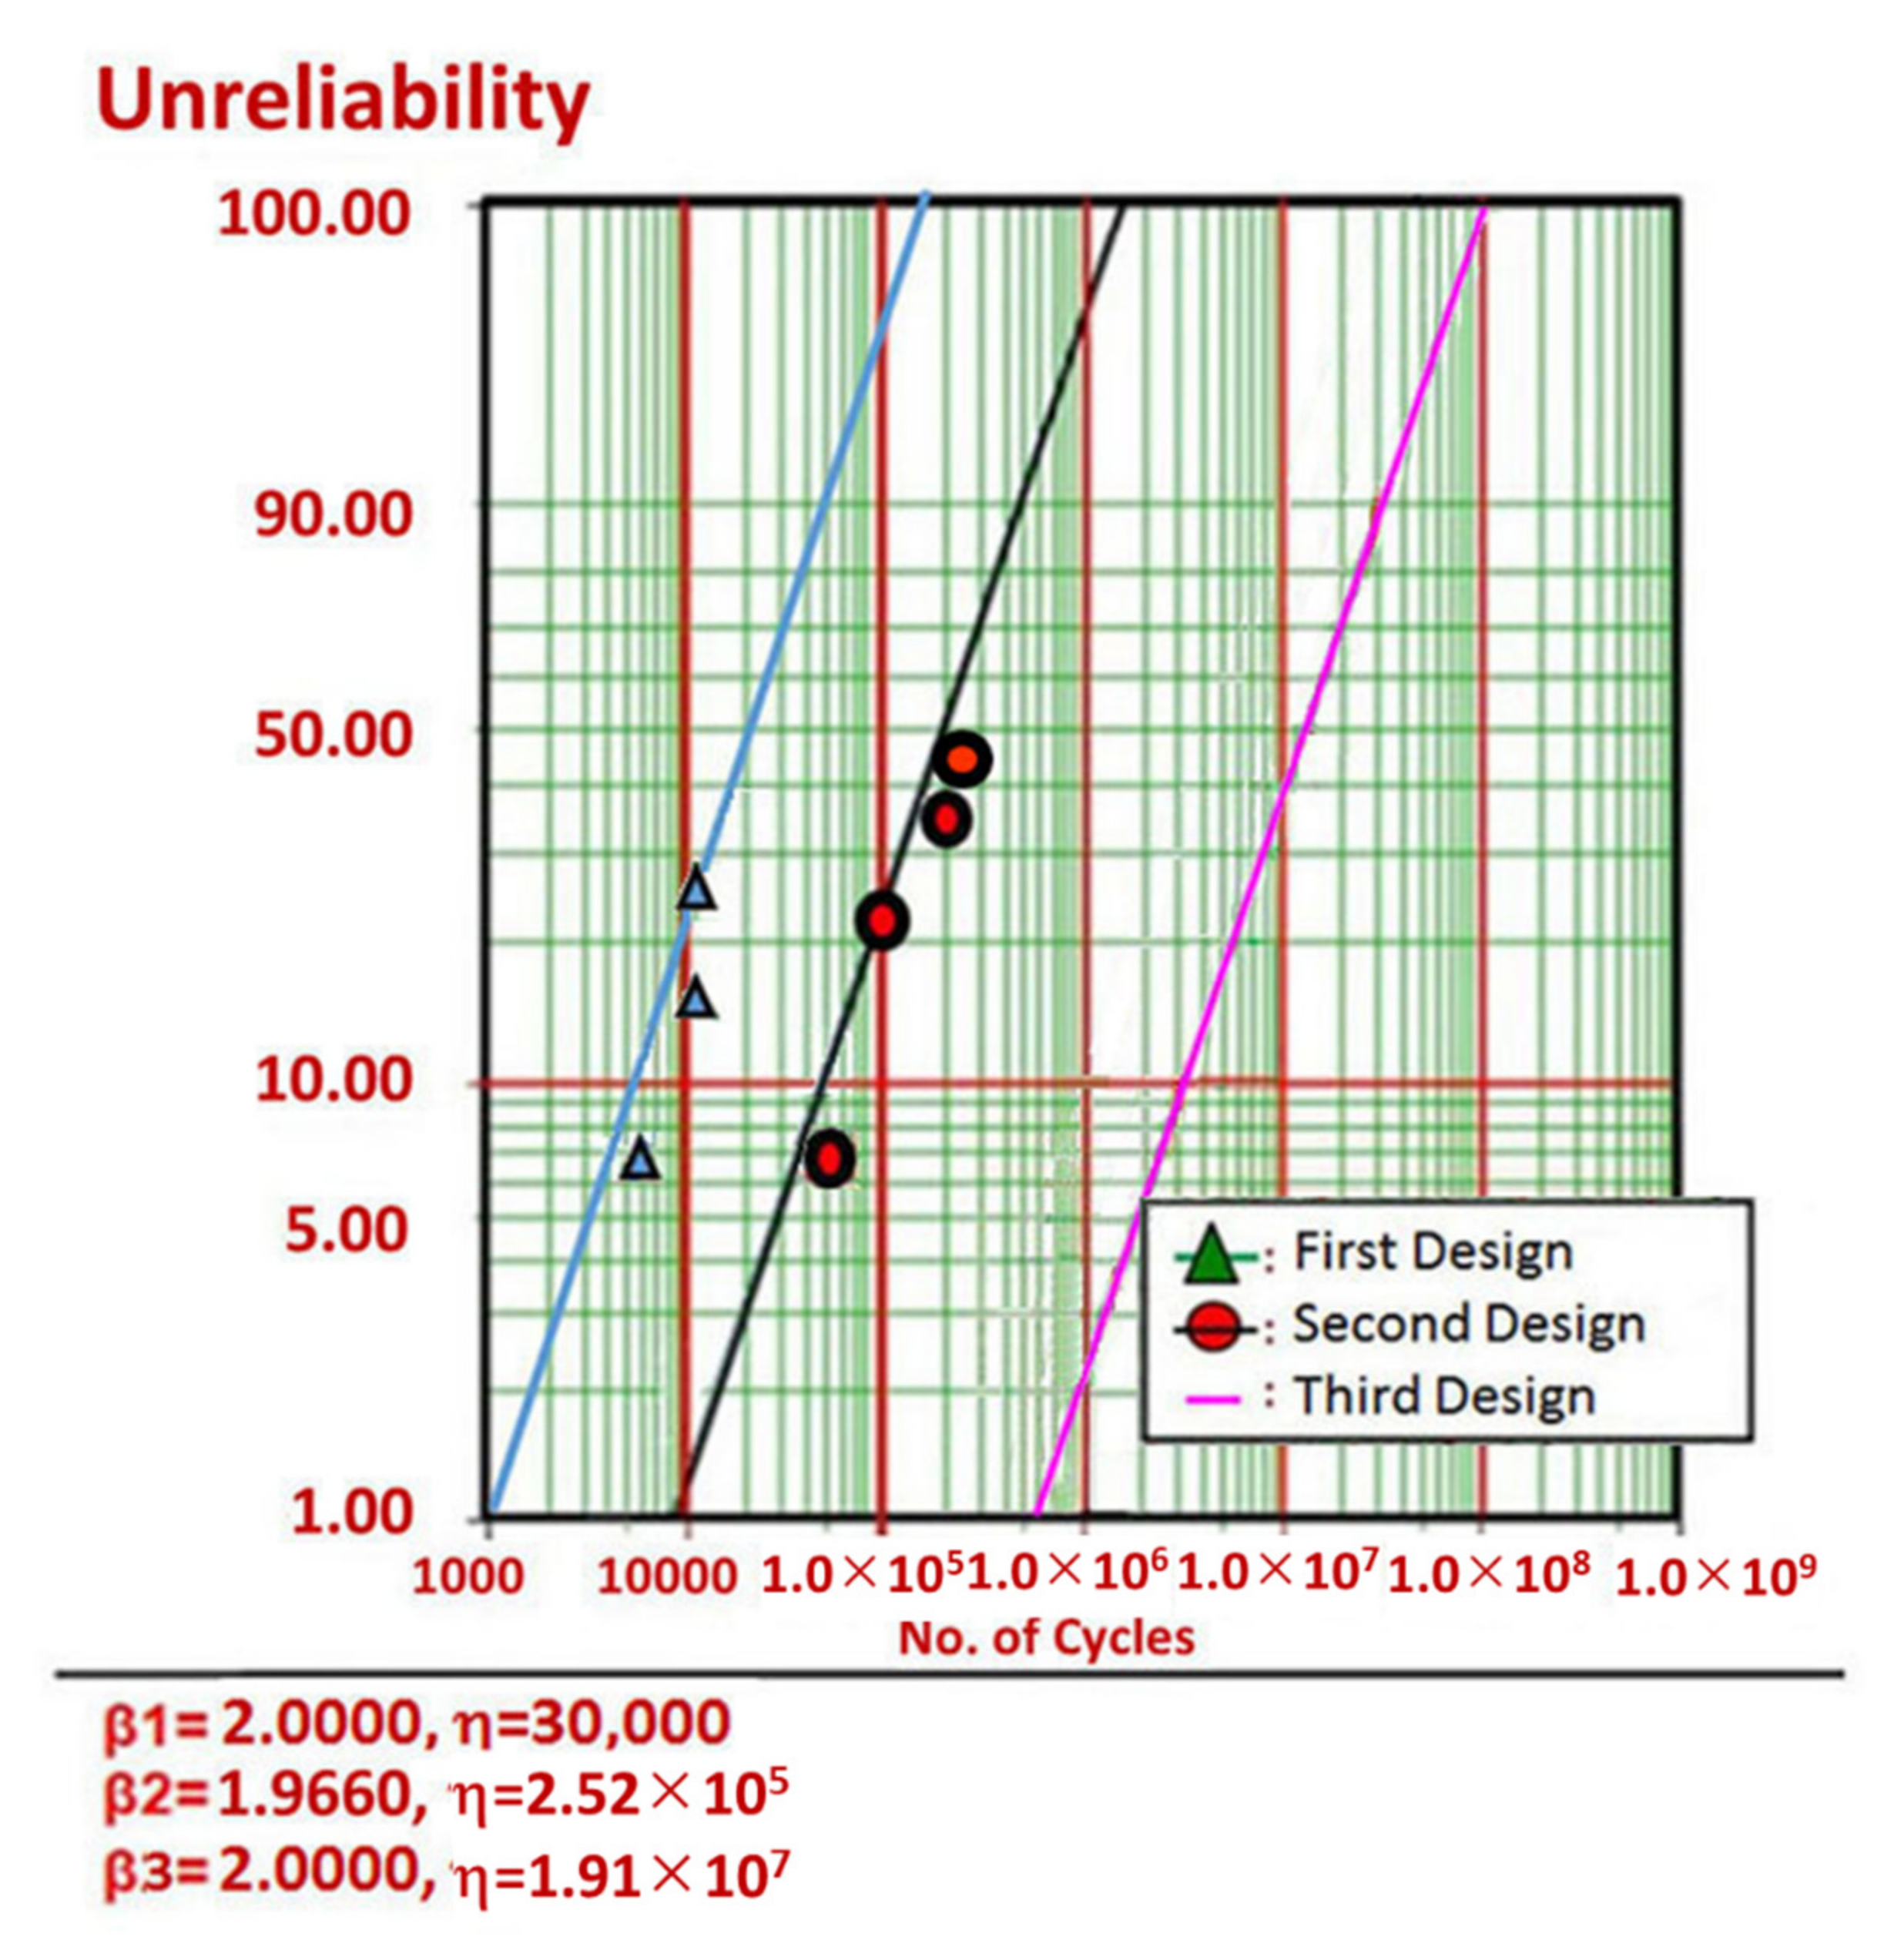
The second ALT failure and market failure data showed a similar pattern on a Weibull plot (Figure 13). As the data for the second ALT and market had similar slopes on the plot, each loading condition of the second ALT and that from the field over the product lifetime were similar. It might be anticipated that the test samples in the laboratory would break in a similar way to those in the field. For the shape parameter, β, the last shape parameter from the chart was reaffirmed to be 1.97, compared with the estimated value of 2.0. Based on both test outcomes in the Weibull plot, the parametric ALT was successful because it identified the design defects which were responsible for the market failures. Because of the similarities in the visual likeness in both photos in Figure 12 (or Figure 14) and similar slopes in the Weibull plot in Figure 13, these ALTs were useful in helping identify the design flaws that were judged to be the failures of the pneumatic cylinders being returned from the market. These failures also determined the product lifetime.
To find the failures of the pneumatic cylinder under an elevated condition of 1.2 MPa and 23 °C, reliability testing was carried out. As a result, the pneumatic cylinder failed in 5 out of 6 samples as follows: approximately 30,000 cycles (one sample), 70,000 cycles (two samples), and 80,000 cycles (two samples). The failure mode of the samples was over the minimum operation pressure and stroke time piston. When the unsuccessful pneumatic cylinders were disassembled, it was discovered there was hardening and wear of the piston seal, and the rod cap was blocked by a slurry. The repeated pressure loading of the pneumatic cylinder caused the wear of the piston seal which generated the slurry and its flow into the port. The slurry then collected at the port and blocked it.
When closely examining the product failure in 2nd ALT, it was determined that the hardening and wear of piston seal in the pneumatic cylinder came from using an improper material. For this case, it was a silicone rubber. Although this material had good sealing attributes, it was still vulnerable to breakdown under repeated pressure loading. The seal material, C2, was changed from silicone rubber to a (thermoset) polyurethane with outstanding abrasion and wear resistance which provided enhanced reliability versus normal rubber-based seal.
In the third ALT, there were no design problems in the pneumatic cylinder until the parametric ALT reached 220,000 cycles. It was then concluded that the design modifications attained from the first and second ALTs were useful in achieving the desired life of the product. Figure 15 and Table 4 summarize the parametric ALT results. With the adjusted designs, the pneumatic cylinder samples were ensured to attain the lifetime target—B1 life of 10 years with about a 60% confidence level.
4. Summary and Conclusions
To increase the lifespan of a newly designed mechanical system such as a pneumatic cylinder used in a machine tool, we used a reliability methodology that included a (generalized) life-stress model through a linear transport process and a sample size formulation. It included the following: (1) the system BX lifetime created the parametric ALT scheme, (2) parametric ALTs with design modifications, and (3) determination if the product design attained the desired number of mission cycles. The failure and redesign of a pneumatic cylinder were used as a test case for the methodology.
In the first ALT, the pneumatic cylinder (n = 10) made noise near 6,000 cycles, 10,500 cycles, and 11,000 cycles. After disassembling three problematic samples, we found they are one partially cracked sample and two chipped samples due to heavy load. The seal material in a pneumatic cylinder was modified from Fe-36Ni Invar Alloy to silicone rubber.
- ▪
- In the second ALT, we discovered the hardening and wear of piston seal like those of market samples. It happens as follows: (1) repetitive operating stress, (2) friction heat in seal, (3) lube vaporization in seal, (4) accelerating seal hardening, and (5) accelerating seal wear. We modified the seal material, C2, from silicone rubber to (thermoset) polyurethane.
- ▪
- During the third ALT, no problems were discovered. The pneumatic cylinder systems should attain the lifetime target—B1 life of 10 years with about a 60% confidence level. By examining problematic field products and conducting parametric ALTs with design modifications, it was possible to improve the lifetime of the pneumatic cylinder.
This methodology has been applied successfully to other mechanical products [4,5] and, as demonstrated here, was effective in improving the reliability of the pneumatic cylinder. It should be applicable to other mechanical systems. Designers need to understand why multi-module products fail during their lifetime. If there are design flaws in the newly designed module structures and these are subjected to repeated loads during its operation, the system can fail before its expected lifetime. Engineers would need to identify the (dynamic) loading of a mechanical system so that the accelerated testing expressed as the ratio of maximum stress versus minimum stress can be carried out until the required mission cycles (reliable quantitative specification) are obtained from the sample size equation. In the meantime, parametric ALT can be utilized to find and alter the design issues of a mechanical product.
Author Contributions
S.W. managed the concept forming, methodology, examination and experiment, and wrote down the manuscript. D.L.O. examined the investigation and writing for the original manuscript. Y.M.H. edited the manuscript. All authors have comprehended and consented to the issued edition of the paper. All authors have read and agreed to the published version of the manuscript.
Funding
This research received no external funding.
Institutional Review Board Statement
Not applicable.
Informed Consent Statement
Not applicable.
Data Availability Statement
The data provided in this research can be obtained on request from the corresponding author.
Conflicts of Interest
The authors declare no conflict of interest.
Abbreviations
| A BX | Cross-sectional area, cm2 Time which is a cumulated failure rate of X%: durability index |
| Ea | Activation energy, eV |
| e | Effort |
| f | Flow |
| F | Impact force, kN |
| F(t) | Unreliability |
| h | Testing cycles (or cycles) |
| h* J | Non-dimensional testing cycles, Junction function equation |
| k | Boltzmann’s constant, 8.62 × 10⁻⁵ eV/deg |
| LB | Target BX life and x = 0.01X, on the condition that x ≤ 0.2 |
| n ∆P Q | Number of test samples Pressure difference, MPa Amount of energy absorbed or released during the reaction. For the semiconductor, total number of dopants per unit area |
| R r | Ratio for minimum stress to maximum stress in stress cycle, σmin/σmax Failed numbers |
| S | Stress |
| T ti | Temperature, K Test time for each sample |
| TF | Time to failure |
| X | Accumulated failure rate, % |
| x | x = 0.01X, on condition that x ≤ 0.2. |
| Greek symbols | |
| ξ | Electrical field exerted |
| η | Characteristic life |
| λ χ2 α | Cumulative damage exponent in Palmgren–Miner’s rule Chi-square distribution Confidence level |
| Superscripts | |
| β | Shape parameter in Weibull distribution |
| n | Stress dependence, |
| Subscripts | |
| 0 | Normal stress conditions |
| 1 | Accelerated stress conditions |
Appendix A. Derivation of Sample Size Equation
If the product pursues Weibull distribution, the accumulated failure rate, F(t), the complement of R(t) in Equation (1) is expressed as:
where t is time, is characteristic life, and is shape parameter.
When t = LB in Equation (A1), the relationship between BX life, LB, and characteristic life, η, can be defined as:
where x = 0.01F(t).
In selecting the model parameters to maximize the likelihood function, the maximum likelihood estimation (MLE) in statistics is a general way of estimating the parameters of a model. The characteristic life, ηMLE, would be stated as:
where is the maximum likelihood estimate for the characteristic life, n is the entire number of samples, is the experimental time for each sample, and r is the number of failures.
For approximating characteristic life, η, in Equation (A2), the Weibayes model by using Weibull examination is a widely acknowledged method of inspecting reliability data. That is, the entire instances as failures (r ≥ 1) and no failures (r = 0) need to be split. As a result, it is feasible to approximate the characteristic life.
If the failure numbers, r, are greater than or equal to 1 and the confidence level is 100 (1 − α), then the characteristic life, ηα, can be estimated from Equation (A3).
where () is the chi-square distribution when the p-value is α.
Presuming there are no failure numbers, ln (1/α) is similar to the chi-square value, .
where ν is the shape parameter and Γ is the gamma function.
For r = 0, the characteristic life ηα from Equation (A4) might be stated as:
As Equation (A4) is demonstrated for all cases r ≥ 0, characteristic life, ηα, might be stated as:
If the estimated characteristic life of the p-value α, ηα, in Equation (A7), is substituted into Equation (A2), we obtain the BX life equation:
As whole reliability testing has insufficient sample numbers to assess the lifetime for the designated failures, which might be less than that of the sample size, the experiment plan can be stated as:
If Equation (A8) is changed with Equation (A9), the BX life equation might be restated as:
If Equation (A10) is reorganized, the sample size equation with the failures can be stated as:
Because for α = 0.6 and , the sample size Equation (A11) can be straightforwardly adjacent to:
where the sample size equation can be stated as n ~ (failure numbers + 1)·(1/cumulative failure rate)·((target lifetime/(plan testing time)) ^ β + r.
To acquire the mission cycle of parametric ALTs from the targeted BX lifetime on the test plan in Table 1, the sample size equation combined with the AF in Equation (13) might be attained.
where the sample size equation can be stated as n ~ (failure numbers + 1)·(1/cumulative failure rate)·((target lifetime/(plan testing time)) ^ β + r.
References
- Magaziner, I.C.; Patinkin, M. Cold competition: GE wages the refrigerator war. Harv. Bus. Rev. 1989, 89, 114–124. [Google Scholar]
- ISO 19973-1:2015Pneumatic Fluid Power—Assessment of Component Reliability by Testing—Part 1: General Procedures, ISO: Geneva, Switzerland, 2015.
- Rogers, W.P.; Armstrong, N.A.; Acheson, D.C.; Covert, E.E.; Feynman, R.P.; Hotz, R.B.; Kutyna, D.J.; Ride, S.K.; Rummel, R.W.; Sutter, J.F.; et al. Report of the Presidential Commission on the Space Shuttle Challenger Accident; NASA: Washington, DC, USA, 1986. [Google Scholar]
- Woo, S.; O’Neal, D.; Woldemichael, D.E.; Atnaw, S.M.; Tulu, M.M. Improving the Fatigue of Newly Designed Mechanical System Subjected to Repeated Impact Loading. Metals 2021, 11, 139. [Google Scholar] [CrossRef]
- Woo, S.; O’Neal, D. Reliability Design of Mechanical Systems Such as Compressor Subjected to Repetitive Stresses. Metals 2021, 11, 1261. [Google Scholar] [CrossRef]
- Duga, J.J.; Fisher, W.H.; Buxaum, R.W.; Rosenfield, A.R.; Buhr, A.R.; Honton, E.J.; McMillan, S.C. The Economic Effects of Fracture in the United States; Final Report; Available as NBS Special Publication 647-2; Battelle Laboratories: Columbus, OH, USA, 1982. [Google Scholar]
- Fatigue. In Elements of Metallurgy and Engineering Alloys; Campbell, F.C. (Ed.) ASM International: Materials Park, OH, USA, 2008. [Google Scholar]
- Modarres, M.; Kaminskiy, M.; Krivtsov, V. Reliability Engineering and Risk Analysis: A Practical Guide, 3rd ed.; CRC Press: Boca Raton, FL, USA, 2016. [Google Scholar]
- Elsayed, E.A. Reliability Engineering; John Wiley & Sons: Hoboken, NJ, USA, 2012. [Google Scholar]
- Hahn, G.J.; Meeker, W.Q. How to Plan an Accelerated Life Test (E-Book); ASQ Quality Press: Milwaukee, WI, USA, 2004. [Google Scholar]
- McPherson, J. Accelerated testing. In Electronic Materials Handbook Volume 1: Packaging; ASM International Publishing: Materials Park, OH, USA, 1989; pp. 887–894. [Google Scholar]
- McPherson, J. Reliability Physics and Engineering: Time-to-Failure Modeling; Springer: New York, NY, USA, 2010. [Google Scholar]
- Griffith, A.A. The phenomena of rupture and flow in solids. Philos. Trans. R. Soc. Lond. A 1921, 221, 163–198. [Google Scholar]
- Irwin, G. Analysis of stresses and strains near the end of a crack traversing a plate. J. Appl. Mech. 1957, 24, 361–364. [Google Scholar] [CrossRef]
- Anderson, T.L. Fracture Mechanics—Fundamentals and Applications, 3rd ed.; CRC: Boca Raton, FL, USA, 2017. [Google Scholar]
- ASTM E606/E606MStandard Test Method for Strain-Controlled Fatigue Testing, ASTM International: West Conshohocken, PA, USA, 2019.
- ASTM E399Standard Test Method for Linear-Elastic Plane-Strain Fracture Toughness of Metallic Materials, ASTM International: West Conshohocken, PA, USA, 2020.
- ASTM E647Standard Test Method for Measurement of Fatigue Crack Growth Rates, ASTM International: West Conshohocken, PA, USA, 2015.
- ASTM E739-10Standard Practice for Statistical Analysis of Linear or Linearized Stress-Life (S-N) and Strain-Life (ε-N) Fatigue Data, ASTM International: West Conshohocken, PA, USA, 2015.
- Braco, R.; Prates, P.; Costa, J.D.M.; Berto, F. New methodology of fatigue life evaluation for multiaxially loaded notched components based on two uniaxial strain-controlled tests. Int. J. Fatigue 2018, 111, 308–320. [Google Scholar] [CrossRef]
- Weingart, R.G.; Stephen, P. Timoshenko: Father of Engineering Mechanics in the U.S. Structure Magazine, 1 August 2007. [Google Scholar]
- Sánchez, M.; Cicero, S.; Arroyo, B.; Álvarez, J.A. Coupling Finite Element Analysis and the Theory of Critical Distances to Estimate Critical Loads in Al6060-T66 Tubular Beams Containing Notches. Metals 2020, 10, 1395. [Google Scholar] [CrossRef]
- Li, Q.; Xie, L. Analysis and Optimization of Tooth Surface Contact Stress of Gears with Tooth Profile Deviations, Meshing Errors and Lead Crowning Modifications Based on Finite Element Method and Taguchi Method. Metals 2020, 10, 1370. [Google Scholar] [CrossRef]
- Hertzberg, R.W.; Vinci, R.P.; Hertzberg, J.L. Deformation and Fracture Mechanics of Engineering Materials, 6th ed.; John Wiley and Sons Inc.: Hoboken, NJ, USA, 2020. [Google Scholar]
- Zupančič, B.; Prokop, Y.; Nikonov, A. FEM analysis of dispersive elastic waves in three-layered composite plates with high contrast properties. Finite Elem. Anal. Des. 2021, 193, 103553. [Google Scholar] [CrossRef]
- Raghavan, A.; Cesnik, C.E. Review of guided-wave structural health monitoring. Shock. Vib. Dig. 2007, 39, 91–114. [Google Scholar] [CrossRef]
- IEEE Standard Glossary of Software Engineering Terminology. IEEE STD 610.12-1990. Standards Coordinating Committee of the Computer Society of IEEE. (Reaffirmed September 2002). Available online: https://ieeexplore.ieee.org/document/159342 (accessed on 31 December 1990).
- Kreyszig, E. Advanced Engineering Mathematics, 10th ed.; John Wiley and Son: Hoboken, NJ, USA, 2011; p. 683. [Google Scholar]
- Grove, A. Physics and Technology of Semiconductor Device, 1st ed.; Wiley International Edition: New York, NY, USA, 1967; p. 37. [Google Scholar]
- Minges, M.L. Electronic Materials Handbook; ASM International: Cleveland, OH, USA, 1989; Volume 1, p. 888. [Google Scholar]
- Karnopp, D.C.; Margolis, D.L.; Rosenberg, R.C. System Dynamics: Modeling, Simulation, and Control of Mechatronic Systems, 6th ed.; John Wiley & Sons: New York, NY, USA, 2012. [Google Scholar]
- Wasserman, G. Reliability Verification, Testing, and Analysis in Engineering Design; Marcel Dekker: New York, NY, USA, 2003; p. 228. [Google Scholar]
- SAMSUNG Appliance Field Report Data, SRTP 97-2; SAMSUNG: Gwangju, Korea, 2003; p. 45.
- William, E.L.; David, M.; Christoper, N.M.; Stephen, W.B.; Richard, J.F.; Timothy, F.; Thomas, A.S.; Frank, W.G. Mechanical Properties of Structural Steels. NIST NCSTAR 1-3D; National Institute of Standards and Technology (NIST): Gaithersburg, MD, USA, 2005. [Google Scholar]
- Tang, L.C. Multiple-steps Step-stress Accelerated Life Test. In Handbook of Reliability Engineering; Springer: London, UK, 2003; pp. 441–455, Chapter 24. [Google Scholar]
Figure 1.
Product lifetime decided by newly designed module (a) categorization of multi-module machine center; (b) product lifetime LB.
Figure 1.
Product lifetime decided by newly designed module (a) categorization of multi-module machine center; (b) product lifetime LB.
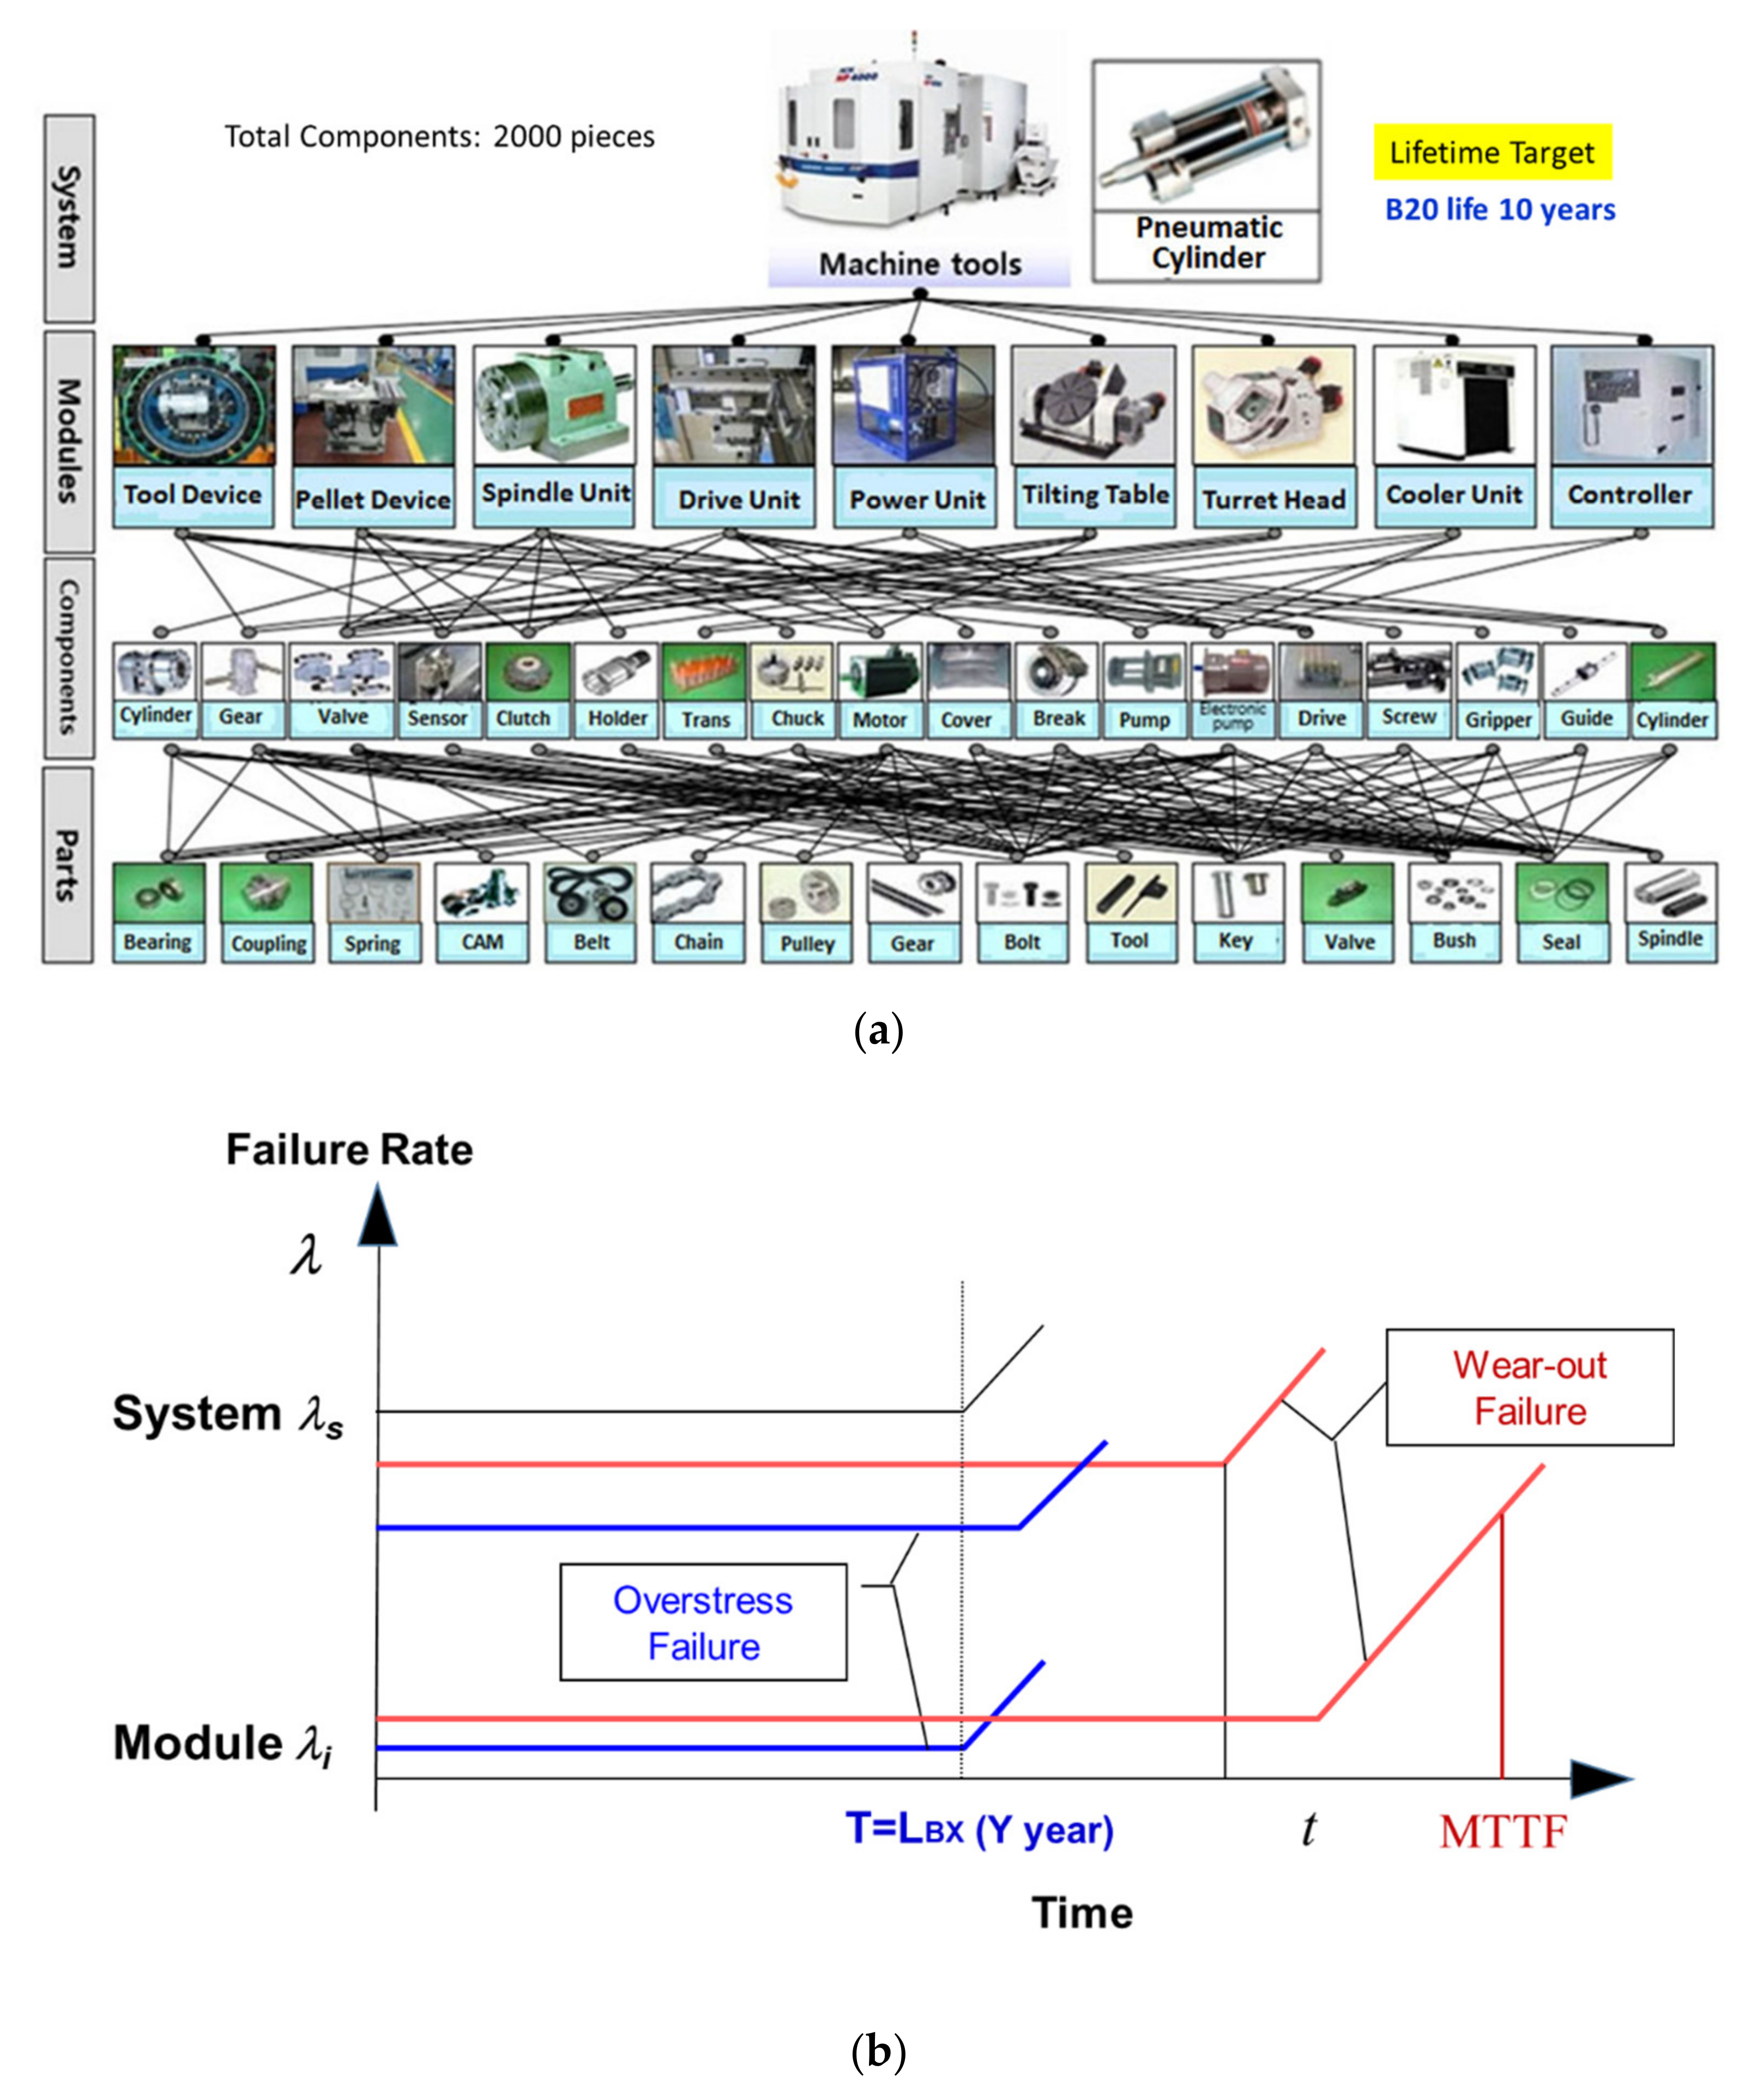
Figure 2.
Reliability function R(t) and cumulative distribution function F(t).
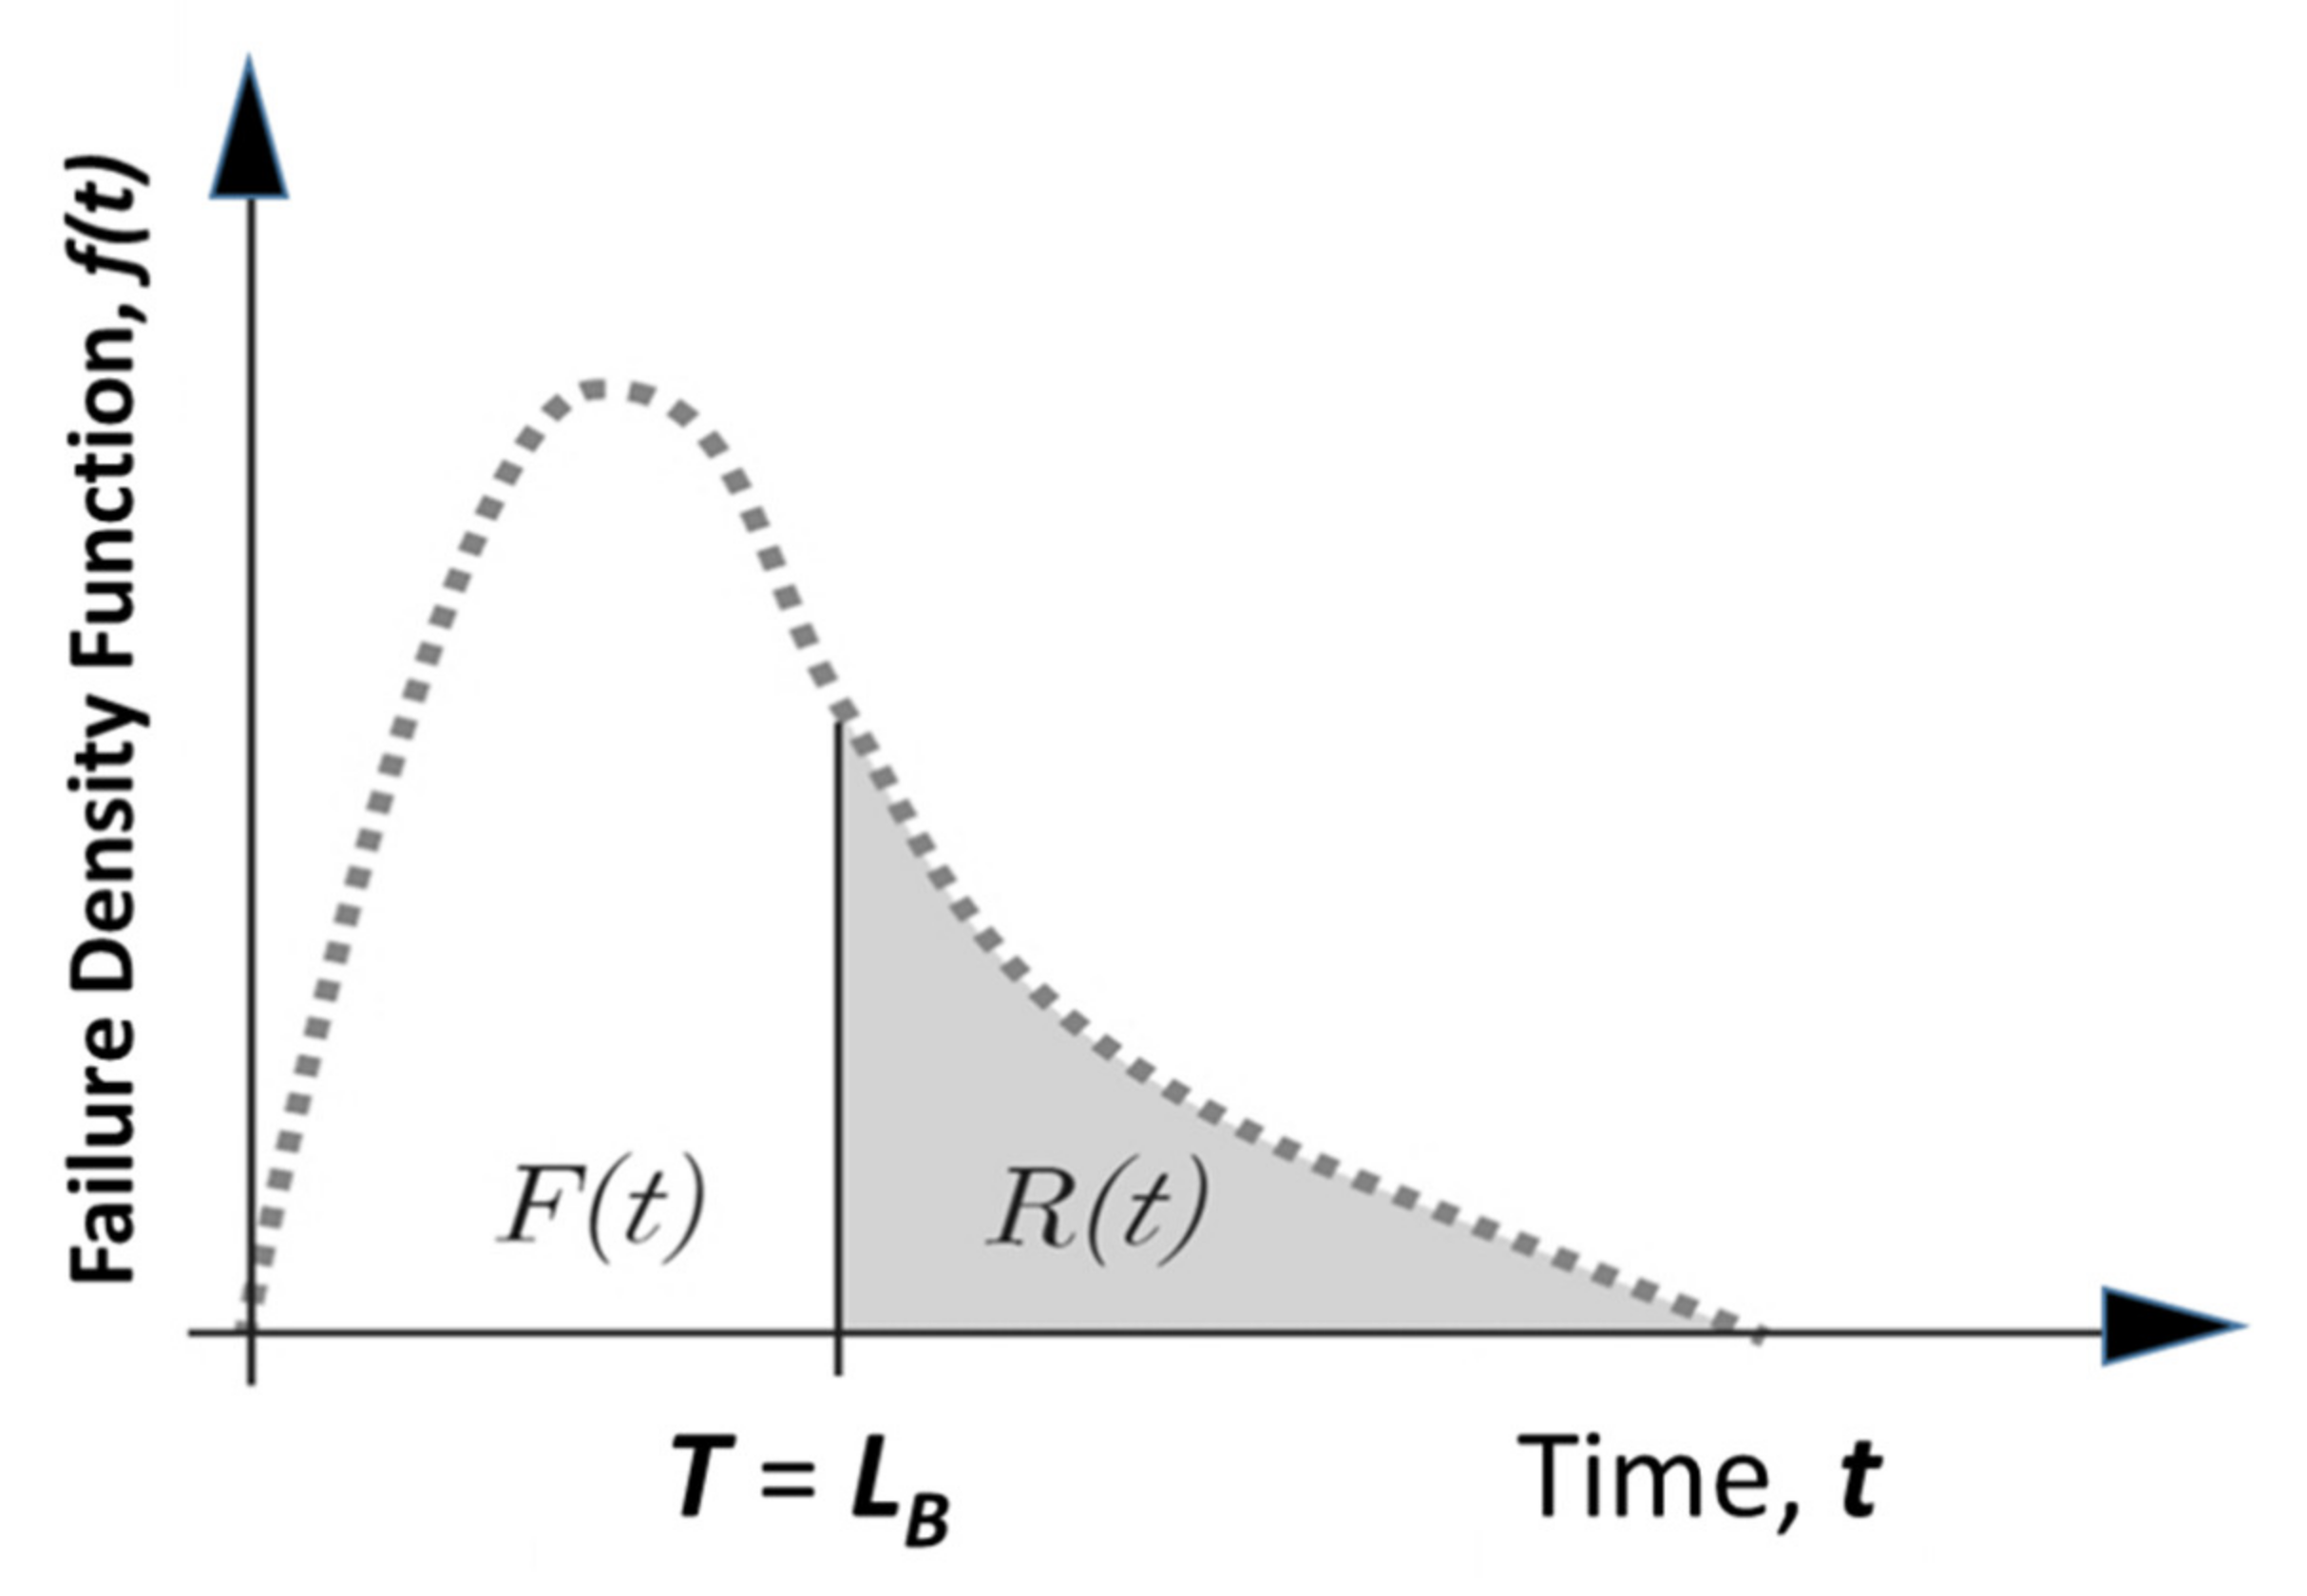
Figure 3.
Intended function of tool change device including pneumatic cylinder (example).
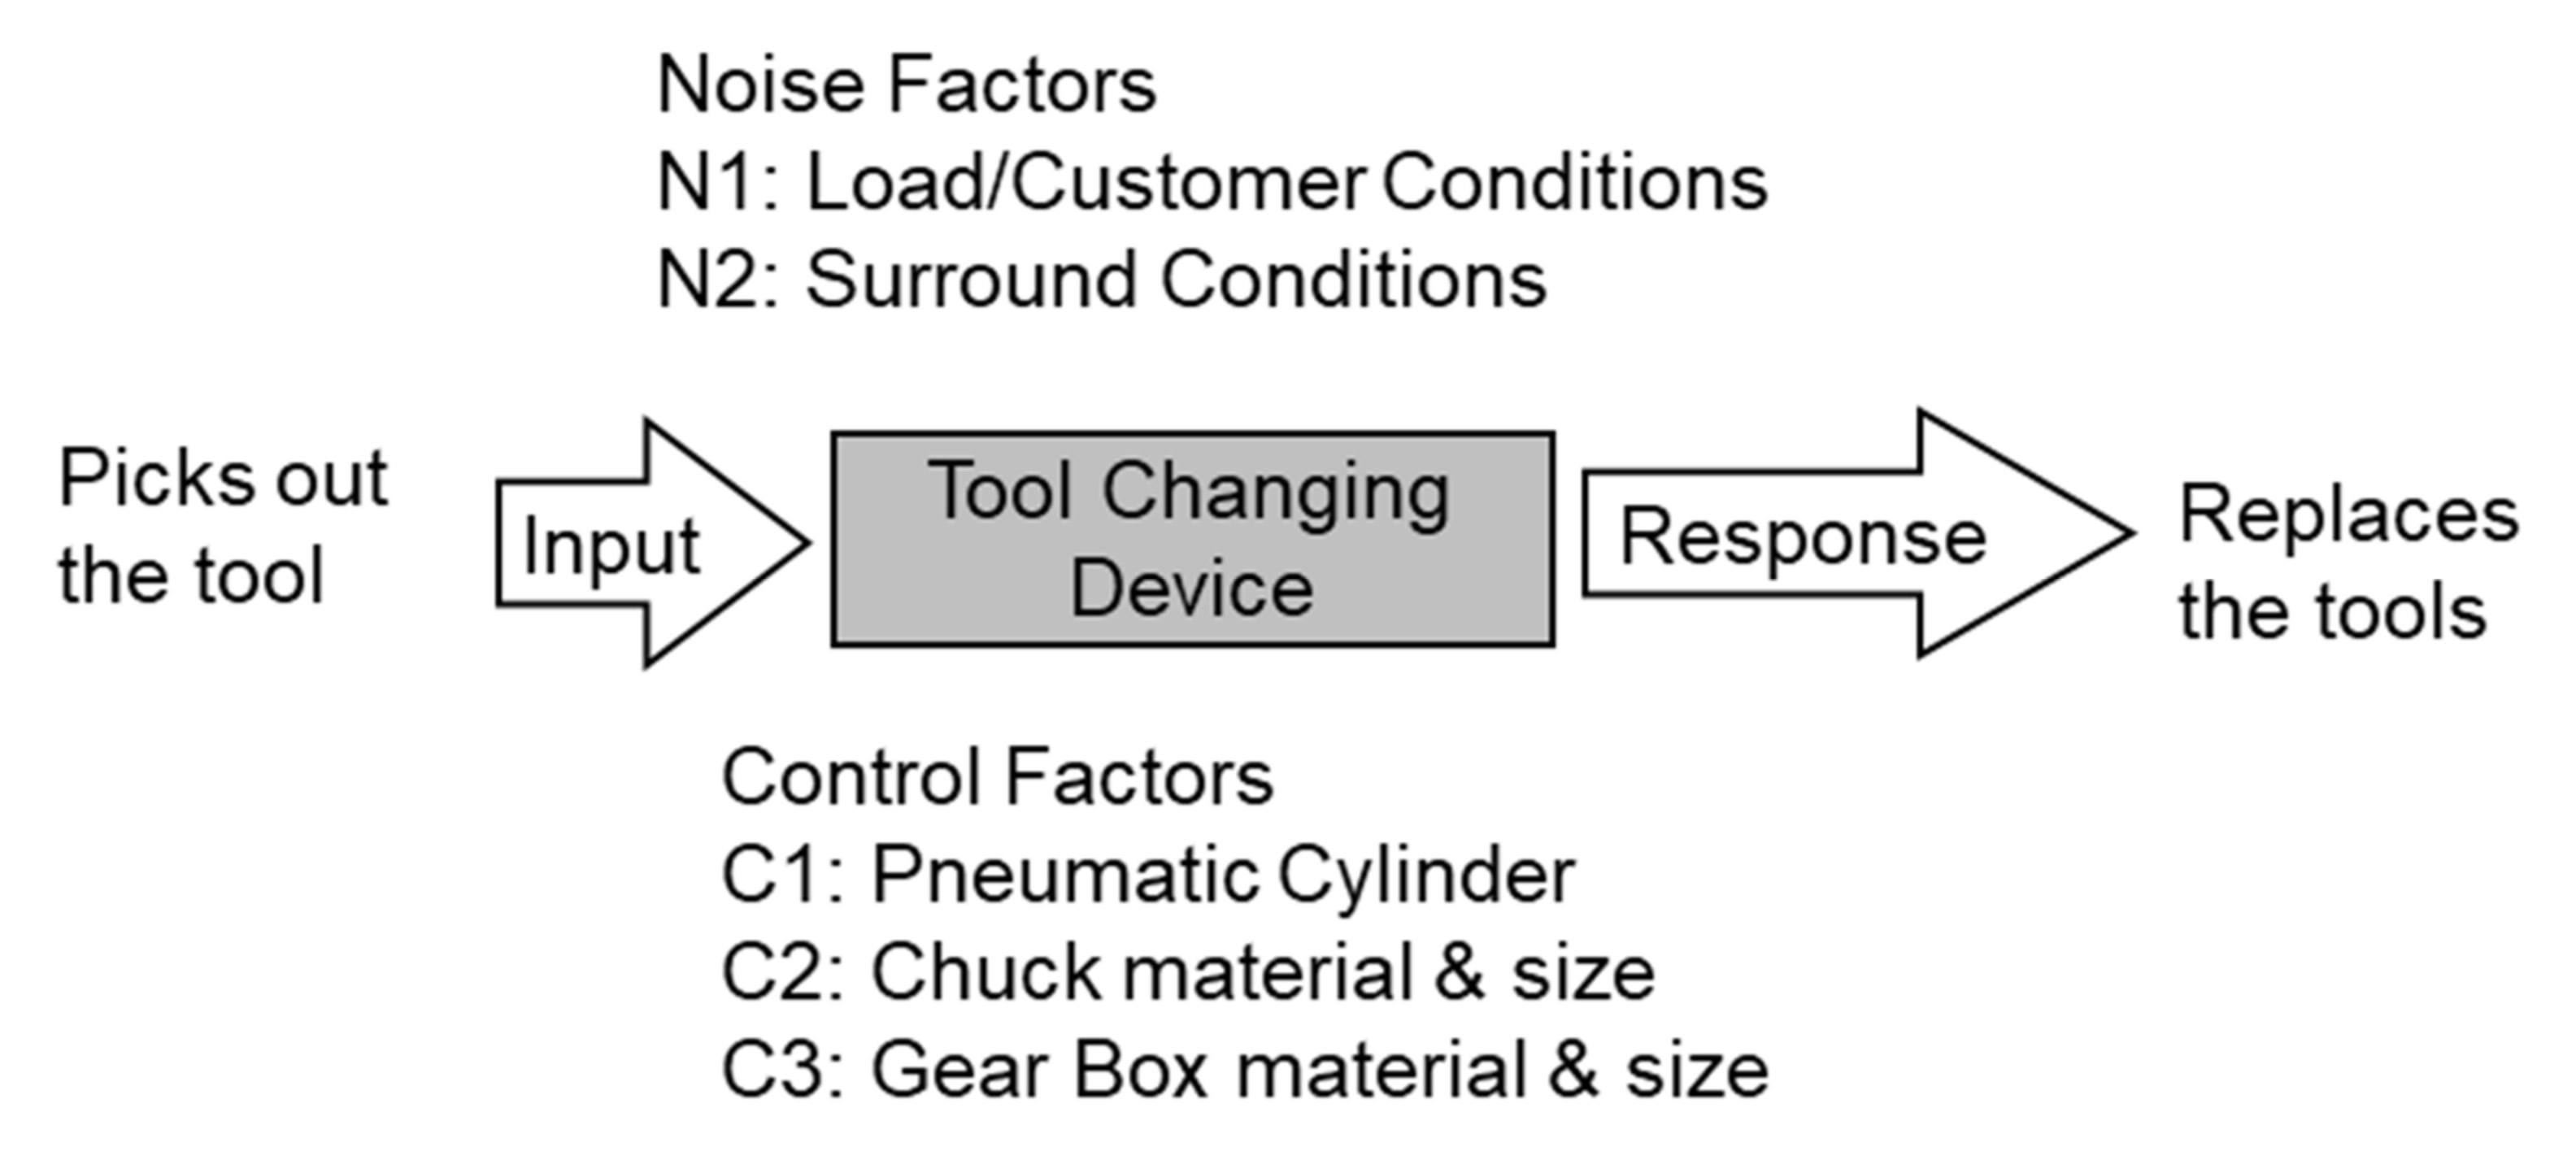
Figure 4.
Pneumatic cylinder usages in field.
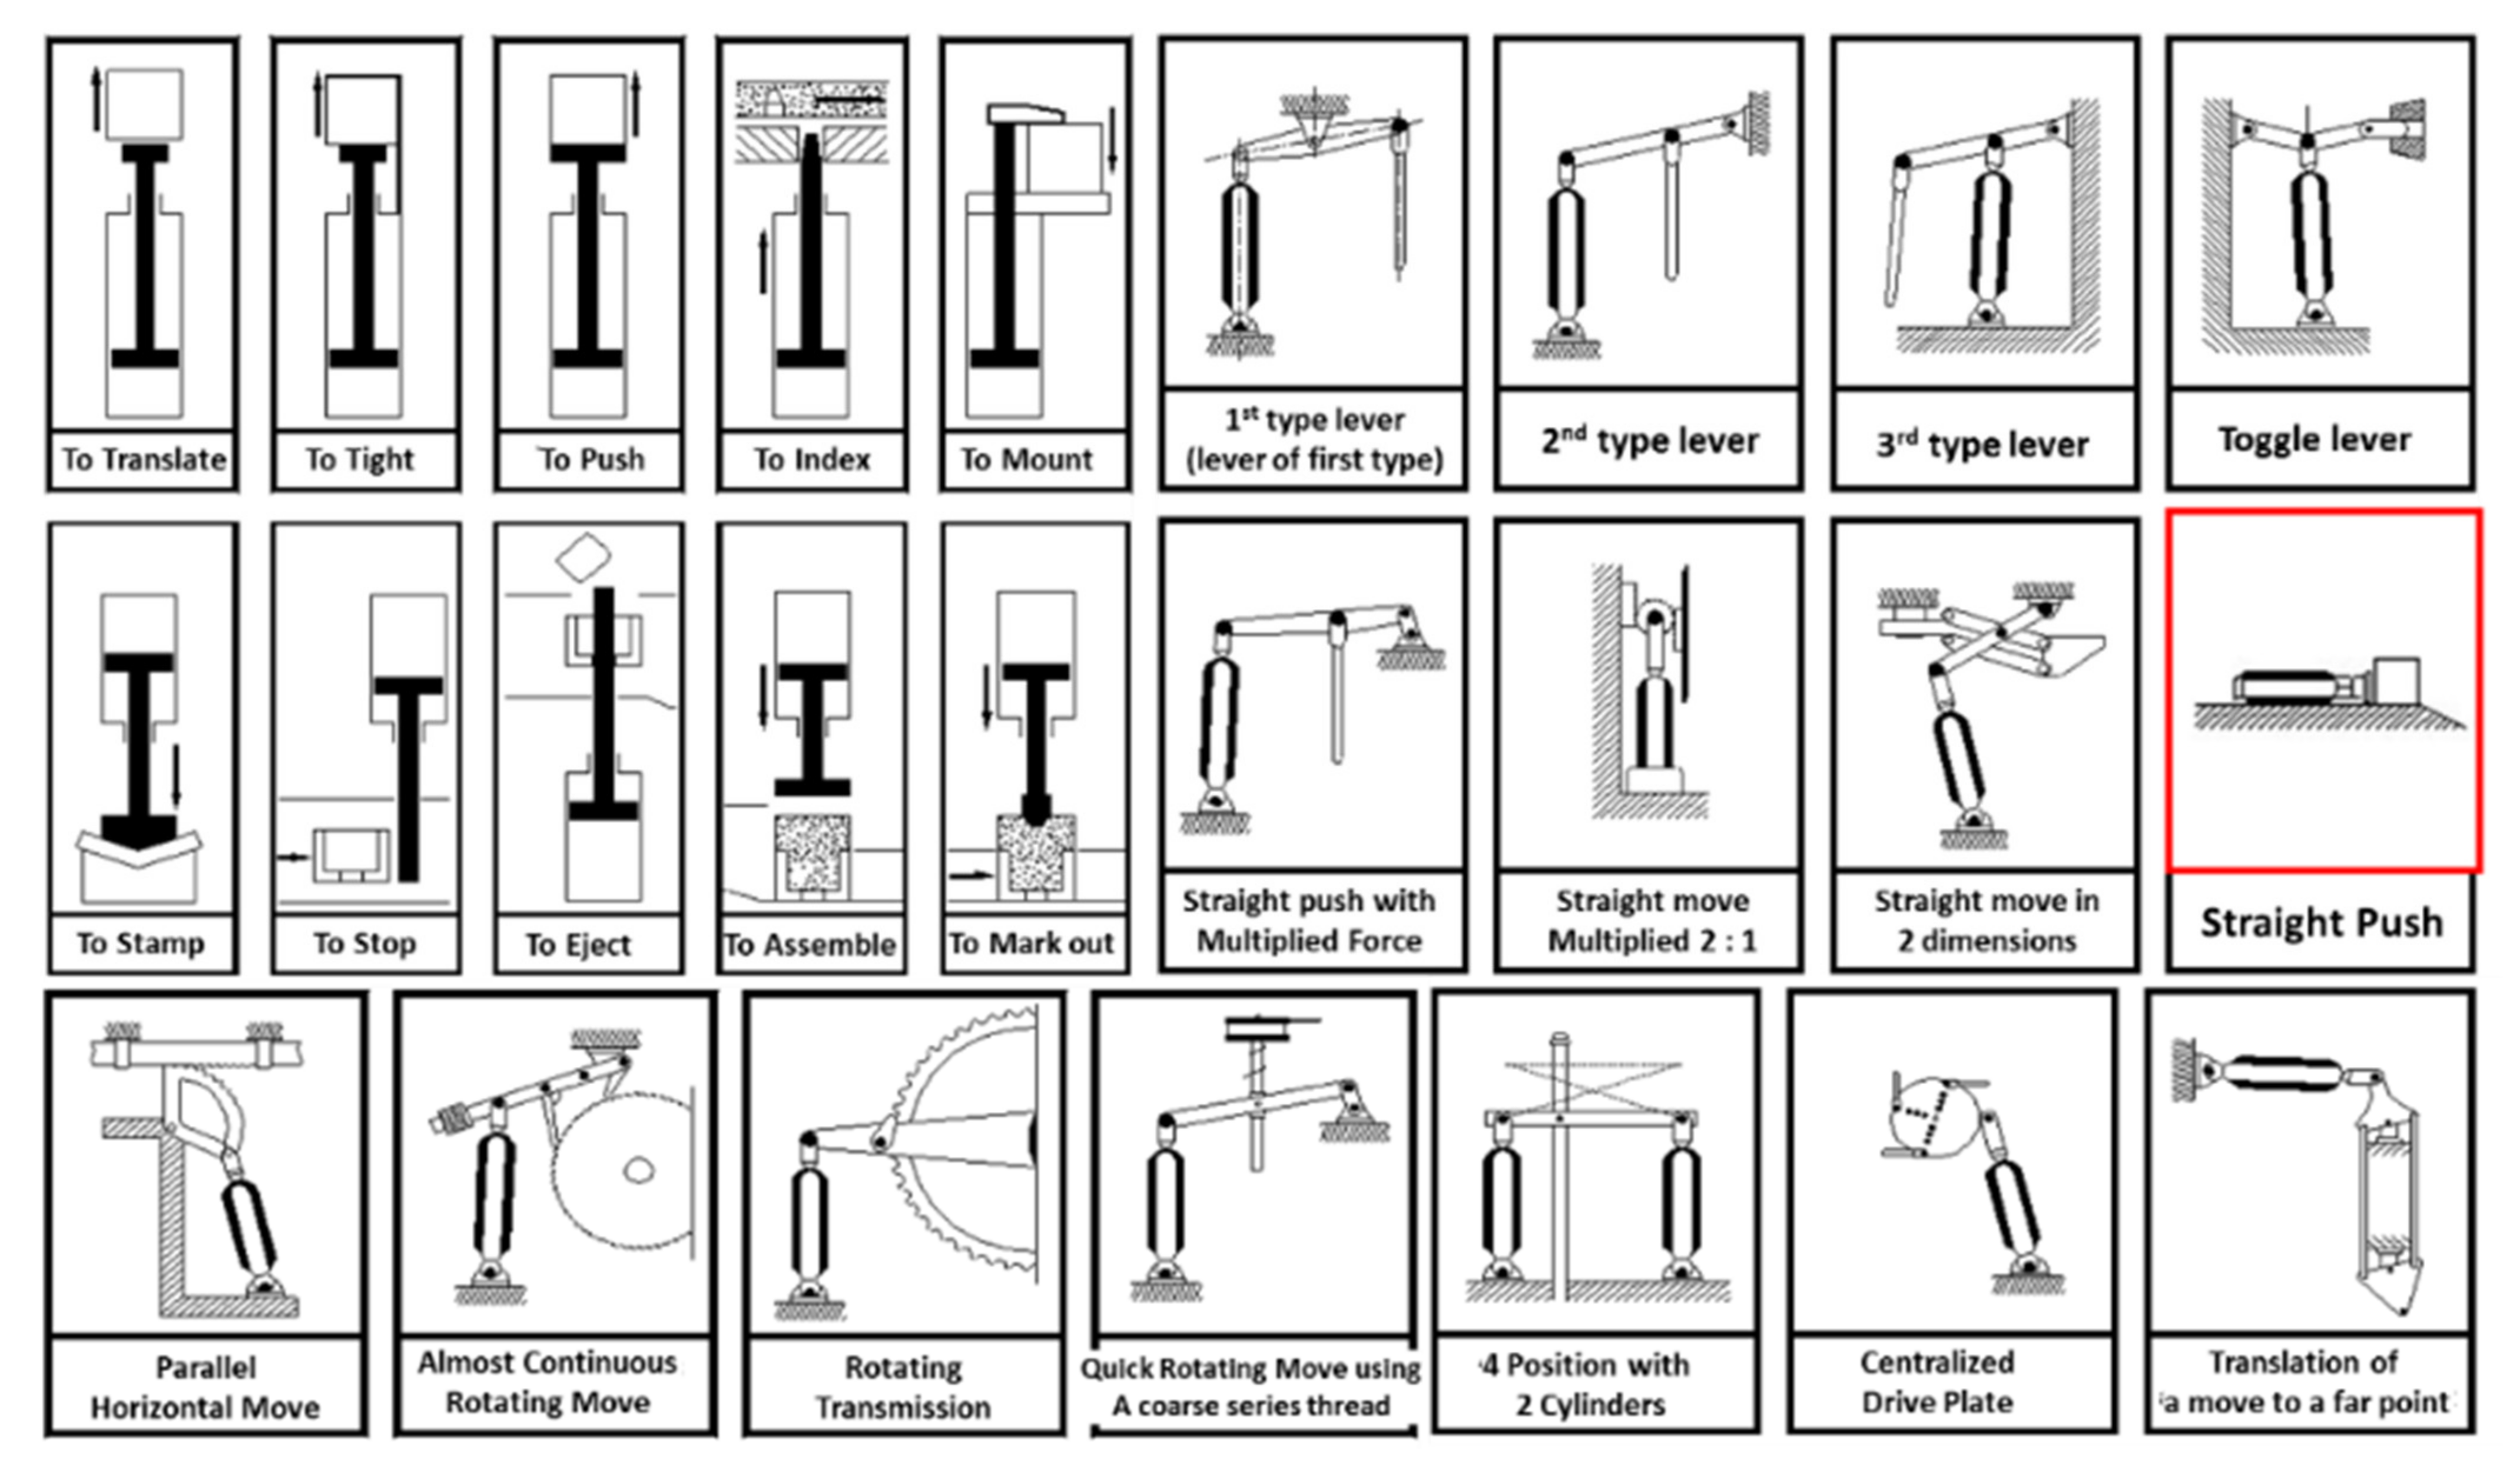
Figure 5.
Fatigue failure on the structure created by repeated (pressure) loading and design flaws.
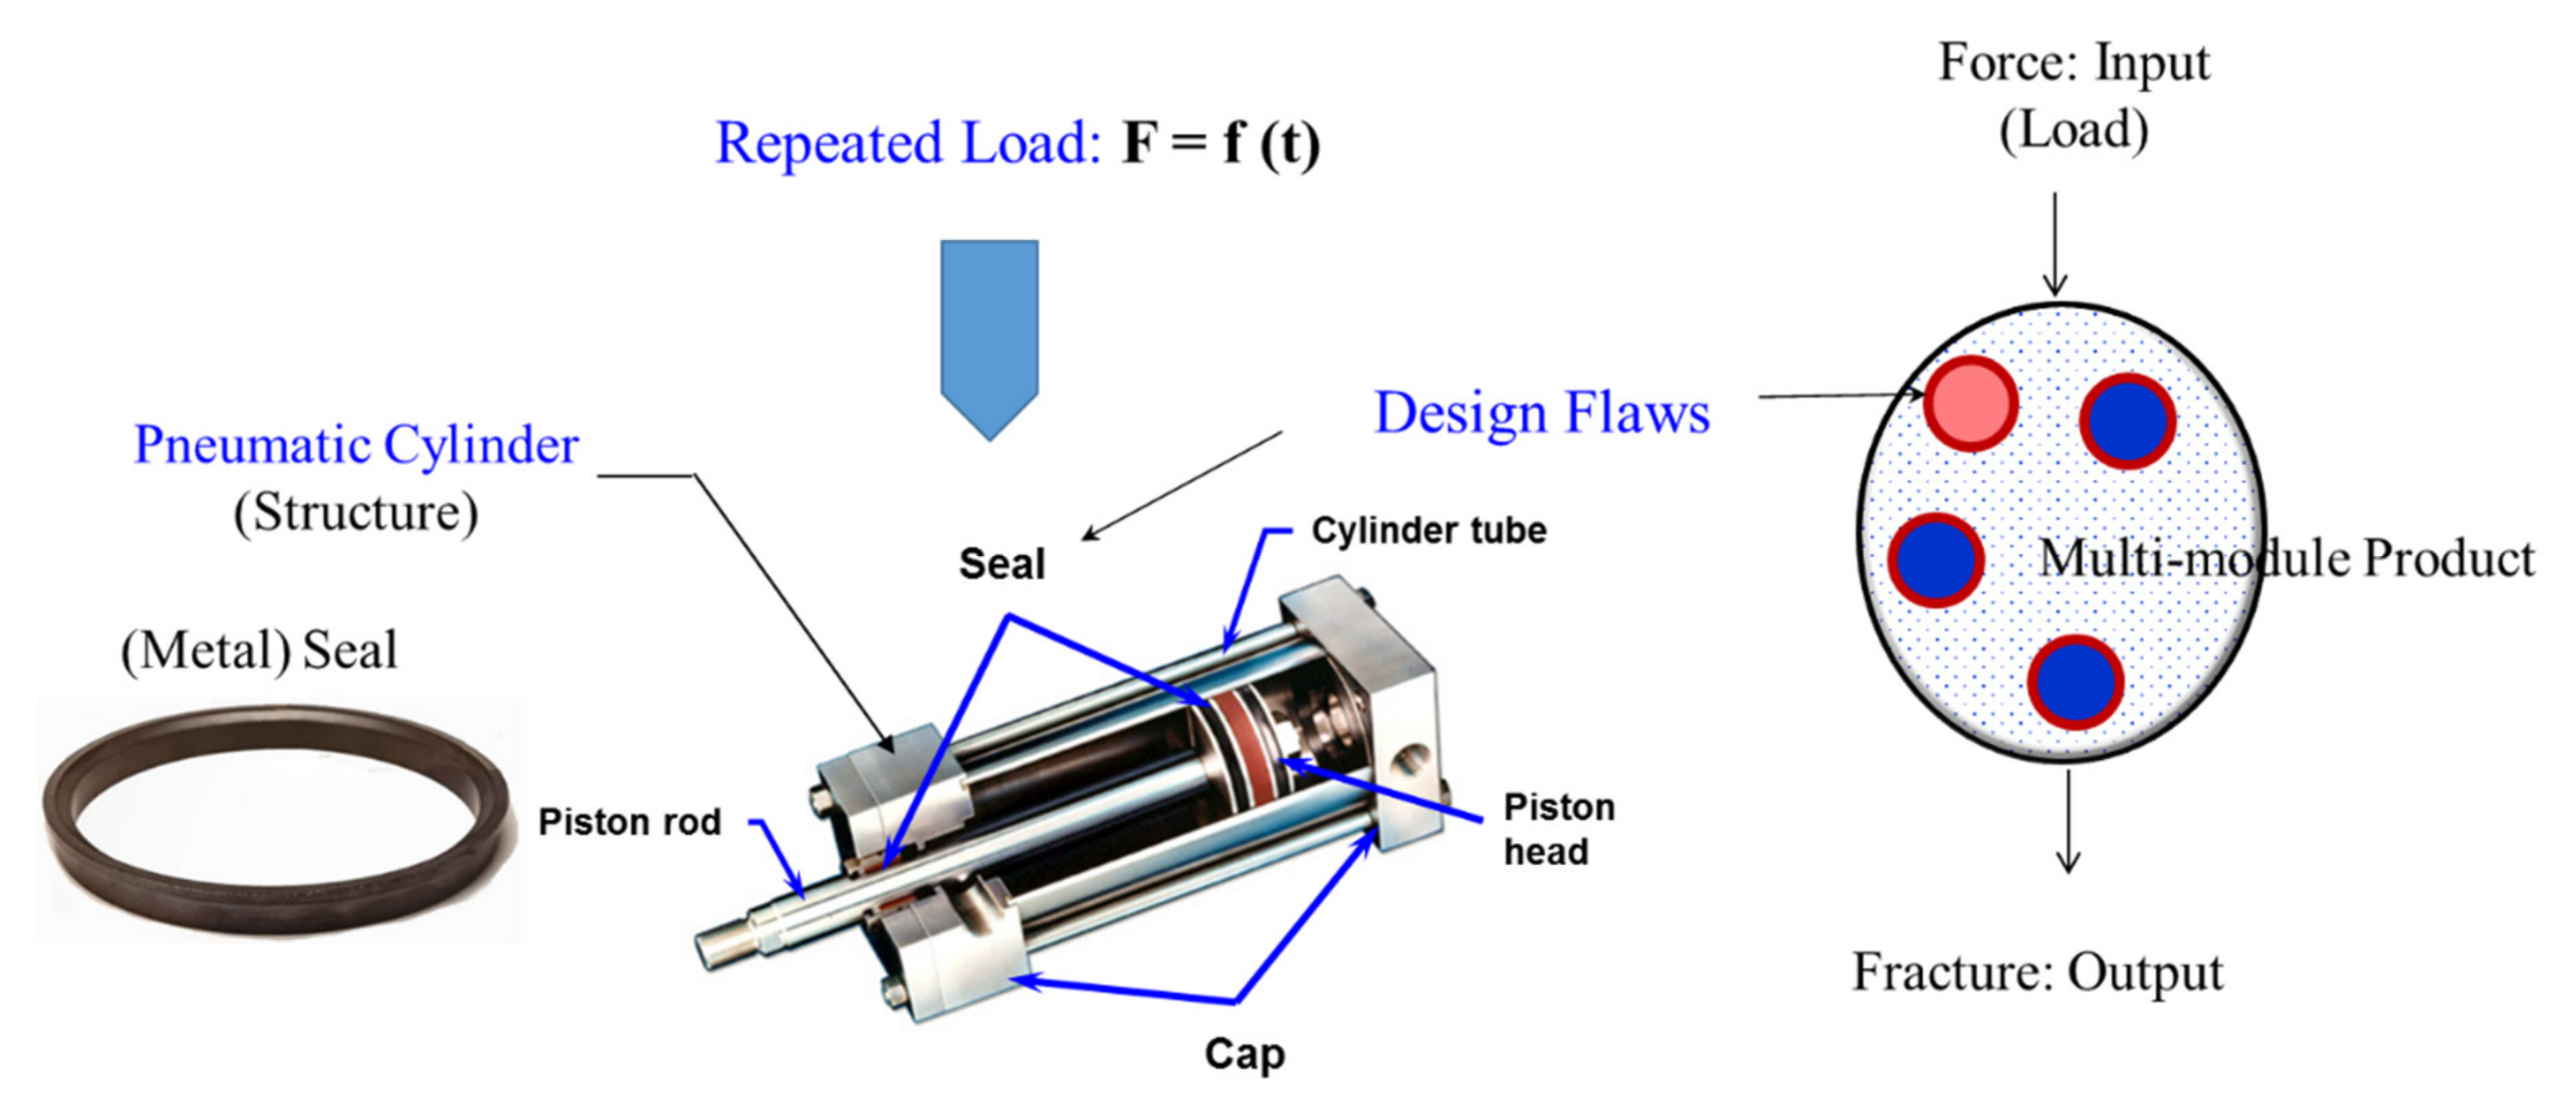
Figure 6.
Potential exchange in material such as silicon as electrical field is exerted.
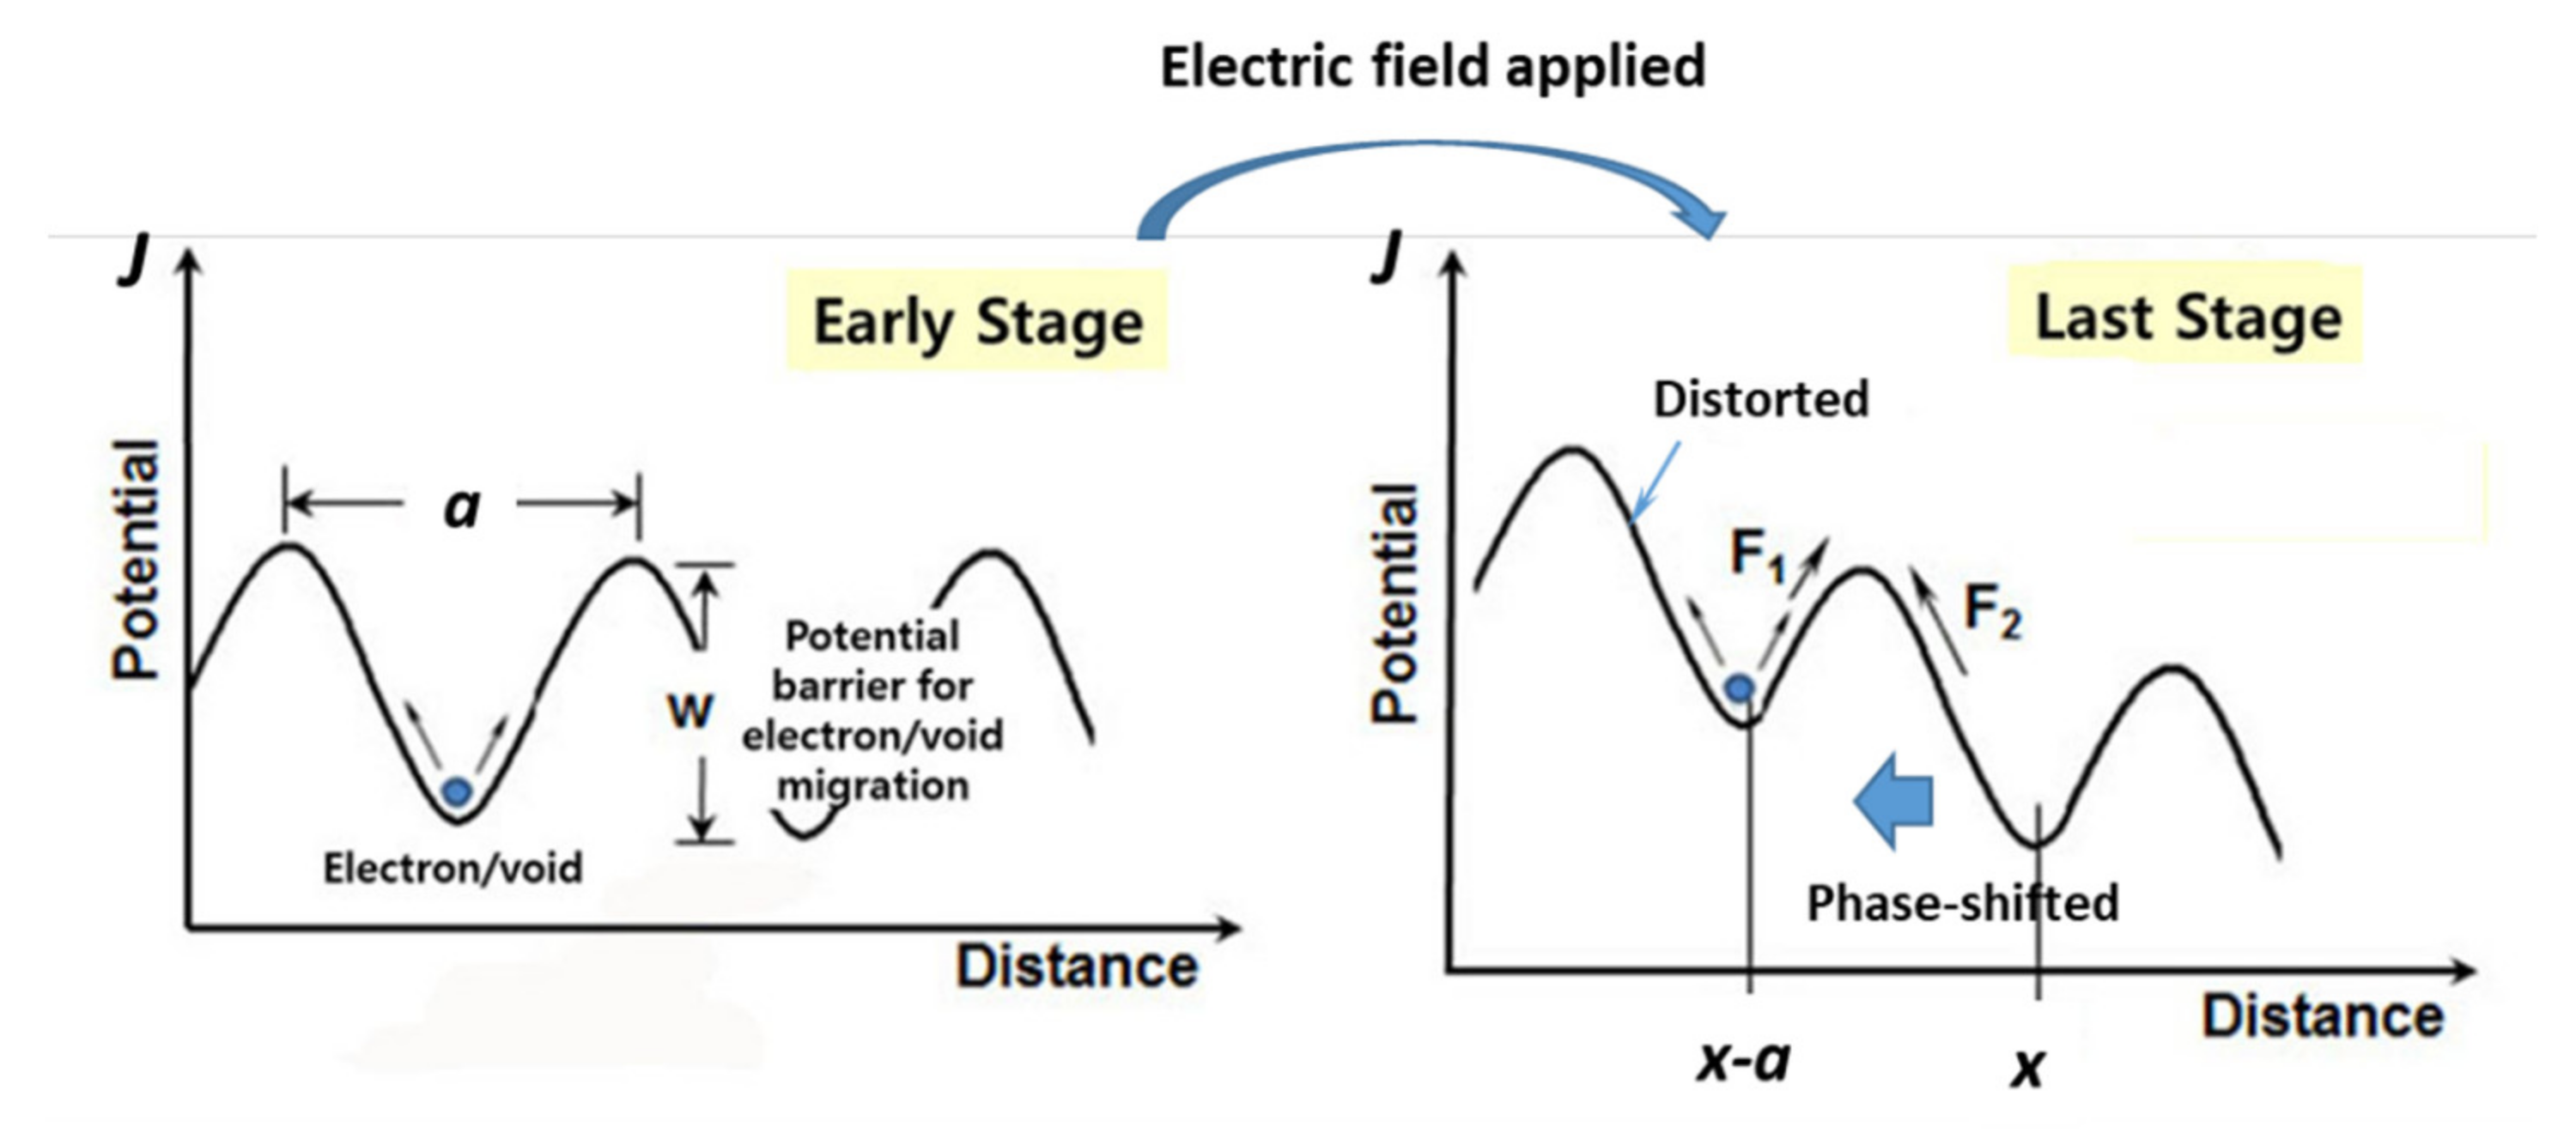
Figure 8.
Pneumatic cylinder in automatic assembly line: (a) automatic assembly line, (b) main parts.
Figure 8.
Pneumatic cylinder in automatic assembly line: (a) automatic assembly line, (b) main parts.

Figure 9.
Failed piston seal in field: (a) initial state (b) final state.

Figure 10.
Equipment for the ALTs; (a) test facility, (b) accelerated testing for cylinders mounted on load masses.
Figure 10.
Equipment for the ALTs; (a) test facility, (b) accelerated testing for cylinders mounted on load masses.
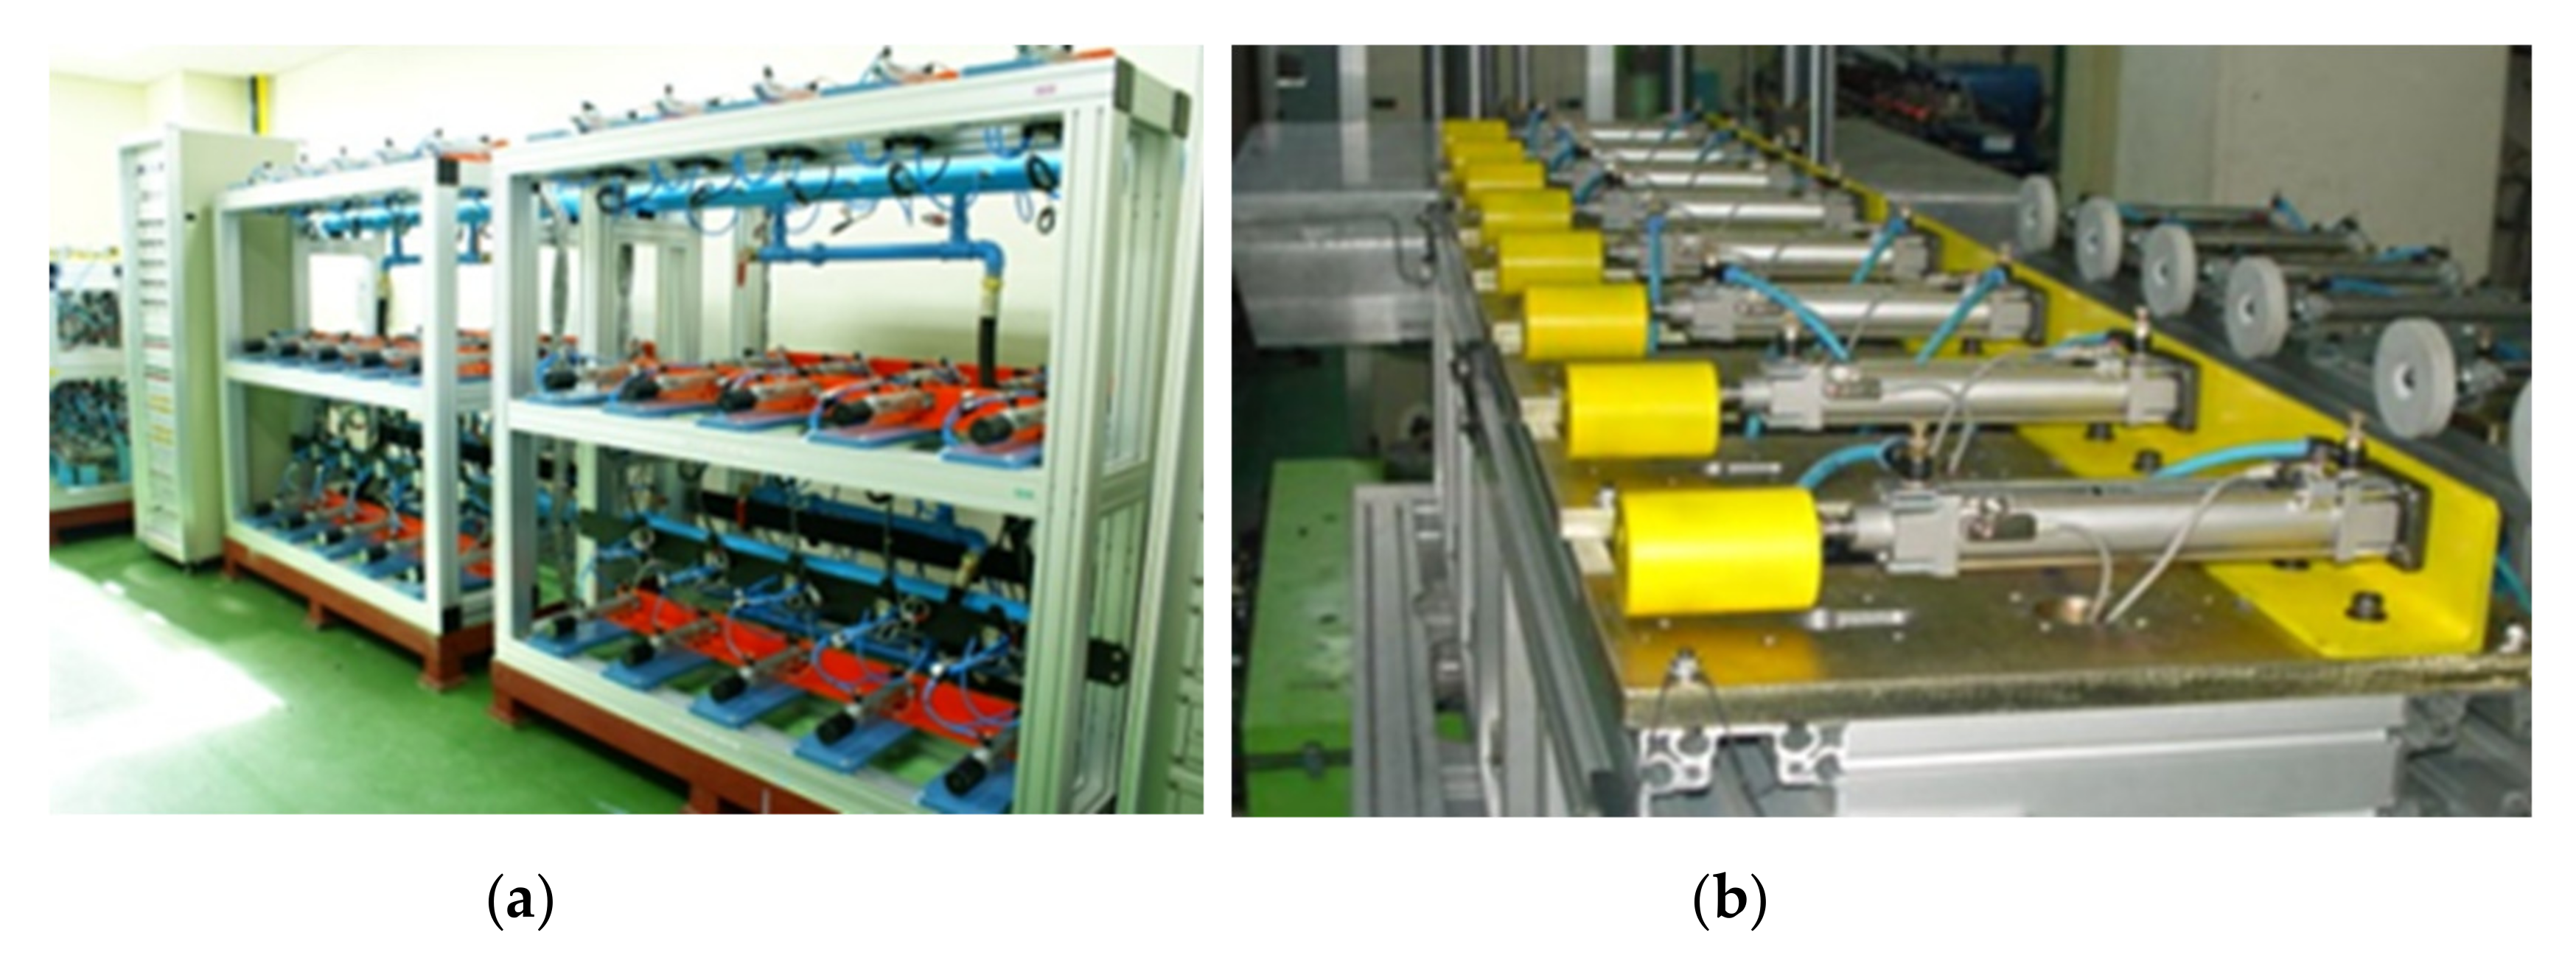
Figure 11.
Design issues of pneumatic cylinder in first ALT; (a) sample noise, (b) two chipped samples, (c) partially cracked sample.
Figure 11.
Design issues of pneumatic cylinder in first ALT; (a) sample noise, (b) two chipped samples, (c) partially cracked sample.
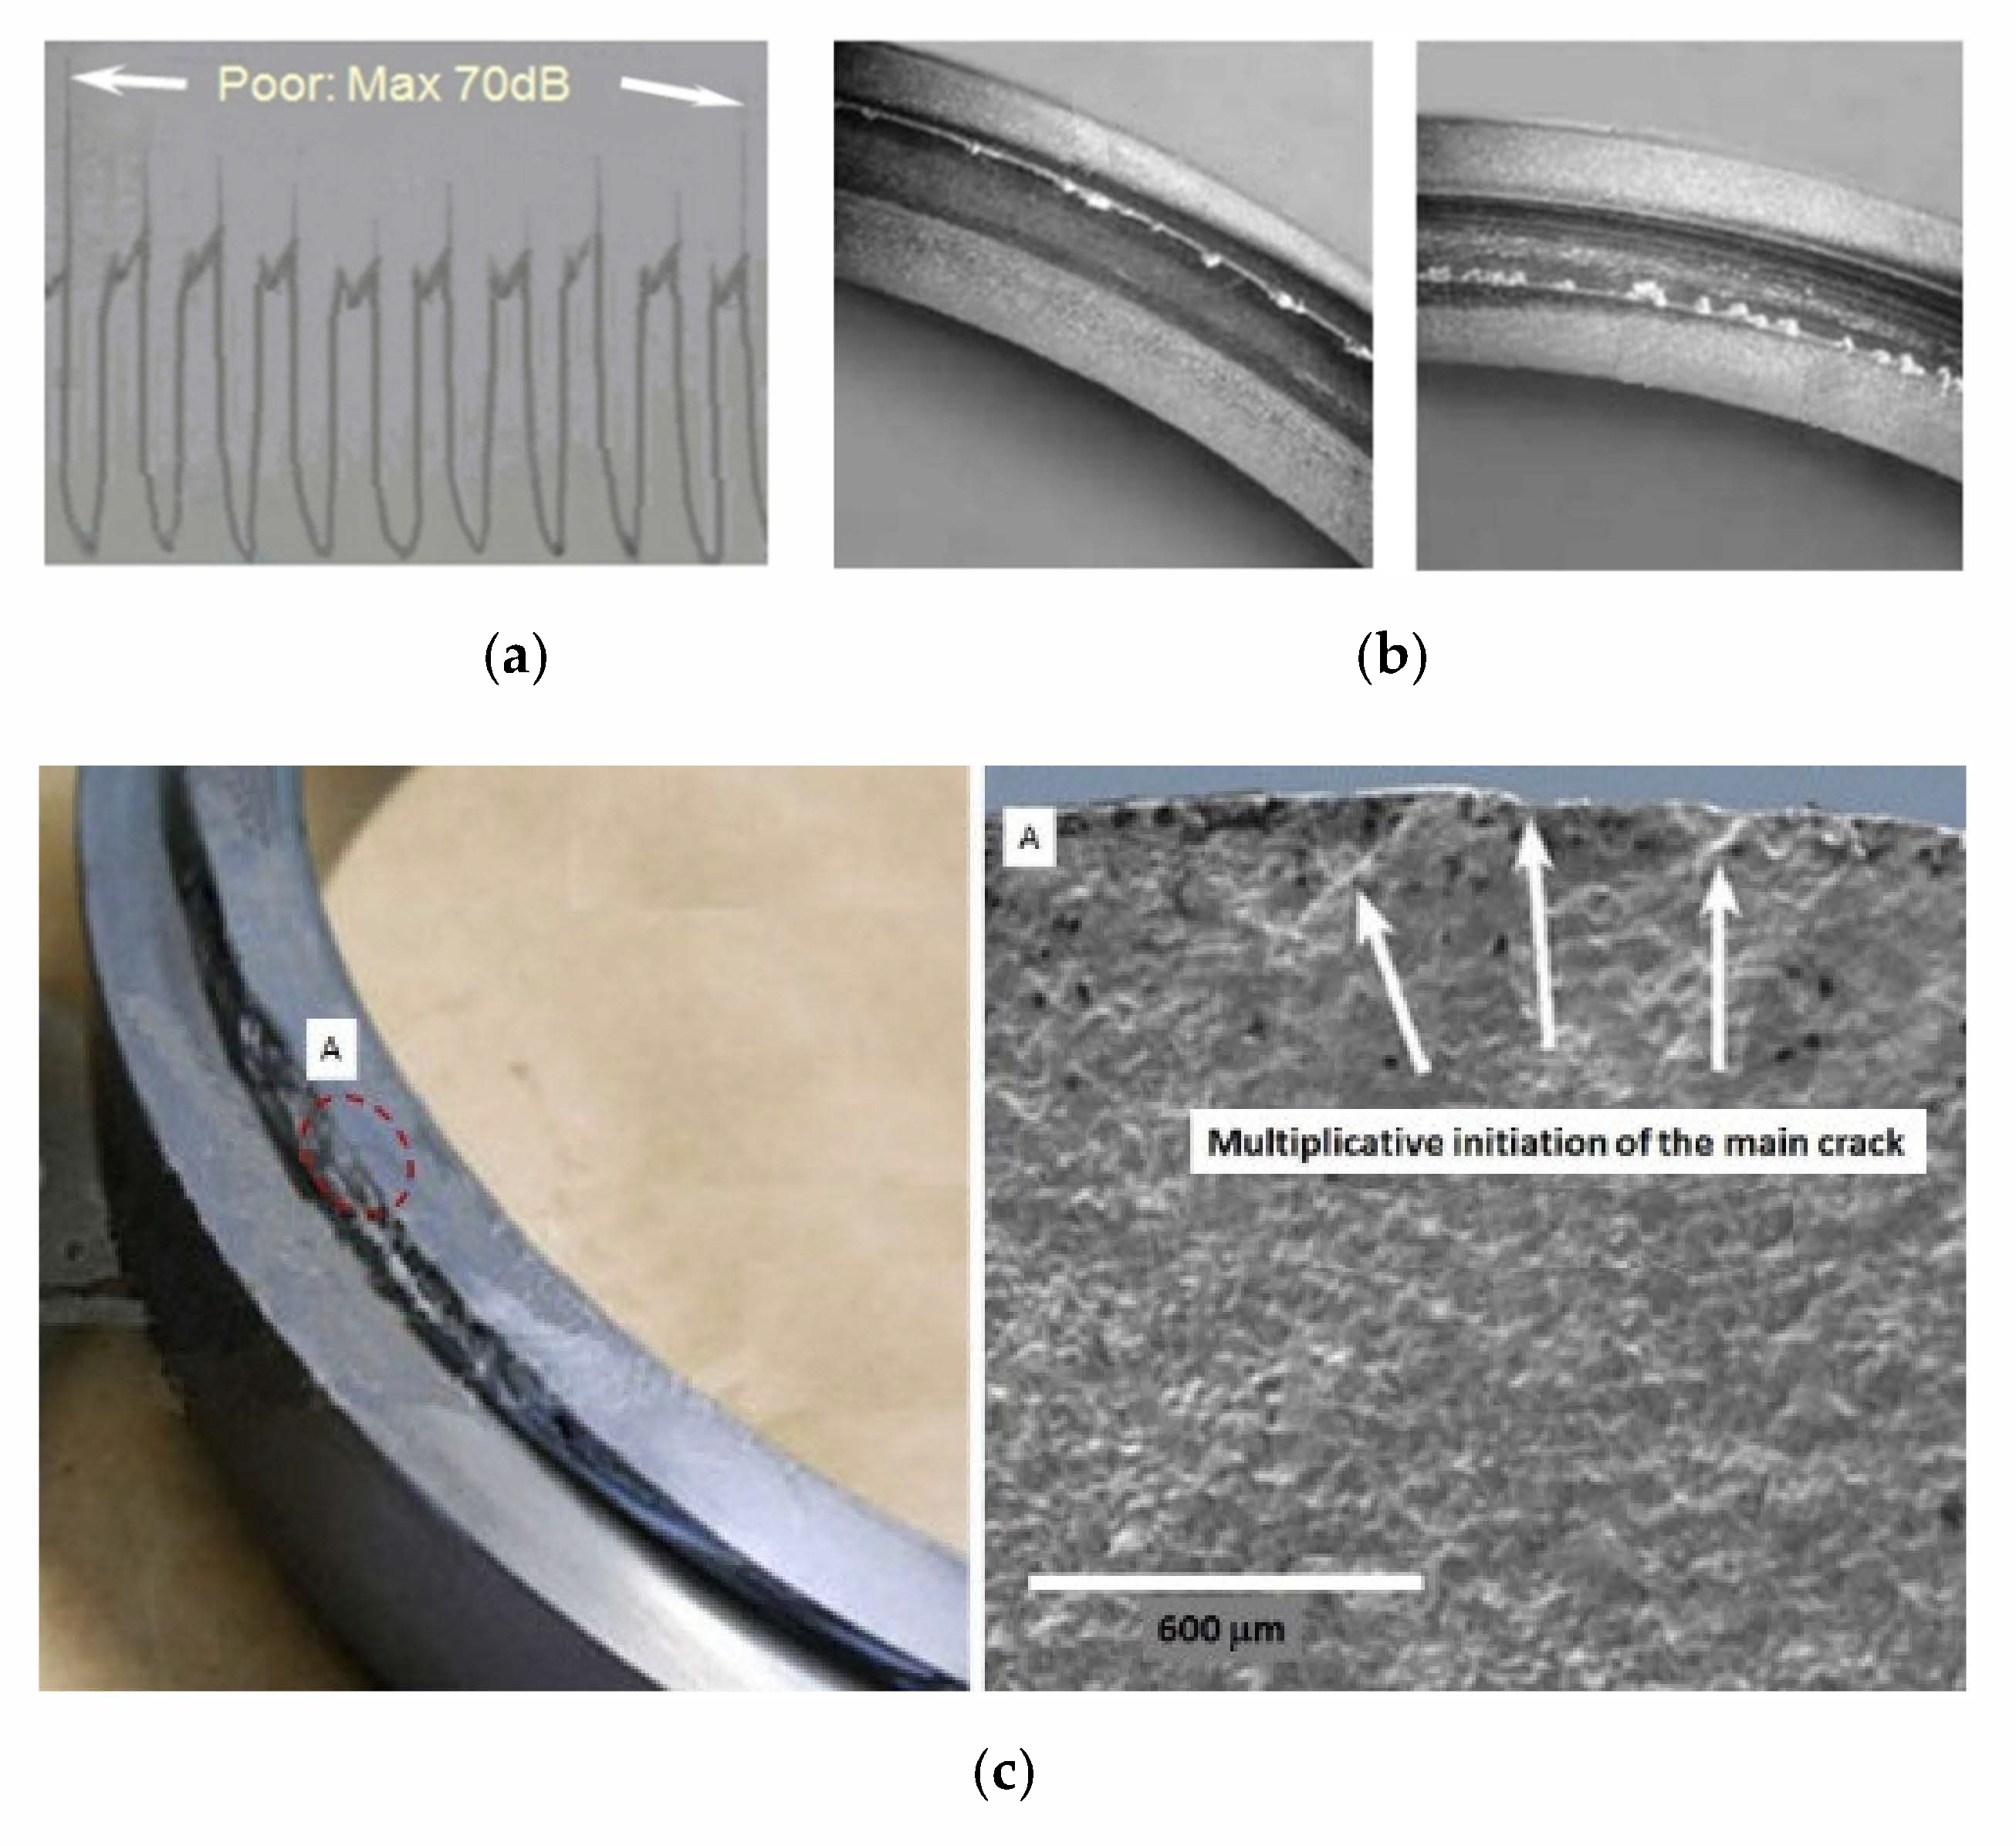
Figure 12.
Unsuccessful products in field and parametric ALT: (a) unsuccessful products in the testing data at the field (or normal condition), (b) unsuccessful products after parametric ALT.
Figure 12.
Unsuccessful products in field and parametric ALT: (a) unsuccessful products in the testing data at the field (or normal condition), (b) unsuccessful products after parametric ALT.
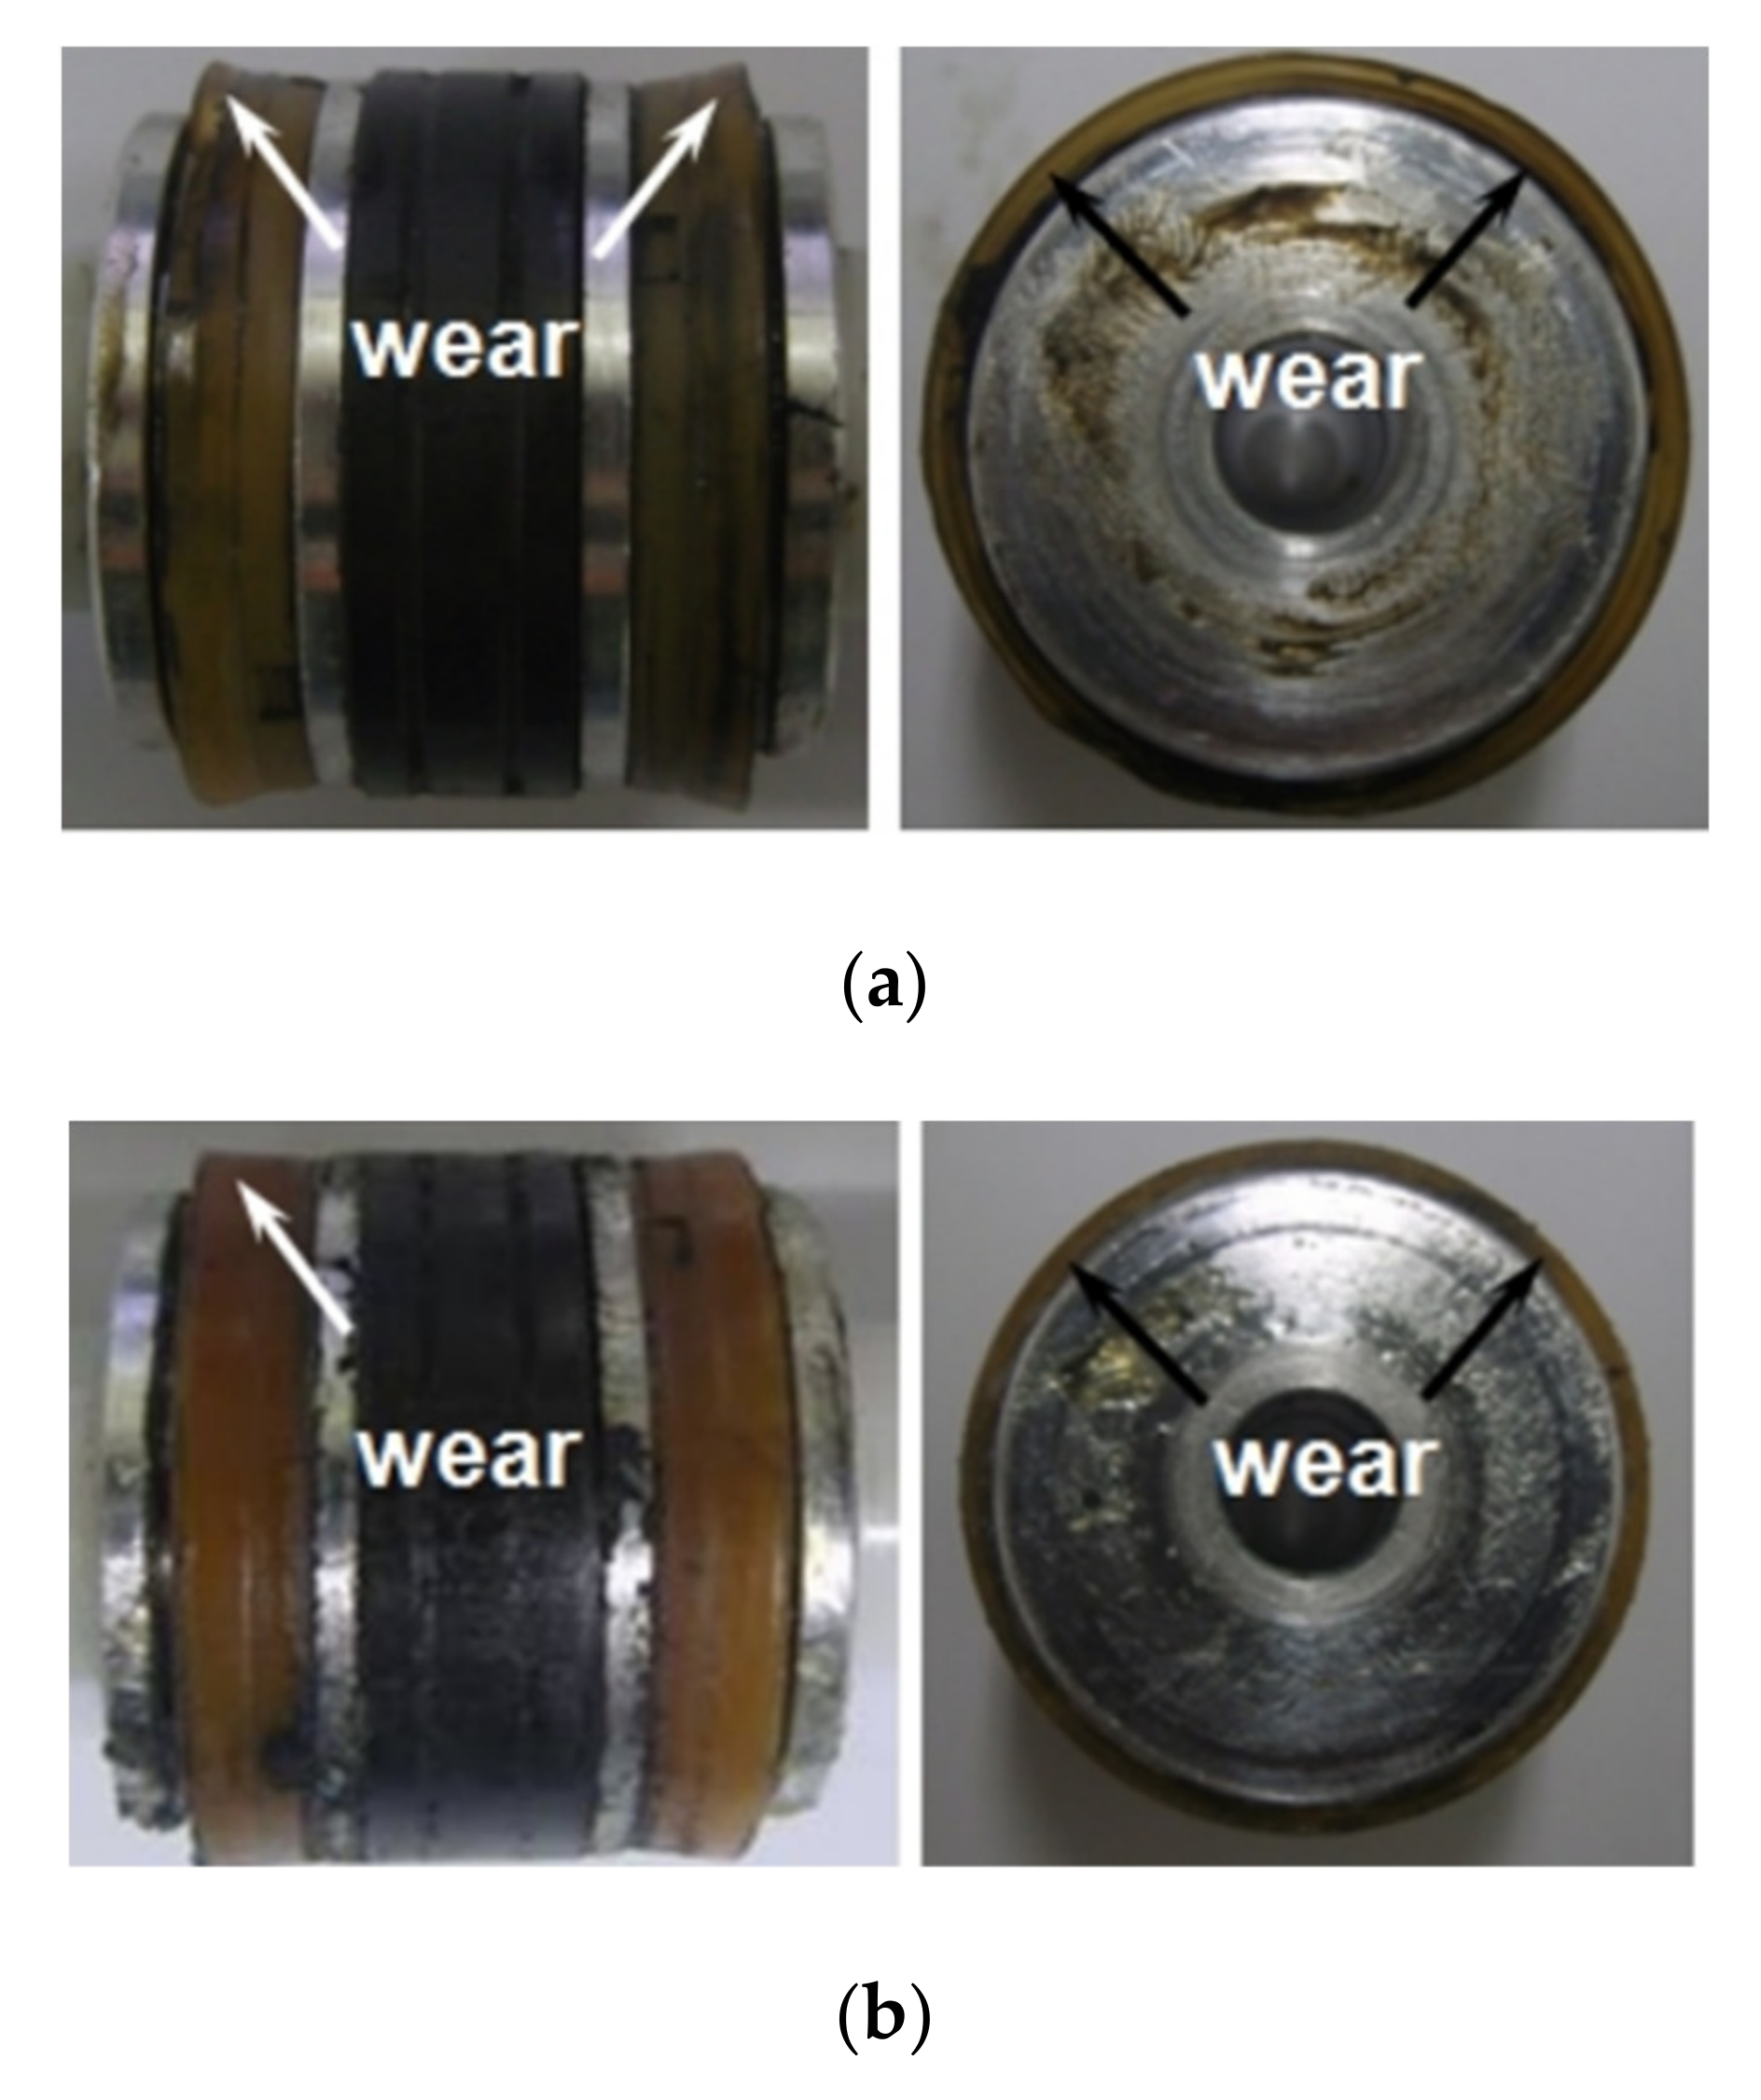
Figure 13.
Market statistics and consequences of ALT on Weibull chart.
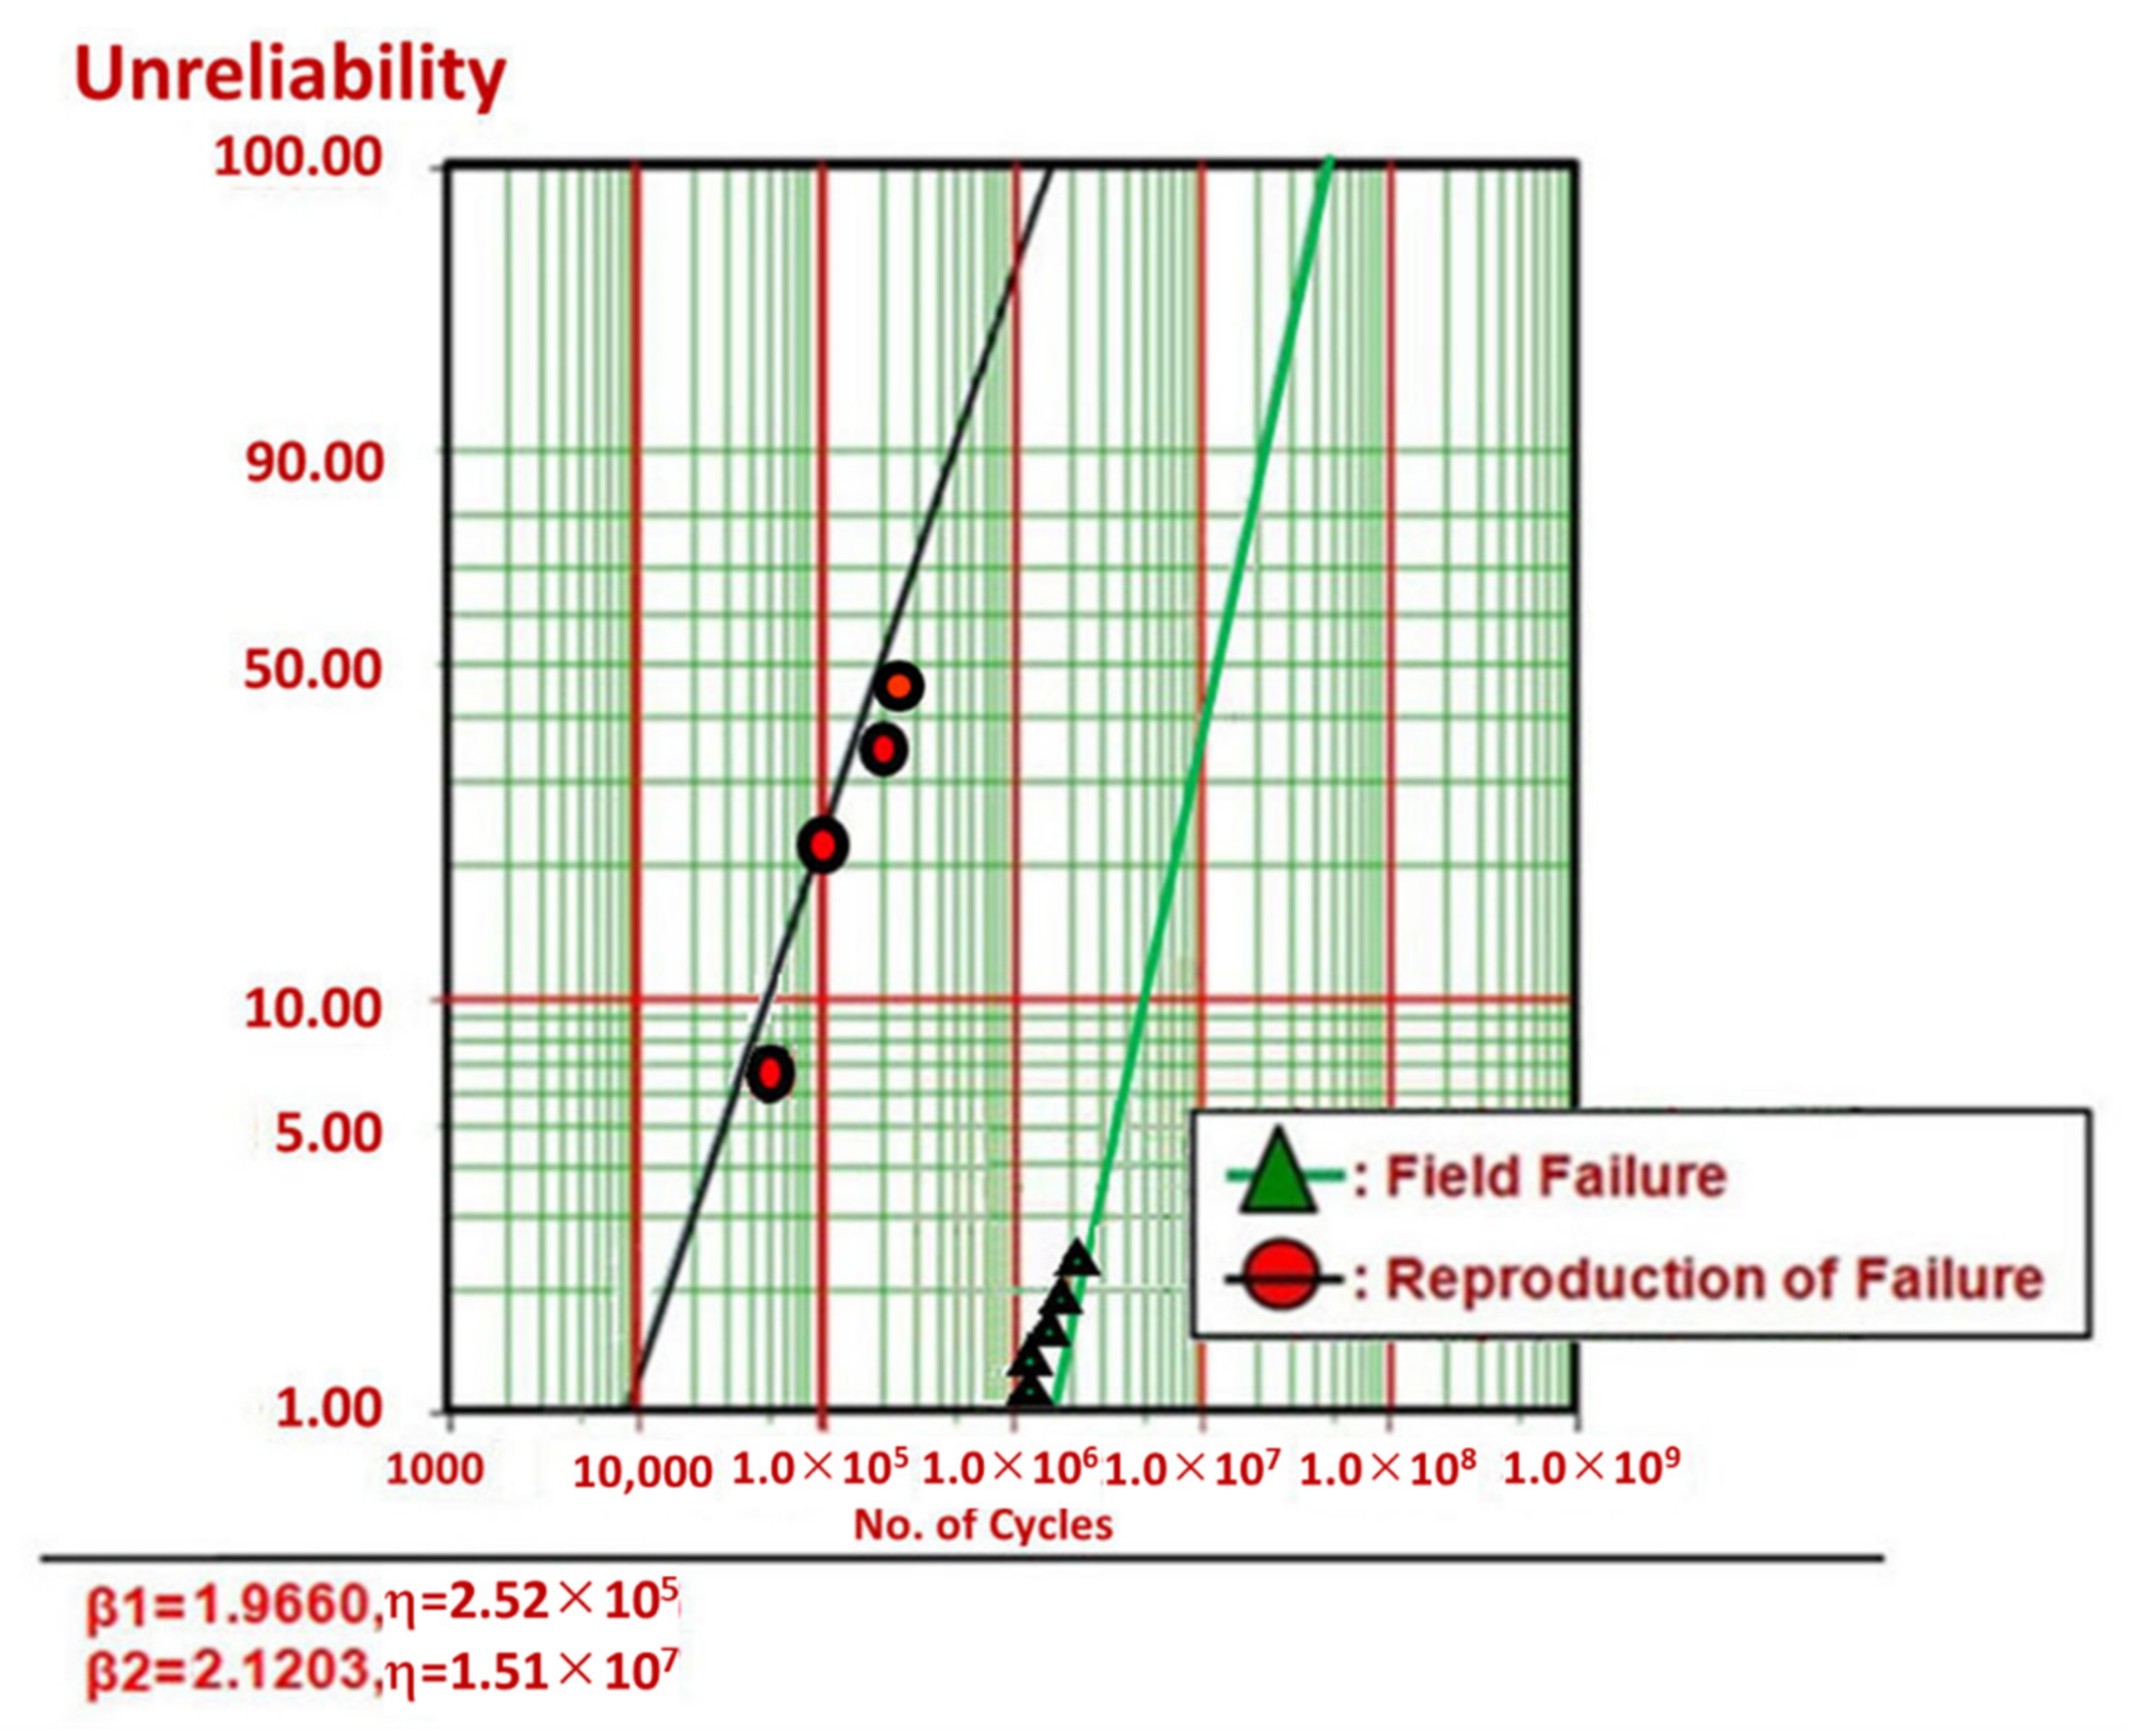
Figure 14.
Blocked rod cap found parametric ALT.
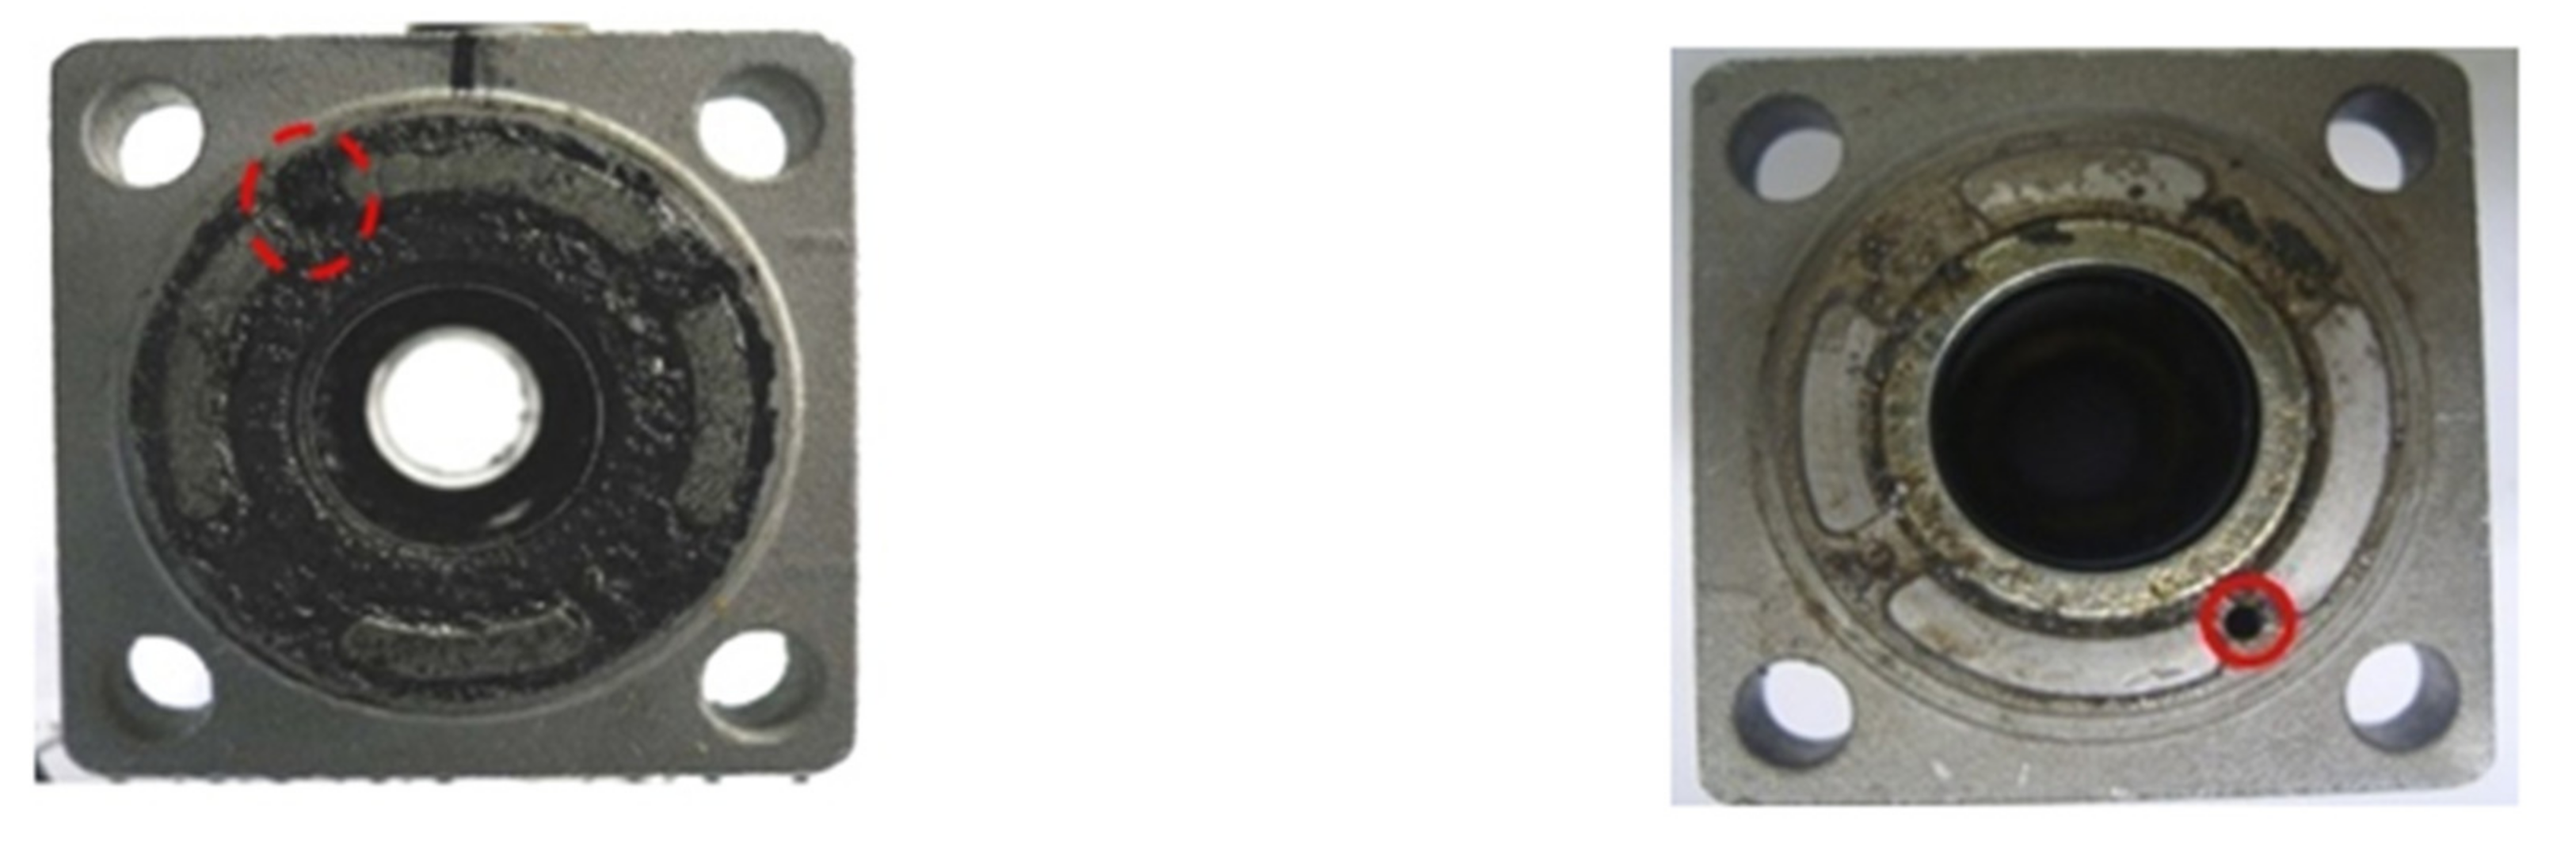
Figure 15.
Result of ALT on Weibull chart.

Table 1.
Whole ALT scheme of mechanical modules in a machine tool.
| Modules | Market Data | Anticipated Reliability | Targeted Reliability | |||||
|---|---|---|---|---|---|---|---|---|
| Failure Rate Per Year, λ (%/Year) | BX Life, LB (Year) | Failure Rate Per Year, λ (%/Year) | BX Life, LB (Year) | Failure Rate Per Year, λ (%/Year) | BX Life, LB (Year) | |||
| A | 0.24 | 4.2 | New | ×5 | 1.20 | 0.83 | 0.10 | 10(BX = 1.0) |
| B | 0.31 | 3.2 | Modified | ×2 | 0.62 | 1.61 | 0.10 | 10(BX = 1.0) |
| C | 0.15 | 6.7 | Modified | ×2 | 0.30 | 3.33 | 0.10 | 10(BX = 1.0) |
| D | 0.35 | 2.9 | Alike | ×1 | 0.35 | 2.9 | 0.10 | 10(BX = 1.0) |
| E | 0.30 | 3.3 | Alike | ×1 | 0.30 | 3.33 | 0.10 | 10(BX = 1.0) |
| Others (F/G/H/I) | 0.50 | 10.0 | Alike | ×1 | 0.50 | 10.0 | 0.50 | 10(BX = 5.0) |
| Product | 1.9 | 2.9 | - | - | 3.27 | 0.83 | 1.00 | 10(BX = 10) |
Table 2.
Power concept in a multi-port product expressed as effort and flow.
| System Attribute | Power, e(t) × f(t) | Effort, e(t) | Flow, f(t) |
|---|---|---|---|
| Translation | F × V | Force, F(t) | Velocity, V(t) |
| Rotation | Τ × ω | Torque, τ(t) | Angular velocity, ω(t) |
| Pump, compressor | ∆P × Q | Pressure difference, ∆P(t) | Volume flow rate, Q(t) |
| Electric | V × i | Voltage, V(t) | Current, i(t) |
| Magnetic | em × φ | Magneto-motive force, em(t) | Magnetic flux, φ(t) |
Table 3.
Pneumatic cylinder ALT conditions.
| System States | Worst Case | ALT | AF |
|---|---|---|---|
| Pressure (MPa) | 0.63 | 0.8 | 1.6 |
Table 4.
Pneumatic cylinder ALT outcomes.
| Parametric ALT | First ALT | Second ALT | Third ALT |
|---|---|---|---|
| Original Design | Design | Final Design | |
| In 220,000 cycles, there are no issues in the pneumatic cylinder | 6000 cycles: 1/10 noise (partially cracked sample) 10,500 cycles: 1/10 noise 11,000 cycles: 1/10 noise (two chipped samples) | 50,000 cycles: 1/10 fail 100,000 cycles: 1/10 fail 110,000 cycles: 1/10 fail 115,000 cycles: 1/10 fail (hardening and wear of piston seal) | 220,000 cycles: 10/10 OK |
| Structure | 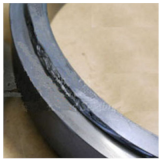 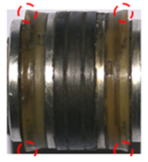 | ||
| Action plans | C1: material: Fe-36Ni Invar Alloy → Silicone rubber | C2: material: Silicone rubber → (thermoset) Polyurethane | |
Publisher’s Note: MDPI stays neutral with regard to jurisdictional claims in published maps and institutional affiliations. |
© 2021 by the authors. Licensee MDPI, Basel, Switzerland. This article is an open access article distributed under the terms and conditions of the Creative Commons Attribution (CC BY) license (https://creativecommons.org/licenses/by/4.0/).
Share and Cite
MDPI and ACS Style
Woo, S.; O’Neal, D.L.; Hassen, Y.M. Enhancing the Lifetime of the Pneumatic Cylinder in Automatic Assembly Line Subjected to Repeated Pressure Loading. Metals 2022, 12, 35. https://doi.org/10.3390/met12010035
AMA Style
Woo S, O’Neal DL, Hassen YM. Enhancing the Lifetime of the Pneumatic Cylinder in Automatic Assembly Line Subjected to Repeated Pressure Loading. Metals. 2022; 12(1):35. https://doi.org/10.3390/met12010035
Chicago/Turabian StyleWoo, Seongwoo, Dennis L. O’Neal, and Yimer Mohammed Hassen. 2022. "Enhancing the Lifetime of the Pneumatic Cylinder in Automatic Assembly Line Subjected to Repeated Pressure Loading" Metals 12, no. 1: 35. https://doi.org/10.3390/met12010035
Note that from the first issue of 2016, this journal uses article numbers instead of page numbers. See further details here.