Article

The Role of Microparticles of β-TCP and Wollastonite in the Creation of Biocoatings on Mg0.8Ca Alloy

1
Laboratory of Physics of Nanostructured Biocomposites, Institute of Strength Physics and Materials Science of SB RAS, 634055 Tomsk, Russia
2
Laboratory of Nanobioengineering, Institute of Strength Physics and Materials Science of SB RAS, 634055 Tomsk, Russia
3
Laboratory of Plasma Synthesis of Materials, Troitsk Institute for Innovation & Fusion Research, Moscow Region, 108840 Troitsk, Russia
4
Shared Use Center “Nanotech”, Institute of Strength Physics and Materials Science of SB RAS, 634055 Tomsk, Russia
5
Laboratory of Electrochemical Processes, Institute of Chemistry FEB RAS, 100-Letiya Vladivostoka Prospect 159, 690022 Vladivostok, Russia
6
Department of Electrochemistry, Innovent Technology Development, Pruessingstrasse 27 B, D-07745 Jena, Germany
7
Research School of High-Energy Physics, National Research Tomsk Polytechnic University, Lenin Prospect 30, 634050 Tomsk, Russia
*
Author to whom correspondence should be addressed.
Metals 2022, 12(10), 1647; https://doi.org/10.3390/met12101647
Submission received: 1 September 2022 / Revised: 19 September 2022 / Accepted: 23 September 2022 / Published: 30 September 2022
(This article belongs to the Special Issue Surface Modification of Metallic Biomaterials)

Abstract

:
The introduction of particles into the composition of coatings can significantly expand the range of properties and possibilities of the modified materials. In this work, the coatings containing microparticles of β-tricalcium phosphate (β-TCP) and wollastonite separately and in combination with each other were created on the surface of an Mg0.8Ca alloy. The morphology and microstructure of the coatings were examined by scanning and transmission electron microscopy. Their phase composition was determined with the help of X-ray diffraction analysis. The coating-to-substrate adhesion evaluation was carried out via the scratch-test method. Potentiodynamic polarization curves of the coatings were obtained during their immersion in 0.9% NaCl solution and their electrochemical properties were determined. Cytotoxic properties of the coatings were investigated by means of the MTT assay and flow cytometry in the course of the biological studies. In addition, NIH/3T3 cell morphology was analyzed using scanning electron microscopy. The structure, morphology, physical and mechanical, corrosive, and biological properties of the coatings depended on the type of particles they contained. Whereas the coating with β-TCP microparticles had higher adhesive properties, the coatings with wollastonite microparticles, as well as the combined coating, were less soluble and more biocompatible. In addition, the wollastonite-containing coating had the highest corrosion resistance.

1. Introduction

The evolution of biomaterials occurred in three stages in accordance with the levels of clinical requirements [1]. First-generation biomaterials, for example, Co-alloys, Al2O3, and polyurethane were supposed to be bioinert and not cause inflammation and damage to human tissue. The second generation of biomaterials, such as titanium alloys and hydroxyapatite, demonstrated bioactive properties. Now scientists are paying close attention to biomaterials that can be used as a temporary construction, and then gradually dissolve in the body, being replaced by natural tissue [2]. Thus, degradable biomaterials are the third generation of biomaterials.
Magnesium is an excellent candidate for creating bioresorbable implants, since its density and elastic modulus, equal to 1.7–2.0 g/cm3 and 45 GPa, respectively, are close to those of natural bone (1.8–2.1 g/cm3 and 10–40 GPa, respectively) [2,3]. Magnesium has a low corrosion resistance. Specifically, the salty environment of the human body affects magnesium and enhances its dissolution, which actually allows the use of Mg alloys as bioresorbable implant materials [4]. Magnesium can be completely dissolved in the human body, similar to biodegradable polymers; however, compared to polymers, the mechanical properties of Mg alloys are much stronger [1,2].
However, a high rate of bioresorption limits the use of magnesium and its alloys as a material for medical implants. In addition, an intensive hydrogen evolution occurs as a result of magnesium corrosion, according to the reaction [4]:
Mg + 2H2O → Mg(OH)2 + H2
Bone healing is hampered by mechanical interference from hydrogen gas. In addition, an increase in alkalinity in the area of implantation can lead to an imbalance in blood parameters [2,3], which can be the cause of inflammatory processes. In order to overcome the limitations of the practical application of Mg, further studies are required to improve its corrosion resistance. In order to control the corrosive properties of magnesium-based materials, a number of alloying elements were used, such as Mn, Cu, Gd, and Zn [2,5,6,7,8,9,10]. Moreover, the mechanical properties of these materials could also be improved by adding such elements as Al, Ca, and Zr [5,6,7,8,10].
The formation of protective coatings is another way to reduce the biodegradability of Mg and its alloys [9,10,11]. Various biocompatible compounds, such as tricalcium phosphate, hydroxyapatite, octacalcium phosphate, metals (Zr, Hf, Nd, Zn, Cr, and Ti), metal oxides (Al2O3, ZrO2, Cr2O3, SiO2, TiO2, Ta2O5, and MgO), fluorides, and biopolymers were used to modify the surface of Mg alloys [9]. It is very important to reveal the effect of the surface layer on the bioresorption rate. In this regard, the surface properties, such as chemical composition, charge, topography, presence of impurities, and heterogeneity are the most interesting [10]. In addition, the same properties have a huge impact on the biological activity of coatings, their ability to interact with cells, proteins, and bacteria [11,12]. It was found that Mg alloys dissolved faster under in vitro conditions than in vivo environments [10]. Cheon et al. [13] reported that tantalum/poly (ether imide) coatings exhibit both protective and osseointegration properties. Kaseem et al. [14] demonstrated interesting results of creating a protective inorganic layer with complex flower- or rod-like morphology. The coating significantly reduced the corrosion rate of the Mg alloy and was promising for biomedical applications.
The typical approach to the formation of a protective and bioactive layer on the surface of a magnesium alloy was the deposition or synthesis of calcium phosphates compounds [15,16]. This was natural since calcium phosphates exhibited the osteogenic ability and angiogenic potential due to their physicochemical properties and mineral composition close to that of bone mineral [17]. Calcium phosphate bioceramics, such as hydroxyapatite (HA, Ca10(PO4)6(OH)2) and β-tricalcium phosphate (β-TCP, Ca3(PO4)2), have osteoinductive and osteoconductive properties and are promising for orthopedic applications [17,18,19,20].
The micro-arc oxidation (MAO) (or plasma electrolytic oxidation (PEO)) method was an excellent way to modify magnesium alloys’ surfaces by creating a protective calcium phosphate layer [21]. With the help of this method, a porous ceramic coating with high adhesion to substrate could be produced. As shown by Lazarev et al. [22], the kinetics parameters of the formation of PEO coatings and the protective properties of coatings significantly depended on the alloy grain size. Yang et al. [23] reported that porous calcium phosphate coatings were formed by the PEO method on a magnesium surface with the use of HA particles. With an increase in the concentration of HA particles, the corrosion resistance of the coatings increased. Wierzbicka et al. [24] obtained the coatings on the surface of an AZ31B alloy with the help of flash plasma electrolytic oxidation (FPEO) process in the electrolytes consisting of two components with different solubility. The coating formed in the electrolyte containing Ca in a highly soluble form exhibited almost two orders of magnitude improvement in corrosion resistance compared with the coatings deposited from the electrolytes consisting of CaO-doped or Ca-free compounds. Echeverry-Rendon et al. [25] studied the effect of the magnesium modified by PEO coatings on different cell types. It was revealed that when the surface-coated Mg dissolved, the released compounds acted more destructively on vascular cells than on adipose tissue-derived stromal cells (ASCs). Moreover, the proliferation of ASCs was observed for all of the surface coatings.
Not only calcium phosphates can be used to modify Mg alloys and create a protective layer. Pan et al. [26] synthesized Si-containing and Si-free micro-arc coatings on Mg–1.74Zn–0.55Ca alloy. The intensive formation of calcium phosphates occurred in the presence of SiOxn− groups. They stimulated the sorption of Ca2+ and PO43− ions, which led to the formation of amorphous hydroxyapatite.
Calcium silicates, such as wollastonite (CaSiO3), is a promising material for medical application due to its excellent bioactivity and biocompatibility [27,28,29,30]. Ca and Si ions took an active part in the process of biomineralization and new bone formation [27,28]. Moreover, wollastonite could be used as a component of the coating formed on the surface of bioinert alloys [29,30] to improve their mechanical and biological properties. Calcium and magnesium silicates, such as bredigite (Ca7MgSi4O16), akermanite (Ca2MgSi2O7), and diopside (CaMgSi2O6), demonstrated remarkable biocompatibility, osteogenesis, and angiogenesis capabilities [31,32]. Some studies have shown that calcium and magnesium silicates stimulated apatite growth and bone formation more intensively than calcium phosphate ceramics (hydroxyapatite, β-tricalcium phosphate) [33,34]. In addition, interesting results were obtained using combined silicate and phosphate biomaterials. Gheisari et al. [35] developed a natural hydroxyapatite–hardystonite nanocomposite ceramic. In another work, novel biocomposites consisting of calcium phosphates such as hydroxyapatite (HAP), α, and β-tricalcium phosphate (α, β-TCP), as well as calcium silicate such as sodium-montmorillonite were created [36]. In both cases, the combination of phosphates and silicates can improve not only the mechanical but also biological properties of the prepared composites.
The purpose of this study was to create phosphate-silicate biocoatings by the MAO method in electrolytes containing β-tricalcium phosphate and wollastonite microparticles on the surface of an Mg0.8Ca alloy as well as to comparatively study their structure, morphology, physical and mechanical, corrosive, and biological properties.

2. Materials and Methods

2.1. Sample Preparation and Characterization
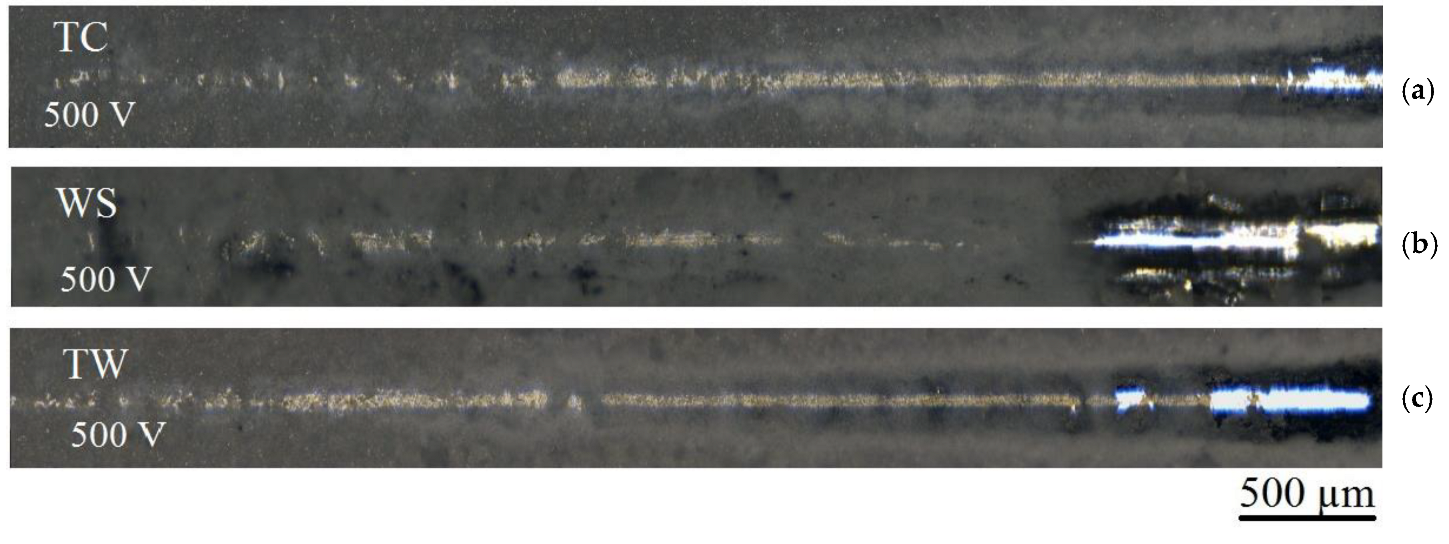
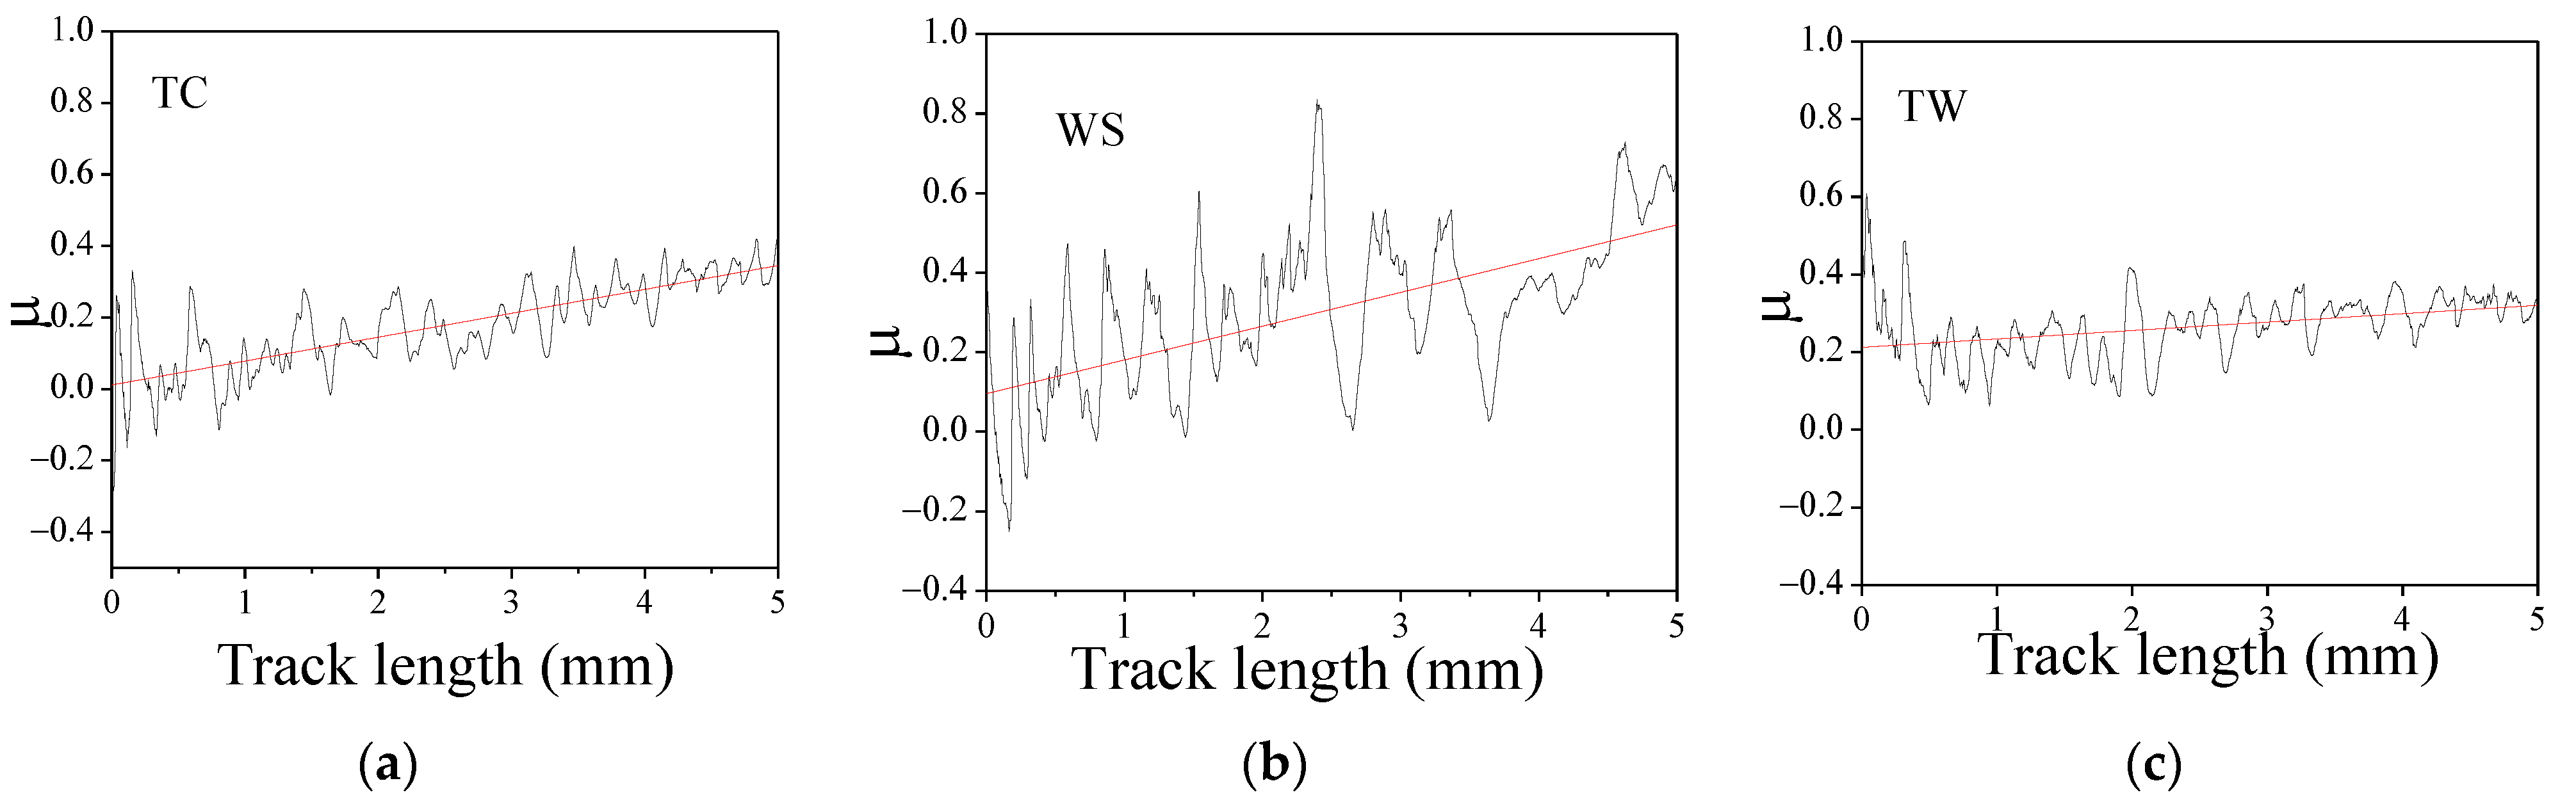
Magnesium alloy Mg-0.8 wt.% Ca (Mg0.8Ca), used as substrate material, was developed at Helmholtz Zentrum Geesthacht (Geesthacht, Germany) [37]. The samples sized 10 × 10 × 1 mm3 were prepared using 120-, 480-, 600-, and 1200-grit silicon-carbide paper. The MAO process was performed with the help of the Micro–Arc 3.0 equipment (ISPMS SB RAS, Tomsk, Russia) [38,39]. The coatings were deposited in the anode mode using the following parameters: pulse frequency of 50 Hz, pulse duration of 100 μs, deposition duration of up to 5 min, and electrical voltage of 350–500 V. The electrolytes contained CaSiO3 (wollastonite), Na2HPO4·12H2O, β-Ca3(PO4)2 (β-TCP), NaOH, Na2SiO3, and NaF (Table 1). Three types of electrolytes were used.
β-tricalcium phosphate (β-TCP) (Germany) with a particle size of 1.5–5.0 μm was used in the electrolytes number I(TC) and III(TW). Wollastonite MIVOLL® 05-96 (ZAO GEOKOM, Kaluga, Russia) with a particle size of 20 μm (average length) was added in the electrolytes number II(WS) and III(TW). β-TCP particles were isometric, while wollastonite particles were elongated (Figure 1). The elongated shape of the natural wollastonite particles was its characteristic feature and was due to the chain structure of the calcium orthosilicate [30,40]. The ζ-potential of powder samples was measured at a pH range of 6–11 (ZetaSizer Nano ZSP, Malvern Instruments Ltd., Malvern, UK).
The morphology and microstructure of the coatings were examined by the method of scanning electron microscopy (SEM, LEO EVO 50, Zeiss, Jena, Germany), as well as with a JEM-2100 transmission electron microscope (TEM, Jeol Ltd., Tokyo, Japan) at the “Nanotech” center at Institute of Strength Physics and Materials Science SB RAS, Tomsk, Russia. The elemental composition of the coatings was studied using energy-dispersive X-ray spectroscopy (EDX, INCA, Oxford Instruments, Abingdon, UK) in combination with the SEM systems. The surface roughness was estimated as average roughness (Ra) with the help of Hommel–Etamic T1000 profilometer (Jenoptik, Jena, Germany) at the National Research Tomsk Polytechnical University. The phase composition was determined with the help of X-ray diffraction analysis (XRD, DRON–7, Burevestnik, St. Petersburg, Russia, “Nanotech” center) in the angular range of 2θ = 10–95° with a scan step of 0.02° with Co Kα radiation. (λ = 0.17902 nm). The XRD-profiles were interpreted and phases were identified using the Joint Committee on Powder Diffraction Standards (JCPDS) powder database. Amorphous/crystalline phase ratio was calculated from the obtained XRD-patterns. Integral intensities of crystalline peaks and diffuse scattering regions were used for calculation.

2.2. Scratch Test

The coating-to-substrate adhesion evaluation was carried out by the scratch-test method on a CSM Macro Scratch Tester Revetest (CSM Instruments, Needham, MA, USA) with a 200 µm radius indenter. The maximum indentation load was 20 N. The scratch length was set to 5 mm. In order to obtain statistically significant data, each measurement was repeated at least three times per sample.

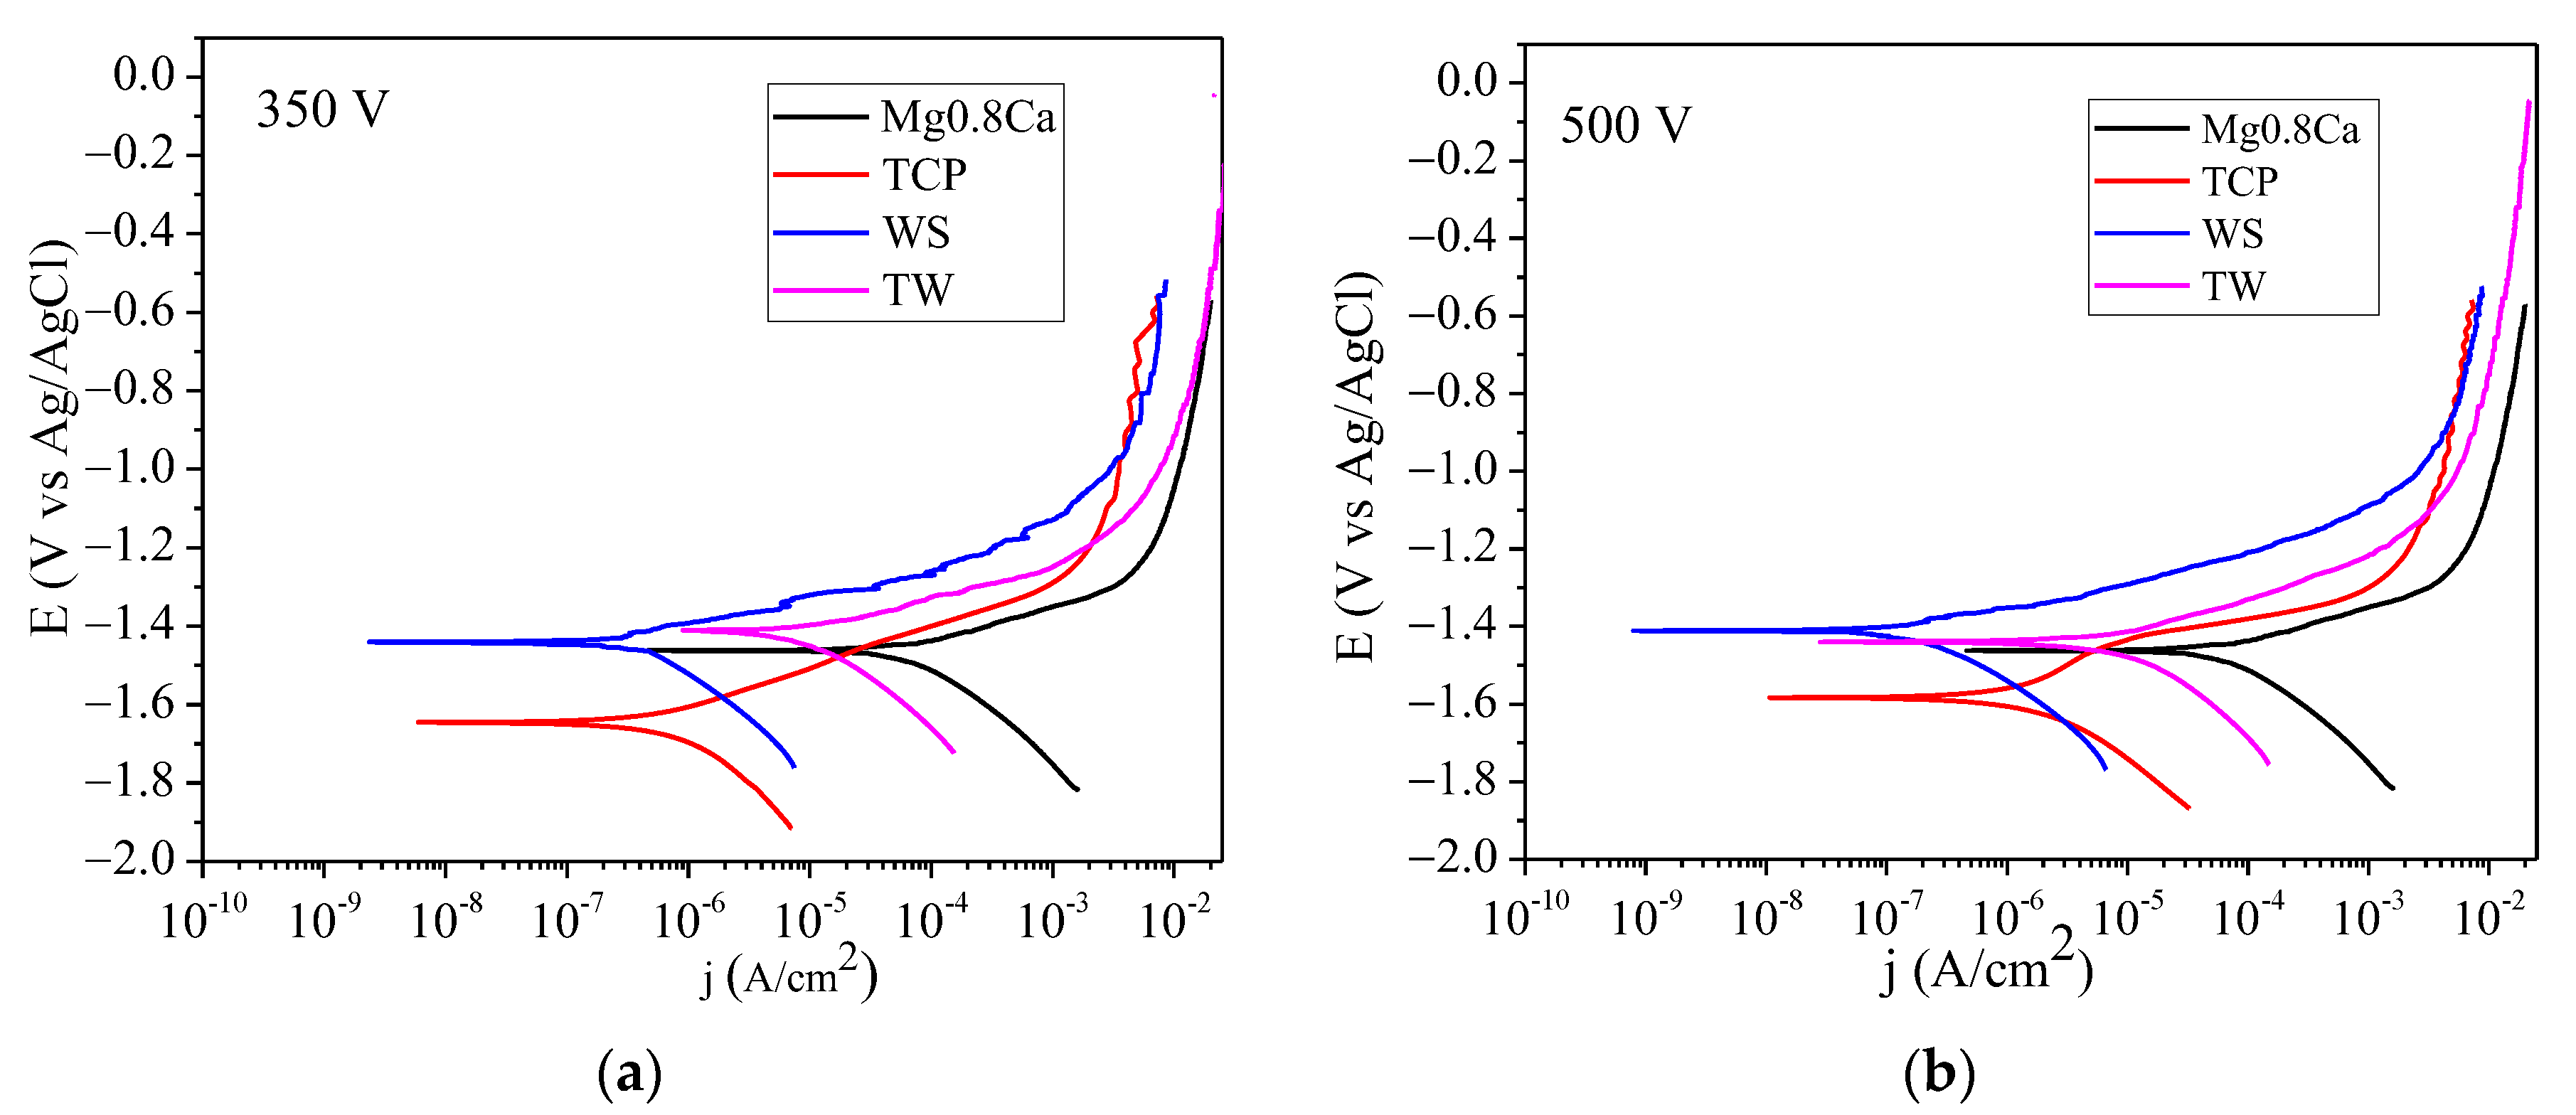
2.3. Electrochemical Studies

Electrochemical properties of the surface layers were investigated with the help of Versa STAT MC system (Princeton Applied Research, Oak Ridge, TN, USA). The measurements were carried out in a three-electrode cell K0235 with 0.9% NaCl aqueous solution used as an electrolyte. A platinum-coated niobium mesh was used as a counter electrode. The K0265 Ag/AgCl electrode was used as a reference electrode. The exposed sample surface area was equal to 0.5 cm2. Before the electrochemical measurements, the samples were kept in the solution for 60 min at open circuit potential (OCP) in order to reach the steady state.
A linear polarization resistance experiment was performed starting from −30 mV to 30 mV vs. OCP at a scan rate of 0.167 mV/s. The polarization resistance, Rp, was calculated from the linear potential-current density plot as Rp = ∆E/∆j, as recommended in [41]. Potentiodynamic polarization curves were recorded at a scan rate of 1 mV/s, which was typical for Mg alloys instead of 0.167 mV/s. The Levenberg–Marquardt (LEV) method was used to fit the experimental polarization curve (potential, E, vs. current density, j) by the following equation:
j = jc(10(EEc)/βa + 10−(EEc)/βc)
which gives best-fit values of corrosion potential, Ec, and corrosion current density, jc [42].

2.4. Biological Studies

A standard 0.9% NaCl solution was used as the model biological fluid for the sample’s biodegradation study according to ISO 10993-5. Both bare Mg alloy samples and coated samples were immersed in the solution at 37 °C for 16 days. The samples mass loss was calculated by the formula:
Δ m = m 0 m i m 0 × 100 %
where m0 was the mass before the dissolution and mi was the mass after the dissolution. The coatings were immersed in a biological fluid (SBF) solution obtained using the standard Kokubo method [43], at the temperature of 37 °C, to determine their ability to stimulate biomineralization processes. After the immersion, the samples were washed with distilled water, dried, and examined by SEM to reveal the formation of calcium phosphates.
The studies of the cytotoxic properties of the coatings were carried out by means of the MTT assay. In this case, the culture NIH/3T3 (ATCC CRL-1658 fibroblast cell lines obtained from the State Research Center of Virology and Biotechnology “VECTOR” (Novosibirsk, Russia) was used. The cells were grown as a monolayer in DMEM with the addition of 10% fetal bovine serum (HyClone, Logan, UT, USA), 2 mM l-glutamine (HyClone, Logan, UT, USA), and 1% penicillin/streptomycin (HyClone, Logan, UT, USA). The cell cultivation was performed at 37 °C and 5% CO2 within 24 h. The final cell concentration was 1 × 10⁴ cells per 100 μL per a well of a 96-well microplate (TPP, Techno Plastic Products AG, Trasadingen, Switzerland). The samples were extracted for 3 h at a surface/volume ratio equal to 1 cm2/mL of the cell medium. A sample of the medium was incubated under similar conditions and was used as a negative control.
The obtained extracts were used for the MTT test, which was based on the reaction of an MTT reagent (3-(4,5 Dimethylthiazol-2-yl)-2,5-diphenyltetrazolium bromide) reduction with reductases of living cells to purple formazan crystals. In typical experiments, the MTT reagent was transferred into each well with extracts and cells and incubated for 2 h at 37 °C and 5% CO2. We applied 100 μL of dimethyl sulfoxide (DMSO) for dissolving formazan crystals. In the final step, the absorption of the solution was recorded at 570 nm wavelength using a Thermo Scientific Multiskan FC microplate spectrophotometer (Thermo Fisher Scientific, Waltham, MA, USA). Parametric methods with a confidence level of p ≤ 0.05 were used for statistical data processing. The pH of the cell medium was determined during the preparation of the extract over a 24-h period.
Besides, cytotoxicity studies were carried out according to ISO 10993-5-2009, which provided for the incubation of the cell culture with the test samples and the in vitro integral assessment of the number of cells after exposure. In this case, the NIH/3T3 culture was used. Cell lines were cultured in DMEM (Lonza, Basel, Switzerland) with the addition of 10% fetal bovine serum (HyClone, Logan, UT, USA) and 5% penicillin/streptomycin-glutamine (HyClone, Logan, UT, USA) in 75 cm2 vessels at 37 °C in a humidified atmosphere of 5% CO2/95% air. The cell culture was seeded into 24-well culture plates (total volume 2 mL) at 70,000 cells per well. Test samples were placed in each well. Cells were incubated for 48 h. Cells were counted in a hemocytometer using vital trypan blue stain. The original cell culture, which was not in contact with the test samples, was taken as a negative control [44,45].
In addition, the method of flow cytometry was used for testing the viability of the NIH/3T3 fibroblast cells. The cells were treated with 10 µL of degradation solution and incubated for 24 h at 37 °C and 5% CO2. The final cell concentration was 5 × 10⁵ cells per well of a 12-well microplate (TPP, Switzerland). The control (untreated) and the 3T3 cells (treated with 24-h degradation solution) were analyzed using Apoptosis Detection Kit with PI (Biolegend, San Diego, CA, USA) at flow cytometer Cytoflex (Beckman Coulter, Brea, CA, USA). The results were processed using the CytExpert 2.0 software (Beckman Coulter, Brea, CA, USA).
All statistical analyses were performed using the statistical software package STATISTICA 10.0 (TIBCO Software, Stanford Research Park, Palo Alto, CA, USA). The normal distribution of the results was checked by the Kolmogorov-Smirnov test. The significance of differences in mean values between groups was analyzed using the Mann-Whitney test. Differences were considered significant at p < 0.05.

3. Results

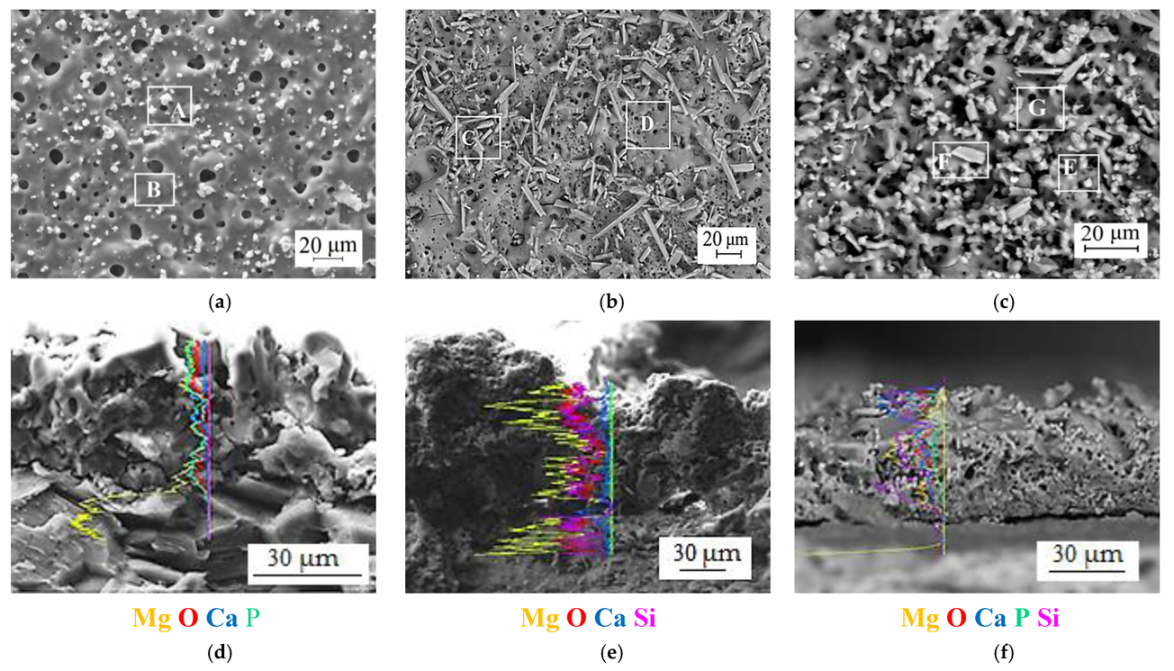
3.1. Dependences of the Coatings Formation, their Morphology, and Elemental Composition

Micro-arc oxidation (MAO) is a very complicated process that depends on a number of parameters. Two main factors, such as the mode used for coating deposition and the composition of the electrolyte, fundamentally affect the micro-arc coating formation process [46,47]. In this work, the MAO process was performed in the anodic potentiostatic mode. Three types of electrolytes containing TCP microparticles, wollastonite, and both types of particles were used simultaneously (Table 1). In this case, three types of coatings were created, named TP, WS, and TW, respectively.
Several studies have shown that the behavior of particles in the electrolyte was strongly influenced by their zeta-potential (ζ) value [47,48]. Figure 2 demonstrates the graphs of ζ versus pH. It was obvious that with an increase in pH, the value of ζ became more negative for both types of particles. The negative value of ζ for the TCP particles becomes greater than that for the wollastonite particles when pH > 8. Since alkaline electrolytes with pH = 10–11 were used, the particles had a maximum negative value of ζ. Hence, it should be assumed that the particles, being in an alkaline electrolyte solution, under the influence of an electric field, moved intensively towards the anode [47].
Due to the growth of the dielectric layer on the surface of the magnesium substrate, a decrease in current density occurred over time (Figure 3a). This process varied in intensity depending on the composition of the electrolyte. Figure 3a shows that the current density was maximal when the coating was formed in the electrolyte with wollastonite and minimal when the coating was applied in the electrolyte containing both types of particles. Figure 3b demonstrates the change in the initial current density versus the voltages of the coating’s deposition. It can be seen that with increasing process voltage, the initial current density raises. When WS coatings were formed at various values of the process voltage, the initial current densities were almost three times higher than the initial current densities observed during the deposition of TC and TW coatings (Figure 3b).
This can be explained by the fact that wollastonite was a more low-melting compound than TCP. Wollastonite transformed into pseudo-wollastonite at 1125 °C [29] and melted at 1544 °C [49]. As for TCP, at a temperature of about 1125 °C β-TCP transformed into α-TCP [50], which passed into the α ‘phase at 1440 °C. The melting point of α ‘phase was 1756 °C [51].
The electrolyte compounds, as well as the substances of the substrate and of the transition oxide layer, melted and interacted with each other in the channels of micro-arc discharges. [46]. Thus, the process of the formation of discharges was more intense with the participation of wollastonite, since a larger number of charge carrier ions were formed as a result of its melting.
The graphs of the coatings thickness and roughness versus the voltage of the MAO process confirmed the regularities of the formation of the coatings in the electrolytes of different compositions (Figure 4). The TC coating deposited at 500 V exhibited the lowest values of thickness and roughness, equal to 80 and 8 µm, respectively. In this case, the maximum thickness values equaled to 150 µm were reached by the WS coating (Figure 4a), and the TW coating demonstrated the maximum roughness Ra value of 10.5 µm (Figure 4b).
The surface morphology of the coatings is shown in Figure 5. The coatings had a pronounced pore structure. The dispersed phase particles deposited from the electrolyte were observed on the surface of the coatings. These were isometric TCP particles in the TC coating (Figure 5a,d) and elongated wollastonite particles in the WS coating (Figure 5b,e). In the combined TW coating, both types of particles were present simultaneously (Figure 5c,f).
With an increase in voltage from 350 to 500 V, the pore diameter increased, as shown by the micrographs of the coatings. The formation of bubbles occurred in WS coatings due to the action of powerful micro-arc discharges. A decrease in the size of wollastonite particles occurred in this case (Figure 5e). In the TW coating deposited at 500 V, the appearance of huge pores and the formation of zones with the accumulation of wollastonite and TCP particles were observed. (Figure 5f).
The regularities of the formation of micro-arc coatings in the anodic potentiostatic regime, in electrolytes containing microparticles, were established in previous studies [18,19,20,30,38,39]. They were as follows: In the first period of coating deposition (up to 50 s in Figure 3a) the most powerful micro-arc discharges were realized and a porous coating layer was formed. During this period, the particles also participated in the formation of the coating, but most of them melted at high temperatures in the micro-arc discharge channels. The deposition of unmelted particles on the coating surface occurred during the final period of the MAO process when the process voltage became minimal. For TC and WS coatings, this period was from 50 to 300 s, whereas for TW coatings it was from 25 to 300 s (Figure 3a).
Examination of the cross-sections of the coatings (Figure 5g–i) showed that the coatings had an internal pore structure with a large number of both interconnected and isolated pores. In some areas, unmelted particles inside the coatings were observed (marked with white arrows). This structure was a result of the implementation of micro-arc discharges, their conjunction, and the formation of an avalanche discharge [46]. Plasma-chemical processes occurred with the formation of new phases [52,53], while rapid cooling resulted in the formation of an amorphous phase.
The elemental composition of the coatings was investigated in different zones by means of the EDX method (Figure 6a–c, Table 2).
Zones A and B in Figure 6a corresponded to the areas of the TC coating with TCP particles and without particles, respectively. Zones C and E of the WS coating in Figure 6b corresponded to the location of the wollastonite particles and the area without them, respectively. Finally, zones E, F, and G in Figure 6c of the TW coating were selected in the areas containing particles of TCP, wollastonite, and without any particles, respectively.
In the composition of the zones corresponding to the TCP particles (A and E), the elements Ca and P predominated, but Mg and Si were additionally present. Ca and Si predominated in the elemental composition of the zones corresponding to the wollastonite particles (C and F), but Mg and P were present too.
This indicated that reactions with the formation of new phases occurred on the surface of the particles during the MAO process. In addition, the particle-free zones (B, D, and G) contained all the elements introduced with the compounds contained in the electrolytes. It should be noted that there was a high Mg content in these zones, which indicated the active formation of secondary compounds with the participation of the substrate material.
Figure 6d–f shows the images of cross-sections of the coatings with the element distribution tracks over the thickness of the coatings. The track lines had the appearance of fluctuations due to the porous structure of the coatings. The cross section of TC coatings contained predominantly P, Mg, and O elements, while the Ca content was low (Figure 6d). The cross sections of WS coatings contained mainly Mg, Si, and O, but the amount of Ca was also lower than the other elements (Figure 6e). The elements Si, Ca, and Mg predominated in the cross sections of TW coatings, moreover, the amount of Ca increased in the direction from the substrate to the coating surface (Figure 6f).

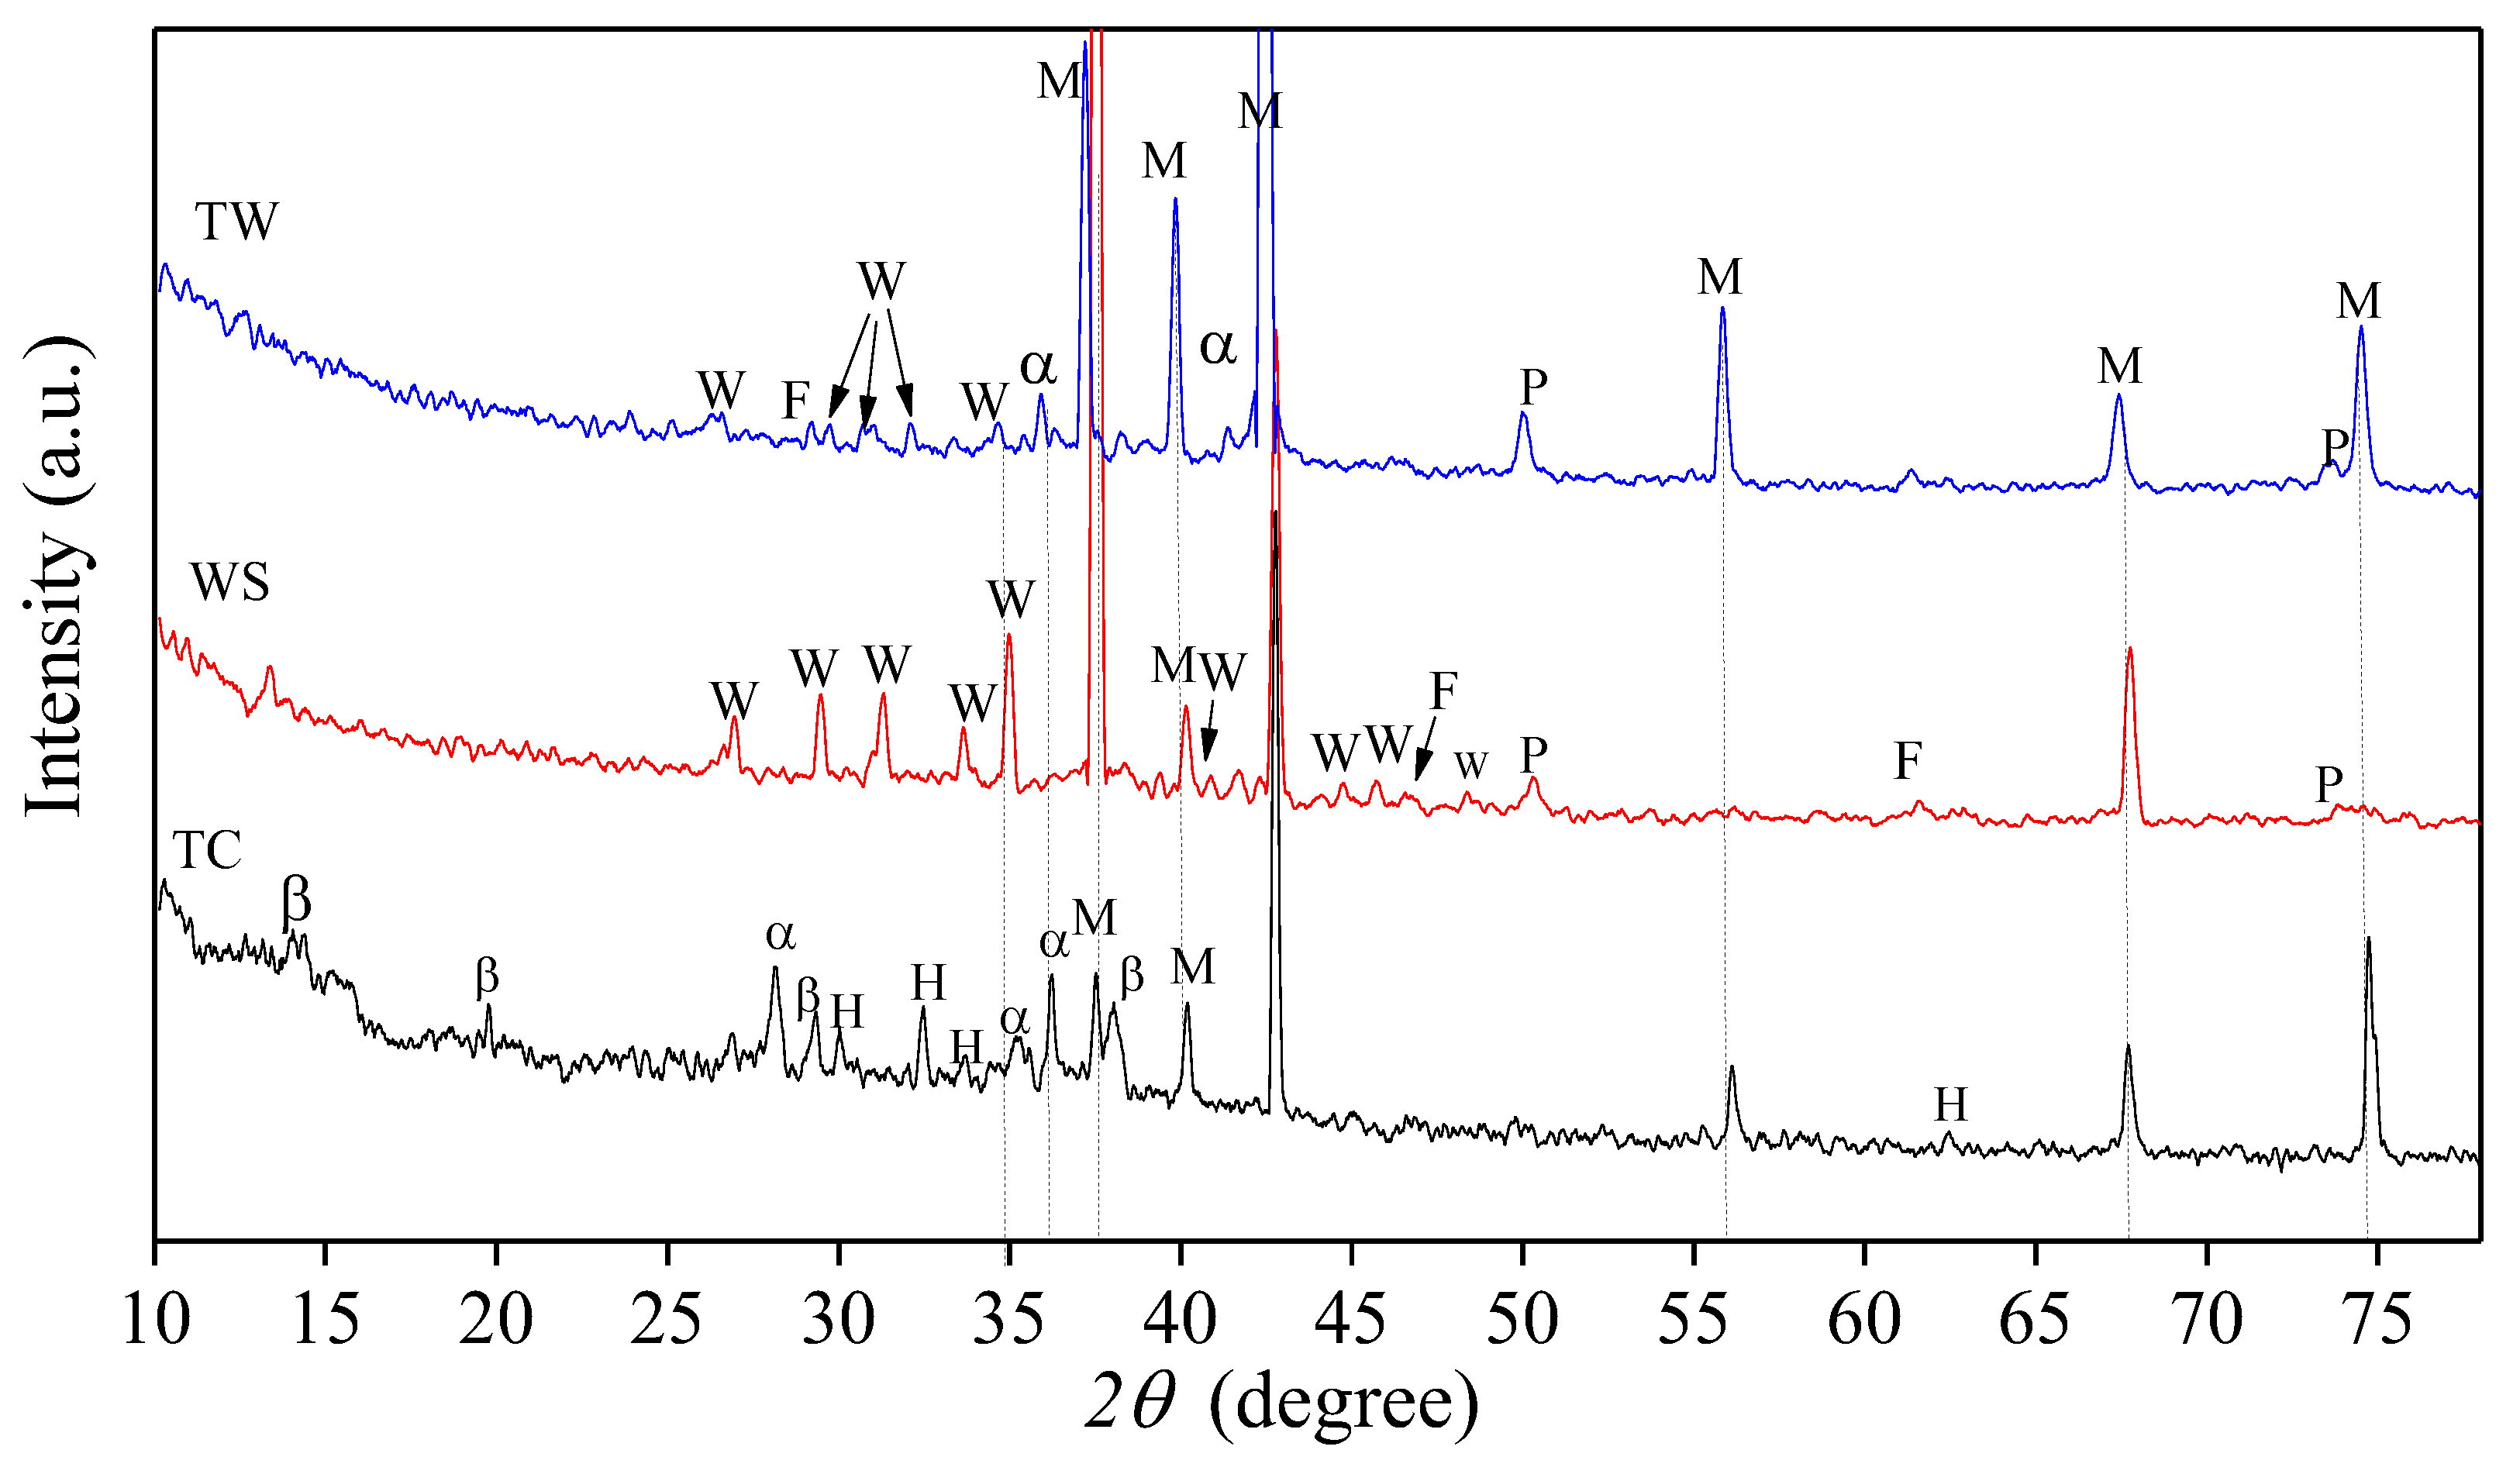
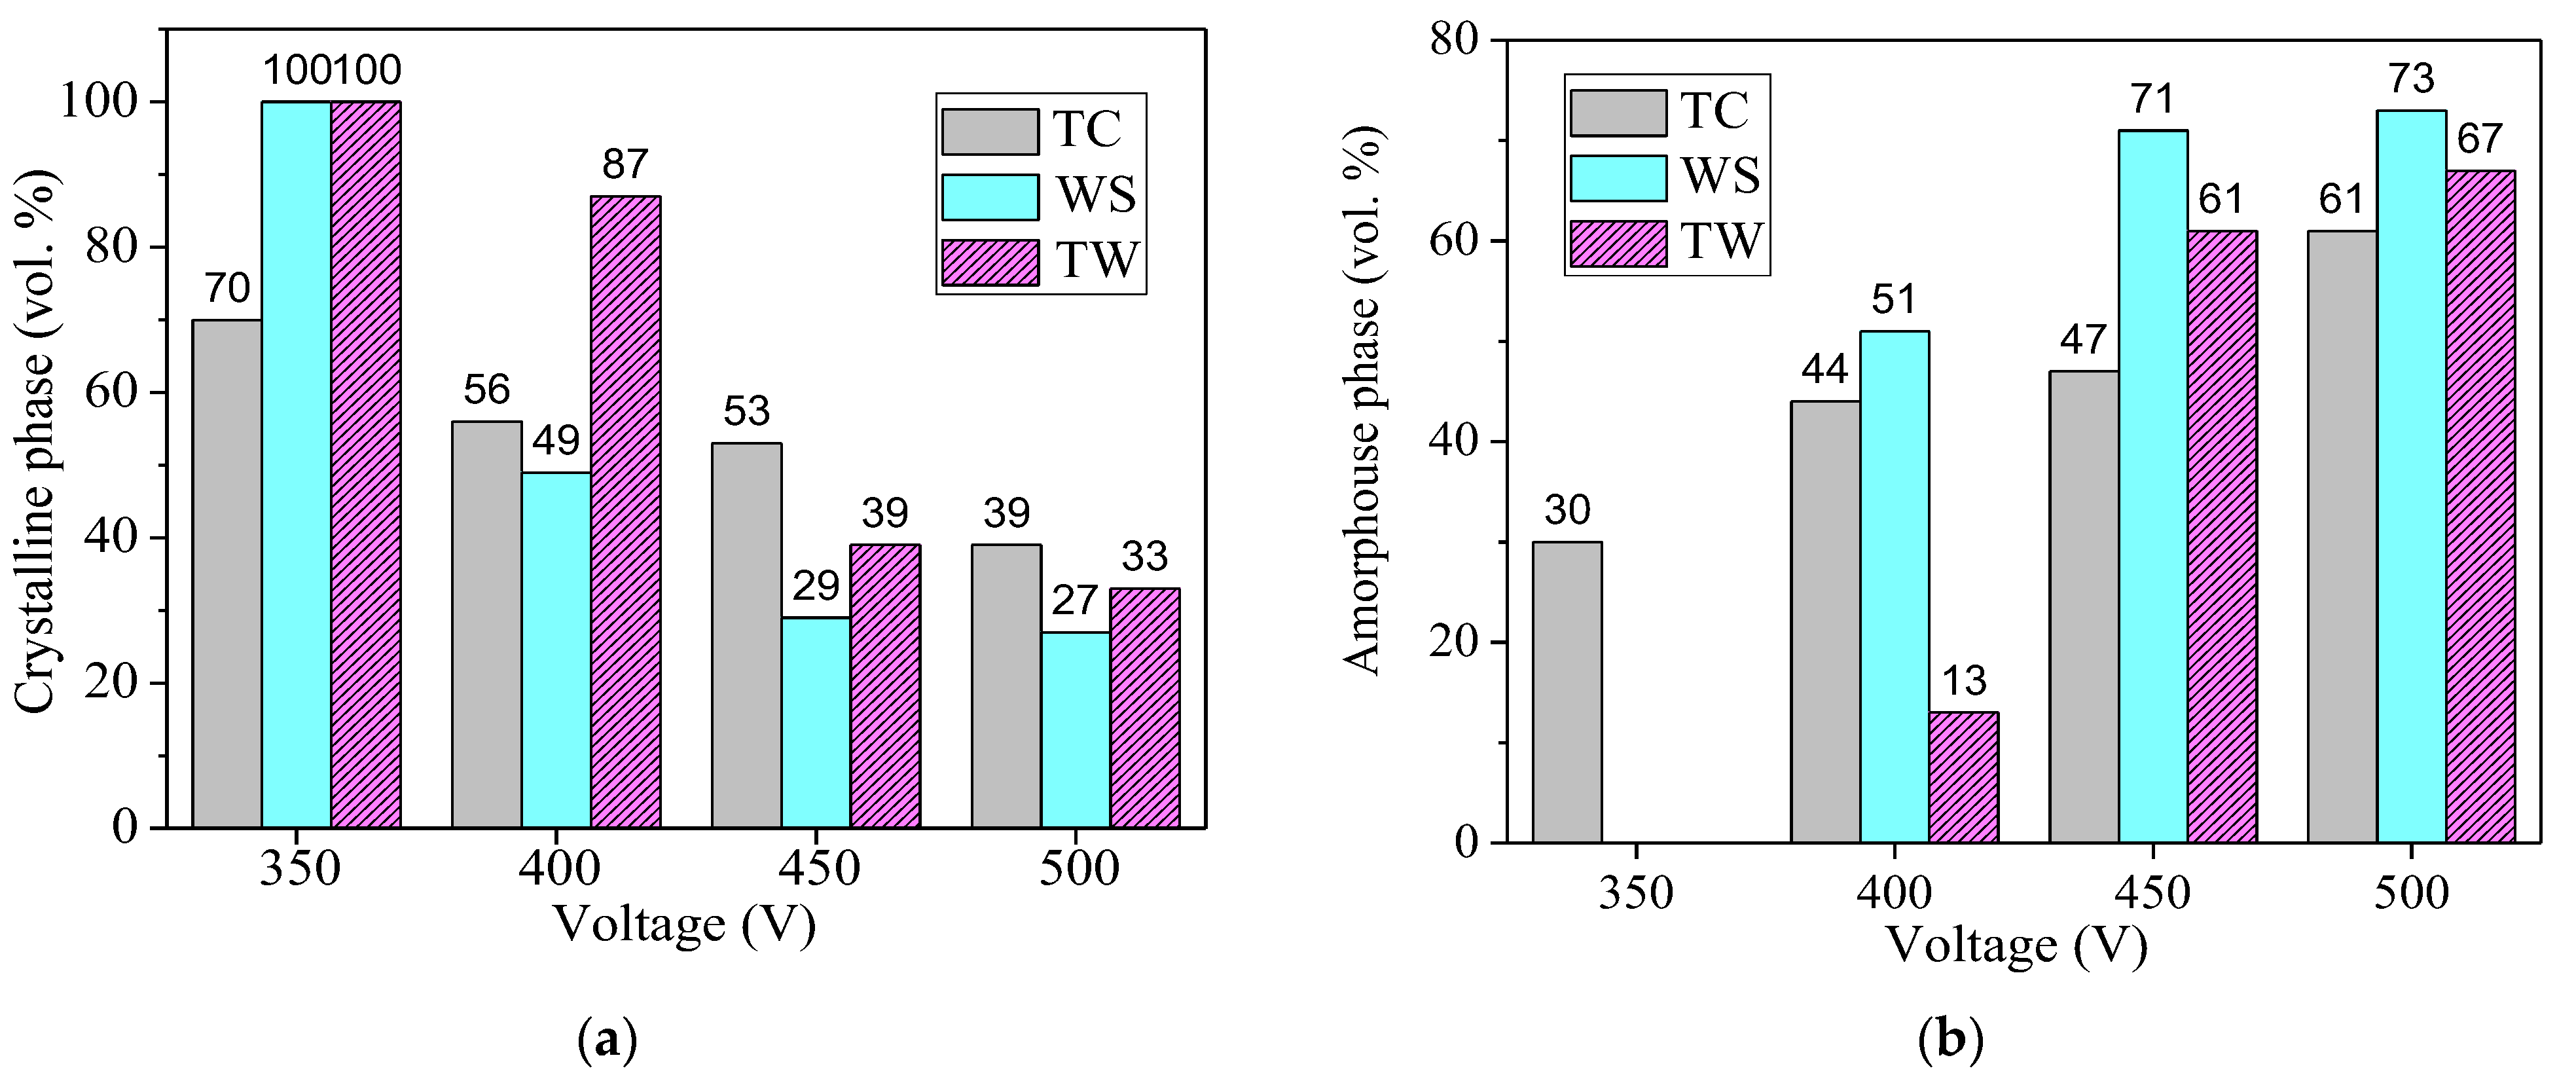
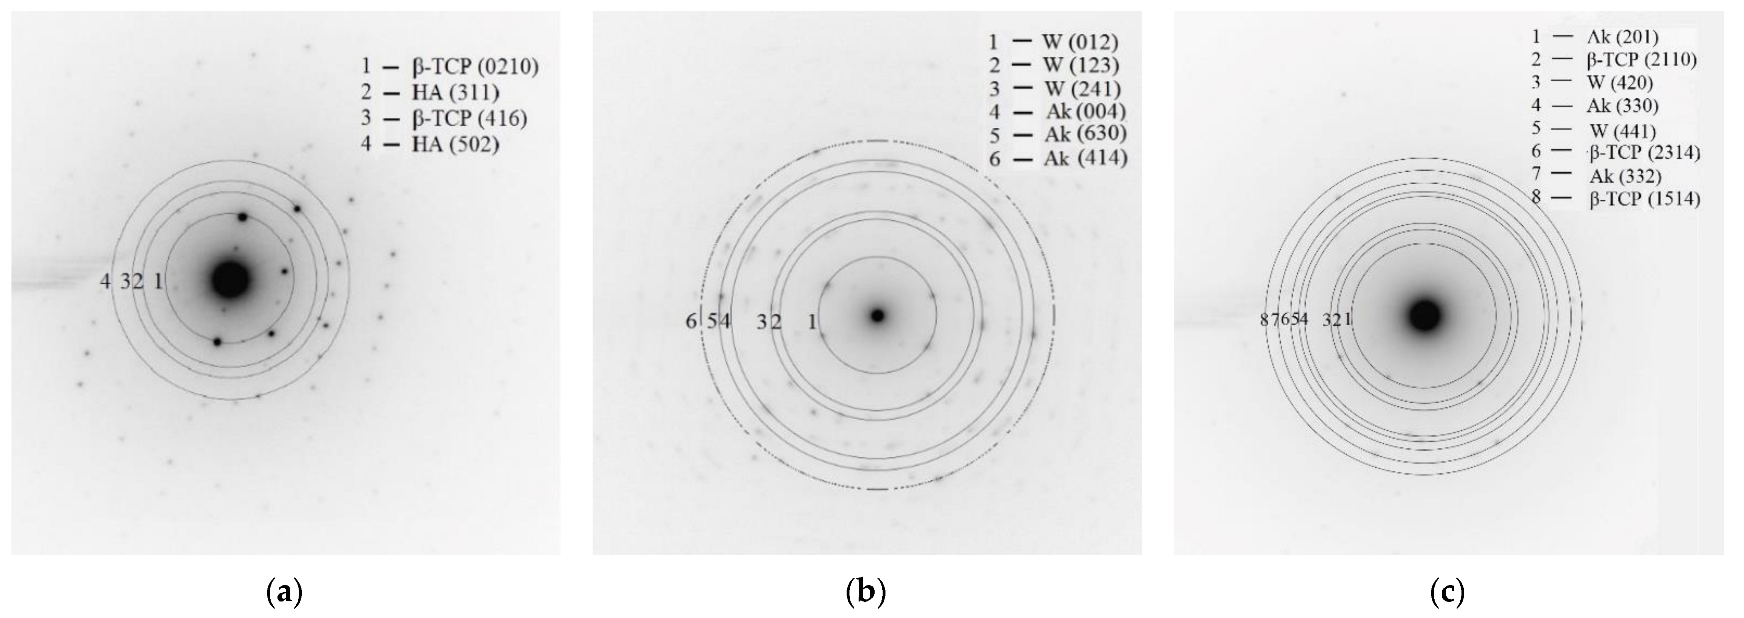
3.2. Coatings Phase Composition

The phase composition of the coatings was investigated using the XRD method (Figure 7). X-ray diffraction patterns of all the coatings indicated their amorphous-crystalline structure. Along with the reflections of the crystalline phases, the diffuse scattering region could be observed in the XRD patterns, in the range of angles from 10 to 45 degrees. The reflexes were characteristic of the substrate material Mg (ICDD #35-0821) present in the XRD patterns of all the coatings. In addition, the X-ray diffraction patterns contained reflections of both the initial crystalline phases β-TCP (β-Ca3(PO4)2 (ICDD #09-0169) and wollastonite (CaSiO3 ICDD #31-0300), deposited in the coatings from the electrolytes, and a new phase formed during plasma-chemical reactions in the coatings. These include α-TCP (α-Ca3(PO4)2 ICDD #09-0348), forsterite (Mg2SiO4 ICDD #34-0189), hydroxyapatite (HA) (Ca10(PO4)6(OH)2 ICDD #09-0432), and magnesium oxide (MgO ICDD #45-0946).
α-TCP was formed as a result of the β-TCP → α-TCP polymorphic transition [51] in TC and TW coatings. Forsterite was formed in the WS coating, in accordance with the reaction (5) [54]. The formation of HA was observed in the TC coatings. It was known that HA could be synthesized from TCP in an alkaline solution according to the reaction (6) [55]. This was facilitated by the polymorphic transition β-TCP → α-TCP, since the α-form of tricalcium phosphate was the most active and reactive [51].
Mg2+ + SiO32− + 2OH → Mg2SiO4 + H2O
Ca3(PO4)2 + H2O → Ca10(PO4)6(OH)2
In the diagrams (Figure 8) the ratio of crystalline and amorphous phases in the coatings depending on the voltage of the MAO process is shown.
At the process voltage of 350 V, only the crystalline phase was formed in WS and TW coatings, while in TC coatings the amount of the crystalline phase was 70 vol.% (Figure 8a). With an increase in voltage in the range of 400–500 V, the amount of the crystalline phase in WS coatings decreased significantly to 49–27 vol.%. In this case, the amount of the crystalline phase in TW coatings decreased less so to 87–33 vol.%. Thus, in the range of the process voltage equal to 400–500 V, the largest amount of the amorphous phase (51–73 vol.%) was formed in WS coatings. Therefore, we observed the appearance of “bubbles” on the surface of these coatings (Figure 5e).
A more detailed analysis of the phase composition of the coatings was performed using the TEM method. Micro-diffraction patterns obtained from the fragments of the coatings are demonstrated in Figure 9. They were point-like, which indicate the presence of crystalline phases.
Indexing of the micro-diffraction patterns showed that β-TCP, HA phases were present in TC coatings (Figure 9a). The WS coatings contained wollastonite and akermanite (ICDD #35-0592) (Figure 9b). Wollastonite, β-TCP, and akermanite were found in TW coatings. Thus, the TEM method additionally established the formation of akermanite in WS and TW coatings during the interaction of wollastonite with a magnesium substrate according to the reaction (7).
2CaSiO3 + Mg2+ + 2OH → Ca2MgSi2O7 + H2O

3.3. Mechanical Properties of the Coatings

The adhesion properties of the coatings were determined by the Scratch Test. Figure 10 demonstrated the optical images of the tracks formed by scratching the surface of the coatings deposited at the voltage of 500 V and having the greatest thickness. Examination of the tracks showed that they were uneven in length. Scratches on TC and TW coatings (Figure 10a,c) had three zones, such as the surface perforation zone (discontinuous), the internal perforation zone of the coating (solid line), and the damaged substrate zone (bright light line at the end of the track). At the same time, the WS coatings did not show an average continuous zone, and the discontinuous perforation zone immediately passed into the area of substrate damage (Figure 10b).
Figure 11 exhibits the graphs of the change in the coefficient of friction (µ) during the formation of a scratch in the coatings. The graphs have fluctuating patterns due to the porous and rough structure of the coatings. For TC and TW coatings, the maximum amplitude of fluctuations of µ was observed at the beginning of the track, and at the end of scratching the amplitude became lower (Figure 11a,c). In this case, the amplitude of fluctuations of µ for the WS coating was high along the entire track (Figure 11b).
SEM images of the track zone where the substrate was damaged are shown in Figure 12a,b. It was found that scratching the TC coating did not damage the substrate (Figure 12a), in contrast to the WS and TW coatings (Figure 12b,c). The destruction of the TC coating was completed at the interface between the coating and the substrate. This fact was also confirmed by the graphs of the depth of the indenter penetration into the coatings along the track length (Figure 12d–f). For the TC coating, the maximum indenter penetration depth was 80 µm, while the coating thickness was 85 µm (Figure 12d). Whereas for the WS and TW coatings having a thickness of 140 µm and 71 µm, respectively, the maximum penetration depths were 146 and 77 µm, respectively (Figure 12e,f).
The values of the critical load (Lc) are given in Table 3. With an increase in the voltage of the coating’s deposition and, consequently, with an increase in their thickness, the Lc increased for all types of coatings. According to the degree of decrease in the adhesive strength of the coatings, they could be arranged as follows: TC > TW > WS. Thus, the TC coating showed the highest strength properties.

3.4. Electrochemical Properties of the Coatings

Potentiodynamic polarization curves (PDP) were obtained (Figure 13) during the immersion in 0.9% NaCl solution to determine the electrochemical properties of the coatings and the pure alloy. The values of corrosion potential (Ec), corrosion current density (ic), and corrosion resistance (Rp) are presented in Table 4. It is known that the corrosion tendency of a material could be revealed from the position of the PDP curves. If the PDP curves are shifted to the right, these materials are less noble and have a higher corrosion rate [14]. Figure 13 shows that the PDP curves of the Mg0.8Ca alloy occupy the extreme right position relative to all other curves. This means that all coatings applied at both 350 V and 500 V reduced the corrosion rate of the alloy. As the process voltage increased, corrosion current density decreased and corrosion resistance increased (Table 4). The WS coating deposited at 500 V was the most corrosion-resistant, since it had the lowest corrosion current density equal to 1.8 × 10⁻⁷ A cm−2 and the highest resistance equal to 1.2 × 10⁵ Ω cm2. However, it should be noted that all investigated coatings could perform a protective function for the magnesium alloy.

3.5. Biological Study

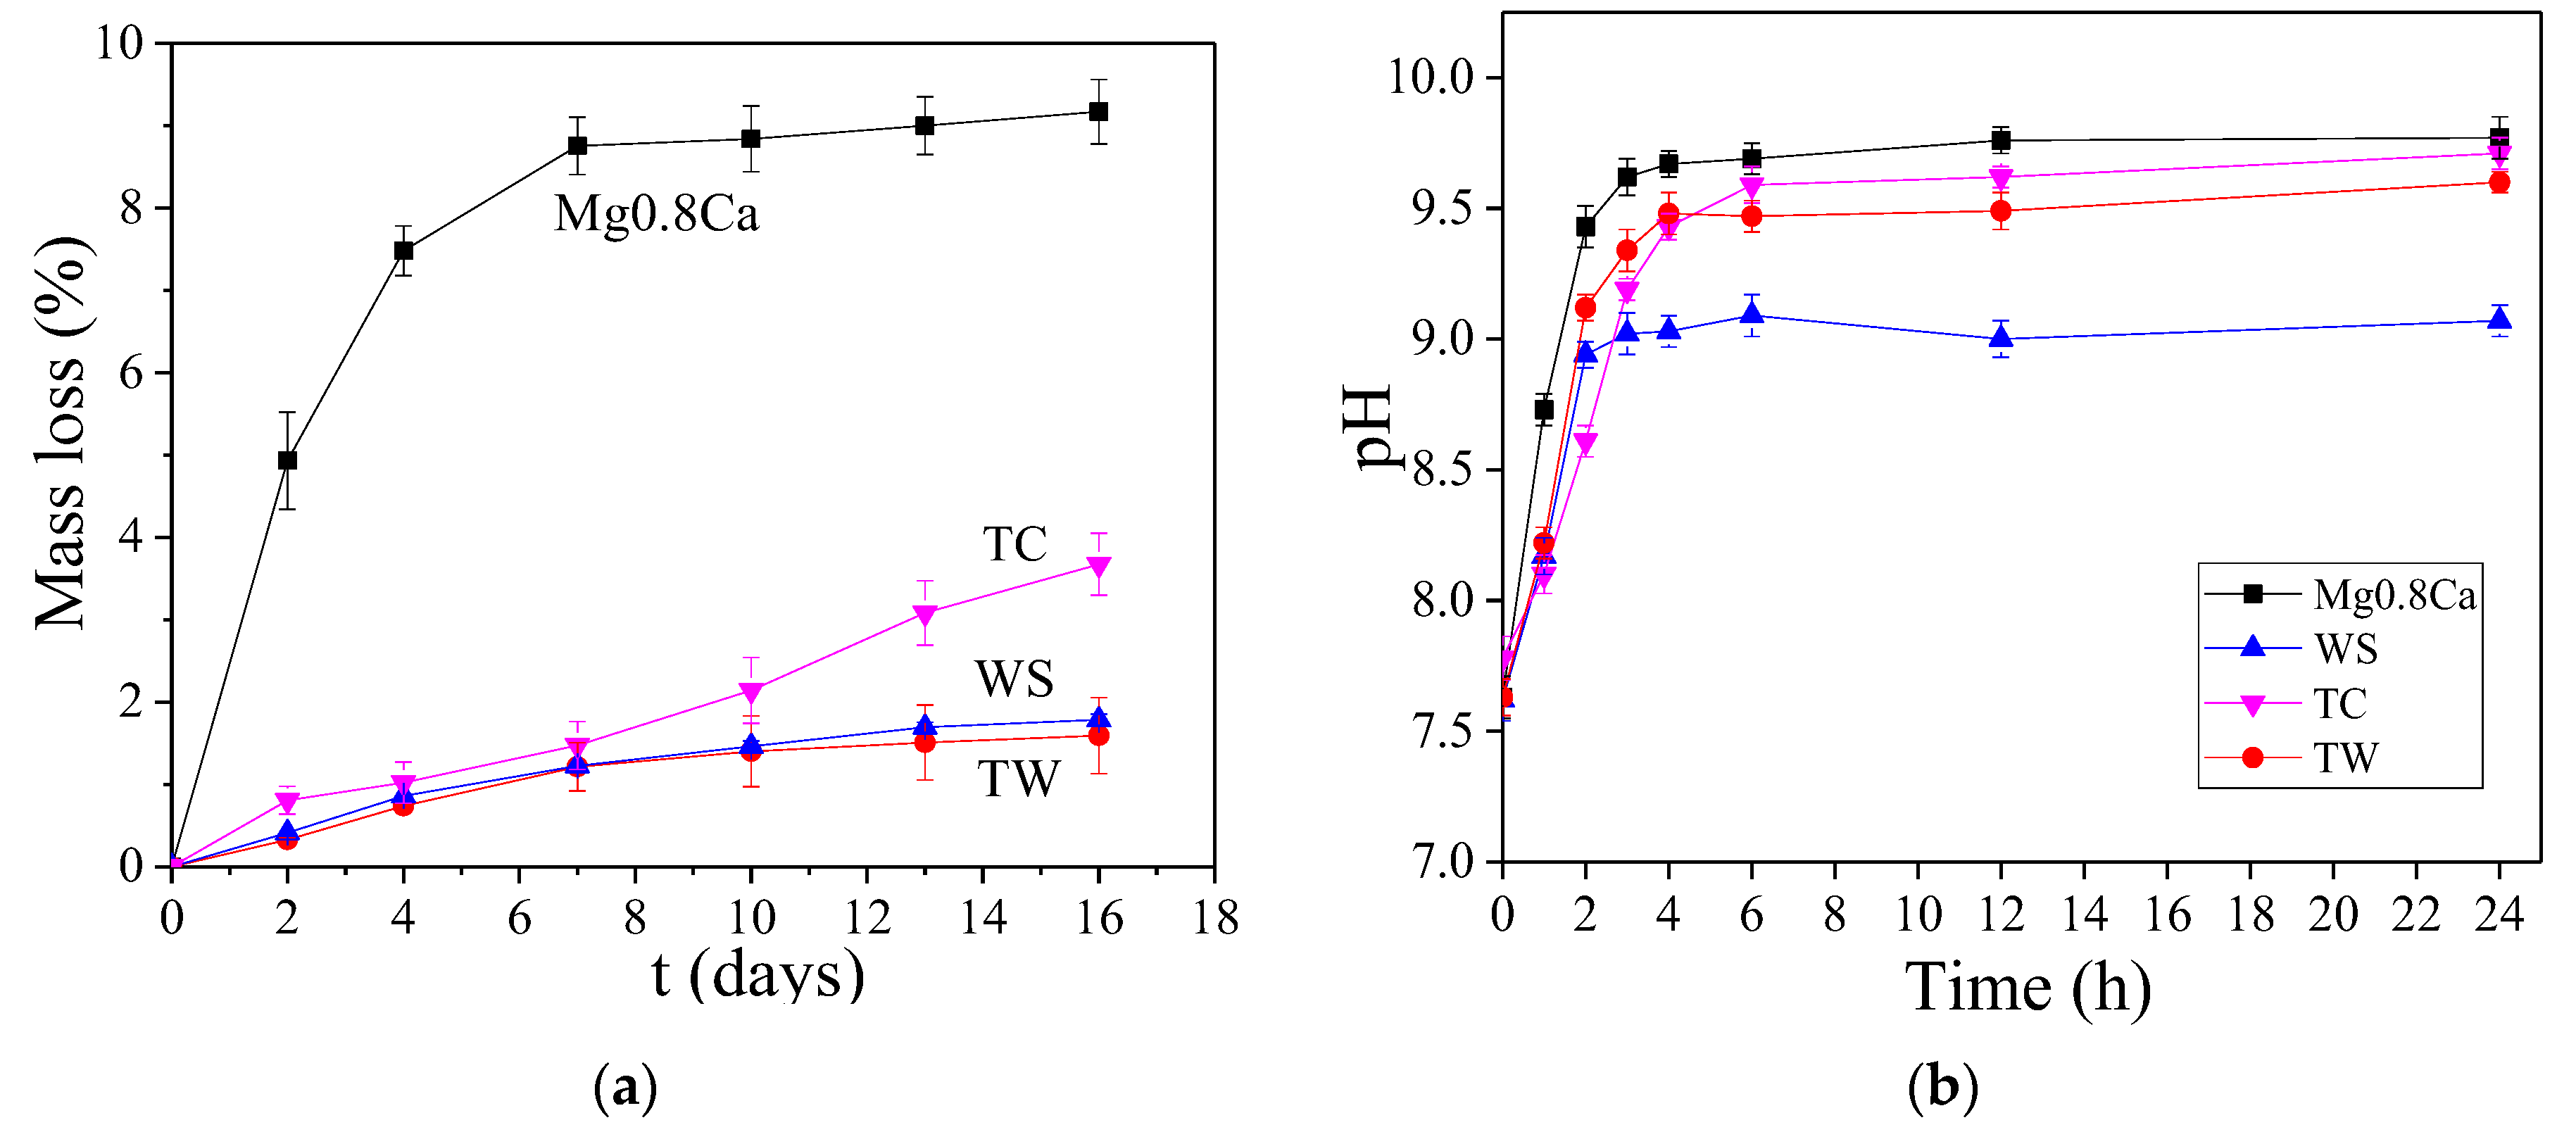
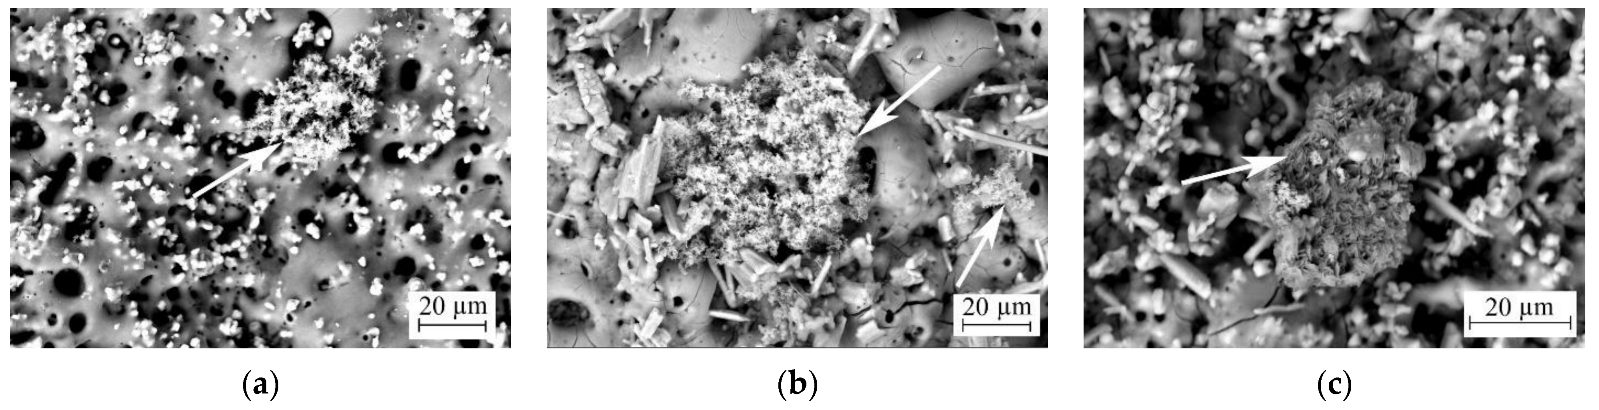
3.5.1. Bioresorption

Comparative studies of the kinetics of bioresorption of TC, WS, and TW coatings, as well as of the pure alloy in a 0.9% NaCl solution, were carried out. Three samples of each type of coating were kept for 16 days. Every day, the mass loss of each sample was checked according to the Equation (3) and the mean value was calculated (Figure 14a). In addition, the studies of the change in the pH of the medium upon dissolution of the coatings and pure magnesium alloy within 24 h (Figure 14b) were performed. It was revealed that the mass loss of the TW, WS, and TC coatings within 16 days was 1.5%, 1.8%, and 3.6%, respectively, while the mass loss of the pure alloy was 9.1%. Thus, the dissolution rate of the pure alloy was significantly higher than that of coated samples. The dissolution rate of WS and TW coatings was two times lower than that of TC coatings. However, when WS coatings dissolved, the change in the pH of the medium towards an increase in alkalinity did not occur as intensely as in the case of a pure alloy, as well as TC and TW coatings (Figure 14b). Nevertheless, slowing down the dissolution process for a long time for all types of coatings would reduce the rate of hydrogen evolution.

3.5.2. Immersion in the SBF Solution

Samples with all types of coatings were examined after immersion in SBF solution for 7 days. SEM images of the surface of the coatings, as well as diagrams of changes in their elemental composition, are shown in Figure 15. A comparative analysis of the micrographs allowed for concluding that the characteristic morphology of the coatings remained the same after 7 days of immersion in SBF. In addition, zones of the formation of small crystals were observed on the surface of all coatings (marked with white arrows). Moreover, WS and TW coatings (Figure 15b,c) have more areas of this kind than the TC coating (Figure 15a).
Comparative analysis of the elemental composition of the coatings before and after SBF showed that the composition of TC coatings remained almost unchanged (Figure 15d), while in WS and TW coatings there was an increase in calcium and phosphorus content and a decrease in magnesium and silicon content after SBF (Figure 15e,f). Moreover, the appearance of phosphorus was observed in WS coatings, whereas before immersion in SBF these coatings did not contain phosphorus. It should be concluded that the deposition of calcium phosphate compounds in SBF solution occurred more intensively on the surface of WS and TW coatings than on the surface of TC coating.

3.5.3. MTT-Test

An important stage in assessing the quality of materials for biomedical applications is the study of their toxic properties in relation to a living organism. In accordance with the international requirements to reduce the number of animals involved in in vivo experiments, extensive toxicological studies were carried out in vitro on relevant cell lines.
Cell lines or primary cultures of human and animal cells were often used as test targets. Cytotoxic studies on 3T3 cells were carried out by the MTT test for all types of coatings and for the pure Mg0.8Ca alloy. The studies were performed both in the initial solution (Figure 16 (1)) and in the extracts diluted 10 times and 100 times (Figure 16 (2) and (3)). Dilution of the solution simulates the interaction of samples with cells under conditions of blood flowing.
The lowest level of cytotoxicity towards 3T3 cells was found for the WS coatings, since the highest number of viable cells from 84% (in the undiluted extract) to 95% (after dilution) was revealed after interaction with the extracts of these coatings.
An average level of cytotoxicity was observed for TC coatings since the number of viable cells ranged from 65% to 78%. Cytotoxicity values for TW coatings were similar to those for TC coatings. Samples of pure alloy, without coatings, were the most cytotoxic. When interacting with the extracts of Mg0.8Ca, the number of viable cells in undiluted extracts reached 28% and, upon dilution, it increased to 62%.
Cell viability studies in direct contact with the coatings showed similar results (Figure 17). The largest number of surviving cells was observed for WS coatings (81%) (Figure 17b). Most of the dead cells that were blue stained with trypan blue (59%) were observed in the TC coatings (Figure 17a). Cells treated with TC showed morphological signs of deterioration and death.

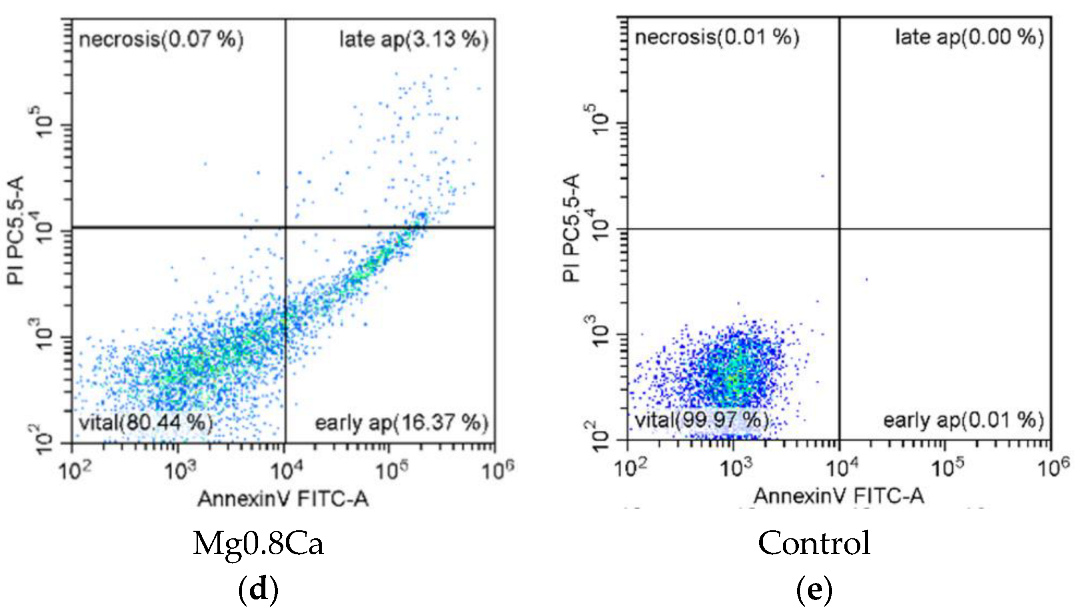
3.5.4. 3T3 Cells Research with the Help of the Flow Cytometry

Studies carried out by the flow cytometry method provided more reliable information about the cytotoxic properties of biomaterials. The results of the investigation of TC, WS, TW coatings, and pure alloy Mg0.8Ca are shown in Figure 18. No cytotoxic effect towards the NIH/3T3 fibroblast cells was observed for the samples with all types of coatings, since the viability of the cell line decreased by no more than 10%. The number of living cells was 89.61%, 92.66%, and 93.57% for TC, WS, and TW coatings, respectively (Figure 18a–c). The lowest level of cytotoxicity was observed for TW coatings. The total population in cells treated with TW coating extract at the stage of early apoptosis (Q3) and late apoptosis (Q2) was 5.03% and 1.33%, respectively (Figure 17c).
After 24-h incubation, the extract of uncoated pure Mg0.8Ca alloy (Figure 18d) caused visible changes in the viability of the 3T3 cell line compared to the control (Figure 18e). The number of living cells was 80.65% for the alloy and 99.95% for the control. The extract of the alloy induced apoptosis in cells. For example, the total population at the stage of early apoptosis (Q3) and late apoptosis (Q2) in cells treated with the extract of Mg0.8Ca was 16.4% and 3.1%, respectively. The viability of NIH/3T3 cells decreased to 87%. Thus, products that reduce the viability of cells were formed in the process of biodegradation of the Mg0.8Ca alloy samples.
The production of micro-arc coatings with micro- and nanoparticles was a modern trend in surface engineering [47]. The introduction of particles into the composition of coatings along with other components and phases could significantly expand the range of properties and possibilities for modifying the surface of materials and improving their functional and operational characteristics [56].
Fattah-alhosseini [47] and Lee [48] revealed that higher negative values of ζ particles provided more stable rheological properties of the electrolyte, and protection against agglomeration in the electrolyte. In addition, a high negative ζ is favorable for electrophoretic processes and, under electrical action, promoted the movement of particles in the direction of the anode [47]. The authors [57] found that zeta-potential of ZrO2 particles became negative due to the addition of carboxylic acid since the particle surface was saturated with negatively charged carboxylate groups. This contributed to a better electrophoretic deposition of the particles.
In the present work, the coatings were formed in electrolytes containing micro-particles of TCP and wollastonite, which had negative zeta-potential (ζ) equal to −47 mV and −43 mV, respectively. According to [47,48,56,57] this property contributed to the intensification of the process of incorporation of TCP and wollastonite particles in the coatings.
The authors [58] have shown that the behavior of micro- and nanoparticles during the formation of MAO (PEO) coatings depends on their melting temperature. If it was high, the particles remain unchanged throughout the entire thickness of the coating. Lee et al. [59] studied behavior of different types of particles when the temperature of the plasma in discharge varied in the range of 1843–2370 °C. If the particles’ melting point was lower than the temperature developing in the micro-arc discharge channel, the particles melted and interacted with the electrolyte and substrate components [60].
In this paper, comparative studies were carried out and regularities partially obtained earlier [18,19,20,30] regarding the processes of the formation of micro-arc coatings with the microparticles of β-TCP and wollastonite were confirmed. It was shown, that in the anodic potentiostatic mode, the current density was maximal at the initial moment of coating deposition. In this case, the β-TCP and wollastonite particles melted and an amorphous-crystalline porous coating layer was formed. Secondary crystalline phases of forsterite, hydroxyapatite, magnesium phosphate, akermanite, and magnesium oxide were formed in the course of plasma-chemical reactions, during the interaction of molten particles, other components of the electrolyte, and the substrate. With an increase in the thickness of the dielectric coating, the current density decreased, and dispersed particles were deposited on the surface and in the near-surface layer without significant changes [18,30].
Studies have shown that at the low process voltage of 350 V, the crystalline phase was predominant in all coatings. However, as the voltage increased in the range of 400–500 V, the content of the crystalline phase decreased and the amount of the amorphous phase sharply increased, especially in WS coatings. In TC coatings formed in the voltage range of 450–500 V, the content of the crystalline phase was the highest among all types of coatings. This led to the fact that the adhesion properties of TC coatings were the best, the maximum breaking load reached 19.2 N, which exceeded the known values obtained by other authors for PEO coatings [61]. The maximum penetration depth of the indenter into the coating was 84 µm when the coating thickness was 87 µm.
However, the study of corrosion and biological properties showed the advantage of WS and TW coatings. As such, the WS coatings had the highest corrosion resistance, so for them the corrosion current and corrosion resistance were 1.8 × 10⁻⁷ A cm−2 and 1.2 × 10⁵ Ω cm−2, respectively. For comparison, Chaharmahali et al. [21] reported about coatings with hydroxyapatite obtained on AZ31B-Mg alloy using plasma electrolytic oxidation, that are characterized by the corrosion current in the range of 1.99 × 10⁻⁶–8.54 × 10⁻⁶ A cm−2 and corrosion resistance in the range of 4.24–11.27 kΩ cm−2.
A lower dissolution rate was observed for WS and TW coatings than for TC coating, possibly because TC coatings had a minimum thickness. When WS coatings dissolved, the change in the pH of the medium was minimal among all three types of coatings. However, some authors believe that a slight increase in the alkalinity of the environment in the area of implantation prevented the development of bacterial infections [2].
The crystals of calcium phosphate formed on the surface of all coatings, after keeping them in the SBF solution for 7 days. However, for TC coating, they were observed in a smaller amount and the elemental composition of TC coating did not change at all. In TW coatings, plate-like crystals were observed. In addition, the content of calcium and phosphorus increased in both WS and TW coatings. Yang et al. [23] have shown similar results.
The study of cytotoxic properties by the MTT test method showed that the highest number of surviving cells of 84% (in undiluted extract) and 95% (after dilution) was found in the interaction of WS coatings with the 3T3 cell line. The studies performed by flow cytometry showed that the number of living cells when interacting with the extracts of WS and TW coatings was 92.66% and 93.57%, respectively. The total population at the stage of early apoptosis and late apoptosis (Q3,Q2) in the cells treated with WS and TW extract coatings, was 5.96%, 1.32%, and 5.03%, 1.33% respectively. Thus, TW coatings had the least cytotoxicity.

4. Conclusions

The coatings containing microparticles of TCP and wollastonite separately, and in combination with each other were formed on an Mg0.8Ca alloy. When the current density was the highest at the initial period of the coating’s deposition, the particles melted and an amorphous-crystalline porous coating layer was formed. Then, the current density decreased due to the formation of a dielectric layer, and the particles were deposited on the surface of the coatings without transformation. The coatings included both the initial crystalline phases of β-TCP and wollastonite, and newly formed phases such as α-TCP, magnesium phosphate, forsterite, hydroxyapatite, akermanite, and magnesium oxide.
Comparative studies of the thickness and roughness of the coatings showed that among the coatings deposited at 500 V the TC coating had the smallest thickness and roughness, equal to 80 and 8 µm, respectively. Whereas, the WS coating had the maximum thickness equal to 150 µm and TW coating had the maximum roughness Ra equal to 10.5 µm.
All coatings showed high adhesive strength, corrosion resistance, and biocompatibility. However, the properties of the coatings differed depending on the type of contained particles. The TC coating had the highest adhesive properties, since the value of the critical load for this coating reached 19.2 N.
WS and TW coatings were less soluble and more biocompatible. The mass loss of the TW and WS coatings within 16 days was 1.5% and 1.8%, respectively. In this case, the mass loss of the TC coating reached 3.6%.
WS coating deposited at 500 V was the most corrosion-resistant since it had the lowest corrosion current density equal to 1.8 × 10⁻⁷ A cm−2 and the highest resistance equal to 1.2 × 10⁵ Ω cm2.
Thus, when replacing a bone defect with a coated implant, the surface layer of the coating containing particles became an interface interacting with tissues and biological fluids. By changing the composition of the dispersed phase, it was possible to vary the properties of the coating and give it specific characteristics (adhesive, osteogenic, corrosive, antibacterial, etc.).

Author Contributions

Conceptualization: M.S. and A.U.; methodology: A.U. and O.B.; software: P.U. and A.U.; validation: M.S., A.U., A.K. and O.B.; formal analysis: P.U. and M.K.; investigation: T.T. and A.M.; resources: J.S.; data curation: T.T., M.K., A.K. and V.E.; writing—original draft preparation: M.S.; writing—review and editing: M.S., O.B., A.K. and V.E.; visualization: V.E. and J.S.; supervision: O.B.; project administration: Y.S.; funding acquisition: Y.S. All authors have read and agreed to the published version of the manuscript.

Funding

The work was performed according to the Government research assignment for ISPMS SB RAS, project FWRW-2021-0007.

Institutional Review Board Statement

Not applicable.

Informed Consent Statement

Not applicable.

Data Availability Statement

Not applicable.

Acknowledgments

The authors express their appreciation for the valuable contributions of Ales Buyakov, V.V. Chebodaeva, I.A. Glukhov, and A.I. Tolmachev from the Institute of Strength Physics and Materials Science SB RAS (Tomsk, Russia) for their assistance in the preparation of the experimental materials.

Conflicts of Interest

The authors declare no conflict of interest.

References

  1. Chen, Q.; Thouas, G.A. Metallic implant biomaterials. Mat. Sci. Eng. R. 2015, 87, 1–5. [Google Scholar] [CrossRef]
  2. Esmaily, M.; Svensson, J.E.; Fajardo, S.; Birbilis, N.; Frankel, G.S.; Virtanen, S.; Arrabal, R.; Thomas, G. Johansson, Fundamentals and advances in magnesium alloy corrosion. Prog. Mater. Sci. 2017, 89, 92–193. [Google Scholar] [CrossRef]
  3. Shao, Y.; Zeng, R.C.; Li, S.Q.; Cui, L.Y.; Zou, Y.H.; Guan, S.K.; Zheng, Y.F. Advance in antibacterial magnesium alloys and surface coatings on magnesium alloys: A Review. Acta Metall. Sin. Engl. Lett. 2020, 33, 615–629. [Google Scholar] [CrossRef]
  4. Sezer, N.; Evis, Z.; Kayhan, S.M.; Tahmasebifar, A.; Koç, M. Review of magnesium-based biomaterials and their applications. J. Magnes. Alloy. 2018, 6, 23–43. [Google Scholar] [CrossRef]
  5. Khlusov, I.A.; Mitrichenko, D.V.; Prosolov, A.B.; Nikolaeva, O.O.; Slepchenko, G.B.; Sharkeev, Y.P. Short review of the biomedical properties and application of magnesium alloys for bone tissue bioengineering. Bull. Sib. Med. 2019, 18, 274–286. [Google Scholar] [CrossRef]
  6. Chen, Y.T.; Hung, F.Y.; Syu, J.C. Biodegradable implantation material: Mechanical properties and surface corrosion mechanism of Mg-1Ca-0.5Zr Alloy. Metals 2019, 9, 857. [Google Scholar] [CrossRef]
  7. Putra, N.E.; Mirzaali, M.J.; Apachitei, I.; Zhou, J.; Zadpoor, A.A. Multi-material additive manufacturing technologies for Ti-, Mg-, and Fe-based biomaterials for bone substitution. Acta Biomater. 2020, 109, 1–20. [Google Scholar] [CrossRef] [PubMed]
  8. Kawamura, N.; Nakao, Y.; Ishikawa, R.; Tsuchida, D.; Iijima, M. Degradation and biocompatibility of AZ31 magnesium alloy implants in vitro and in vivo: A micro-computed tomography study in rats. Materials 2020, 13, 473. [Google Scholar] [CrossRef]
  9. Ali, M.; Elsherif, M.; Salih, A.E.; Ul-Hamid, A.; Hussein, M.A.; Park, S.; Yetisen, A.K.; Butt, H. Surface modification and cytotoxicity of Mg-based bio-alloys: An overview of recent advances. J. Alloys Compd. 2020, 825, 154140. [Google Scholar] [CrossRef]
  10. Atrens, A.; Johnston, S.; Shi, Z.; Dargusch, M.S. Viewpoint–understanding Mg corrosion in the body for biodegradable medical implants. Scripta Mater. 2018, 154, 92–100. [Google Scholar] [CrossRef]
  11. Zhang, D.; Liu, Y.; Liu, Z.; Wang, Q. Advances in antibacterial functionalized coatings on Mg and its alloys for medical use—A Review. Coatings 2020, 10, 828. [Google Scholar] [CrossRef]
  12. Prosolov, K.A.; Lastovka, V.V.; Belyavskaya, O.A.; Lychagin, D.V.; Schmidt, J.; Sharkeev, Y.P. Tailoring the surface morphology and the crystallinity state of Cu- and Zn-substituted hydroxyapatites on Ti and Mg-based alloys. Materials 2020, 13, 4449. [Google Scholar] [CrossRef] [PubMed]
  13. Cheon, K.H.; Park, C.; Kang, M.H.; Kang, I.G.; Lee, M.K.; Lee, H.; Kim, H.E.; Jung, H.D.; Jang, T.S. Construction of tantalum/poly(ether imide) coatings on magnesium implants with both corrosion protection and osseointegration properties. Bioact. Mater. 2021, 6, 1189–1200. [Google Scholar] [CrossRef] [PubMed]
  14. Kaseem, M.; Ko, Y.G. Morphological modification and corrosion response of MgO and Mg3(PO4)2 composite formed on magnesium alloy. Compos. B Eng. 2019, 176, 107225. [Google Scholar] [CrossRef]
  15. Rahman, M.; Li, Y.; Wen, C. HA coating on Mg alloys for biomedical applications: A review. J. Magnes. Alloy. 2020, 8, 929–943. [Google Scholar] [CrossRef]
  16. Tian, Q.; Lin, J.; Rivera-Castaneda, L.; Tsanhani, A.; Dunn, Z.S.; Rodriguez, A.; Aslani, A.; Liu, H. Nano-to-submicron hydroxyapatite coatings for magnesium-based bioresorbable implants–deposition, characterization, degradation, mechanical properties, and cytocompatibility. Sci. Rep. 2019, 9, 810. [Google Scholar] [CrossRef]
  17. Albulescu, R.; Popa, A.C.; Enciu, A.M.; Albulescu, L.; Dudau, M.; Popescu, I.D.; Mihai, S.; Codrici, E.; Pop, S.; Lupu, A.R.; et al. Comprehensive in vitro testing of calcium phosphate-based bioceramics with orthopedic and dentistry applications. Materials 2019, 12, 3704. [Google Scholar] [CrossRef]
  18. Sedelnikova, M.B.; Komarova, E.G.; Sharkeev, Y.P.; Tolkacheva, T.V.; Sheikin, V.V.; Egorkin, V.S.; Mashtalyar, D.V.; Kazakbaeva, A.A.; Schmidt, J. Characterization of the Micro-Arc Coatings Containing β-Tricalcium Phosphate Particles on Mg-0.8Ca Alloy. Metals 2018, 8, 238. [Google Scholar] [CrossRef]
  19. Sedelnikova, M.B.; Sharkeev, Y.P.; Tolkacheva, T.V.; Khimich, M.A.; Bakina, O.V.; Fomenko, A.N.; Kazakbaeva, A.A.; Fadeeva, I.V.; Egorkin, V.S.; Gnedenkov, S.V.; et al. Comparative Study of the structure, properties, and corrosion behavior of Sr-containing biocoatings on Mg0.8Ca. Materials 2020, 13, 1942. [Google Scholar] [CrossRef]
  20. Sedelnikova, M.B.; Ugodchikova, A.V.; Uvarkin, P.V.; Chebodaeva, V.V.; Tolkacheva, T.V.; Schmidt, J.; Sharkeev, Y.P. Structural-morphological and adhesive properties of calcium-phosphate coatings formed on a magnesium alloy by micro-arc oxidation in an electrolyte containing disperse particles. Russ. Phys. J. 2021, 64, 830–837. [Google Scholar] [CrossRef]
  21. Chaharmahali, R.; Fattah-alhosseini, A.; Babaei, K. Surface characterization and corrosion behavior of calcium phosphate (Ca-P) base composite layer on Mg and its alloys using plasma electrolytic oxidation (PEO): A review. J. Magnes. Alloy. 2021, 9, 21–40. [Google Scholar] [CrossRef]
  22. Lazarev, D.M.; Farrakhov, R.G.; Mukaeva, V.R.; Kulyasova, O.B.; Parfenov, E.V.; Yerokhin, A.L. Growth kinetics and corrosion protection properties of plasma electrolytic oxidation coatings on biodegradable Mg−2% Sr alloy. Surf. Eng. Appl. Electrochem. 2020, 56, 83–92. [Google Scholar] [CrossRef]
  23. Yang, J.; Lu, X.; Blawert, C.; Di, S.; Zheludkevich, M.L. Microstructure and corrosion behavior of Ca/P coatings prepared on magnesium by plasma electrolytic oxidation. Surf. Coat. Techn. 2017, 319, 359–369. [Google Scholar] [CrossRef]
  24. Wierzbicka, E.; Pillado, B.; Mohedano, M.; Arrabal, R.; Matykina, E. Calcium doped flash-PEO coatings for corrosion protection of Mg alloy. Metals 2020, 10, 916. [Google Scholar] [CrossRef]
  25. Echeverry-Rendon, M.; Echeverria, F.; Harmsen, M.C. Interaction of different cell types with magnesium modified by plasma electrolytic oxidation. Colloids Surf. B 2020, 193, 111153. [Google Scholar] [CrossRef] [PubMed]
  26. Pan, Y.; Chen, C.; Wang, D.; Huang, D. Dissolution and precipitation behaviors of silicon-containing ceramic coating on Mg–Zn–Ca alloy in simulated body fluid. Colloids Surf. B 2014, 122, 746–751. [Google Scholar] [CrossRef]
  27. Palakurthy, S.; Reddy, K.V.G.; Samudrala, R.K.; Azeem, P.A. In vitro bioactivity and degradation behaviour of β-wollastonite derived from natural waste. Mat. Sci. Eng. C 2019, 98, 109–117. [Google Scholar] [CrossRef] [PubMed]
  28. Mohammadi, H.; Hafezi, M.; Nezafati, N.; Heasarki, S.; Nadernezhad, A.; Ghazanfari, S.M.H.; Sepantafar, M. Bioinorganics in bioactive calcium silicate ceramics for bone tissue repair: Bioactivity and biological properties. J. Ceram. Sci. Techn. 2014, 5, 1–12. [Google Scholar] [CrossRef]
  29. Zakaria, M.Y.; Sulong, A.B.; Muhamad, N.; Raza, M.R.; Ramli, M.I. Incorporation of wollastonite bioactive ceramic with titanium for medical applications: An overview. Mat. Sci. Eng. C 2019, 97, 884–895. [Google Scholar] [CrossRef]
  30. Sedelnikova, M.B.; Ugodchikova, A.V.; Tolkacheva, T.V.; Chebodaeva, V.V.; Cluklhov, I.A.; Khimich, M.A.; Bakina, O.V.; Lerner, M.I.; Egorkin, V.S.; Schmidt, J.; et al. Surface modification of Mg0.8Ca alloy via wollastonite micro-arc coatings: Significant improvement in corrosion resistance. Metals 2021, 11, 754. [Google Scholar] [CrossRef]
  31. Zhai, W.; Lu, H.; Wu, C.; Chen, L.; Lin, X.; Naoki, K.; Chen, G.; Chang, J. Stimulatory effects of the ionic products from Ca–Mg–Si bioceramics on both osteogenesis and angiogenesis in vitro. Acta Biomater. 2013, 9, 8004–8014. [Google Scholar] [CrossRef] [PubMed]
  32. Wu, C.; Chang, J. Degradation, bioactivity, and cytocompatibility of diopside, akermanite, and bredigite ceramics. J. Biomed. Mater. Res. Part B Appl. Biomater. 2007, 83, 153–160. [Google Scholar] [CrossRef]
  33. Ni, S.; Chang, J.; Chou, L.; Zhai, W. Comparison of osteoblast-like cell responses to calcium silicate and tricalcium phosphate ceramics in vitro, Inc. J. Biomed. Mater. Res. Part B Appl. Biomater. 2007, 80B, 174–183. [Google Scholar] [CrossRef]
  34. Liu, Q.; Cen, L.; Yin, S.; Chen, L.; Liu, G.; Chang, J.; Cui, L. A comparative study of proliferation and osteogenic differentiation of adipose-derived stem cells on akermanite and β-TCP ceramics. Biomaterials 2008, 29, 4792–4799. [Google Scholar] [CrossRef] [PubMed]
  35. Gheisari, H.; Karamian, E.; Abdellahi, M. A novel hydroxyapatite Hardystonite nanocomposite ceramic. Ceram. Int. 2015, 41, 5967–5975. [Google Scholar] [CrossRef]
  36. Jamil, M.; Elouahli, A.; Abida, F.; Khallok, H.; Gourri, E.; Kheribech, A.; Hatim, Z. Development of triphasic hydroxyapatite/(α and β)–tricalcium phosphate based composites by sintering powder of calcium–apatite in the presence of montmorillonite. J. Inorg. Organomet. Polym. Mater. 2020, 30, 2489–2498. [Google Scholar] [CrossRef]
  37. Rosemann, P.; Schmidt, J.; Heyn, A. Short and long term degradation behaviour of Mg–1Ca magnesium alloys and protective coatings based on plasma-chemical oxidation and biodegradable polymercoating in synthetic body fluid. Mater. Corros. 2013, 64, 714–722. [Google Scholar] [CrossRef]
  38. Sedelnikova, M.B.; Sharkeev, Y.P.; Komarova, E.G.; Khlusov, I.A.; Chebodaeva, V.V. Structure and properties of the wollastonite–calcium phosphate coatings deposited on titanium and titanium–niobium alloy using micro-arc oxidation method. Surf. Coat. Techn. 2016, 307, 1274–1283. [Google Scholar] [CrossRef]
  39. Sedelnikova, M.B.; Komarova, E.G.; Sharkeev, Y.P.; Ugodchikova, A.V.; Tolkacheva, T.V.; Rau, J.V.; Buyko, E.E.; Ivanov, V.V.; Sheikin, V.V. Modification of titanium surface via Ag-, Sr- and Si-containing micro-arc calcium phosphate coating. Bioact. Mater. 2019, 4, 224–235. [Google Scholar] [CrossRef]
  40. Bragg, W.L.; Claringbull, G.F. Crystal Structure of Minerals; Cornell University Press: Ithaca, NY, USA, 1965; Volume 4. [Google Scholar]
  41. ASTM G59–97; Standard Test Method for Conducting Potentiodynamic Polarization Resistance Measurements. ASTM International: West Conshohocken, PA, USA, 2009.
  42. Shi, Z.; Atrens, A. An innovative specimen configuration for the study of Mg corrosion. Corros. Sci. 2011, 53, 226–246. [Google Scholar] [CrossRef]
  43. Kokubo, T.; Takadama, H. How useful is SBF in predicting in vivo bone bioactivity? Biomaterials 2006, 27, 2907–2915. [Google Scholar] [CrossRef] [PubMed]
  44. Sadowska, J.M.; Wei, F.; Guo, J.; Guillem-Marti, J.; Lin, Z.; Ginebra, M.P.; Xiao, Y. The effect of biomimetic calcium deficient hydroxyapatite and sintered β-tricalcium phosphate on osteoimmune reaction and osteogenesis. Acta Biomater. 2019, 96, 605–618. [Google Scholar] [CrossRef] [PubMed]
  45. Somemura, S.; Kumai, T.; Yatabe, K.; Sasaki, C.; Fujiya, H.; Niki, H.; Yudoh, K. Physiologic Mechanical Stress Directly Induces Bone Formation by Activating Glucose Transporter 1 (Glut 1) in Osteoblasts, Inducing Signaling via NAD+-Dependent Deacetylase (Sirtuin 1) and Runt-Related Transcription Factor 2 (Runx2). Int. J. Mol. Sci. 2021, 22, 9070. [Google Scholar] [CrossRef]
  46. Mortazavi, G.; Jiang, J.; Meletis, E.I. Investigation of the plasma electrolytic oxidation mechanism of titanium. Appl. Surf. Sci. 2019, 488, 370–382. [Google Scholar] [CrossRef]
  47. Fattah-alhosseini, A.; Chaharmahali, R.; Babaei, K. Effect of particles addition to solution of plasma electrolytic oxidation (PEO) on the properties of PEO coatings formed on magnesium and its alloys: A review. J. Magnes. Alloy. 2020, 8, 799–818. [Google Scholar] [CrossRef]
  48. Lee, K.M.; Shin, K.R.; Namgung, S.; Yoo, B.; Shin, D.H. Electrochemical response of ZrO2-incorporated oxide layer on AZ91 Mg alloy processed by plasma electrolytic oxidation. Surf. Coat. Techn. 2011, 205, 3779–3784. [Google Scholar] [CrossRef]
  49. Osborn, E.F.; Muan, A.; Levin, E.M.; Robbins, C.R.; McMurdie, H.F. Phase Diagrams for Ceramists. J. Am. Ceram. Soc. 1978, 496, 257. [Google Scholar]
  50. Dorozhkin, S.V. Multiphasic calcium orthophosphate (CaPO4) bioceramics and their biomedical applications. Ceram. Int. 2016, 42, 6529–6554. [Google Scholar] [CrossRef]
  51. Dorozhkin, S.V. Calcium orthophosphates (CaPO4): Occurrence and properties. Prog. Biomater. 2016, 5, 9–70. [Google Scholar] [CrossRef]
  52. Aliofkhazraei, M.; Macdonald, D.D.; Matykina, E.; Parfenov, E.V.; Egorkin, V.S.; Curran, J.A.; Troughton, S.C.; Sinebryukhov, S.L.; Gnedenkov, S.V.; Lampke, T.; et al. Review of plasma electrolytic oxidation of titanium substrates: Mechanism, properties, applications and limitations. Appl. Surf. Sci. 2021, 5, 100121. [Google Scholar] [CrossRef]
  53. Khan, R.H.U.; Yerokhin, A.L.; Li, X.; Dong, H.; Matthews, A. Influence of current density and electrolyte concentration on DC PEO titania coatings. Surf. Eng. 2014, 30, 102–108. [Google Scholar] [CrossRef]
  54. Darband, G.B.; Aliofkhazraei, M.; Hamghalam, P.; Valizade, N. Plasma electrolytic oxidation of magnesium and its alloys: Mechanism, properties and applications. J. Magnes. Alloy. 2017, 5, 74–132. [Google Scholar] [CrossRef]
  55. Dorozhkin, S.V. Synthetic amorphous calcium phosphates (ACPs): Preparation, structure, properties, and biomedical applications. R. Soc. Chem. Biomater. Sci. 2021, 9, 7748–7798. [Google Scholar] [CrossRef]
  56. Polunin, A.V.; Cheretaeva, A.O.; Borgardt, E.D.; Rastegaev, I.A.; Krishtal, M.M.; Katsman, A.V.; Yasnikov, I.S. Improvement of oxide layers formed by plasma electrolytic oxidation on cast Al–Si alloy by incorporating TiC nanoparticles. Surf. Coat. Technol. 2021, 423, 127603. [Google Scholar] [CrossRef]
  57. Hanaor, D.; Michelazzi, M.; Leonelli, C.; Sorrell, C.C. The effects of carboxylic acids on the aqueous dispersion and electrophoretic deposition of ZrO2. J. Eur. Ceram. Soc. 2012, 32, 235–244. [Google Scholar] [CrossRef]
  58. Zhuang, J.J.; Guo, Y.Q.; Xiang, N.; Xiong, Y.; Hu, Q.; Song, R.G. A study on microstructure and corrosion resistance of ZrO2-containingPEO coatings formed on AZ31 Mg alloy in phosphate-based electrolyte. Appl. Surf. Sci. 2015, 357, 1463–1471. [Google Scholar] [CrossRef]
  59. Lee, K.M.; Lee, B.U.; Yoon, S.I.; Lee, E.S.; Yoo, B.; Shin, D.H. Evaluation of plasma temperature during plasma oxidation processing of AZ91 Mg alloy through analysis of the melting behavior of incorporated particles. Electrochim. Acta 2012, 67, 6–11. [Google Scholar] [CrossRef]
  60. Lu, X.; Sah, S.P.; Scharnagl, N.; Störmer, M.; Starykevich, M.; Mohedano, M.; Blawert, C.; Zheludkevich, M.L.; Kainer, K.U. Degradation behavior of PEO coating on AM50 magnesium alloy produced from electrolytes with clay particle addition. Surf. Coat. Technol. 2015, 269, 155–169. [Google Scholar] [CrossRef]
  61. Kyrylenko, S.; Warchoł, F.; Oleshko, O.; Husak, Y.; Kazek-Kęsik, A.; Korniienko, V.; Deineka, V.; Sowa, M.; Maciej, A.; Michalska, J.; et al. Effects of the sources of calcium and phosphorus on the structural and functional properties of ceramic coatings on titanium dental implants produced by plasma electrolytic oxidation. Mater. Sci. Eng. C 2021, 119, 111607. [Google Scholar] [CrossRef]
Figure 1. SEM images of β-TCP (a) and wollastonite (b) particles.
Metals 12 01647 g001
Figure 2. Graphs of the ζ of the TCP and wollastonite particles versus the pH.
Metals 12 01647 g002
Figure 3. (a) Graphs of the current density versus the time of the TC, WS, and TW coatings deposition at 400 V; (b) graphs of the initial current density versus the voltages of the coating’s deposition.
Metals 12 01647 g003
Figure 4. Graphs of the coatings thickness (a) and roughness (b) versus the voltage of the coating’s deposition.
Metals 12 01647 g004
Figure 5. Surface morphology of the TC (a,d), WS (b,e), and TW (c,f) coatings, deposited at 350 (ac) V and 500 V (df); cross-section images of the TC (g), WS (h), and TW (i) coatings, deposited at 400 V.
Metals 12 01647 g005aMetals 12 01647 g005b
Figure 6. SEM images of the surface of the TC (a), WS (b), and TW (c) coatings with the marked zones; cross-section images of the TC (d), WS (e), and TW (f) coatings with the tracks of the distribution of the elements.
Metals 12 01647 g006
Figure 7. XRD patterns of the coatings deposited at 350 V: M—Mg, W—wollastonite, F—forsterite, P—MgO, β—β-TCP, and α—α-TCP, H—hydroxyapatite.
Metals 12 01647 g007
Figure 8. Diagrams of the content of crystalline (a) and amorphous (b) phases in the coatings versus the voltage of the coating’s deposition.
Metals 12 01647 g008
Figure 9. Micro-diffraction patterns of the fragments of the TC (a), WS (b), and TW (c) coatings. β-TCP—β tricalcium phosphate, HA—hydroxyapatite, W—wollastonite, Ak— akermanite.
Metals 12 01647 g009
Figure 10. Optical images of the tracks after scratch testing of the coatings TC (a), WS (b), and TW (c).
Metals 12 01647 g010
Figure 11. Graphs of changes in the coefficient of friction along the tracks in the TC (a), WS (b), and TW (c) coatings.
Metals 12 01647 g011
Figure 12. SEM-images of the zone of the substrate damage (ac), the depth of the indenter penetration into the coatings along the track length (df).
Metals 12 01647 g012
Figure 13. Potentiodynamic polarization (PDP) curves obtained in 0.9% NaCl for the bare Mg0.8Ca alloy and the coatings formed at 350 V (a) and at 500 V (b).
Metals 12 01647 g013
Figure 14. Graphs of the mass loss over time (a), kinetics of pH changes in the cell medium during interaction with the samples (b).
Metals 12 01647 g014
Figure 15. SEM images of the coatings after the SBF (ac), the elemental composition of the coatings before and after the SBF (df).
Metals 12 01647 g015aMetals 12 01647 g015b
Figure 16. Effect of Mg0.8Ca and coating extracts on the viability of 3T3 cell line determined by MTT assay (1), when extracts were diluted 10 (2) and 100 (3) times as compared to control. For each group, 5 wells per plate were treated identically, and each experiment was performed with at least 3 plates.
Metals 12 01647 g016
Figure 17. Optical images of the 3T3 cells after the interaction with the coatings and stained with trypan blue (blue—dead cells), cell viability (% of negative control): (a) TC, (b) WS, (c) TW, (d) control.
Metals 12 01647 g017
Figure 18. NIH/3T3 cells after incubation with the samples TC (a), WS (b), TW (c), and alloy Mg0.8Ca (d); control (untreated cells) (e). The results of the research with the help of flow cytometry.
Metals 12 01647 g018aMetals 12 01647 g018b
Table 1. The chemical composition of electrolytes.
CompoundThe Content of Compounds in the Electrolyte, g/L
IIIIII
CaSiO3-30–6020–40
β-Ca3(PO4)230–70-20–40
Na2HPO4·12H2O30–50--
NaOH555
Na2SiO3-1010
NaF333
Coating symbolTCWSTW
Table 2. Elemental composition in the marked zones.
Elements, at.%Marked Zones
ABCDEFG
O Kα50.262.063.963.657.259.858.2
Mg Kα6.617.20.711.11.82.020.5
P Kα20.315.2--16.33.34.4
Ca Kα22.95.616.76.422.219.75.7
Si Kα--18.718.92.515.211.2
Table 3. Critical load for the coatings deposited at different process voltages.
The CoatingsCritical Load, Lc, N
350 V450 V500 V
TC11.4 ± 0.917.0 ± 0.219.2 ± 0.3
WS10.1 ± 0.412.9 ± 0.216.4 ± 0.2
TW10.7 ± 0.816.4 ± 1.017.8 ± 0.4
Table 4. Electrochemical parameters.
Sample (Applied Voltage, V)Ec, V (vs. Ag/AgCl)ic, A cm−2Rp, Ω cm2
Mg0.8Ca−1.461.3 × 10−43.1 × 10²
TC (350)−1.651.8 × 10−62.0 × 10⁴
TC (500)−1.587.2 × 10−74.6 × 10⁴
WS (350)−1.444.8 × 10−75.2 × 10⁴
WS (500)−1.411.8 × 10−71.2 × 10⁵
TW (350)−1.411.1 × 10−51.9 × 10³
TW (500)−1.447.0 × 10−63.5 × 10⁴
Publisher’s Note: MDPI stays neutral with regard to jurisdictional claims in published maps and institutional affiliations.

