
Microstructure of Joints Processed by Ultrasonic Consolidation of Nickel Sheets
by
 ,
,
Elvina R. Shayakhmetova
1,*,
Mariya A. Murzinova
1,
Vasiliy S. Zadorozhniy
2 and
Ayrat A. Nazarov
1 1
Institute for Metals Superplasticity Problems, Russian Academy of Sciences, 39 Khalturin Street, Ufa 450001, Russia
2
Ural Power Engineering Institute, Ural Federal University, 19 Mir Street, Ekaterinburg 620002, Russia
*
Author to whom correspondence should be addressed.
Metals 2022, 12(11), 1865; https://doi.org/10.3390/met12111865
Submission received: 23 September 2022
/
Revised: 14 October 2022
/
Accepted: 28 October 2022
/
Published: 1 November 2022
Abstract
:Ultrasonic consolidation is an advanced process of sequential solid-state joining of metal foils or sheets by ultrasonic welding. This process was used for joining six sheets of nickel with a thickness of 0.2 mm. Ultrasonic consolidation was accompanied by the formation of wear particles between the sheets. The appearance of microbonds between the sheet surface and the wear particles led to the formation of parallel rows of voids and swirl-like patterns near the interfaces. It was shown that ultrasonic consolidation of nickel sheets led to the formation of fine recrystallized grains near contact surfaces and a subgrain structure in the bulk of the consolidated layers. The microstructural changes were accompanied by an increase in the microhardness of nickel from 1567 MPa in the initial sheet to 2065 and 2400 MPa, respectively, in the bulk and joint zones of the consolidated sample. However, significant differences in the microstructure and microhardness of the layers were not revealed, despite the fact that the accumulated plastic deformation and thermal effects were different from layer to layer. This unexpected result was explained by an inhomogeneity of the microstructure of the nickel samples obtained by ultrasonic consolidation and by a possible interplay between ultrasonic residual hardening and softening.

1. Introduction
Ultrasonic welding (USW) as a method of solid-state joining of metals was invented in the early 1950s of the last century [1,2]. This process is carried out by applying high-frequency shear vibrations parallel to the planes of the foils or sheets to be welded pressed to each other by a normal clamping force. Owing to its efficiency and continuous improvement, this method has become a technology that is used in various industries (automotive, electronics, electrical, instrumentation, etc.) [3,4]. In recent decades, interest in ultrasonic welding has increased since it is the basic process underlying the advanced technology of ultrasonic consolidation (USC). The ultrasonic consolidation proposed by White and patented by Solidica Inc., USA [5], is an innovative process of additive manufacturing, in which three-dimensional metal objects of complex shapes are obtained by successive seam welding of foil tapes or sheets of metals. USC is used in the manufacture of multilayer parts with various combinations of sheet thicknesses and materials [6,7,8]. The joints of thin sheets of highly conductive materials such as copper, aluminum, and nickel are required, for example, during the production of capacitors and lithium-ion batteries for the electronics and automotive industries [9]. Moreover, USC is a very efficient process to fabricate heat exchangers with intricate internal channels [7]. Nickel, due its high heat conductivity and corrosion resistance in chemical environments, is widely used in heat exchangers in aggressive media [10]. Therefore, the study of joints processed by USC of nickel has an important practical aspect.
Microstructure evolution during USW and USC of aluminum and copper-based alloys and its relationship with processing parameters were considered in many research articles, and their results have been summarized in several reviews [11,12,13]. However, mechanisms of bond formation, as well as the effects of USW/USC processing parameters on the joint quality still remain debatable.
Joint formation during USC has some distinctive features as compared to USW. While before USW, both surfaces to be welded are similar (they are smooth and usually cleaned of coarse oxides and contaminants), before each step of USC, the surfaces of the sheet to be welded and of the substrate (previously welded tape or sheet) are different. These differences appear due to the interaction of the upper surface of the substrate with the welding tip or sonotrode during the preceding step of consolidation. In contrast to the sheet to be welded, which has a smooth and cleaned surface, the surface of the substrate is deformed, oxidized, and has a relief that is similar to the one of the welding tip or sonotrode.
The relief on the substrate surface makes it very difficult to obtain defect-free samples or parts by USC [12,13,14]. Usually, spherical voids and thin gaps are located in one or more rows along the joint interfaces. To increase the weld density, it is recommended to perform postprocessing heat treatment [15,16,17] or hot isostatic pressing [18,19]; to select reasonable sonotrode patterns [20,21,22]; to increase the substrate temperature, clamping force, oscillation amplitude; and to decrease the welding speed [23,24,25,26,27,28]. Variation of the named process parameters will inevitably lead to changes in friction conditions, friction-induced heating, and deformation development (metal flow) on the contact surfaces and, consequently, to changes in the bulk and interface microstructures in ultrasonically consolidated samples, which, in turn, significantly affects their properties.
The most detailed structural studies were carried out on materials obtained by USC of similar aluminum-based alloys [29,30,31,32,33,34] and their combinations with other metals and alloys [35,36,37]. The structure of ultrasonically consolidated copper was considered in several articles [38,39,40]. To the best of our knowledge, there was only one article in which images and a description of the interface microstructure in samples produced by USC of nickel tapes were reported [41].
In the above-mentioned studies on USC of copper and aluminum [29,30,31,32,33,34,35,36,37,38,39,40], the authors observed structure refinement along weld joint interfaces. New small grains were located mainly in the near-surface layer of the substrate (top of bottom tape layer), while in the welded tape (bottom of top tape layer), no changes in the shape and size of grains were revealed and an increase in the fraction of low-angle boundaries and the formation of a subgrain structure was found [29,30,31,34]. The authors of the mentioned references believed that new fine grains were formed as a result of dynamic recrystallization, and it was the recrystallization that “led to metallurgical bonding through grain boundary migration and allowed for successive welding of tapes” [37]. Meanwhile, the interface microstructure in nickel joints obtained by USC was found to differ significantly from that described above [41]. Fine recrystallized grains were revealed only around unbonded regions and these new grains were located both in the bottom and top tapes. The microstructure in the well-bonded regions remained coarse-grained, with twins inside grains, and did not differ from the microstructure in the bulk of the tape. Janaki Ram et. al. noted: “While there is some amount of plastic deformation at the weld interface, the amount of plastic deformation does not seem to be macroscopically significant…There was no evidence of melting or recrystallization at the interfaces. The interfaces appeared flat and mechanical interlocking did not seem to be in place” [41].
The absence of structural changes in well-bonded regions of nickel tapes after ultrasonic consolidation does not agree with both the results of the structure examination of aluminum and copper samples made by USC and with the results of Ref. [42], where the ultrafine-grained structure was formed in the joint zone of coarse-grained nickel sheets after USW.
The present study aimed to obtain additional data on the microstructure and microhardness of joints processed by ultrasonic consolidation of nickel sheets making use of successive spot ultrasonic welding to simulate this process. Although this method is limited to small samples suitable just for microstructure examinations and microhardness tests, it allows using more readily available spot welding machines and controlling the ultrasonic amplitude in situ during welding. Considering the same underlying mechanisms behind the elementary welding processes, such a simulation allows one to obtain additional scientific information on the microstructure evolution during consolidation.
2. Materials and Methods
An annealed sheet of commercially pure nickel (purity 99.5%) with a thickness of 0.2 mm was used as the material for our studies. The typical microstructure of its longitudinal section is presented in Figure 1.
The average grain size in the initial sheet was estimated to be about 20 μm ignoring the twin boundaries (Figure 1a,b). The grain boundary misorientation spectrum (Figure 1c) has a pronounced maximum (about 0.4) near the angle of 60° which corresponds to ∑3 twin boundaries, while the fraction of low-angle boundaries is very low (less than 0.1). The microstructure of the initial sheet was fully recrystallized, which is proved by the fact that the average internal grain misorientations did not exceed 2° (Figure 1d). All the features described above are typical of annealed nickel [43].
Square cards with a side length of 1 cm were cut from the sheet. The surfaces to be joined were ground with abrasive papers, then washed with isopropyl alcohol and dried before consolidation. USC was carried out on an experimental home-made equipment for spot ultrasonic welding described in [42,44] and schematically presented in Figure 2. A sonotrode tip with dimensions of 4.5 mm × 6 mm having a serrated surface with seven parallel teeth oriented perpendicular to the vibration direction was used. The USC was carried out with a vibration frequency of 20 kHz, displacement amplitude of the welding tip of 15 μm, clamping force (P) of 6 kN, and welding time of 2 s. These values of welding parameters were selected based on the data of our earlier studies on ultrasonic welding of nickel sheets according to which allowed the formation of sound joints exhibiting high lap shear strength (about 70 MPa) [42].
Six sheets of nickel with a thickness of 0.2 mm were successively welded to a substrate of the same material with a thickness of 0.5 mm. For structure examination, the consolidated sample was cut using an electric discharge machine (“Delta-test”, Moscow, Russia) in the direction of the ultrasonic vibrations as indicated on Figure 2. The cut plane passed through the middle of the weld spot. The surface of the cross-section of the consolidated sample was mechanically ground and polished, the final treatment was performed on a diamond suspension with a particle size of 0.05 μm. The microstructure examination was performed on a TESCAN MIRA 3 LMH FEG (TESCAN ORSAY HOLDING a.s., Brno-Kohoutovice, Czech Republic) electron microscope equipped with a CHANNEL 5 electron backscattered diffraction (EBSD) analyzer (Oxford Instruments HKL, Oxford, UK). The EBSD data collection was carried out with a scanning step of 0.2, 0.5, and 1 μm for different zones of the sample. The quality of the maps was considered satisfactory if the number of indexed points was at least 85%. When processing the EBSD data, misorientations less than 2° were not taken into account, boundaries with misorientations from 2° to 15° were considered as low-angle boundaries (LABs), and those with misorientations of more than 15° as high-angle boundaries (HABs). On microstructure maps, the LABs, HABs, and twin boundaries were plotted by white, black, and red lines, respectively. A fragment with an area of at least five points was taken as a grain. The equivalent diameter was taken as the grain size. The average grain and subgrain sizes were determined in accordance with the requirements of ASTM E 112-10. The density of geometrically necessary dislocations, (GNDs, hereinafter the term dislocation density will also be used) was estimated as a function of kernel average misorientation, θ, where θ was below the subgrain misorientation angle equal to 5°, and the size of kernel was prescribed to the 5th nearest-neighbor as described by Zhilyaev et al. [45]. To obtain statistically reliable data, four EBSD maps obtained from each layer of the consolidated sample, both from its volume and joint zones, were analyzed. Each map contained at least 50 grains. The absolute statistical error of the measurements was calculated for a confidence level of 90%.
The Vickers microhardness measurements were performed in accordance with the requirements of ASTM E 384-05a, using an ITV-1AM testing instrument (“Metrotest”, Neftekamsk, Russia) under a test force of 0.098 H (10 gf) and a dwell time of 10 s. The microhardness was measured separately in bulk and interface zones of each welded layer. The average value at a point was determined from the results of at least five measurements. The standard deviation was taken as the error of measurements.
3. Results and Discussion
Figure 3 shows the macrostructure of the consolidated sample in its cross-section. At a microscope magnification of less than 200, voids and thin gaps were observed only at the peripheries of the joints.
With microscope magnifications of more than 1000, it was possible to reveal discontinuities less than 1 μm in size and fine misoriented crystallites (grains and subgrains) differing in shades of gray (Figure 4). Thin gaps and spherical voids, which are often located in two or three rows, predominated in the partially-bonded regions (Figure 4a–c). Elongated wear particles were observed within some of these gaps (Figure 4a). Such particles were mainly located in the peripheral sections of the fourth and fifth joints. Under the shear and compression strains acting during the process of USW, the wear particles acquired sinuous swirl-like shapes (see insert in top right corner of Figure 4a), as well as flattened and filled valleys on the substrate, which can improve the quality of the joints [46]. The appearance of microbonds between the sheet surface and wear particles led to the formation of parallel rows of voids and swirl-like patterns near interfaces (Figure 4b), which are usually associated with mechanical interlocking between the welded materials [13].
Contact surfaces between all layers had a wave-like profile, repeating the profile of the welding tip (Figure 4c). Therefore, under the chosen processing conditions of the USC of the nickel sheets, the filling of the valleys formed due to the interaction of the upper surfaces with the welding tip occurred mainly due to the plastic flow of the metal, and the crumpling and flattening of the hills was insignificant. Partially-bonded regions with small voids alternated with well-bonded regions as is represented in Figure 4d. The well-bonded regions were predominant in the central parts of the joints.
It should be emphasized that fine misoriented crystallites were observed along all contact surfaces: in the bottom and top sheets, near discontinuities, within wear particles, as well as in soundly joined regions (Figure 4). To clarify the structural features around the contact surfaces and in the bulks of the sheets of the consolidated sample, the EBSD analysis was performed.
The BSE images and COMs of the microstructure in the cross-section of the consolidated sample are shown in Figure 5.
It can be seen that the microstructures of all layers are similar. The ultrasonic consolidation of Ni sheets led to the formation of distinct microstructural zones. There are regions in the bulk of the sheets consisting of relatively coarse grains (further referred to as coarse-grained zones) and fine-grained zones near interfaces.
Figure 6 illustrates the differences in inter- and intragrain misorientations in the coarse-grained and fine-grained zones of the consolidated sample. In the coarse-grained zones (Figure 6a), the average grain area is similar to that in the initial sheet (Figure 1a,b), but the grains have a curved shape and uneven contrast due to residual internal stresses [47,48]. Networks of low-angle boundaries were formed inside these grains (Figure 6a,c) and the fraction of twins decreased significantly in comparison with that in the initial structure (Figure 1c). Grain average misorientations increased from 1–2° in the initial sheet (Figure 1d) to 5–12° in the bulk material of the consolidated sheets (Figure 6f). The structural changes described are typical of nickel subjected to cold or warm deformation up to strains of 0.10–0.29 [43].
No transition microstructural zones, where the grains would gradually change in size, were observed between the coarse-grained and fine-grained zones (Figure 6b). However, in large grains adjacent to the fine-grained zone, the intragranular misorientations rapidly increased in the direction from the grain centers to the boundaries with fine grains. An example is presented in Figure 6e which plots the change in misorientation with a distance along line AB shown in Figure 6b. It can be seen that a net of low-angle boundaries with misorientations more than 5° were formed inside coarse grains near the fine-grained zone; that is, a layer with a developed subgrain structure (with the subgrain size of 1–2 μm) adjoins the fine grains. For this reason, the width of the fine-grained zone seems essentially larger in BSE images than in crystal orientation maps.
In the fine-grained zone (Figure 6g), substructured and deformed grains occupy approximately 70% of the volume and the rest of the volume is occupied by equiaxed recrystallized grains with sizes from 0.5 to 3 μm. Here, the fraction of high-angle boundaries is about 0.7, but the height of the bar near the angle of 60° in the grain boundary misorientation spectrum, which corresponds to ∑3 twin boundaries, is very small (Figure 6d).
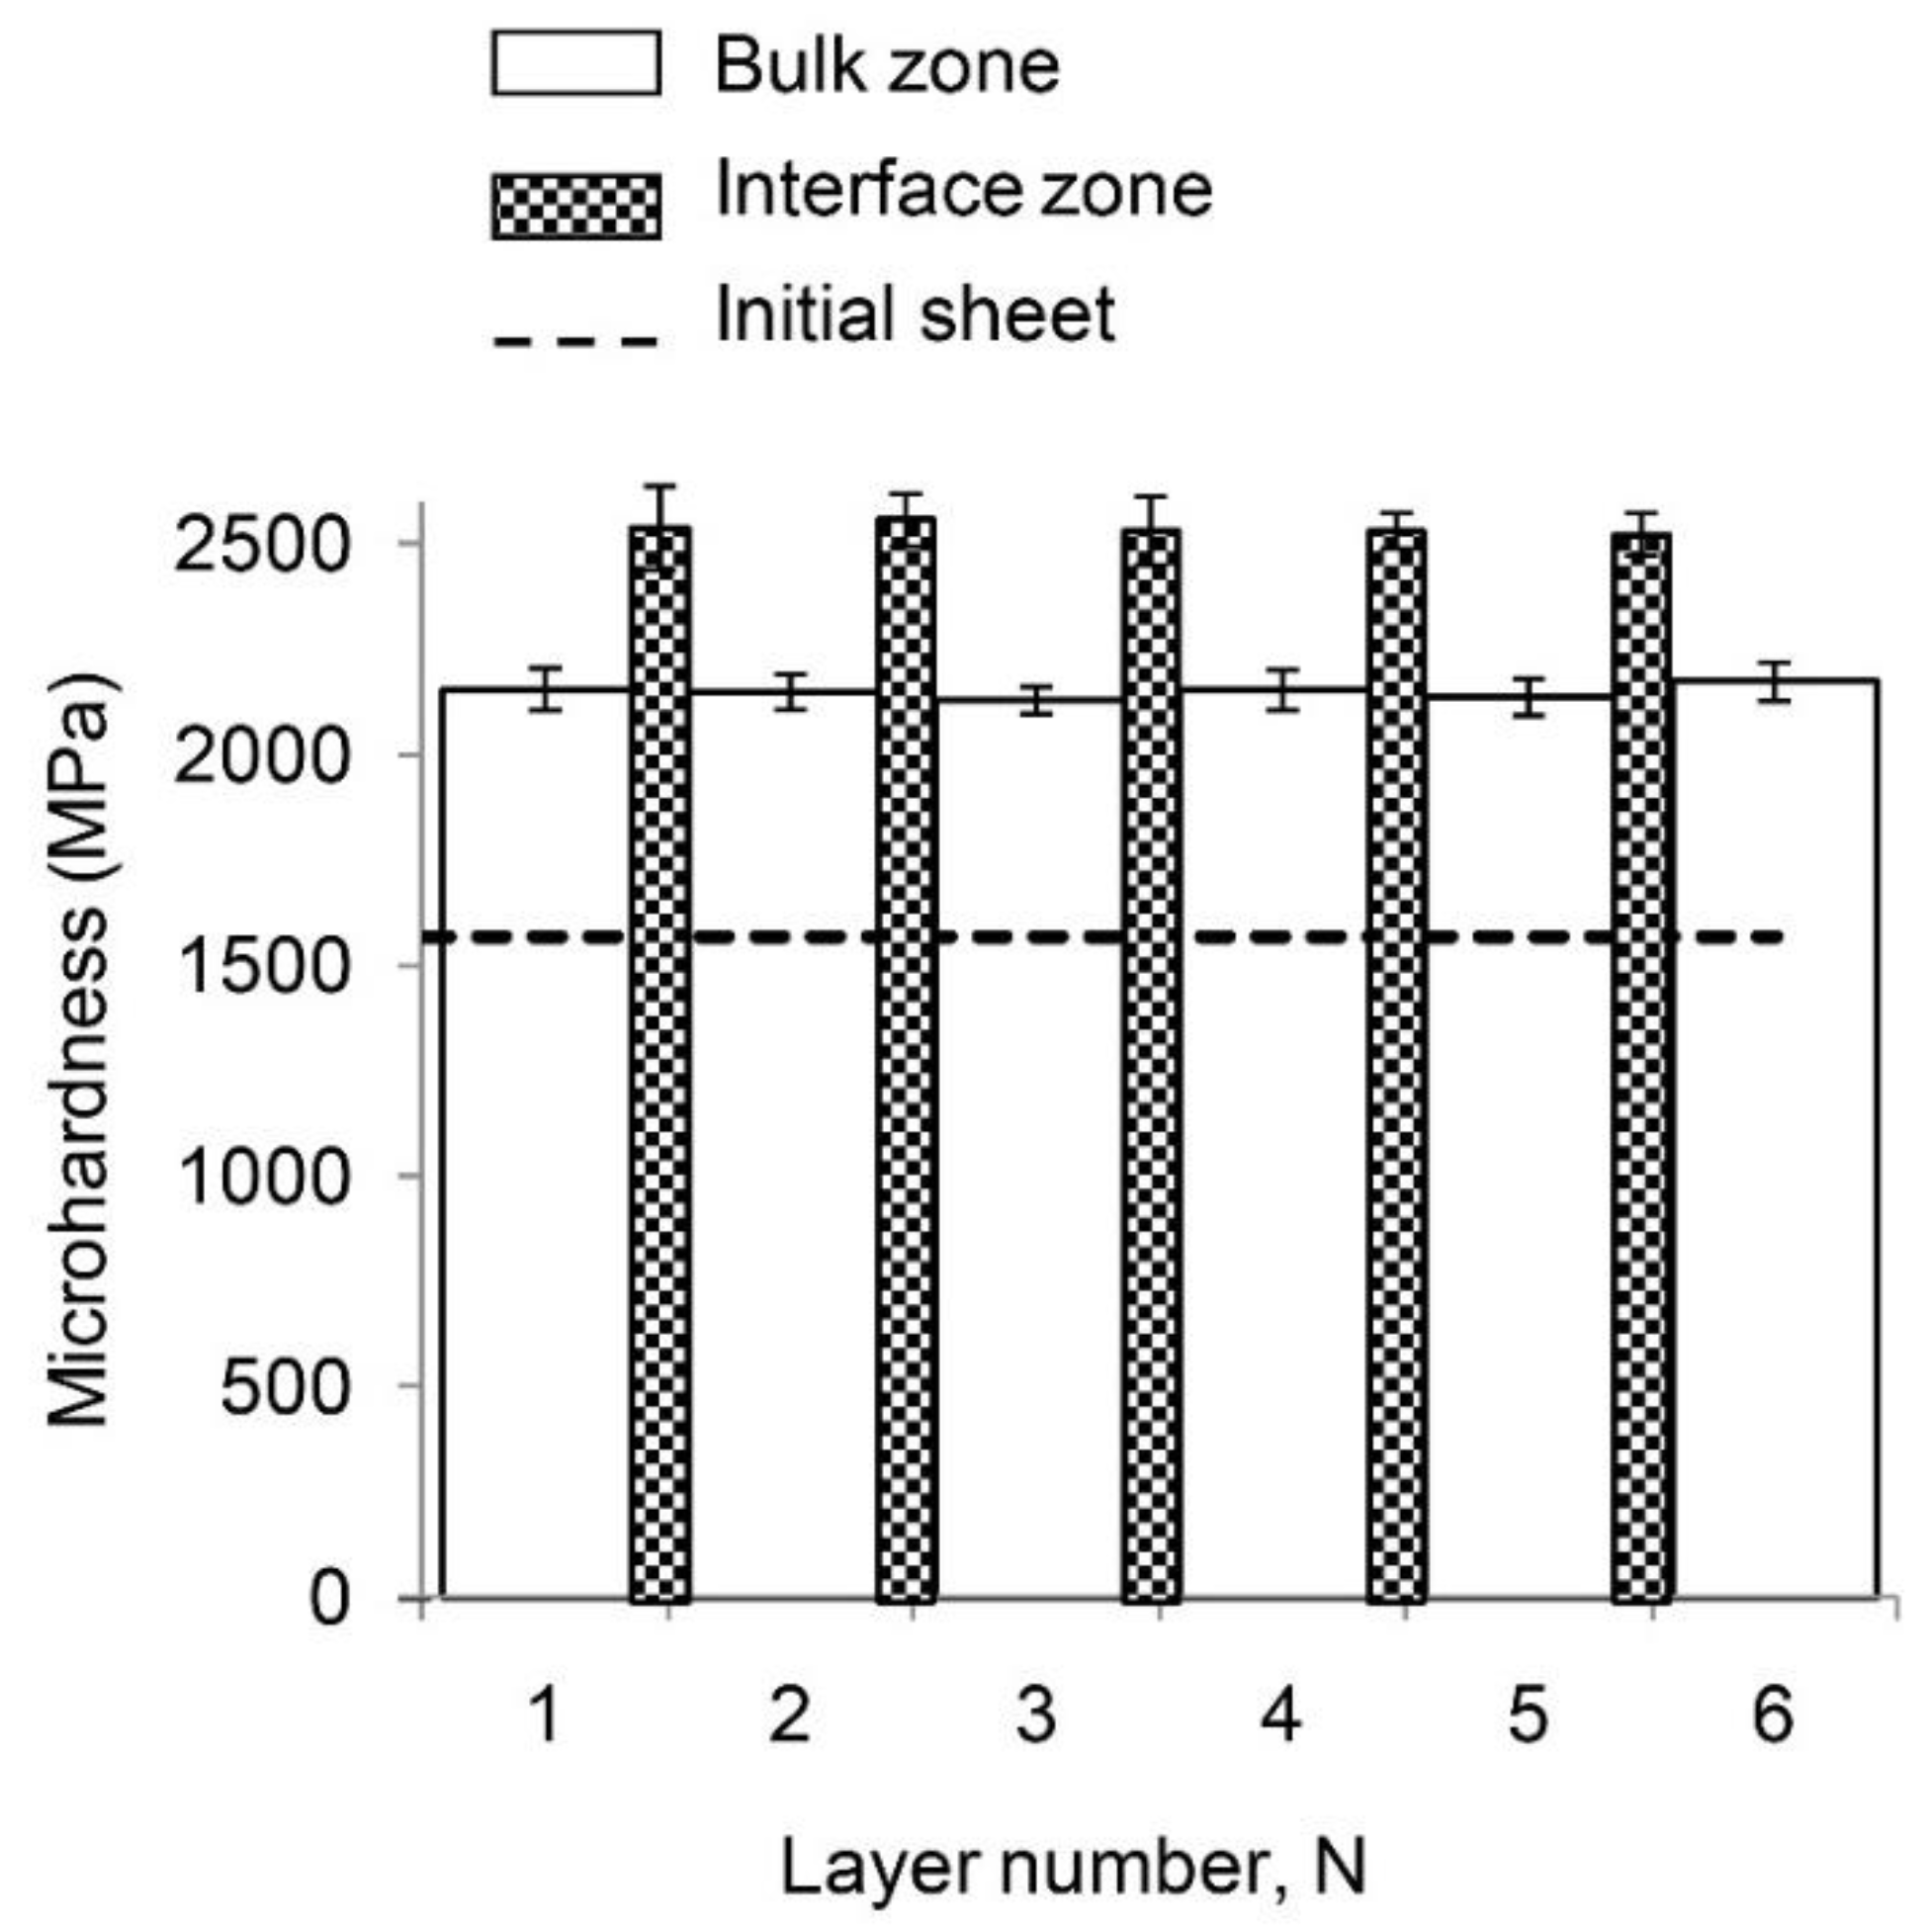
The observed microstructural features are consistent with the results of the microhardness measurements in different zones of the consolidated sample, which are represented in Figure 7. The measurements were carried out along the middle line of each consolidated layer (sheet) and along each interface. The layers in Figure 7 are numbered from the bottom to the top of the consolidated sample. It can be seen that the microhardness practically does not change from layer to layer and from interface to interface.
The absence of a difference in the microhardness and microstructure of the layers seems quite unexpected, since the accumulations of plastic deformation and thermal effects from layer to layer are different. To understand the obtained experimental results, we compared the average sizes of grains, Di, subgrains disoriented to more than 5°, di, and the density of geometrically necessary dislocations (GNDs), ρi, which result in the lattice curvature below 5°, in different layers of the consolidated sample and did not reveal statistically significant differences in their values. For example, the average sizes of grains, subgrains, and density of GNDs in coarse-grained regions of the first and fifth layers were, correspondingly, D1 = 19.2 ± 1.7 μm and D5 = 18.4 ± 2.3 μm, d1 = 5.5 ± 1.8 μm and d5 = 4.5 ± 1.2 μm, ρ1 = 1.4 × 10¹⁴ ± 1.8 × 10¹³ m−2 and ρ5 = 1.7 × 10¹⁴ ± 3.2 × 10¹³ m−2. In different joint zones with fine-grained structure, the average sizes of grains, DJi, and subgrains, dJi, were also similar: DJ1 = 0.92 ± 0.23 μm, dJ1 = 0.73 ± 0.18 μm and DJ5 = 0.71 ± 0.33 μm, dJ5 = 0.63 ± 0.26 μm. As were the values of GND density, ρJi, in the layers: ρJ1 = 1.5 × 10¹⁴ ± 1.9 × 10¹³ m−2 and ρJ5 = 1.7 × 10¹⁴ ± 3.8 × 10¹³ m−2.
This result can be explained by the extreme inhomogeneity of the structure both in the bulk of the layers and in the joint zones. We can only note a tendency towards a decrease in the dislocation density and an increase in the size of the subgrains in the first layer in comparison with the fifth one, which is explained by the development of recovery processes in the lower layers during repeated heating cycles. Furthermore, the estimates of the dislocation density and subgrain sizes made were fairly rough, since they depended on the scanning step and did not account for statistically stored dislocations, i.e., dislocations belonging to systems with a zero net Burgers vector, which do not cause lattice curvature.
Another explanation of this feature can be based on an interplay of acoustic residual softening and hardening which was recently considered for the case of ultrasonic-assisted compression straining of CoCrFeMnNi high-entropy alloy [49]. When the initial dislocation density is low, the materials tend to harden under the effect of ultrasound, while the materials with high initial dislocation density will soften. Therefore, in each next welded layer, intensive multiplication of dislocation will occur, while in the lower layers already exposed to ultrasound, annihilation will prevail. This might result in a decrease in the differences between the densities of dislocations and substructure parameters in different layers of the consolidated sample.
Average values of the microhardness in the initial sheet, bulk, and interface zones of the consolidated sample are equal to 1567, 2065, and 2400 MPa, respectively. Thus, the microhardness in the bulks of the consolidated sheets and near the weld joint interfaces is about 30 and 50% higher as compared to the one in the initial sheet.
The largest increase in microhardness in the fine-grained zone, where high-angle boundaries prevail (Figure 6d), is in good agreement with the Hall–Petch relationship, according to which the yield stress or hardness are inversely proportional to the square root of the grain size [50,51]. Based on this relationship, one can estimate the microhardness increase due to the difference in average grain sizes in the initial sheet din = 9 μm (taking now twin boundaries into account) and in the joint zone dj = 0.8 μm as ΔHV = k(dj−1/2 − din−1/2) = 670 MPa, where k = 27 GPa·nm1/2 as used for nickel in Ref. [52]. This value comprises the largest part (approximately 80%) of the total increase in the microhardness which is equal to 830 MPa. Evidently, the rest of the increase, 160 MPa, is due to the dislocation hardening. The increase in microhardness in the bulk of consolidated sheets approximately equal to 500 MPa can be explained by the formation of dislocation substructure, which is evidenced by the increased fraction of low-angle boundaries (Figure 6c). The value of the substructural hardening is directly proportional to the square root of the dislocation density and inversely proportional to the mean subgrain size [53]. Due to the absence of recrystallization, the dislocation hardening in this region is higher than in the fine-grained zone.
Thus, during ultrasonic consolidation of nickel sheets, noticeable changes in the microstructure and microhardness occurred. As has been noted above in the Introduction, the possibility of dynamic recrystallization during USC is not questioned in general. However, after USC of nickel tapes, no evidence of recrystallization in the well-bonded regions were found earlier [41]. In the present study, we showed that the USC of nickel, similar to that of copper and aluminum, can be accompanied by the formation of fine recrystallized grains near interfaces and the subgrain structure in the bulk of the consolidated layers.
4. Conclusions
The results of the present work show that by using ultrasonic welding of annealed nickel sheets with a thickness of 0.2 mm multilayer consolidated samples can be obtained. It was shown that wear particles could play a significant role in the formation of parallel rows of voids and swirl-like patterns near the interfaces. The ultrasonic consolidation of nickel sheets led to the formation of distinct microstructural zones in the samples. Zones with a fine-grained recrystallized microstructure with the width of about 10 µm were formed around the interfaces, while the bulks of the layers consisted of the zones with coarse deformed grains and developed internal substructure. The microstructural changes were accompanied by an increase in the microhardness of nickel from 1567 MPa in the initial sheet up to 2065 and 2400 MPa in the bulk and interface zones of the consolidated sample, respectively.
Author Contributions
Conceptualization, A.A.N.; methodology, E.R.S., V.S.Z. and M.A.M.; formal analysis, E.R.S. and V.S.Z.; investigation, E.R.S. and M.A.M.; writing—original draft preparation, E.R.S.; writing—review and editing, M.A.M. and A.A.N.; visualization, E.R.S.; supervision, A.A.N.; project administration, A.A.N. All authors have read and agreed to the published version of the manuscript.
Funding
The present work was accomplished in terms of the State Assignment of the Institute for Metals Superplasticity Problems of the Russian Academy of Sciences, financed by the Ministry of Science and Higher Education of the Russian Federation (Registration Number 122011900468-4).
Data Availability Statement
The data presented in this study are available in the article.
Acknowledgments
Electron microscopic studies and mechanical tests were carried out on the facilities of the shared services center of IMSP RAS “Structural and Physical-Mechanical Studies of Materials”.
Conflicts of Interest
The authors declare no conflict of interest.
References
- Willrich, H.O. Application of ultrasonic waves. Weld J. 1950, 18, 61–66. [Google Scholar]
- Lewis, W.J.; Antonevich, J.N.; Monroe, R.E.; Rieppel, P.J. Fundamental Studies on the Mechanism of Ultrasonic Welding; Technical Report; Wright-Patterson Air Force Base: Dayton, OH, USA, 1960. [Google Scholar]
- Matheny, M.P.; Graff, K.F. Ultrasonic welding of metals. In Power Ultrasonics-Applications of High-Intensity Ultrasound; GallegoJuárez, J.A., Graff, K.F., Eds.; Woodhead: Cambridge, UK, 2015; pp. 259–293. [Google Scholar]
- Ultrasonic Metal Welding. Available online: www.SonobondUltrasonics.com (accessed on 19 September 2022).
- White, D. Ultrasonic Object Consolidation. U.S. Patent 6,519,500, 23 March 2000. [Google Scholar]
- Su, Z.; Zhu, Z.; Zhang, Y.; Zhang, H.; Xiao, Q. Recrystallization Behavior of a Pure Cu Connection Interface with Ultrasonic Welding. Metals 2021, 11, 61. [Google Scholar] [CrossRef]
- Hehr, A.; Norfolk, M. A comprehensive review of ultrasonic additive manufacturing. Rapid. Proto. J. 2019, 26, 445–458. [Google Scholar] [CrossRef]
- Becker, M.; Balle, F. Multi-Spot Ultrasonic Welding of Aluminum to Steel Sheets: Process and Fracture Analysis. Metals 2021, 11, 779. [Google Scholar] [CrossRef]
- Lee, S.S.; Kim, T.H.; Hu, S.J.; Cai, W.W.; Li, J.; Abell, J.A. Characterization of joint quality in ultrasonic welding of battery tabs. J. Manuf. Sci. Eng. 2012, 135, 249–261. [Google Scholar] [CrossRef]
- Bakkar, A.; Ataya, S.; Badr, O. Failure analysis of heat exchanger tubes of Ni-200 alloy in a titanium tetrachloride vaporizer. J. Petrol. Min. Eng. 2020, 22, 21–25. [Google Scholar] [CrossRef]
- Sanga, B.; Wattal, R.; Nagesh, D. Mechanism of joint formation and characteristics of interface in ultrasonic welding: Literature Review. Period. Eng. Nat. Sci. 2018, 6, 107–119. [Google Scholar] [CrossRef]
- Li, D. A review of microstructure evolution during ultrasonic additive manufacturing. Int. J. Adv. Manuf. Technol. 2021, 113, 1–19. [Google Scholar] [CrossRef]
- Ni, Z.L.; Ye, F.X. Ultrasonic spot welding of aluminum alloys: A review. J. Manuf. Processes 2018, 35, 580–594. [Google Scholar] [CrossRef]
- Schick, D.E.; Hahnlen, R.M.; Dehoff, R.; Collins, P.; Babu, S.S.; Dapino, M.J.; Lippold, J.C. Microstructural characterization of bonding interfaces in aluminum 3003 blocks fabricated by ultrasonic additive manufacturing. Weld J. 2010, 89, 105–115. [Google Scholar]
- Sojiphan, K.; Sriraman, M.R.; Babu, S.S. Stability of Microstructure in Al3003 Builds made by Very High Power Ultrasonic Additive Manufacturing. In Proceedings of the International Sold Freeform Fabrication Symposium—An Additive Manufacturing Conference, Austin, TX, USA, 9–11 August 2010; pp. 362–372. [Google Scholar]
- Wolcott, P.; Hehr, A.; Pawlowski, C.; Dapino, M. Process improvements and characterization of ultrasonic additive manufactured structures. J. Mater. Process. Technol. 2016, 233, 44–52. [Google Scholar] [CrossRef] [Green Version]
- Gussev, M.N.; Sridharan, N.; Norfolk, M.; Terrani, K.A.; Babu, S.S. Effect of post weld heat treatment on the 6061 aluminum alloy produced by ultrasonic additive manufacturing. Mater. Sci. Eng. A 2017, 684, 606–616. [Google Scholar] [CrossRef]
- Gussev, M.N.; Sridharan, N.; Thompson, Z.; Terrani, K.A.; Babu, S.S. Influence of hot isostatic pressing on the performance of aluminum alloy fabricated by ultrasonic additive manufacturing. Scr. Mater. 2018, 145, 33–36. [Google Scholar] [CrossRef]
- Kuo, C.H.; Sridharan, N.; Han, T.; Dapino, M.J.; Babu, S.S. Ultrasonic additive manufacturing of 4130 steel using Ni interlayers. Sci. Technol. Weld. Join. 2019, 24, 382–390. [Google Scholar] [CrossRef]
- Friel, R.J.; Johnson, K.E.; Dickens, P.M.; Harris, R.A. The effect of interface topography for Ultrasonic Consolidation of aluminium. Mater. Sci. Eng. A 2010, 527, 4474–4483. [Google Scholar] [CrossRef] [Green Version]
- Feng, M.N.; Zhen, L. Interface morphology and microstructure of high-power ultrasonic spot welded Mg/Al dissimilar joint. Sci. Technol. Weld. Join. 2019, 24, 63–78. [Google Scholar] [CrossRef]
- Li, D.; Soar, R. Influence of sonotrode texture on the performance of an ultrasonic consolidation machine and the interfacial bond strength. J. Mater. Process. Technol. 2009, 209, 1627–1634. [Google Scholar] [CrossRef]
- Kong, C.Y.; Soar, R.C.; Dickens, P.M. Optimum process parameters for ultrasonic consolidation of 3003 aluminium. J. Mater. Process. Technol. 2004, 146, 181–187. [Google Scholar] [CrossRef]
- Li, H.; Cao, B. Effects of welding pressure on high-power ultrasonic spot welding of Cu/Al dissimilar metals. J. Manuf. Processes 2019, 46, 194–203. [Google Scholar] [CrossRef]
- Janaki Ram, G.D.; Yang, Y.; Stucker, B.E. Effect of process parameters on bond formation during ultrasonic consolidation of aluminum alloy 3003. J. Manuf. Syst. 2006, 25, 221–238. [Google Scholar] [CrossRef]
- Kulakov, M.; Rack, H.J. Control of 3003-H18 aluminum ultrasonic consolidation. J. Eng. Mater. Technol. 2009, 131, 0210061. [Google Scholar] [CrossRef]
- Hopkins, C.; Fernandez, S.; Dapino, M. Statistical characterization of ultrasonic additive manufacturing Ti/Al composites. J. Eng. Mater. Technol. 2010, 132, 041006. [Google Scholar] [CrossRef]
- Rousseau, J.-N.; Bois-Brochu, A.; Giguère, N.; Blais, C. Study of ultrasonic additive manufacturing and its utilization for the production of aluminum components made of alloys of the AA5XXX series. Int. J. Adv. Manuf. Technol. 2022, 119, 7983–8002. [Google Scholar] [CrossRef]
- Mariani, E.; Ghassemieh, E. Microstructure evolution of 6061 O Al alloy during ultrasonic consolidation: An insight from electron backscatter diffraction. Acta Mater. 2010, 58, 2492–2503. [Google Scholar] [CrossRef]
- Dehoff, R.; Babu, S.S. Characterization of interfacial microstructures in 3003 aluminum alloy blocks fabricated by ultrasonic additive manufacturing. Acta Mater. 2010, 58, 4305–4315. [Google Scholar] [CrossRef]
- Fujii, H.T.; Sriraman, M.R.; Babu, S.S. Quantitative evaluation of bulk and interface microstructures in Al-3003 alloy builds made by very high power ultrasonic additive manufacturing. Metall. Mater. Trans. A 2011, 42A, 4045–4055. [Google Scholar] [CrossRef]
- Shimizu, S.; Fujii, H.T.; Sato, Y.S.; Kokawa, H.; Sriraman, M.R.; Babu, S.S. Mechanism of weld formation during very-high-power ultrasonic additive manufacturing of Al alloy 6061. Acta Mater. 2014, 74, 234–243. [Google Scholar] [CrossRef]
- Fujii, H.T.; Shimizu, S.; Sato, Y.S.; Kokawa, H. High-strain-rate deformation in ultrasonic additive manufacturing. Scr. Mater. 2017, 135, 125–129. [Google Scholar] [CrossRef]
- Johnson, K.E. Interlaminar Subgrain Refinement in Ultrasonic Consolidation. Ph.D. Thesis, Loughborough University, Loughborough, UK, 2008. Available online: https://digitalcommons.olivet.edu/engn_facp/1 (accessed on 19 September 2022).
- Sridharan, N.; Wolcott, P.; Dapino, M.; Babu, S.S. Microstructure and texture evolution in aluminum and commercially pure titanium dissimilar welds fabricated using ultrasonic additive manufacturing. Scr. Mater. 2016, 117, 1–5. [Google Scholar] [CrossRef]
- Lin, J.-Y.; Nambu, S.; Koseki, T. Evolution of bonding interface during ultrasonic welding between steel and aluminium alloy. Sci. Technol. Weld. Join. 2019, 24, 83–91. [Google Scholar] [CrossRef]
- Wolcott, P.J.; Sridharan, N.; Babu, S.S.; Miriyev, A.; Frage, N.; Dapino, M.J. Characterisation of Al–Ti dissimilar material joints fabricated using ultrasonic additive manufacturing. Sci. Technol. Weld. Join. 2016, 21, 114–123. [Google Scholar] [CrossRef]
- Sriraman, M.R.; Babu, S.S.; Short, M. Bonding characteristics during very high power ultrasonic additive manufacturing of copper. Scr. Mater. 2010, 62, 560–563. [Google Scholar] [CrossRef]
- Obielodan, J.; Ceylan, A.; Murr, L.; Stucker, B. Multi-material bonding in ultrasonic consolidation. Rapid. Prototyp. J. 2010, 16, 180–188. [Google Scholar] [CrossRef]
- Sriraman, M.R.; Gonser, M.; Fujii, H.T.; Babu, S.S.; Bloss, M. Thermal transients during processing of materials by very high power ultrasonic additive manufacturing. J. Mater. Process Technol. 2011, 211, 1650–1657. [Google Scholar] [CrossRef]
- Janaki Ram, G.D.; Yang, Y.; Nylander, C.; Aydelotte, B.; Stucker, B.E.; Adams, B.L. Interface microstructures and bond formation in ultrasonic consolidation. In Proceedings of the International Solid Freeform Fabrication Symposium, Austin, TX, USA, 6–8 August 2007. [Google Scholar] [CrossRef]
- Shayakhmetova, E.R.; Murzinova, M.A.; Nazarov, A.A. Ultrasonic welding of nickel with coarse and ultrafine grained structures. Metals 2021, 11, 1800. [Google Scholar] [CrossRef]
- Gurao, N.P.; Satyam, S. Generalized scaling of misorientation angle distributions at meso-scale in deformed materials. Sci. Rep. 2014, 4, 5641. [Google Scholar] [CrossRef] [Green Version]
- Mukhametgalina, A.A.; Murzinova, M.A.; Nazarov, A.A. Ultrasonic spot welded, CP Ti/AA2024/CP Ti alloy joints. Lett. Mater. 2021, 11, 508–513. [Google Scholar] [CrossRef]
- Zhilyaev, A.P.; Shakhova, I.; Belyakov, A.; Kaibyshev, R.; Langdon, T.G. Wear resistance and electroconductivity in copper processed by severe plastic deformation. Wear 2013, 305, 89–99. [Google Scholar] [CrossRef]
- Lin, J.Y.; Nambu, S.; Koseki, T. Evolution of Bonding Interface during Ultrasonic Welding between Ni and Steels with Various Microstructure. ISIJ International 2020, 60, 330–336. [Google Scholar] [CrossRef] [Green Version]
- Schwartz, A.J.; Kumar, M.; Adams, B.L. Electron Backscatter Diffraction in Materials Science. In Mapping and Assessing Plastic Deformation Using EBSD; Brewer, L.N., Field, D.P., Merrima, C.C., Eds.; Springer Science: New York, NY, USA, 2009; pp. 251–276. [Google Scholar] [CrossRef]
- Wright, S.I.; Nowell, M.M.; Field, D.P. A Review of Strain Analysis Using Electron Backscatter Diffraction. Microsc. Microanal. 2011, 17, 316–329. [Google Scholar] [CrossRef]
- Li, C.; Tang, X.; Zhang, H.; Wang, X.; Deng, L.; Zhang, M.; Gong, P.; Jin, J. Ultrasonic and size effects on the rheological behavior of CoCrFeMnNi high-entropy alloy. J. All. Comp. 2022, 913, 165238. [Google Scholar] [CrossRef]
- Hall, E.O. Deformation and ageing of mild steel: III Discussion of Results. Proc. Phys. Soc. 1951, 64, 747–753. [Google Scholar] [CrossRef]
- Petch, N.J. The cleavage strength of polycrystals. J. Iron. Steel. Inst. 1953, 174, 25–28. [Google Scholar]
- Nazarov, A.A. On the pile-up model of the grain size-yield stress relation for nanocrystals. Scr. Mater. 1996, 34, 697–701. [Google Scholar] [CrossRef]
- Thompson, A.W. Substructure Strengthening Mechanisms. Metall. Trans. 1977, 8A, 833–842. [Google Scholar] [CrossRef]
Figure 1.
Microstructure in the cross-section of the initial sheet of Ni before USC: (a) backscattered electron (BSE) image; (b) crystal orientation map (COM) with color code in right top corner; (c) distribution of grain boundary misorientation angles; and (d) grain average misorientation map with the color code in the lower-left angle.
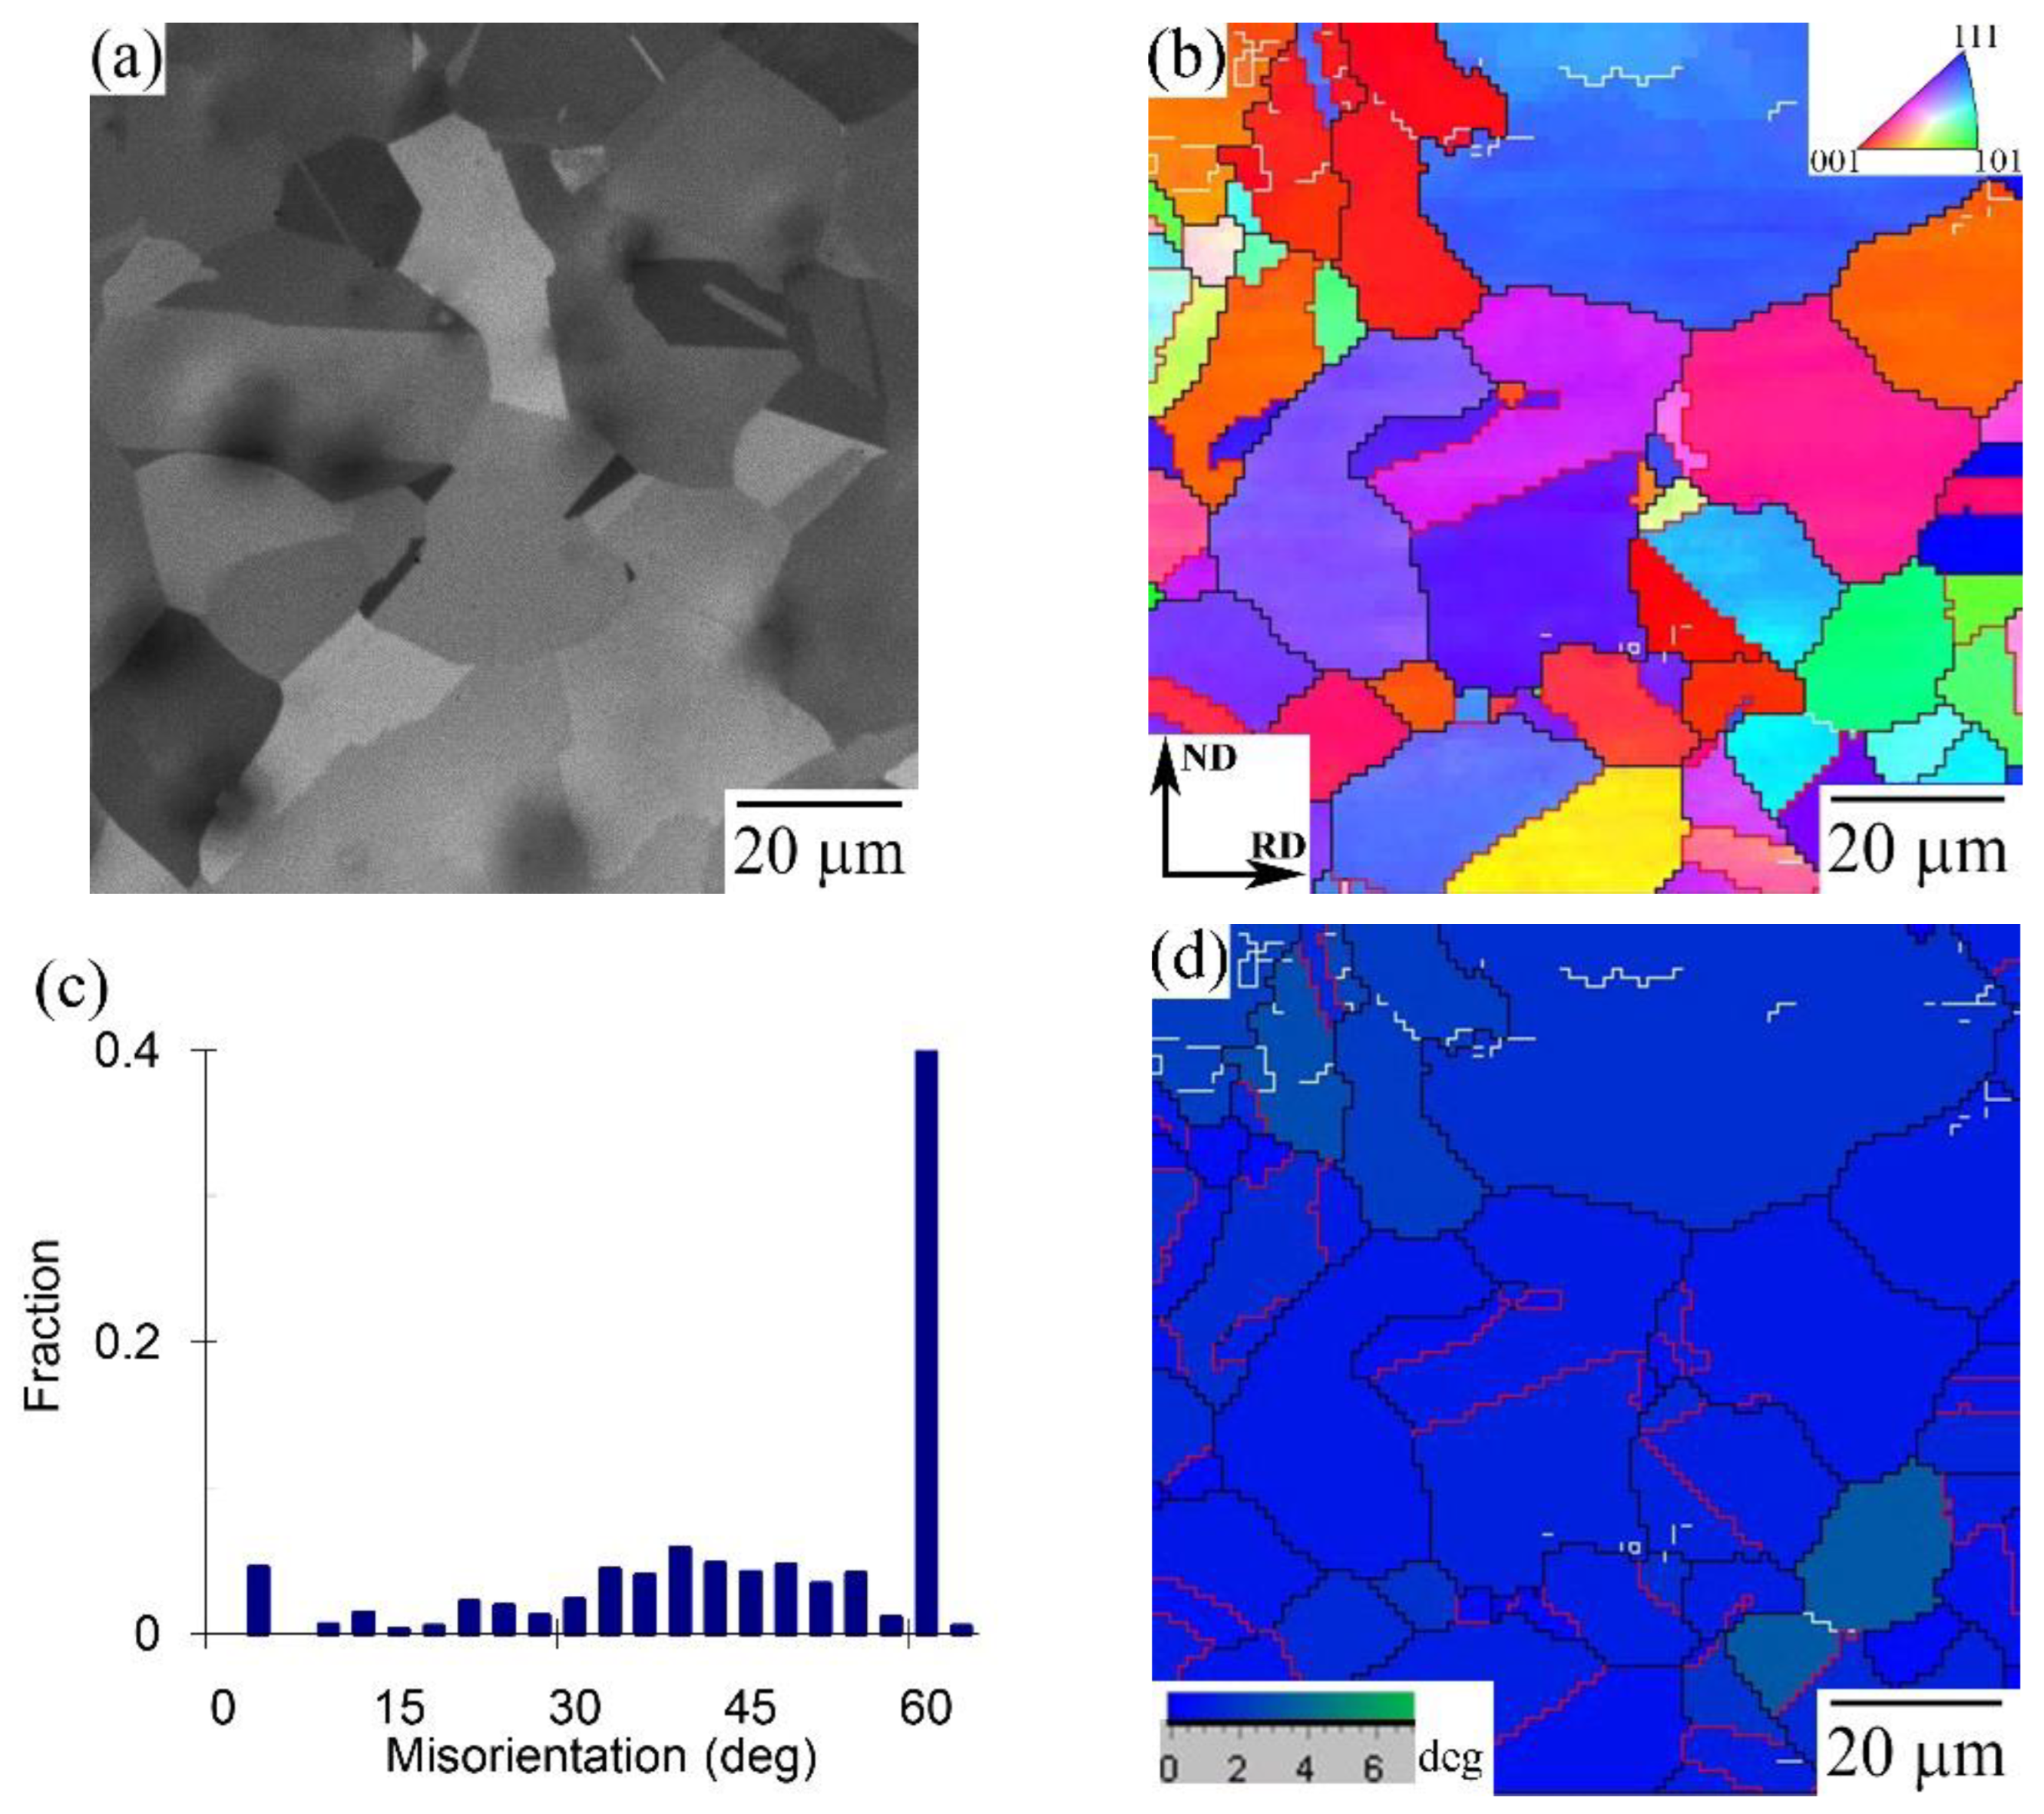
Figure 2.
A schematic representation of the process of ultrasonic consolidation and a consolidated sample.
Figure 2.
A schematic representation of the process of ultrasonic consolidation and a consolidated sample.
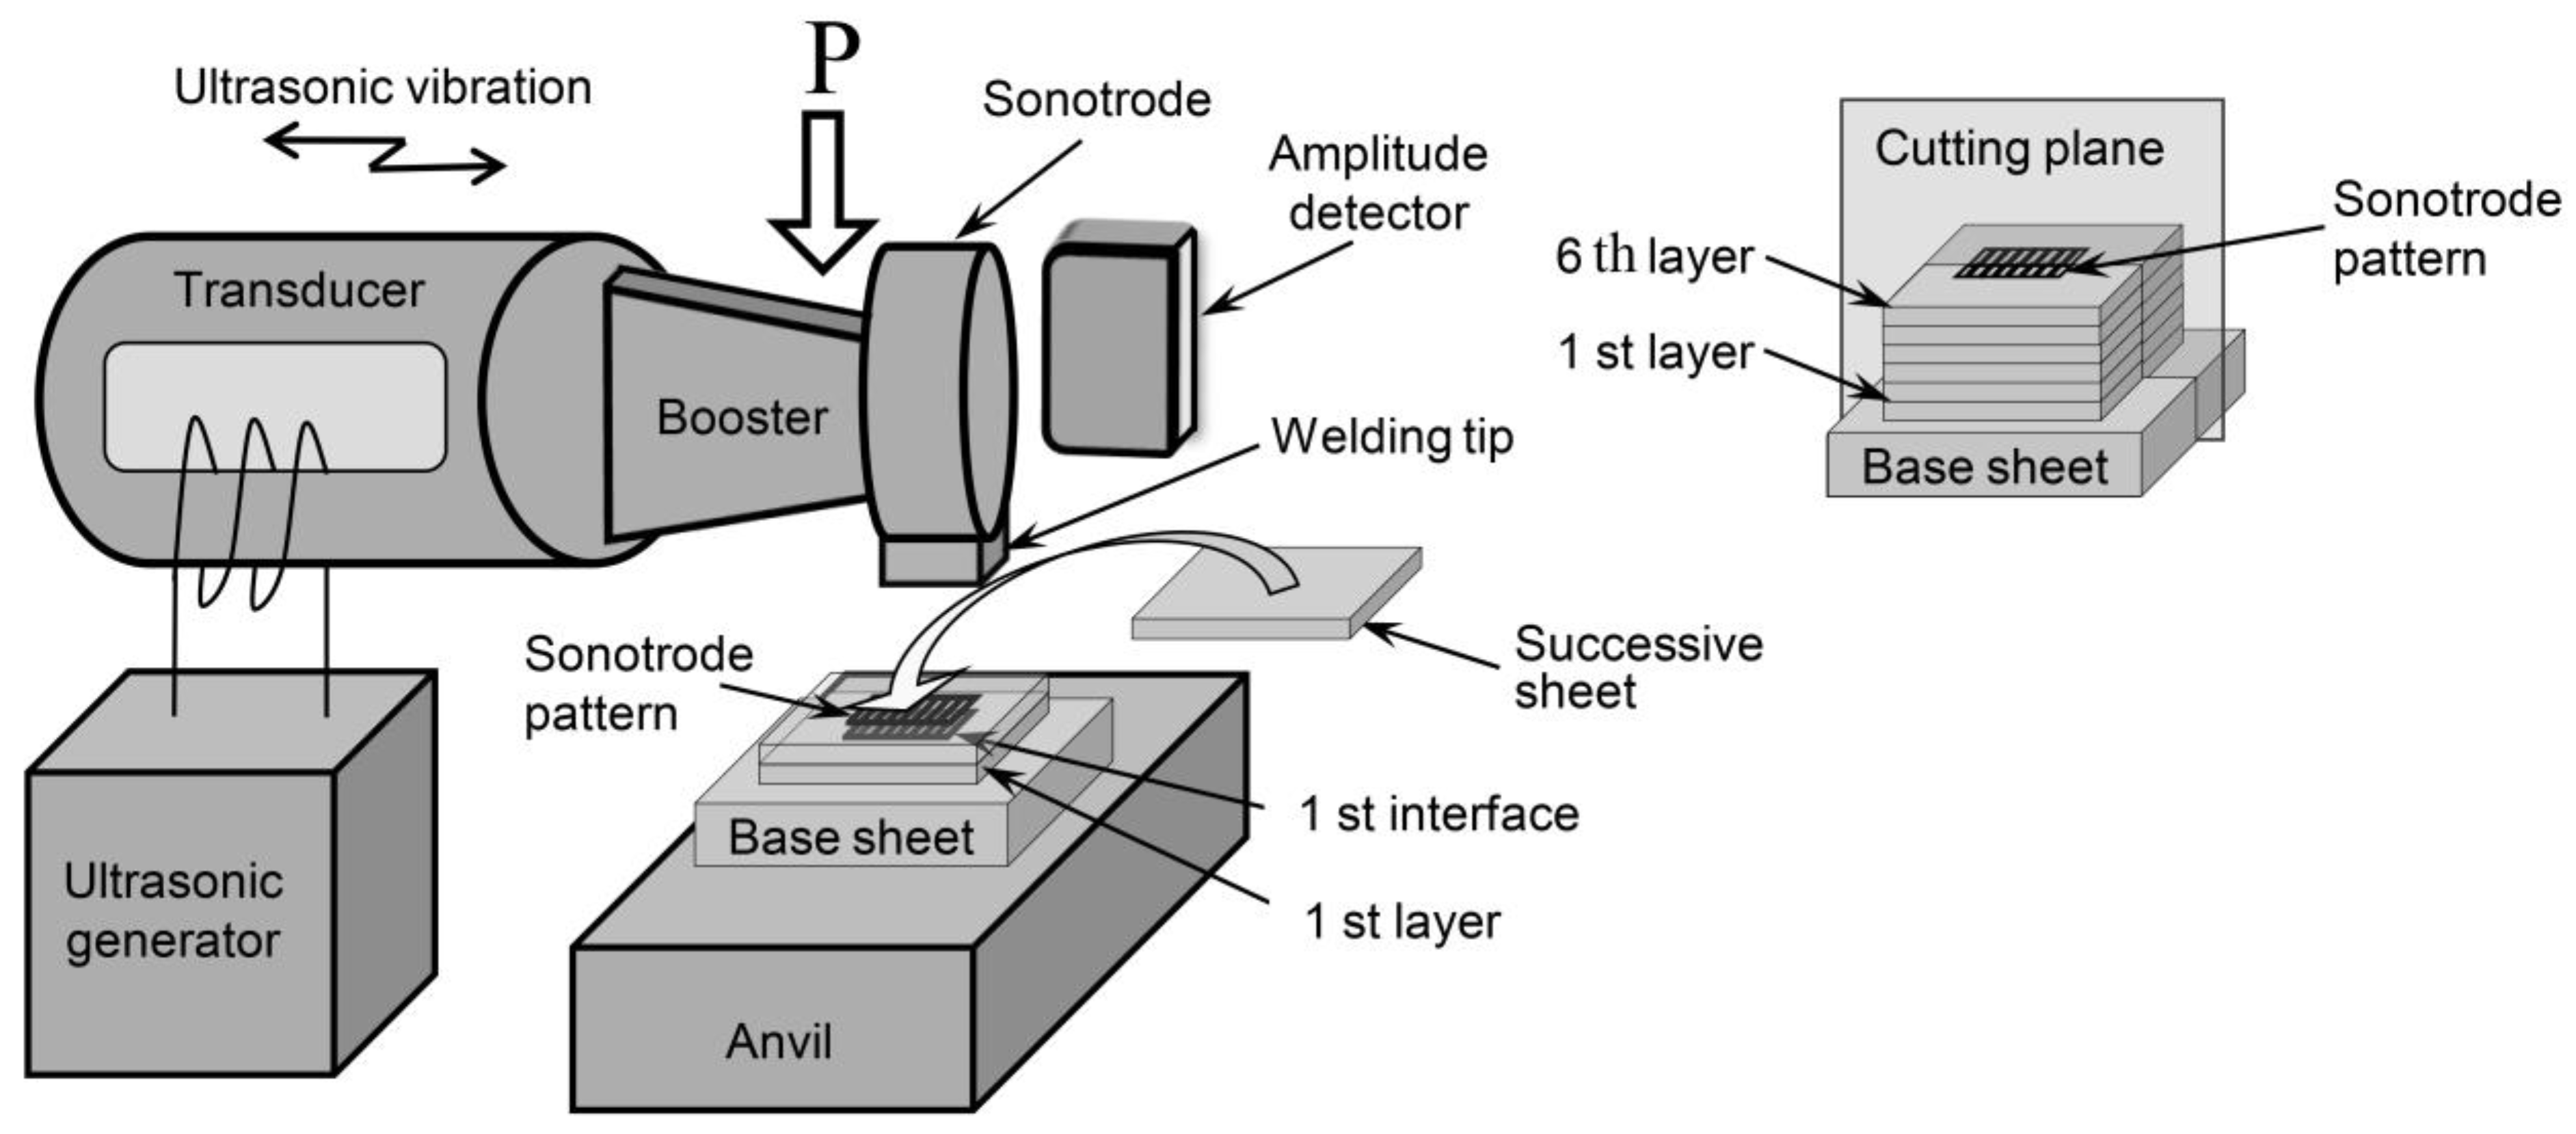
Figure 3.
Macrostructure of the consolidated sample. A scaled-up image of some voids and gaps (enclosed in ellipses) is shown in the inset.
Figure 3.
Macrostructure of the consolidated sample. A scaled-up image of some voids and gaps (enclosed in ellipses) is shown in the inset.
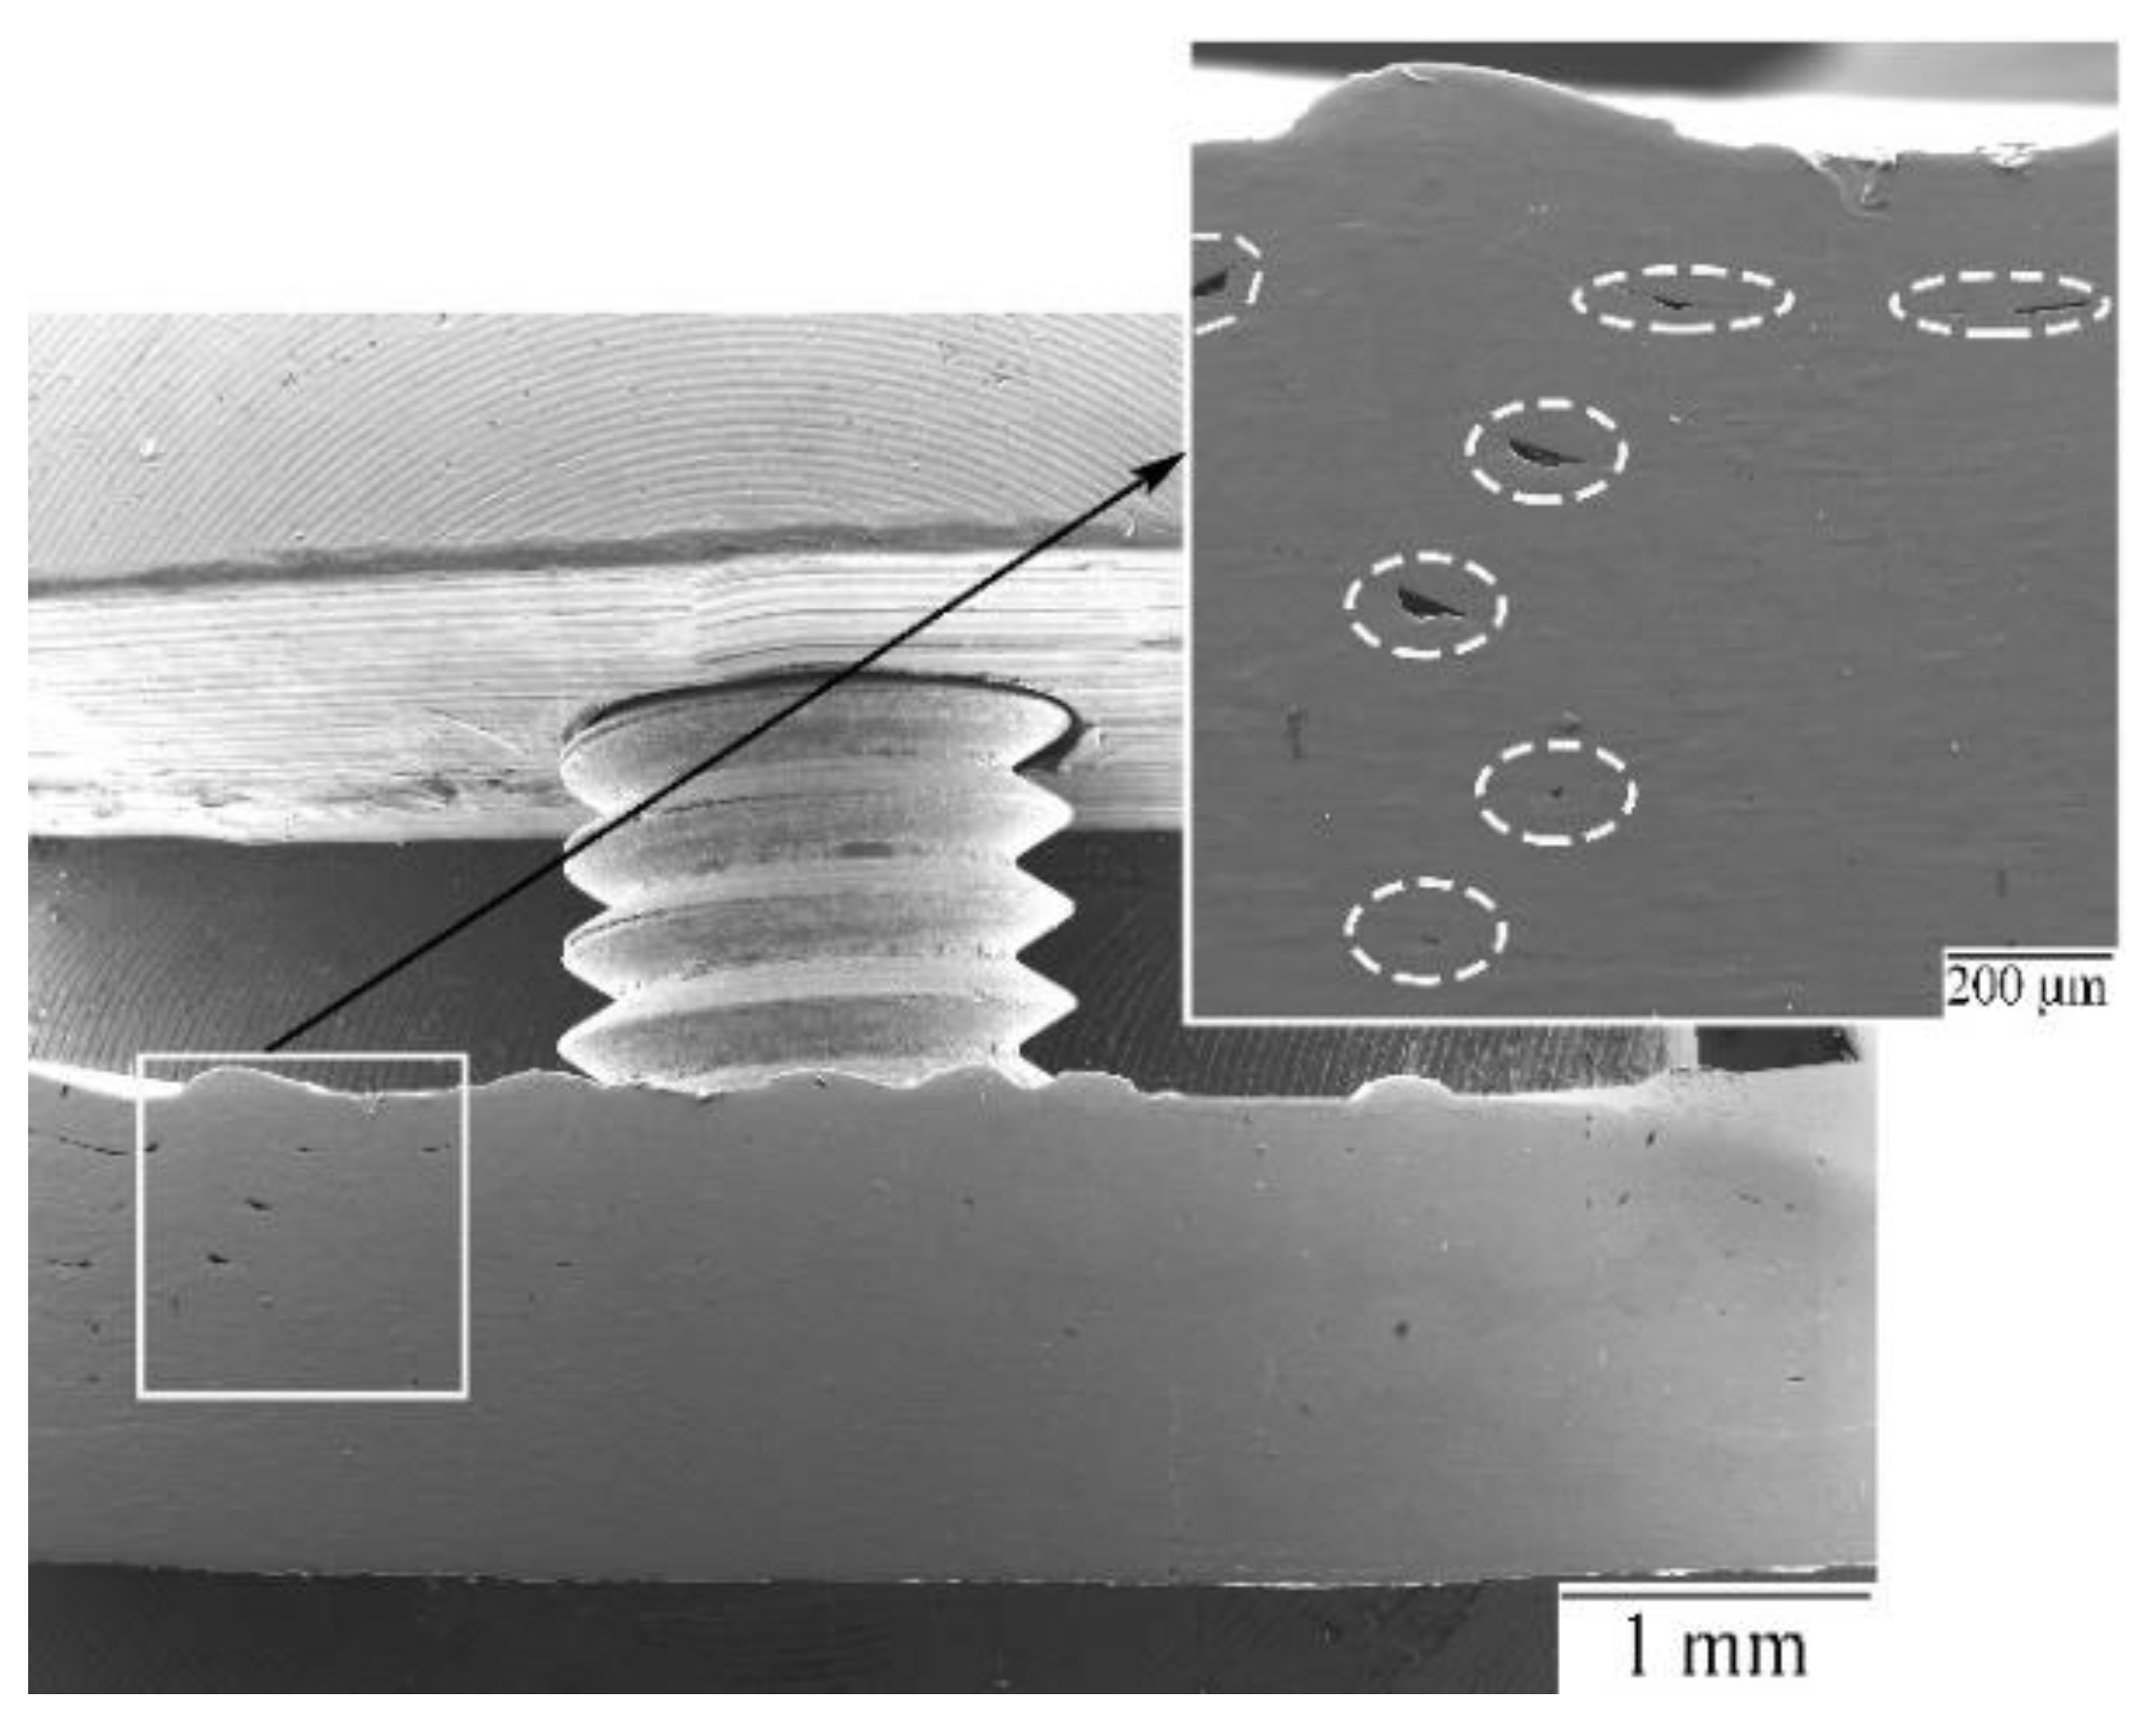
Figure 4.
Typical backscattered electron images of the joint zone: (a) gaps with pilling wear particles; (b) partially bonded regions with single and parallel rows of small discrete voids (shown by arrows); (c) wave-like profile of an interface (outlined) and refined microstructure around it; and (d) well-bonded region.
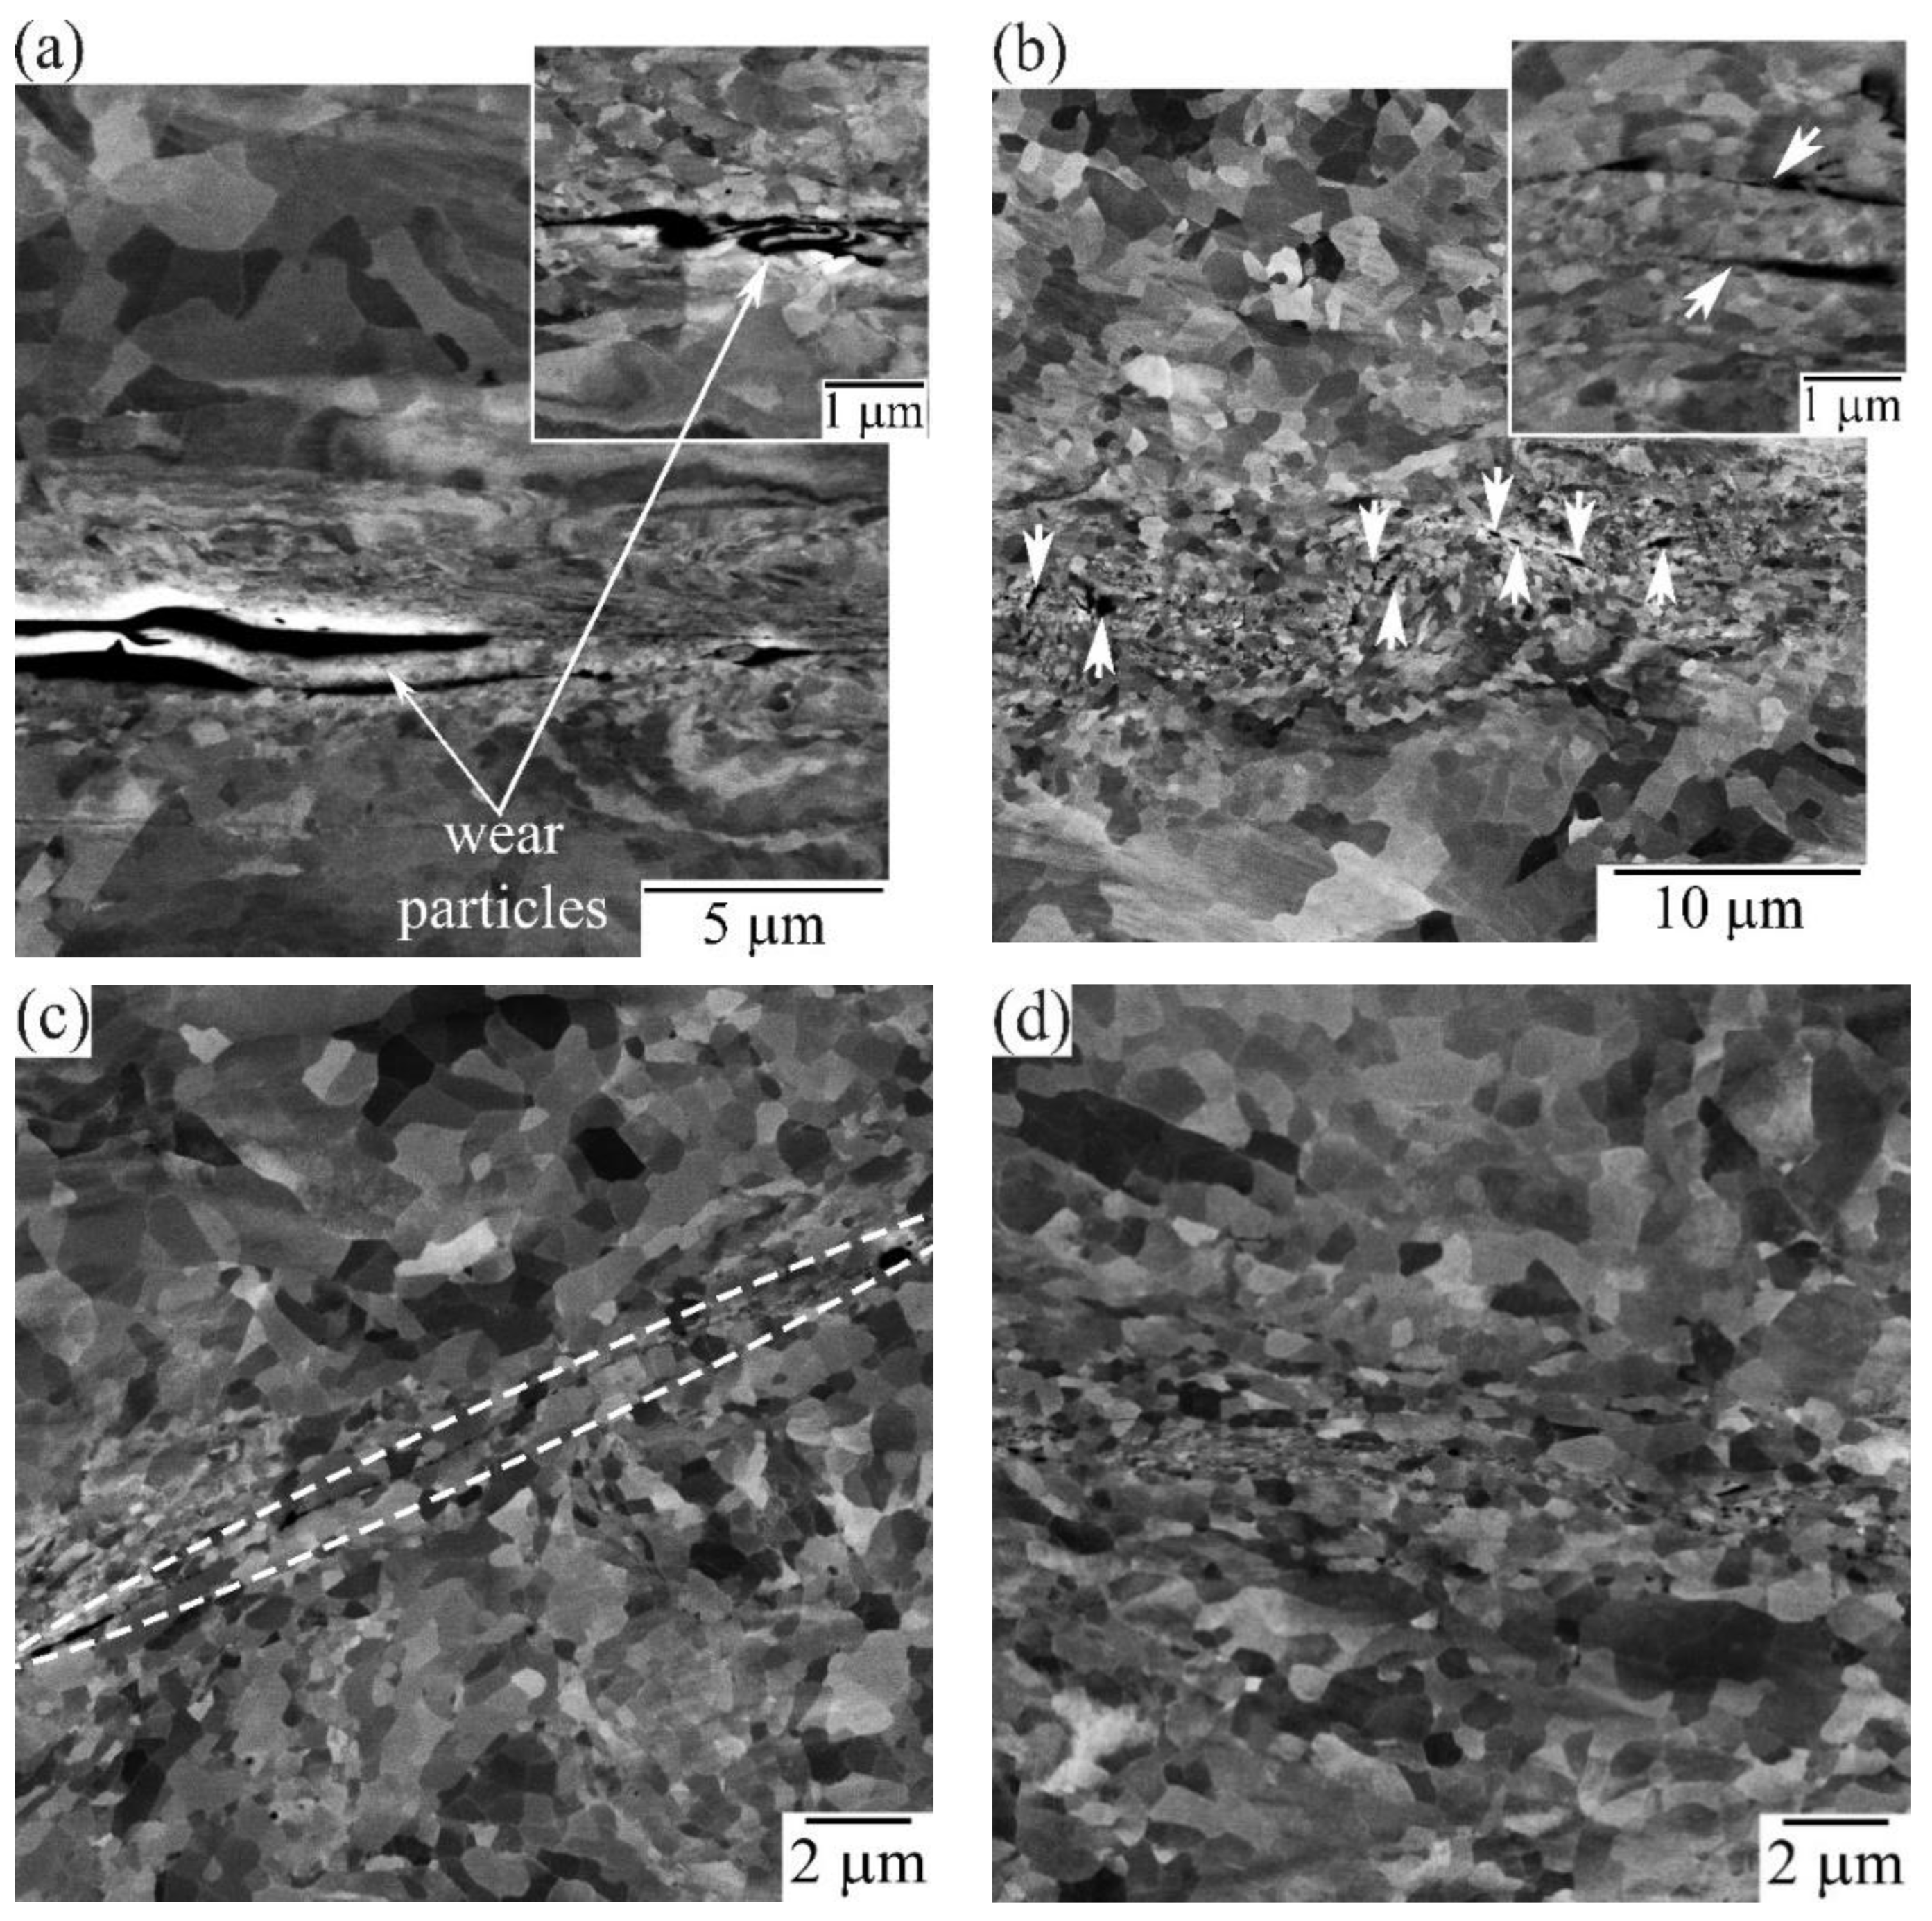
Figure 5.
Microstructure of the consolidated sample: (a) backscattered electron images; (b) crystal orientation map with color code in right top corner; the joint zones are indicated with arrows.
Figure 5.
Microstructure of the consolidated sample: (a) backscattered electron images; (b) crystal orientation map with color code in right top corner; the joint zones are indicated with arrows.

Figure 6.
Microstructures of different zones in the ultrasonically consolidated sample: (a,b) typical crystal orientation maps taken from coarse-grained and fine-grained zones, respectively; (c,d) corresponding misorientation angle distributions of grain boundaries; (e) misorientation profile along line AB on (b); (f,g) grain average misorientation maps obtained from the coarse-grained and fine-grained zones, respectively; the color code of intragrain misorientations for (f,g) is shown under the maps.
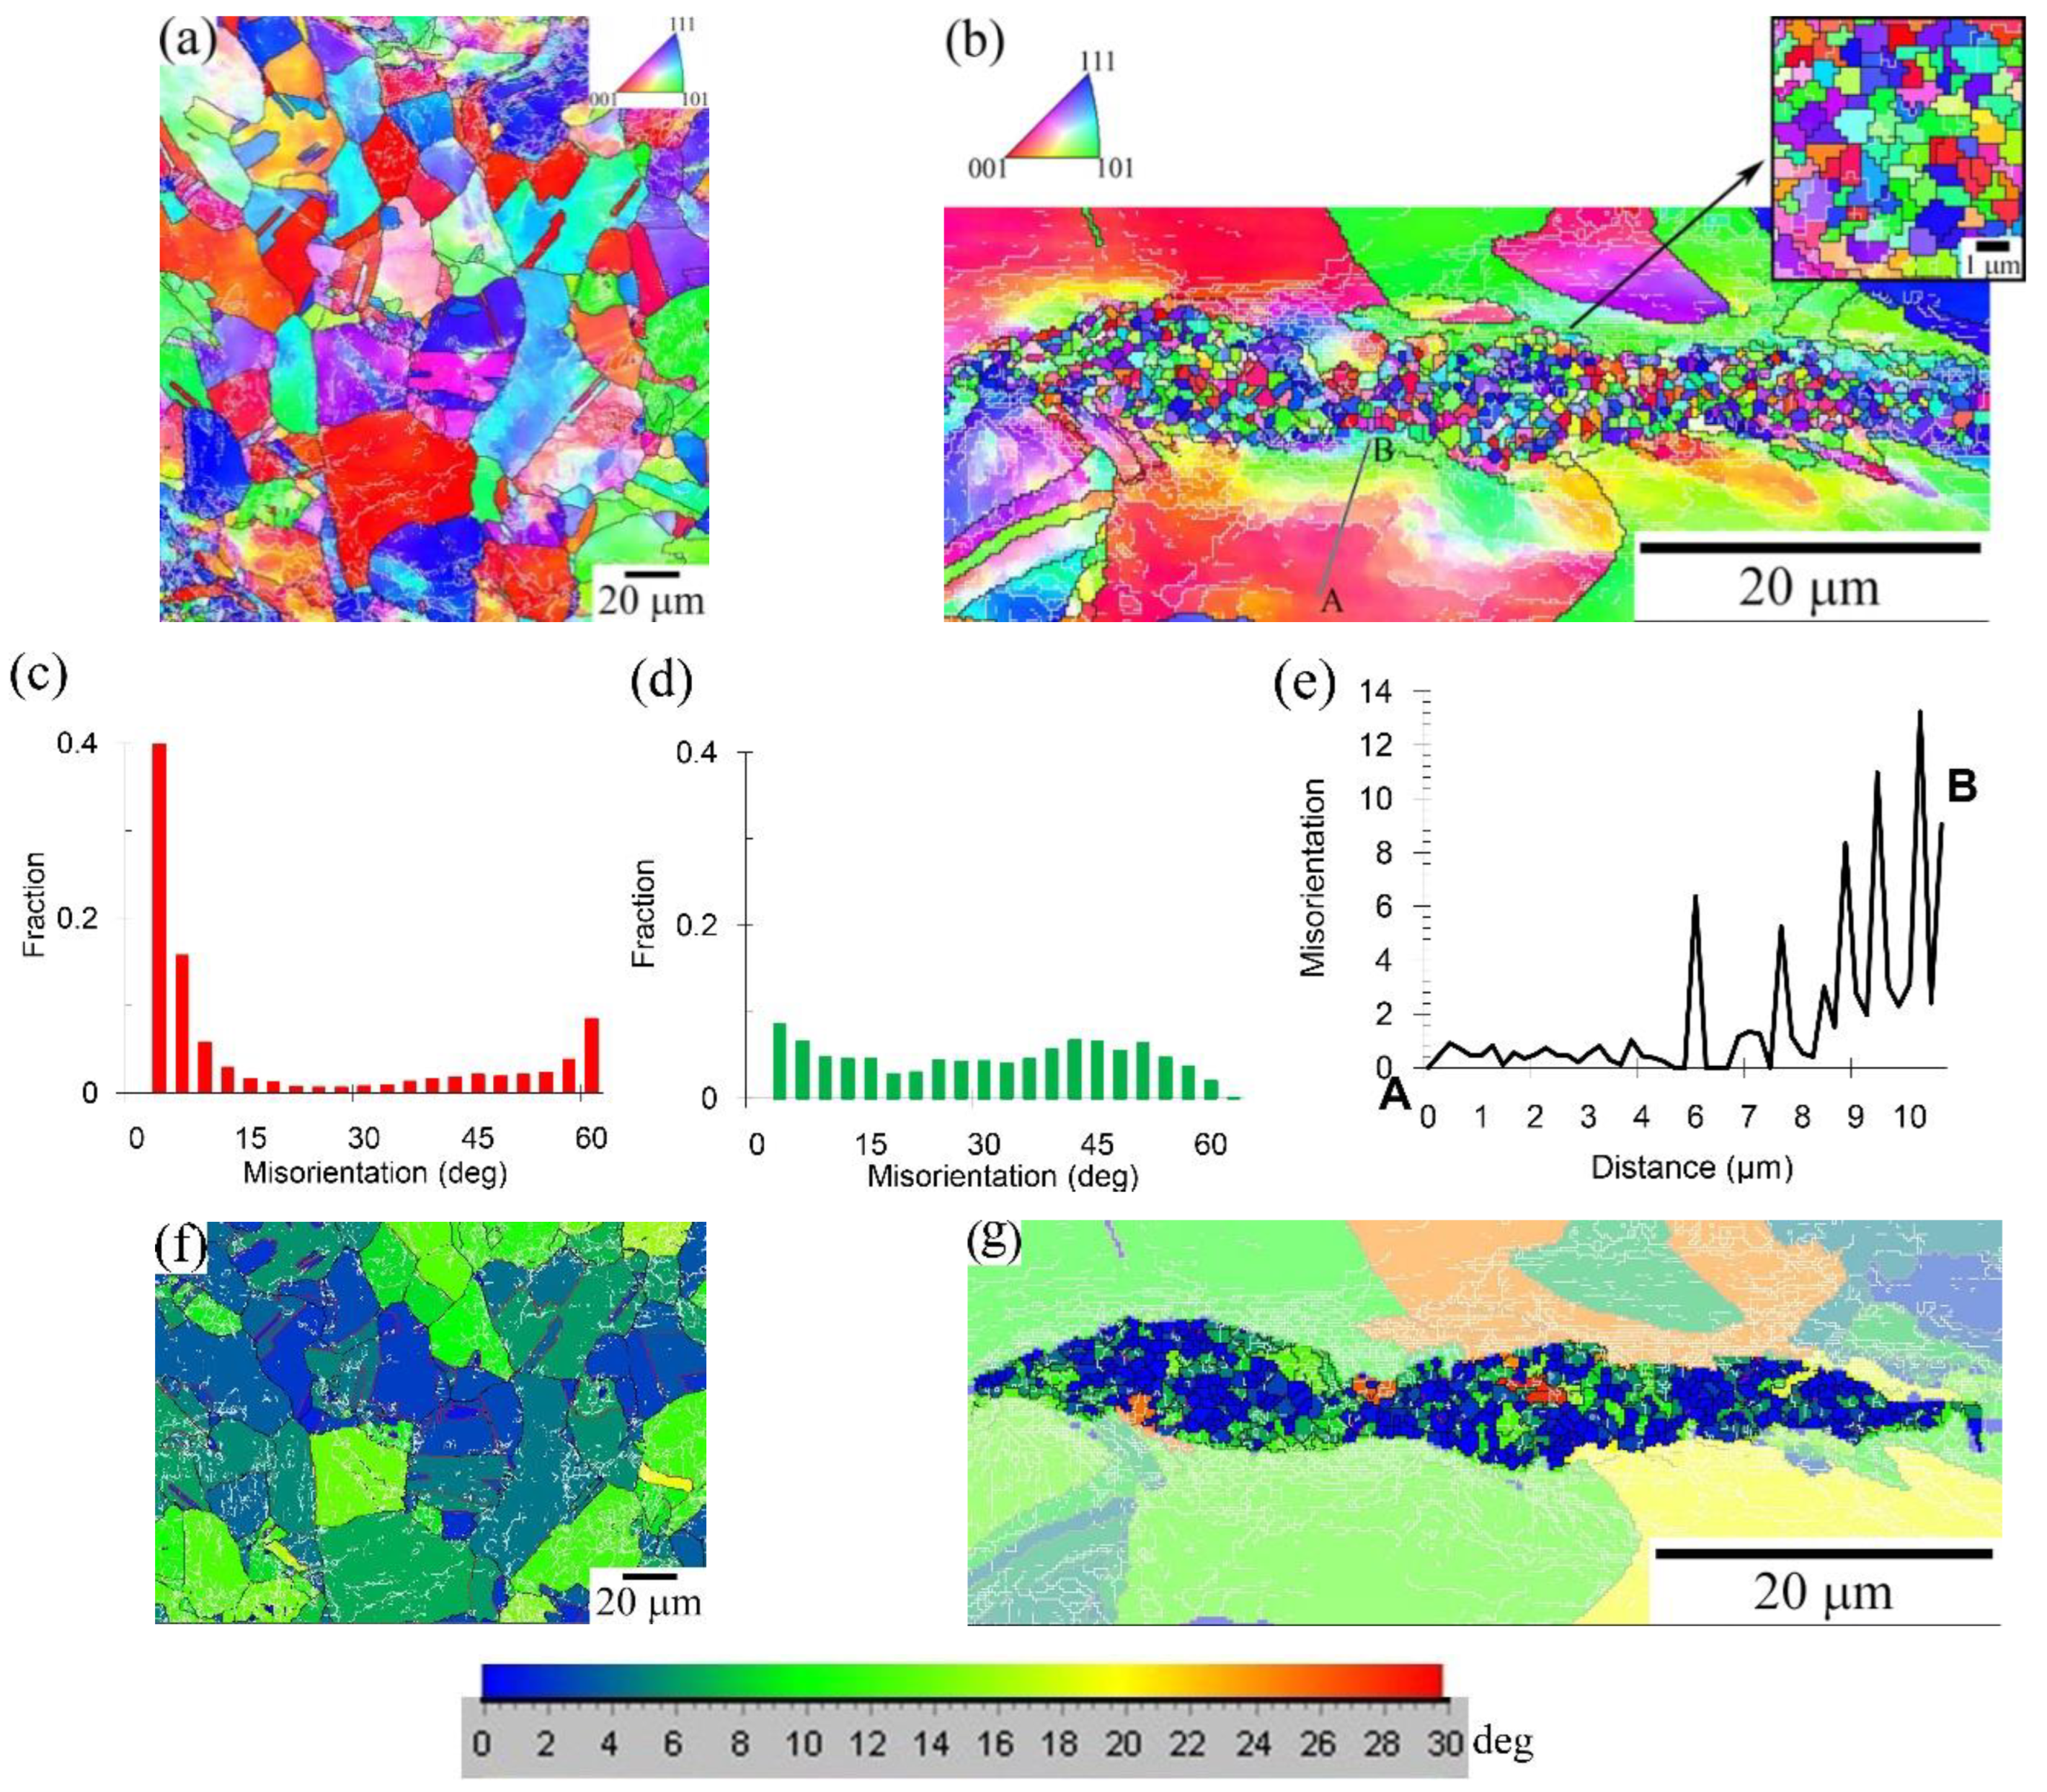
Figure 7.
Microhardness in different zones of consolidated nickel sample. Dashed line indicates the microhardness of the initial sheet.
Figure 7.
Microhardness in different zones of consolidated nickel sample. Dashed line indicates the microhardness of the initial sheet.
Publisher’s Note: MDPI stays neutral with regard to jurisdictional claims in published maps and institutional affiliations. |
© 2022 by the authors. Licensee MDPI, Basel, Switzerland. This article is an open access article distributed under the terms and conditions of the Creative Commons Attribution (CC BY) license (https://creativecommons.org/licenses/by/4.0/).
Share and Cite
MDPI and ACS Style
Shayakhmetova, E.R.; Murzinova, M.A.; Zadorozhniy, V.S.; Nazarov, A.A. Microstructure of Joints Processed by Ultrasonic Consolidation of Nickel Sheets. Metals 2022, 12, 1865. https://doi.org/10.3390/met12111865
AMA Style
Shayakhmetova ER, Murzinova MA, Zadorozhniy VS, Nazarov AA. Microstructure of Joints Processed by Ultrasonic Consolidation of Nickel Sheets. Metals. 2022; 12(11):1865. https://doi.org/10.3390/met12111865
Chicago/Turabian StyleShayakhmetova, Elvina R., Mariya A. Murzinova, Vasiliy S. Zadorozhniy, and Ayrat A. Nazarov. 2022. "Microstructure of Joints Processed by Ultrasonic Consolidation of Nickel Sheets" Metals 12, no. 11: 1865. https://doi.org/10.3390/met12111865
Note that from the first issue of 2016, this journal uses article numbers instead of page numbers. See further details here.