
Analysis of Texture and Anisotropic Elastic Properties of Additively Manufactured Ni-Base Alloys

School of Engineering and Design, Technische Universität München, Boltzmannstraße 15, 85748 Garching, Germany
*
Author to whom correspondence should be addressed.
Metals 2022, 12(11), 1991; https://doi.org/10.3390/met12111991
Submission received: 25 October 2022
/
Revised: 9 November 2022
/
Accepted: 15 November 2022
/
Published: 21 November 2022
(This article belongs to the Special Issue Advanced Techniques for Metallurgical Characterization)
Abstract
:Additive manufacturing of metallic materials generates strong crystallographic textures, leading to anisotropic elastic properties on the macroscopic scale. The impact of the processing parameters on the resulting texture requires suitable techniques for the prediction and the experimental determination of elastic properties to exploit the anisotropy in the design process. Within this study mechanical as well as microstructure based approaches are applied on a batch of specimens manufactured from IN718 by selective laser melting to assess the elastic behavior on macroscropic scale. Tensile loading experiments and the impulse excitation technique are applied for the determination of elastic properties without additional constitutive data. Furthermore, the elastic behavior is estimated from single-crystal elastic properties and texture data measured by electron backscatter diffraction and high energy X-ray diffraction. The results of the applied approaches are discussed and compared, allowing also to assess the homogeneity of the elastic properties within the batch of specimens.
1. Introduction
In the past few years additive manufacturing techniques evolved rapidly and are used increasingly in serial production. The process parameters in additive manufacturing routes significantly influence the resulting material properties on microscopic as well as on macroscopic scale. On the one hand this potentially leads to uncertainties, but on the other hand it enables to take advantage of these influences by their consideration in the design process [1,2,3,4,5].
Both aspects give rise to the need of suitable characterization techniques to assess microstructural and mechanical properties in a fast and efficient way. In this contribution, the focus is placed on characterization of elastic behavior on macroscopic scale, in case of the Ni-base alloy IN718 processed by selective laser melting (SLM). The highly anisotropic heat flux during the process and the tendency to epitaxial solidification leads to the formation of strong crystallographic textures [6,7]. Due to the strongly anisotropic elastic behavior of Ni-base alloys in single crystalline state, a strong texture results in significantly anisotropic elastic properties on macroscopic scale. The knowledge of the elastic behavior enables a proper component design and leads to a reliable estimation of residual stresses from strain measurements. These aspects are usually investigated by performing simulations, which require the elasticity tensor to describe the constitutive relation between the stress tensor and the strain tensor in the elastic regime by Hooke’s law:
Mechanical characterization techniques enable to determine the elastic behavior without assuming the elastic properties in the single crystalline state. In contrast, microstructure based approaches allow to estimate the elasticity tensor from the orientation density function (ODF) and single-crystal elastic properties, by application of homogenization theories.
In this contribution tensile loading experiments (TL) and the impulse excitation technique (IET) are applied to determine elastic properties exclusively from experimental data, whereby electron backscatter diffraction (EBSD) and high energy X-ray diffraction (HE-XRD) are applied for the characterization of the texture in form of pole figures and ODFs. The experimental and evaluation procedures of the mentioned techniques are briefly described and the gained results are discussed and compared.
The paper is organized as follows. Section 2 is devoted to the preparation of the specimens tested. The characterization techniques applied in our study are sketched in Section 3, which is separated into mechanical and microstructure related methods. These techniques are applied to the SLM-processed Ni-base alloy IN718 and the results and their discussion follows in Section 4. The main emphasis of our work is to present a combination of characterization methods to quantify in a highly reliable and efficient way the anisotropic elastic behavior of IN718 as it results from the special production route.
2. Specimen Preparation
The investigated batch of differently oriented cylinders (diameter , length ) is designed with the objective to provide a sufficient number of suitable specimens to assess their elastic behavior. The orientations of the cylinder axes are described by polar angle and azimuthal angle, which are both discretized in steps of . The combination of all polar angles and all azimuthal angles leads to the batch of specimens, which is shown in Figure 1a. This batch of 17 cylinders is sufficient to determine all 21 independent coordinates of the elasticity tensor from fundamental flexural and fundamental torsional eigenfrequencies by IET (s. Section 3.2.1) [8]. Furthermore, the orientations of the cylinder axes allow to determine directional Young’s moduli corresponding to 9 unique directions and to 4 redundant directions by TL and IET.
The complete batch of specimens is manufactured in a single job from the Ni-base alloy IN718 on a machine of type M 290 by the manufacturer EOS (Krailling, Germany), using the FO1 scanning strategy. By applying this strategy, the cross-section is divided into wide stripes, which are filled by scan vectors. The stripe orientations are rotated in every layer by , but orientations which result in an angle between the intert gas flow and the scan vectors of less than are skipped. Additionally, the stripes are filled in the opposite direction of the intert gas flow, in order to avoid metal splashes on the powder (s. Figure 2). These features lead to a minimization of defects, but also significantly influence the texture and consequently the elastic properties of the material.
The specimens for tensile loading experiments are machined by turning, whereby the specimens analyzed by IET are manufactured by electrical discharge machining. Both types of specimens are shown in Figure 1b. The specimens for microstructural analysis are prepared from remaining material of the machined specimens. The investigations of specimens, which are located close to the center of the build volume and specimens taken from locations close to the edge of the build plate allow to assess the homogeneity of the texture. Due to the low penetration depth of the electron beam, the orientation of the measurement plane may also influence the result. Therefore, in case of specimens analyzed by EBSD, every measurement plane coincides with a different coordinate plane. In order to avoid an influcence of edge effects a distance of at least between the specimens and the cylinder surfaces is maintained.
3. Characterization Techniques
3.1. Mechanical Approaches
Mechanical approaches allow the determination of elastic behavior without additional input of constitutive properties. However, the direct determination of the fully anisotropic elastic behavior is challenging. Due to the high number of degrees of freedom, the evaluation of the elasticity tensor from experimental data generally represents an ill-conditioned inverse problem. Hence, measurement deviations may lead to significant uncertainties of the results. In literature inverse problems of this type are described in context with ultrasound measurements [9]. In this course the determination of the elasticity tensor by IET is discussed in Section 3.1.2. Additionally, directional Young’s moduli are measured by performing uniaxial tensile loading experiments, which are described in the following subsection.
3.1.1. Tensile Loading
The most common method for the experimental determination of the Young’s modulus is to analyze stress-strain data obtained during uniaxial tensile loading in the elastic regime. Even though tensile tests are simple to perform and the required equipment is accessible in material testing laboratories, the corresponding experimental and evaluation procedures are not clearly standardized. In ISO 6892-1 [10], as well as in ASTM-E-111 [11] only suggestions regarding the required measurement equipment and the evaluation procedure are described.
In this contribution cylindrical tensile specimens with a diameter of and a gauge length of are analyzed. In preliminary tests, yield stresses between and were observed, depending on the specimen orientation. Therefore, the specimens are loaded to a maximum stress of in order to provide a sufficient safety margin against yielding. The specimens are initially loaded to in several preloading cycles and subsequently 10 measurement cycles are performed at a rate of , as shown in Figure 3a. The range of the strain level is below , which requires a highly precise extensometer of class to ensure an accurate strain measurement.
In the course of this contribution Young’s moduli are determined from the stress-strain relation observed in the unloading path, since during loading microplasticity may occur, leading to a plastic strain component and consequently influencing the calculated Young’s modulus. Shortly prior to complete unloading, the strain response is non-linear, as shown in Figure 3a. This most probably results from measurement deviations, which are potentially higher at low strains. In order to reduce the impact of these effects, the Young’s modulus is evaluated from data of the unloading path in the top of the load range, which is marked red (s. Figure 3a,b). The stress-strain relation in this range is approximated by a linear function using the method of least squares, as shown in Figure 3b. The gradient of this function corresponds to the determined Young’s modulus from a single load cycle. For the final determination of the Young’s modulus, the results of 10 loading cycles are averaged, leading to standard deviations below . The resulting Young’s moduli are summarized in Section 4.1.
3.1.2. Impulse Excitation Technique
The impulse excitation technique allows to determine elastic moduli from the eigenfrequencies of a specimen, which are identified by an acoustic modal analysis. A mechanical impulse is triggered by an excitation unit, leading to a vibration of the specimen. The emitted sound signal is recorded by a microphone and subsequently postprocessed, in order to evaluate the eigenfrequencies. As the eigenfrequencies of the specimen depend on its density, geometry and elastic properties, the latter can be calculated from the measured eigenfrequencies by solving an inverse problem. The determination of Young’s modulus and shear modulus in case of isotropy and homogeneity is standardized by the ASTM E1876-15 [12]. We proposed to adapt the standardized relations for the isotropic case to estimate elastic moduli with respect to the specimen basis (s. Figure 4) also for the anisotropic case [8].
The directional Young’s modulus in the longitudinal direction of the specimen is estimated from the fundamental flexural eigenfrequency by applying the relation:
whereby, m denotes the mass of the specimen. The factor accounts for the influence of transverse shear, as Equation (2) is based on Euler-Bernoulli’s beam theory. The shear modulus in the specimen plane is estimated from the standardized relation between the fundamental torsional eigenfrequency and the shear modulus in case of isotropy. In this contribution slender bars (thickness , width , length ) are analyzed, leading to good estimations of and by the modified relations from the ASTM-standard. The measured Young’s moduli in the direction of the cylinder axes are summarized in a bar graph, which is shown in Section 4.1.
The direct relation between directional moduli and coordinates of the compliance tensor with respect to the specimen basis in combination with the transformation rule allow to estimate the compliance tensor with respect to the basis of the batch of specimens (s. Figure 1a), by solving a system of linear equations. Since such inverse problems are frequently ill-conditioned, it is essential to select the specimen orientations as well as the considered eigenfrequencies with the objective that the inverse problem is preferably well-posed. This is achieved by minimizing the condition number of the system of linear equations by a proper choice of specimen orientations and a suitable selection of considered eigenfrequencies. The solution of the system of linear equations represents a first approximation of the compliance tensor. Subsequently, the Newton-Raphson method in combination with the finite element method for the calculation of the eigenfrequencies is applied to eliminate the impact of the deviations from the estimations. A detailed description of this approach and its application to the batch of specimens investigated in this contribution was published in [8]. The resulting elasticity tensor is discussed in Section 4.3.
3.2. Microstructure Based Approaches
In microstructure based approaches, the elastic properties are estimated from the ODF and single-crystal constitutive data. In this context, the elastic constants of directionally solidified IN718 in single crystalline state (, , ) are assumed [13]. For the estimation of the homogenized elasticity tensor the Hill-approximation is applied.
In this section distances between elasticity tensors determined by different approaches are discussed. For this purpose the deviation of the directional Young’s modulus, averaged over the northern unit-hemishere and the Euclidean distance of elasticity tensors are used. Both measures are described in the Appendix A.
In the following subsection the experimental procedure in case of EBSD analysis is described, whereas in Section 3.2.2 the measurements based on HE-XRD are adressed.
3.2.1. Electron Backscatter Diffraction
Electron backscatter diffraction is a well-established technique for the analysis of texture at high local resolution. In this contribution, the EBSD measurements are performed in a scanning electron microscope (SEM) of type JEOL JSM-7600 F, which is operated at an acceleration voltage of . The crystal orientations are determined by an Oxford Symmetry detector in combination with the software Aztec. Using a magnification of 180 and a working distance of allows to scan measurement areas of 640 µ × 480 µ within a few minutes, by applying a grid of 3 µ. In order to capture larger measurement areas, the stage of the SEM is moved, allowing to stich the results of several measurements together. Due to the low penetration depth of the electron beam in the range of a few , only small measurement volumes can be captured, compared to diffraction experiments via HE-XRD. Therefore, the orientation of the measurement plane, as well as the measurement area may influence the result. In order to quantify and to minimize the impact of these influences, three specimens (specimen A–C) are analyzed, whereby each coordinate plane coincides with a measurement plane of a specimen, as shown in Figure 1a. The measured crystal orientations are postprocessed using the software MTEX [14]. In this context several transformations are applied, in order to describe the crystal orientations and the resulting elasticity tensors with respect to the basis of the batch of specimens (s. Figure 1a).
For all specimens the distances between elasticity tensors estimated from different measurement areas and those estimated from the largest measurement area are shown in Figure 5a,b. The changes of both distances significantly decrease for measurement areas larger than . The averaged deviation of the directional Young’s modulus is below for measurement areas larger than for all specimens, which indicates that this measurement area is sufficiently large to capture the texture on macroscopic scale.
In Table 1 the equivalent grain diameters of the material investigated are listed. Due to the longitudinal shape of the grains with small crosssections in the -plane, a larger number of grains is captured in case of specimen A compared to specimens B and C, leading to smaller distance measures at equal measurement areas.
3.2.2. High Energy XRD
The experiments based on High Energy XRD are performed at the High Energy Materials Science (HEMS) beamline Petra III at DESY in Hamburg [15]. This diffractometer is highly suitable for texture analysis using large measurement volumes. A high energy X-ray beam with a photon energy of completely penetrates the cylindrical specimens with a diameter of . The spotsize of leads to a large measurement volume. The diffracted radiation is recorded by an area detector in form of Debey-Scherrer rings (s. Figure 6a). The distance of between the specimen and the detector of type Perkin Elmer XRD 1621 with a size of allows to observe the diffracted radiation corresponding to the lattice planes , and . The texture of the material leads to intensity variations along the Debey-Scherrer rings, as shown in Figure 6b. This allows to reconstruct the pole figures of the lattice planes from several diffraction images, corresponding to different rotation angles of the specimen about the cylinder axis, by the software SteCa [16,17]. In this study, the rotation angle is discretized in steps of , between and , leading to the determination of the pole figures from 36 diffraction images. Subsequently, the ODF is calculated from the pole figures using the calcODF function of MTEX, which is based on the minimization of a least square functional [18]. In this course a kernel function of type de la Vallèe Poussin with a halfwidth of is used. Similar to EBSD measurements three differently oriented specimens from different spatial locations (specimens D–F) are analyzed (s. Figure 1a). The pole figures as well as the resulting elasticity tensors with respect to the basis of the batch of specimens are discussed in Section 4.
4. Results and Discussion
4.1. Directional Young’s Moduli
The directional Young’s moduli are determined in different ways: From uniaxial stress-strain data, from the fundamental eigenfrequencies and from the elasticity tensors identified by microstructure based approaches. Even though the directional Young’s moduli do not describe the complete elastic behavior, they allow to compare the results from all approaches. In Figure 7 the directional Young’s moduli determined by the different approaches are summarized. The cylinder axes of specimens 1 and 9, 3 and 11, 5 and 13, as well as 7 and 15 are equally oriented. Therefore, the Young’s moduli among these pairs of specimens should be equal. The maximum deviation of Young’s moduli among equally oriented specimens in case of IET is below , whereby in case of tensile loading a maximum deviation of is observed. This indicates that the results from IET are more accurate, compared to those from tensile loading. Since the texture is almost homogeneous (s. Section 4.2), the directional Young’s moduli are calculated from a single elasticity tensor within this study. Consequently, in case of microstructure based approaches Young’s moduli in equal directions are indentical.
4.2. Pole Figures
Both microstructure based approaches allow to discuss the texture by means of pole figures, which are summarized in Figure 8a,b. The similarity of the pole figures corresponding to specimens from different spatial locations indicates that the texture is in good approximation homogeneous. A comparison between the pole figures determined by EBSD and the ones determined by HE-XRD further confirms that a measurement area of is sufficiently large to capture the texture on macroscopic scale by EBSD, independently from the orientation of the measurement plane.
The directional Young’s modulus of cubic single crystals, which applies in case of Ni-base alloys, shows its maximum values in -directions. Hence, the Young’s moduli of polycrystalline aggregates in directions corresponding to poles of high intensity in -pole figures are particularly high. This becomes evident from the Young’s moduli of specimen 1, 6, 9 and 14, whose orientations correspond to poles of high intensity in the -pole figures.
4.3. Elasticity Tensors
The resulting elasticity tensors based on EBSD and HE-XRD measurements are estimated from all specimens investigated by the corresponding approach, whereby the resulting elasticity tensor in case of IET is taken from [8]. In Table 2 the resulting elasticity tensors are presented in Voigt-notation. The distance measures between the resulting elasticity tensors are listed in Table 3. Obviously, the distances between and are lower compared to the ones between and , as well as between and , irrespective which of the two distance measures is used. This is reasonable, as the results from microstructure based approaches are calculated from the same single-crystal elastic properties by applying the same homogenization theory. Furthermore, the elasticity tensor determined from IET includes measurement deviations, leading to an increase of the Euclidean distance. Despite this fact, the averaged deviation in the directional Young’s modulus between and the elasticity tensors from microstructure based approaches is in range of , which is acceptable compared to distances between elasticity tensors estimated by identical approaches (s. Table 4). The low distances between elasticity tensors determined from identical approaches but on different specimens further indicate that the elastic behavior is homogeneous. The distances between the elasticity tensors in case of HE-XRD are particularly low. This may result from the pole figure inversion, which seems to reduce the degree of anisotropy, as the kernel function smoothes the ODF. The distances between the results from different specimens in case of EBSD can be explained by small orientation deviations, which are clearly reflected in the corresponding pole figures (Figure 8a).
5. Conclusions
In this contribution mechanical and microstructure based approaches were applied to determine anisotropic elastic properties on macroscopic scale of strongly textured Ni-base alloys manufacured by SLM. The results demonstrate that IET is more suitable for a precise determination of directional Young’s moduli, compared to tensile loading.
The microstructural investigations of specimens taken from different spatial locations revealed that the texture is in good approximation homogenously distributed over the batch of specimens. Hence, the texture of additively manufactured bulk material is not influenced significantly by the geometry of the component.
Furthermore, it was shown that a measurement area of is sufficiently large to capture the texture information via EBSD neccessary for the prediction of elastic properties on macroscopic scale, independently from the orientation of the measurement plane.
The distances between the elasticity tensor determined by IET and those determined by microstructure based approaches are significantly larger compared to the distances between elasticity tensors determined on different specimens using the same technique. This can be explained by the impact of measurement deviations in case of IET and by the assumption of single-crystal elastic properties as well as by the impact of the homogenization theory. In case of HE-XRD, additional uncertainties result from pole figure inversion.
Considering these aspects, the determination of the elastic properties by EBSD from sufficiently large and differently oriented measurement areas in combination with a validation of the results by IET seem to be suitable to investigate the impact of the processing parameters of the SLM-process on the anisotropic elastic behavior at reasonable effort.
In this context the development of a characterization technique, which combines elastic properties determined by IET and texture information as well as the grain morphology from EBSD, seems to be promising for a reliable and fast prediction of the elasticity tensor on macroscopic scale. This would lead to independency from any assumptions of single-crystal elastic properties and the microstructural information would additionally allow the application of more advanced homogenization theories.
Author Contributions
T.O.: investigations, data curation and writing, C.K.: supervision, review, editing, E.W.: review and editing. All authors have read and agreed to the published version of the manuscript.
Funding
This research received no external funding.
Data Availability Statement
Data presented in this article is available at request from the corresponding author.
Acknowledgments
We acknowledge DESY (Hamburg, Germany), a member of the Helmholtz Association HGF, for the provision of experimental facilities. Parts of this research were carried out at Petra III-P07. We would like to thank Weimin Gan for providing the beamtime.
Conflicts of Interest
The authors declare that they have no known competing financial interest or personal relationship that could have appeared to influence the work reported in this paper.
Appendix A
The assessment of the differences between elasticity tensors requires suitable distance measures.
An intuitive approach is to average the absolute difference of the directional Young’s moduli over the northern unit-hemisphere, according to:
Even though this measure takes into account all directional Young’s moduli, it does not include the complete elastic behavior.
In contrast, the Euclidean distance, proposed by Morin et al. takes into account differences of the complete elasticity tensor [19]. Due to the invariance from inversion of the arguments, the Euclidean distance between elasticity tensors and the corresponding compliance tensors is equal:
In general, the Euclidean distance requires the choice of a gauge . However, using the logarithmic Euclidean distance leads to independency of from .
References
- Fernandez-Zelaia, P.; Kirka, M.M.; Dryepondt, S.N.; Gussev, M.N. Crystallographic texture control in electron beam additive manufacturing via conductive manipulation. Mater. Des. 2020, 195, 1090–1100. [Google Scholar] [CrossRef]
- Kirka, M.M.; Lee, Y.; Greenley, D.A.; Okello, A.; Goin, M.J.; Pearce, M.T.; Dehoff, R.R. Strategy for texture management in metals additive manufacturing. JOM 2017, 69, 523–531. [Google Scholar] [CrossRef] [Green Version]
- Popovic, V.A.; Borisov, E.V.; Popovic, A.A.; Sufiiarov, V.S.; Masaylo, D.V.; Alzina, L. Functionally graded Inconel 718 processed by additive manufacturing: Crystallographic texture, anisotropy of microstructure and mechanical properties. Mater. Des. 2017, 114, 441–449. [Google Scholar] [CrossRef]
- Dehoff, R.R.; Kirka, M.M.; List, F.A.; Unocic, K.A.; Sames, W.J. Crystallographic texture engineering through novel melt strategies via electron beam melting: Inconel 718. Mater. Sci. Tech.-Land. 2015, 31, 939–944. [Google Scholar] [CrossRef]
- Geiger, F.; Kunze, K.; Etter, T. Tailoring the texture of IN738LC processed by selective laser melting (SLM) by specific scanning strategies. Mater. Sci. Eng. A-Struct. 2016, 661, 240–246. [Google Scholar] [CrossRef]
- Wan, H.Y.; Zhou, Z.J.; Li, C.P.; Chen, G.F.; Zhang, G.P. Effect of scanning strategy on grain structure and crystallographic texture of Inconel 718 processed by selective laser melting. J. Mater. Sci. Technol. 2018, 34, 1799–1804. [Google Scholar] [CrossRef]
- Liu, J.; To, A.C. Quantitative texture prediction of epitaxial columnar grains in additive manufacturing using selective laser melting. Addit. Manuf. 2017, 16, 58–64. [Google Scholar] [CrossRef]
- Obermayer, T.; Krempaszky, C.; Werner, E. Determination of the anisotropic elasticity tensor by mechanical spectroscopy. Contin. Mech. Therm. 2021, 34, 165–184. [Google Scholar] [CrossRef]
- Sedlák, P.; Seiner, H.; Zídek, J.; Janovská, M.; Landa, M. Determination of all 21 independent elastic coefficients of generally anisotropic solids by resonant ultrasound spectroscopy: Benchmark Examples. Exp. Mech. 2014, 54, 1073–1085. [Google Scholar] [CrossRef]
- DIN EN ISO 6892-1; Metallic Materials—Tensile Testing—Part 1: Method of Test at Room Temperature. Beuth: Berlin, Germany, 2019. [CrossRef]
- ASTM E111-17; Standard Test Method for Young’s Modulus, Tangent Modulus, and Chord Modulus. American Society for Testing Materials: West Conshohocken, PA, USA, 2017. [CrossRef]
- ASTM E1876-15; Standard Test Method for Dynamic Young’s Modulus, Shear Modulus, and Poisson Ratio by Impulse Excitation of Vibration. American Society for Testing Materials: West Conshohocken, PA, USA, 2001. [CrossRef]
- Martin, G.; Ochoa, N.; Saï, K.; Hervé-Luanco, E.; Cailletaud, G. A multiscale model for the elastoviscoplastic behavior of directionally solidified alloys: Application to FE structural computations. Int. J. Solids. Struct. 2014, 51, 1175–1187. [Google Scholar] [CrossRef]
- Bachmann, F.; Hieschler, R.; Schaeben, H. Texture analysis with MTEX—Free and open source software toolbox. Solid State Phenom. 2010, 210, 63–68. [Google Scholar] [CrossRef] [Green Version]
- Schell, N.; King, A.; Beckmann, F.; Fischer, T.; Müller, M.; Schreyer, A. The high energy materials science beamline (HEM) at Petra III. Mater. Sci. Forum 2014, 772, 57–61. [Google Scholar] [CrossRef] [Green Version]
- Randau, C.; Garbe, U.; Brokmeier, H.-G. StressTextureCalculator: A software tool to exact texture, strain and microstructure information from area-detector measurements. J. Appl. Cryst. 2011, 44, 641–646. [Google Scholar] [CrossRef]
- Brydon, R.E.; Burle, J.; Coenen, W.; Gan, W.; Hofmann, M.; Katter, J.; Soinien, J.; Wuttke, J. Stress and Texture Calculator Steca, Version 2. 2018. Available online: https://github.com/scgmlz/Steca2 (accessed on 2 February 2022).
- Hieschler, R.; Schaeben, H. A novel pole figure inversion method: Specification of the MTEX algorithm. J. Appl. Cryst. 2008, 41, 1024–1037. [Google Scholar] [CrossRef]
- Morin, L.; Gilormini, P.; Derrien, K. Generalized euclidean distances for elasticity tensors. J. Elast. 2020, 138, 221–232. [Google Scholar] [CrossRef]
Figure 1.
(a) Batch of cylindrical specimens showing the locations of specimens for analysis by EBSD (specimen A–C) and by HE-XRD (specimen D–F). (b) Machined specimens for tensile loading experiments and IET.
Figure 1.
(a) Batch of cylindrical specimens showing the locations of specimens for analysis by EBSD (specimen A–C) and by HE-XRD (specimen D–F). (b) Machined specimens for tensile loading experiments and IET.
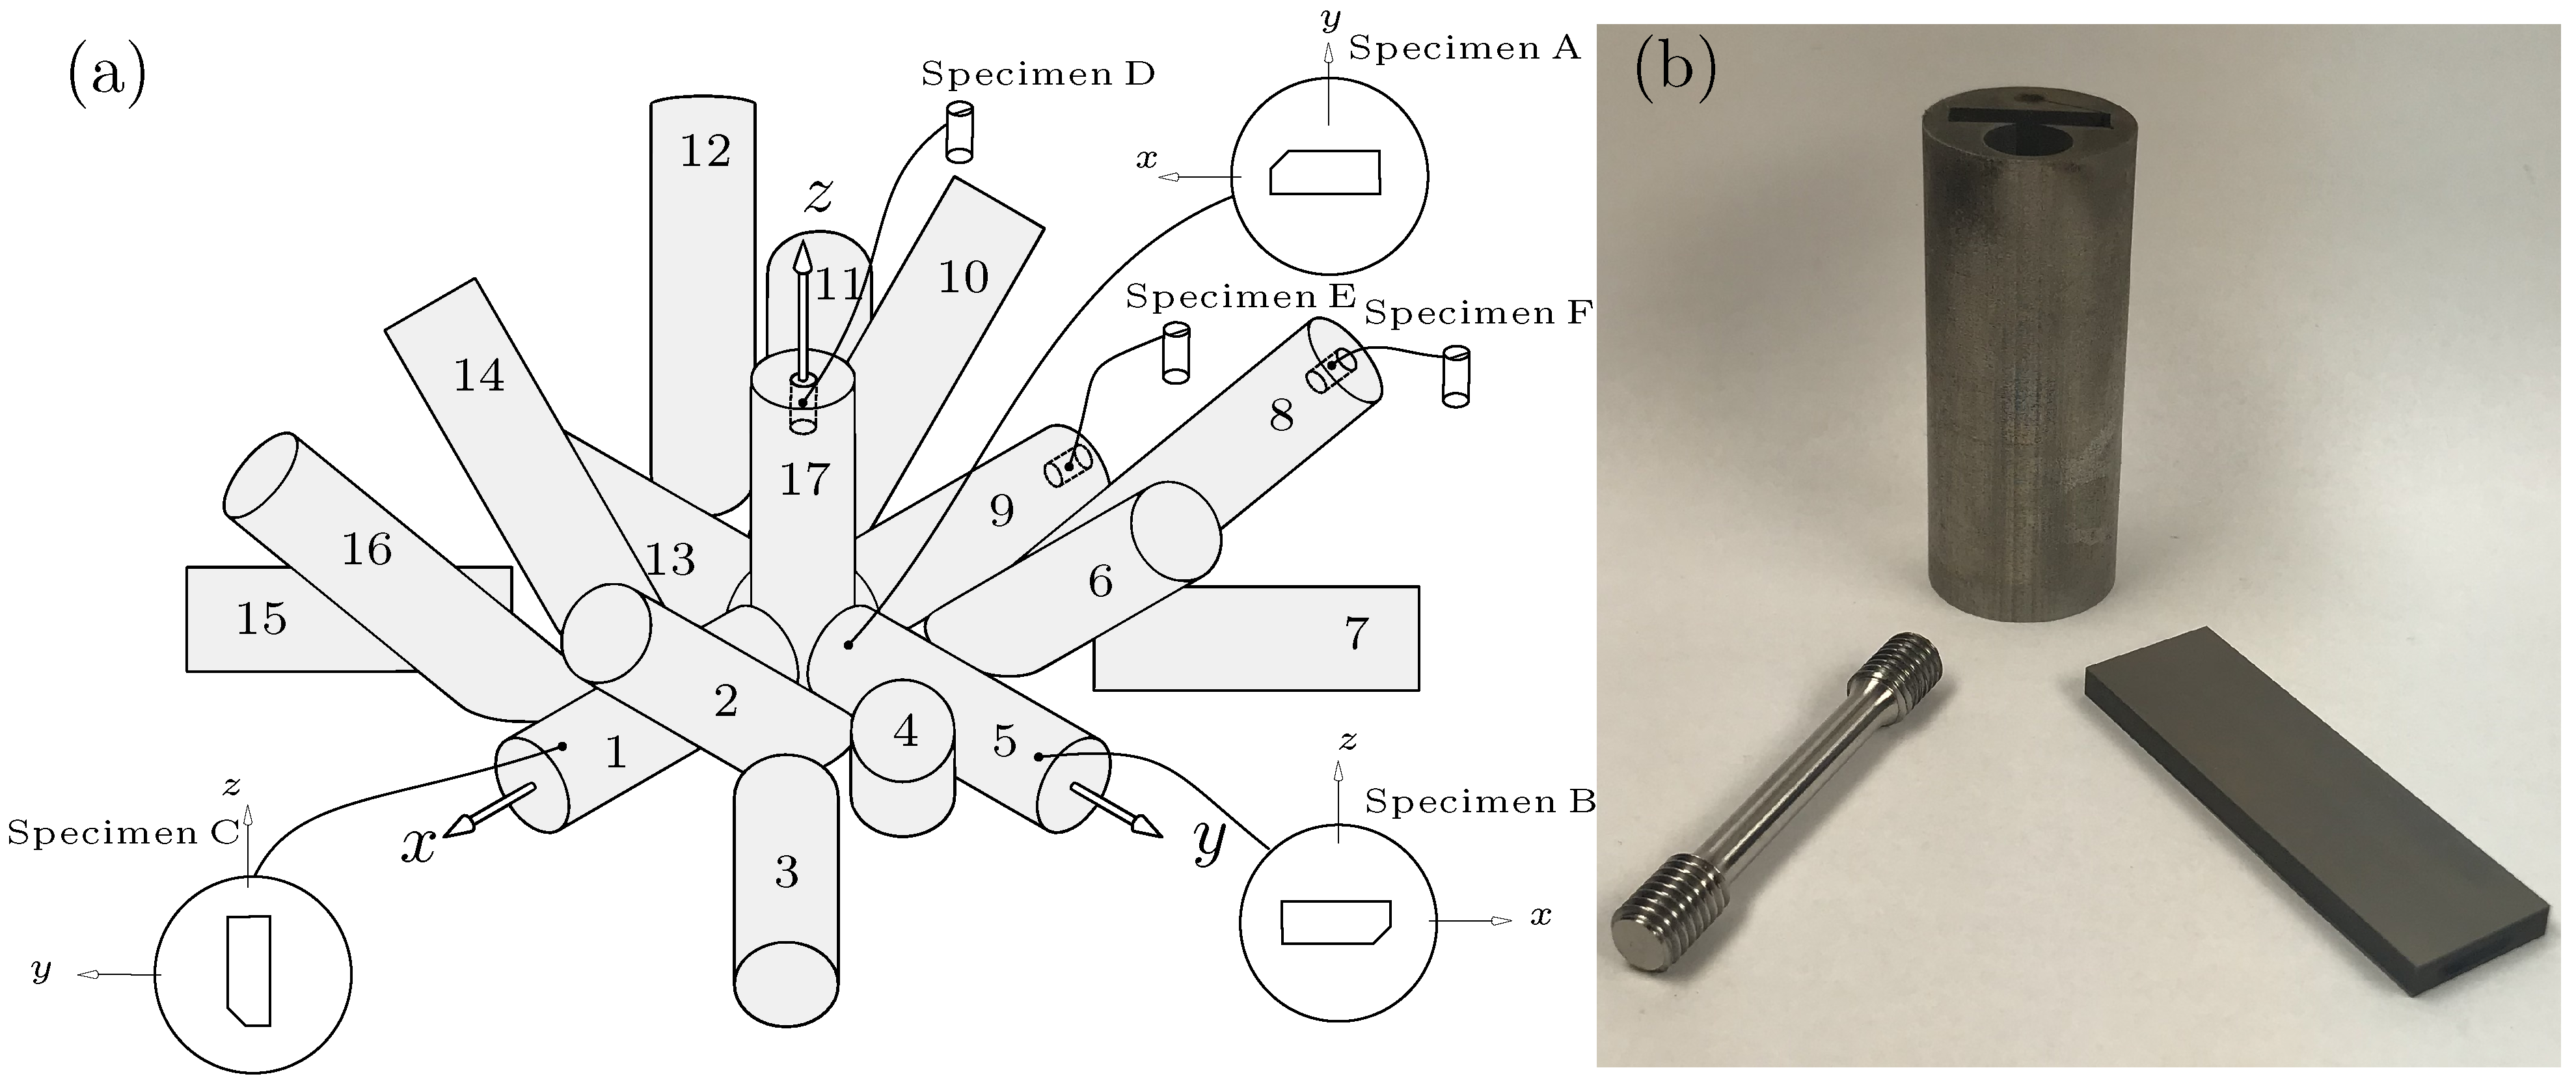
Figure 2.
Stripes, scan vectors and scanning sequence of FO1 scanning strategy.
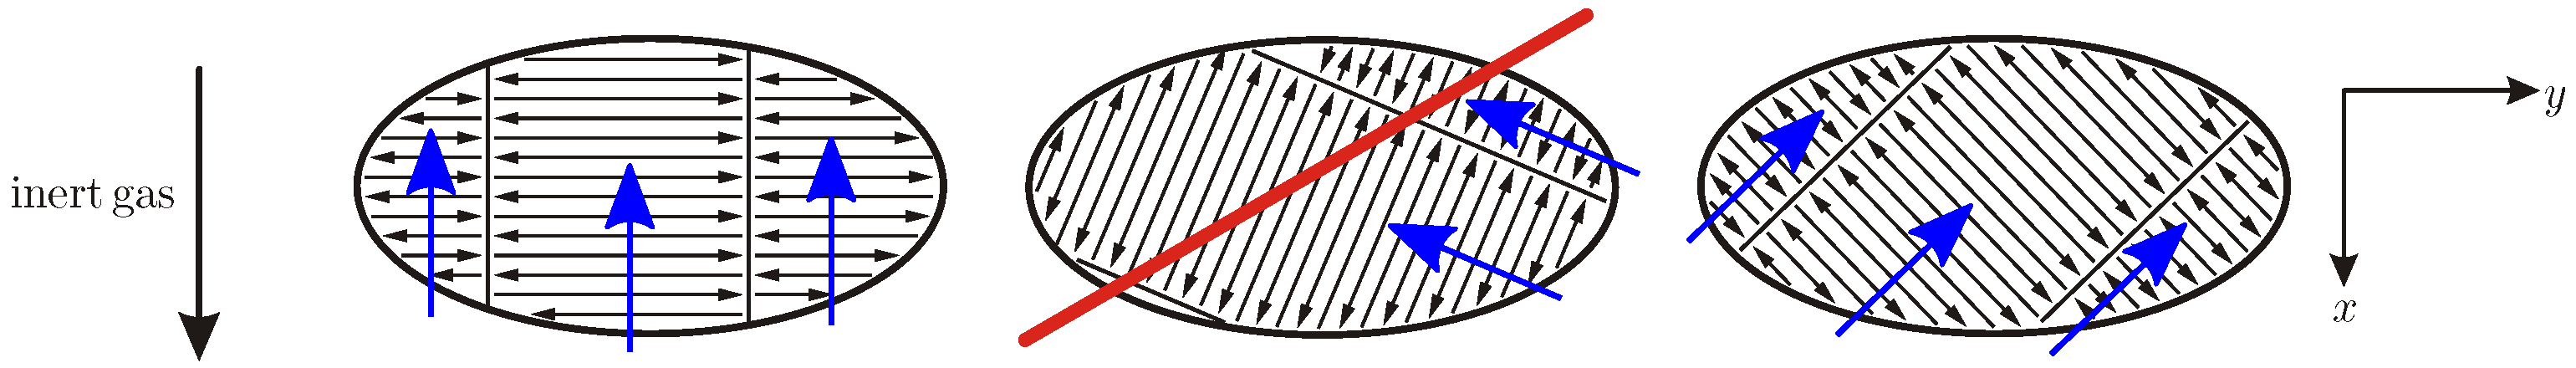
Figure 3.
(a) Stress and strain plotted over time in a measurement cycle. (b) Evaluation of the Young’s modulus from a single measurement cycle.
Figure 3.
(a) Stress and strain plotted over time in a measurement cycle. (b) Evaluation of the Young’s modulus from a single measurement cycle.
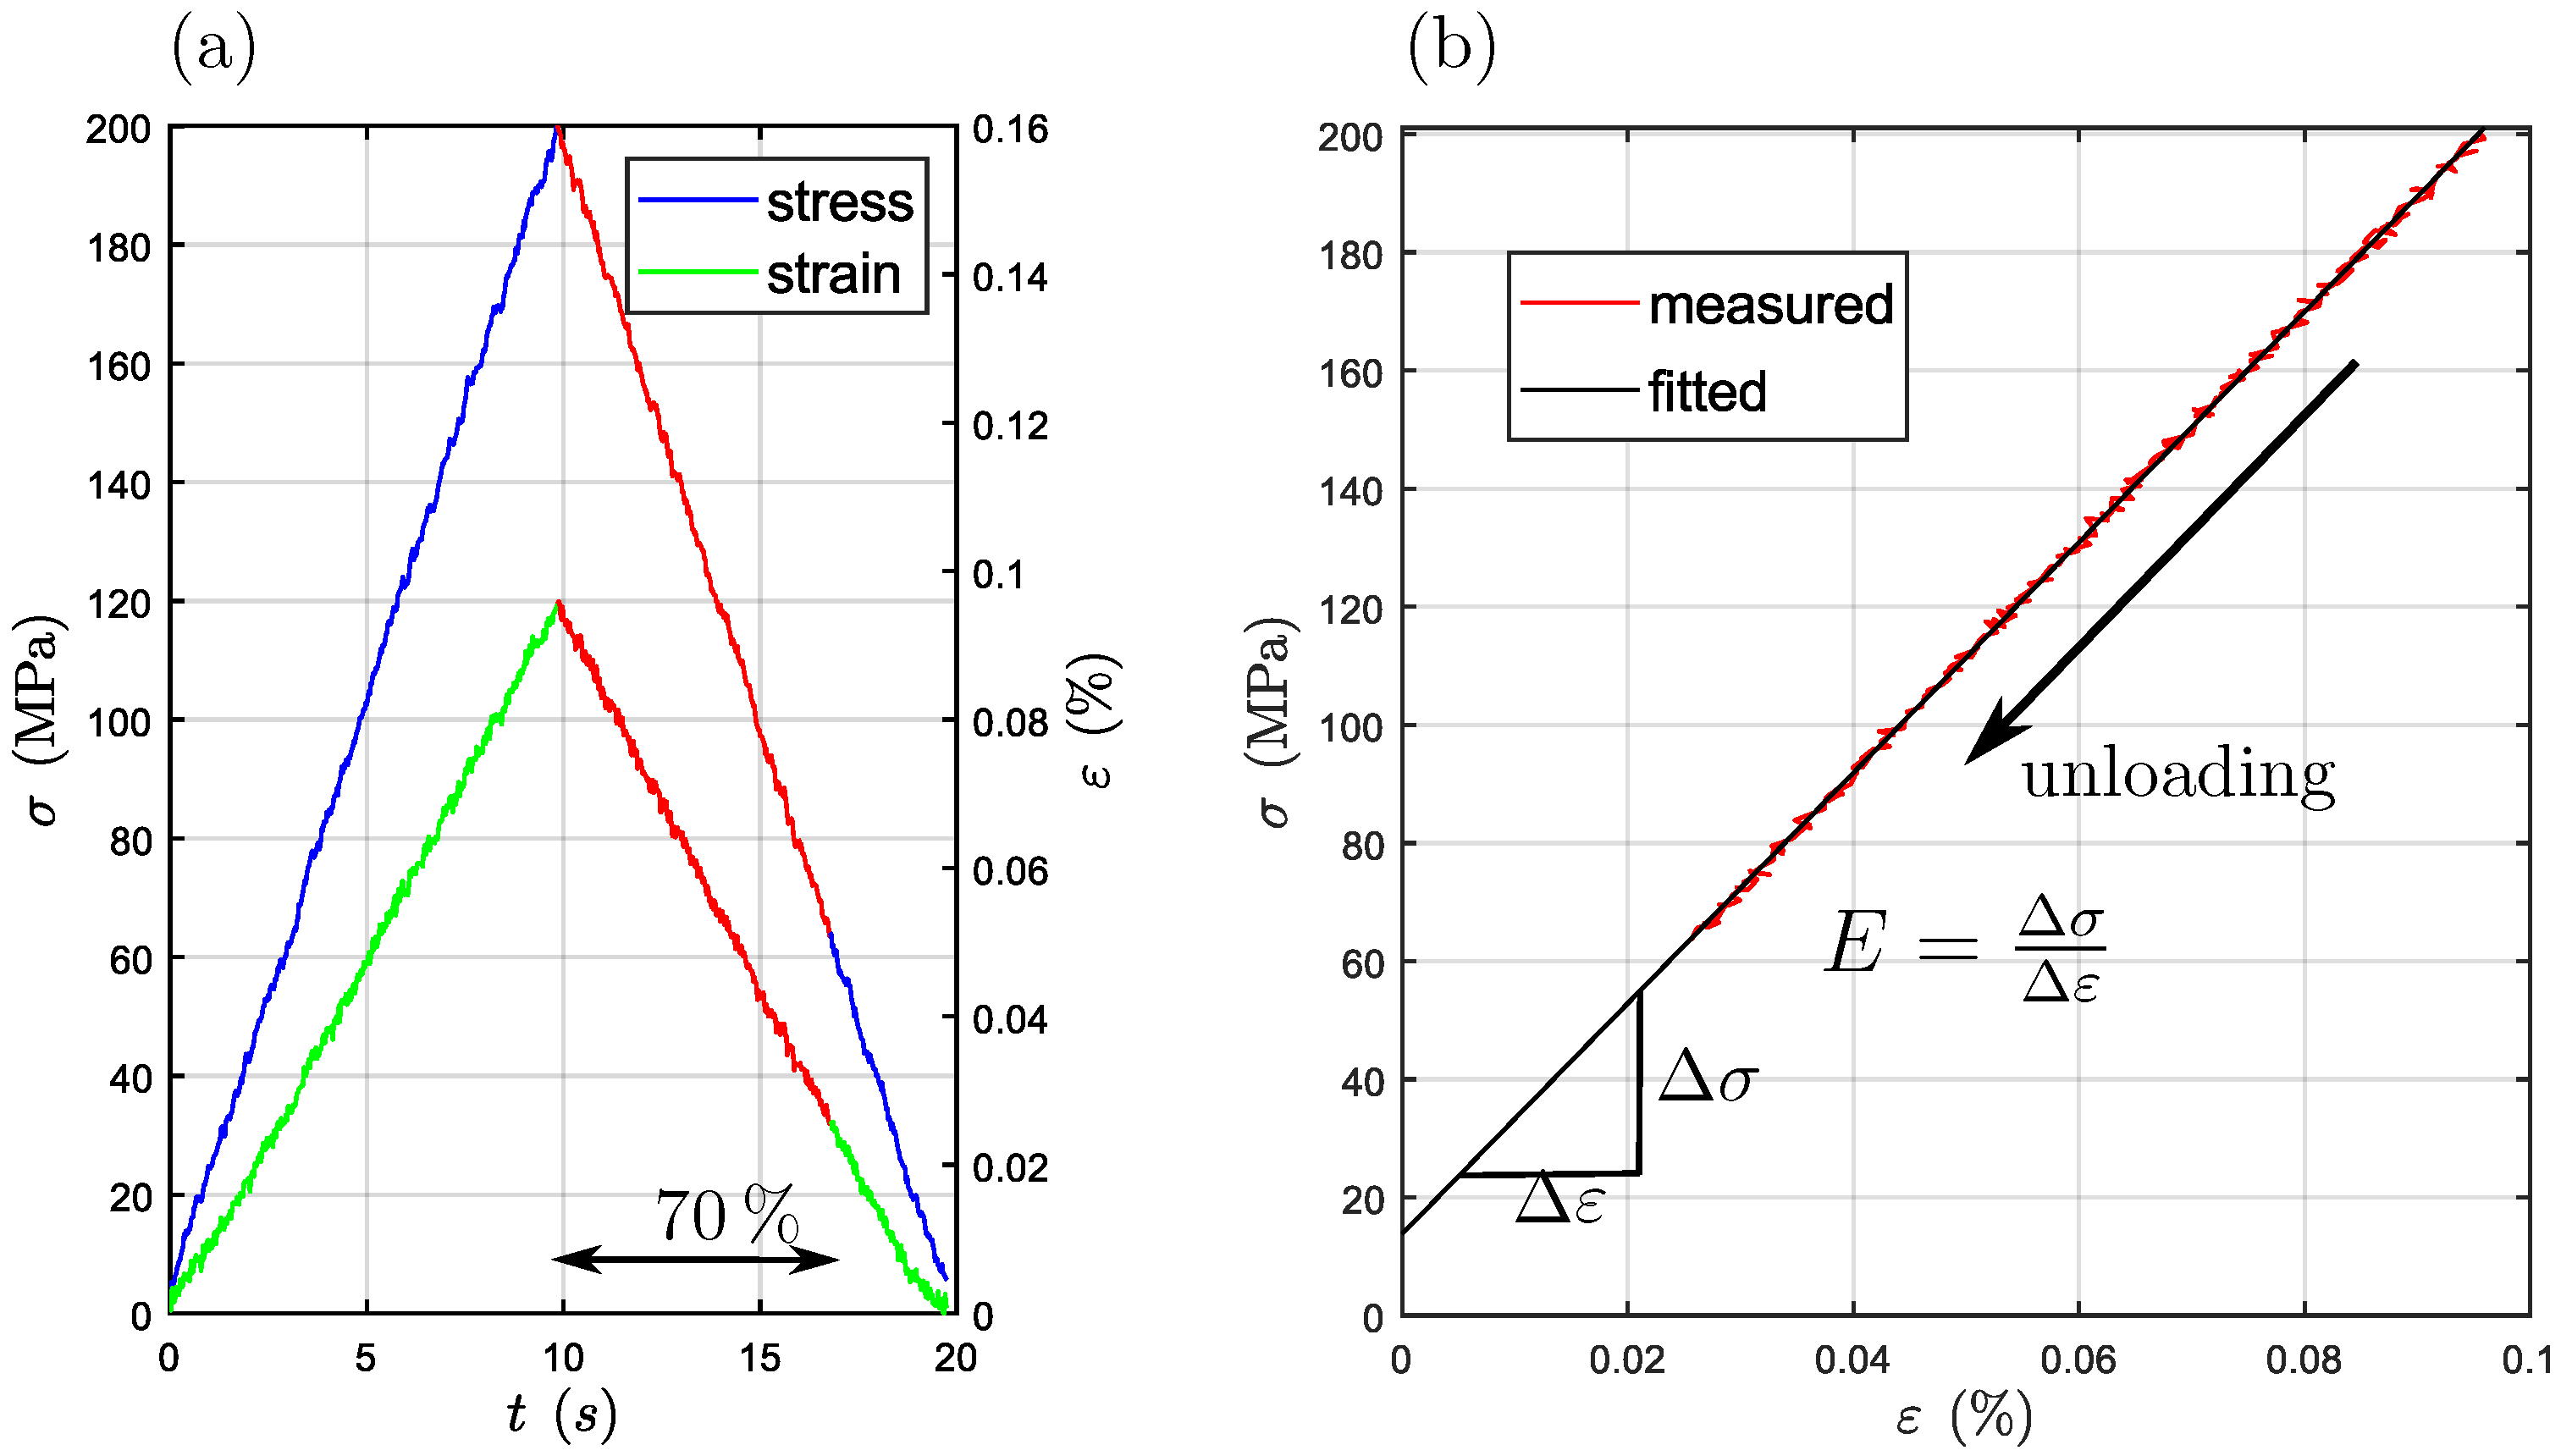
Figure 4.
Sketch of the experimental setup for determination of , with respect to the specimen basis (, ) from the fundamental flexural eigenfrequency .
Figure 4.
Sketch of the experimental setup for determination of , with respect to the specimen basis (, ) from the fundamental flexural eigenfrequency .

Figure 5.
Distance measure , shown in (a), and distance measure , shown in (b), between elasticity tensors determined from different measurement areas and the corresponding elasticity tensors determined from measurement areas of in case of specimen A, B and C.
Figure 5.
Distance measure , shown in (a), and distance measure , shown in (b), between elasticity tensors determined from different measurement areas and the corresponding elasticity tensors determined from measurement areas of in case of specimen A, B and C.
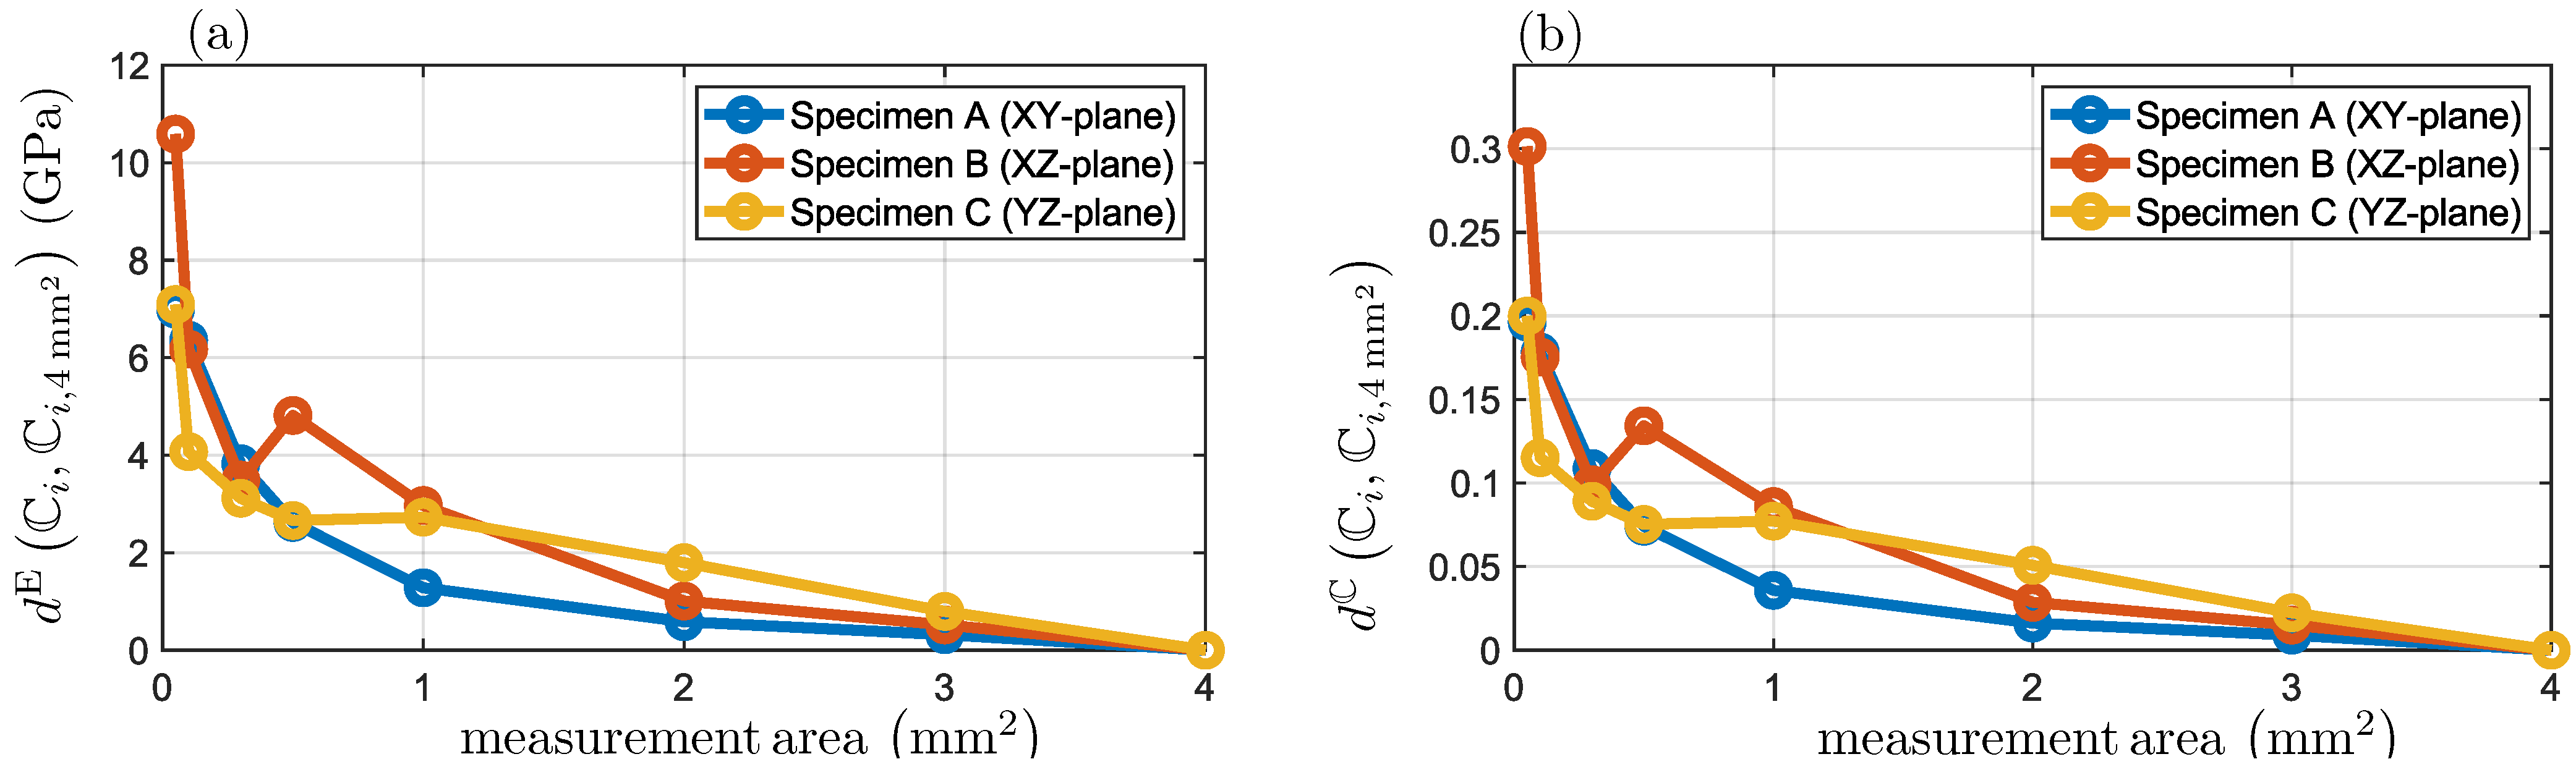
Figure 6.
(a) Texture measurement by the Debey-Scherrer method. (b) Diffraction image.

Figure 7.
Comparison of Young’s moduli in direction of the cylinder axes obtained by different approaches. Tensile loading (TL), Impulse Excitation Technique (IET), Electron Backscatter Diffraction (EBSD), High Energy XRD (HE-XRD).
Figure 7.
Comparison of Young’s moduli in direction of the cylinder axes obtained by different approaches. Tensile loading (TL), Impulse Excitation Technique (IET), Electron Backscatter Diffraction (EBSD), High Energy XRD (HE-XRD).
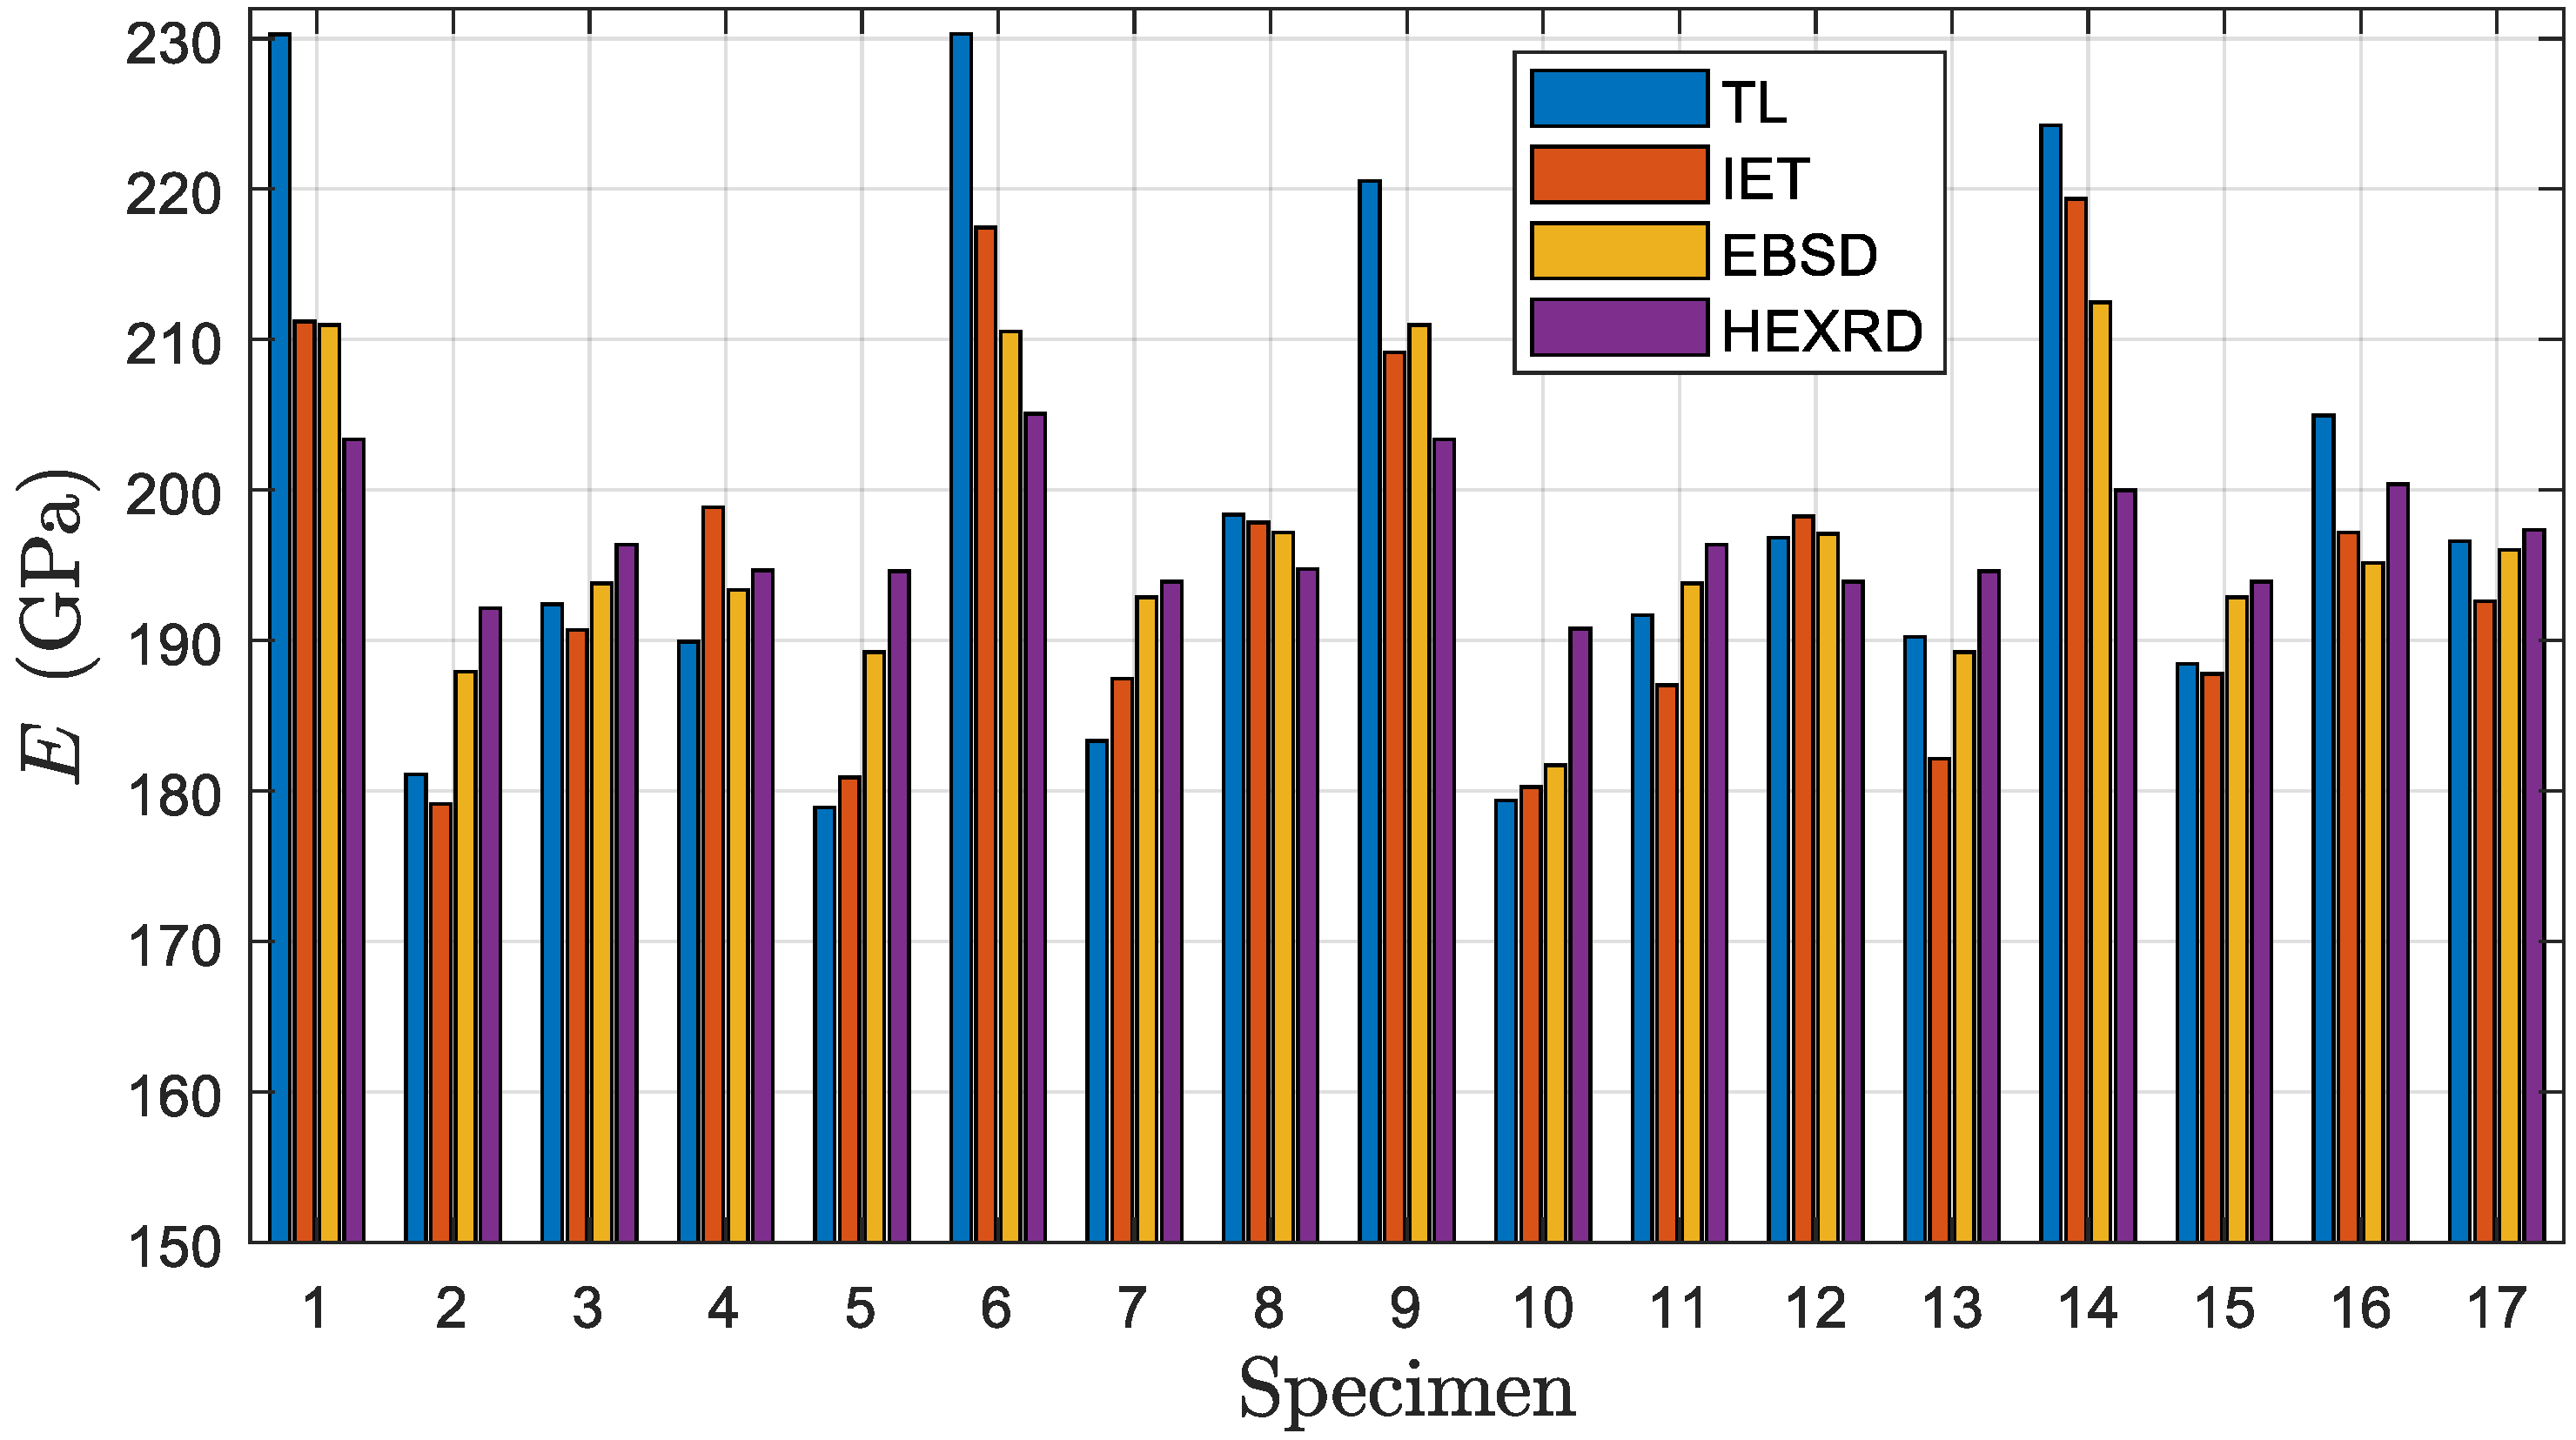
Figure 8.
(a) Pole figures of specimens A–C, determined by EBSD from measurement areas of . (b) Pole figures of specimens D–F, determined by HE-XRD.
Figure 8.
(a) Pole figures of specimens A–C, determined by EBSD from measurement areas of . (b) Pole figures of specimens D–F, determined by HE-XRD.


Table 1.
Comparison of equivalent grain diameters d observed from measurement areas of in case of specimens A, B and C.
Table 1.
Comparison of equivalent grain diameters d observed from measurement areas of in case of specimens A, B and C.
| Specimen A (-Plane) | Specimen B (-Plane) | Specimen C (-Plane) | |
|---|---|---|---|
Table 2.
Resulting elasticity tensors determined by IET, EBSD and HE-XRD.
Table 3.
Distance measures between elasticity tensors determined by the different approaches.
Table 4.
Comparison of elasticity tensors from single specimens in case of EBSD (, , ) and HE-XRD (, , ).
Table 4.
Comparison of elasticity tensors from single specimens in case of EBSD (, , ) and HE-XRD (, , ).
| EBSD | HE-XRD | |||||
|---|---|---|---|---|---|---|
Publisher’s Note: MDPI stays neutral with regard to jurisdictional claims in published maps and institutional affiliations. |
© 2022 by the authors. Licensee MDPI, Basel, Switzerland. This article is an open access article distributed under the terms and conditions of the Creative Commons Attribution (CC BY) license (https://creativecommons.org/licenses/by/4.0/).
Share and Cite
MDPI and ACS Style
Obermayer, T.; Krempaszky, C.; Werner, E. Analysis of Texture and Anisotropic Elastic Properties of Additively Manufactured Ni-Base Alloys. Metals 2022, 12, 1991. https://doi.org/10.3390/met12111991
AMA Style
Obermayer T, Krempaszky C, Werner E. Analysis of Texture and Anisotropic Elastic Properties of Additively Manufactured Ni-Base Alloys. Metals. 2022; 12(11):1991. https://doi.org/10.3390/met12111991
Chicago/Turabian StyleObermayer, Thomas, Christian Krempaszky, and Ewald Werner. 2022. "Analysis of Texture and Anisotropic Elastic Properties of Additively Manufactured Ni-Base Alloys" Metals 12, no. 11: 1991. https://doi.org/10.3390/met12111991
Note that from the first issue of 2016, this journal uses article numbers instead of page numbers. See further details here.