Article

Electrochemical Investigation of Lateritic Ore Leaching Solutions for Ni and Co Ions Extraction

1
Process Metallurgy and Metal Recycling, RWTH Aachen University, Intzestraβe 3, D-52072 Aachen, Germany
2
Department of Electrochemistry, Institute of Chemistry, Technology and Metallurgy, National Institute of the Republic of Serbia, University of Belgrade, Njegoševa 12, 11000 Belgrade, Serbia
3
Center of Excellence in Environmental Chemistry and Engineering-ICTM, University of Belgrade, Njegoševa 12, 11000 Belgrade, Serbia
4
Department of Natural and Mathematical Science, State University of Novi Pazar, 36300 Novi Pazar, Serbia
*
Author to whom correspondence should be addressed.
Metals 2022, 12(2), 325; https://doi.org/10.3390/met12020325
Submission received: 31 December 2021 / Revised: 4 February 2022 / Accepted: 8 February 2022 / Published: 12 February 2022

Abstract

:
Determination of the extractive behavior of ionic species from lateritic ore leachates is complex, since the leachates are pregnant with tens of different ions in, as a rule, multiple oxide states. To examine the possible pathways of intrinsic electrochemical extraction of the crucial elements Ni and Co, it was necessary to make model solutions of these elements and to subject them to electrochemical examination techniques in order to obtain a benchmark. Beside Ni and Co, the model system for Fe had to be evaluated. Iron, as a dominant ore component by far, is the main interfering factor in the extraction processes of Ni and Co in rather low amounts from leaching solution. The leachate examination results were compared to separate model solutions, as well as to their combinations in concentrations and to pH values comparable to those of the leachate. The separation of the leachate components was initially performed by continuous increase in pH upon leaching with NaOH solution, and afterwards the pH-adjusted solutions were subjected to electrochemical investigation. With the purpose of connecting and quantifying the visual changes in leachate upon increase in pH, conductometric measurements were performed. Reactions of oxidation/precipitations were indicated, which led to the essential Fe removal by precipitation. Resulting solutions were found suitable for Ni and Co electrochemical extraction.

1. Introduction

Cobalt and nickel are considered both strategic and critical raw materials [1]. Nickel has already been used in batteries, such as nickel–cadmium or nickel–metal-hydride, but its use in lithium-ion batteries caused rising interest in this metal, since it is able to deliver a higher energy density and more storage capacity to these batteries. Nickel has become the most important for the lithium-ion battery cathodes, thus enabling the reduction the use of cobalt, which is scarce and more expensive [2]. Nevertheless, cobalt is still essential for the manufacturing of Li-ion batteries and its compounds for supercapacitor electrodes due to the high specific capacitance and high energy density as well as better cyclic stability of Co oxide [3]. With an outbreak of electric vehicle production, global demand for cobalt and nickel has been growing. Global demand for these metals in electric vehicle batteries from 2018 to 2025 is forecasted to increase by 10 times [4,5,6].
Along with increasing needs, there has been the growing interest to recover Ni and Co by hydrometallurgical processes, mainly focused on the improvement of leaching processes [7,8,9,10]. Investigation of lateritic ore leachates for Ni and Co extraction, including advanced electrochemical techniques, should make the processing of such ores economically and technologically feasible. The pregnant leach solution (PLS) of a lateritic ore contains plenty of elements gained from their native oxide state. Ni and Co may be extracted by electrochemical deposition, which is especially suitable due to the low content of cobalt in the ores [11,12,13]. There are, however, among all the others, high amounts of iron, which is undesired for the extraction processes of cobalt and nickel [14].
The electrochemical behavior of a leachate, i.e., PLS, was investigated by the usage of constant-potential electrodeposition of PLS metals (employing chronoamperometry (CA) method) and linear sweep voltammetry (LSV), as well as by conductometry (CM). In such a complex solution, containing dozens of different ions, many of them with multiple oxide states, it is hard to determine the behavior of ionic species separately. Moreover, the mutual interactions of those ions, as well as the changes in ion interference with the solution pH, make determination of exact leaching process parameters very difficult. To examine the extraction possibilities of these crucial elements, Ni and Co, it was necessary to make model solutions of these elements and to subject them to cyclic voltammetry (CV) and (CA/LSV) examination techniques in order to obtain benchmark. Beside Ni and Co, the model system for Fe had to be evaluated, as Fe is the main interfering factor of the Ni and Co extraction process from leaching solution. The leachate examination results were compared to separate model solutions containing desired metals, as well as their combination in concentration and pH values equal to those of the leachate. Oxidation, reduction and electrodeposition were investigated at −900 mV and at different pH. The characteristic pH values were selected according to visual changes in acidic leachate and the results of conductometric investigation upon stepped increase in pH. Conductometry as employed to quantify metal ions’ transitions.

2. Materials and Methods
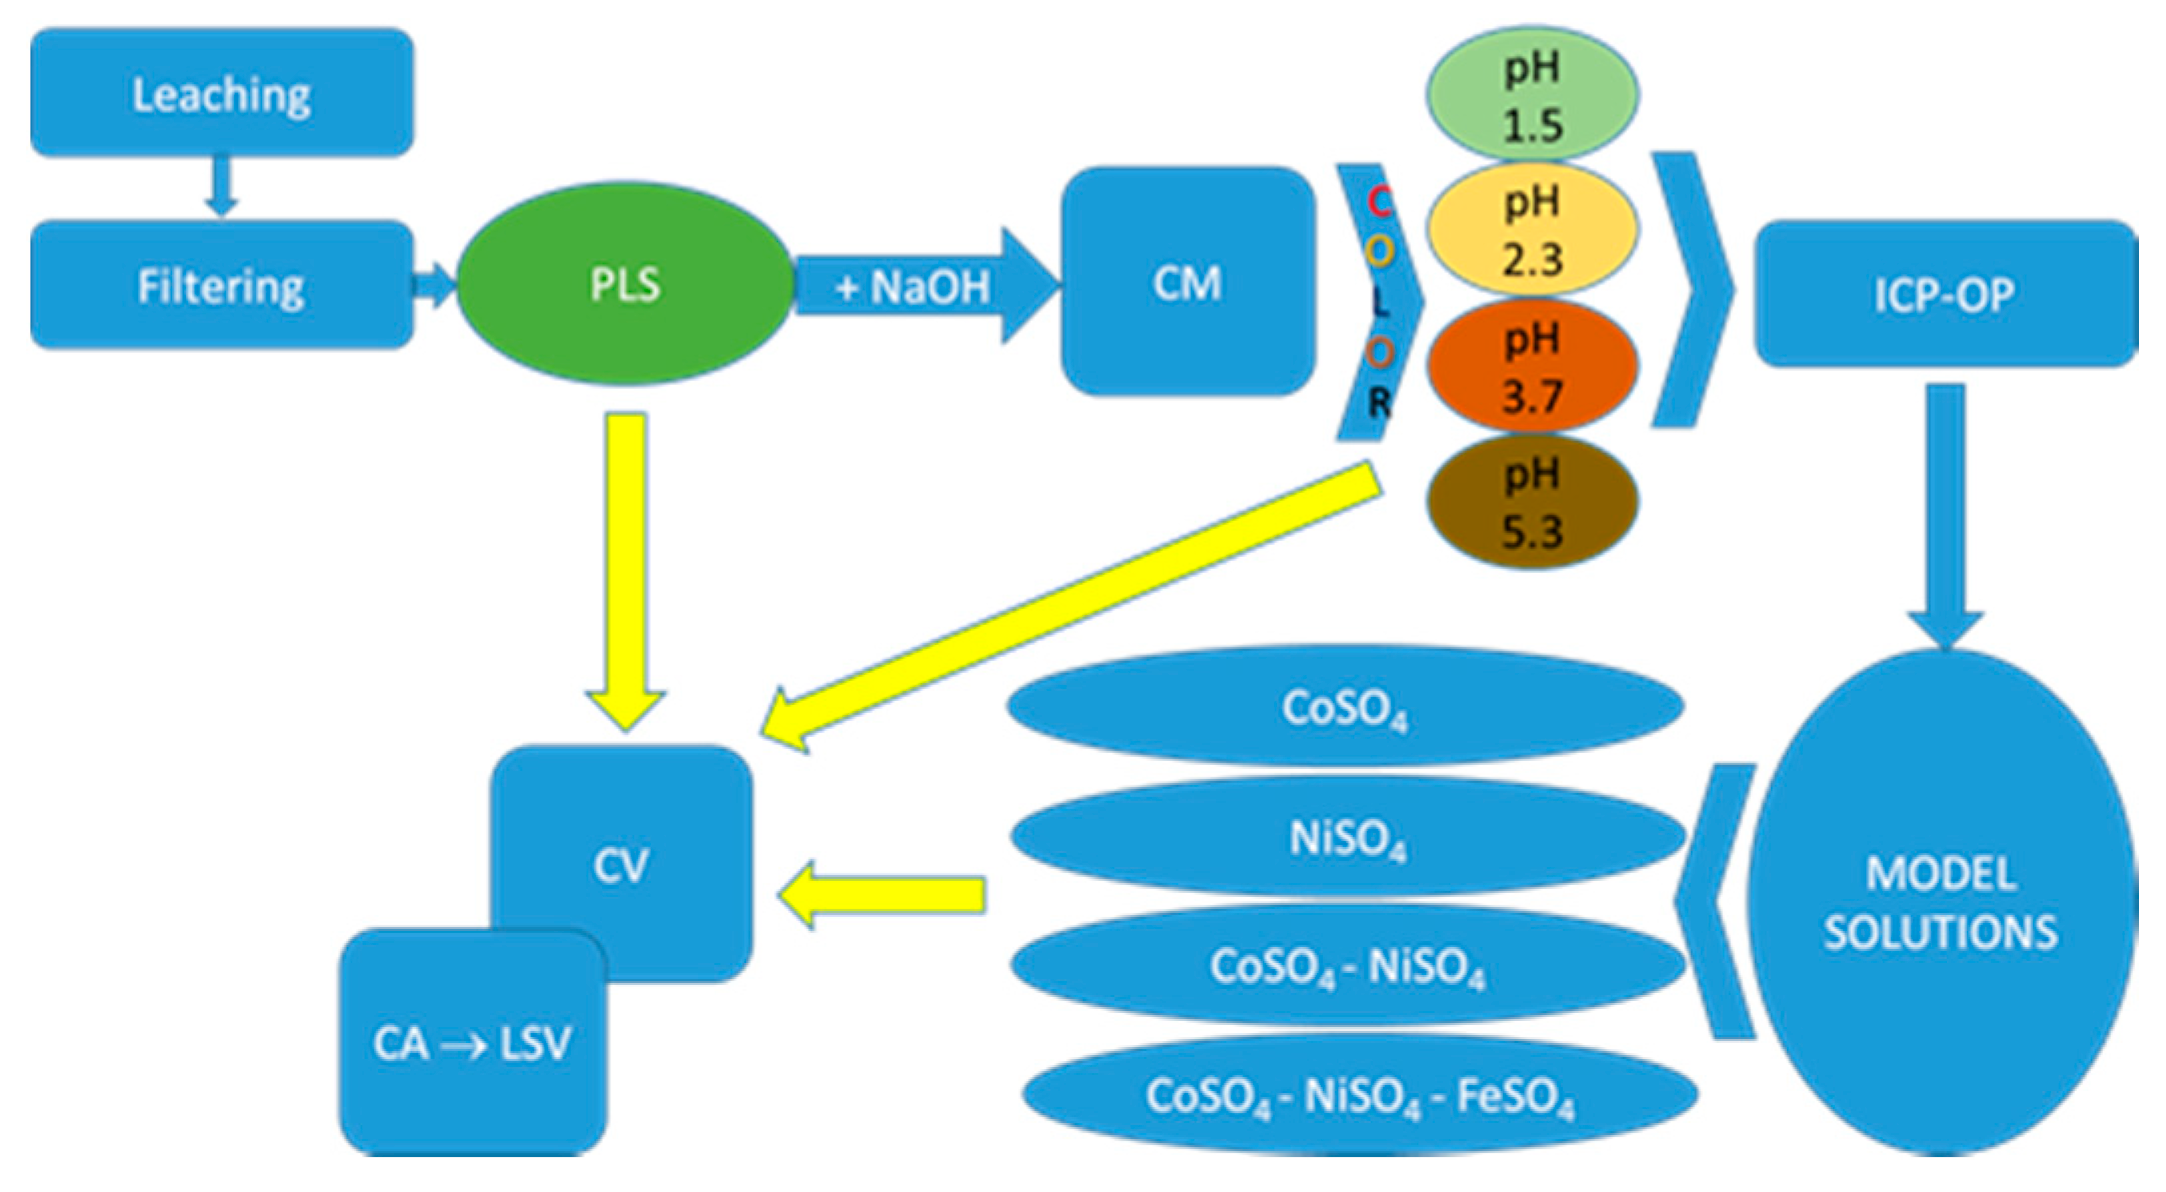
2.1. Leaching

Leaching of the lateritic ore was performed with 1.0 M sulfuric acid. The case-study ore (PT HUADI Nickel-Alloy Indonesia, Papanloe, Pa’jukukang, Bantaeng Regency, South Sulawesi 92461, Indonesia) composition is presented in Table 1. The composition of the ore was determined by X-ray fluorescence (AXIOS, PANalytical, Eindhoven, The Netherlands).
The mineral composition of the ore was determined by X-ray diffraction (XRD) analysis, which was performed on a RigakuMiniFlex 600 instrument with D/teXUltra 250 high-speed detector and an X-ray tube with a copper anode (Rigaku, Tokyo, Japan). Shooting conditions were: angle range 3–90°, step 0.02° and recording speed 10°/min. The voltage of the X-ray tube was 40 kV, and the current was 15 mA. The identification of minerals was performed in the Match! Software, and the obtained diffractograms were compared with the data from the ICDD database. The limit of detection of XRD analysis is about 1%. The minerals rhomboclase (HFe(SO4)2·4(H2O)) and getite (FeOOH) were identified.
The leaching was carried out at elevated temperature in a round-bottom flask under reflux. The mechanical stirring unit was introduced through an upper opening. The flask was placed inside a temperature controlled heating unit (SAF Wärmetechnik GmbH, Weinheimer Str. 2A, 69509 Mörlenbach, Germany). The automated heating unit kept the temperature at a constant level over the time of the experiment. To automate the heating, a thermocouple was constantly measuring the temperature during the trial. The ore concentrate leaching was carried out with a solid to liquid ratio of 1 g:5 mL, at the temperature of 70 °C and a stirring speed of 300 rpm for 120 min. The obtained leaching solution was filtered through quantitative filter paper (Grade 391-blue spot, LLG, Meckenheim, Germany). The leachate was subjected to a pH change by addition of appropriate portions of 10 M NaOH solution (a high concentration of NaOH is applied in order to consider the changes in ion concentrations as negligible upon PLS neutralization). Specific changes in the system, e.g., occurrence of precipitates, color change, etc., at different pH values were evaluated.
The starting leachate was of pH 0.5, and characteristic pH values according to specific visual changes are as follows: 1.5, 2.3, 3.7 and 5.3. Chemical analysis of the leachate at different pH was conducted using ICP-OES (Spectro Arcos, SPECTRO Analytical Instruments GmbH, Boschstr. 10, 47533 Kleve, Germany).

2.2. Preparation of Model Solutions

The following model solutions: CoSO4, NiSO4, FeSO4, CoSO4–NiSO4 and CoSO4–NiSO4–FeSO4 were prepared according to the metal concentrations in PLS measured by ICP-OES. Model solutions were prepared by dissolving CoSO4, NiSO4 and FeSO4 in 1 M sulfuric acid using p.a. chemicals and double distilled water. Concentrations of Ni, Co and Fe ions, as found in NaOH-treated PLS and listed in Table 2, were persistent in all of the model solutions. A base solution of pH 3.7 was prepared without metal ions using H2SO4.
The selected characteristic pH values were 3.7 and 5.3 according to visual changes during the leaching process and conductometric investigation.

2.3. Electrochemical Methods

In order to connect and quantify the visual changes in leachate upon increase in pH, and to separate the precipitations of metal ions from neutralization of unreacted acid, conductometric measurements (CM) were performed. The leachate resistance was measured continuously upon addition of NaOH solution portions at room temperature (22 ± 1 °C) in a home-made conductometric cell consisting of the two Pt parallel plates at fixed distance. pH was measured independently by standard digital pH-meter. The alternating voltage of 10 mV r.m.s. amplitude around open circuit reading (few mV differences between the plates) at 10 kHz was applied to induce directed ion motion. The applied frequency corresponds to the minimum of imaginary cell impedance, which was checked by recording the impedance spectra. The resistance reading was taken from the resistance/time dependences as a stable reading for at least 1 min, while single resistance measurement at 10 kHz took less than 1 s. The input voltage signal and the cell response were generated and evaluated by Biologic SP-200 potentiostat (BioLogic SAS, Grenoble, France). In addition, 1:1 Diluted (with 1.0 M H2SO4) native pregnant leach solution (PLS) and PLS with initial addition of 5 mL of H2O2 to 50 mL of PLS (PLSox) were subjected to CM.
Other electrochemical measurements (CA, LSV) were performed in a standard three-electrode system using potentiostat/galvanostat, Biologic model SP-200 (Bio-Logic SAS, Grenoble, France). The three-electrode cell consisted of a SCE reference electrode (all potentials are given in SCE scale), platinum wire as a counter electrode and working electrode.
The working electrodes were as follows:
  • Glassy carbon electrode (GC) was the working electrode for cyclic voltammetry (CV) measurements in PLSs, CoSO4 and NiSO4 model solutions, as well as in base solution. The working electrode was mechanically polished consecutively on emery papers of the following grades: 280, 360, 800 and 1000, and then on polishing cloths (Buehler Ltd., Lake Bluff, IL, USA) impregnated with alumina of 1, 0.3 and 0.05 µm grades;
  • For the examination of the electrochemical potentiostatic extracts from PLSs at different pH, working electrodes were the alloys deposited onto polished GC;
  • To model the electrochemical dissolution by LSV, working electrodes were Ni–, Co–, Fe–, Ni–Co and Ni–Co–Fe alloys deposited on GC from the model solutions. Before each electrodeposition, the GC surface was mechanically polished with a polishing cloth (Buehler Ltd., Lake Bluff, IL, USA) impregnated with a water suspension of alumina powder (0.05 μm grade). Characterization of alloy composition was performed by alloy electrochemical dynamic dissolution using a linear sweep voltammetry (LSV) technique.
CV measurements were performed in the native PLS (pH 0.5) as well as in NaOH-treated PLSs at pH 3.7 and 5.3. Both NiSO4 and CoSO4 model solutions were also subjected to the CV measurements. Anodic CV branches were recorded upon hold at the cathodic potential limit for 2 min. In order to check the hydrogen evolution reaction’s (HER) contribution to the CV currents in leachates, the base solution was also subjected to CV measurements. All CV measurements were conducted at 25.0 °C at a sweep rate of 10 mV s−1. The metal deposition was carried out potentiostatically at −0.9 V for 60 min, at 1000 rpm under N2 bubbling. Obtained deposits were electrochemically checked using linear sweep voltammetry (LSV). LSV measurements were conducted in a phosphate buffer solution (pH 7.2) with an anodic sweep rate of 10 mV s−1 at 25 °C. A schematic overview of the experimental procedure is shown in Figure 1.
All electrochemical experiments were conducted in N2-saturated solutions.

3. Results and Discussion

Visual color changes were detected upon addition of the portions of 10 M NaOH. Natively green PLS at pH 0.5 changed its color to orange-yellow at pH 1.3 and finally reddish when pH 2.1 is reached. With an increasing volume of NaOH added, brownish flakes occurred; stable solid brown precipitate was registered at pH 2.8. NaOH and H2O2 addition led to color changes at different pH values in comparison to the case without H2O2 addition: orange-yellow color appeared at pH 1.5, red color at pH 2.7 and brown color with solid precipitates at pH 4.9.

3.1. Conductometric Measurements

The intrinsic ionic transitions registered by conductometric measurements during neutralization by NaOH are illustrated by Figure 1 and Figure 2, which show the changes in resistance and incremental resistance, respectively, with a volume of 10 M NaOH added. Incremental resistance is gained as the first derivative of the curves from Figure 2.
Figure 2 shows generally higher resistances of PLS and PLSox with respect to 1 M H2SO4 as a leaching medium, since some portion of the acid was spent for dissolution of lateritic ore. On the other hand, PLSox is of a bit lower resistance down the curve, which indicates that addition of peroxide causes the oxidation of the ions to attain higher, and, consequently, more conductive states. Up to pH 2.4, the resistance increases, whereas the shape of the curves appears quite similar, with obvious changes in resistance increments per volume of NaOH added. This enables the recognition of the three neutralization phases (I–III), with mid phase II of the most pronounced incremental resistance change (Figure 3). As presented in Figure 3, the three investigated solutions are of similar incremental resistance changes in phases I–III. These phases are then to be recognized as neutralization phases of the excess of acid as a leaching agent. The neutralization of the sulfuric acid ends at around pH 7, indicated as a sudden change from increase to decrease in resistance. In the cases of PLS and PLSox, this transition finally takes place above pH 10, since NaOH is used for precipitation of ions in pH range 2.4–10 through phases IV–VI, as indicated in the inset of Figure 2 in details.
Neutralization of the ions (phases IV–VI) appears much faster than that of the excess of leaching agent because the incremental resistance in phases I–III is lower. In a narrow pH range of 2.4–2.9, there is a unique and fast increase in resistance for PLS, followed by resistance decrease (phase V), which is common for PLS and PLSox. The incremental resistance decrease is much higher for PLSox. It could be that phase IV corresponds to neutralization of lower oxidation states since it is hardly distinguishable in the case of PLSox. Consequently, phase V could be related to the post-neutralization state, after neutralizations of ions in higher oxidation states (the process is much faster for PLSox with respect to PLS).
According to conductometric considerations, it follows that precipitation of the main ions in PLS is occurring when pH reaches ca. 2.4, with precipitations of Fe species as the most abundant component. This is in accordance with the visual appearance of the massive brownish precipitate and corresponding Pourbaix diagram for Fe, which reports the transitions of metal ions to oxohydroxide ions (the change in PLS color from green to orange-yellow was observed at pH below 2) and finally hematite, roughly in the pH range of 1–5 in a rather acidic environment. According to Figure 2 and Pourbaix diagram, precipitation of Fe species should end in the pH range 2.9–5, whereas the precipitation of other ionic components should take place between pH 5 and 10 upon addition of NaOH solution in volumes between 12.5 and 13 mL (Figure 2, inset—transition from decrease to increase in resistance, phase VI). According to Pourbaix diagrams for Ni and Co, precipitations of corresponding hydroxides/oxides should not start at pH below 6 and 9, respectively. In addition, Ni and Co ions in the solution are stable at the electrode potentials negative to 0.5 VSVE. These considerations introduce a possibility to separate Fe from Ni and Co by Fe precipitation in the pH range of 3–6 and, afterwards, electrochemical extraction of Ni/Co. The extracts can be analyzed by electrochemical dissolution up to 0.5 VSVE, and even beyond, but with generation of the Ni/Co oxides/hydroxides in the electrode–electrolyte interphase. Bearing in mind these findings, the pH values of PLS were set for electrochemical investigations as reported in Table 2.

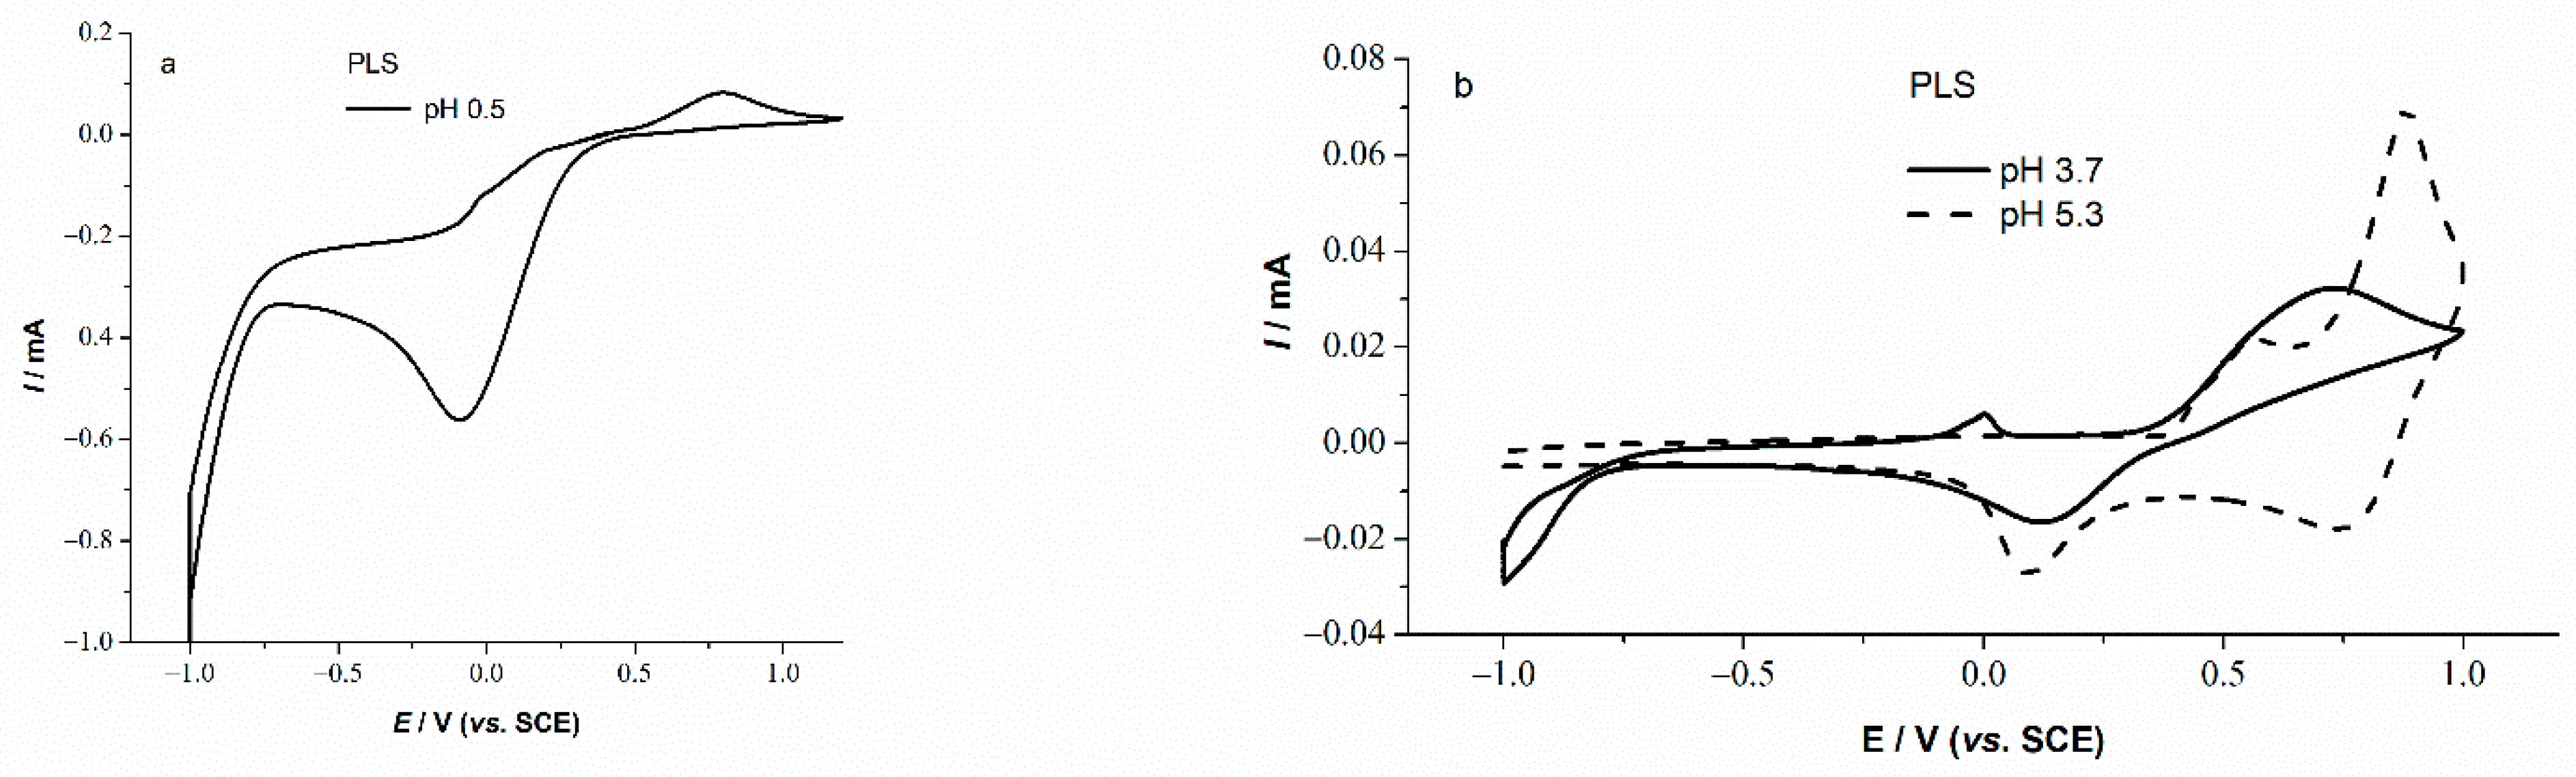
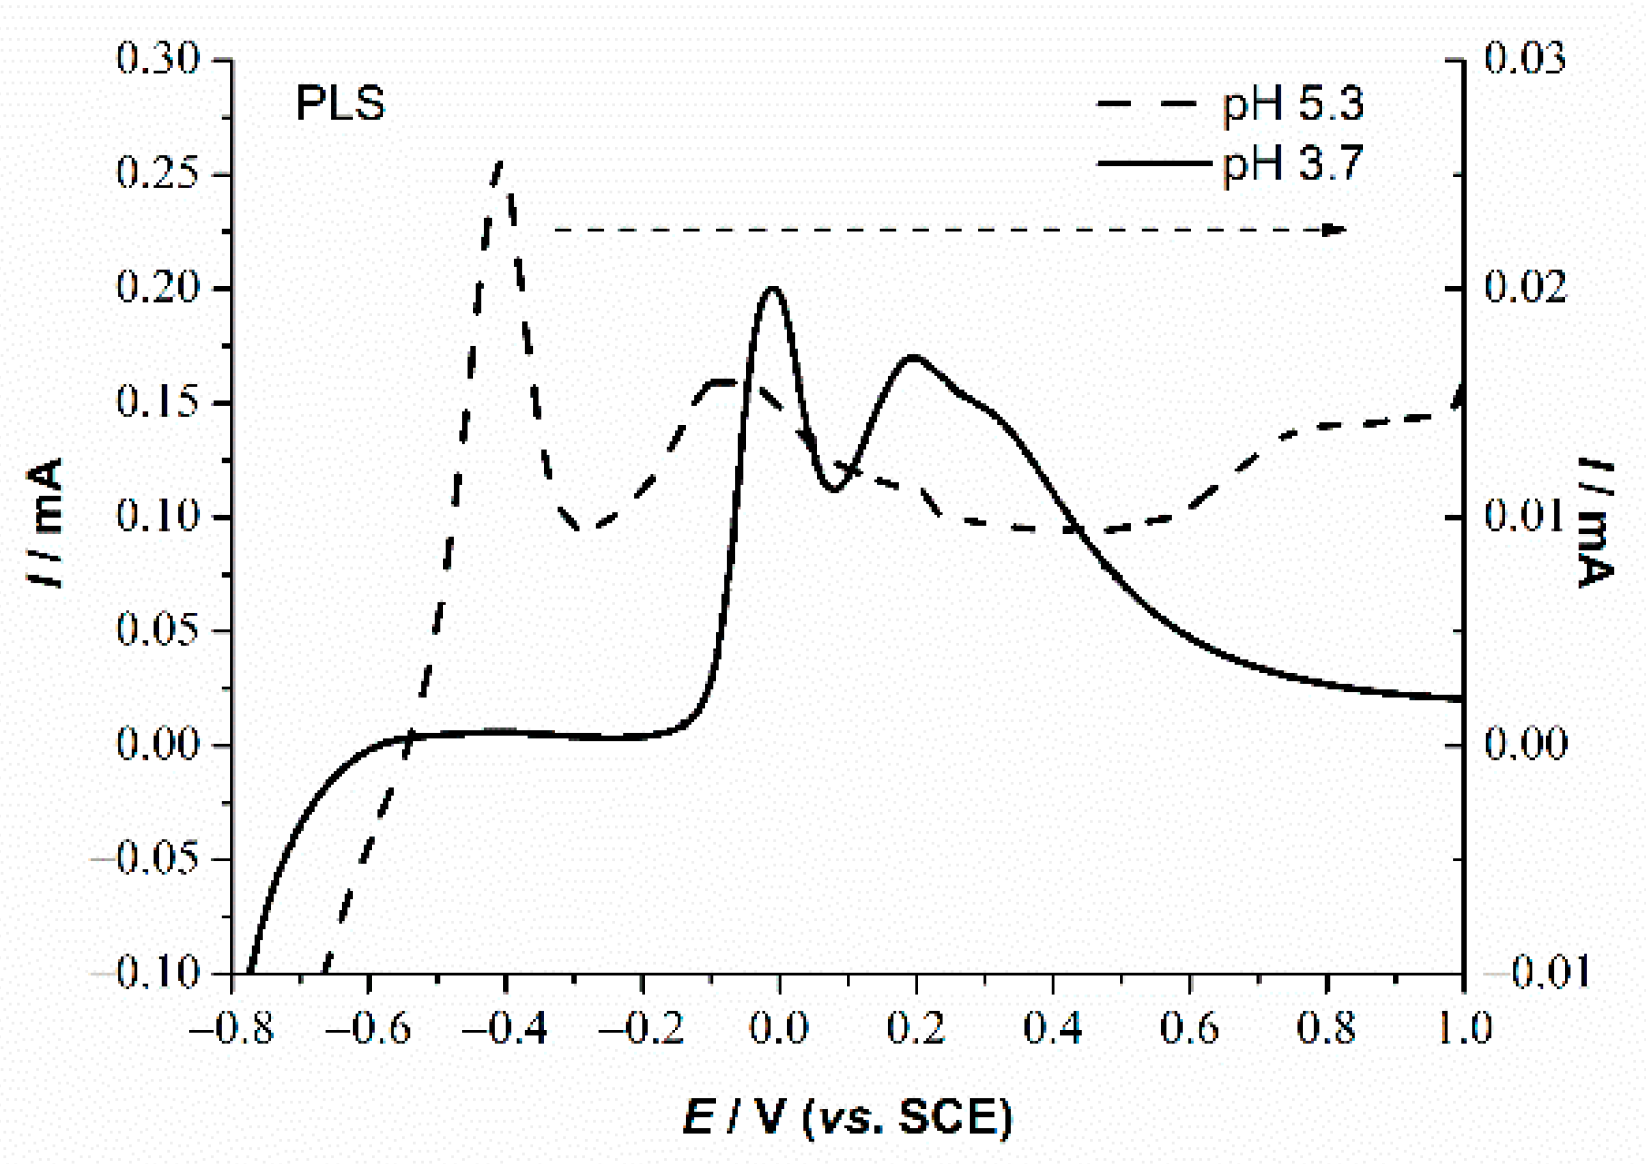
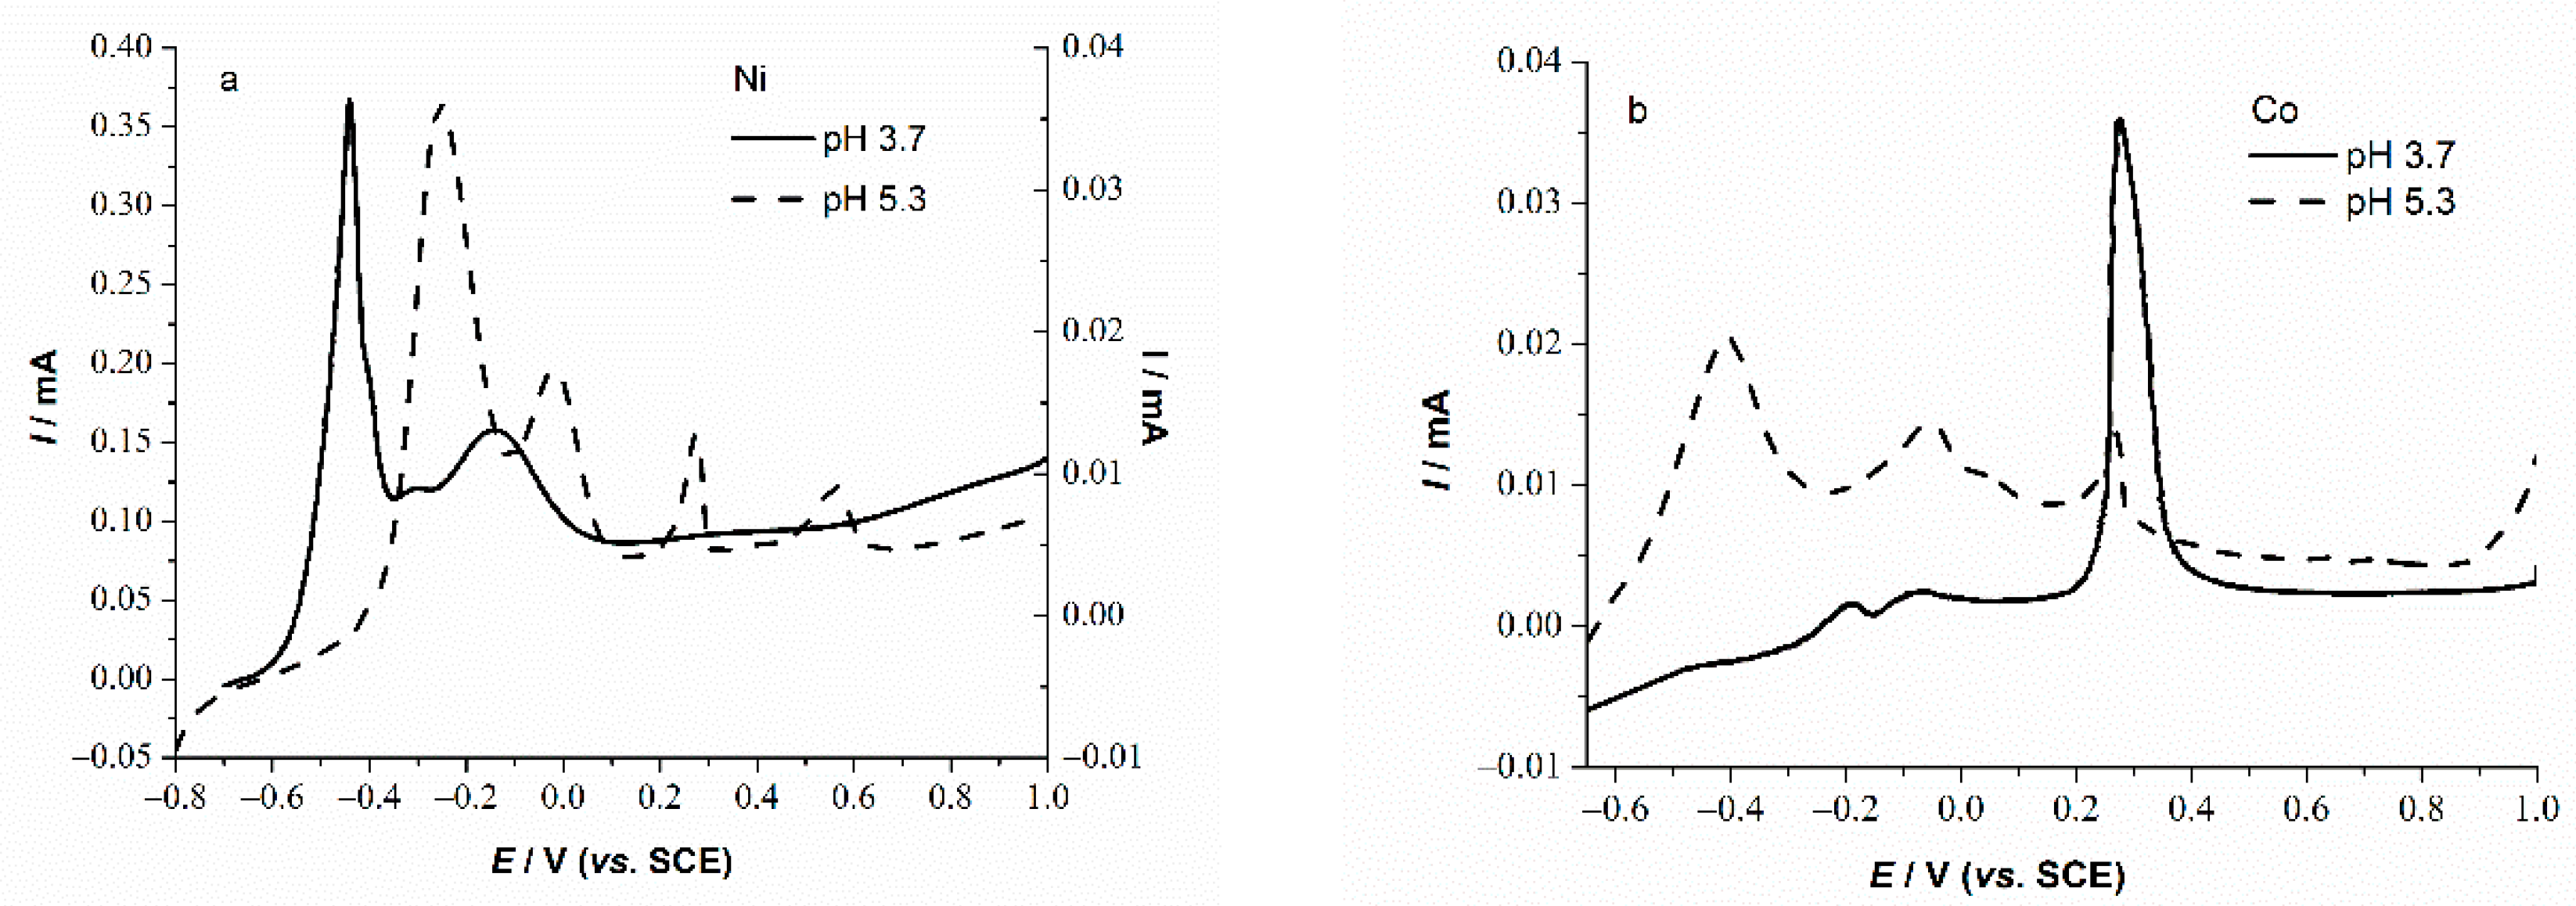
3.2. Basic Electrochemical Behavior of PLS

Cyclic voltammograms in native PLS (pH 0.5) and PLSs at pH 3.7 and 5.3 are shown in Figure 4. Reversible Fe3+/Fe2+ redox transition dominates the CV response of PLS at pH 0.5, 3.7 and 5.3 (Figure 4a,b), indicating the excess of 3+ state by higher currents of the reduction peak at around −0.15 V with respect to the anodic counterpart at around 0.9 V. On the other hand, the CVs of the NaOH treated solutions (Figure 4b) are of considerably lower currents due to the removal of iron from the solution. The onset of Fe deposition and a side reaction of hydrogen evolution (HER) in the solution of pH 3.7 take place at around –0.8 V. The presence of the two weak anodic shoulders can be seen at around 0.0 and 0.2 V. These shoulders are transferred to the peak at 0.0 V upon increase in pH to 3.7. A small peak at the potential of 0.7 V indicates that there are still some traces of iron in the solution (Table 2). At pH 5.3, this peak shifted catholically to 0.56 V, while new reversible peaks at around 0.9 V arose due to transitions in the Ni/Co oxides.
Figure 5 shows cyclic voltammograms of NiSO4 and CoSO4 model solutions of different pH and concentrations (Table 2), compared to CV of base solution. Base solution of pH 3.7 was prepared by setting the pH of 1.0 M H2SO4 with NaOH.
Although there was no pronounced hydrogen evolution even at pH 3.7 down to −1.0 V (Figure 5, blue line), the nickel electrodeposition process depended considerably on the pH value of the solution. It should be taken into account that slightly different Ni2+ and Co2+ concentrations at pH 3.7 and 5.3 solutions (Table 2) could also have an impact on the electrodeposition processes. However, despite lower concentration at pH 5.3, both NiSO4 and CoSO4 at pH 5.3 exhibited more intense anodic peaks compared to those in pH 3.7 solutions. At lower pH, HER, as a side reaction, takes place in model solutions on metal deposits in comparison to the base solution where HER takes place on GC. HER thus spends considerable current, and consequently a lower amount of metal is being deposited. This can be observed as the less intensive anodic oxidation/dissolution peaks. In addition, due to more intense HER, i.e., profound H+ consumption, there is local pH increase near the electrode surface. If the pH value is high enough, hydrolysis of the metal ion as an additional reaction may occur that can lead to the precipitation of the metal hydroxides. Consequently, different phases of a metal in a deposit may occur [15]. Unlike Ni, Co electrodeposition process is less sensitive to pH due to rather low Co concentrations.
LSV curves of the deposits obtained potentiostatically at –0.9 V from PLSs and model solutions are shown in Figure 5, Figure 6, Figure 7 and Figure 8. Multiple peaks indicate multiple phases of the deposits and/or subsequent processes in which dissolved metal ions participate.
Ni- curves at different pH (Figure 7a) showed typical LSV behavior in phosphate buffer with two main anodic peaks below 0.0 V assignable to Ni⟹Ni2+ transition. The peaks at more positive potentials appear suppressed at pH 5.3 due to formation of NiO/Ni(OH)2 film, [16,17]. The presence of Ni⟹Ni2+ transition-related peaks in Ni-pH3.7 and Ni-pH5.3 LSV curves suggest that Ni was deposited in a metallic form at both pH values.
The shape of the Co-pH5.3 LSV curves indicates that cobalt was deposited in a mainly metallic form at pH 5.3 (Figure 7b), with suppression of the peaks at more negative potentials at lower pH. Namely, an anodic peak around −0.410 V, related to Co⟹Co(OH)2 transition, occurred in Co-pH5.3 LSV response. Additional anodic peaks at −0.08 and 0.260 V correspond to Co(OH)2⟹Co3O4 and Co3O4⟹CoOOH transitions, respectively. Onset of CoOOH⟹CoO2 transition can be seen at 0.9 V. On the other hand, surface of a deposit obtained at pH 3.7 consisted mostly of Co3O4 due to a dominant peak around 0.3 V, representing the Co3O4⟹CoOOH transition [18].
These differences in active/passive behavior of the surfaces of Co and Ni deposits can be explained by different surface morphology due to different model solutions concentrations and pH. Owing to the different electrodeposition process (Figure 5), different Ni and Co phases can be potentiostatically formed [19,20,21]. At lower pH, side HER may have a larger impact on the morphology of metal deposition. An increase in pH value near the electrode due to HER, i.e., H+ consumption, may lead to the precipitation of the hydroxide [15].
Comparing the starting leachate of pH 0.5 with 111.61 mmol/L of Fe and the solution of pH 5.3, where Fe content was negligible (Table 2.), the goal of Fe removal is reached, as commented further in Figure 4. LSV–Ni–Co consisted of the two main peaks associated to the Ni⟹Ni2+ and Co⟹Co2+ transitions. Like Ni–Co curves, Figure 8, the pH-5.3 PLS curve, Figure 6, consists of the two anodic peaks around −0.4 V. Furthermore, Ni–Co and leachate curves consisted of a broad peak around 0 V, while the peak present in the Ni-curve (Figure 7) was at −0.17 V. This anodic shifting can be assigned to the influence of Co on the Ni–Co LSV curve, which causes the appearance of the broad peak between −0.2 and 0.2 V present in sole Co-curve (Figure 7b). Compared to the Ni–Co curve (Figure 8a), LSV curve related to deposit obtained from Ni–Co–Fe model solution (Figure 8b) consisted of mainly of a peak at around −0.4 V. A peak at 0 V, seen in LSV of both Ni–Co and leachate at pH 3.7 and pH 5.3, is not evident. It seems that the presence of a small amount of Fe can contribute to the suppression of the abovementioned peak (Figure 8).
The shape of the leachate and Ni–Co curves (Figure 6 and Figure 8) resembles the shape of both Ni and Co-pH 5.3 curves (Figure 7 and Figure 8), suggesting that Ni–Co dominates leachate deposit composition. A peak at around −0.4 V, related to M⟹M2+ transition, is present in all of these curves except the PLS-pH3.7 curve. Peaks present in PLS-pH3.7 curve at 0 and 0.2 V correspond to the peaks registered in Ni-pH3.7 and both Co and Ni–Co curves (Figure 8a).
Both Fe-pH5.3 and Fe-pH3.7 (Figure 9) curves contain the peaks related to transitions of different hydroxide forms, indicating that deposits are in the state of the hydroxide rather than metallic Fe [22]. LSV–Fe curves for both Fe-pH5.3 and Fe-pH3.7 (Figure 9) exhibit peaks at 0.0 and 0.2 V which are suppressed at LSV–Ni–Co–Fe curves.
LSV results are in accordance with Table 2, which shows that Fe was removed from the leachate at the pH 5.3. However, although Fe was almost completely removed, its presence slightly influenced the peaks at the Ni–Co–Fe LSV curve (Figure 7). The LSV curve related to the deposit obtained from leachate at this pH value is in good agreement with the curve of the corresponding Ni–Co model deposit. Fe ion removal is a precondition in the Ni and Co extraction process from leaching solution, since the presence of Fe is detrimental in those ions’ extraction process from PLS. Extracted Ni and Co, i.e., electrodeposited in metallic form, can be valorized from lateritic ore leaching solution.

4. Conclusions

There is a possibility to separate Fe from Ni and Co in leachates of lateric ores by Fe precipitation in the pH range 3–6, and afterwards to electrochemically extract Ni/Co. The extracts can be subjected to electrochemical dissolution up to 0.5 VSVE, and even further with generation of the Ni/Co oxides/hydroxides in the electrode–electrolyte interphase.
Reversible Fe3+/Fe2+ redox transition dominates the CV response of native PLS at pH 0.5, indicating the excess of the 3+ state by higher currents of a reduction CV peak. On the other hand, the CVs of the NaOH-treated leaching solutions are of considerably lower currents, indicating a removal of Fe from the solution. The onset of Fe deposition and a side HER in solution with pH 3.7 takes place at around –0.8 V.
Fe was almost successfully removed from the leachate at the pH 5.3. The LSV curve related to the deposit obtained from leachate at this pH value is in good agreement with the curve of the corresponding Ni–Co model deposit.
The presence of Ni⟹Ni2+ transition related peaks in Ni-pH3.7 and Ni-pH5.3 LSV curves suggests that Ni was deposited in a metallic form at both pH values.
The shape of the Co-pH5.3 LSV curves indicates that cobalt was deposited in a mainly metallic form only at pH 5.3 (Figure 7b). Namely, the anodic peak around −0.410 V, related to Co⟹Co(OH)2 transition, occurred at Co-pH5.3 LSV response.

Author Contributions

Conceptualization, M.M., J.S., S.S., V.P. and B.F.; methodology, S.S. and V.P.; formal analysis, J.M. and M.K.; investigation, J.M., M.K. and M.M.; resources, J.S.; data curation, J.M. and M.K.; writing—original draft preparation, J.M. and M.K.; writing—review and editing, M.M. and V.P.; supervision, J.S. and B.F.; project administration, M.M. All authors have read and agreed to the published version of the manuscript.

Funding

This research was supported by the Science Fund of the Republic of Serbia, Program DIASPORA, #GRANT No.6463002, CAPTAIN.

Data Availability Statement

Not applicable.

Acknowledgments

The authors would like to thank Katarina Božić, University of Belgrade, Institute of Chemistry, Technology and Metallurgy, National Institute of the Republic of Serbia, for conductometric measurements assistance.

Conflicts of Interest

The authors declare no conflict of interest. The funders had no role in the design of the study; in the collection, analyses or interpretation of data; in the writing of the manuscript, or in the decision to publish the results.

References

  1. Slack, J.F.; Kimball, B.E.; Shedd, K.B. Cobalt. In Critical Mineral Resources of the United States—Economic and Environ Mental Geology and Prospects for Future Supply; Schulz, K.J., DeYoung, J.H., Seal, R.R., Bradley, D.C., Eds.; USGS Pubs: Reston, VA, USA, 2017; Volume 1082, pp. F1–F40. [Google Scholar]
  2. Bloomberg. Available online: https://www.bloomberg.com/news/articles/2021-02-25/musk-says-nickel-is-biggest-concern-for-electric-car-batteries (accessed on 12 December 2021).
  3. Wood, M.; Li, J.; Ruthera, R.E.; Du, Z.; Self, E.C.; Meyer, H.M., III; Daniel, C.; Belharouak, I.; Wood, D.L., III. Chemical stability and long-term cell performance of low-cobalt, Ni-Rich cathodes prepared by aqueous processing for high-energy Li-Ion batteries. Energy Stor. Mater. 2020, 24, 188–197. [Google Scholar] [CrossRef]
  4. Deetman, S.; Pauliuk, S.; van Vuuren, D.P.; van der Voet, E.; Tukker, A. Scenarios for demand growth of metals in electricity generation technologies, cars, and electronic appliances. Environ. Sci. Technol. 2018, 52, 4950–4959. [Google Scholar] [CrossRef] [PubMed] [Green Version]
  5. Davis, J.R. (Ed.) Nickel, Cobalt, and Their Alloys, ASM Specialty Handbook; ASM International: Novelty, OH, USA, 2000. [Google Scholar]
  6. Statista. Available online: https://www.statista.com/statistics/967700/global-demand-for-nickel-in-ev-batteries/ (accessed on 12 December 2021).
  7. Banza, A.N.; Gock, E.; Kongolo, K. Base metals recovery from copper smelter slag by oxidising leaching and solvent extraction. Hydrometallurgy 2002, 67, 63–69. [Google Scholar] [CrossRef]
  8. Altundogan, H.S.; Boyrazli, M.; Tumen, F. A study on the sulphuric acid leaching of copper converter slag in the presence of dichromate. Miner. Eng. 2004, 17, 465–467. [Google Scholar] [CrossRef]
  9. Song, S.; Sun, W.; Wang, L.; Liu, R.; Han, H.; Hu, Y.; Yang, Y. Recovery of cobalt and zinc from the leaching solution of zinc smelting slag. J. Environ. Chem. Eng. 2019, 7, 102777. [Google Scholar]
  10. Khalid, M.K.; Hamuyuni, J.; Agarwal, V.; Pihlasalo, J.; Haapalainen, M.; Lundström, M. Sulfuric acid leaching for capturing value from copper rich converter slag. J. Clean. Prod. 2019, 215, 1005–1013. [Google Scholar] [CrossRef]
  11. Meshram, P.; Prakash, U.; Bhagat, L.; Abhilash; Zhao, H.; van Hullebucsh, E.D. Processing of Waste Copper Converter Slag Using Organic Acids for Extraction of Copper, Nickel, and Cobalt. Minerals 2020, 10, 290. [Google Scholar] [CrossRef] [Green Version]
  12. Potysz, A.; Lens, P.N.; van de Vossenberg, J.; Rene, E.R.; Grybos, M.; Guibaud, G.; van Hullebusch, E.D. Comparison of Cu, Zn and Fe bioleaching from Cu-metallurgical slags in the presence of Pseudomonas fluorescens and Acidithiobacillus thiooxidans. Appl. Geochem. 2016, 68, 39–52. [Google Scholar] [CrossRef]
  13. Yang, Z.; Rui-lin, M.; Wang-dong, N.; Hui, W. Selective leaching of base metals from copper smelter slag. Hydrometallurgy 2010, 103, 25–29. [Google Scholar] [CrossRef]
  14. Elias, M. Nickel laterite deposit—Geological overview, resources and exploitation. In Giant Ore Deposits: Characteristics, Genesis and Exploration; Cooke, D., Pongratz, J., Eds.; Special Publication 4; University of Tasmania, Centre for Ore Deposit Research: Hobart, Australia, 2002; Volume 6, pp. 205–220. [Google Scholar]
  15. Koza, J.M.; Uhlemann, M.; Gebert, A.; Schultz, L. The effect of a magnetic field on the pH value in front of the electrode surface during the electrodeposition of Co, Fe and CoFe alloys. J. Electroanal. Chem. 2008, 617, 194–202. [Google Scholar] [CrossRef]
  16. Macdonald, D.D.; Liang, R.Y.; Pound, B.G. An Electrochemical Impedance Study of the Passive Film on Single Crystal Ni(111)in Phosphate Solutions. J. Electrochem. Soc. 1987, 134, 2981. [Google Scholar] [CrossRef]
  17. Martini, E.M.A.; Amaral, S.T.; Muller, I.L. Electrochemical behaviour of Invar in phosphate solutions at pH 6.0. Corros. Sci. 2004, 46, 2097–2115. [Google Scholar] [CrossRef]
  18. Chivot, J.; Mendoza, L.; Mansour, C.; Pauporte´, T.; Cassir, M. New insight in the behaviour of Co–H2O system at 25–150 °C, based on revised Pourbaix diagrams. Corros. Sci. 2008, 50, 62–69. [Google Scholar] [CrossRef]
  19. Yu, Y.; Sun, L.; Ge, H.; Wei, G.; Jiang, L. Study on Electrochemistry and Nucleation Process of Nickel Electrodeposition. Int. J. Electrochem. Sci. 2017, 12, 485–495. [Google Scholar] [CrossRef]
  20. Tian, L.; Xu, J.; Qiang, C. The electrodeposition behaviors and magnetic properties of Ni–Co films. Appl. Surf. Sci. 2011, 257, 4689–4694. [Google Scholar] [CrossRef]
  21. Yu, Y.; Song, Z.; Ge, H.; Wei, G.; Jian, L. Electrochemical mechanism of cobalt film electrodeposition process. Mater. Res. Innov. 2016, 20, 280–284. [Google Scholar] [CrossRef]
  22. Richardson, J.A.; Abdullahi, A.A. Corrosion in Alkalis, Reference Module in Materials Science and Materials Engineering; Elsevier: Amsterdam, The Netherlands, 2018. [Google Scholar] [CrossRef]
Figure 1. Schematic overview of the experimental procedure.
Metals 12 00325 g001
Figure 2. The changes in resistance in 1.0 M H2SO4, PLS and PLSox upon neutralization by NaOH gained by impedance conductometric measurements. Input voltage: 10 mV r.m.s., 10 kHz; 22 ± 1 °C.
Metals 12 00325 g002
Figure 3. The changes in resistance per volume of 10M NaOH added calculated as first derivative of the curves from Figure 2; specific phases of neutralization, I–VI, as well as corresponding pH ranges, are indicated according to intersections of tangent lines. The standard deviations of linearization are presented as error caps.
Metals 12 00325 g003
Figure 4. Cyclic voltammograms of (a) native PLS at pH 0.5 and (b) NaOH-treated PLSs (pH 3.7 and 5.3), v =10 mV s−1. The anodic branches are recorded upon hold at the cathodic limit for 2 min.
Metals 12 00325 g004
Figure 5. CV of GC in N2-saturated (a) NiSO4, compared to base and (b) CoSO4 solutions, v = 10 mV/s. The anodic branches are recorded upon hold at the cathodic limit for 2 min.
Metals 12 00325 g005
Figure 6. LSV curves in phosphate buffer solution (pH 7.2, 25°C) of deposits obtained after CAs at −900 mV in PLSs.
Metals 12 00325 g006
Figure 7. LSV curves in phosphate buffer solution (pH 7.2, 25 °C) of deposits obtained after CAs at −900 mV in (a) NiSO4 and (b) CoSO4..
Metals 12 00325 g007
Figure 8. LSV curves in phosphate buffer solution (pH 7.2, 25 °C) of deposits obtained after CAs at −900 mV in (a) NiSO4–CoSO4 and (b) NiSO4–CoSO4–FeSO4.
Metals 12 00325 g008
Figure 9. LSV curves in phosphate buffer solution (pH 7.2, 25°C) of deposits obtained after CAs at −900 mV in FeSO4.
Metals 12 00325 g009
Table 1. Chemical analysis of the ore, mass %.
SiO2MgOFe2O3NiOAl2O3CaOMnOCr2O3CuOCo3O4K2OTiO2
11.705.8170.703.804.270.130.731.78<DL 10.050.020.07
1 DL–detection limit.
Table 2. Overview of the pH and concentrations (mmol/L) of the leachate and model solutions.
pHCoNiFe
3.70.3424 13.5 4.8
5.30.2661 12.3 0.0464
Publisher’s Note: MDPI stays neutral with regard to jurisdictional claims in published maps and institutional affiliations.

