
Effect of Ce on the Microstructure and Corrosion Resistance of Al-5Mg-3Zn-1Cu Alloy


1
School of Materials Science and Engineering, Kunming University of Science and Technology, Kunming 650093, China
2
National−Local Joint Engineering Laboratory for Technology of Advanced Metallic Solidification Forming and Equipment, Kunming University of Science and Technology, Kunming 650093, China
3
National Engineering Research Center of Light Alloy Net Forming, State Key Laboratory of Metal Matrix Composites, Shanghai Jiao Tong University, Shanghai 200240, China
*
Authors to whom correspondence should be addressed.
Metals 2022, 12(3), 371; https://doi.org/10.3390/met12030371
Submission received: 24 December 2021
/
Revised: 5 February 2022
/
Accepted: 16 February 2022
/
Published: 22 February 2022
(This article belongs to the Special Issue Research Progress in the Microstructure and Mechanical Properties of Light Alloys)
Abstract
:The effects of different Ce content on the microstructure and corrosion resistance of Al-5Mg-3Zn-1Cu alloy in metal mold gravity casting were studied in this paper. The microstructure of the alloy was characterized by scanning electron microscope (SEM) and X-Ray diffractometer (XRD). The corrosivity of all alloys in 3.5 wt.%NaCl solution was studied by electrochemical and immersion corrosion techniques. The results show that the microstructure of the alloy is mainly composed of α-Al, T phase, and Al2Cu phase. Ce can refine the organization of the alloy, but when the addition of Ce is higher than 0.25 wt.%, a massive Ce-rich phase appears in the alloy. The results of a potential polarization test show that the corrosion potential of the alloy increases obviously from −1.253 V to −1.193 V with the increase in Ce content in the alloy.
1. Introduction
With continuous growth of the economy, automobile production has been increasing year by year, causing subsequent energy crises and air pollution problems; thus, lightweight automobiles has been recommended [1,2,3,4,5]. Cast aluminum alloy offers the characteristics of low density, high specific strength, and good corrosion resistance and casting process; thus, it is widely used in the field of automobile manufacturing [6,7,8,9,10]. At present, the aluminum alloy used for automobiles is mainly Al-Si alloy, but it is not ideal, because its ductility is less than 6% and yield strength is lower than 280 MPa, which cannot meet the current requirements for automotive lightweight materials [11]. At present, there is the urgent need for an aluminum alloy material that offers high strength, ductility, and toughness.
Al-5Mg-3Zn-1Cu alloy has low Zn/Mg ratio—high strength, good toughness, and low hot cracking sensitivity, which makes it a good choice for automotive parts [7,12]. When a small amount of Zn is added to the Al-Mg alloy, part of the β phase that precipitated at the grain boundary is replaced by T phase; however, when a large amount of Zn element is added to the Al-Mg alloy, a large amount of T phase precipitates at the grain boundary and in the grain. Previous research results have shown that the strength of the Al-Mg-Zn alloy is greatly improved, compared to traditional 5xxx aluminum alloy, due to the precipitation of intragranular T phase, but continuous precipitation of a large number of T phases along the grain boundary weakens the intergranular corrosion resistance of the alloy. In order to further improve the comprehensive properties of aging-strengthened Al-Mg-Zn-Cu alloy, optimization of the alloy’s corrosion resistance is urgently required [13,14,15].
Rare earth elements are widely used in aluminum alloys to achieve specific admirable properties. When Chen Kanghua et al. [16] added a small amount of Yb element to the 7A60 alloy, the strength and toughness of the alloy were improved. Zheng Q et al. [17] found that the addition of La formed an La-rich surface shell in the outer layer of Mg2Si, and the shell effectively slowed down the dissolution of Mg2Si and reduced the surrounding local corrosion. Zhu Zhiyun et al. [18] believe that Ce improves the intergranular corrosion and exfoliation corrosion of 7249 alloy. In aluminum alloy, Ce is mainly enriched in the grain boundary and combines with impure elements to form rare earth compounds to purify the grain boundary and eliminate the harmful effects of the elements [19]. In addition, the addition of Ce elements can effectively refine the grain structure, interact with the alloy elements in the alloy to form alloy compounds, and change the phase composition of the alloy. At present, there is no research on improving the corrosion sensitivity of Al-Mg-Zn-Cu alloy by adding Ce. In this study, Al-5Mg-3Zn-1Cu alloys with different Ce contents were designed and prepared, and their microstructure and corrosion sensitivity studied. This research has guiding significance for the application of Al-Mg-Zn-Cu alloy in automobile parts.
2. Materials and Methods
In this study, 99.7% pure aluminum, 99.97% pure zinc, and 99.95% pure magnesium ingots and two master alloys—Al-50%Cu alloy and Al-10%Ce alloy (without special description, all compositions are in wt.% units)—were used to prepare alloys. The alloy was smelted in a crucible resistance furnace (SG2-5-10,CHOY, Shanghai, China); the specific technical parameters are shown in Table 1. After the aluminum block was melted, the insoluble Al-50%Cu and Al-20%Ce were subject to heat preservation 10 min after the melting of the master alloy, and stirred twice during the period. Meltable pure Zn and Mg blocks were added when the aluminum block was melted, and the addition of Mg was done to avoid excessive burning loss caused by contact with oxygen at high temperature. The aluminum alloy melt was refined and degassed with C2Cl6 at 710 °C, and the slag was removed after static 20 min. The aluminum alloy melt temperature was raised to 720 °C and poured into a metal mold preheated to 200 °C to obtain a casting of 1300 × 110 × 20 mm3. The chemical compositions of the four alloys were identified by inductively coupled plasma (PerkinElmer ICP-MS DRC II, Waltham, MA, USA). The specific results are shown in Table 2.
The metallographic samples were cut from the same position of each sample alloy. The six samples were ground to 3000 # with silicon carbide paper, then polished with 2.5 μm and 0.5 μm diamond slurry, respectively, until the surface was smooth and unscratched. The metallographic samples were then etched with Keller etching solution for 15 s. The microstructure and morphology of the alloy were observed with an optical microscope (OM, NikonMA200, Tokyo, Japan) and a scanning electron microscope (SEM, Zeiss EVO180, Oberkochen, Germany). The element distribution and composition of each phase were also analyzed using an energy dispersive spectrometer (EDS, BrukerXFlashDetector6|30, Karlsruhe, Germany), and the phase of each alloy was analyzed by an X-ray diffractometer (RigakuMiniFlex600, Tokyo, Japan).
Corrosion resistance was tested by the full immersion corrosion weight loss method. The experimental standard was carried out according to JB/T7901-1999, and the size of the sample was φ = 15 mm and h = 3 mm. Three parallel samples were selected for each group. Before the experiment, the sample was polished with 400# metallographic sandpaper, the oxide layer on the surface of the sample was removed, and then fine grinding was carried out with 800#,1200# and 1500# of metallographic sandpaper. The original samples were weighed and recorded using an analytical balance. After weighing, the samples of each group were soaked in 3.5 wt.% NaCl solution (25 °C, pH = 7) for a total time of 720 h. The sample was taken out every 240 h, rinsed with clean water, then heated to 80 °C with a mixed solution of CrO3, H3PO4, and pure water for 5~10 min. The corrosion products on the surface of the alloy sample were then removed, washed, dried, and weighed; the weight after corrosion was weighed using the FA2004N analytical balance produced by Shanghai Shunyu Hengping Co. Ltd.
The electrochemical experiment was carried out on a Chenhua CHI660e electrochemical workstation. The size of the electrochemical sample was 10 × 10 × 5 mm and the test surface of the sample was 10 × 10 mm. Before the test, the test surface of the sample was ground and polished, and the surface kept clean. In addition to the test surface, the other sides of the sample were encapsulated with acrylic powder, and a wire was used to connect the sample to the test electrode. The standard three-electrode system was used—the test alloy was used as the working electrode, the platinum plate as the counter electrode, and the saturated calomel electrode as the reference electrode. The solution used was 3.5 wt.% NaCl solution (25 °C, pH = 7).
3. Results and Discussion
3.1. Microstructure of As-Cast Alloy
The type and number of second phases in an aluminum alloy have a great influence on its properties. Figure 1 shows an optical microstructure diagram of aluminum alloy with different Ce content. The microstructure of Al-5Mg-3Zn-1Cu alloy is mainly composed of a cluster-like white α-Al matrix and a black second phase. The second phase in the microstructure of the alloy without Ce element in Figure 1a is relatively coarse, and there are a certain number of impurity phases and defects observed; the clustered α-Al in the alloy structure with a small amount of Ce element in Figure 1b becomes finer, and the microstructure of the second phase precipitated in the alloy is more uniform. This is because in the process of solidification, Ce elements gather at the front of the solid–liquid interface, resulting in the redistribution of solute elements, increase in undercooling, and intensification of the branching process, which makes the dendrite shape finer and refines the grain structure of the alloy. At the same time, it is also attributed to the purification effect of rare earth element Ce on grain boundaries. With continuous increase in the content of Ce element, especially in the alloy with the addition of 0.5% Ce element, an irregular polygonal crystalline phase appears in the microstructure, and the black second phase in the alloy structure becomes thicker. This may be due to the excessive addition of Ce, which leads to a preferential reaction of rare earth elements with other elements in the alloy, such as Cu or Mg, which consumes part of Ce, resulting in a decrease in the content of Ce at the front of the solid–liquid interface and immense weakening of the undercooling effect of the composition.
Four alloys were detected and analyzed by X-ray diffraction; the results are shown in Figure 2. The main phases in the alloy are α-Al, T-AlMgZnCu, and Al2Cu. In order to further explore the types and distribution of the second phase in the alloy, SEM and EDS were used to characterize the second phase in the alloy. Figure 3 shows the SEM diagram of Al-5Mg-3Zn-1Cu and Al-5Mg-3Zn-1Cu-0.5Ce alloys, from which we can see the microstructure of the Al-Mg-Zn-Cu alloy, with a large number of semi-continuous gray second phases distributed by the network, as well as other second phases. Energy Dispersive Spectroscopy (EDS) is used to analyze the precipitates; the results are shown in Table 3. It was found that the chemical composition of the precipitated phase with long reticular distribution was mainly composed of Al, Mg, Zn, and Cu, in which the content of Al was the highest. Combined with XRD patterns, the phase is determined to be a α-Al+T-AlMgZnCu eutectic phase, which has also been verified in previous work. At the same time, a precipitated phase with dark black irregular lump distribution was found in Al-5Mg-3Zn-1Cu alloy. Al and Cu elements with the highest content in this phase were analyzed by EDS, and the Al2Cu phase was found in XRD characterization; thus, it can be inferred that the precipitated phase is the Al2Cu phase. Similarly, by EDS analysis of each precipitated phase in the Al-5Mg-3Zn-1Cu-0.5Ce alloy, a α-Al+T-AlMgZnCu eutectic phase with long network distribution and a dark black block Al2Cu phase were also found. The difference is that with the increase in Ce content, an irregular polygonal phase appears in the alloy. EDS analysis found that there were a large number of Ce elements in this phase.
3.2. Results and Analysis of Corrosion Resistance
In order to further explore the effect of Ce on the corrosion resistance of Al-5Mg-3Zn-1Cu alloy, the weight loss method was used to calculate the corrosion rate of four alloys in different periods. Figure 4 shows the corrosion rates of four alloys under different corrosion periods (240 h, 480 h, 720 h). It can be seen that the corrosion rate of each alloy increases with the increase in corrosion cycle, while the corrosion rate of the alloy decreases with the increase in content of Ce (the corrosion rate of the alloy with 0.25% Ce content was found to be the lowest). The formula for calculating the corrosion rate of aluminum alloy is as follows:
where R is the corrosion rate, mm/a; M is the weight of the sample before the experiment, g; M1 is the weight of the sample after the experiment, g; S is the total area of the specimen, cm2; T is the experiment time, t; D is the density of the material, kg/m3.
Figure 5 shows the corrosion morphology of four alloys after being corroded in 3.5 wt.% NaCl solution for 720 h. After the corrosion products on the surface of aluminum alloy are removed, the microstructure and morphology of each alloy are observed, and it can be seen that the Ce content has an obvious effect on the corrosion morphology of the alloy. In the alloy without Ce, a large number of corrosion pits of irregular shape and deep depth are seen; with the addition of 0.15 wt.% Ce element, the number of pitting pits decreases and the depth becomes shallow. With further increase in Ce content, the number of corrosion pits on the alloy surface continues to decrease, which shows that Ce can significantly improve the corrosion resistance of the alloy.
Figure 6 shows the OCP (Open Circuit Potential) curve of Al-5Mg-3Zn-1Cu alloy without Ce and with 0.15% Ce. The Open Circuit Potential of both alloys shifted positively at the initial stage of corrosion and reached a stable state with time, but the potential shift of the alloy without Ce was higher than that of the alloy with Ce. At the same time, it was found that while the potential of the alloy is stable, the potential of the alloy without Ce fluctuates all the time. In comparison, the potential of the alloy with 0.15% Ce addition is stable, and the fluctuation in the OCP curve is caused by local corrosion. It can be seen that the addition of Ce reduces the local corrosion sensitivity of Al-5Mg-3Zn-1Cu alloy [20,21].
Figure 7 shows the potential polarization curves of Al-5Mg-3Zn-1Cu alloys with different Ce content in 3.5 wt.% NaCl solution, where the soaking time after obtaining the polarization curves was 7 min. It can be found that Ce has a great influence on the potential polarization curve of the alloy. The polarization curves of each alloy were analyzed using the CHI660e electrochemical workstation with its own fitting software. The specific results obtained are shown in Table 4. Without the addition of Ce, the corrosion potential of the alloy was −1.253 V. After the addition of 0.15 wt.% Ce to the alloy, the corrosion potential increased to −1.193 V. However, with further addition of Ce, a partial decrease in the corrosion potential of the alloy was found. The corrosion potential is a thermodynamic parameter and the smaller the value, the greater the tendency of the alloy to corrode. The corrosion current of the alloy is a kinetic parameter—the larger its value, the greater the corrosion tendency of the alloy. The corrosion current of the alloy without the addition of Ce element was 8.334 × 10⁻⁶ A, while the corrosion current of the alloy with the addition of 0.15 wt.% Ce was reduced to 5.8502 × 10⁻⁶ A, which was a great reduction compared to the alloy without Ce, indicating that the corrosion resistance of the alloy was improved. However, with further addition of Ce, the corrosion current of the alloy was found to continue to increase instead. The same situation occurred in each Rp. This is because when there are too many Ce elements in the alloy, large Ce-rich phases appear in the organizational structure of the alloy, and the appearance of such Ce-rich phases absorbs most of the Ce elements in the alloy; thus, the Ce in the rare earth–aluminum composite oxide film is reduced, and the corrosion performance of the alloy is also reduced. The addition of Ce elements increases the corrosion potential of the alloy, indicating that Ce can significantly improve the corrosion resistance of Al-5Mg-3Zn-1Cu alloy; however, there exists an optimal range for the addition of the element.
The experimental results show that the addition of Ce can effectively improve the corrosion resistance of Al-5Mg-3Zn-1Cu alloy. The Cl− formed by hydrolysis is an active particle with strong adsorption and strong erosion, which is the main cause of pitting corrosion. At first, Cl− is adsorbed at the active site on the surface of the aluminum alloy, which is enhanced at the incomplete or defective oxide film; then, the adsorbed ion reacts with the oxide film, the oxide film becomes thinner, and the bare alloy dissolves directly. Ce element has high electrochemical activity and unique physical and chemical properties [22]; therefore, it is easy to enter into a surface oxide film structure to form a rare earth-aluminum composite oxide film. This oxide film has high compactness, which can effectively reduce the corrosion tendency of the alloy [23]. At the same time, Ce can effectively reduce the impurities in Al-5Mg-3Zn-1Cu alloy; make the microstructure and physical state of the alloy more uniform, thus reducing the probability of local corrosion caused by corrosion microbattery due to microstructure inhomogeneity; and improve the corrosion resistance of the alloy to a certain extent. However, when there is too much Ce element in the alloy, a large chunk of a Ce-rich phase appears in the microstructure, absorbing a large amount of the element; therefore, Ce elements in the rare earth-aluminum composite oxide film is reduced, and the corrosion property of the alloy is decreased.
4. Conclusions
- After adding Ce element to the alloy, the main microstructure of the alloy was α-Al, T-AlMgZnCu, Al2Cu, and a bulk rich Ce phase.
- The addition of Ce can effectively refine the microstructure of the alloy. When the addition of Ce is 0.15 wt.%, the refinement effect is the most obvious, and the precipitated second phase is the most uniform.
- The results of weight loss experiments show that Ce can effectively reduce the corrosion rate of Al-5Mg-3Zn-1Cu alloy, and also increase the corrosion potential of Al-5Mg-3Zn-1Cu and reduce the local corrosion sensitivity of the alloy.
Author Contributions
Conceptualization, X.Z. and Y.S.; methodology, X.Z.; software, X.Z.; validation, X.Z., Y.S. and Y.J.; formal analysis, Q.W.; investigation, Y.S. and Y.J.; resources, Y.S. and Q.W.; data curation, X.Z.; writing—original draft preparation, X.Z. and Y.S.; writing—review and editing, X.Z., Y.S. and Y.J.; visualization, Q.W.; supervision, Y.J.; project administration, Y.S.; funding acquisition, Y.S. All authors have read and agreed to the published version of the manuscript.
Funding
This work was supported by the National Natural Science Foundation of China (Grant No. U1902220) and Yunnan Fundamental Research Projects (Grant No. 202101BE070001-041).
Institutional Review Board Statement
Not applicable.
Informed Consent Statement
Informed consent was obtained from all subjects involved in the study.
Data Availability Statement
Not applicable.
Conflicts of Interest
The authors declare that they have no known competing financial interests or personal relationships that could have appeared to influence the work reported in this paper.
References
- Li, Y.J.; Zhang, W.Z.; Marthinsen, K. Precipitation crystallography of plate-shaped Al 6(Mn, Fe) dispersoids in AA5182 alloy. Acta Mater. 2012, 60, 5963–5974. [Google Scholar] [CrossRef]
- Williams, J.C.; Starke, E.A., Jr. Progress in structural materials for aerospace systems. Acta Mater. 2003, 51, 5775–5799. [Google Scholar] [CrossRef]
- Yang, Y.; Tan, P.; Sui, Y.; Jiang, Y.; Zhou, R. Influence of Zr Content on Microstructure and Mechanical Properties of As-cast Al-Zn-Mg-Cu Alloy. J. Alloy. Compd. 2021, 867, 158920. [Google Scholar] [CrossRef]
- Barabi, A.; Zarei-Hanzaki, A.; Abedi, H.; Anoushe, A.; Cho, J.H. The correlation of macrostructure, microstructure, and texture with room temperature mechanical properties of a twinning-induced plasticity automotive steel after friction stir spot welding/processing. Steel Res. Int. 2018, 89, 1800245. [Google Scholar] [CrossRef] [Green Version]
- Prach, O.; Trudonoshyn, O.; Randelzhofer, P.; Körner, C.; Durst, K. Effect of Zr, Cr and Sc on the Al–Mg–Si–Mn high-pressure die casting alloys. Mater. Sci. Eng. A 2019, 759, 603–612. [Google Scholar] [CrossRef]
- Shin, S.S.; Lim, K.M.; Park, I.M. Characteristics and microstructure of newly designed Al–Zn-based alloys for the die-casting process. J. Alloy. Compd. 2016, 671, 517–526. [Google Scholar] [CrossRef]
- Tang, H.P.; Wang, Q.D.; Lei, C.; Ye, B.; Wang, K.; Jiang, H.Y.; Zhang, X.-F.; Lin, Z.; Zhang, J.-B. Effect of cooling rate on microstructure and mechanical properties of an Al-5.0Mg-3.0Zn-1.0Cu cast alloy. J. Alloy. Compd. 2019, 801, 596–608. [Google Scholar] [CrossRef]
- Pourbahari, B.; Emamy, M. Effects of La intermetallics on the structure and tensile properties of thin section gravity die-cast A357 Al alloy. Mater. Des. 2016, 94, 111–120. [Google Scholar] [CrossRef] [Green Version]
- Stemper, L.; Tunes, M.A.; Dumitraschkewitz, P.; Mendez-Martin, F.; Tosone, R.; Marchand, D.; Curtin, W.A.; Uggowitzer, P.J.; Pogatscher, S. Giant hardening response in AlMgZn(Cu) alloys. Acta Mater. 2021, 206, 116617. [Google Scholar] [CrossRef]
- Ji, S.; Watson, D.; Fan, Z.; White, M. Development of a super ductile diecast Al–Mg–Si alloy. Mater. Sci. Eng. A 2012, 556, 824–833. [Google Scholar] [CrossRef] [Green Version]
- Tang, H.P.; Wang, Q.D.; Luo, C.; Lei, C.; Liu, T.-W.; Li, Z.-Y.; Jiang, H.-P.; Ding, W.-J.; Fang, J.; Zhang, J.-W. Effects of aging treatment on the precipitation behaviors and mechanical properties of Al-5.0Mg-3.0Zn-1.0Cu cast alloys. J. Alloy. Compd. 2020, 842, 155707. [Google Scholar] [CrossRef]
- Liu, T.-W.; Wang, Q.-D.; Tang, H.-P.; Li, Z.-Y.; Lei, C.; Ebrahimi, M.; Jiang, H.-Y.; Wen-Jiang, D.I.N.G. Microstructure and mechanical properties of squeeze-cast Al−5.0Mg−3.0Zn−1.0Cu alloys in solution-treated and aged conditions. Trans. Nonferrous Met. Soc. China 2020, 30, 2326–2338. [Google Scholar] [CrossRef]
- Meng, C.; Zhang, D.; Zhuang, L.Z.; Zhang, J.S. Correlations between stress corrosion cracking, grain boundary precipitates and Zn content of Al–Mg–Zn alloys. J. Alloys Compd. 2016, 655, 178–187. [Google Scholar] [CrossRef]
- Carroll, M.C.; Gouma, P.I.; Mills, M.J.; Daehn, G.S.; Dunbar, B.R. Effects of Zn additions on the grain boundary precipitation and corrosion of Al-5083. Scr. Mater. 2000, 42, 335–340. [Google Scholar] [CrossRef]
- Yan, X.; Tan, P.; Sui, Y.; Jiang, Y.; Wang, Q. Effects of different holding pressures on the microstructure and mechanical properties of Al-5.9Zn-2.2Mg-1.8Cu alloy. J. Alloys Compd. 2022, 894, 162367. [Google Scholar] [CrossRef]
- Zhang, Z.; Chen, K.H.; Fang, H.C.; Qi, X.W.; Gang, L.I.U. Effect of Yb addition on strength and fracture toughness of Al-Zn-Mg-Cu-Zr aluminum alloy. Trans. Nonferrous Met. Soc. China 2008, 18, 1037–1042. [Google Scholar] [CrossRef]
- Zheng, Q.; Wu, J.; Jiang, H.; Zhang, L.; Zhao, J.; He, J. Effect of micro-alloying element La on corrosion behavior of Al-Mg-Si alloys. Corros. Sci. 2021, 179, 109113. [Google Scholar] [CrossRef]
- Zhu, Z.Y.; Zhang, X.H.; Chen, H.L. Effect of cerium on intergranular corrosion and exfoliation corrosion behavior of 7249 aluminum alloy. Trans. Mater. Heat Treat. 2014, 35, 74–78. [Google Scholar]
- Hu, G.; Zhu, C.; Xu, D.; Dong, P.; Chen, K. Effect of cerium on microstructure, mechanical properties and corrosion properties of Al-Zn-Mg alloy. J. Rare Earths 2021, 39, 208–216. [Google Scholar] [CrossRef]
- Ly, R.; Karayan, A.I.; Hartwig, K.T.; Castaneda, H. Insights into the electrochemical response of a partially recrystallized Al-Mg-Si alloy and its relationship to corrosion events. Electrochim. Acta 2019, 308, 35–44. [Google Scholar] [CrossRef]
- Orłowska, M.; Ura-Bińczyk, E.; Olejnik, L.; Lewandowska, M. The effect of grain size and grain boundary misorientation on the corrosion resistance of commercially pure aluminium. Corros. Sci. 2019, 148, 57–70. [Google Scholar] [CrossRef]
- Zhang, Y.; Wei, F.; Mao, J.; Niu, G. The difference of La and Ce as additives of electrical conductivity aluminum alloys. Mater. Charact. 2019, 158, 109963. [Google Scholar] [CrossRef]
- Feng, Y.; Li, X.; Wang, R.; Peng, C.; Liu, L. Influence of cerium on microstructures and electrochemical properties of Al-Mg-Sn-Hg anode materials for seawater battery. J. Rare Earths 2015, 33, 1010–1016. [Google Scholar] [CrossRef]
Figure 1.
Microstructure of Al-5Mg-3Zn-1Cu alloy with different Ce content: (a) 0.0 Ce wt.%, (b) 0.15 Ce wt.%, (c) 0.25 Ce wt.%, (d) 0.50 Ce wt.%.
Figure 1.
Microstructure of Al-5Mg-3Zn-1Cu alloy with different Ce content: (a) 0.0 Ce wt.%, (b) 0.15 Ce wt.%, (c) 0.25 Ce wt.%, (d) 0.50 Ce wt.%.
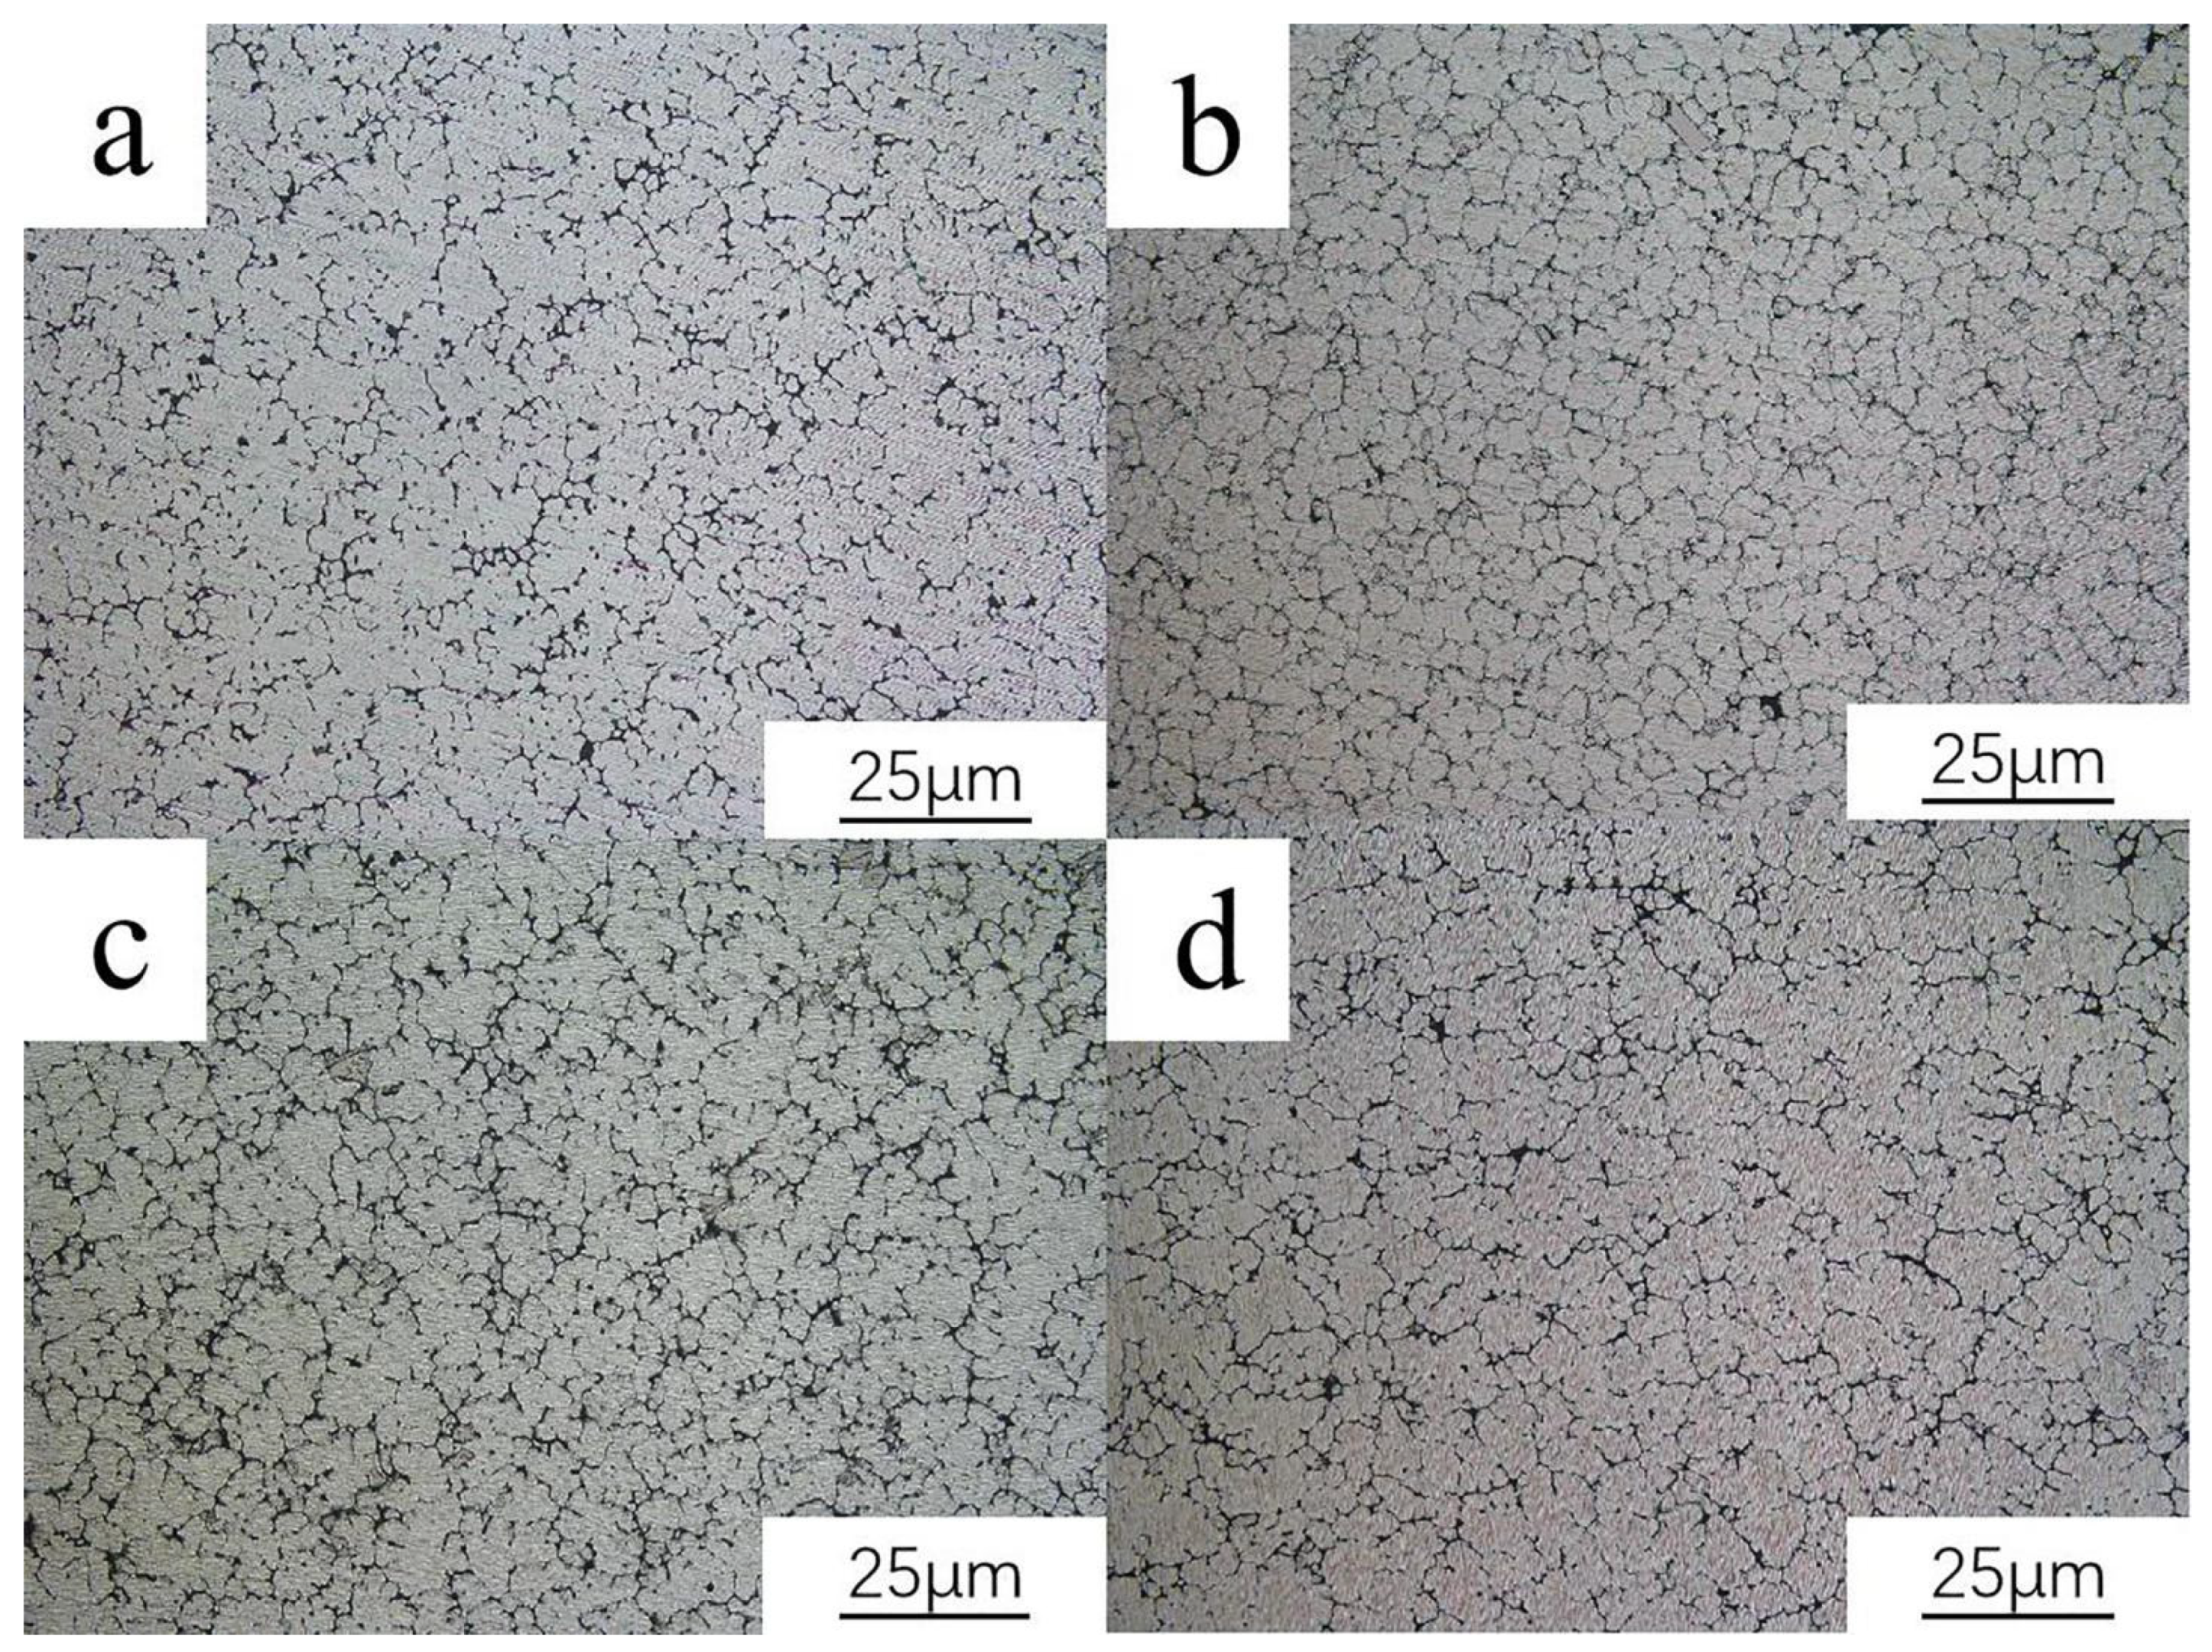
Figure 2.
XRD patterns of Al-5Mg-3Zn-1Cu alloys with different Ce content.

Figure 3.
SEM diagram of Al-5Mg-3Zn-1Cu alloy with different Ce content: (a) 0.0 Ce wt.%, (b) 0.25 Ce wt.%.
Figure 3.
SEM diagram of Al-5Mg-3Zn-1Cu alloy with different Ce content: (a) 0.0 Ce wt.%, (b) 0.25 Ce wt.%.
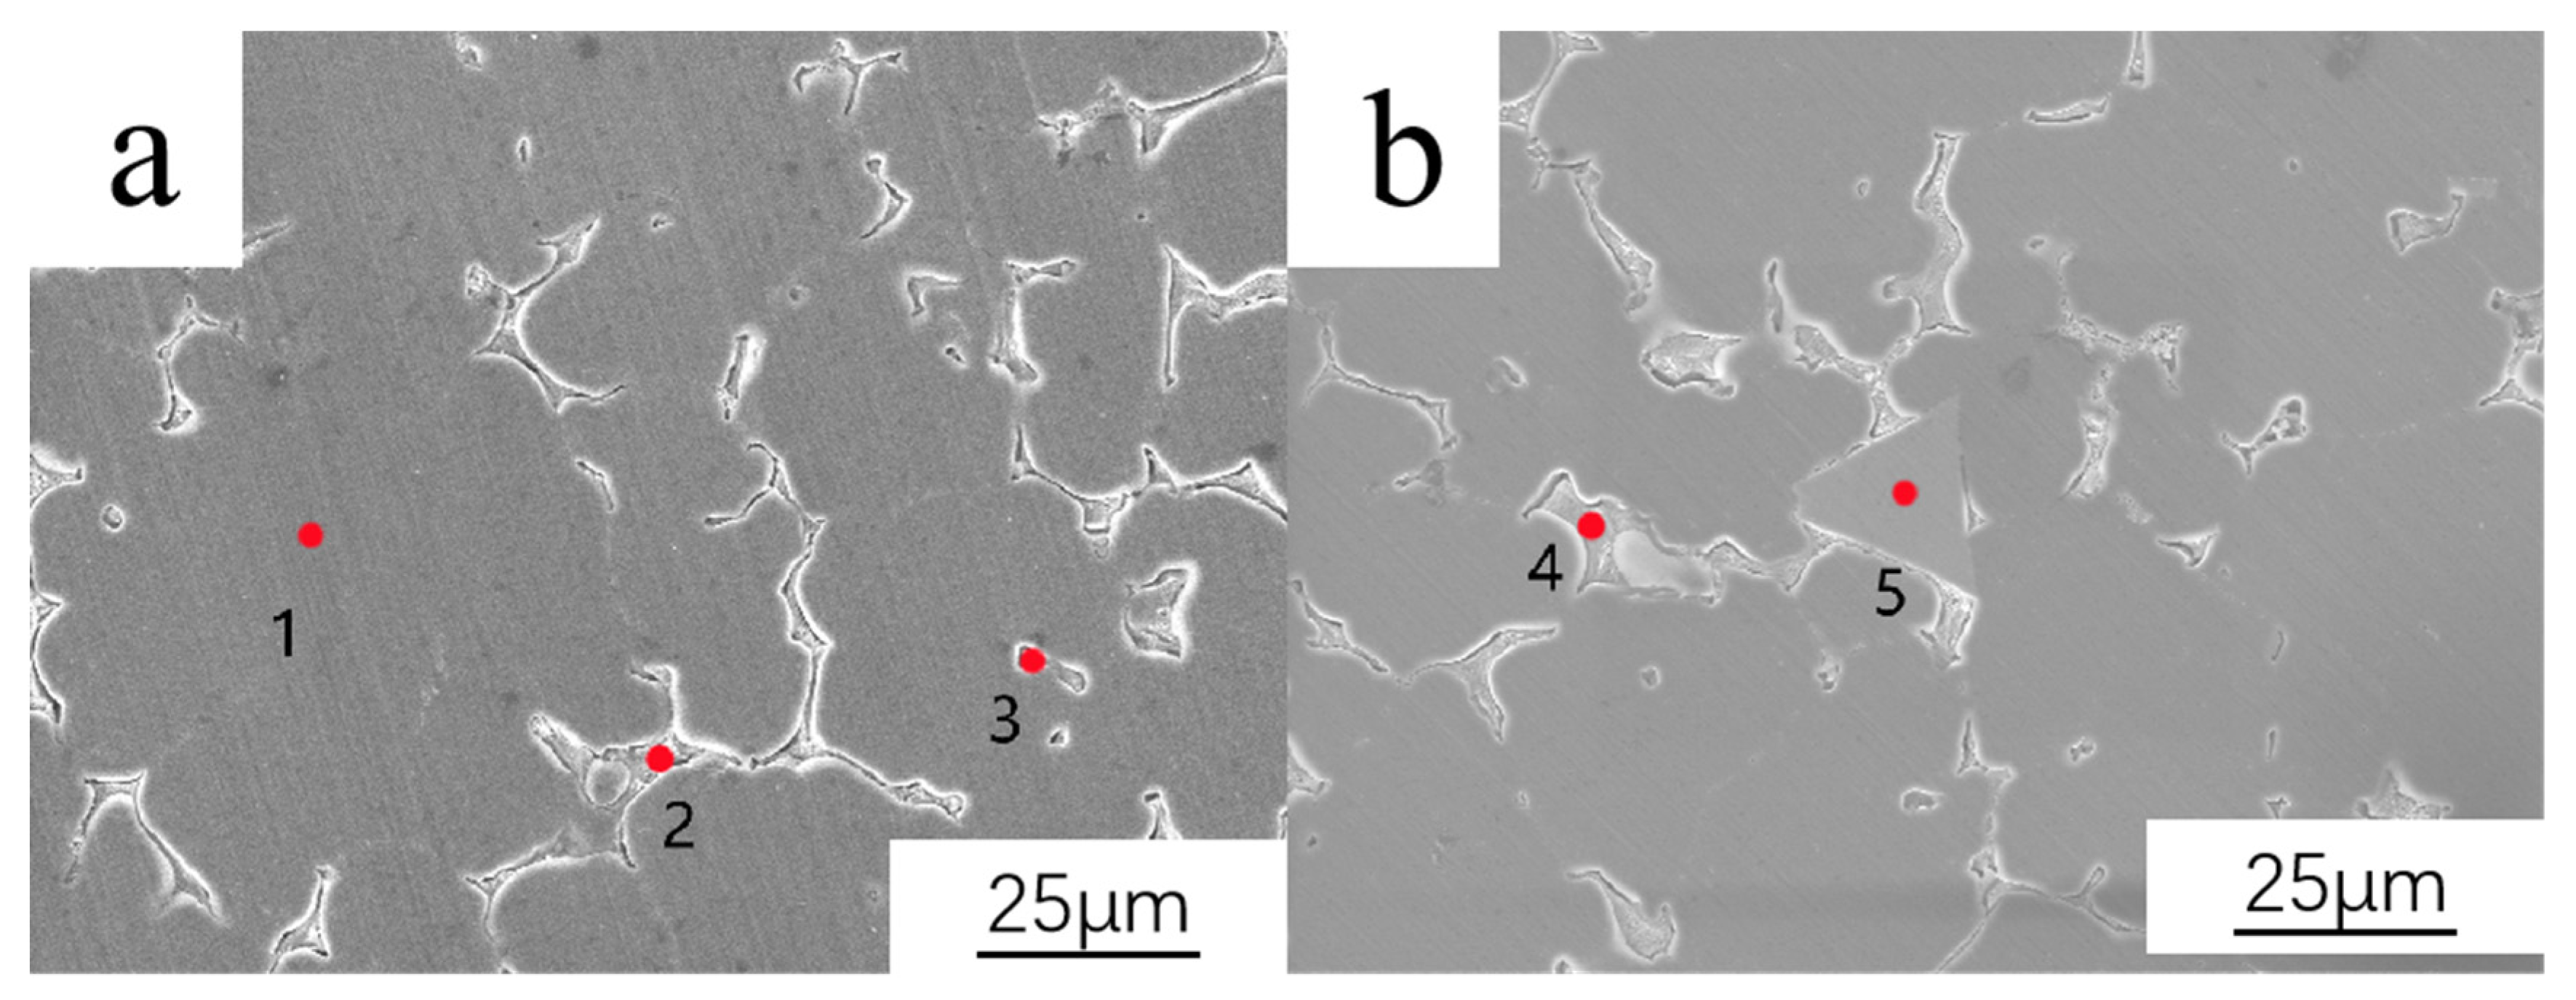
Figure 4.
Corrosion rate diagram of Al-5Mg-3Zn-1Cu alloy with different Ce content.
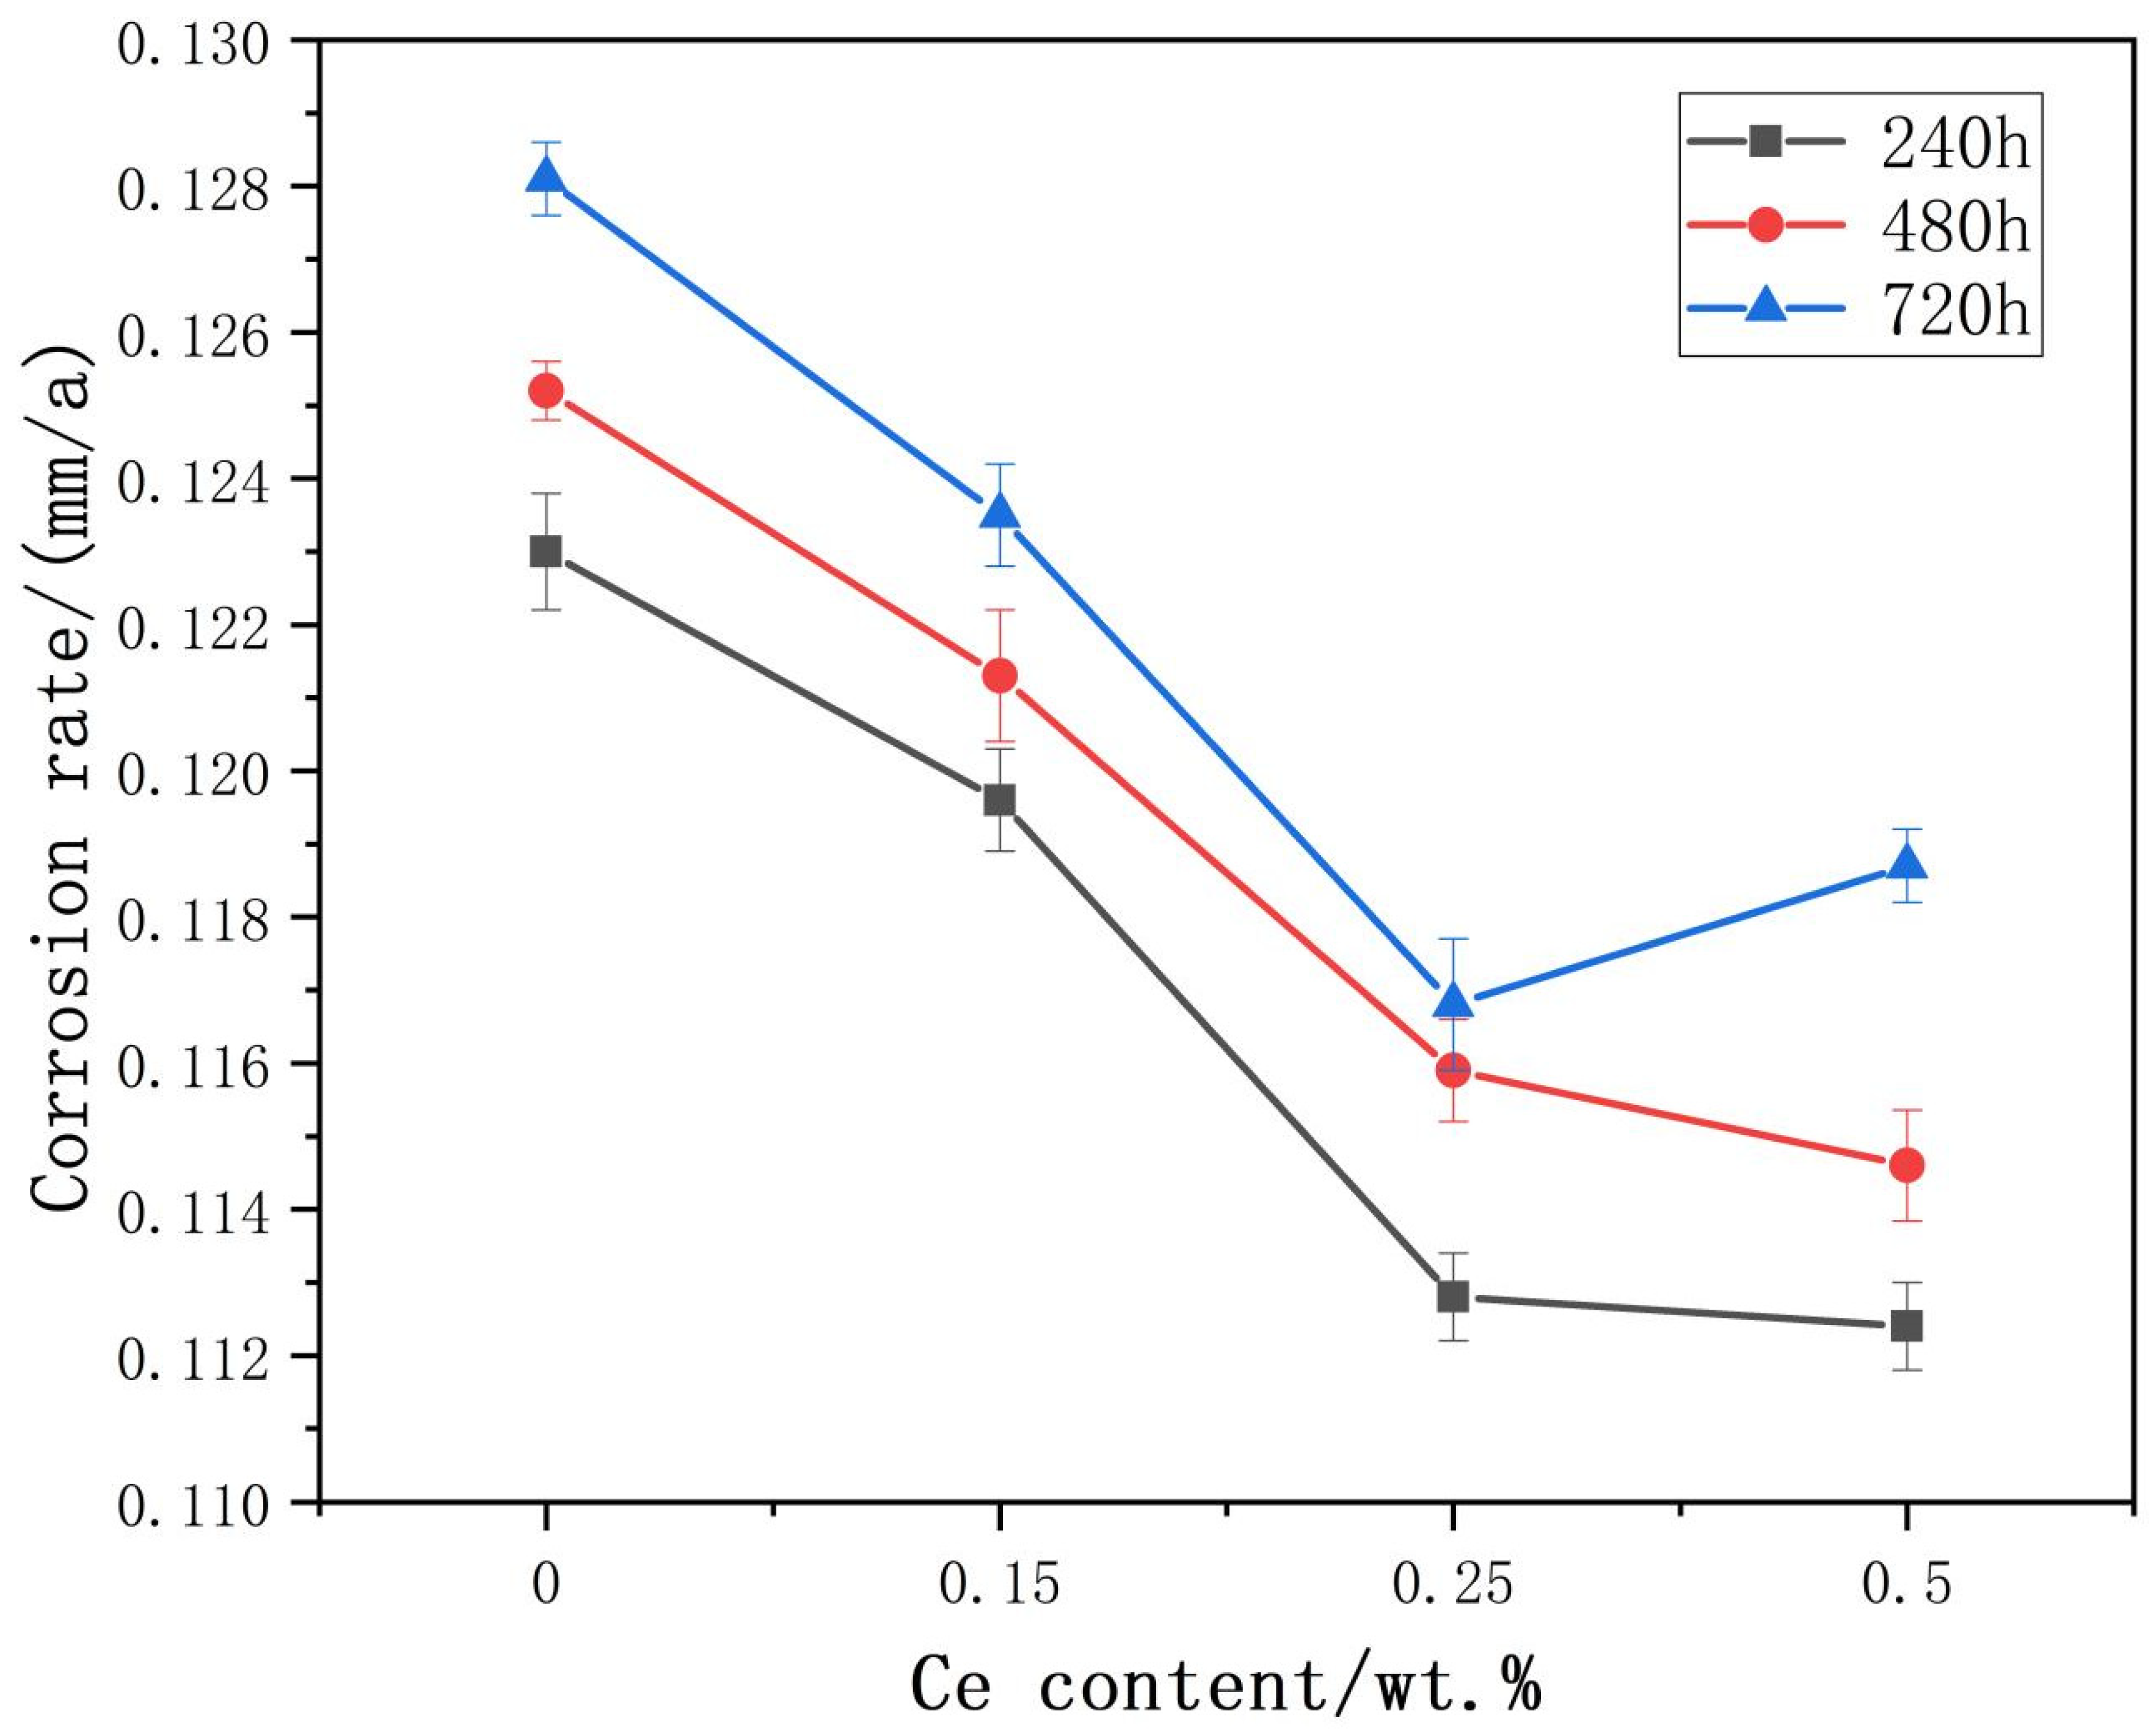
Figure 5.
Microstructure of Al-5Mg-3Zn-1Cu alloy with different Ce content after removal of corrosion products:(a) 0.0 Ce wt.%, (b) 0.15 Ce wt.%, (c) 0.25 Ce wt.%, (d) 0.50 Ce wt.%.
Figure 5.
Microstructure of Al-5Mg-3Zn-1Cu alloy with different Ce content after removal of corrosion products:(a) 0.0 Ce wt.%, (b) 0.15 Ce wt.%, (c) 0.25 Ce wt.%, (d) 0.50 Ce wt.%.

Figure 6.
Open circuit potential curve for Al-5Mg-3Zn-1Cu alloy without Ce and with 0.15% Ce.

Figure 7.
Potentiodynamic polarization curves of Al-5Mg-3Zn-1Cu alloys with different additive amounts of Ce.
Figure 7.
Potentiodynamic polarization curves of Al-5Mg-3Zn-1Cu alloys with different additive amounts of Ce.


Table 1.
Technical parameters of a resistance furnace (CHOY SG2-5-10).
| Parameter Name | Unit | Parameter Value |
|---|---|---|
| Rated power | Kw | 5 |
| Rated voltage | Volt | 220 |
| Rated temperature | °C | 1000 |
| Connection method of heating element | / | Parallel connection |
| Heating time | Min | ≤50 |
| Loss of power | Kw | ≤1.2 |
| Furnace size | Mm | Φ200 × h250 |
| Weight | Kg | 80 |
Table 2.
Chemical composition of cast Al-Mg-Zn-Cu-xCe alloys (wt.%).
| Alloys | Mg | Zn | Cu | Ce | Al |
|---|---|---|---|---|---|
| Al-5Mg-3Zn-1Cu | 5.21 | 2.94 | 0.94 | \ | Bal. |
| Al-5Mg-3Zn-1Cu-0.15Ce | 4.94 | 2.91 | 1.05 | 0.12 | Bal. |
| Al-5Mg-3Zn-1Cu-0.25Ce | 4.92 | 3.12 | 0.98 | 0.27 | Bal. |
| Al-5Mg-3Zn-1Cu-0.50Ce | 5.18 | 3.06 | 0.96 | 0.53 | Bal. |
Table 3.
EDS point scanning element content (element content, at.%).
| Element | Al | Mg | Zn | Cu | Ce | Phase |
|---|---|---|---|---|---|---|
| 1 | 97.00 | 2.61 | 0.17 | 0.22 | \ | ɑ-Al |
| 2 | 79.91 | 10.08 | 3.89 | 4.89 | \ | T-AlMgZnCu |
| 3 | 78.76 | 0.04 | 3.25 | 17.89 | 0.06 | Al2Cu |
| 4 | 82.25 | 9.45 | 2.95 | 5.22 | 0.13 | T-AlMgZnCu |
| 5 | 91.24 | 4.23 | 1.22 | 0.04 | 3.27 | AlMgZnCe |
Table 4.
The electrochemical parameters of Al-5Mg-3Zn-1Cu alloys with different Ce content.
| Alloys | Ecorr(V) | Icorr(10−6 A) | Rp(Ω) |
|---|---|---|---|
| Al-5Mg-3Zn-1Cu | −1.253 | 8.334 | 3596 |
| Al-5Mg-3Zn-1Cu-0.15Ce | −1.193 | 5.850 | 4413 |
| Al-5Mg-3Zn-1Cu-0.25Ce | −1.231 | 7.253 | 4193 |
| Al-5Mg-3Zn-1Cu-0.50Ce | −1.234 | 7.769 | 4136 |
Publisher’s Note: MDPI stays neutral with regard to jurisdictional claims in published maps and institutional affiliations. |
© 2022 by the authors. Licensee MDPI, Basel, Switzerland. This article is an open access article distributed under the terms and conditions of the Creative Commons Attribution (CC BY) license (https://creativecommons.org/licenses/by/4.0/).
Share and Cite
MDPI and ACS Style
Zhang, X.; Sui, Y.; Jiang, Y.; Wang, Q. Effect of Ce on the Microstructure and Corrosion Resistance of Al-5Mg-3Zn-1Cu Alloy. Metals 2022, 12, 371. https://doi.org/10.3390/met12030371
AMA Style
Zhang X, Sui Y, Jiang Y, Wang Q. Effect of Ce on the Microstructure and Corrosion Resistance of Al-5Mg-3Zn-1Cu Alloy. Metals. 2022; 12(3):371. https://doi.org/10.3390/met12030371
Chicago/Turabian StyleZhang, Xingwen, Yudong Sui, Yehua Jiang, and Qudong Wang. 2022. "Effect of Ce on the Microstructure and Corrosion Resistance of Al-5Mg-3Zn-1Cu Alloy" Metals 12, no. 3: 371. https://doi.org/10.3390/met12030371
Note that from the first issue of 2016, this journal uses article numbers instead of page numbers. See further details here.