Article

Effects of the Al Content on the Evolution of Quadruple Basal Textures in Mg-xAl-1Zn-0.1Mn-0.1Ca-0.2Y Alloy Sheets Processed via Cold Rolling and Annealing

1
Department of Magnesium, Korea Institute of Materials Science, Changwon 51508, Korea
2
Department of Materials Science and Engineering, Chungnam National University, Daejeon 34134, Korea
3
Advanced Materials Engineering, University of Science and Technology, Daejeon 34113, Korea
*
Author to whom correspondence should be addressed.
Metals 2022, 12(3), 499; https://doi.org/10.3390/met12030499
Submission received: 14 February 2022 / Revised: 8 March 2022 / Accepted: 14 March 2022 / Published: 16 March 2022

Abstract

:
The effects of the Al content on the texture evolution of Mg-xAl-1Zn-0.1Ca-0.2Y alloy sheets fabricated via hot rolling, cold rolling, and subsequent annealing were systematically investigated. A lower Al content led to a higher number of free Ca solute atoms that contributed to co-segregation with Zn, delaying the recrystallization of the cold-rolled sheets during annealing and changing the basal pole figure shape of the annealed sheets. A quadruple basal texture, in which the positions of the four basal poles were developed at tilt angles of ±25° to the rolling direction (RD) and ±40° to the transverse direction (TD) from the normal direction, was obtained in the annealed Mg sheets. A smaller amount of Al caused an increase in the intensity of the main peaks along the TD but a decrease in the intensity along the RD. As a result, the texture of the annealed sheets gradually changed from RD-split to diamond and TD-split in the (0002) pole figure, as shown by the relative comparison of pole intensities in both directions. This texture change strongly affects the Schmid factor for the basal slip. For the alloys with an off-basal texture investigated in this study, as the maximum intensity of the basal poles increased, the average Schmid factor of the basal planes also increased, making the basal slip easier.

1. Introduction

Significant research attention has been devoted to lightweight structural materials, such as Mg alloys, to reduce the weight of automobiles and thereby increase the energy efficiency and mitigate CO2 emissions. However, Mg alloys exhibit poor room-temperature (RT) formability owing to the lack of available slip systems and the strong basal texture formed during the rolling process, where the latter is due to the hexagonal close-packed (HCP) crystal lattice. This limits the widespread application of Mg alloys in various industrial fields [1,2,3]. The commercial wrought AZ31 Mg alloy exhibits a relatively low yield strength, elongation-to-failure, and Erichsen index (IE) values of 170–179 MPa, ~22%, and 3.4–4.7 mm at RT, respectively. To improve the RT formability of Mg alloy sheets, studies have focused on high-temperature solution treatment, complex rolling processes, grain refinement, and the weakening of the basal texture [4,5,6,7,8,9].
Some researchers have attempted to modify and improve the texture of Mg sheets by adding alloying elements, such as rare earth elements (REEs) and non-REEs, including Ca, Zn, and Zr [8,10,11,12]. In the Mg-3Y alloy, the addition of Y was very effective for obtaining a large number of compression twins, secondary twins, and pyramidal <c+a> slip. This causes homogeneous deformation and a weaker basal texture, improved work hardening, and enhanced ductility [2]. Moreover, the addition of Zn and Y can significantly reduce the stacking fault energy (SFE), facilitate the activation of prismatic slip systems, and form segregation zones along stacking faults [13]. In contrast to Mg-3Y alloy sheets with texture spread in the rolling direction (RD), a unique off-basal texture in which the position of basal poles is tilted by ±35° from the normal direction (ND) toward the transverse direction (TD) is typically obtained in Mg-Zn-Y alloy sheets through the activation of prismatic slip systems. This results in excellent RT formability [14], and Chino et al. [15] reported that a Mg-1.5Zn-0.2Y alloy sheet fabricated via extrusion and rolling exhibited a significant IE value of 9.2 mm with a yield strength of 139 MPa.
Ca has been employed as a more economical alloying element to weaken the texture of Mg alloys. Similar to some REEs, Ca can reduce the generalized SFE for all slip modes in Mg alloys and the energy barrier for <a> dislocations to cross slip in nonbasal planes, decreasing the difference in the critical resolved shear stress (CRSS) between nonbasal and basal slips [16]. Additionally, for Mg-Zn-Ca ternary alloys, the co-segregation of Zn and Ca decreases the grain-boundary energy and induces a grain-boundary pinning effect during recrystallization and grain growth. This reduces the grain-boundary mobility and inhibits basal-texture orientation [1,17].
Al is a widely used alloying element in Mg alloys because of its significant strengthening effect. In AZ series’ alloys, increasing the Al content to 6 wt.% resulted in edge cracking, whereas Al contents of 3 and 4 wt.% promoted rolling during hot rolling [18]. In contrast to Mg-Zn-based alloys, the addition of Ca and REEs does not have a substantial effect on texture weakening and formability improvement in Mg-Al-based alloys, because Al atoms have a strong affinity for Ca or REE atoms. Therefore, these elements were consumed to form intermetallic compounds, preventing SFE reduction or a co-segregation effect at the grain boundary. However, dilute Mg-Al-Zn-Ca-based alloys show excellent RT formability, comparable to that of Mg-Zn-Ca and Mg-Zn-Y alloys [15,19,20,21,22]. Trang et al. [22] recently developed an AZMX3100 alloy sheet via twin-roll casting, hot rolling at 300 °C, and annealing at 350 °C for 1 h, which exhibited an IE value of 8.0 mm with a high yield strength of 219 MPa. They reported that the changes in texture consisting of a broadening of basal poles along the TD and a splitting of basal poles along the RD, resulting from the co-segregation of Zn and Ca along the grain boundaries, were responsible for the enhanced formability. Bian et al. [20] reported that a quadruple basal texture, in which the position of basal poles was tilted by ±10° from the ND toward the RD and tilted by ±40° from the ND toward the TD, was formed in the AZMX1110 alloy sheet. They found that Ca, Al, and Zn were segregated along the grain boundaries, forming a weak quadruple basal texture.
As such, it can be seen that the effects of Ca and REE on texture formation of AZ series magnesium alloys are different depending on the Al content. Therefore, the investigation of the effect of changes in the Al content on texture evolution during thermomechanical processes, especially the formation of a quadruple basal texture, is necessary. In this study, we investigated the effect of the Al content on the texture evolution of Mg-xAl-1Zn-0.1Mn-0.1Ca-0.2Y (x = 1, 2, and 3 wt.%) processed by cold rolling and annealing.

2. Materials and Methods

Commercial pure-Mg, pure-Zn, Mg-20Ca, Al-10Mn, and Mg-30Y (all in wt.%; all compositions hereinafter are also expressed in wt.% unless otherwise specified) were used to produce Mg-xAl-1Zn-0.1Mn-0.1Ca-0.2Y (x = 1, 2, 3) alloys. The alloys with different Al contents were denoted as AZXW1100, AZXW2100, and AZXW3100. The alloys were melted at 720 °C in an induction furnace, using a graphite crucible, under a protective gas (10% SF6 and 90% CO2), to prevent the ignition of the melt. The melt was poured into a cast-iron mold that was preheated to 200 °C and then cooled to RT. The chemical compositions of the as-prepared alloys were measured by using inductively coupled plasma–optical emission spectroscopy (ICP–OES), as listed in Table 1. The cast slabs were homogenized at 450 °C for 24 h and then machined to a thickness of 15 mm, width of 190 mm, and length of 150 mm. The slabs were hot-rolled at 420 °C, at a reduction rate of 30%/pass to achieve a total reduction of 90%, and then cooled under an air atmosphere. The hot-rolled sheets were then cold-rolled at a reduction rate of 3–5%/pass, with a total reduction of 20%. The rotation speed of the rollers was 5 m/min, and the final thickness of the cold-rolled sheets was approximately 1.2 mm. Subsequently, the rolled sheets were annealed in a muffle furnace at 300 °C for 10–30 min to obtain a fully recrystallized microstructure.
The microstructure was characterized by using optical microscopy (OM) and electron backscatter diffraction (EBSD). For these analyses, the samples were polished by using an OP-S suspension and a polishing lubricant and then etched by using a solution comprising 3.0 g picric acid, 10 mL acetic acid, 10 mL distilled water, and 80 mL ethanol. The texture was measured by using X-ray diffraction (XRD) with Cu-Kα radiation at 40 kV/100 mA, and all EBSD data were analyzed by using the Tex-SEM Laboratories orientation imaging microscopy (TSL-OIM) software (version 7.0). Incomplete pole figures of five different planes ( 10 1 ¯ 0 ), (0002), ( 10 1 ¯ 1 ), ( 10 1 ¯ 2 ), and ( 10 1 ¯ 3 ) were obtained, and these pole figures were normalized to correct for the defocusing effect. Complete pole figures were calculated by using TexTools (version 3.3). Tensile specimens with a gauge length of 25 mm and width of 6 mm along the RD, 45° direction, and TD were machined from the annealed sheets. Tensile tests were conducted at an initial strain rate of 10−3/s at RT, using an INSTRON-5982 universal testing machine. Erichsen cupping tests were conducted by using specimens with a diameter of 100 mm at RT, where the punch diameter, punch speed, and blank-holder force were 20, 6, and 10 kN, respectively.

3. Results and Discussion

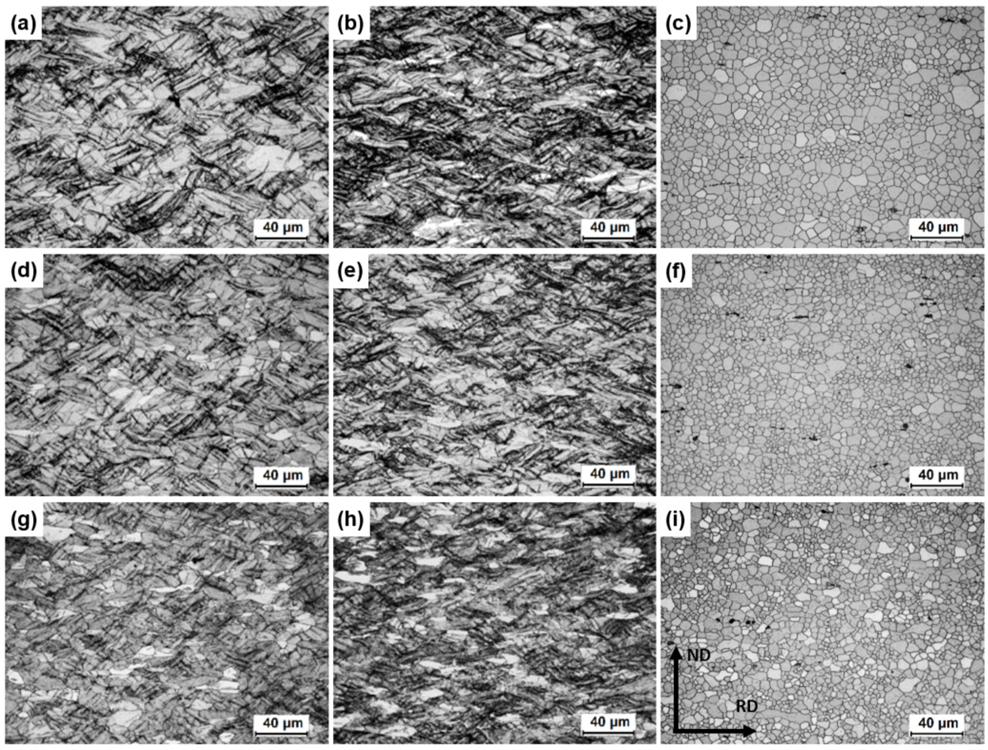
3.1. Microstructural Changes with the Varying Al Content

Figure 1 shows optical micrographs of the AZXW1100, AZXW2100, and AZXW3100 sheets in the hot-rolled, cold-rolled, and annealed states. The samples heated to 420 °C were rolled by using a twin-roller with a surface temperature equivalent to RT, resulting in a large fraction of deformed structures, including deformation twins and shear bands, although the sheets were hot-rolled. By looking at Figure 1a,d,g, we see that the fraction of shear bands decreased with the increasing Al content, and the cold-rolled sheets had a larger fraction of shear bands than the hot-rolled sheets. The change in the fraction of shear bands with the Al content is related to the concentration of Ca solute atoms in the matrix. Because of the deformation twins and their aggregates, shear bands form in the late stage of uniform strain application or in the plastic instability region. In Figure 2, when comparing the EBSD-IPF maps showing the shear bands in black region due to a result of the low CI (confidence index) values due to severe deformation, we see that the fraction of shear bands in the cold-rolled sheets decreases with the decreasing Al content, indicating that a decrease in Al content results in an enhancement in the plastic instability.
Figure 3 shows a quantitative analysis of Ca and Y solutes dissolved in the matrix of hot-rolled samples homogenized at 420 °C for 8 h, determined using an electron probe microanalyzer (EPMA). The amounts of Ca and Y solutes obtained via thermodynamic calculations under the equilibrium condition at 420 °C, using the FactSage software for the chemical compositions listed in Table 1, are also included in Figure 3. Differences between the calculated and measured values originate from the resolution limit of the EPMA; however, the amount of Ca solutes dissolved in the matrix evidently increases as the Al content decreases, but on the other hand, the amount of Y solutes was almost unchanged. As mentioned previously, the co-segregation of Zn and Ca atoms at grain boundaries results in texture weakening by activating non-basal dislocation slips during deformation (cold rolling in this study) and impeding grain growth. This confirmed that a reduction in the Al content is effective in increasing the amount of Ca solute atoms available to contribute to the co-segregation with Zn. The recrystallized microstructures after annealing at 300 °C are shown in Figure 1c,f,i, where the average grain sizes of the AZXW3100, AZXW2100, and AZXW1100 sheets are 5.14, 4.09, and 4.16 μm, respectively.
Figure 4 shows the EBSD results for the inverse pole figure (IPF) maps and pole figures of the annealed sheets. The EBSD data were obtained from the center of the RD–ND plane, but the IPF maps and pole figures were constructed in the RD–TD plane for comparison with the X-ray pole figures. There is no color gradient within a single grain in the IPF maps of the three alloy sheets, indicating the absence of the residual stress in the annealed samples. The black areas in the IPF maps correspond to the second phase. The average grain size was measured from the IPF maps in Figure 4a–c. The size decreased as the Al content decreased from 3 to 2 wt.%, whereas negligible difference in size was observed when the Al content changed from 2 to 1 wt.%. In the IPF maps, red-colored grains indicate a strong basal texture, whereas green, blue, and purple grains indicate TD texture components. Larger area fractions of green, blue, and purple grains were observed in the annealed AZXW2100 and AZXW1100 sheets compared to the annealed AZXW3100 sheet. This indicates that a decrease in the Al content results in the development of TD texture components in the basal pole figure.

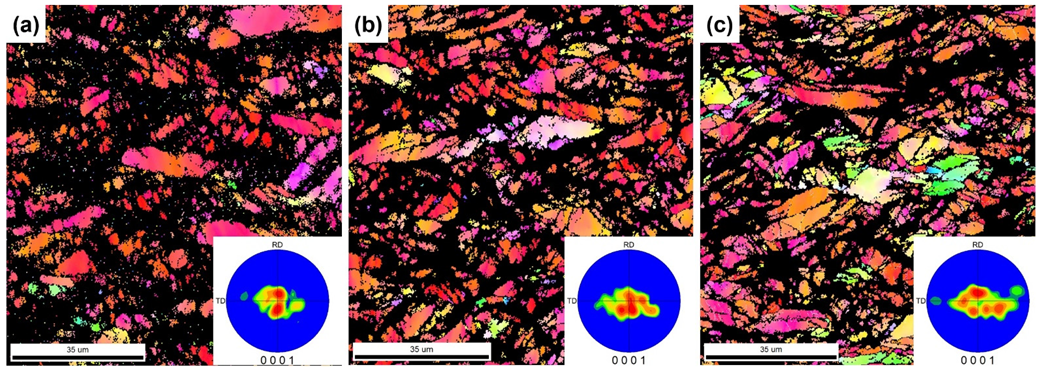
3.2. Effect of the Al Content on the Texture Evolution

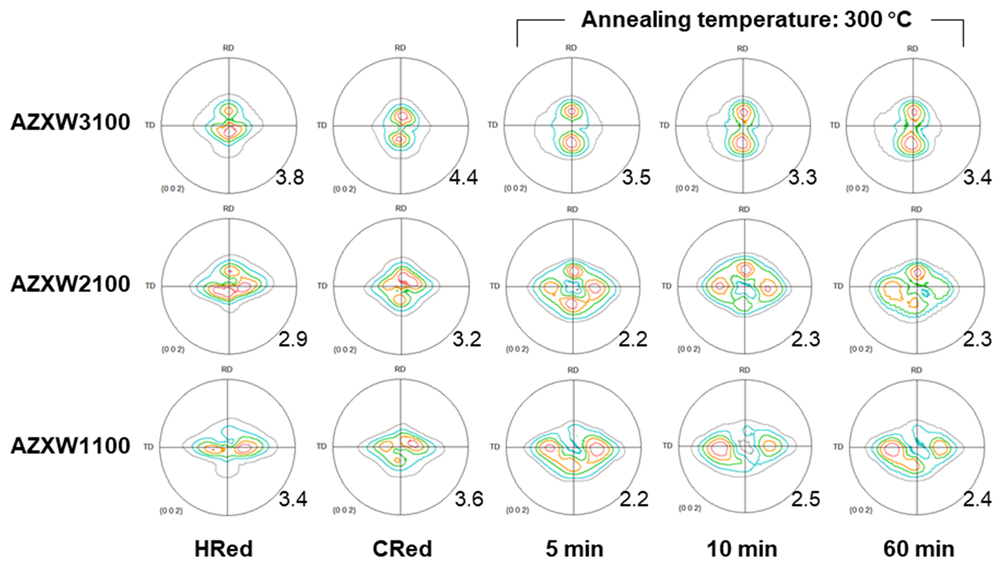
3.2.1. Texture Changes Due to Rolling and Annealing

Figure 5 shows the changes in the basal pole figures measured by using XRD after cold rolling and subsequent recrystallization annealing. The textures obtained by using XRD were similar to those obtained via EBSD. When comparing the basal pole figures of sheets annealed for 10 min, we can see that the main peak positions changed from RD-split to diamond-shaped to TD-split with the decreasing Al content. Although the alloys investigated in this study contain only 0.1 wt.% Ca, the TD-split basal texture can be obtained by controlling the Al content. The TD-split texture observed in the annealed AZXW1100 alloy sheet in this study is normally observed in HCP metals (e.g., Ti and Zr), where the slip of < 11 2 ¯ 0 > dislocations on the { 10 1 ¯ 0 } prismatic plane is dominant [23]. Although the most dominant slip system in Mg alloys is {0001}< 11 2 ¯ 0 >, a TD-split texture has also been reported for Mg alloys with the addition of Zn and REEs or Ca. First-principles calculations were used to calculate the SFE of the Mg-Zn-Y alloy, confirming that the SFE decreased significantly with the addition of Zn and Y. This facilitated non-basal dislocation slip by hindering the dislocation movement on the basal plane and by forming segregation zones along the (0001) planes [24,25,26,27]. This impeded grain growth, retained the orientation of the recrystallized grains, and weakened the texture, thus allowing the development of TD texture components.
From the calculation results for Ca solutes (Table 2) dissolved in the matrix at 420 °C, it can be concluded that the critical Ca amount required to form the TD-split texture component was 0.008 wt.%. Guo [28] reported that the AZ31 + 0.5 wt.% Ca alloy exhibited an RD-split texture during hot rolling, similar to the hot-rolled AZXW3100, whereas Chaudry [21] reported the formation of TD-split basal texture for the same alloy. From Table 2, for AZXW2100 and AZXW1100 alloy sheets, the TD-split texture component can be formed with the addition of a small amount of Ca as low as 0.1 wt.%.
Figure 5 also shows that, while cold rolling did not cause a significant change in the shape of the texture, the maximum intensity of the basal pole figure increased. A considerable change in texture occurred after subsequent annealing. The maximum intensity of the basal pole figures in the AZXW1100 and AZXW2100 sheets, with TD texture components, was lower than that of the AZXW3100 sheet with only RD texture components. Increasing the annealing time from 5 to 60 min resulted in insignificant changes to the observed maximum intensity for all sheets.

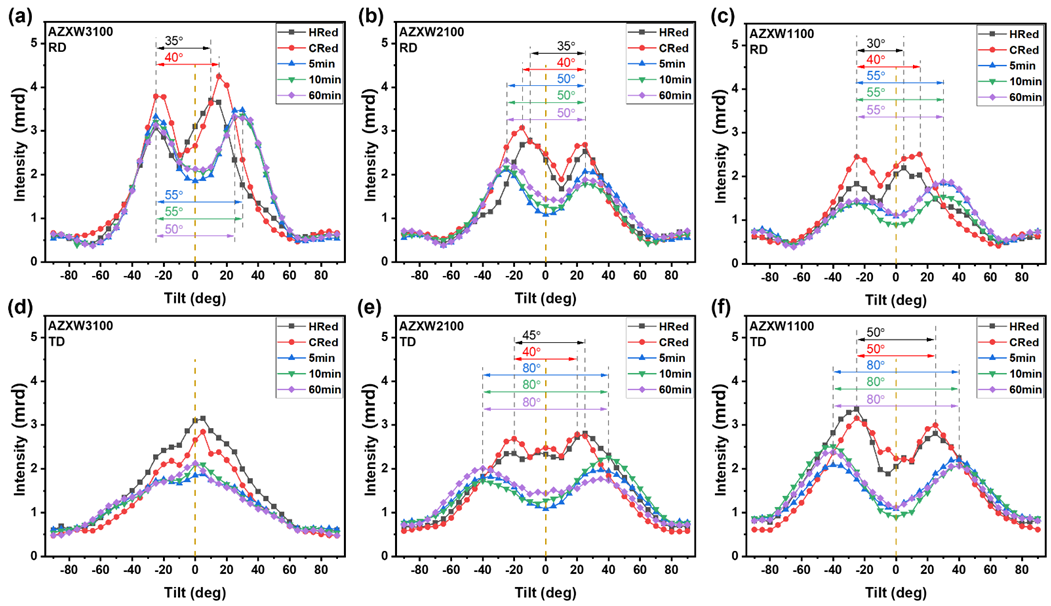
3.2.2. Variation in the Basal Pole Intensity with the Al Content

The intensity of the basal pole figures in Figure 5 can be also plotted as the change of the tilt angle from the ND toward the RD or TD. As shown in Figure 6a, the hot-rolled AZXW3100 sheet had a much higher intensity than the AZXW1100 and AZXW2100 sheets, and the peak position of the basal poles was tilted away from the ND by ±20°, toward the RD. The shape of the basal poles did not change, and the maximum intensity increased from 3.8 to 4.4 mrd by cold rolling. The cold-rolled AZXW3100 sheet exhibited the highest maximum intensity among all the samples. The angle between the two peaks in the intensity profile of the basal poles along the RD increased to 55° for the annealed AZXW3100 sheet. Significantly, there was only one peak along the TD for the AZXW3100 alloy (Figure 6d). For the hot-rolled AZXW2100 sheet, the angles between the two peaks in the intensity profile of the basal poles along the RD and TD were 35° and 45°, respectively. Cold rolling causes the angle between the two peaks along the RD to increase by 5°, whereas, along the TD, a decrease of 5° was observed, and the maximum intensity increased from 2.9 to 3.2 mrd. As shown in Figure 6b,e, the annealing treatment increased the angle between the two peaks in the intensity profile of the basal poles to 50° and 80° along the RD and TD, respectively, and the maximum intensity significantly decreased from 3.2 to 2.2 mrd. In Figure 6f, the peak intensity of the basal pole figure in the hot-rolled AZXW1100 sheet is tilted away from the ND by ±25° toward the TD. For the cold-rolled AZXW1100 sheet, the angle between the two peaks of the basal poles along the TD did not increase, whereas the maximum intensity of the basal poles increased slightly from 3.4 to 3.6 mrd compared to the hot-rolled sheet. After annealing at 300 °C for 5 min, the angle between the two peaks in the basal poles along the TD increased to 80° in the annealed AZXW1100 sheet, and the maximum intensity decreased significantly from 3.6 to 2.2 mrd. When the annealing time was increased to 60 min, the maximum intensity increased slightly; however, the angle between the two peaks remained unchanged.
The variation in the basal pole intensity along the RD or TD at different stages of the thermomechanical processes was analyzed to illustrate changes in the shape of the basal poles with the Al content and to investigate the formation of the quadruple basal texture. As shown in Figure 6, the deformation induced by cold rolling increased the intensity of the basal poles at a specific tilt angle of ±20° from the ND toward the RD, regardless of the type of alloy. According to previous reports [8,13,29,30], Mg-Zn-Y and Mg-Zn-Ca alloys have well-developed RD texture components at a specific tilt angle after cold rolling. Additionally, Styczynski et al. [30] reported that the activation of the pyramidal <c+a> slip system and the formation of deformation twins during cold rolling were responsible for the basal splitting in the RD. As shown in Figure 1 and Figure 6a–c, the intensity of the basal poles in the RD and the fraction of shear bands increased with the increasing Al content. The increase in the basal pole intensity at ±20° toward the RD is also attributed to the formation of shear bands, which mainly consist of contraction twins and double twins. In contrast to the RD, there was negligible changes in the maximum intensity of the cold-rolled sheets in the TD with the varying Al content.
As mentioned previously, cold rolling did not cause a significant change in the shape of the texture, whereas a considerable change in texture occurred after subsequent annealing. From Figure 6a–c, a decrease in the Al content results in a significant decrease in the basal pole intensity of the annealed sheets along the RD. However, there is no significant change in the maximum intensity of the basal poles in the TD between the annealed sheets. Notably, in the case of alloys containing 2 and 1 wt.% Al, two peaks corresponding to the maximum intensity of the basal poles developed at the specific tilt angle of ±40° in the TD. This results in the texture of the annealed sheets gradually changing from RD-split to diamond to TD-split in the (0002) pole figure, owing to the relative comparison of the pole intensities in the RD and TD. However, despite the change in the shape of the texture, the annealed AZXW2100 and AZXW1100 sheets retained a quadruple basal texture with two peaks in the basal pole intensity at specific tilt angles in both the RD and TD.

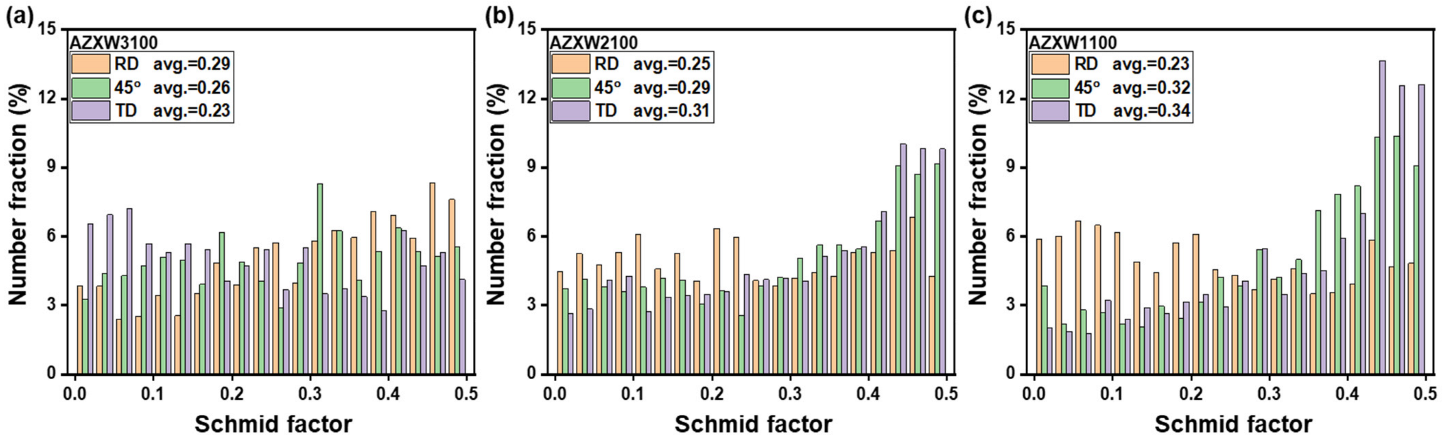
3.2.3. Schmid Factor for Basal Slip

In Mg alloys, basal slip follows the Schmid’s law, according to which the yield strength, σy, can be expressed as σy = τCRSS/m, where τCRSS is the CRSS for the activation of basal slip, and m is the Schmid factor (SF) [31]. The SFs for basal slip along the RD, 45° direction, and the TD of the annealed sheets were measured by using EBSD data, as shown in Figure 7. In the annealed AZXW1100 and AZXW2100 alloy sheets, which exhibited TD texture components developed at a tilt angle of ±40°, a large fraction (>30%) of the grains exhibited an SF higher than 0.4 in the TD, as shown in Figure 7b,c. The annealed AZXW1100 sheet exhibits the highest average SF (0.34) in the TD, followed by those in the 45° direction and the RD, owing to the high fraction of basal planes inclined from the ND toward the TD by 40°. The annealed AZXW3100 sheet contained grains with a low average SF in the TD and a high average SF (0.29) in the RD.
Figure 8 shows that the average SF values and maximum intensities of the basal poles along the RD and TD in Figure 5 have a linear relationship, where the average SF increases with the maximum intensity of the basal poles. Additionally, the sharp increase in the average SF in the TD is due to a larger fraction of grains tilted by ±40° in the TD. The increase in the average SF in the RD is relatively moderate because the fraction of grains tilted by ±25° in the RD is larger. Therefore, the average SF is a very suitable parameter to effectively reflect both the intensity and shape of the basal poles and to represent the ease of basal slip activation according to the loading direction. Consequently, a higher average SF results in easier dislocation slip on a particular crystal plane. As shown in Figure 7 and Figure 8, reducing the Al content decreases the average SF in the RD while increasing it in the TD. In the alloys with an off-basal texture investigated in this study, as the maximum intensity of the basal poles increases, the average SF of the basal planes also increases, thereby making basal slip easier. This is contrary to the existing general assumption that the lower the texture intensity, the better the ductility and formability [32,33,34]. Therefore, it must be emphasized that the average SF can be an important factor in describing the yield and strain-hardening behaviors of metallic materials, similar to the work-hardening exponent (n-value).

4. Conclusions

In this study, the effects of the Al content on the formation of quadruple basal textures in Mg-xAl-1Zn-0.1Ca-0.2Y alloy sheets fabricated via hot rolling, cold rolling, and subsequent annealing processes were systematically investigated, and key conclusions were drawn:
(1)
A decrease in the Al content resulted in a decrease in the basal pole intensity of the annealed sheets along the RD, but there was no significant change in intensity along the TD. In particular, two peaks of basal poles were developed at a specific tilt angle of ±40° to the TD from the ND in the alloys containing 2 and 1 wt.% Al. Consequently, the basal pole figure shape of the annealed sheets gradually changed from RD-split to diamond and TD-split, owing to the relative peak intensities in the RD and TD directions.
(2)
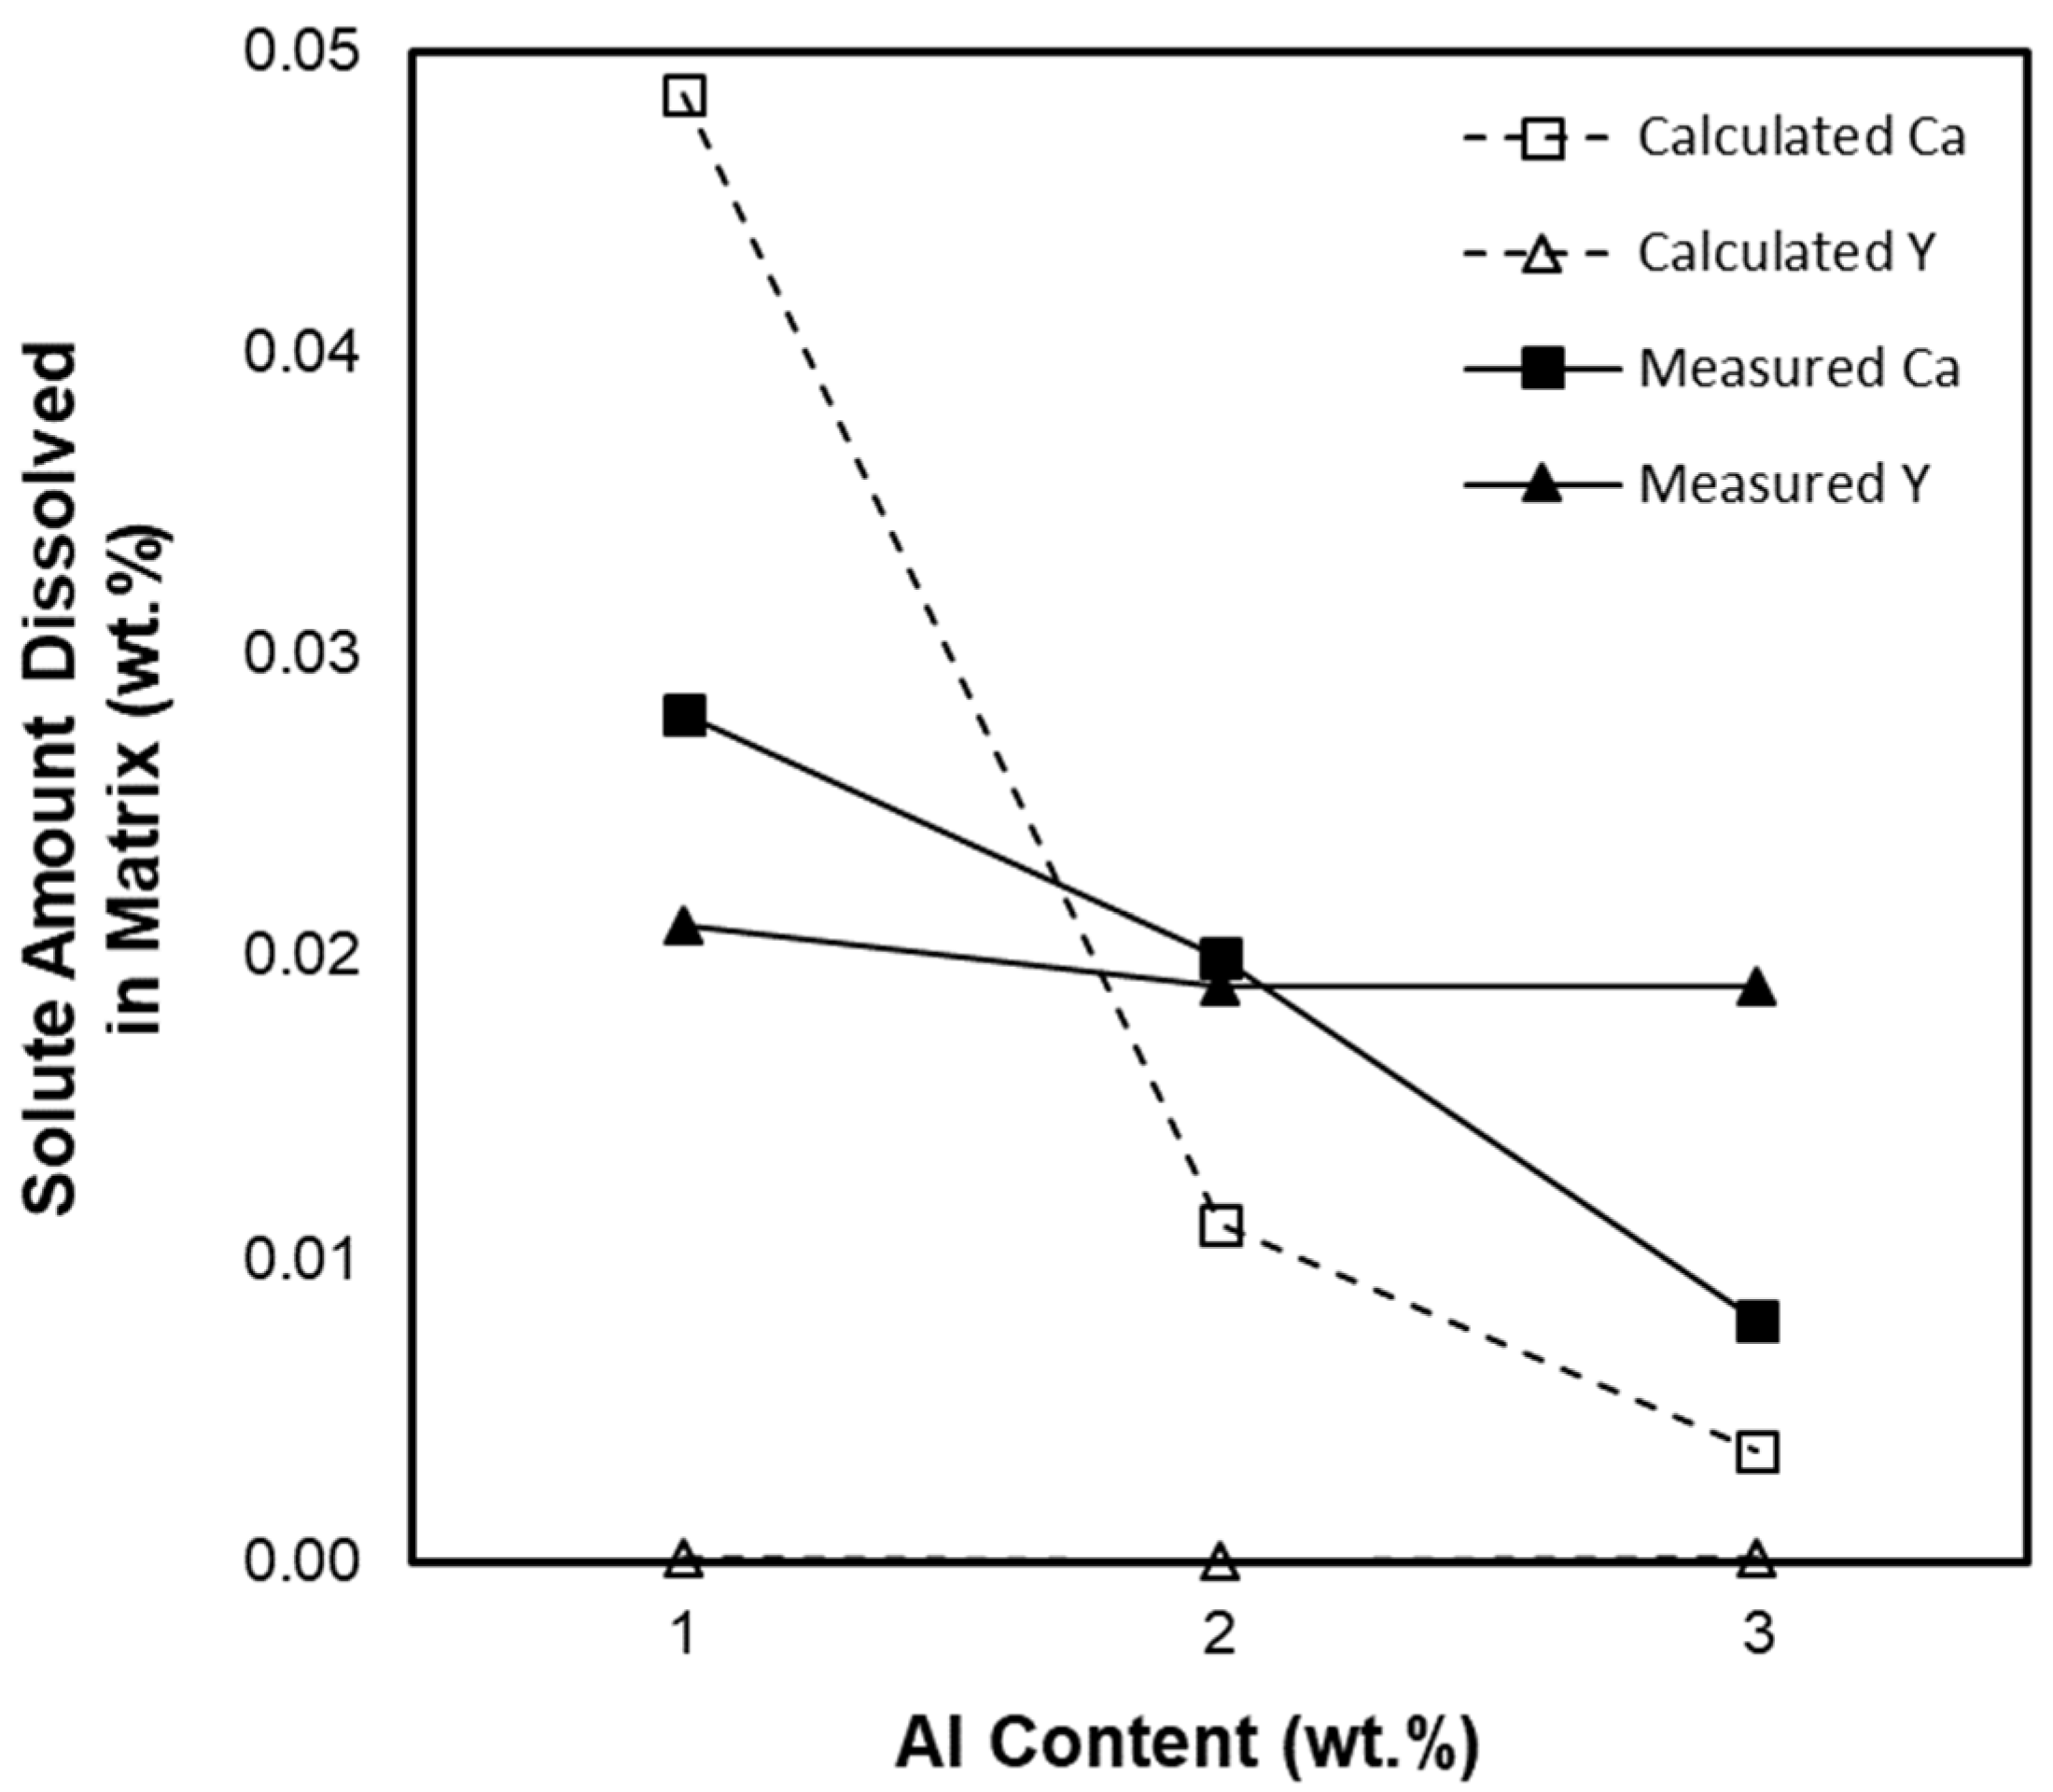
The texture change with the Al content in the alloys investigated in this study was mainly attributed to the change in the amount of Ca solute dissolved in the matrix grains. It was confirmed that the addition of a smaller amount of Al led to a larger amount of free Ca solute atoms available to contribute to co-segregation with Zn, resulting in the strengthening of the TD-split texture components but weakening of the RD-split components. Based on the thermodynamic calculation results, the critical amount of Ca solute required to form the TD-split texture component is 0.008 wt.%.
(3)
The average SF, which represents the ease of basal slip activation according to the loading direction, has a linear relationship with the maximum intensities of the basal poles along the RD and TD. In this study, as the maximum intensity of the basal poles in the alloys with off-basal textures increased, the average SF of the basal planes increased, making basal slip easier. Considering the average SF, strengthening the intensity of the basal poles developed at a specific tilt angle of ±40° to the TD is more effective in improving the ductility and formability than in those developed at a tilt angle of ±25° to the RD.

Author Contributions

Conceptualization, Y.M.K.; data curation, L.L.; investigation, L.L. and Y.G.; methodology, L.L.; project administration, Y.M.K.; supervision, J.S.S., B.-C.S. and Y.M.K.; validation, Y.G.; writing—original draft, L.L. and Y.M.K.; writing—review and editing, J.S.S., B.-C.S. and Y.M.K. All authors have read and agreed to the published version of the manuscript.

Funding

This study was supported by the Fundamental Research Program (PNK8390) of the Korea Institute of Materials Sciences (KIMS).

Institutional Review Board Statement

Not applicable.

Informed Consent Statement

Not applicable.

Data Availability Statement

Not applicable.

Conflicts of Interest

The authors declare no conflict of interest.

References

  1. Wang, Q.; Jiang, B.; Tang, A.; Fu, J.; Jiang, Z.; Sheng, H.; Zhang, D.; Huang, G.; Pan, F. Unveiling annealing texture formation and static recrystallization kinetics of hot-rolled Mg-Al-Zn-Mn-Ca alloy. J. Mater. Sci. Technol. 2020, 43, 104–118. [Google Scholar] [CrossRef]
  2. Sandlöbes, S.; Zaefferer, S.; Schestakow, I.; Yi, S.; Gonzalez-Martinez, R. On the role of non-basal deformation mechanisms for the ductility of Mg and Mg–Y alloys. Acta Mater. 2011, 59, 429–439. [Google Scholar] [CrossRef] [Green Version]
  3. Wang, Q.; Jiang, B.; Chen, D.; Jin, Z.; Zhao, L.; Yang, Q.; Huang, G.; Pan, F. Strategies for enhancing the room-temperature stretch formability of magnesium alloy sheets: A review. J. Mater. Sci. 2021, 56, 12965–12998. [Google Scholar] [CrossRef]
  4. Nakata, T.; Xu, C.; Yoshida, Y.; Yoshida, K.; Kamado, S. Improving room-temperature stretch formability of a high-alloyed Mg–Al–Ca–Mn alloy sheet by a high-temperature solution-treatment. Mater. Sci. Eng. A 2021, 801, 140399. [Google Scholar] [CrossRef]
  5. Zhang, H.; Cheng, W.; Fan, J.; Xu, B.; Dong, H. Improved mechanical properties of AZ31 magnesium alloy sheets by repeated cold rolling and annealing using a small pass reduction. Mater. Sci. Eng. A 2015, 637, 243–250. [Google Scholar] [CrossRef]
  6. Barezban, M.H.; Roumina, R.; Mirzadeh, H.; Mahmudi, R. Effect of Gd on Dynamic Recrystallization Behavior of Magnesium during Hot Compression. Met. Mater. Int. 2021, 27, 843–850. [Google Scholar] [CrossRef]
  7. Gu, D.; Peng, J.; Wang, J.; Pan, F. Effect of Mn Modification on Microstructure and Mechanical Properties of Magnesium Alloy with Low Gd Content. Met. Mater. Int. 2021, 27, 1483–1492. [Google Scholar] [CrossRef]
  8. Zeng, Z.R.; Zhu, Y.M.; Xu, S.W.; Bian, M.Z.; Davies, C.H.J.; Birbilis, N.; Nie, J.F. Texture evolution during static recrystallization of cold-rolled magnesium alloys. Acta Mater. 2016, 105, 479–494. [Google Scholar] [CrossRef]
  9. Ma, R.; Lu, Y.; Wang, L.; Wang, Y. Influence of rolling route on microstructure and mechanical properties of AZ31 magnesium alloy during asymmetric reduction rolling. Trans. Nonferrous Met. Soc. China 2018, 28, 902–911. [Google Scholar] [CrossRef]
  10. Bohlen, J.; Wendt, J.; Nienaber, M.; Kainer, K.U.; Stutz, L.; Letzig, D. Calcium and zirconium as texture modifiers during rolling and annealing of magnesium–zinc alloys. Mater. Charact. 2015, 101, 144–152. [Google Scholar] [CrossRef] [Green Version]
  11. Yuasa, M.; Miyazawa, N.; Hayashi, M.; Mabuchi, M.; Chino, Y. Effects of group II elements on the cold stretch formability of Mg–Zn alloys. Acta Mater. 2015, 83, 294–303. [Google Scholar] [CrossRef]
  12. Li, Z.H.; Sasaki, L.L.; Bian, M.Z.; Nakata, T.; Yoshida, Y.; Kawabe, N.; Kamado, S.; Hono, K. Role of Zn on the room temperature formability and strength in Mg–Al–Ca–Mn sheet alloys. J. Alloy. Compd. 2020, 847, 156347. [Google Scholar] [CrossRef]
  13. Kim, Y.M.; Mendis, C.; Sasaki, T.; Letzig, D.; Pyczak, F.; Hono, K.; Yi, S. Static recrystallization behaviour of cold rolled Mg-Zn-Y alloy and role of solute segregation in microstructure evolution. Scr. Mater. 2017, 136, 41–45. [Google Scholar] [CrossRef] [Green Version]
  14. Bian, M.Z.; Sasaki, T.T.; Suh, B.C.; Nakata, T.; Kamado, S.; Hono, K. A heat-treatable Mg–Al–Ca–Mn–Zn sheet alloy with good room temperature formability. Scr. Mater. 2017, 138, 151–155. [Google Scholar] [CrossRef]
  15. Chino, Y.; Sassa, K.; Mabuchi, M. Texture and stretch formability of a rolled Mg–Zn alloy containing dilute content of Y. Mater. Sci. Eng. A 2009, 513–514, 394–400. [Google Scholar] [CrossRef]
  16. Zhu, G.; Wang, L.; Zhou, H.; Wang, J.; Shen, Y.; Tu, P.; Zhu, H.; Liu, W.; Jin, P.; Zeng, X. Improving ductility of a Mg alloy via non-basal <a> slip induced by Ca addition. Int. J. Plast. 2019, 120, 164–179. [Google Scholar] [CrossRef]
  17. Suh, B.-C.; Kim, J.H.; Hwang, J.H.; Shim, M.-S.; Kim, N.J. Twinning-mediated formability in Mg alloys. Sci. Rep. 2016, 6, 22364. [Google Scholar] [CrossRef] [Green Version]
  18. Zarandi, F.; Seale, G.; Verma, R.; Essadiqi, E.; Yue, S. Effect of Al and Mn additions on rolling and deformation behavior of AZ series magnesium alloys. Mater. Sci. Eng. A 2008, 496, 159–168. [Google Scholar] [CrossRef]
  19. Yi, S.; Victoria-Hernandez, J.; Kim, Y.M.; Letzig, D.; You, B.S. Modification of Microstructure and Texture in Highly Non-Flammable Mg-Al-Zn-Y-Ca Alloy Sheets by Controlled Thermomechanical Processes. Metals 2019, 9, 181. [Google Scholar] [CrossRef] [Green Version]
  20. Bian, M.Z.; Sasaki, T.T.; Nakata, T.; Yoshida, Y.; Kawabe, N.; Kamado, S.; Hono, K. Bake-hardenable Mg–Al–Zn–Mn–Ca sheet alloy processed by twin-roll casting. Acta Mater. 2018, 158, 278–288. [Google Scholar] [CrossRef]
  21. Chaudry, U.M.; Kim, Y.S.; Hamad, K. Effect of Ca addition on the room-temperature formability of AZ31 magnesium alloy. Mater. Lett. 2019, 238, 305–308. [Google Scholar] [CrossRef]
  22. Trang, T.T.T.; Zhang, J.H.; Kim, J.H.; Zargaran, A.; Hwang, J.H.; Suh, B.-C.; Kim, N.J. Designing a magnesium alloy with high strength and high formability. Nat. Commun. 2018, 9, 2522. [Google Scholar] [CrossRef] [PubMed]
  23. Wang, Y.N.; Huang, J.C. Texture analysis in hexagonal materials. Mater. Chem. Phys. 2003, 81, 11–26. [Google Scholar] [CrossRef]
  24. Hua, Z.M.; Wang, B.Y.; Wang, C.; Zhang, H.M.; Du, C.F.; Li, Y.J.; Zha, M.; Ma, P.K.; Yang, Z.Z.; Wang, H.Y. Solute segregation assisted superplasticity in a low-alloyed Mg–Zn–Ca–Sn–Mn alloy. Materialia 2020, 14, 100918. [Google Scholar] [CrossRef]
  25. Hantzsche, K.; Bohlen, J.; Wendt, J.; Kainer, K.U.; Yi, S.B.; Letzig, D. Effect of rare earth additions on microstructure and texture development of magnesium alloy sheets. Scr. Mater. 2010, 63, 725–730. [Google Scholar] [CrossRef]
  26. Bohlen, J.; Nürnberg, M.R.; Senn, J.W.; Letzig, D.; Agnew, S.R. The texture and anisotropy of magnesium–zinc–rare earth alloy sheets. Acta Mater. 2007, 55, 2101–2112. [Google Scholar] [CrossRef] [Green Version]
  27. Kim, D.W.; Suh, B.C.; Shim, M.S.; Bae, J.H.; Kim, D.H.; Kim, N.J. Texture Evolution in Mg-Zn-Ca Alloy Sheets. Metall. Mater. Trans. A 2013, 44, 2950–2961. [Google Scholar] [CrossRef] [Green Version]
  28. Guo, F.; Pei, R.; Jiang, L.; Zhang, D.; Korte-Kerzel, S.; Al-Samman, T. The role of recrystallization and grain growth in optimizing the sheet texture of magnesium alloys with calcium addition during annealing. J. Magnes. Alloy. 2020, 8, 252–268. [Google Scholar] [CrossRef]
  29. Zeng, Z.R.; Bian, M.Z.; Davies, C.H.J.; Birbilis, N.; Nie, J.F. Effects of dilute additions of Zn and Ca on ductility of magnesium alloy sheet. Mater. Sci. Eng. A 2016, 674, 459–471. [Google Scholar] [CrossRef]
  30. Styczynsk, A.; Hartig, C.; Bohlen, J.; Letzig, D. Cold rolling textures in AZ31 wrought magnesium alloy. Scr. Mater. 2004, 50, 943–947. [Google Scholar] [CrossRef]
  31. Nan, X.L.; Wang, H.Y.; Zhang, L.; Li, J.B.; Jiang, Q.C. Calculation of Schmid factors in magnesium: Analysis of deformation behaviors. Scr. Mater. 2012, 67, 443–446. [Google Scholar] [CrossRef]
  32. Tu, T.; Chen, X.-H.; Chen, J.; Zhao, C.-Y.; Pan, F.-S. A High-Ductility Mg–Zn–Ca Magnesium Alloy. Acta Metall. Sin. 2019, 32, 23–30. [Google Scholar] [CrossRef] [Green Version]
  33. Lin, J.; Wang, X.; Ren, W.; Yang, X.; Wang, Q. Enhanced Strength and Ductility Due to Microstructure Refinement and Texture Weakening of the GW102K Alloy by Cyclic Extrusion Compression. J. Mater. Sci. Technol. 2016, 32, 783–789. [Google Scholar] [CrossRef]
  34. Wang, J.; Zhu, G.; Wang, L.; Vasiev, E.; Park, J.-S.; Sha, G.; Zeng, X.; Knezevic, M. Origins of high ductility exhibited by an extruded magnesium alloy Mg-1.8Zn-0.2Ca: Experiments and crystal plasticity modeling. J. Mater. Sci. Technol. 2021, 84, 27–42. [Google Scholar] [CrossRef]
Figure 1. Optical micrographs of the hot-rolled (a,d,g), cold-rolled (b,e,h), and subsequently annealed (c,f,i) sheets: (ac) AZXW3100, (df) AZXW2100, and (gi) AZXW1100.
Metals 12 00499 g001
Figure 2. EBSD-IPF maps and pole figures for basal planes of the cold-rolled sheets of (a) AZXW3100, (b) AZXW2100, and (c) AZXW1100. The fraction of shear bands (black region) is 52.9%, 48.2%, and 42.5%, respectively.
Metals 12 00499 g002
Figure 3. Quantitative analysis of Ca and Y solutes dissolved in matrix grains, with varying Al contents.
Metals 12 00499 g003
Figure 4. EBSD-IPF maps and pole figures for basal (0002) and prismatic (10-10) planes of the annealed sheets: (a,d) AZXW3100, (b,e) AZXW2100, and (c,f) AZXW1100.
Metals 12 00499 g004
Figure 5. X-ray pole figures of the hot-rolled, cold-rolled, and annealed sheets.
Metals 12 00499 g005
Figure 6. (0002) Pole intensities of the hot-rolled, cold-rolled, and annealed sheets from the ND along the RD (ac) and TD (df) axes calculated from Figure 5: (a,d) AZXW3100, (b,e) AZXW2100, and (c,f) AZXW1100.
Metals 12 00499 g006
Figure 7. SFs along the RD, 45° direction, and TD: (a) AZXW3100, (b) AZXW2100, and (c) AZXW1100.
Metals 12 00499 g007
Figure 8. Relationship between the average SFs and the maximum intensities of basal poles along the RD and TD. Arrow direction indicates a decrease in the Al content.
Metals 12 00499 g008
Table 1. Chemical composition (in wt.%) of the studied alloys.
AlloysAlZnMnCaYMg
AZXW31002.9731.0560.1320.1340.266Bal.
AZXW21001.9261.0100.1280.1480.248Bal.
AZXW11000.9600.9360.1310.1310.218Bal.
Table 2. Thermodynamic calculation results of the Ca concentration in matrix at 420 °C under an equilibrium condition, using the FactSage software. Gray shaded area indicates the alloys with the TD-split texture component.
Addition Amount (wt.%)3 Al2 Al1 Al
0.1 Ca0.0030.0080.035
0.3 Ca0.0060.0160.087
0.5 Ca0.0080.0240.157
0.7 Ca0.0100.0360.224
1.0 Ca0.0150.0710.324
Publisher’s Note: MDPI stays neutral with regard to jurisdictional claims in published maps and institutional affiliations.

