
Fatigue Crack Propagation on Uniaxial Loading of Biaxially Predeformed Pearlitic Rail Steel

Department of Industrial and Materials Science, Chalmers University of Technology, 412 96 Gothenburg, Sweden
*
Author to whom correspondence should be addressed.
Metals 2023, 13(10), 1726; https://doi.org/10.3390/met13101726
Submission received: 15 September 2023
/
Revised: 3 October 2023
/
Accepted: 8 October 2023
/
Published: 11 October 2023
(This article belongs to the Special Issue Fatigue and Fracture in Steels)
Abstract
:Rolling contact fatigue loading causes the surface material in the top of the rail to severely deform. The microstructure aligns along the shear direction and the mechanical behavior in terms of plastic flow becomes anisotropic. Cracks are initiated in the severely deformed surface region and propagates along the direction of microstructure flow lines. However, the effect of large shear deformation on fatigue crack growth is not yet well understood. In this study, uniaxial fatigue crack propagation of undeformed and biaxially predeformed pearlitic rail steel R260 has been investigated. The material was predeformed to different deformation states using combined axial compression and shear deformation, corresponding to material found at different depths in the severely deformed surface layer of rails. Fatigue crack propagation rate was dependent on the material state and influenced by both work hardening and microstructural anisotropy. It was found that predeformed material exhibited lower crack growth rates than undeformed material under this loading condition. The influence of predeformation on the crack growth direction was limited.
1. Introduction
In the transition to a more climate friendly transportation infrastructure, railways have the potential to significantly contribute, being among the most energy efficient and safest modes of transportation. To realize this potential, economic viability along with functionality and safety must be ensured. Proper maintenance is imperative for the safety, and therefore good condition monitoring and material degradation models are essential. One major concern with respect to safety, reliability, and maintenance costs, is rolling contact fatigue [1,2]. By understanding the mechanical behavior and material properties of the associated damaged material, the detrimental effects of rolling contact fatigue can be mitigated. In this study, we investigate the uniaxial fatigue crack propagation behavior in fully pearlitic rail steel. This steel was predeformed by large shear deformation to simulate the material state typically found close to the rail head surface in field.
The most commonly used material for railway rails are pearlitic steels of various grades, as it provides good wear resistance and strength properties relative to cost. In addition, these steels can be tailored by alloying and heat treatment to fit the operating conditions, see, e.g., Refs. [3,4,5,6]. The pearlitic microstructure is composed of pearlite colonies with a lamellar structure of alternating ferrite and cementite with similar orientation [7]. In this study, the standard pearlitic rail grade R260 has been used in the fatigue crack propagation experiments. Among the rail grades used in Europe, the R260 steel belongs to the softer ones. Hence, plastic deformation and wear in these steels are more pronounced compared to premium rail grades such as the R350HT (head hardened rail) [8,9].
In service, railways rails are repeatedly undergoing rolling contact fatigue loading, where the loads imposed by the train is transferred through the wheel to a very small contact patch at the railhead surface. Consequently, contact stresses of large magnitude at the rail/wheel interface develops. In addition, frictional forces such as traction and cornering generates large interfacial shear stresses, resulting in plastic deformation of the rail head surface layer (as well as of wheel running surface). When frictional forces acts in a predominant direction i.e., unidirectional traffic conditions, it leads to accumulation of shear strains (ratchetting). Hence, the microstructure at the rail head surface becomes aligned and anisotropic. Correspondingly, the material properties are significantly changed from that of the virgin material state, see, e.g., Refs. [10,11,12,13,14]. The severely deformed surface material seems prone to crack initiation and the crack propagation resistance is suspected to be reduced due to the microstructure alignment. It is well known that the severely deformed surface material is the origin of many damage categories, such as squats and head checks that are associated with rolling contact fatigue cracks [15,16,17]. However, the changes in material properties and mechanical behavior due to severe deformation of the surface layer are not well understood.
Mechanical testing of the severely deformed surface material will provide a deeper understanding about the mechanical behavior and material properties. However, it is not convenient to extract test bars from field samples, primarily because the severely deformed region is very shallow and often already cracked. For this reason, the material state must be replicated. The most common approach reported in the literature, for replicating the material state, is to deform the material by large shear deformation under high compressive loads, similar to the loading condition which the rail head surface material is subjected to. This has previously been done by using equal angular channel pressing (ECAP) and high pressure torsion (HPT) [18,19]. Fatigue crack propagation experiments based on Crack Tip Opening Displacement (CTOD) experiments on such severely deformed pearlitic rail material have shown that fatigue crack propagation and fracture toughness strongly correlates with the ferrite-cementite lamellae orientation, i.e., the material properties are anisotropic [20,21,22].
The limitations with the aforementioned predeformation techniques (ECAP and HPT) is the small material volume that can be produced in lab-scale equipment and the induced strain gradient in the microstructure. Consequently, the samples must be small in order to have a well defined and uniform material state. To overcome this limitation, an alternative predeformation technique was proposed by Meyer et al. [23], where solid cylindrical test bars are twisted while applying a constant compressive load. With this method, it is possible to achieve shear strains up to approximately 2.3, when using test bars with an initial gauge section diameter of 10 mm. The advantage of this method is that test bars, after reprofiling, become axi-symmetric and can be used for multiaxial fatigue testing. However, with the limitation it is not possible to achieve as high shear strains as measured in the very surface of the rail, at depths less than 0.1 mm. The anisotropy in plastic properties were characterized after predeformation by Meyer et al. [24], but the influence of anisotropy on crack growth characteristics is still unknown. In this study, the aim is to investigate the effect of predeformation on the crack propagation behavior. This has been done by crack propagation measurement, fractography, and microstructure characterization.
2. Material and Methods
2.1. Material
Uniaxial fatigue crack propagation was studied in predeformed fully pearlitic rail steel R260 (UIC900). The nominal chemical composition of this rail steel is detailed in Table 1. Cylindrical rods with a diameter of 26 mm were extracted from virgin rail heads, as illustrated in Figure 1a. The cylindrical rods were subsequently machined into test bars, following the dimensions provided by the drawing in Figure 1b.
2.2. Predeformation and Reprofiling
The predeformation method developed by Meyer et al. [23] has been used to replicate the anisotropic surface material found in rails. The predeformation process is a cyclic sequence in which test bars are twisted under simultaneous compression, as illustrated and explained in Figure 2a. In total, two predeformed material states were produced, corresponding to twisting 3 × 90 degrees (PD3) and 6 × 90 degrees (PD6) under a nominal initial compressive stress of −500 MPa. The nominal compressive stress slightly decreases in each cycle as the diameter increases. The test bars used for predeformation were machined according to the drawing in Figure 1b. These test bars were prepared in two steps prior to predeformation. In the first step, they were gradually ground up to P1200 SiC abrasive paper to avoid pre-mature failure during predeformation. Thereafter, in the second step, a grid to measure surface shear strain was applied by laser etching, see Figure 2b. Naturally, undeformed test bars were also included as a reference, and these are called PD0.
The compressive load during predeformation causes a slight bending of the test bar gauge section besides decreasing the length/width ratio. Reprofiling was therefore required to make the test bars axi-symmetric and thereby suitable for fatigue testing. Test bars denoted PD6 were reprofiled according to the drawing in Figure 1b. However, it was not possible to reprofile PD3 test bars with this geometry due to the slight bending but limited widening of the profile. Therefore, the dimensions in Figure 1b were adjusted. The gauge section diameter was changed to 9.5 mm instead of 10 mm and the transition radius R30 was changed to R28.
Mirror polishing was done prior to uniaxial fatigue testing to eliminate the effect of surface roughness. To avoid rounding of the starting notch, the final preparation was divided in three steps. The first step was to grind and polish with abrasive paper up to P2400. Thereafter, the notch was drilled according to the drawing in Figure 3. Lastly, the final steps of polishing down to 1 µm diamond paste were finalized.
2.3. Mechanical Testing
2.3.1. Uniaxial Fatigue Crack Propagation
The uniaxial fatigue crack propagation experiments were load controlled and conducted under constant amplitude loading with zero mean stress (fully reversed cyclic loading). The load was applied in a sinusoidal waveform with a frequency of 10 Hz. Two nominal stress amplitudes were employed: 60% and 70% of , expressed in terms of the offset yield strength in tension for virgin rail material. The was measured in a previous study by Meyer et al. [23] to 534.2 MPa on samples from the same batch. In total, three test bars of each material state (PD0, PD3, and PD6) for each amplitude were tested, as shown by the test plan in Table 2. In this study, we used MTS 809 axial/torsion system, with an axial and torsional load capacity of 100 kN, respectively, 1100 Nm. The experiments were conducted in a clean lab environment at room temperature. The temperature was not controlled as plastic deformation is mainly localized to the vicinity of the notch and crack front.
2.3.2. Crack Measurement
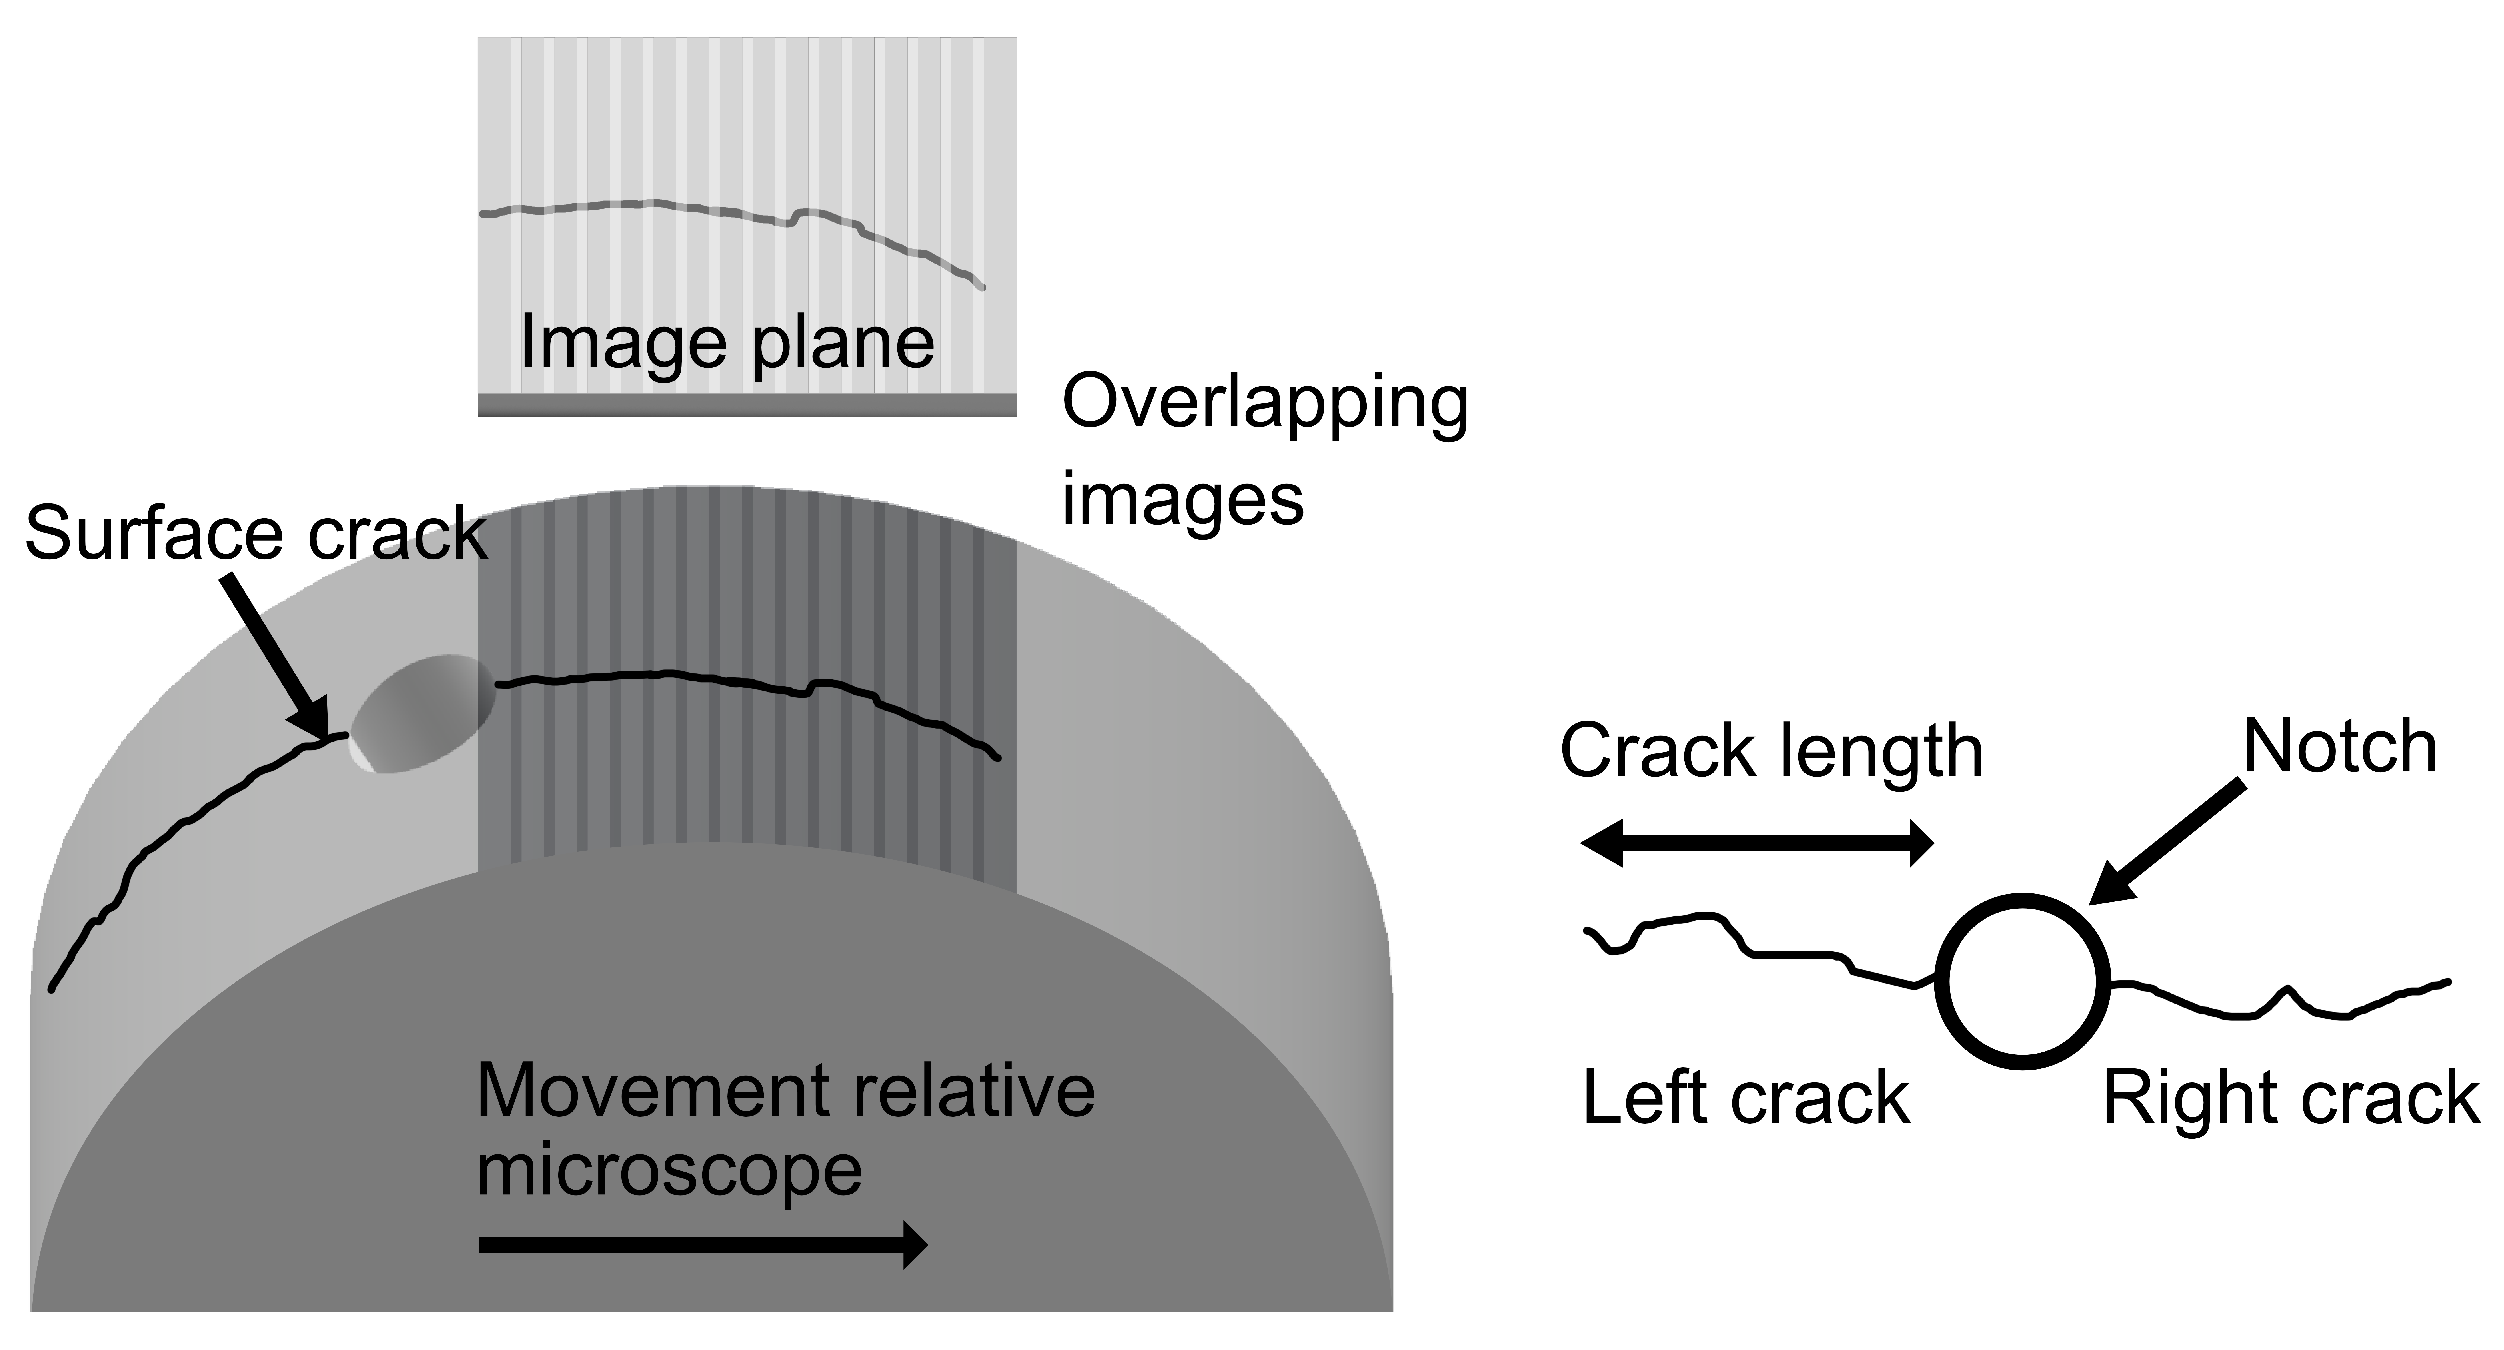
Crack length has been measured with both stereo- and optical microscope at periodic intervals during the fatigue crack propagation experiments. Multiple micrographs were acquired along the lateral surface of the test bar to cover the whole crack, where each micrograph represents the projection of a small section on the lateral surface, see Figure 4. The acquired micrographs were stitched to form a single micrograph containing the whole crack. This was enabled by letting each section during image acquisition overlap with the adjacent sections. The measurements were conducted every 1000 cycles for the first 10,000 cycles and thereafter every 2000 cycles. Closer periodic measurements were applied towards the end of the fatigue life, when it was anticipated that the test bar would not withstand another full interval. The definition of crack length in the crack propagation measurements reported in Section 3.3 is defined in Figure 4, where the crack length is the horizontal crack extension, measured from the edge of the notch on the image plane. In addition, the crack length was corrected for the curvature of the test bar, i.e., the true length of the crack is longer than the length of the projected crack.
2.4. Characterization Methodology
2.4.1. Shear Strain Measurement
The laser etched grids on the predeformed test bars were used for surface shear strain measurement. The shear strain was calculated by using Equation (1), where the angle was measured between the intersecting lines of the deformed grid (see Figure 5). In total, each test bar was measured at 24 positions evenly distributed around the circumference of the gauge section. The test bar was rotated in steps of 60 degrees and at each rotation, the angle was measured at 4 locations along the focused top surface of the gauge section.
2.4.2. Hardness Measurement
The hardness distribution in both undeformed and predeformed samples was determined and evaluated using the Vickers method. The equipment used for conducting the hardness measurements was the hardness tester DuraScan 70 G5 by Struers/Emcotest. In total, hardness was measured on seven samples: two samples for each material state and one reference sample. The reference sample was extracted from a reprofiled PD6 test bar whilst the other samples were extracted after the completed fatigue testing experiment. Figure 6a, shows the location of sample extraction (white cross-section). The cut were made 2 mm from the top of the hole that forms the notch. Hardness was measured along the radial direction on the cross-section on a polished surface according to the indent pattern shown in Figure 6b. In all measurements, the applied load was 5 kgf (HV5), to enable comparison between the samples without risking the possible size effect.
3. Results
3.1. Hardness and Shear Strain
The effect of predeformation on hardness distribution relative the undeformed material state is shown in Figure 7. The presented hardness values were measured along the radial direction, starting close to the sample surface (circumference). From the figure, it can be observed that the undeformed samples have a uniform hardness distribution, averaging 269 HV5 with a corresponding standard deviation of 7 HV5. As expected, these results are in accordance with the hardness requirement outlined in the European rail standard EN 13674-4, for the R260 rail steel. Comparing the hardness distribution of the predeformed samples with the undeformed, a notable difference can be observed. Predeformation introduces significant hardening throughout the cross-section, characterized by a nearly linear decrease in hardness along the radial direction, towards the sample center. This hardness gradient is similar for PD3 and PD6, with PD6 having a hardness level that is approximately 20 HV5 units higher than for PD3. In addition, it can be observed that for the same shear strain level in PD3 and PD6, there is a good agreement between the absolute levels in hardness. For example, the hardness level at 2.5 mm depth in PD6 correspond well to 0.5 mm depth in PD3 (at half the radius, half of the surface shear strain is expected). Lastly, the hardness measurements for the reference sample (PD6) completely overlaps the hardness levels for the PD6 samples, proving that the hardness distribution was unaffected by the fatigue crack propagation experiments.
From the principles of solid mechanics, the hardness gradient can be understood by considering the distribution of stresses and strains in a cylinder subjected to torsion. In this case, the stress and strain increases along the radial direction, away from the center. The shear strain is straightforward to analyze because of the concept that all planes can be assumed to remain planar. Thus, the shear strain varies linearly, from zero at the center, to the measured value at the surface, see Table 3. However, the stress distribution remains unknown, primarily because of plastic deformation, increasing diameter, and the subsequent decrease in diameter. Switching perspective, to the detailed, microstructural scale, the hardness gradient is instead mainly explained on the basis of differences in dislocation density and interlamellar spacing. Nikas et al. [25] measured the dislocation density and interlamellar in test bars predeformed by the method described in this study (Section 2.2). The dislocation density was found to increase almost linearly with increasing shear strain whilst only a slight decrease in interlamellar spacing was observed. Thus, it can be considered that the interlamellar spacing have a limited contribution to the increased hardness of the PD3 and PD6 test bars.
In Table 3, the surface shear strain () measurements of predeformed test bars, calculated by Equation (1), are presented. The standard deviation is low, which is in accordance to previous studies using this predeformation method, see, for example, Refs. [25,26]. The notation in the table denotes the surface shear strain after predeformation, while corresponds to the surface shear strain in reprofiled (and predeformed) test bars.
3.2. Microstructure Characterization
The micrographs in Figure 8 and Figure 9 shows the microstructure of the deformed material state PD3. These micrographs depicts the cross-section perpendicular to the radial direction, close to the lateral surface, as indicated by the coordinate system in Figure 9. From Figure 8a,b it can be observed that the pearlite colony boundaries are distinguishable and the microstructure shows an overall alignment towards the tangential direction. It must be noted, that the overall microstructure alignment is not equivalent to the individual orientation of the lamellar structure within the pearlite colonies. This is qualitatively exemplified in Figure 9a,b. In Figure 9a, most of the lamellae are aligned along the shearing direction, as opposed to Figure 9b, where the lamellae orientation is observed to vary. This variation of lamellae orientation is not unexpected as the reorientation during shear deformation depends on the initial orientation. For example, comparing lamellae oriented perpendicular to the shear direction with lamellae oriented with an angle relative the shear load, the lamellae in the latter case will be more aligned along the shear direction [27,28]. As a consequence of the initial orientation variation, the interlamellar spacing will also vary throughout the structure. In addition, the micrographs of Figure 9a,b also features bent and curved cementite lamellae, which according to Zhang et al. [27] is explained on the basis of large inclination angles relative to the direction of the applied shear load. The reorientation of the cementite lamellae during predeformation was quantitatively measured by Meyer and Nikas [26]. They reported that the orientation of the cementite lamellae is statistically more probable along the tangential direction, at an angle depending on the pre-deformation level.
The corresponding microstructure at the cross-section perpendicular to the radial direction, close to the lateral surface, for the predeformed material state PD6, is shown in Figure 10a,b. Here, the microstructure shows an overall alignment towards the tangential direction. Compared with the material state of PD3, the alignment is more evident and the pearlite colony boundaries cannot easily be distinguished. The variation of the cementite orientation throughout the structure is observed as for the case of the PD3 microstructure. Several areas show curved lamellae, due to shear localization. This is exemplified in Figure 11a,b.
3.3. Crack Length
The crack length measurements, resulting from the crack propagation experiments conducted with a nominal stress amplitude corresponding to 60% of , are shown in Figure 12. In the graph, it can be seen how the surface crack length changes with the number of load cycles until failure. Note that in all measurements for each test bars, there are two measured cracks, one crack on each side of the notch. From the crack propagation measurements, it can be observed that the initial crack growth rate is constant, followed by a transition to an exponential increase in crack growth rate. This crack propagation behavior is expected because the stress intensity at the crack front is dependent on the load bearing area, which reduces exponentially as the crack propagates. The area reduction can initially be considered as negligible, and the stress concentration induced by the notch dominates the local stress condition. Interestingly, the two cracks for each experiment almost extended at the same rate, indicating that the crack front becomes symmetric around the notch; cracks are initiating at each side of the notch, then joining to form a semi-elliptic crack front after some crack growth. This is further supported by the semi-elliptic fatigue fracture surface, see Figure A1.
When comparing the crack propagation resistance, a notable difference between undeformed and predeformed samples is observed. This difference is highlighted by the number of cycles to reach the same surface crack length, which was almost twice as many for predeformed test bars than for the undeformed. However, the predeformed material states PD3 and PD6 exhibit similar crack propagation resistance, except for one notable discrepancy; experiment 1 of PD3, which had approximately 25% longer fatigue life. In this case, crack initiation was delayed on one of the sides, with a subsequent lag in merging and progression into semi-elliptic crack growth, characterized by exponential crack growth rate.
The crack length measurements, for the nominal stress amplitude corresponding to 70% of is shown in Figure 13. Additionally, in this case, the two measured cracks follow each other well and the corresponding fracture surfaces are semi-elliptic, as shown in Figure A2. When compared to the lower nominal stress amplitude, it is observed that the initial constant crack propagation rate is higher, and the transition to exponential crack growth occurs earlier, for all tests. The difference in crack propagation resistance between undeformed and predeformed samples is large, larger than the corresponding difference observed for the lower nominal stress amplitude. In fact, the crack propagation rate in the undeformed test bars is so high that the crack measurement interval was too long to resolve the progression of the crack length. The comparison of the crack growth rates between the predeformed test bars PD3 and PD6 shows that there is a slight difference between them, with PD6 having higher crack propagation resistance. At this stress amplitude, the difference is clearer than what was observed at the lower stress amplitude, but still not drastic.
3.4. Crack Path
For the length of the crack contours of the final crack before the fracture was measured on stitched micrographs from optical microscopy, see Section 2.3.2. In this case, the crack length was not corrected for the curvature of the test bar. To examine and visualize the correlation between crack path and material state, the crack surface contours were digitized. Digitization was done by extracting the crack contour in a commercial photo editing software. The pixel data of the crack contour was converted to spatial data by using a Matlab script. The processed crack contours are visualized in Figure 14 and Figure 15 for respective nominal stress amplitude. The background grid represents the magnitude of surface shear deformation in PD6 test bars along the direction of microstructure alignment. It can be observed that for both nominal stress amplitudes, the surface crack in the undeformed material is on average straight with local crack kinking, as is the crack path for PD3. Comparing these crack paths with the crack paths of PD6 in the lower stress amplitude experiments, it can be seen that there is a slight difference in the average inclination angle. However, at the higher stress amplitude there is no distinct difference between the different material states. The crack paths are further discussed in Section 4.2. Validation data for the crack contours is available as Supplementary Material.
The surface crack path relative the orientation of the cementite lamellae was closely examined in a scanning electron microscope (FEGSEM). The correlation between crack growth direction and orientation of the cementite lamellae was found to be limited. The variation of crack growth direction with respect to orientation of the cementite lamellae is exemplified in Figure 16 and Figure 17, for PD3 and PD6 samples. These figures qualitatively demonstrate the variation in crack growth direction; only along small sections is the crack observed to propagate along the cementite lamellae, see detailed view B and A in Figure 16 and Figure 17. In other sections the crack propagates across the cementite lamellae, as exemplified in the detailed views A and B of Figure 16 and Figure 17.
4. Discussion
4.1. Crack Propagation Resistance
The crack propagation measurements showed that fatigue crack propagation resistance is increased by predeformation. Meanwhile, the difference in fatigue crack propagation rate between the predeformed material states is small. The material state of the predeformed material is different from the undeformed material in three respects. Firstly, the plastic properties are anisotropic, depicted by a distorted yield surface as described by Meyer et al. [24]. Secondly, the microstructure is aligned, however with a wide distribution in local strain level. Third, the degree of work hardening is different. This will be discussed in the following paragraph.
Meyer et al. [24] characterized the yield surface of the pearlitic rail steel R260 subjected to different levels of predeformation by using tubular specimens. The yield strength was determined by using plastic work as a criterion for yielding. The yield stress of the undeformed material was 475 MPa. It was found that predeformation induces anisotropy in the plastic behavior. The increase in yield stress on axial loading in tension for mJ/mm3 was 60 MPa for and 123 MPa for . In compression even larger increases in yield stress were reported, with 234 MPa for and 274 MPa for , i.e., a proof of stress asymmetry. The accumulated shear strain magnitudes of this study is close to the accumulated strain in the PD3 and PD6 test bars. The PD6 test bars have slightly higher accumulated shear strain and thereby the actual yield strength is expected to be slightly higher than for . The main difference between the predeformed test bars in the present study and the hollow test bars is the strain gradient, which is present in only solid test bars. Thus, the further the crack grows in depth, the lower is the pre-strain level and consequently the mechanical behavior of the material in front of the crack varies along the radial direction. Interestingly, the crack front in our case is still semi-elliptic, as normally found in solid, homogeneous materials, governed by the local stress intensity along the crack front. The semi-elliptic shape of the final fatigue crack in our case proves that the fracture properties in the outermost pre-strained material are at least on par with the undeformed material. If it would have been significantly more brittle, the crack front would likely have advanced further around the perimeter of the test bar. The fatigue fracture surface for predeformed material is shown in Figure A1 and Figure A2 for the respective nominal stress amplitude.
The magnitude of the plastic strain at the notch during crack initiation and at the crack tip during crack propagation is dependent on the local yield stress and the applied load. It is well known that cyclic plasticity induces damage to the material, thereby consuming life. The amount of cyclic plastic deformation in ductile materials will therefore control the overall number of cycles to failure [29]. The fatigue crack propagation experiments in this study were stress controlled. Thus, the magnitude of plastic deformation was in all stages of the fatigue life larger for undeformed material than the predeformed material. The difference in yield strength and fatigue crack propagation resistance between PD3 and PD6 is however relatively small. The increased crack propagation resistance observed for predeformed material is therefore thought to be mainly an effect of the increased yield strength and anisotropy in plastic deformation. The difference in yield strength in tension is relatively low but in compression it is significant. However, the plastic behavior will change upon cyclic loading. Thus, the yield strength in compression will most likely decrease from the monotonically measured. The completely reversed cyclic behavior of predeformed material have not been examined, but are characterized for the undeformed material [30]. The Bauschinger effect is likely to be present on both global level and locally in front of the crack. It seems a significant difference in yield between undeformed and predeformed material will remain upon cyclic loading.
The effect of microstructure alignment on the fatigue crack propagation resistance seems limited. The accumulated shear strain of PD6 is twice that of PD3. Thus, a pronounced effect of anisotropy on cyclic fracture properties should have been manifested as either a distinct increase or decrease in fatigue life. However, using the nominal, average pre-strain level is a blunt measure; there is a distribution from nearly unaffected material to shear bands with several times the nominal strain. If the existence of such shear bands is more important for the fatigue crack propagation than the density of such bands, it might explain why little difference is seen between the two predeformed material states. To examine this, loading along different directions relative the microstructure alignment are necessary.
4.2. Crack Path
The fatigue crack propagation rate and fracture toughness of severely deformed and aligned pearlitic microstructures obtained by high pressure torsion have been examined in previous studies [18,20,21,22]. It was found that the fracture toughness and fatigue crack propagation resistance is a strong function of the orientation of cementite. The fracture toughness and fatigue crack propagation resistance was reported to be the lowest along the interface of cementite and ferrite lamellae and the highest when the crack plane was perpendicular to the aligned cementite and ferrite lamellae. However, the biaxial predeformation method used in this study is not capable of producing a globally aligned microstructure. Meyer and Nikas characterized the orientation of the cementite lamellae after predeformation to an accumulated shear strain of . The orientation of the cementite lamellae was found to have a statistically preferred direction, but the microstructure gradient cannot be considered as globally aligned. The distribution along the radial direction is unknown. However, the orientation of the preferred direction with respect to the axial direction will be lowered since the imposed shear strain is linearly decreasing with the radius. Moreover, the probability of a preferred direction is expected to decrease along the radial direction towards the center of the test bar.
The surface crack was often observed to grow along the cementite-ferrite interface in certain directions for both undeformed and predeformed material. In the other sections the crack grew across cementite lamellae. The fracture toughness along these directions is higher since the crack propagates through the cementite lamellae, which act as barriers to crack propagation [18]. Based on the anisotropy in fracture toughness from the high pressure torsion experiments it is likely that the average fracture toughness is governed by the distribution of easy and hard orientations of the cementite lamellae with respect to the applied load. In previous studies it has also been reported that the crack path of undeformed pearlitic steel is tortuous because each pearlite colony has a preferred crack growth plane. The statistical nature of the cementite orientation cause the crack to continuously advance through differently oriented pearlite colonies along the lateral surface and radial directions. This explains the observed variations in crack path with respect to the orientation of the cementite lamellae.
The average direction of the surface crack however seems to be influenced by the degree of predeformation even though the orientation of individual pearlite colonies varies along the lateral surface. It was observed that the surface crack of PD6 on average grows along a straight line with an inclination angle relative to the horizontal plane. This could be explained by the average reorientation of the microstructure. Interestingly this average inclination disappears as the load amplitude is increased. Thus, the crack path is thought to be dependent on the degree of plasticity. The load amplitude difference between the two load amplitudes is 53.4 MPa, which is close to the difference in monotonic yield strength between PD3 and PD6. This increase was sufficient to eliminate the average inclination angle of PD6 and thus it could explain why no distinct inclination angle was observed for PD3. Another explanation could be that the reorientation of the microstructure for PD3 is insufficient to deviate crack growth from the horizontal plane. Examination of the surface crack path gives valuable insight about the existence of a crack path correlation with the orientation of the pearlite colonies. However, the surface crack path cannot be considered as representative for the overall crack propagation direction. This is mainly because of the microstructure gradient and that the surface crack mainly grow under the state of plane stress, whereas crack growth within the material grows under more plain strain dominated conditions.
5. Conclusions
In this study we investigated the effect of large shear predeformation on the fatigue crack propagation behavior under uniaxial loading. We considered three distinct material states: PD0, which represents the undeformed condition, and PD3 as well as PD6, corresponding to the two deformed material states, achieved by twisting 3 × 90 and 6 × 90 degrees under a constant axial compressive load, resulting in surface shear strains of 0.74 and 1.52, respectively. The crack was initiated from a drilled hole, used as a starting notch. The fatigue crack propagation experiments were load controlled and conducted under two nominal stress amplitudes corresponding to 60% and 70% of the offset yield strength in tension for undeformed material. The surface crack growth rate was measured by optical and stereo microscope. The fracture surface and surface crack path was then examined with scanning electron microscope (FEGSEM). From the observations and results of this study, it can be concluded that:
- Predeforming test bars by twisting under compression significantly increases the fatigue crack propagation resistance for stress controlled, constant amplitude loading;
- The amount of predeformation has very limited effect on fatigue crack propagation resistance when comparing the predeformed states PD3 and PD6;
- The direction of surface crack growth in the predeformed states PD3 and PD6 does not follow the direction of the overall microstructure alignment;
- The crack paths in both undeformed and predeformed material was tortuous.
Further work is required to explain the effect of predeformation on the fatigue crack path and to distinguish between the effect from work hardening and microstructure alignment. To isolate the effect of work hardening and microstructure alignment, a heat treatment is suggested for stress relief. The critical step is to avoid spheroidization and changes in crystallographic orientation. In situ SEM fatigue crack propagation testing is also suggested by using single edge notched plate specimens with a uniform but different degree of predeformation. This would provide a more comprehensive understanding of the influence of microstructure alignment on crack propagation. It is possible to extract such plates from test bars predeformed by the method described in this study.
Supplementary Materials
The following supporting information can be downloaded at: https://www.mdpi.com/article/10.3390/met13101726/s1.
Author Contributions
Conceptualization, D.G. and J.A.; methodology, D.G. and J.A.; software, D.G.; formal analysis, D.G.; investigation, D.G.; resources, J.A.; data curation, D.G.; writing—original draft preparation, D.G.; writing—review and editing, D.G. and J.A.; visualization, D.G.; supervision, J.A.; project administration, J.A.; funding acquisition, J.A. All authors have read and agreed to the published version of the manuscript.
Funding
This work is a part of the activities within the center of Excellence CHARMEC. They are funded within the European Unions’s Horizon 2020 research and innovation programme in the Shift2Rail projects In2Track2 and In2Track3 under grant agreements No. 826255 and 101012456 and in the Europe Rail project IAM4RAIL under grant agreement No. 101101966.
Data Availability Statement
Data will be made available on request.
Conflicts of Interest
The authors declare no conflict of interest. The funders had no role in the design of the study; in the collection, analyses, or interpretation of data; in the writing of the manuscript; or in the decision to publish the results.
Appendix A
Figure A1.
Fracture surface of the predeformed test bars loaded with a nominal stress amplitude corresponding to 60% of the offset yield strength, . (a) shows the PD3 test bars and (b) shows the PD6 Test bars.
Figure A1.
Fracture surface of the predeformed test bars loaded with a nominal stress amplitude corresponding to 60% of the offset yield strength, . (a) shows the PD3 test bars and (b) shows the PD6 Test bars.

Figure A2.
Fracture surface of predeformed test bars loaded with a nominal stress amplitude corresponding to 70% of the offset yield strength, . (a) shows the PD3 test bars and (b) shows the PD6 Test bars.
Figure A2.
Fracture surface of predeformed test bars loaded with a nominal stress amplitude corresponding to 70% of the offset yield strength, . (a) shows the PD3 test bars and (b) shows the PD6 Test bars.

References
- Magel, E.; Mutton, P.; Ekberg, A.; Kapoor, A. Rolling contact fatigue, wear and broken rail derailments. Wear 2016, 366–367, 249–257. [Google Scholar] [CrossRef]
- Haidemenopoulos, G.N.; Zervaki, A.D.; Terezakis, P.; Tzanis, J.; Giannakopoulos, A.E.; Kotouzas, M.K. Investigation of rolling contact fatigue cracks in a grade 900A rail steel of a metro track. Fatigue Fract. Eng. Mater. Struct. 2006, 29, 887–900. [Google Scholar] [CrossRef]
- Toribio, J.; González, B.; Matos, J.C.; Ayaso, F.J. Influence of Microstructure on Strength and Ductility in Fully Pearlitic Steels. Metals 2016, 6, 318. [Google Scholar] [CrossRef]
- Jabłońska, M.; Lewandowski, F.; Chmiela, B.; Gronostajski, Z. Advanced Heat Treatment of Pearlitic Rail Steel. Materials 2023, 16, 6430. [Google Scholar] [CrossRef]
- Fei, J.; Zhou, G.; Zhou, J.; Zhou, X.; Li, Z.; Zuo, D.; Wu, R. Research on the Effect of Pearlite Lamellar Spacing on Rolling Contact Wear Behavior of U75V Rail Steel. Metals 2023, 13, 237. [Google Scholar] [CrossRef]
- Hyzak, J.M.; Bernstein, I. The role of microstructure on the strength and toughness of fully pearlitic steels. Met. Trans. A 1976, 7, 1217–1224. [Google Scholar] [CrossRef]
- Guo, N.; Liu, Q. Back-scattered electron imaging combined with EBSD technique for characterization of pearlitic steels. J. Microsc. 2012, 246, 221–228. [Google Scholar] [CrossRef] [PubMed]
- Pointner, P.; Joerg, A.; Jaiswal, J. Definitive Guidelines on the Use of Different Rail Grades, INNOTRACK, Project Number. TIP5-CT-2006-031415; 2009 Technical Report. Available online: https://api.semanticscholar.org/CorpusID:148564871 (accessed on 7 October 2023).
- Maya-Johnson, S.; Ramirez, A.; Toro, A. Fatigue crack growth rate of two pearlitic rail steels. Eng. Fract. Mech. 2015, 138, 63–72. [Google Scholar] [CrossRef]
- Alwahdi, F.A.; Kapoor, A.; Franklin, F.J. Subsurface microstructural analysis and mechanical properties of pearlitic rail steels in service. Wear 2013, 302, 1453–1460. [Google Scholar] [CrossRef]
- Dylewski, B.; Risbet, M.; Bouvier, S. Experimental Characterization of the Tridimensional Gradient of Microstructure Induced by RCF in the Rolling Band of Rails. Procedia Eng. 2015, 133, 202–210. [Google Scholar] [CrossRef]
- Eden, H.C.; Garnham, J.E.; Davis, C.L. Influential microstructural changes on rolling contact fatigue crack initiation in pearlitic rail steels. Mater. Sci. Technol. 2005, 21, 623–629. [Google Scholar] [CrossRef]
- Masoumi, M.; Ariza, E.A.; Sinatora, A.; Goldenstein, H. Role of crystallographic orientation and grain boundaries in fatigue crack propagation in used pearlitic rail steel. Mater. Sci. Eng. A 2018, 722, 147–155. [Google Scholar] [CrossRef]
- Dylewski, B.; Risbet, M.; Bouvier, S. The tridimensional gradient of microstructure in worn rails—Experimental characterization of plastic deformation accumulated by RCF. Wear 2017, 392–393, 50–59. [Google Scholar] [CrossRef]
- Fletcher, D.I.; Franklin, F.J.; Kapoor, A. Rail surface fatigue and wear. In Wheel-Rail Interface Handbook; Woodhead Publishing Ltd.: Cambridge, UK, 2009; pp. 280–310. [Google Scholar] [CrossRef]
- Johnson, K.L. The Strength of Surfaces in Rolling Contact. Proc. Inst. Mech. Eng. Part C Mech. Eng. Sci. 1989, 203, 151–163. [Google Scholar] [CrossRef]
- Cannon, D.F.; Edel, K.O.; Grassie, S.L.; Sawley, K. Rail defects: An overview. Fatigue Fract. Eng. Mater. Struct. 2003, 26, 865–886. [Google Scholar] [CrossRef]
- Hohenwarter, A.; Taylor, A.; Stock, R.; Pippan, R. Effect of large shear deformations on the fracture behavior of a fully pearlitic steel. Metall. Mater. Trans. A Phys. Metall. Mater. Sci. 2011, 42, 1609–1618. [Google Scholar] [CrossRef]
- Wetscher, F.; Stock, R.; Pippan, R. Changes in the mechanical properties of a pearlitic steel due to large shear deformation. Mater. Sci. Eng. A 2007, 445–446, 237–243. [Google Scholar] [CrossRef]
- Kammerhofer, C.; Hohenwarter, A.; Scheriau, S.; Brantner, H.P.; Pippan, R. Influence of morphology and structural size on the fracture behavior of a nanostructured pearlitic steel. Mater. Sci. Eng. A 2013, 585, 190–196. [Google Scholar] [CrossRef]
- Leitner, T.; Trummer, G.; Pippan, R.; Hohenwarter, A. Influence of severe plastic deformation and specimen orientation on the fatigue crack propagation behavior of a pearlitic steel. Mater. Sci. Eng. A 2018, 710, 260–270. [Google Scholar] [CrossRef]
- Leitner, T.; Hohenwarter, A.; Pippan, R. Anisotropy in fracture and fatigue resistance of pearlitic steels and its effect on the crack path. Int. J. Fatigue 2019, 124, 528–536. [Google Scholar] [CrossRef]
- Meyer, K.A.; Ekh, M.; Ahlström, J. Modeling of kinematic hardening at large biaxial deformations in pearlitic rail steel. Int. J. Solids Struct. 2018, 130–131, 122–132. [Google Scholar] [CrossRef]
- Meyer, K.A.; Ekh, M.; Ahlström, J. Anisotropic yield surfaces after large shear deformations in pearlitic steel. Eur. J. Mech. A/Solids 2020, 82, 103977. [Google Scholar] [CrossRef]
- Nikas, D.; Zhang, X.; Ahlström, J. Evaluation of local strength via microstructural quantification in a pearlitic rail steel deformed by simultaneous compression and torsion. Mater. Sci. Eng. A 2018, 737, 341–347. [Google Scholar] [CrossRef]
- Meyer, K.A.; Nikas, D.; Ahlström, J. Microstructure and mechanical properties of the running band in a pearlitic rail steel: Comparison between biaxially deformed steel and field samples. Wear 2018, 396–397, 12–21. [Google Scholar] [CrossRef]
- Zhang, X.; Godfxhorey, A.; Hansen, N.; Huang, X. Hierarchical structures in cold-drawn pearlitic steel wire. Acta Mater. 2013, 61, 4898–4909. [Google Scholar] [CrossRef]
- Ivanisenko, Y.; Lojkowski, W.; Valiev, R.Z.; Fecht, H.J. The mechanism of formation of nanostructure and dissolution of cementite in a pearlitic steel during high pressure torsion. Acta Mater. 2003, 51, 5555–5570. [Google Scholar] [CrossRef]
- Jessop, C.; Ahlström, J.; Persson, C.; Zhang, Y. Damage evolution around white etching layer during uniaxial loading. Fatigue Fract. Eng. Mater. Struct. 2020, 43, 201–208. [Google Scholar] [CrossRef]
- Gigan, G.; Norman, V.; Ahlström, J.; Vernersson, T. Thermomechanical fatigue of grey cast iron brake discs for heavy vehicles. Proc. Inst. Mech. Eng. Part D J. Automob. Eng. 2019, 233, 453–467. [Google Scholar] [CrossRef]
Figure 1.
(a) Material extraction from virgin rail heads. The figure shows the cross-section of a UIC60 rail head profile. The dashed circle shows where the cylindrical rods were extracted and the black circle shows the material in the gauge section of the test bars. (b) drawing of test bars used for predeformation. Dimensions in [mm].
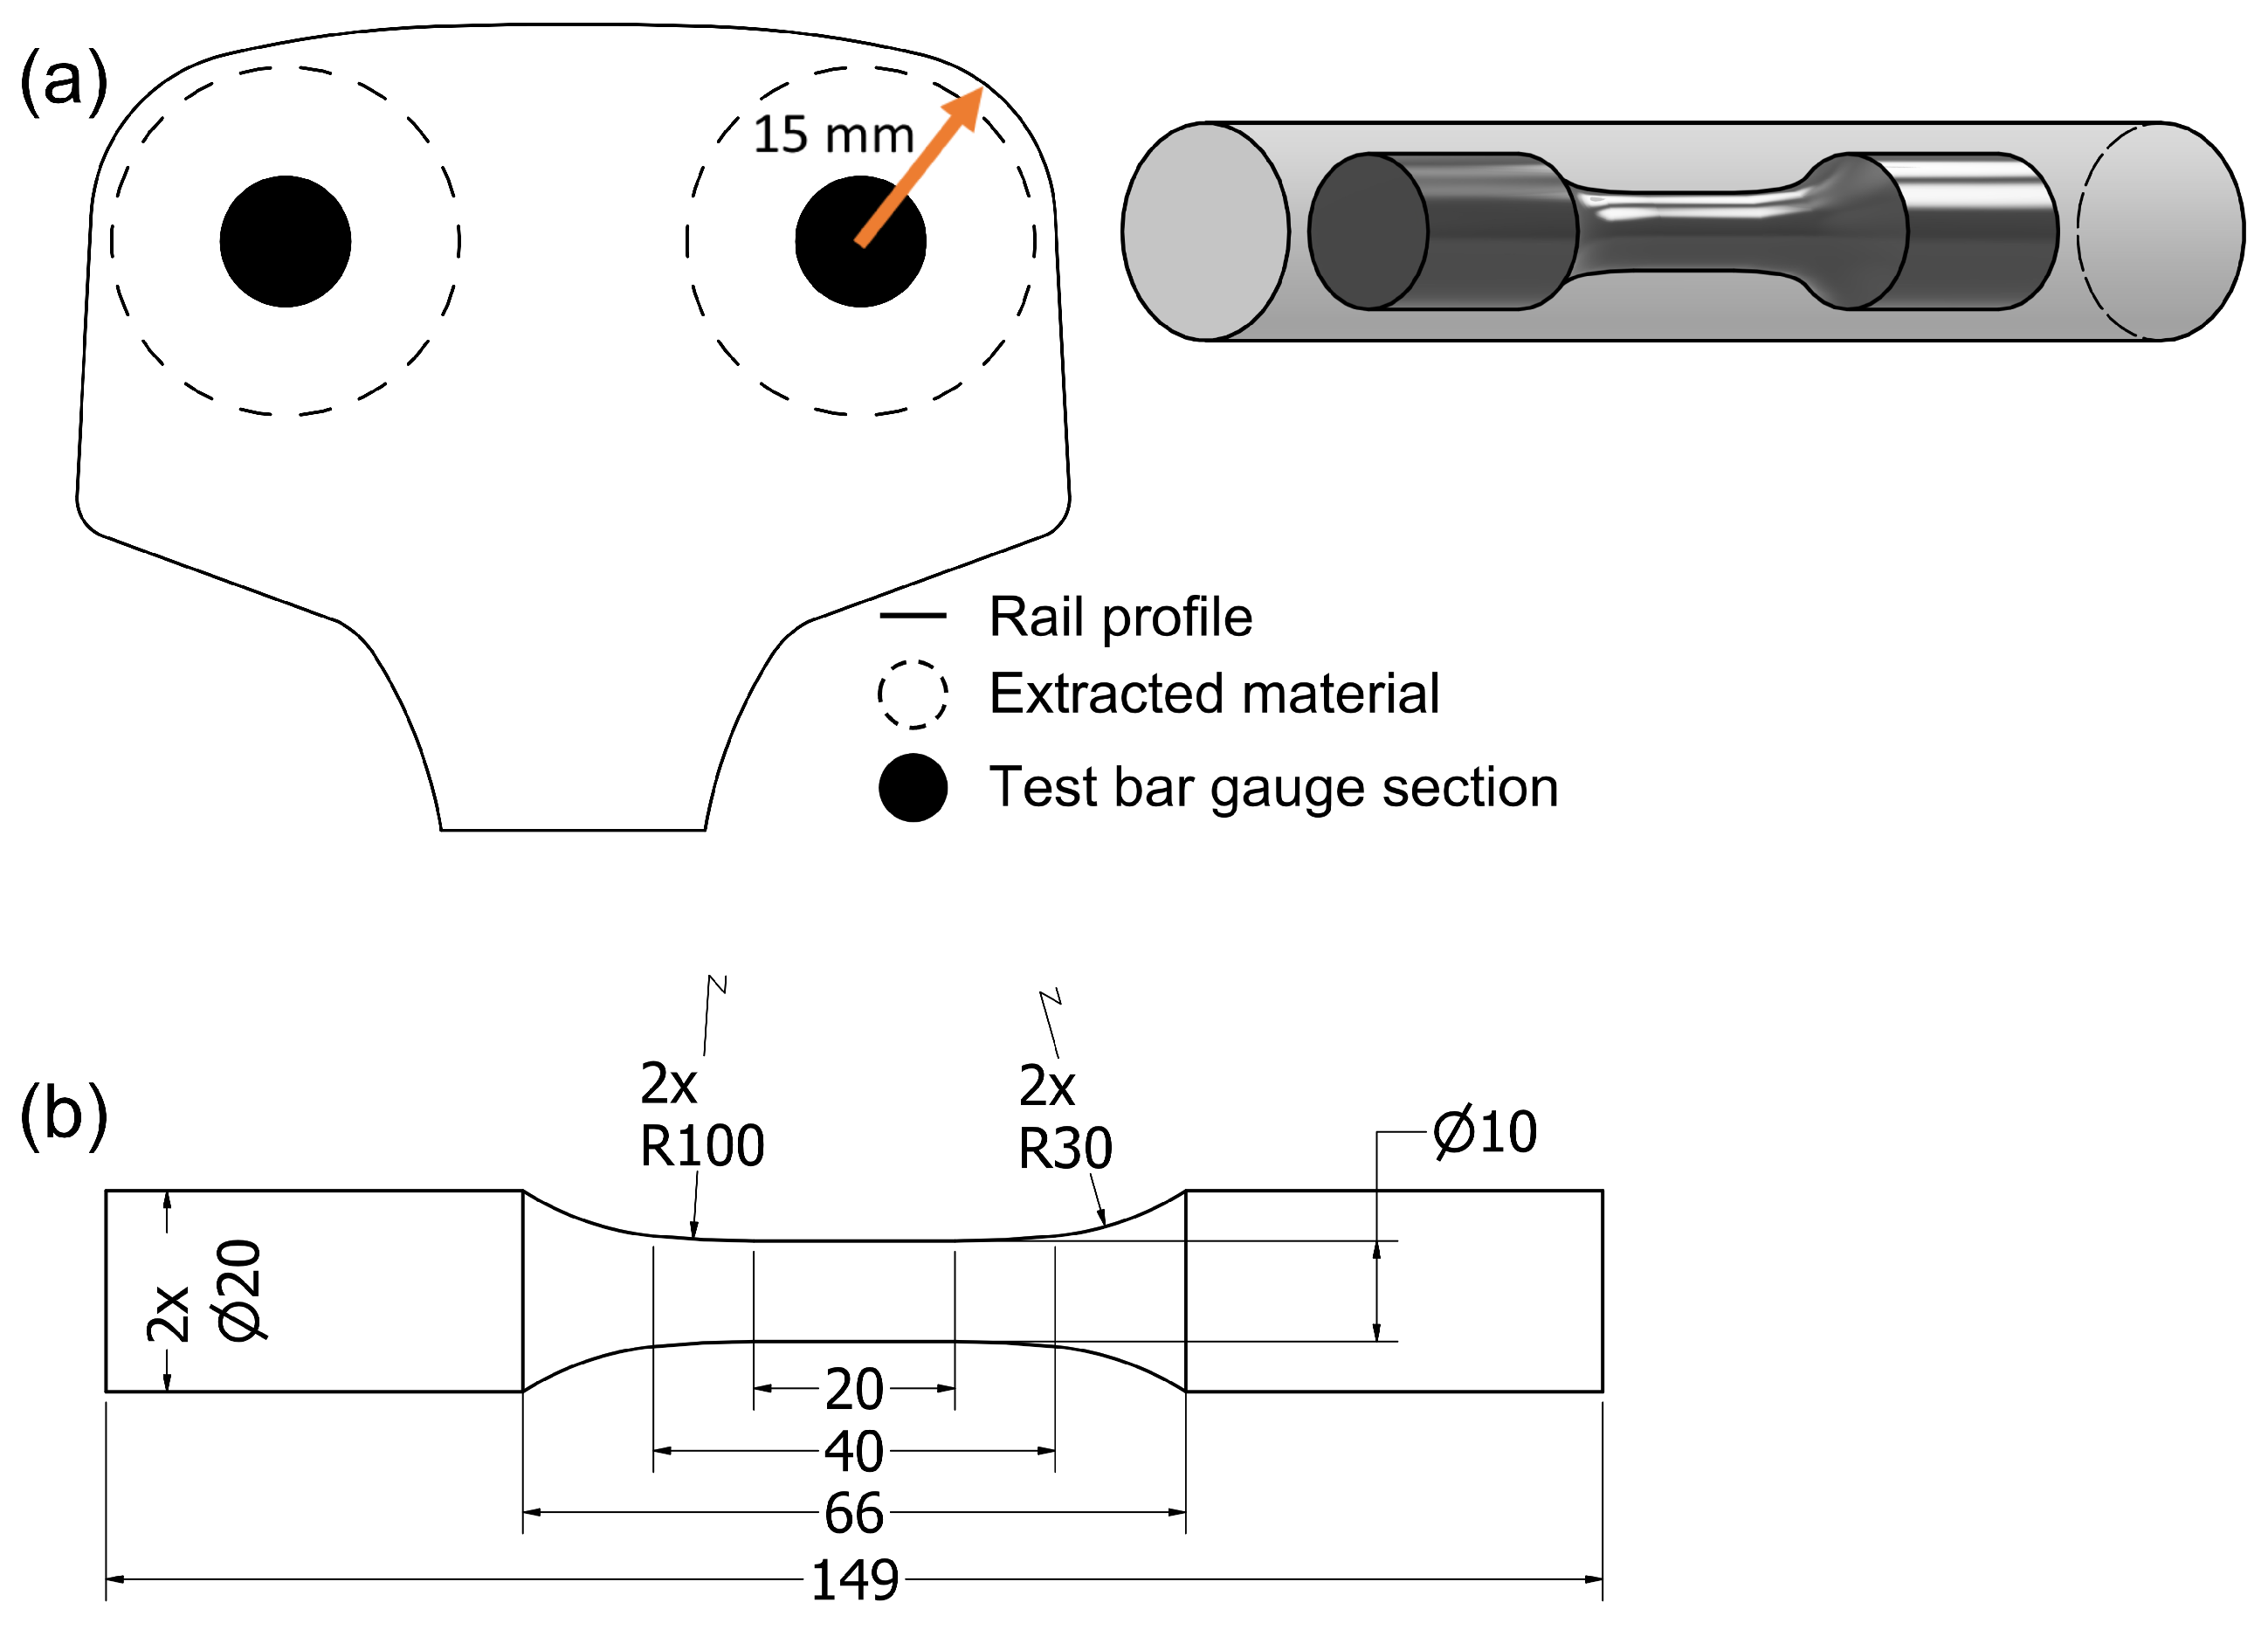
Figure 2.
The predeformation process is shown in (a) and in (b) the shear deformation resulting after twisting 3 × 90 degrees is visualized by the laser etched grid.
Figure 2.
The predeformation process is shown in (a) and in (b) the shear deformation resulting after twisting 3 × 90 degrees is visualized by the laser etched grid.
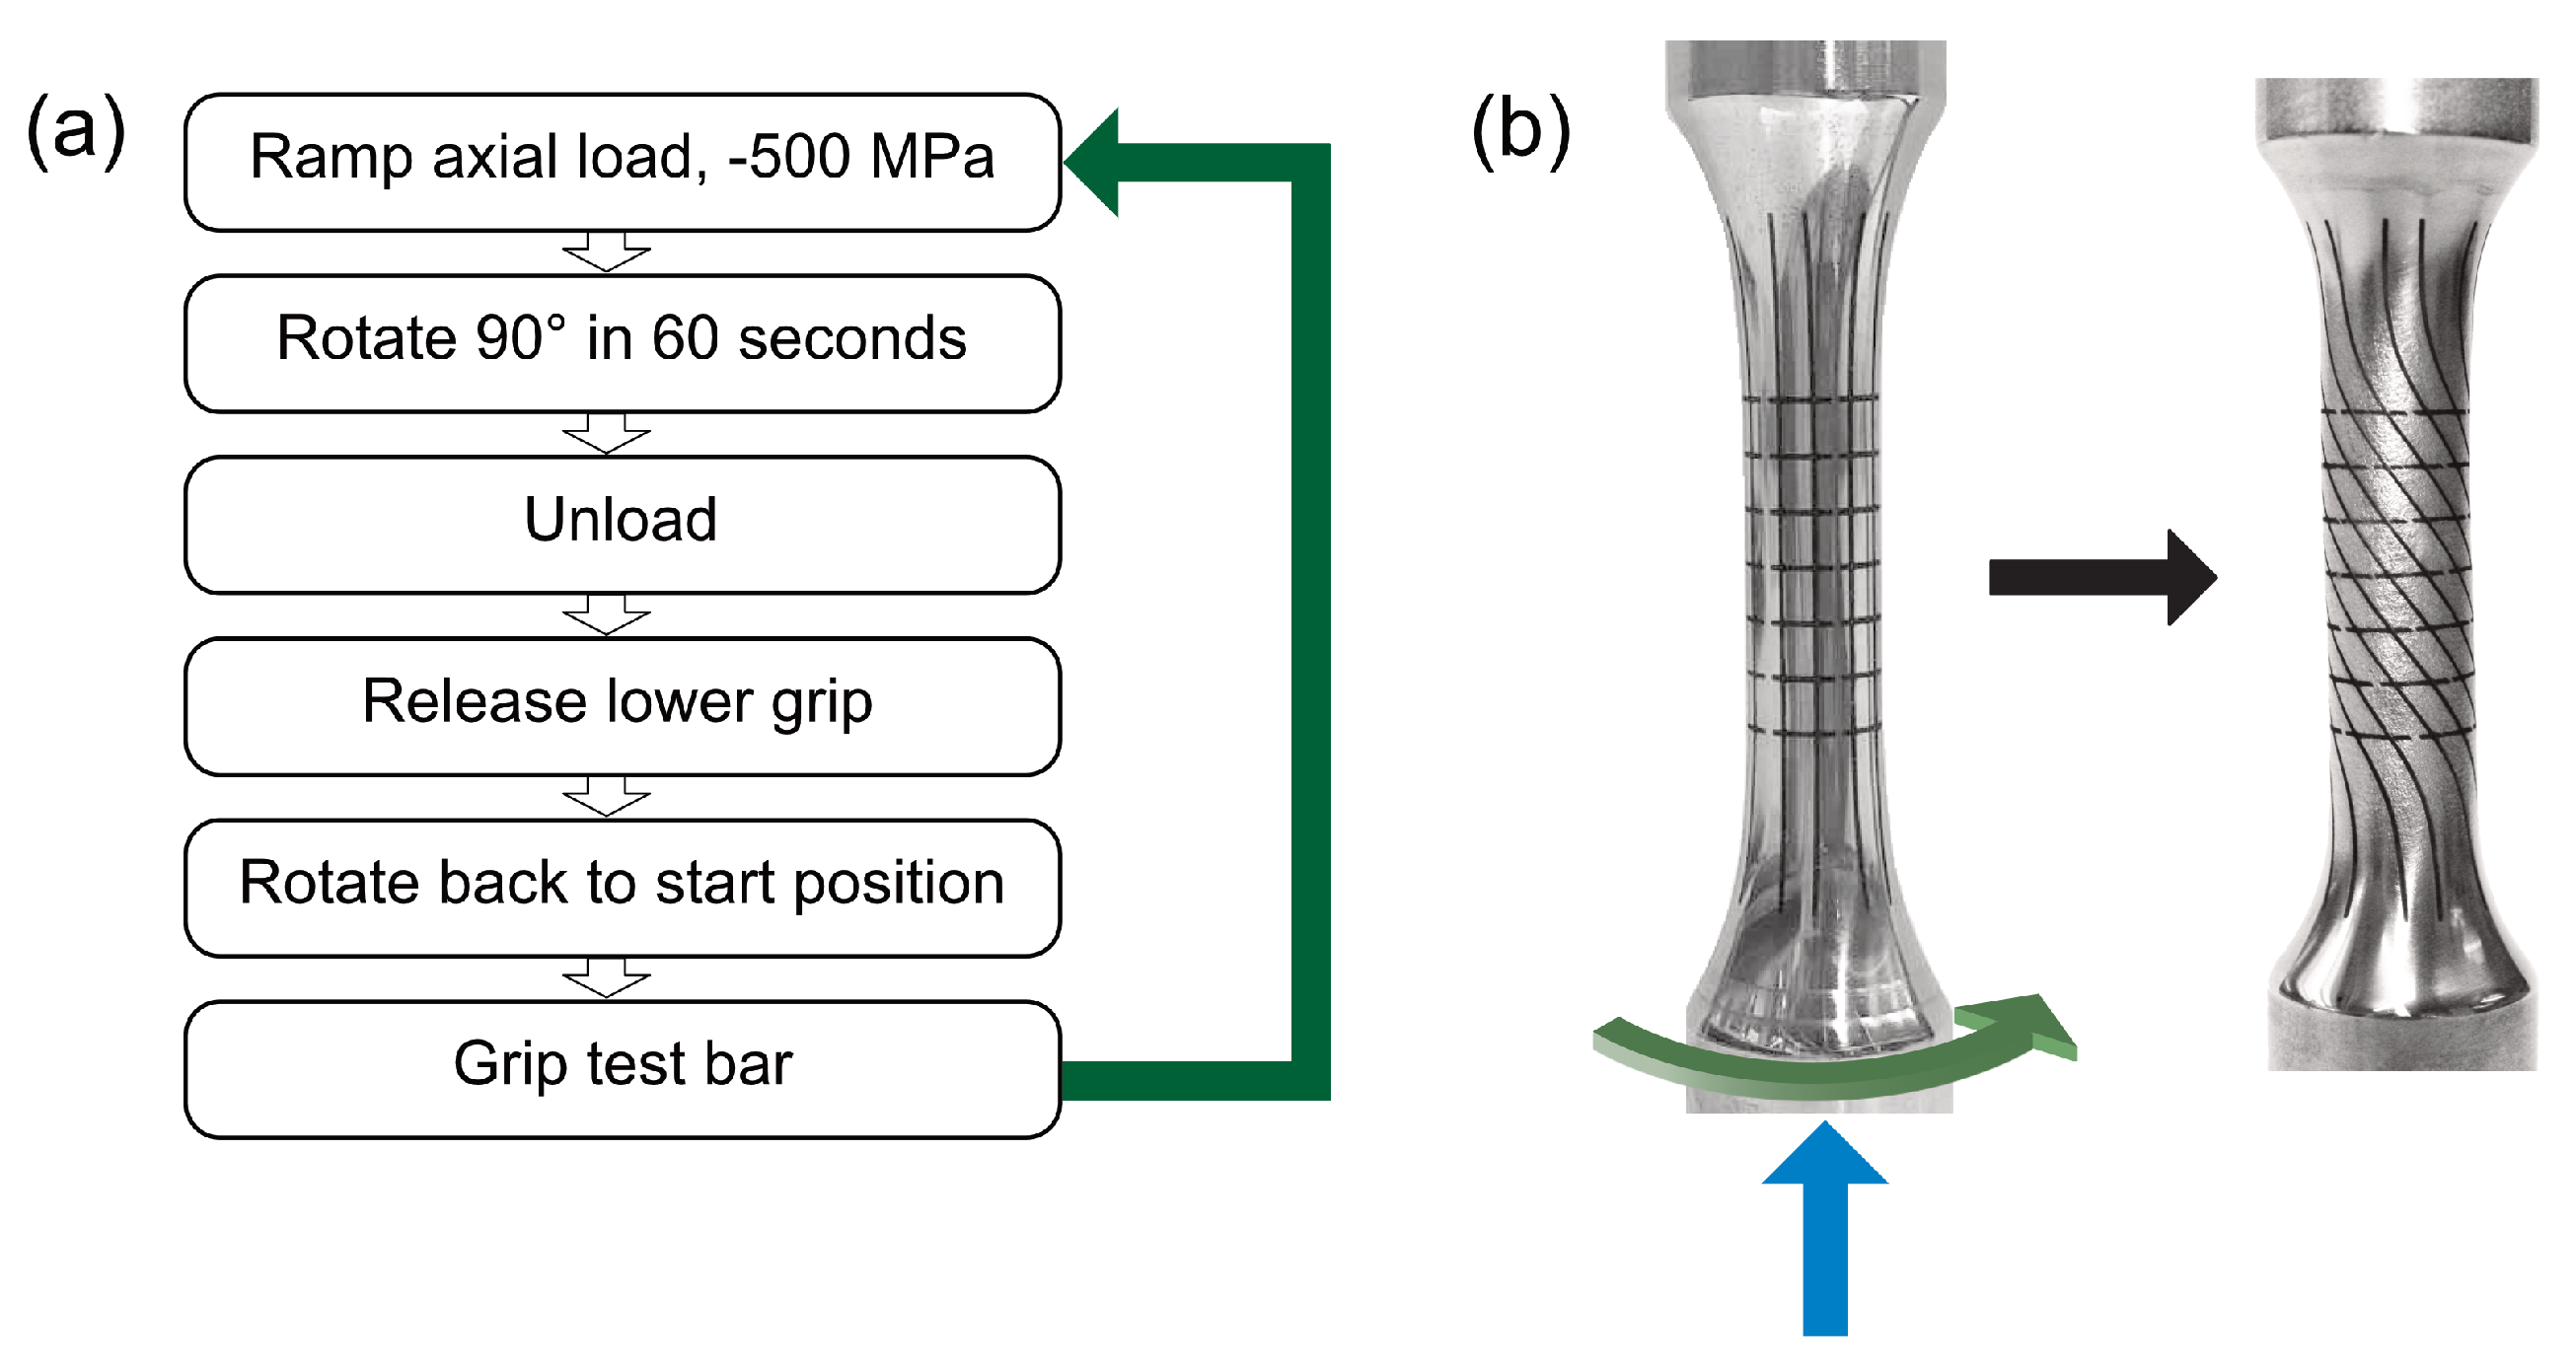
Figure 3.
Drawing of the notched test bars. Dimensions in [mm].
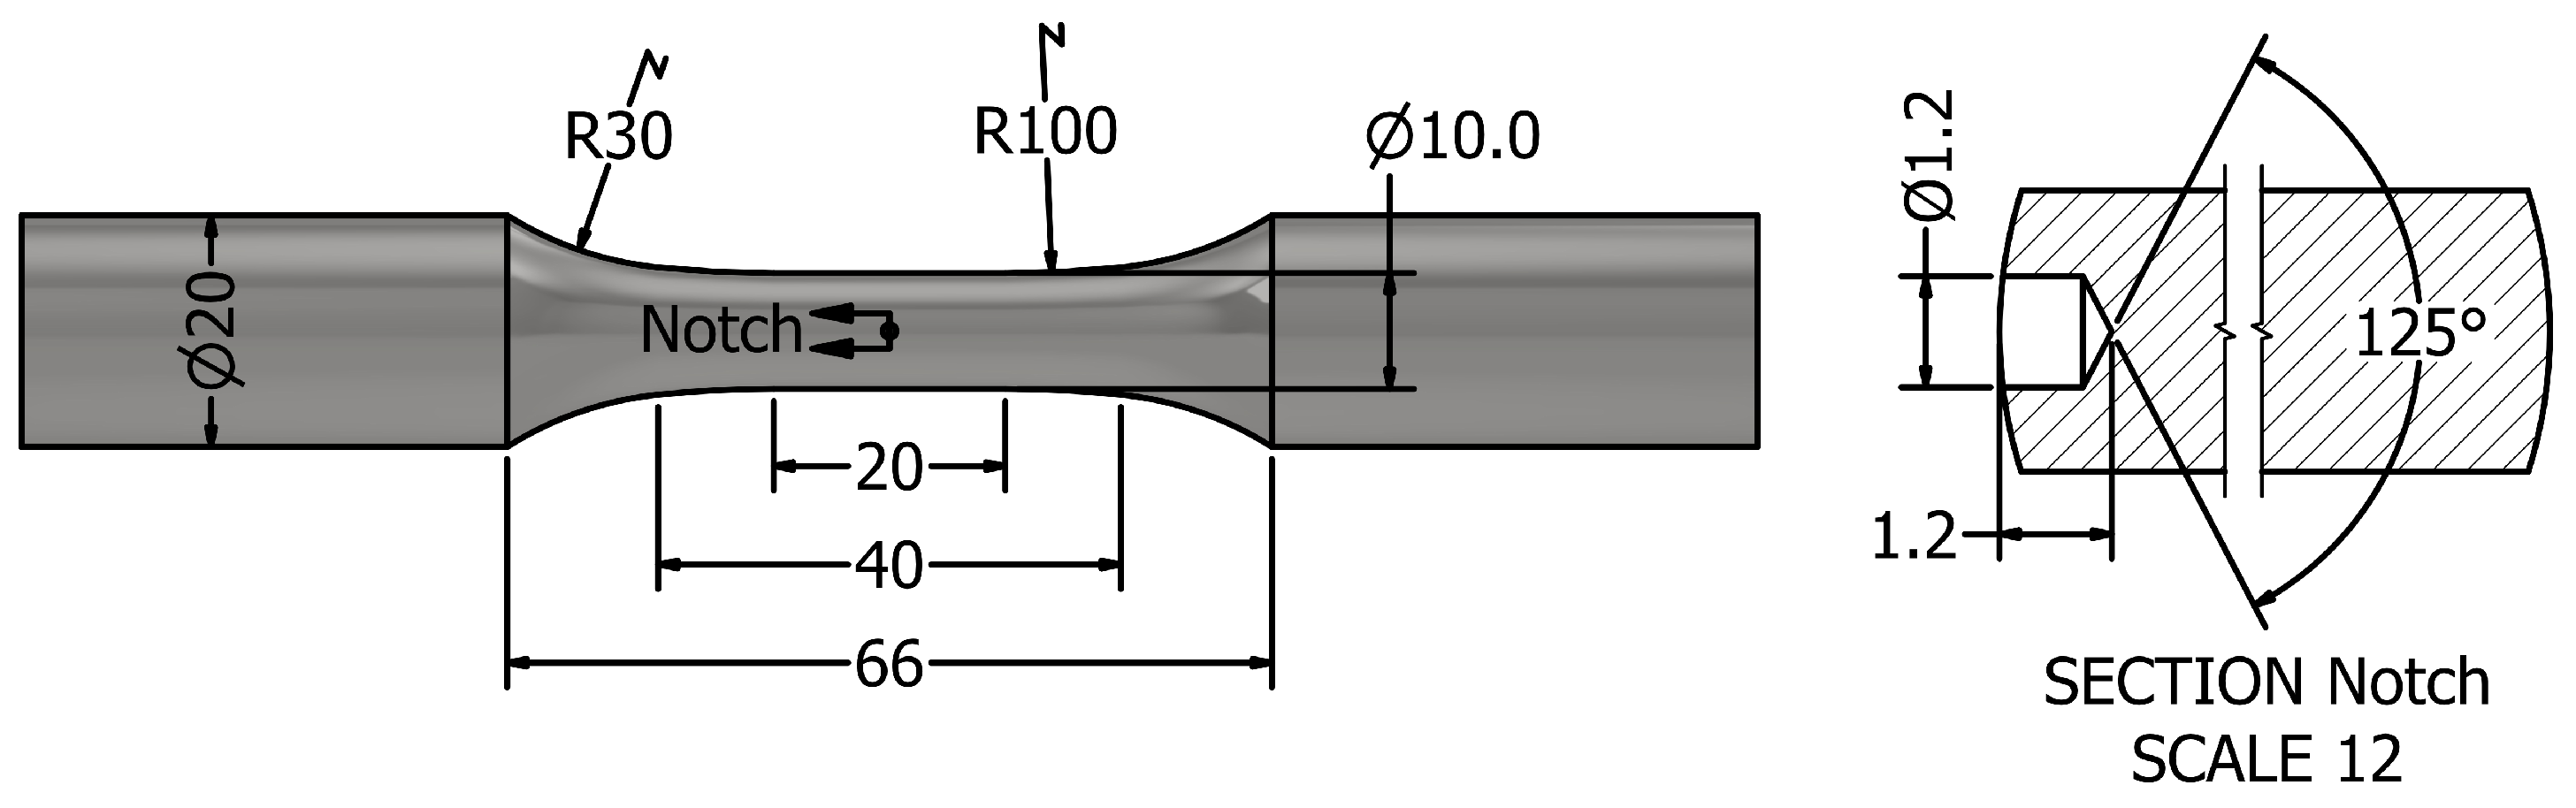
Figure 4.
Visual representation of image acquisition for crack measurement using stereo and optical microscope, including the definition of crack length reported in Section 3.3.
Figure 4.
Visual representation of image acquisition for crack measurement using stereo and optical microscope, including the definition of crack length reported in Section 3.3.

Figure 5.
Measurement of angle (used for calculating surface shear strain in Equation (1)) on predeformed test bars with a laser etched grid.
Figure 5.
Measurement of angle (used for calculating surface shear strain in Equation (1)) on predeformed test bars with a laser etched grid.
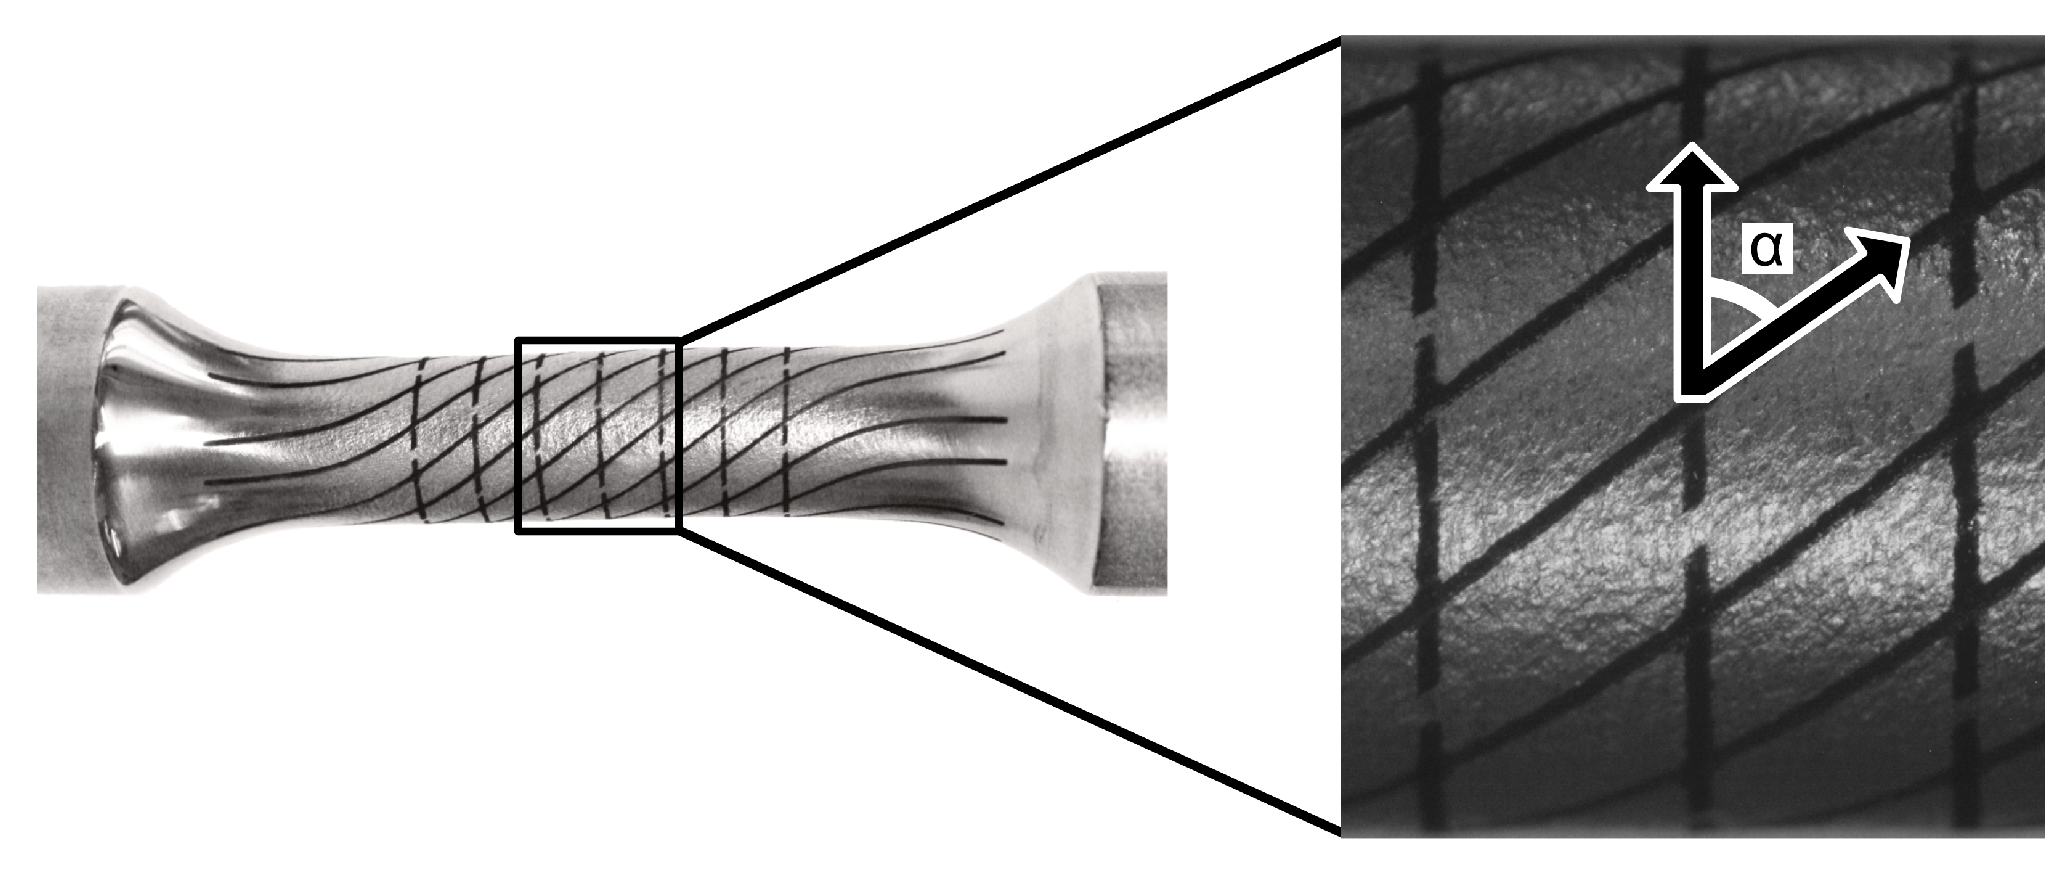
Figure 6.
Illustration of the location of hardness measurement in (a) and indent pattern used for characterizing the hardness gradient in (b).
Figure 6.
Illustration of the location of hardness measurement in (a) and indent pattern used for characterizing the hardness gradient in (b).
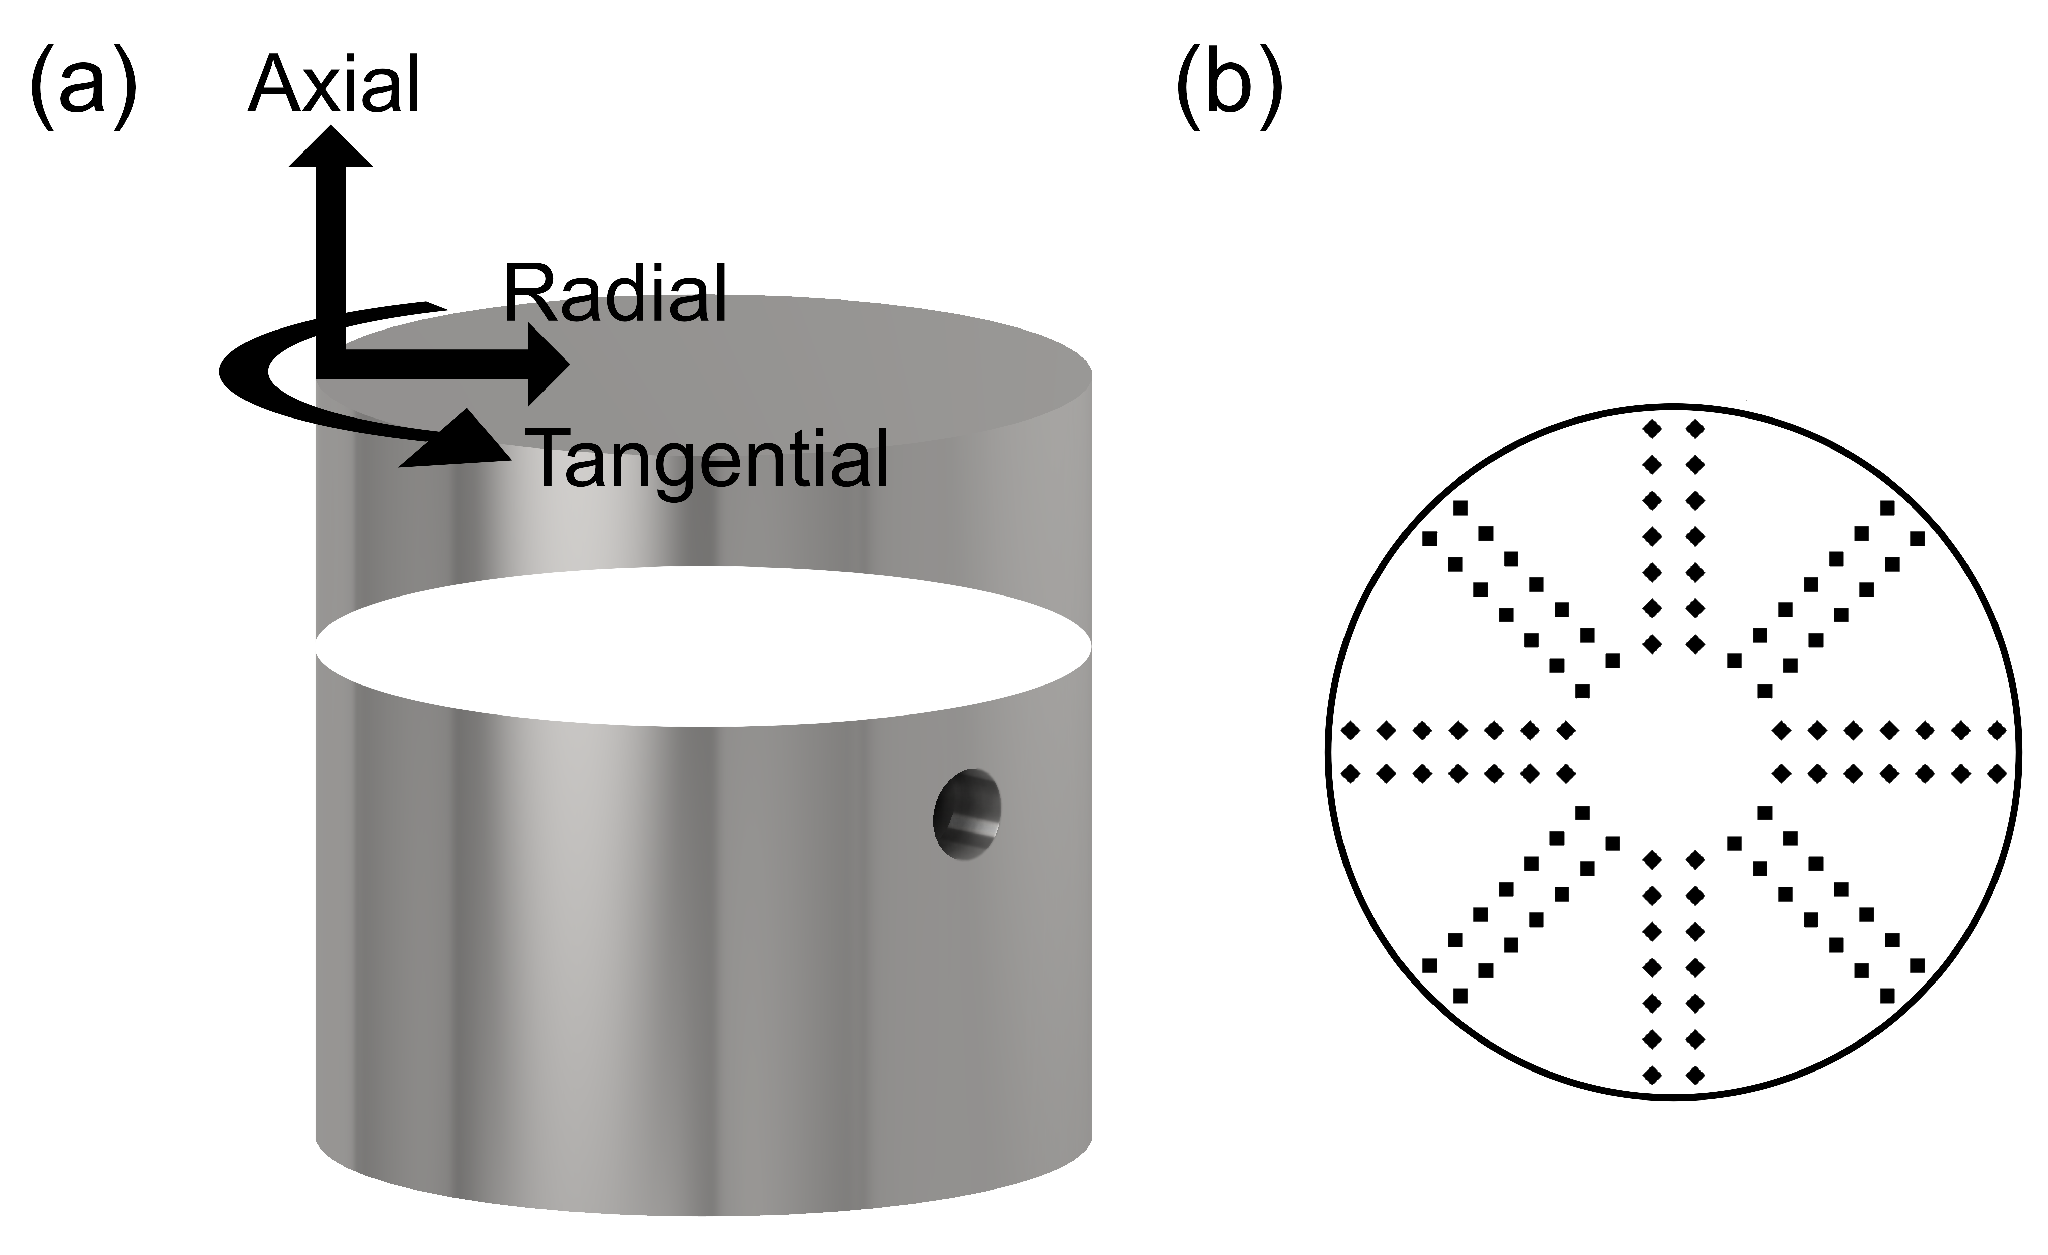
Figure 7.
Hardness distribution, for both undeformed and predeformed samples, measured along the radial direction from the sample (lateral) surface.
Figure 7.
Hardness distribution, for both undeformed and predeformed samples, measured along the radial direction from the sample (lateral) surface.

Figure 8.
Microstructure of a PD3 test bar: (a) SEM micrograph at the notch and (b) optical micrograph, at the cross-section perpendicular to the radial direction, close to the lateral surface.
Figure 8.
Microstructure of a PD3 test bar: (a) SEM micrograph at the notch and (b) optical micrograph, at the cross-section perpendicular to the radial direction, close to the lateral surface.
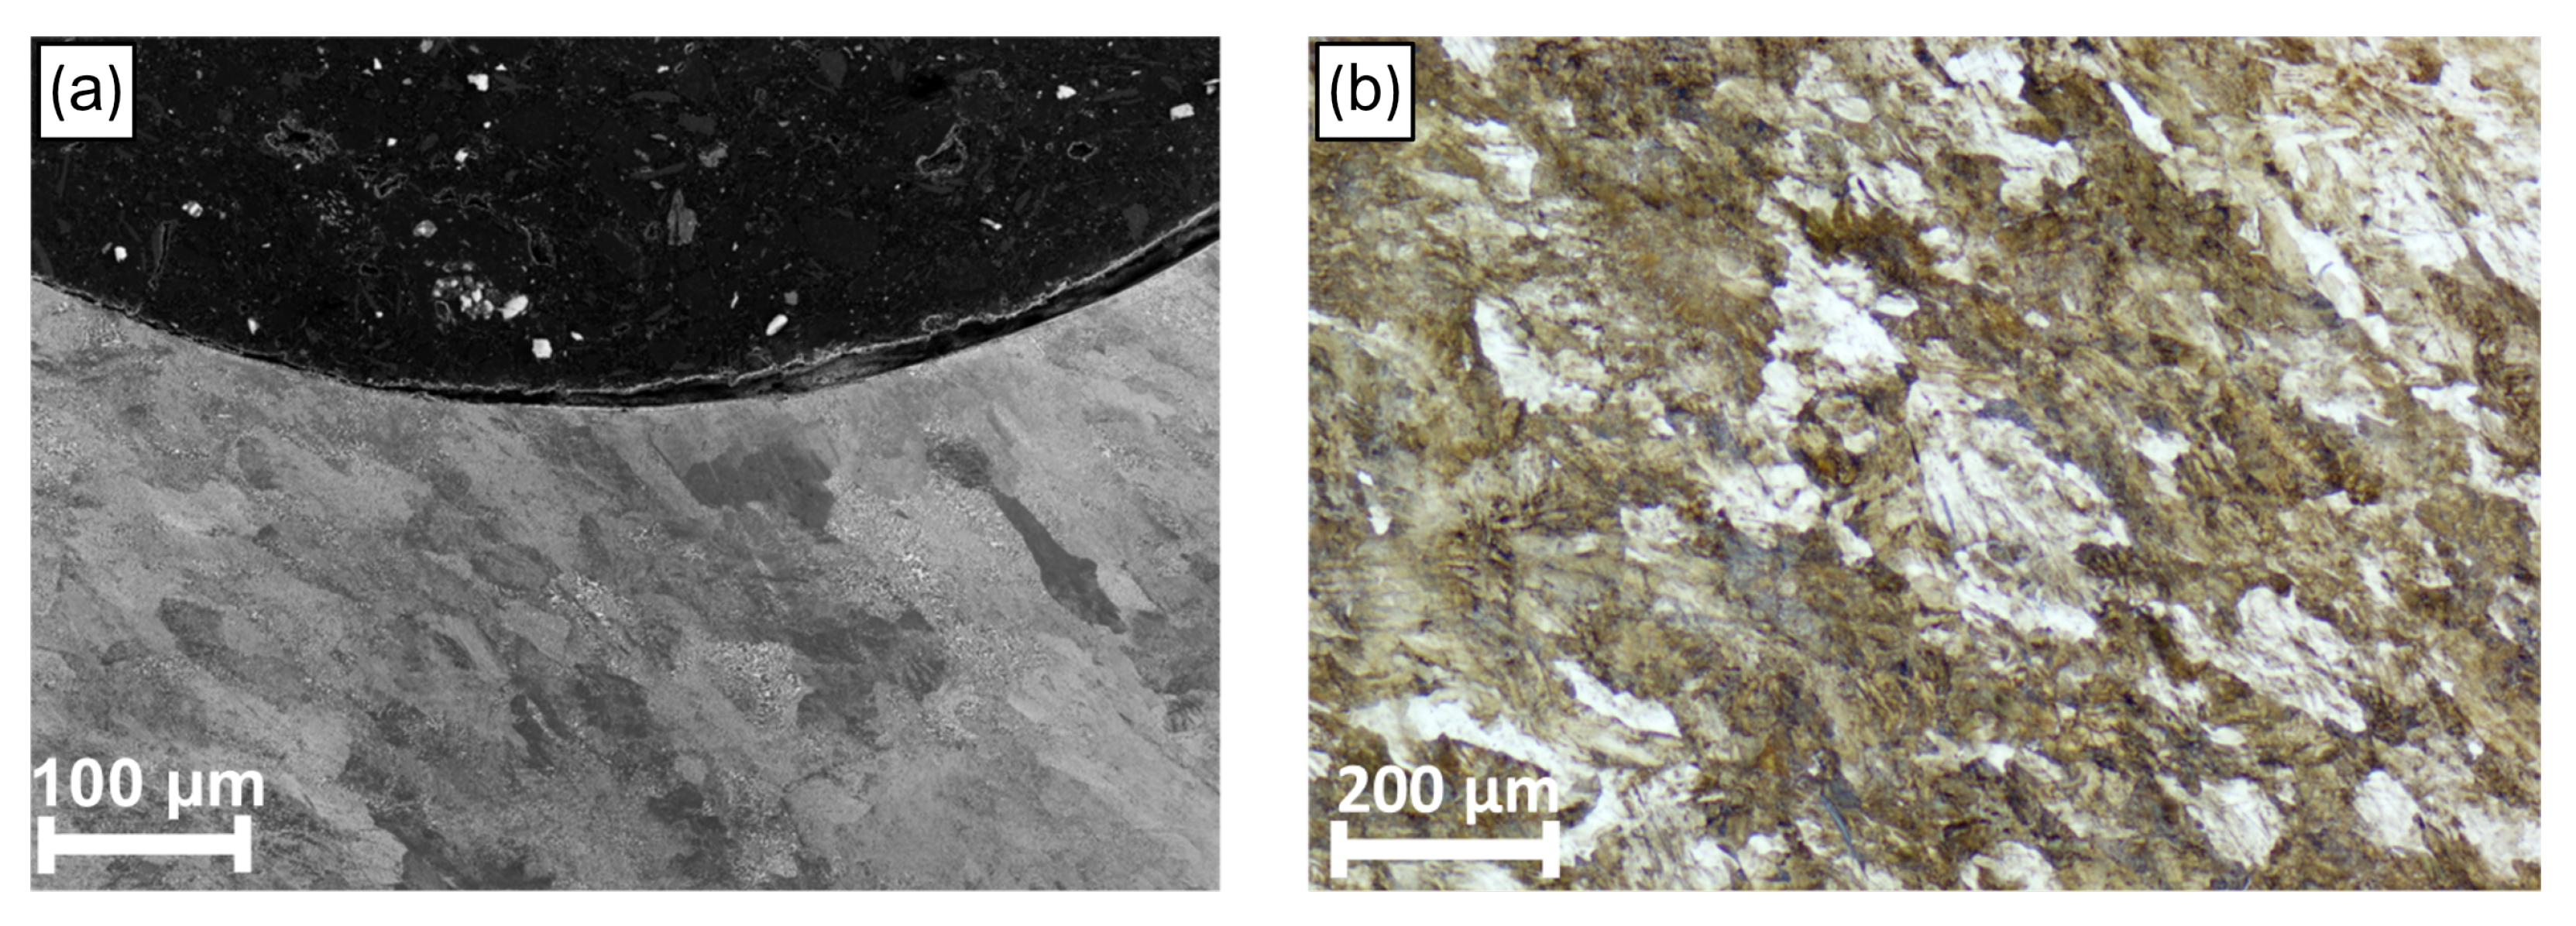
Figure 9.
Orientation of pearlite lamellae in a PD3 test bar. In (a) most of the cementite lamellae have reoriented along tangential (predeformation) direction whilst no preferred direction is observed in (b).
Figure 9.
Orientation of pearlite lamellae in a PD3 test bar. In (a) most of the cementite lamellae have reoriented along tangential (predeformation) direction whilst no preferred direction is observed in (b).

Figure 10.
Microstructure of a PD6 test bar: (a) SEM micrograph at the notch and (b) optical micrograph at the cross-section perpendicular to the radial direction, close to the lateral surface.
Figure 10.
Microstructure of a PD6 test bar: (a) SEM micrograph at the notch and (b) optical micrograph at the cross-section perpendicular to the radial direction, close to the lateral surface.
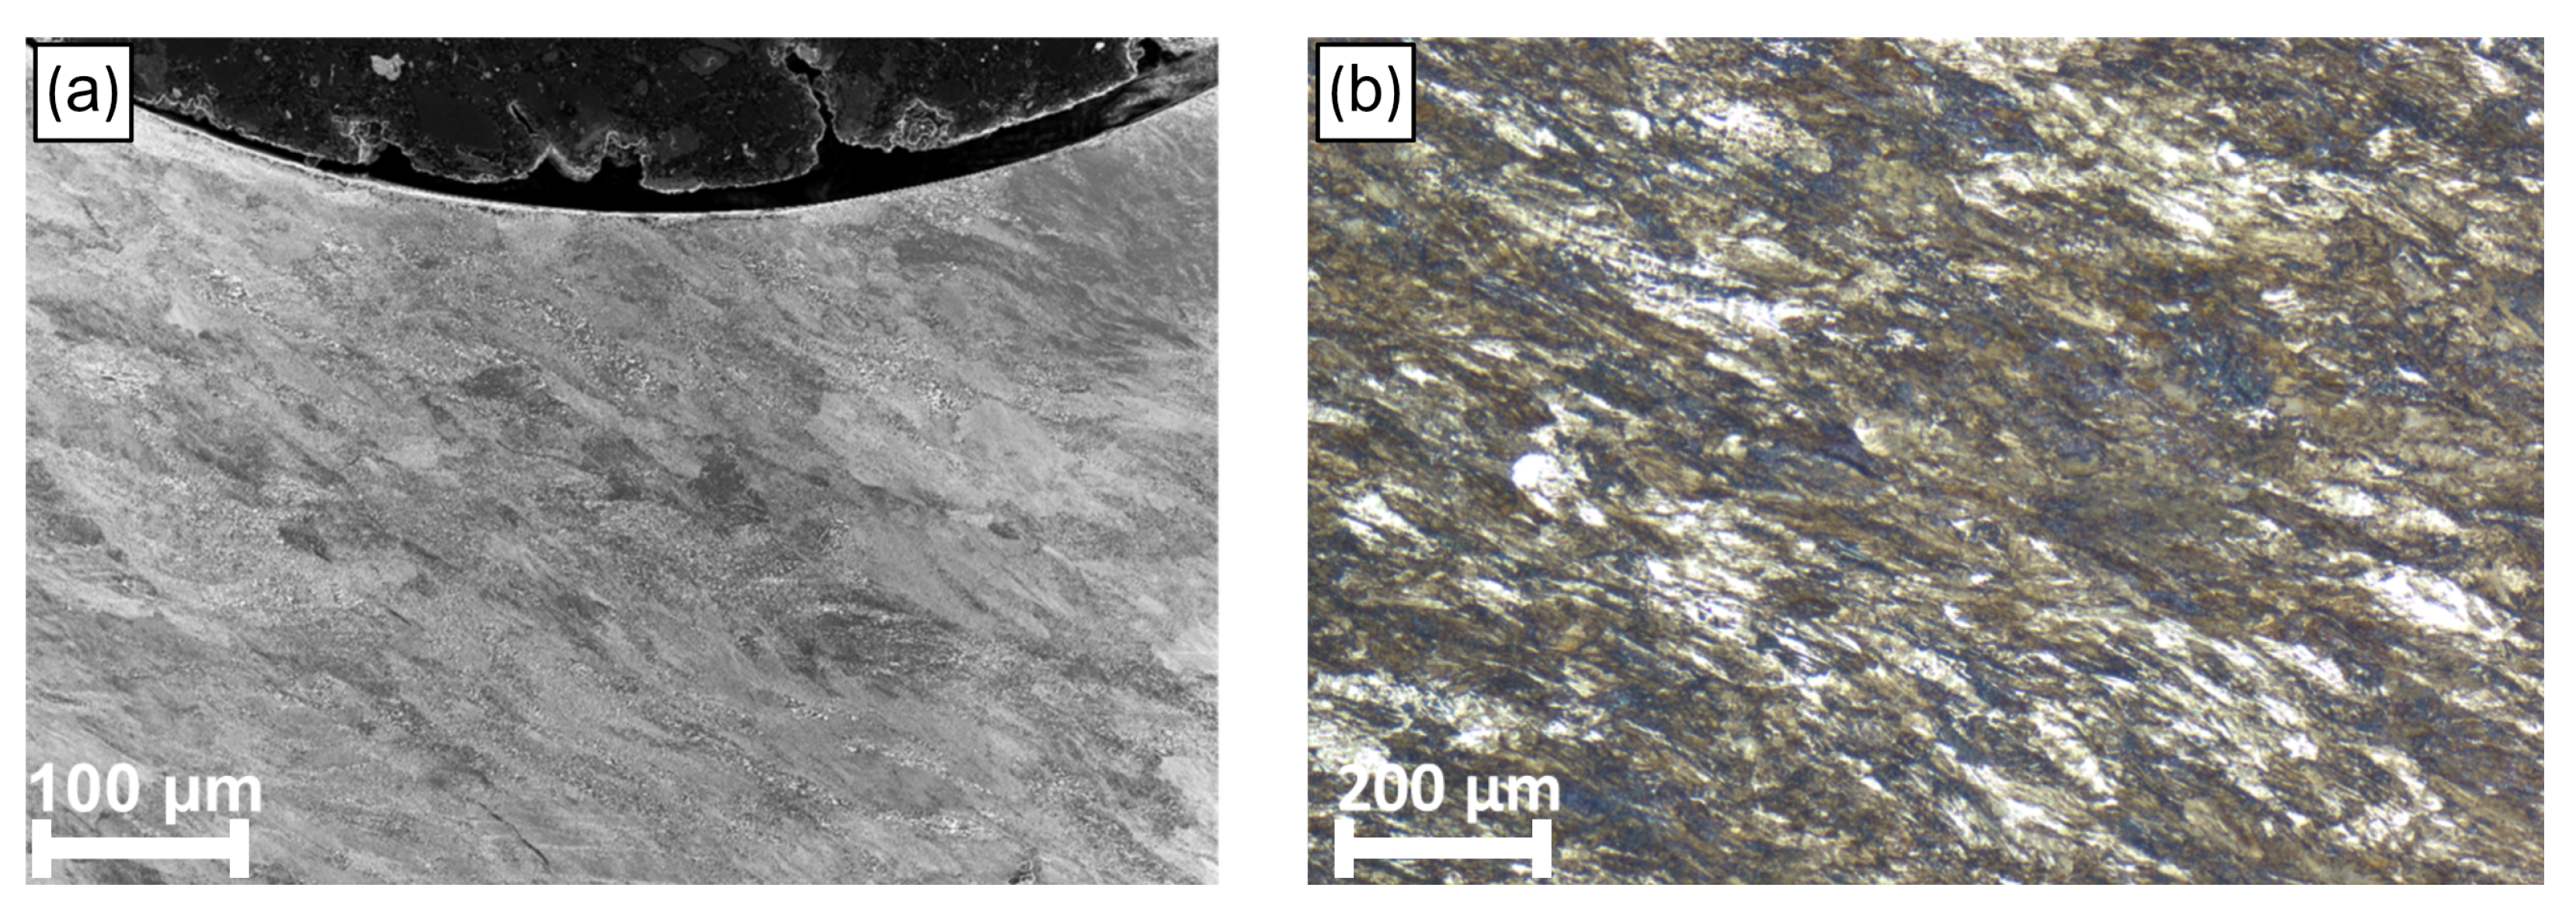
Figure 11.
Orientation of pearlite lamellae in a PD6 test bar. In (a) most of the cementite lamellae have reoriented along the tangential (predeformation) direction whilst no preferred direction is observed in (b).
Figure 11.
Orientation of pearlite lamellae in a PD6 test bar. In (a) most of the cementite lamellae have reoriented along the tangential (predeformation) direction whilst no preferred direction is observed in (b).

Figure 12.
The results from the crack length measurements, conducted for the test series loaded with a nominal stress amplitude corresponding to 60% of .
Figure 12.
The results from the crack length measurements, conducted for the test series loaded with a nominal stress amplitude corresponding to 60% of .
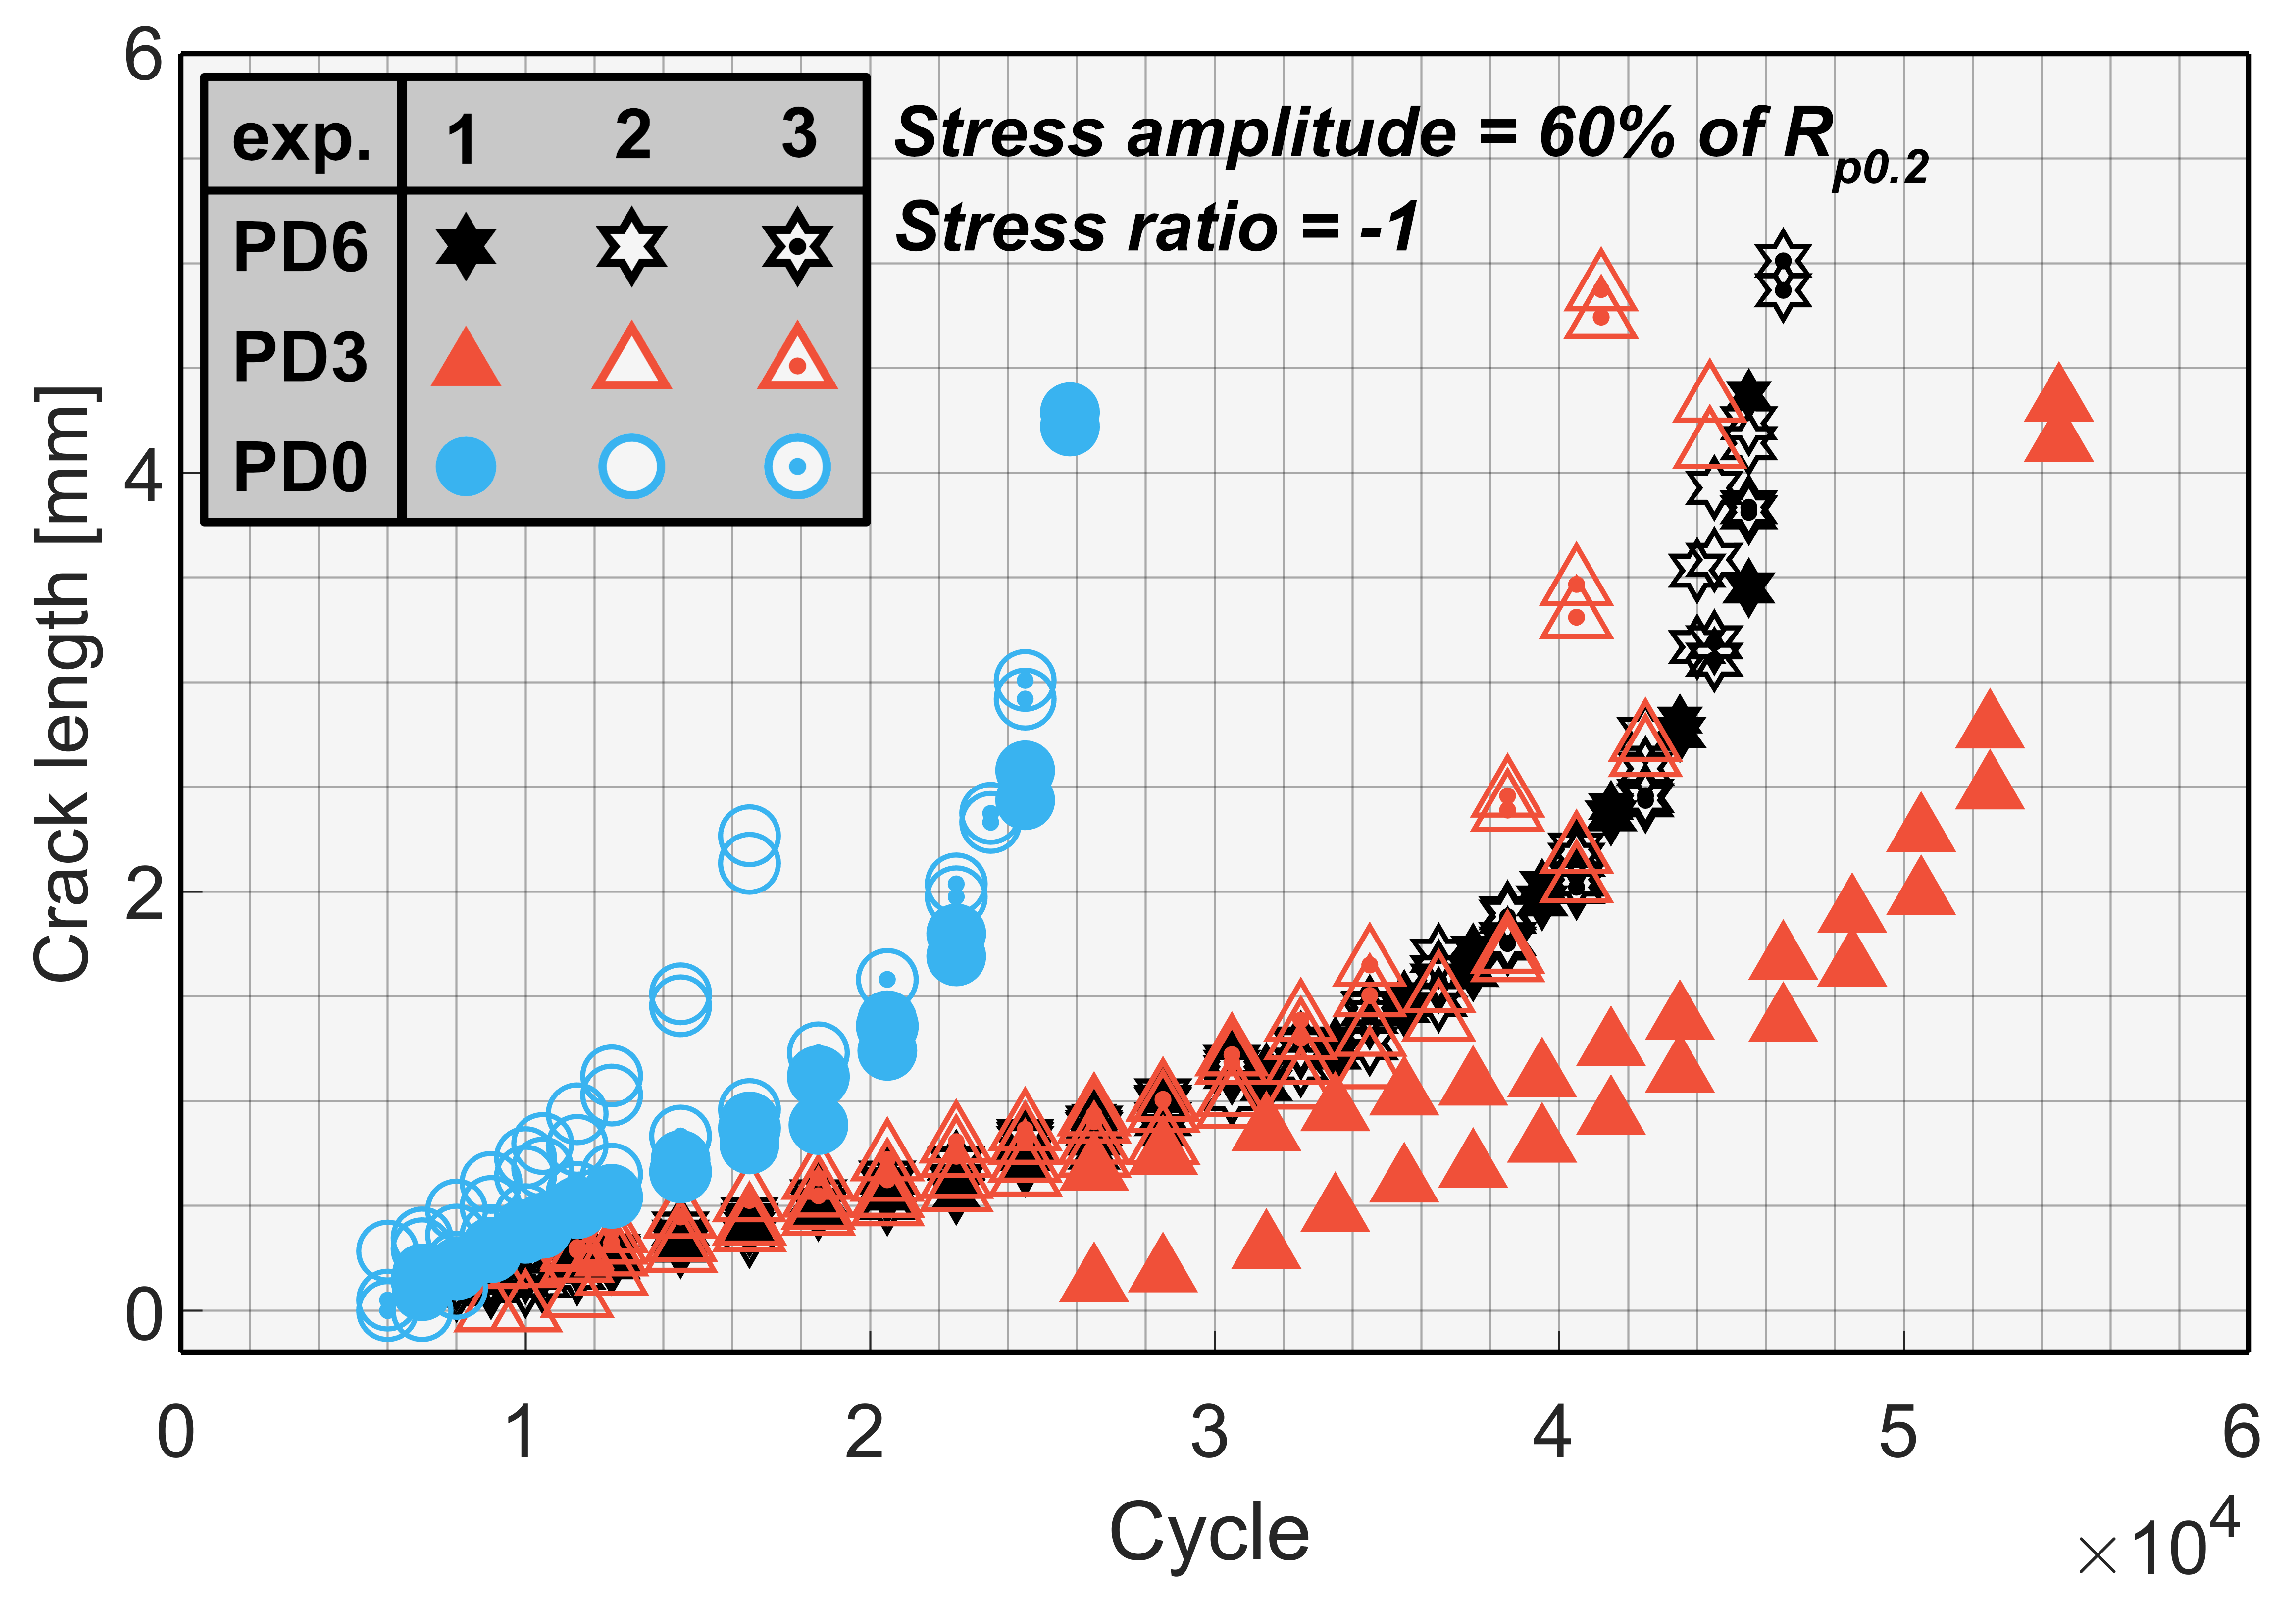
Figure 13.
The results from the crack length measurements, conducted for the test series loaded with a nominal stress amplitude corresponding to 70% of .
Figure 13.
The results from the crack length measurements, conducted for the test series loaded with a nominal stress amplitude corresponding to 70% of .
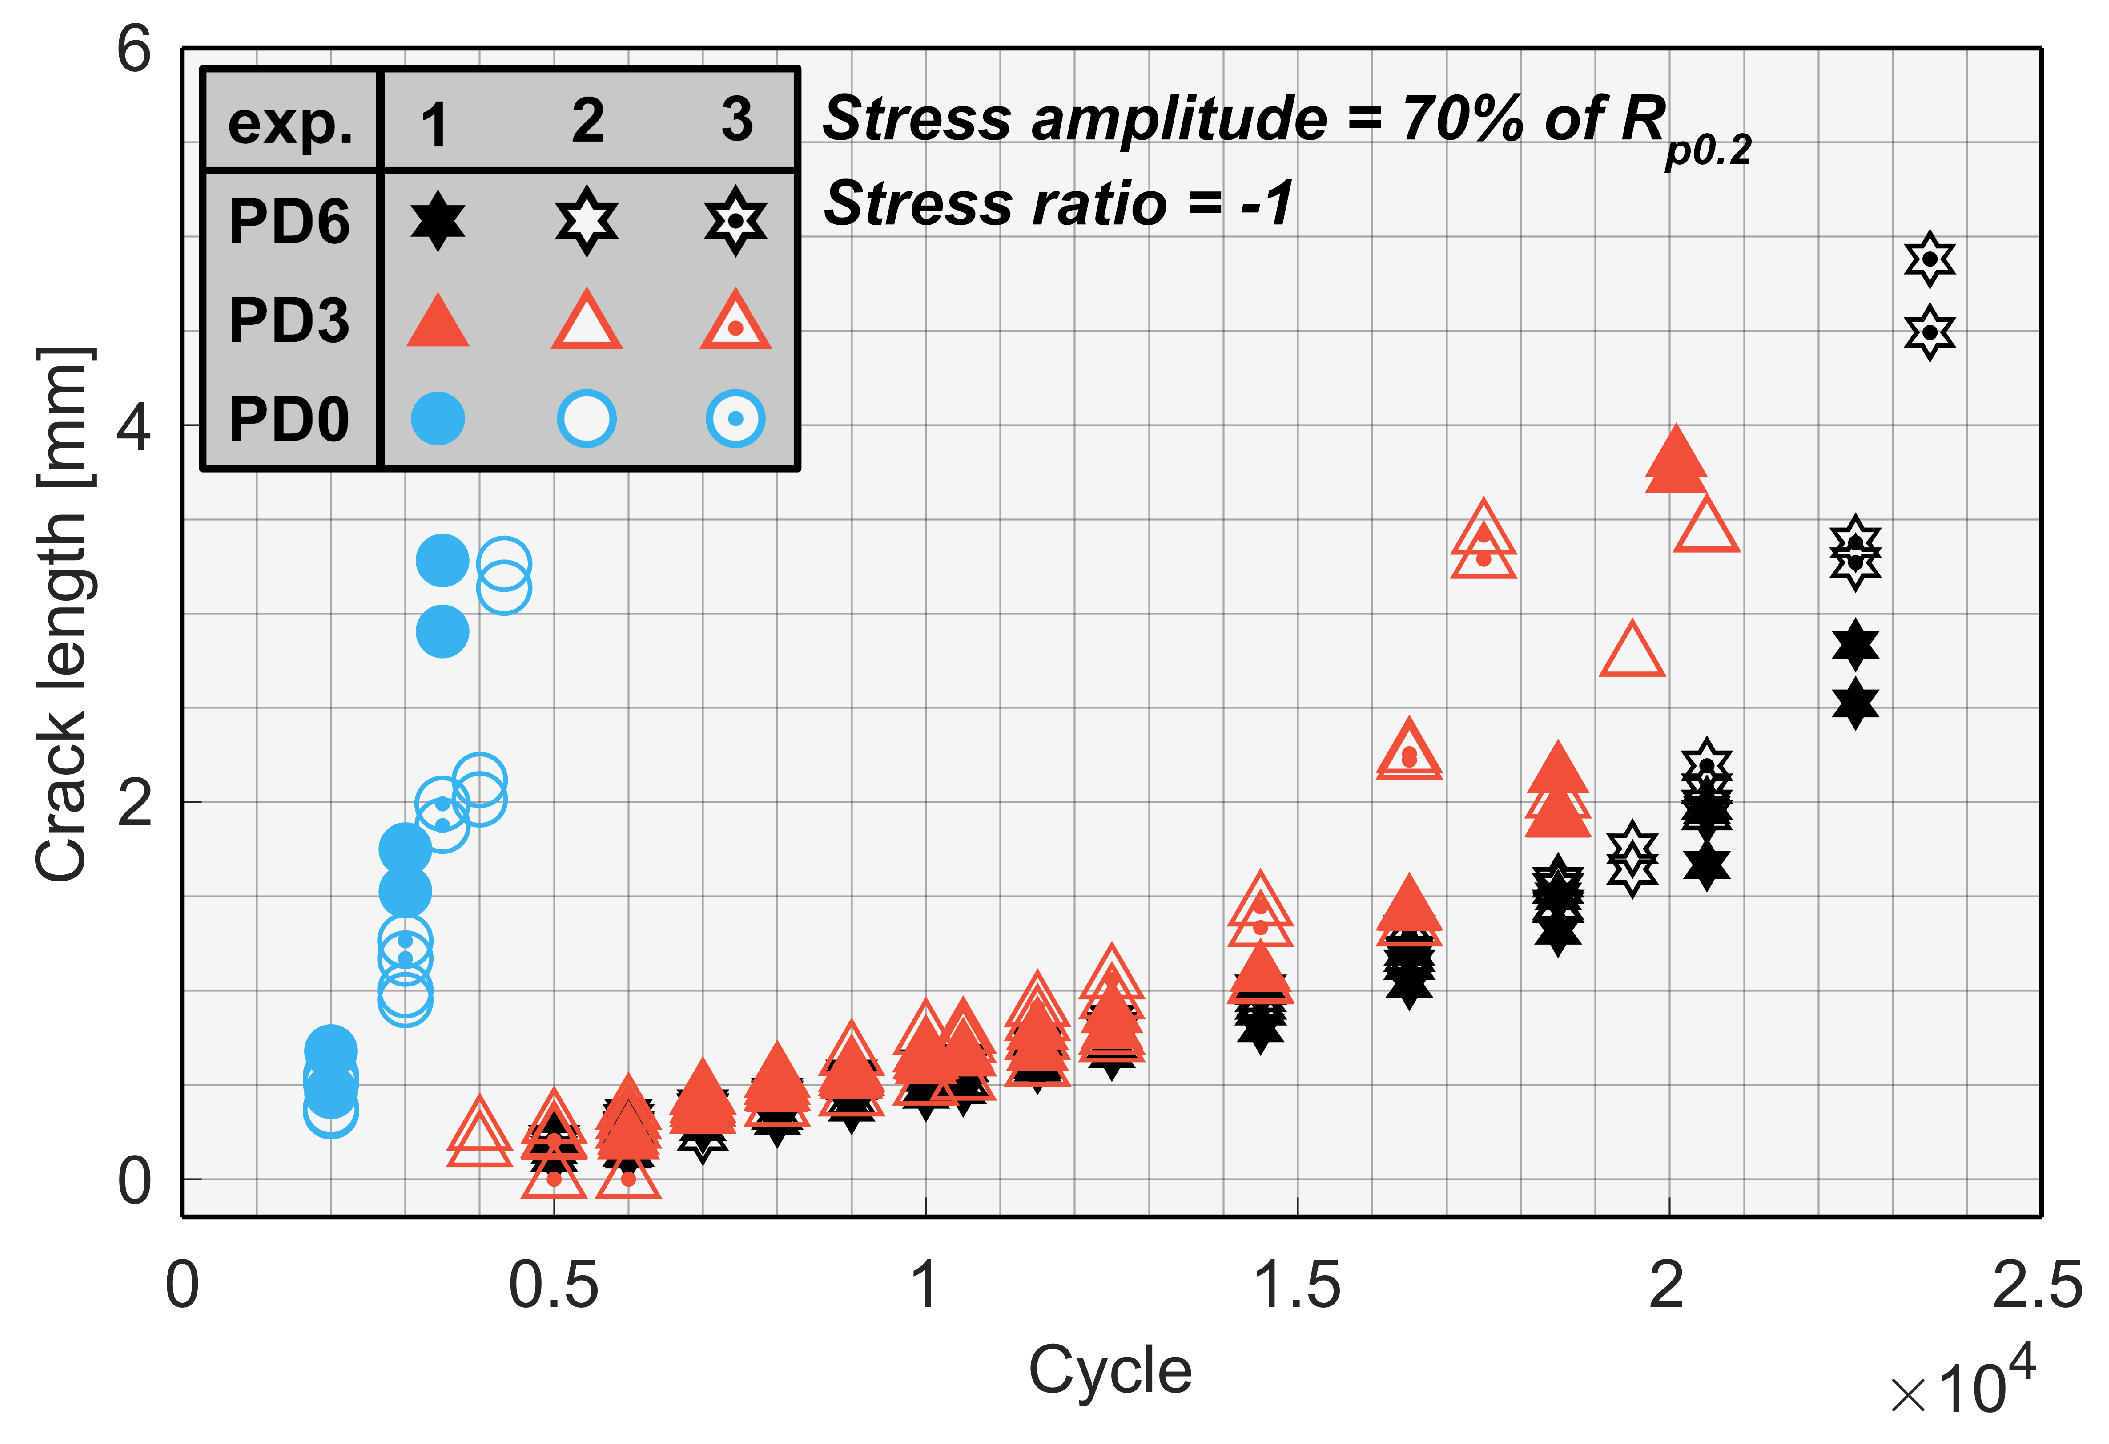
Figure 14.
The final crack contour on the image plane (see Figure 4) for all test bars, loaded with a nominal stress amplitude corresponding to 60% of .
Figure 14.
The final crack contour on the image plane (see Figure 4) for all test bars, loaded with a nominal stress amplitude corresponding to 60% of .
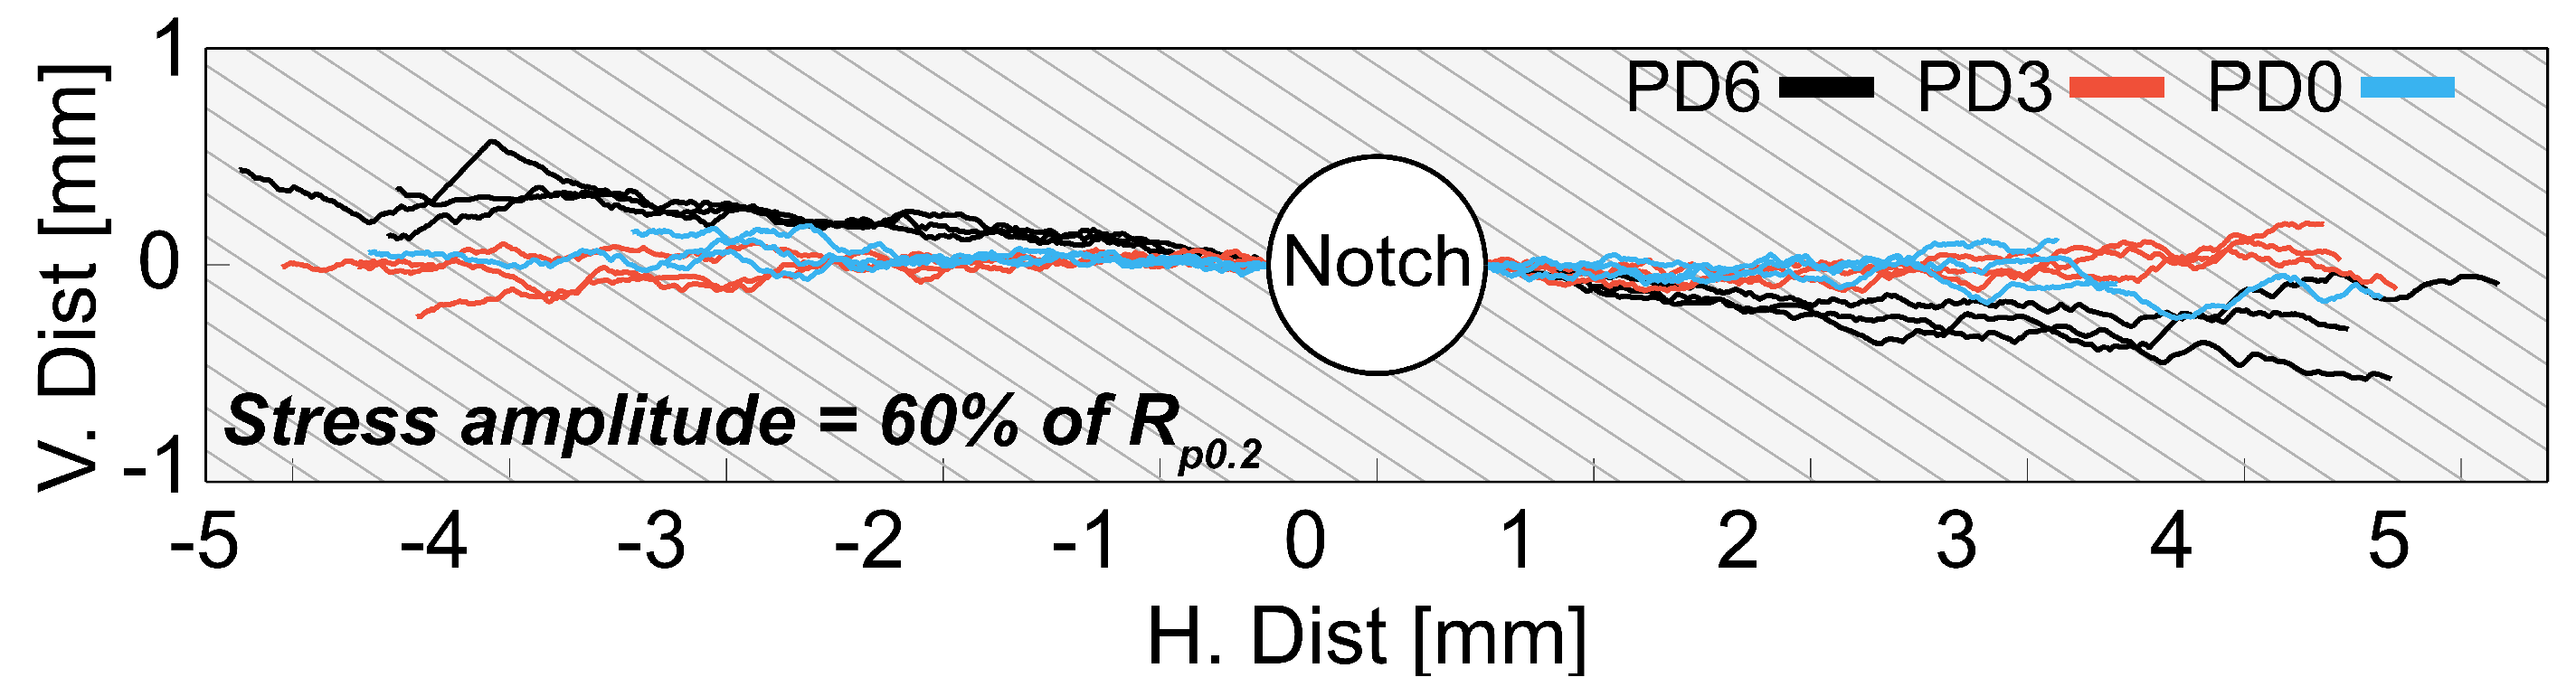
Figure 15.
The final crack contour on the image plane (see Figure 4) for all test bars, loaded with a nominal stress amplitude corresponding to 70% of .
Figure 15.
The final crack contour on the image plane (see Figure 4) for all test bars, loaded with a nominal stress amplitude corresponding to 70% of .
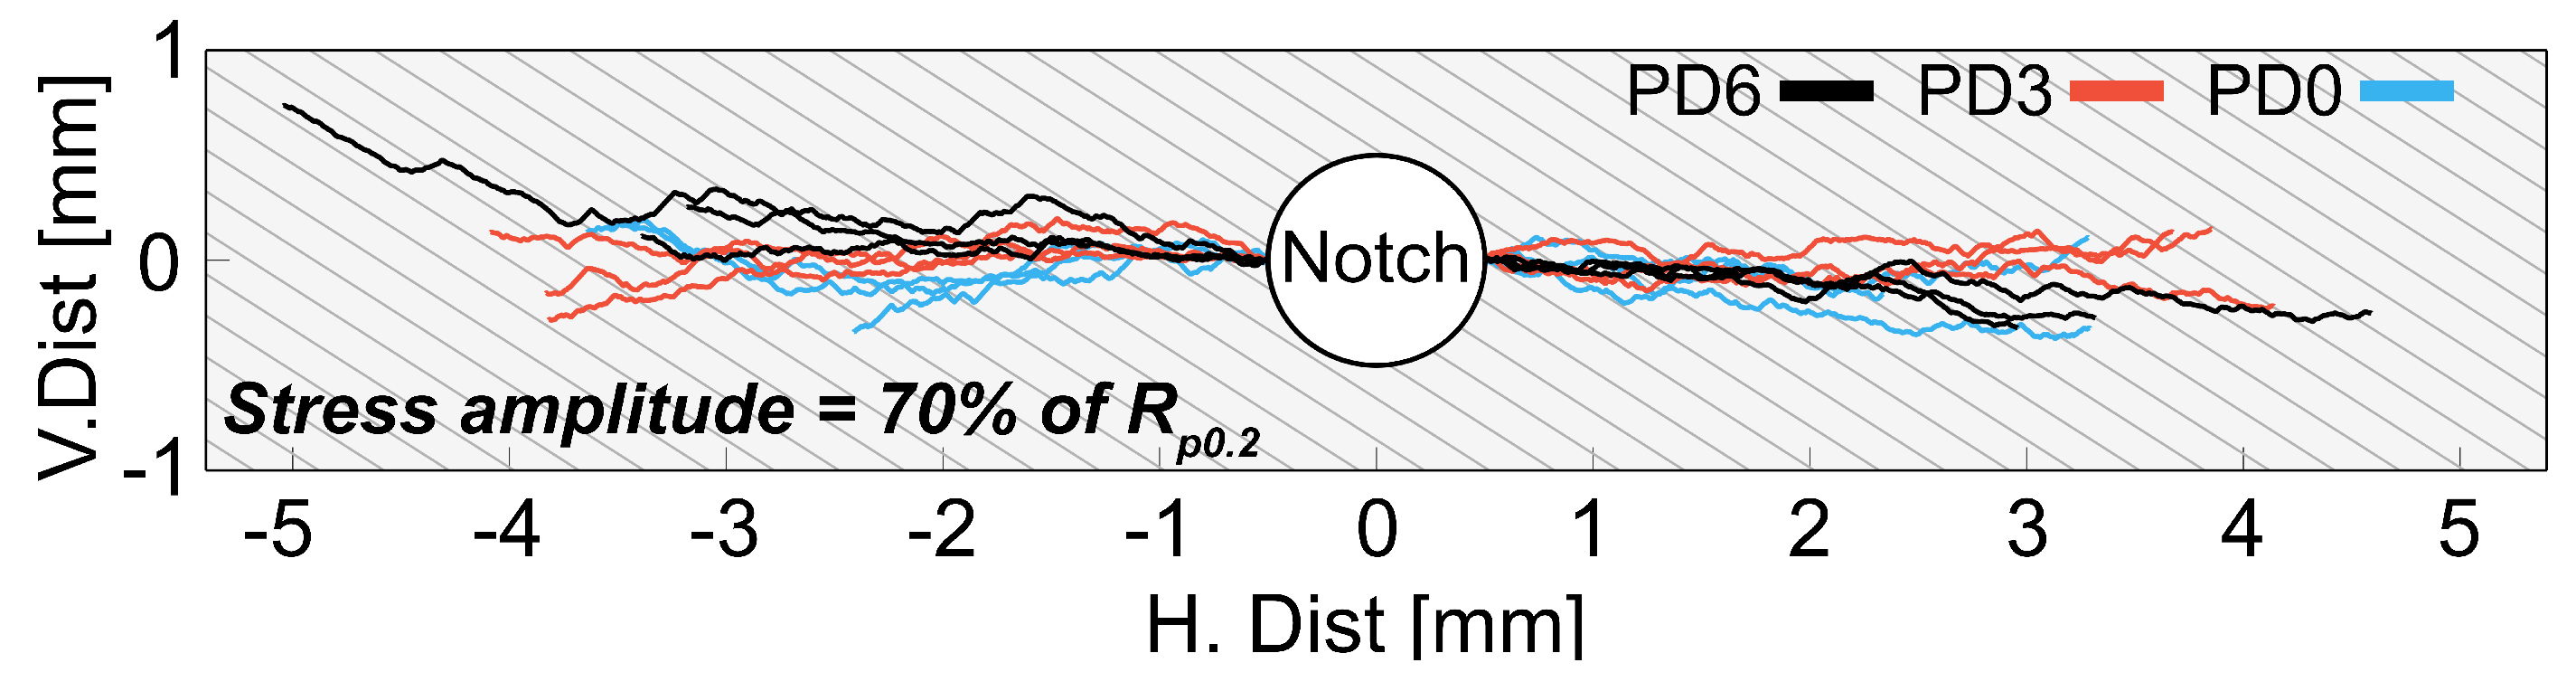
Figure 16.
Surface crack path (on the lateral surface) for a PD3 test bar. The figure exemplifies the observed variation in crack growth direction on the surface. The detailed views A and B show the surface crack growth across and along the cementite lamellae, respectively.
Figure 16.
Surface crack path (on the lateral surface) for a PD3 test bar. The figure exemplifies the observed variation in crack growth direction on the surface. The detailed views A and B show the surface crack growth across and along the cementite lamellae, respectively.
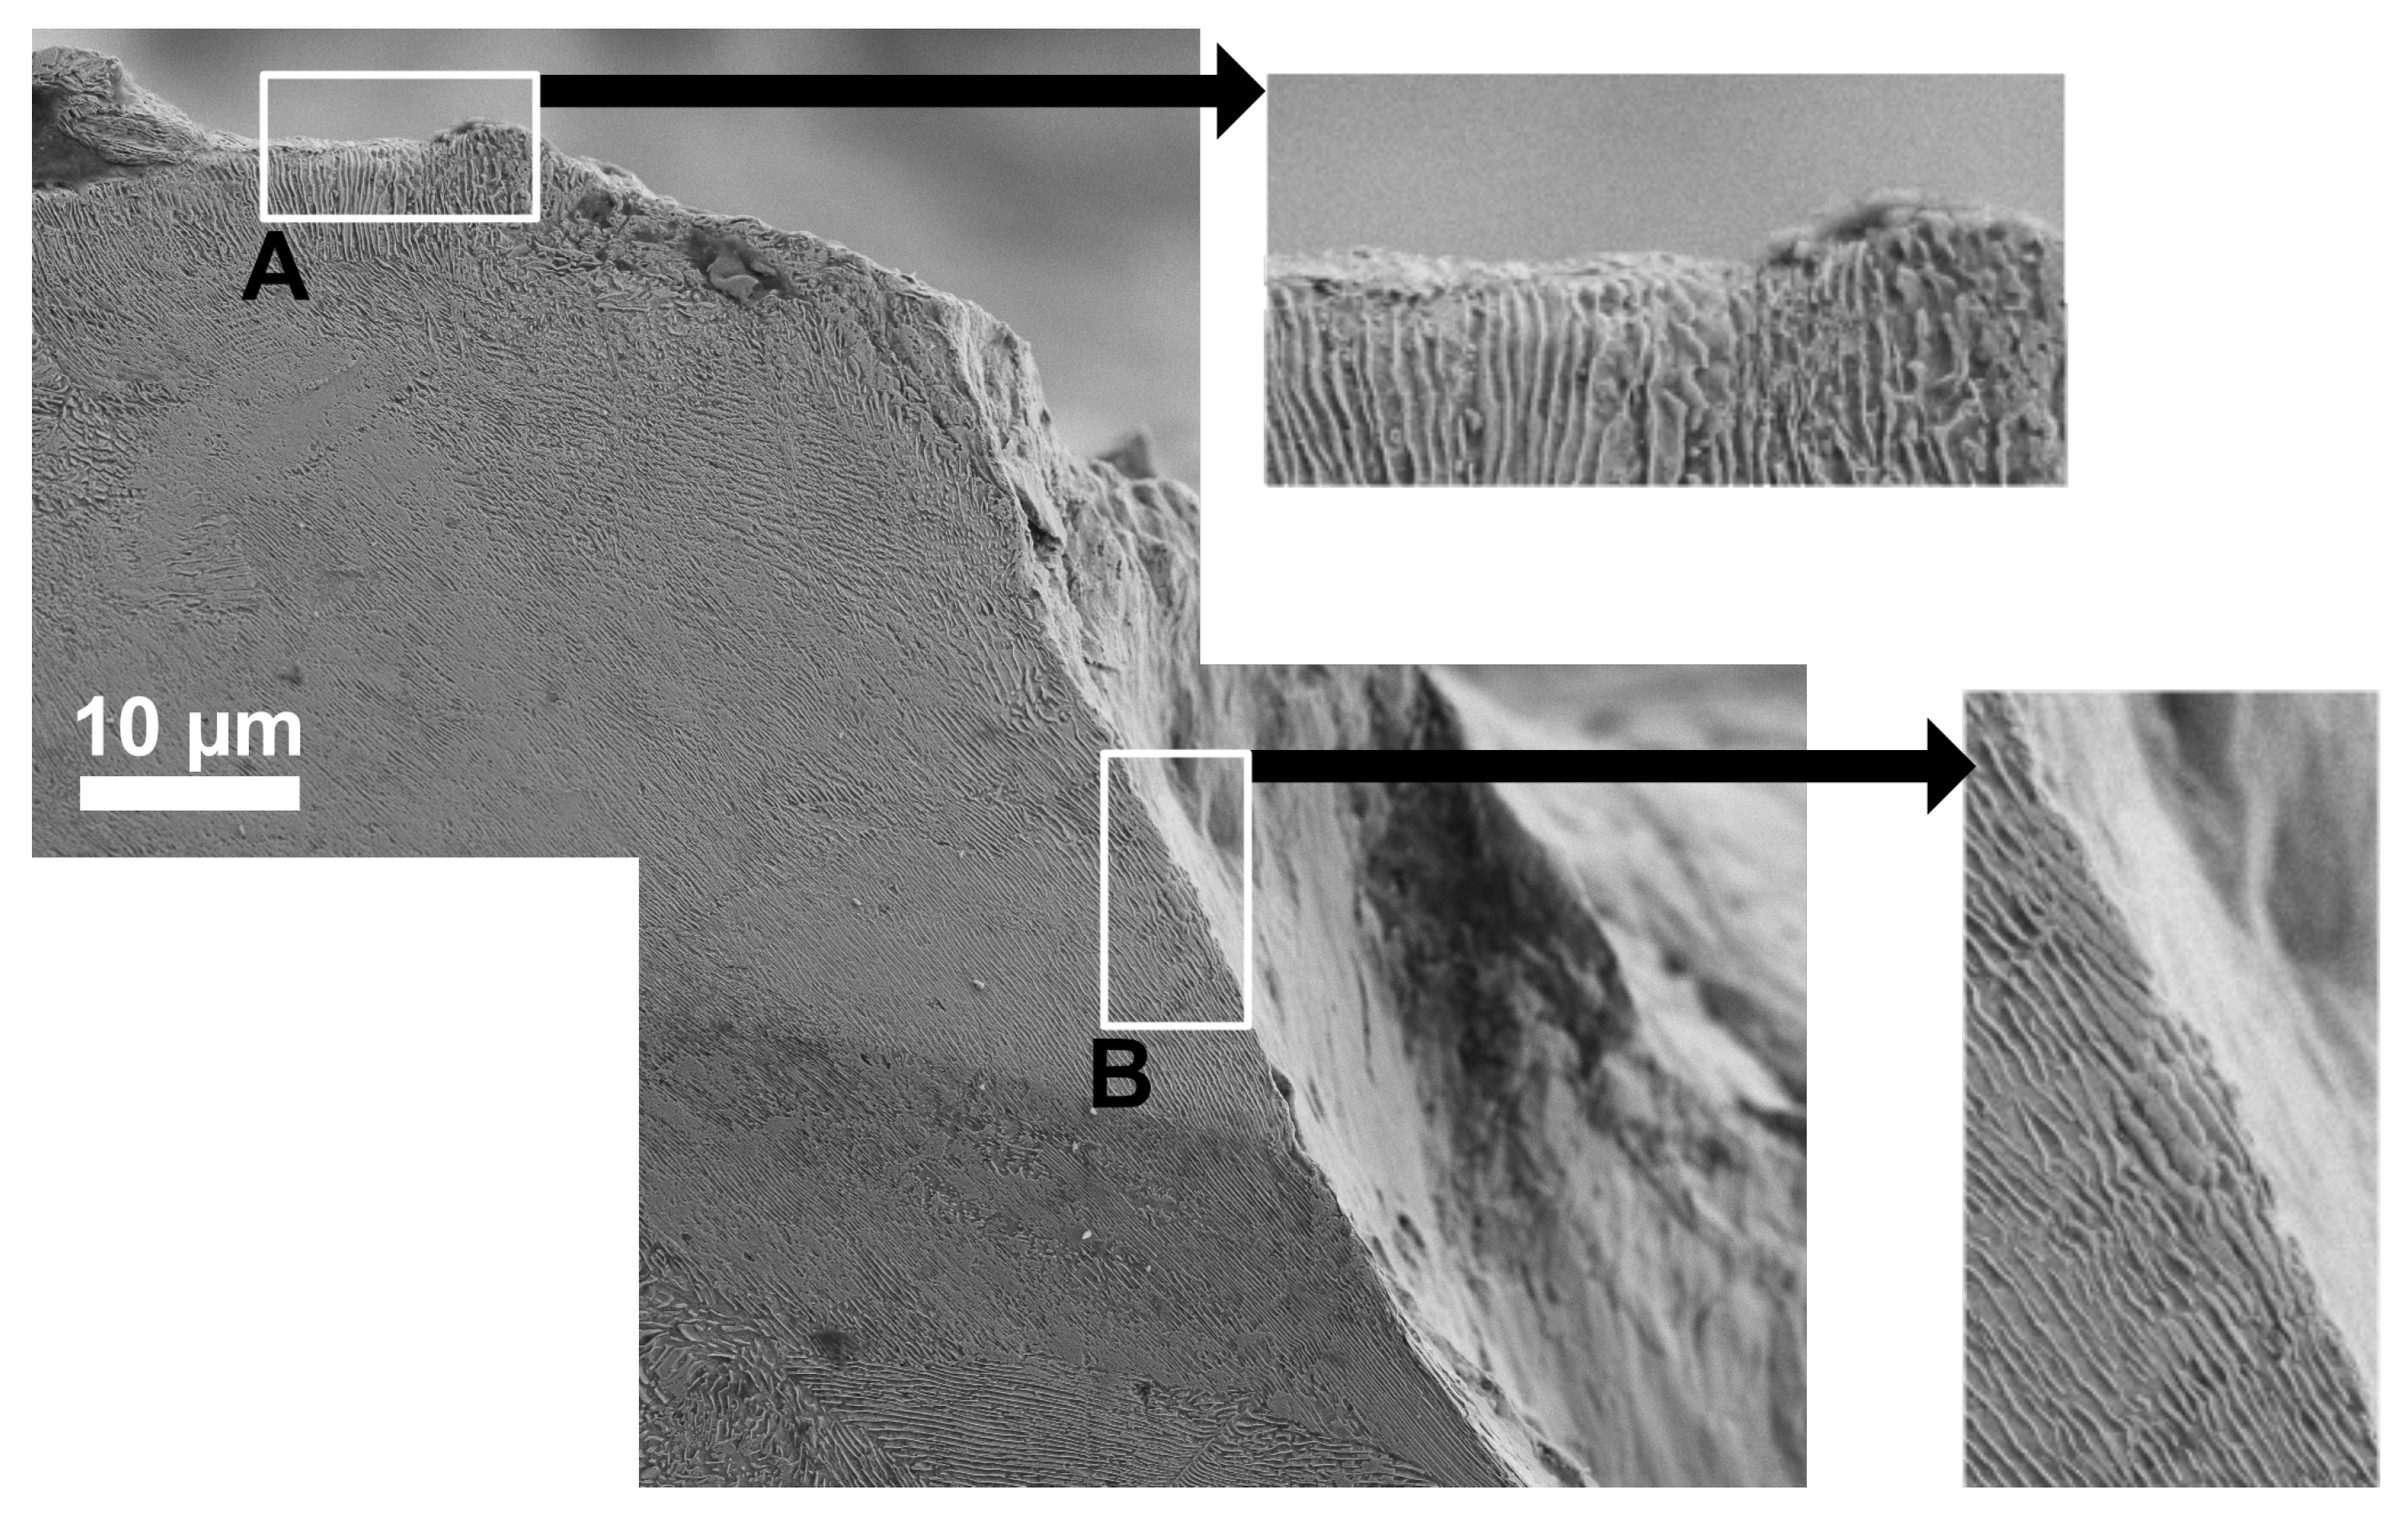
Figure 17.
Surface crack path (on the lateral surface) for a PD6 test bar. The figure exemplifies the observed variation in crack growth direction on the surface. The detailed views A and B show surface crack growth along and across the cementite lamellae, respectively.
Figure 17.
Surface crack path (on the lateral surface) for a PD6 test bar. The figure exemplifies the observed variation in crack growth direction on the surface. The detailed views A and B show surface crack growth along and across the cementite lamellae, respectively.


Table 1.
The nominal chemical composition measured in the R260 steel (wt%).
| Mn | C | Si | Cr | Cu | S | N | P | V | Al |
|---|---|---|---|---|---|---|---|---|---|
| 1.04 | 0.72 | 0.31 | 0.02 | 0.018 | 0.010 | 0.006 | 0.006 | <0.005 | 0.002 |
Table 2.
Summary of the test plan.
| Predeformation | Load | No. of Test Bars |
|---|---|---|
| PD0 | 0.7 | 3 |
| PD3 | 0.7 | 3 |
| PD6 | 0.7 | 3 |
| PD0 | 0.6 | 3 |
| PD3 | 0.6 | 3 |
| PD6 | 0.6 | 3 |
Table 3.
Summary of surface shear strain measurements.
| PD3 | 0.74 ± 0.05 | 0.66 ± 0.05 |
| PD6 | 1.52 ± 0.05 | 1.38 ± 0.05 |
Disclaimer/Publisher’s Note: The statements, opinions and data contained in all publications are solely those of the individual author(s) and contributor(s) and not of MDPI and/or the editor(s). MDPI and/or the editor(s) disclaim responsibility for any injury to people or property resulting from any ideas, methods, instructions or products referred to in the content. |
© 2023 by the authors. Licensee MDPI, Basel, Switzerland. This article is an open access article distributed under the terms and conditions of the Creative Commons Attribution (CC BY) license (https://creativecommons.org/licenses/by/4.0/).
Share and Cite
MDPI and ACS Style
Gren, D.; Ahlström, J. Fatigue Crack Propagation on Uniaxial Loading of Biaxially Predeformed Pearlitic Rail Steel. Metals 2023, 13, 1726. https://doi.org/10.3390/met13101726
AMA Style
Gren D, Ahlström J. Fatigue Crack Propagation on Uniaxial Loading of Biaxially Predeformed Pearlitic Rail Steel. Metals. 2023; 13(10):1726. https://doi.org/10.3390/met13101726
Chicago/Turabian StyleGren, Daniel, and Johan Ahlström. 2023. "Fatigue Crack Propagation on Uniaxial Loading of Biaxially Predeformed Pearlitic Rail Steel" Metals 13, no. 10: 1726. https://doi.org/10.3390/met13101726
Note that from the first issue of 2016, this journal uses article numbers instead of page numbers. See further details here.