
Creep–Fatigue Life Estimation of Gr.91 Steel and Its Welded Joints
Independent Researcher, 4-22-53 Tatsumidai-Higashi, Ichihara 290-0003, Japan
Metals 2023, 13(11), 1880; https://doi.org/10.3390/met13111880
Submission received: 17 September 2023
/
Revised: 27 October 2023
/
Accepted: 9 November 2023
/
Published: 13 November 2023
(This article belongs to the Special Issue Creep and Fatigue Behavior of Alloys)
Abstract
:A series of creep–fatigue tests of Gr.91 steel were performed at 600 °C. Fatigue life was reduced by tensile strain holding. The minimum life reduction factor was approximately 0.3. The creep–fatigue life could not be estimated properly via the conventional linear summation rule of the fatigue damage and creep damage. Since this material is considered to have a large creep–fatigue interaction, it was proposed that the creep–fatigue life should be estimated using the improved linear summation rule of the fatigue damage, the creep damage and the creep–fatigue interaction damage. In the future, it will be necessary to clarify the creep–fatigue interaction mechanism and define its damage value. On the other hand, a series of creep–fatigue tests for Gr.91 steel welded joints were also performed in the strain range of 0.5% at 600 °C. Again, the fatigue life was shortened by the tensile strain holding. The minimum fatigue life reduction factor was approximately 0.2. All the test pieces fractured in the fine-grained HAZ of the welded joints. The creep–fatigue life could not be estimated properly using the linear summation rule of the fatigue damage and creep damage in the HAZ. One possible reason was thought to be the effects of the elastic follow-up phenomena peculiar to welded joints. The creep strain of the HAZ might increase due to the transfer of the elastic strain from both the base metal and the weld metal, according to the elastic follow-up phenomena during strain holding. In the future, it will be important to quantitatively estimate the effects of the elastic follow-up phenomena.
1. Introduction
Most components operating at elevated temperatures are subjected to cyclic loading (fatigue) due to their startup–shutdown operations and constant loading (creep) due to their steady operations. This is true not only for large equipment such as power plants, but also small devices such as personal computers. Therefore, it seems to be reasonable to apply creep–fatigue life estimation methods to those apparatuses and devices. In Japan, many creep–fatigue studies were actively conducted from the 1970s to the 1980s. They were mainly aimed at establishing the strength design method for fast breeder reactor (FBR) components. Low-pressure sodium was planned to flow through the pipes at approximately 500 °C. Thermal stress was expected to be dominant in FBR components, as shown in Figure 1 [1]. It was divided into steady thermal stress via thermal expansion in the piping system and transient thermal stress via the temperature gradient in the reactor vessel. Both are strain-controlled stresses. The main fracture mode was thought to be strain-controlled creep–fatigue due to thermal stress, while it was creep due to load-controlled hoop stress under high-pressure steam in thermal power plants. A large amount of creep–fatigue data were obtained, and a creep–fatigue life estimation method was established. However, the concept of a creep–fatigue life estimation has not spread well in industry. Alternatively, it is common to estimate only the fatigue life or creep life for components operated at elevated temperatures. A possible reason is that the creep–fatigue life estimation method is complex and has not yet been satisfactorily verified, but a more important reason may be that the necessity of a creep–fatigue life estimation is not fully recognized. Without clarification of the mechanism of the creep–fatigue interaction, the necessity of a creep–fatigue life estimation is obscured.
Gr.91 (9Cr-1Mo-V-Nb) steel is an excellent material with high-temperature strength properties and oxidation resistance around 600 °C, so it is widely used in thermal power plants and petrochemical plants. Recently, there have been several reports regarding the creep–fatigue properties of Gr.91 steel or Gr.92 (9Cr-1.8W-0.5Mo-V-Nb) steel [2,3,4,5]. In this paper, a series of creep–fatigue tests of Gr.91 steel were performed at 600 °C to investigate its creep–fatigue properties. Furthermore, the creep–fatigue lives were estimated using the linear damage summation rules of the fatigue damage, the creep damage and the creep–fatigue interaction damage. On the other hand, Gr.91 steel welded joints are key structures for life estimation in thermal power plants. Figure 2 shows an example of the routing and elements in a high-energy piping system [6]. There is a straight pipe, an elbow, a T-piece, a Y-piece and so on, that are connected via circumferential welding. A high-energy piping system is more than 100 m long, and it thermally expands by about 1 m when heated to operating temperatures. However, since it is fixed at the boiler outlet and turbine inlet, the thermal expansion is restrained, and then thermal stress is generated. Therefore, circumferential welded joints are subjected to creep-fatigue loading due to thermal expansion stress and internal pressure during plant operation. Recently, thermal power plants have come to be used as regulated power sources, so creep–fatigue estimation is becoming an important issue as the number of plants starts and stops increases. In this paper, a series of creep–fatigue tests for Gr.91 steel welded joints were also performed at 600 °C to investigate their creep–fatigue properties. The creep–fatigue lives were also estimated using the linear damage summation rules of the fatigue damage and creep damage. Simultaneously, the elastic follow-up phenomena were discussed, where the creep strain in the heat-affected zone (HAZ) of welded joints increases during the strain holding.
2. Creep–Fatigue Life Estimation of Gr.91 Steel
2.1. Creep–Fatigue Test Results
To investigate the creep–fatigue properties of Gr.91 steel, a series of creep–fatigue tests were performed [7]. The test material was an ASME A387 Gr.91 Cl.2 steel plate, and it was normalized and tempered. The test was performed on a hydraulic servo-controlled fatigue test machine with a load capacity of 100 kN, and the test piece was heated with a high-frequency induction device. The test piece was a round bar with a diameter of 10 mm. The test temperature was 600 °C, and the axial strain was controlled at a gauge length of 25 mm. Figure 3 shows the loading waveform. It was strain-controlled fatigue of the stress ratio −1 with strain holding at the tensile peak. Several loading waveforms could be considered, but a strain-controlled trapezoidal wave with tensile strain holding was selected, which simulates the loading patterns during actual component operations. One reason for the selection is that the thermal stress in the actual components is strain-controlled, and the other reason is that rachet deformation is likely to occur with load control. The strain range was 0.4% to 1.5%, and the strain hold time was 1 to 60 min. Figure 4 shows the relationship between the strain range and the cycles to failure. The cycles to failure were defined as when the peak stress decreased by 25% of the steady value. The fatigue lives were shortened by strain holding within all strain ranges. Figure 5 shows the relationship between the fatigue life reduction factor and the strain hold time. The fatigue life reduction factor was defined as the ratio of the creep–fatigue life to pure fatigue life without strain holding. The minimum life reduction factor was approximately 0.3, and there was a tendency showing that the smaller the strain range, the smaller the life reduction factor. In addition, the longer the strain hold time, the smaller the fatigue life reduction factor, but the fatigue life reduction factor tended to saturate at the strain holding of about 30 min in all the strain ranges. Figure 6 compares the fatigue life reduction factors among Gr.91 steel at 600 °C, HR6W steel at 750 °C [8] and Alloy 617 at 700 °C [9]. The fatigue life reduction factor of Alloy 617 was much smaller than that of Gr.91 steel or HR6W steel. In Alloy 617, the cause of the fatigue life reduction seems to be the creep effect during strain holding because the fracture mode clearly changed from transgranular cracking to intergranular cracking due to strain holding [10]. However, the cause of the fatigue life reduction is not clear for Gr.91 steel because the change in the fracture mode is not as clear as that of Alloy 617. The cause of the fatigue life reduction for Gr.91 steel is discussed in Section 2.3.
2.2. Creep–Fatigue Life Estimation Results
The creep–fatigue lives were estimated based on the test results given in Section 2.1 [7]. Fatigue damage is cyclic-dependent, while creep damage is time-dependent, but the linear damage summation rule estimates the creep–fatigue lives by linearly adding both damages [11,12]. Figure 7 presents the calculation methods for the fatigue damage and creep damage. Fatigue damage was defined as the life reduction factor relative to the fatigue life without strain holding. Fatigue damage was calculated from the ratio of the creep–fatigue life with strain holding to the fatigue life without strain holding within the same strain range. The time exhaustion rule and the ductility exhaustion rule are generally used to calculate the creep damage. The time exhaustion rule is a stress-based estimation method where the creep damage is defined as the ratio of the time spent to rupture time. The creep damage was calculated by introducing the stress of the stress relaxation curve during strain holding into the creep rupture curve. On the other hand, the ductility exhaustion rule is a strain-based estimation method where the creep damage is defined as the ratio of consumed creep ductility to fracture ductility. Creep damage was calculated by introducing the creep rate of the stress relaxation curve during strain holding into the fracture ductility–creep rate diagram. Fracture ductility was defined as the true strain at the fracture, and it was calculated from the reduction area of the fractured test piece. Figure 8 shows the accumulated fatigue damage and creep damage until failure. All the creep damage values calculated using the time exhaustion rule were very small. While the sum of the fatigue damage and creep damage was much lower than 1 when the creep damage was calculated using the time exhaustion rule, it was closer to 1 when the creep damage was calculated using the ductility exhaustion rule. However, this result does not necessarily mean that the ductility exhaustion rule is better than the time exhaustion rule because fracture ductility values at low creep rates must be extrapolated from experimental values at high creep rates, and the accuracy of extrapolation significantly influences the creep damage values when using the ductility exhaustion rule. In other words, the results in Figure 8 could be a coincidence. It seems necessary to improve the accuracy of the fracture ductility values at low creep rates via long-term creep tests. The interpretations of the fact that the sum of the fatigue damage and creep damage was much lower than 1 when the creep damage was calculated by the time exhaustion rule are discussed in Section 2.3.
2.3. Discussions of the Creep–Fatigue Interaction
As shown in Figure 9, there are two possible interpretations of the fact that the sum of the fatigue damage and creep damage calculated using the time exhaustion rule was much less than 1 (Figure 8). One is the interpretation that creep damage is underestimated. Many studies [13,14,15] have been conducted on this point, and several countermeasures have been developed. For example, the ductility exhaustion rule adopted by the British high-temperature structural design code R5 [16] is one of them. The second interpretation is that the effects of the creep–fatigue interaction are not considered in the linear damage summation rule. Figure 10 illustrates this schematically. It follows the concept that there is creep–fatigue interaction damage (DIN) in addition to fatigue damage (DF) and creep damage (DC), and failure occurs when the sum of the three damages becomes 1 (DF + DC + DIN = 1). Creep–fatigue interaction damage seems to depend on the material type, temperature range, stress level, and so on. If DIN = 0, then DF + DC = 1; if DIN > 0, then DF + DC < 1; and if DIN < 0, then DF + DC > 1. According to this concept, it is understood that the creep–fatigue interaction damage of Gr.91 steel at 600 °C is very large, and then DF + DC < 1 (Figure 8). Incidentally, as mentioned in Section 2.1, the fatigue life reduction due to strain holding was significant for Alloy 617 (Figure 6), and its cause seemed to be the creep effect during strain holding. In this case, the creep–fatigue interaction damage is very small (DIN = 0), and the sum of the fatigue damage and creep damage is expected to be 1 (DF + DC = 1). Little research has been carried out so far on the mechanism of the creep–fatigue interaction [17,18]. Yokobori et al.’s [19] analysis is one of the few studies. They tried to treat creep–fatigue issues not as an individual combination of creep and fatigue, but as a simultaneous progress of a time-dependent fracture and a cycle-dependent one. Figure 11 shows the procedure for the creep–fatigue interaction analysis. An increased rate of creep–fatigue damage was expressed as a linear summation of the creep crack growth rate and the fatigue one. The term of the fatigue–crack growth was multiplied by a time-dependent coefficient, and similarly, that of the creep–crack growth was multiplied by a cycle-dependent coefficient. If coefficient α does not depend on time t, and coefficient β does not depend on cycle N, there is no creep–fatigue interaction (DF + DC = 1). Regarding the creep–fatigue life estimation, it seems that clarification of the creep–fatigue interaction mechanism and how to define the creep–fatigue interaction damage remain issues for the future.
3. Creep–Fatigue Life Estimation of Gr.91 Steel Welded Joints
3.1. Creep–Fatigue Test Results
To investigate the creep–fatigue properties of Gr.91 steel welded joints, a series of fundamental creep–fatigue tests were performed [20]. Welded joints were prepared via the automated welding of ASME A387 Gr.91 Cl.2 steel plates followed by post-weld heat treatment at 740 °C for 8.4 h. The test was performed on a hydraulic servo-controlled fatigue test machine with a load capacity of 100 kN, and the test piece was heated with a high-frequency induction device. Figure 12 shows the test piece. It was a round bar with a diameter of 10 mm, which was cut off perpendicular to the weld line. The test section, with a gauge length of 25 mm, consisted of the base metal, weld metal and HAZ. The HAZ was located in the centre of the test section and its width was approximately 2 mm. The test temperature was 600 °C, and the axial strain in the test section was controlled. The loading waveform was a trapezoidal wave with tensile strain holding similar to Gr.91 steel (Figure 3). The strain range was 0.5%, and the strain hold time was 1 to 300 min. Figure 13 compares the hardness distribution in the test pieces before testing, after the fatigue test and after the creep–fatigue test. Before testing, the Vickers hardness of the weld metal was about 250 and that of the base metal was about 220. The lowest hardness was about 200 near the HAZ. The Vickers hardness after the fatigue test decreased overall compared to that before testing. On the other hand, the hardness of the weld metal decreased significantly, resulting in a flat harness distribution overall after the creep–fatigue test. Based on the hardness distribution results, it is assumed that the strain concentrates and plastic restraint occurs in the HAZ. Figure 14 shows a cross-sectional view of the fractured test pieces for the strain hold time of 300 min. All the test pieces fractured in the fine-grained HAZ. This is so-called Type IV damage, and it is a creep-dominant failure caused by the stress triaxiality in the HAZ. Figure 15 shows the creep voids observed in the HAZ inside the fractured test piece and the microcracks observed in the HAZ on the fractured test piece’s surface. It could be inferred that the microcracks generated on the surface due to fatigue damage were connected, with many voids generated by creep damage, and they propagated inside the test piece. Figure 16 shows the relationship between the fatigue life reduction factor and the strain hold time. The fatigue life reduction factor was defined as the ratio of the creep–fatigue life to pure fatigue life without strain holding. The longer the strain hold time, the smaller the fatigue life reduction factor, but the fatigue life reduction factor tended to saturate at a strain holding of about 300 min. The minimum fatigue life reduction factor was at approximately 0.2 for the 300 min strain holding.
3.2. Creep–Fatigue Life Estimation Results
Figure 17 shows the creep–fatigue life estimation method for welded joints [20]. This is basically the same method as for Gr.91 steel (Figure 7), although there is no guarantee that it will apply to discontinuities such as welded joints. Fatigue damage was defined as the life reduction factors relative to the fatigue life of welded joints without strain holding. Fatigue damage was calculated from the ratio of the creep–fatigue life with strain holding to the fatigue life without strain holding within the same strain range. Creep damage was defined as the ratio of the time spent to the rupture time of a welded joint based on the time exhaustion rule. Creep damage was calculated by introducing the stress of the stress relaxation curve during strain holding into the creep rupture curve of the welded joints. Figure 18 shows the creep rupture curve of the welded joints. It was a curve obtained by lowering the creep rupture curve of Gr.91 steel by the creep strength reduction factor of welded joints, which was proposed by ORNL [21]. Figure 19 plots the accumulated fatigue damage and creep damage until fracture. It was found that the test pieces fractured when the sum of the fatigue damage and the creep damage was considerably less than 1. One of the reasons may be that the effects of the creep–fatigue interaction were not considered in the linear damage summation rule, as is the case with Gr.91 steel (Section 2.3). However, the creep–fatigue interaction damage of welded joints does not seem to be as large as that of Gr.91 steel because the fracture mode of welded joints was creep-dominant due to the fact that many creep voids were observed inside the HAZ (Figure 15). Therefore, another possible reason may be the influence of the elastic follow-up phenomena peculiar to welded joints. The creep strain of the HAZ may increase due to the transfer of the elastic strain from the base metal and the weld metal according to the elastic follow-up phenomena during strain holding. If the elastic follow-up phenomena are not considered in the creep–fatigue life estimation, the creep strain of the HAZ may be underestimated. This is discussed in Section 3.3.
3.3. Discussion of the Elastic Follow-Up Phenomena
One of the reasons why the life estimation results based on the linear damage summation rule were much less than 1 (Figure 19) is that the elastic follow-up phenomena peculiar to welded joints were not considered [2]. Figure 20 shows the concept of the elastic follow-up phenomena [22]. Rod 1, with low rigidity ξ1, and rod 2, with high rigidity ξ2, are connected in a series. When a forced displacement is applied to the connected rod at high temperatures, assuming that only rod 1 creeps, the elastic deformation of rod 2 is transferred to rod 1 with the stress relaxation of rod 1. As a result, the creep strain of rod 1 at the initial state ε1a increases to the strain after the elastic follow-up ε1b. The strain increase ratio ε1b/ε1a is determined by the rigidity ratio ξ1/ξ2 and the ratio of the length of rod 1 to the total length α (=L1/(L1 + L2)). For example, the value of ε1b/ε1a exceeds 3.0 when the value of ξ1/ξ2 is 0.5 and the value of α is 0.1.
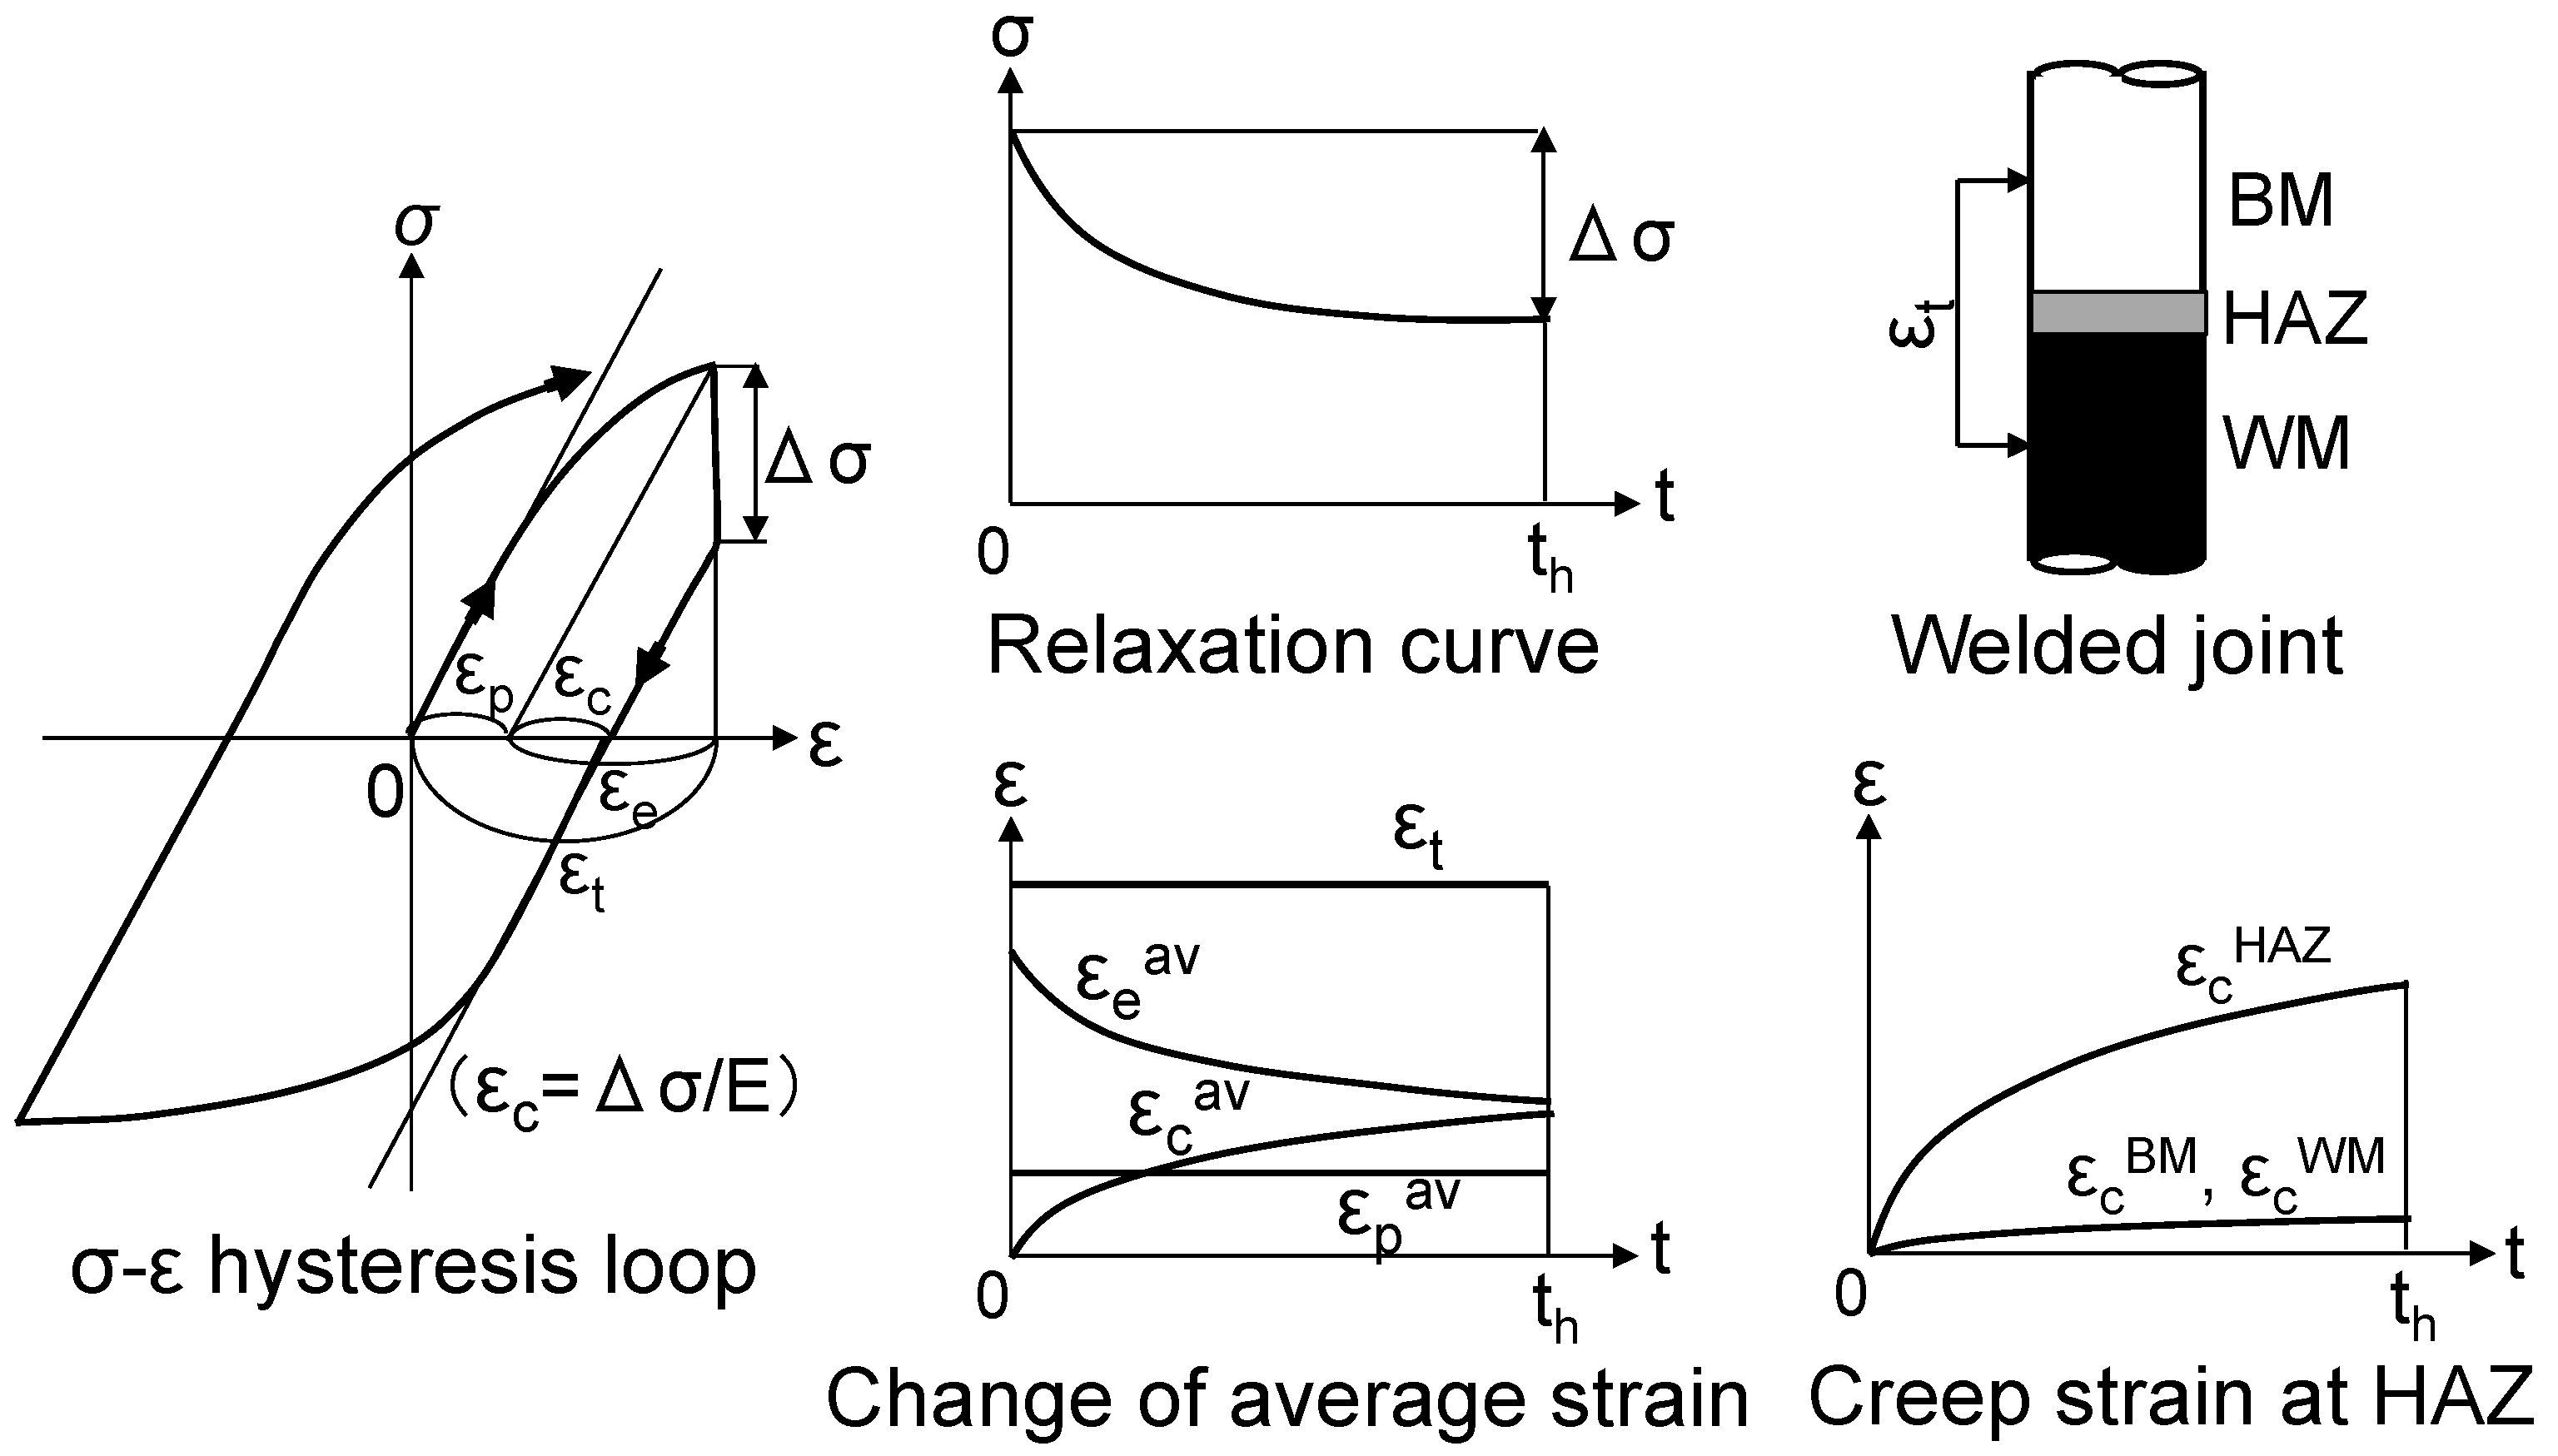
In Gr.91 steel welded joints, the base metal, the HAZ and the weld metal are connected in a series (Figure 12), and the rigidity of the HAZ may be much lower than that of the base and weld metals. Furthermore, the value of α may be approximately 0.1 (=2 mm/25 mm). Therefore, the creep strain of the HAZ may increase due to the transfer of the elastic strain from the base and weld metals according to the elastic follow-up phenomena during the strain holding. Figure 21 illustrates this schematically. When the total strain εt is kept constant, the average plastic strain εpav does not change, although the elastic average strain εeav decreases and the average creep strain εcav increases with the stress relaxation. Here, the average creep strain εcav is the average among the creep strain of the base metal εcBM, that of the weld metal εcWM and that of the HAZ εcHAZ. While the creep strains of the base and weld metals hardly increase, the creep strain of the HAZ seems to increase significantly. In the future, it will be important to quantitatively evaluate the effects of the elastic follow-up phenomena in the creep–fatigue life estimation of welded joints.
4. Conclusions
The creep–fatigue properties and their life estimation methods for Gr.91 steel and its welded joints were investigated. The results obtained are summarized below.
- (1)
- In a series of creep–fatigue tests of Gr.91 steel at 600 °C, the fatigue life decreased with the tensile strain holding, and the smaller the strain range, the smaller the fatigue life reduction factor. The minimum life reduction factor was approximately 0.3. Furthermore, the longer the strain hold time, the smaller the fatigue life reduction factor, but it tended to saturate at a strain holding of about 30 min.
- (2)
- The test pieces fractured when the linear summation of the accumulated fatigue damage and the creep damage calculated using the time exhaustion rule was much less than 1. One of the reasons is that the creep damage was underestimated, but another important reason is that the effect of the creep–fatigue interaction was not considered. In this material at 600 °C, the damage due to the creep–fatigue interaction is considered to be quite large.
- (3)
- The creep–fatigue life should be estimated using the linear summation rule of the fatigue damage, the creep damage, and the creep–fatigue interaction damage. In the future, it will be necessary to clarify the creep–fatigue interaction mechanism and define the damage value.
- (4)
- In a series of creep–fatigue tests of Gr.91 steel welded joints in the strain range of 0.5% at 600 °C, the fatigue life decreased with the tensile strain holding. The longer the strain hold time, the lower the fatigue life, and the minimum fatigue life reduction factor was approximately 0.2 in the case of the 300 min strain holding. All the test pieces fractured in the fine-grained HAZ.
- (5)
- The creep–fatigue life of the welded joint was estimated using the linear damage summation rule of the fatigue damage and the creep damage of the HAZ, which was the fracture location. All the test pieces fractured when the linear summation of the fatigue damage and the creep damage was considerably less than 1. One possible reason is the influence of the elastic follow-up phenomena peculiar to welded joints.
- (6)
- The creep strain in the HAZ may increase due to the transfer of the elastic strain from the base metal and the weld metal according to the elastic follow-up phenomena during the strain holding. In the future, it will be important to quantitatively evaluate the increase in the creep strain in the HAZ in order to estimate the creep–fatigue life of welded joints.
Funding
This research received no external funding.
Data Availability Statement
Data are contained within the article.
Conflicts of Interest
The author declares no conflict of interest.
References
- Wada, Y. Design of elevated temperature components 5, FBR. J. Soc. Mater. Sci. Jpn. 1987, 36, 127–132. [Google Scholar]
- Bender, T.; Klenk, A.; Weihe, S. Creep-fatigue assessment of martensitic welds based on numerically determined local deformation. Mater. Test. 2023, 65, 815–823. [Google Scholar] [CrossRef]
- Ando, M.; Takaya, S. Creep–fatigue evaluation method for weld joints of Mod.9Cr–1Mo steel. Part I: Proposal of the evaluation method based on finite element analysis and uniaxial testing. Nucl. Eng. Des. 2017, 323, 463–473. [Google Scholar] [CrossRef]
- Veerababu, J.; Goyal, S.; Nagesha, A. Studies on creep-fatigue interaction behaviour of Grade 92 steel and its weld joints. Int. J. Fatigue 2021, 149, 106307. [Google Scholar] [CrossRef]
- Egner, W.; Sulich, P.; Mroziński, S.; Egner, H. Modelling thermo-mechanical cyclic behaviour of P91 steel. Int. J. Plast. 2020, 135, 102820. [Google Scholar] [CrossRef]
- Nonaka, I. Creep-Fatigue Life Estimation of Circumferential Welds in Thermal High Energy Piping Systems. Manuscript Submitted for Publication. Available online: https://www.tandfonline.com/journals/ymht20 (accessed on 1 May 2023).
- Nonaka, I.; Torihata, S.; Kihara, S. Prediction of creep-fatigue lives for FBR and boiler materials based on ductility exaustion concept. Mater. Sci. Res. Int. 1997, 3, 44–48. [Google Scholar]
- Nomura, K.; Kubushiro, K. Creep-fatigue property for a long term tensile strain hold of Ni-based alloy HR6W. In Proceedings of the 56th Symposium on Strength of Materials at High Temperature, Okazaki, Japan, 6–7 December 2018; pp. 118–121. [Google Scholar]
- NIMS Fatigue Data Sheet, No.113; National Institute for Materials Science: Tsukuba, Japan, 2011.
- Kobayashi, K.; Hayakawa, M.; Kimura, M. Creep-fatigue interaction properties of Ni-based superalloy 617. Acta Met. Sin. (Engl. Lett.) 2011, 24, 115–131. [Google Scholar]
- Robinson, E.L. Effect of Temperature Variation on the Long Time Rupture Strength of Steels. Trans. ASME 1952, 74, 777. [Google Scholar] [CrossRef]
- Taira, S. IUTAM Colloquium; Springer: New York, NY, USA, 1962; p. 96. [Google Scholar]
- Nonaka, I.; Kitagawa, M.; Torihata, S. Feasibility study on ductility exhaustion approach for creep-fatigue damage assessment of FBR 316 stainless steel using published data. J. Soc. Mater. Sci. Jpn. 1995, 44, 41–45. [Google Scholar] [CrossRef]
- Takahashi, Y.; Yaguchi, M. Modification of ductility exhaustion-type creep-fatigue life prediction method based on re-definition of creep damage and application to high-chromium steels. J. Soc. Mater. Sci. Jpn. 2005, 54, 168–173. [Google Scholar] [CrossRef]
- Spindler, M.W.; Payten, W.M. Advanced ductility exhaustion methods for the calculation of creep damage during creep-fatigue cycling. J. ASTM Int. Sel. Tech. Pap. 1539 2011, 8, 102–127. [Google Scholar]
- An Assessment Procedure for High Temperature Response of Structures, R5; Nuclear Electric: Berkeley, UK, 1995; Issue 1.
- Yagi, K.; Kubo, K.; Tanaka, C. Chiaki. Evaluation of creep-fatigue interaction by linear damage rule and appearance of fracture for SUS 304 stainless steel subjected to combined creep-fatigue tests. J. Soc. Mater. Sci. Jpn. 1979, 29, 928–934. [Google Scholar] [CrossRef]
- Kubo, K.; Kanemaru, O.; Yagi, K. Relationship between ceep damage mode and creep-fatigue interaction for SUS 321 steel. J. Soc. Mater. Sci. Jpn. 1993, 42, 1–7. [Google Scholar] [CrossRef]
- Yokobori, T.; Ichikawa, M.; Yokobori, A.T., Jr. Interaction of Fatigue and creep. J. Jpn. Soc. Strength Fract. Mater. 1973, 9, 13–20. [Google Scholar] [CrossRef]
- Nonaka, I.; Torihata, S.; Kihara, S.; Umaki, H. Creep-fatigue life evaluation for weldments of modified 9Cr-1Mo steel at boiler temperature. Mater. High Temp. 1998, 15, 107–111. [Google Scholar] [CrossRef]
- Brinkman, C.R.; Maziasz, P.J.; Keys, B.L.P.; Upiton, H.D. Oak Ridge National Laboratory Report, No. ORNL/9Cr/90-1; Oak Ridge National Laboratory: Oak Ridge, TN, USA, 1990.
- Ando, Y.; Okabayashi, K. Structural Design of Nuclear Plant; University of Tokyo Press: Tokyo, Japan, 1977; pp. 192–197. [Google Scholar]
Figure 1.
Thermal stress expected during operation in FBR plants [1] permissioned from Japan Society of Materials Science in 2023. (a) Steady thermal stress due to thermal expansion in the piping system. (b) Transient thermal stress due to the temperature gradient in the reactor vessel.
Figure 1.
Thermal stress expected during operation in FBR plants [1] permissioned from Japan Society of Materials Science in 2023. (a) Steady thermal stress due to thermal expansion in the piping system. (b) Transient thermal stress due to the temperature gradient in the reactor vessel.
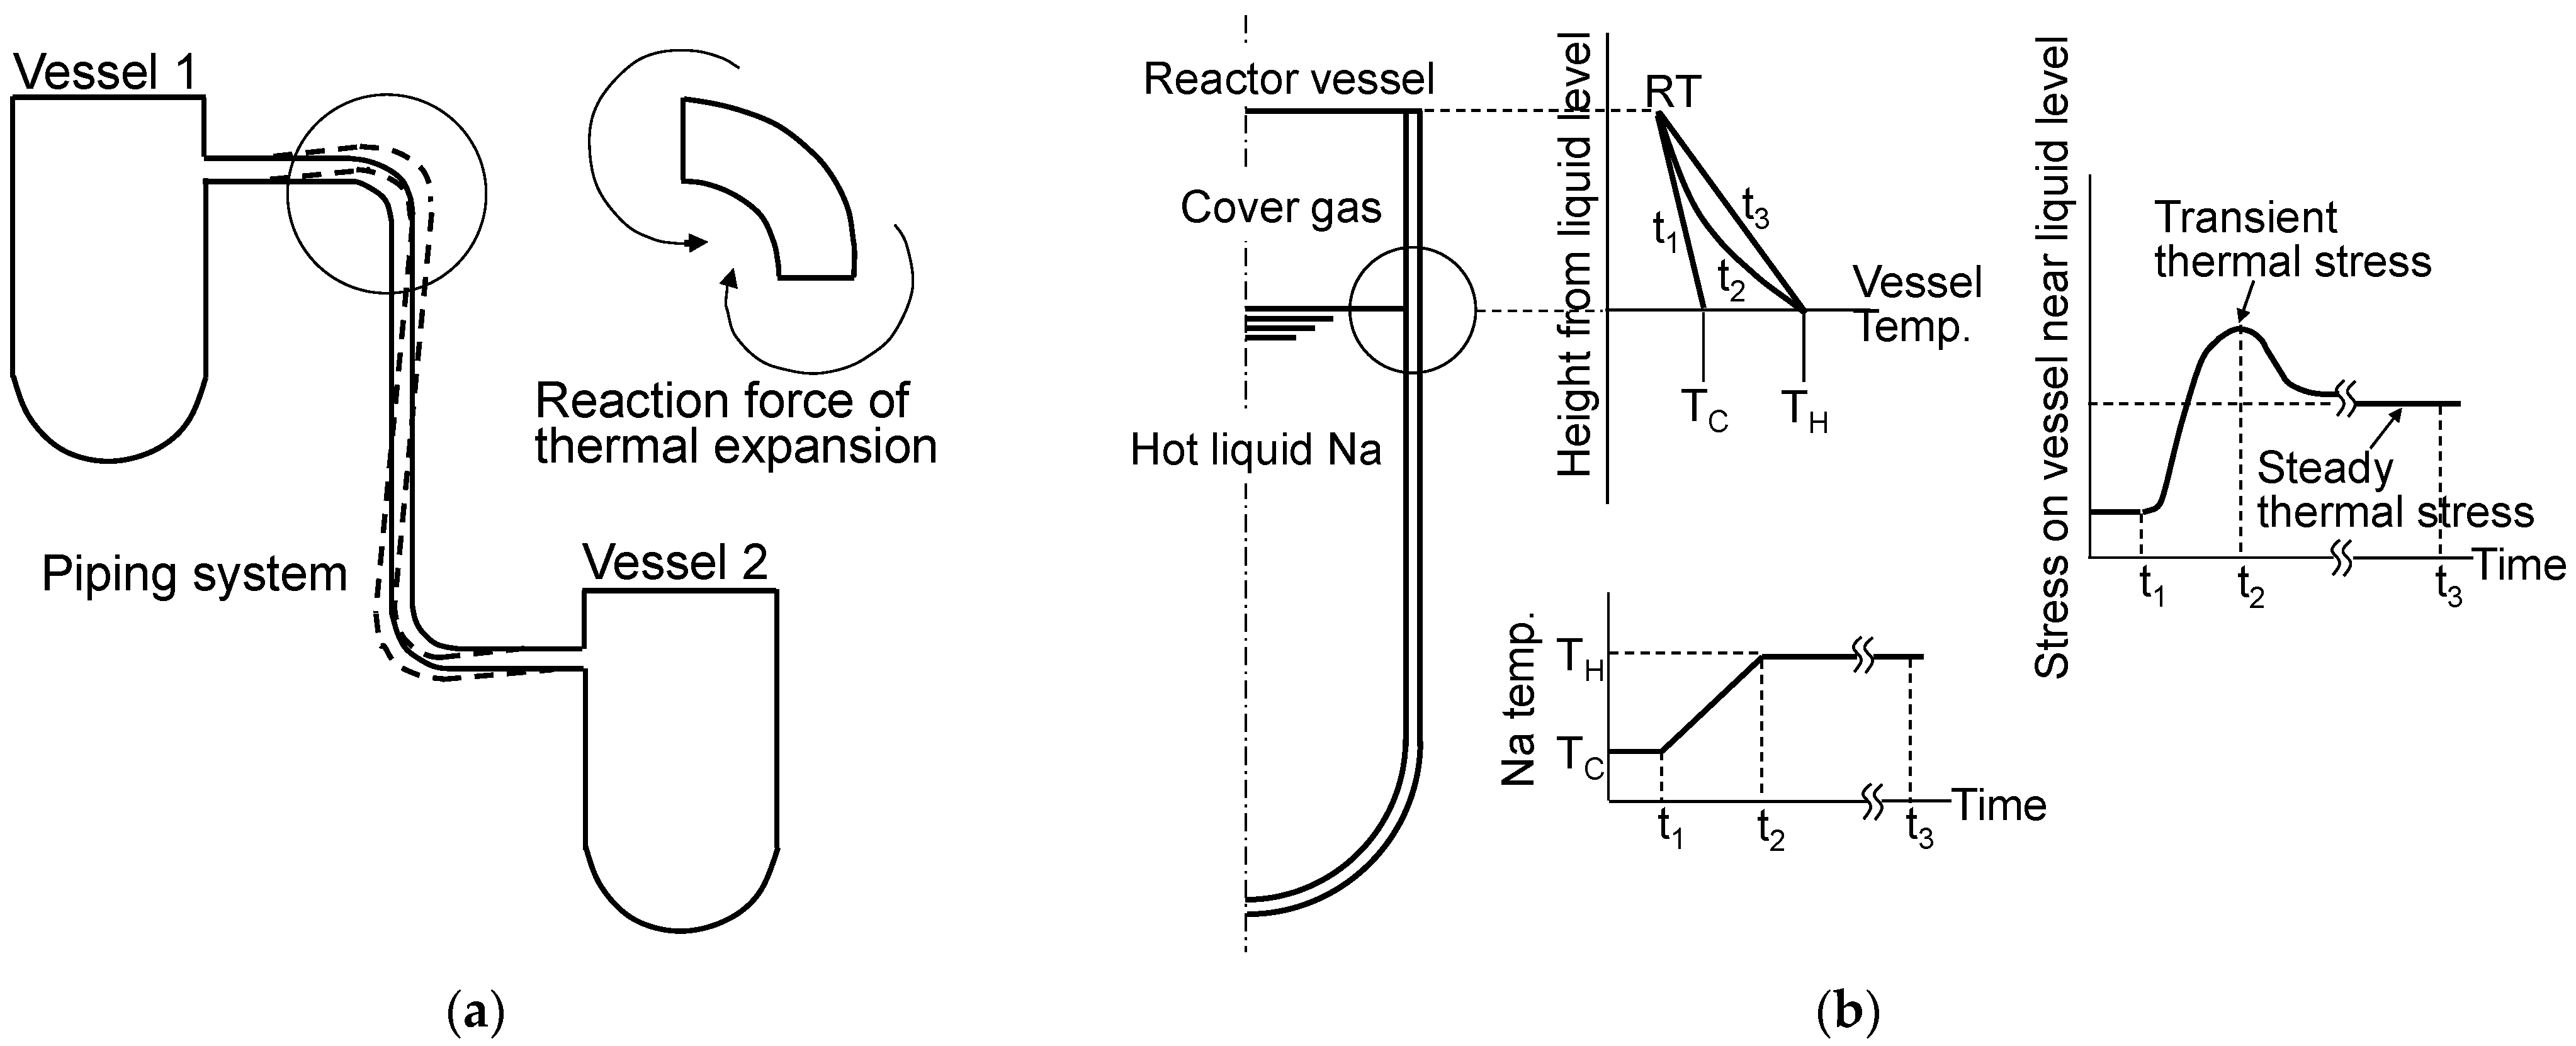
Figure 2.
Routing and elements in the high-energy piping system of a thermal power plant.
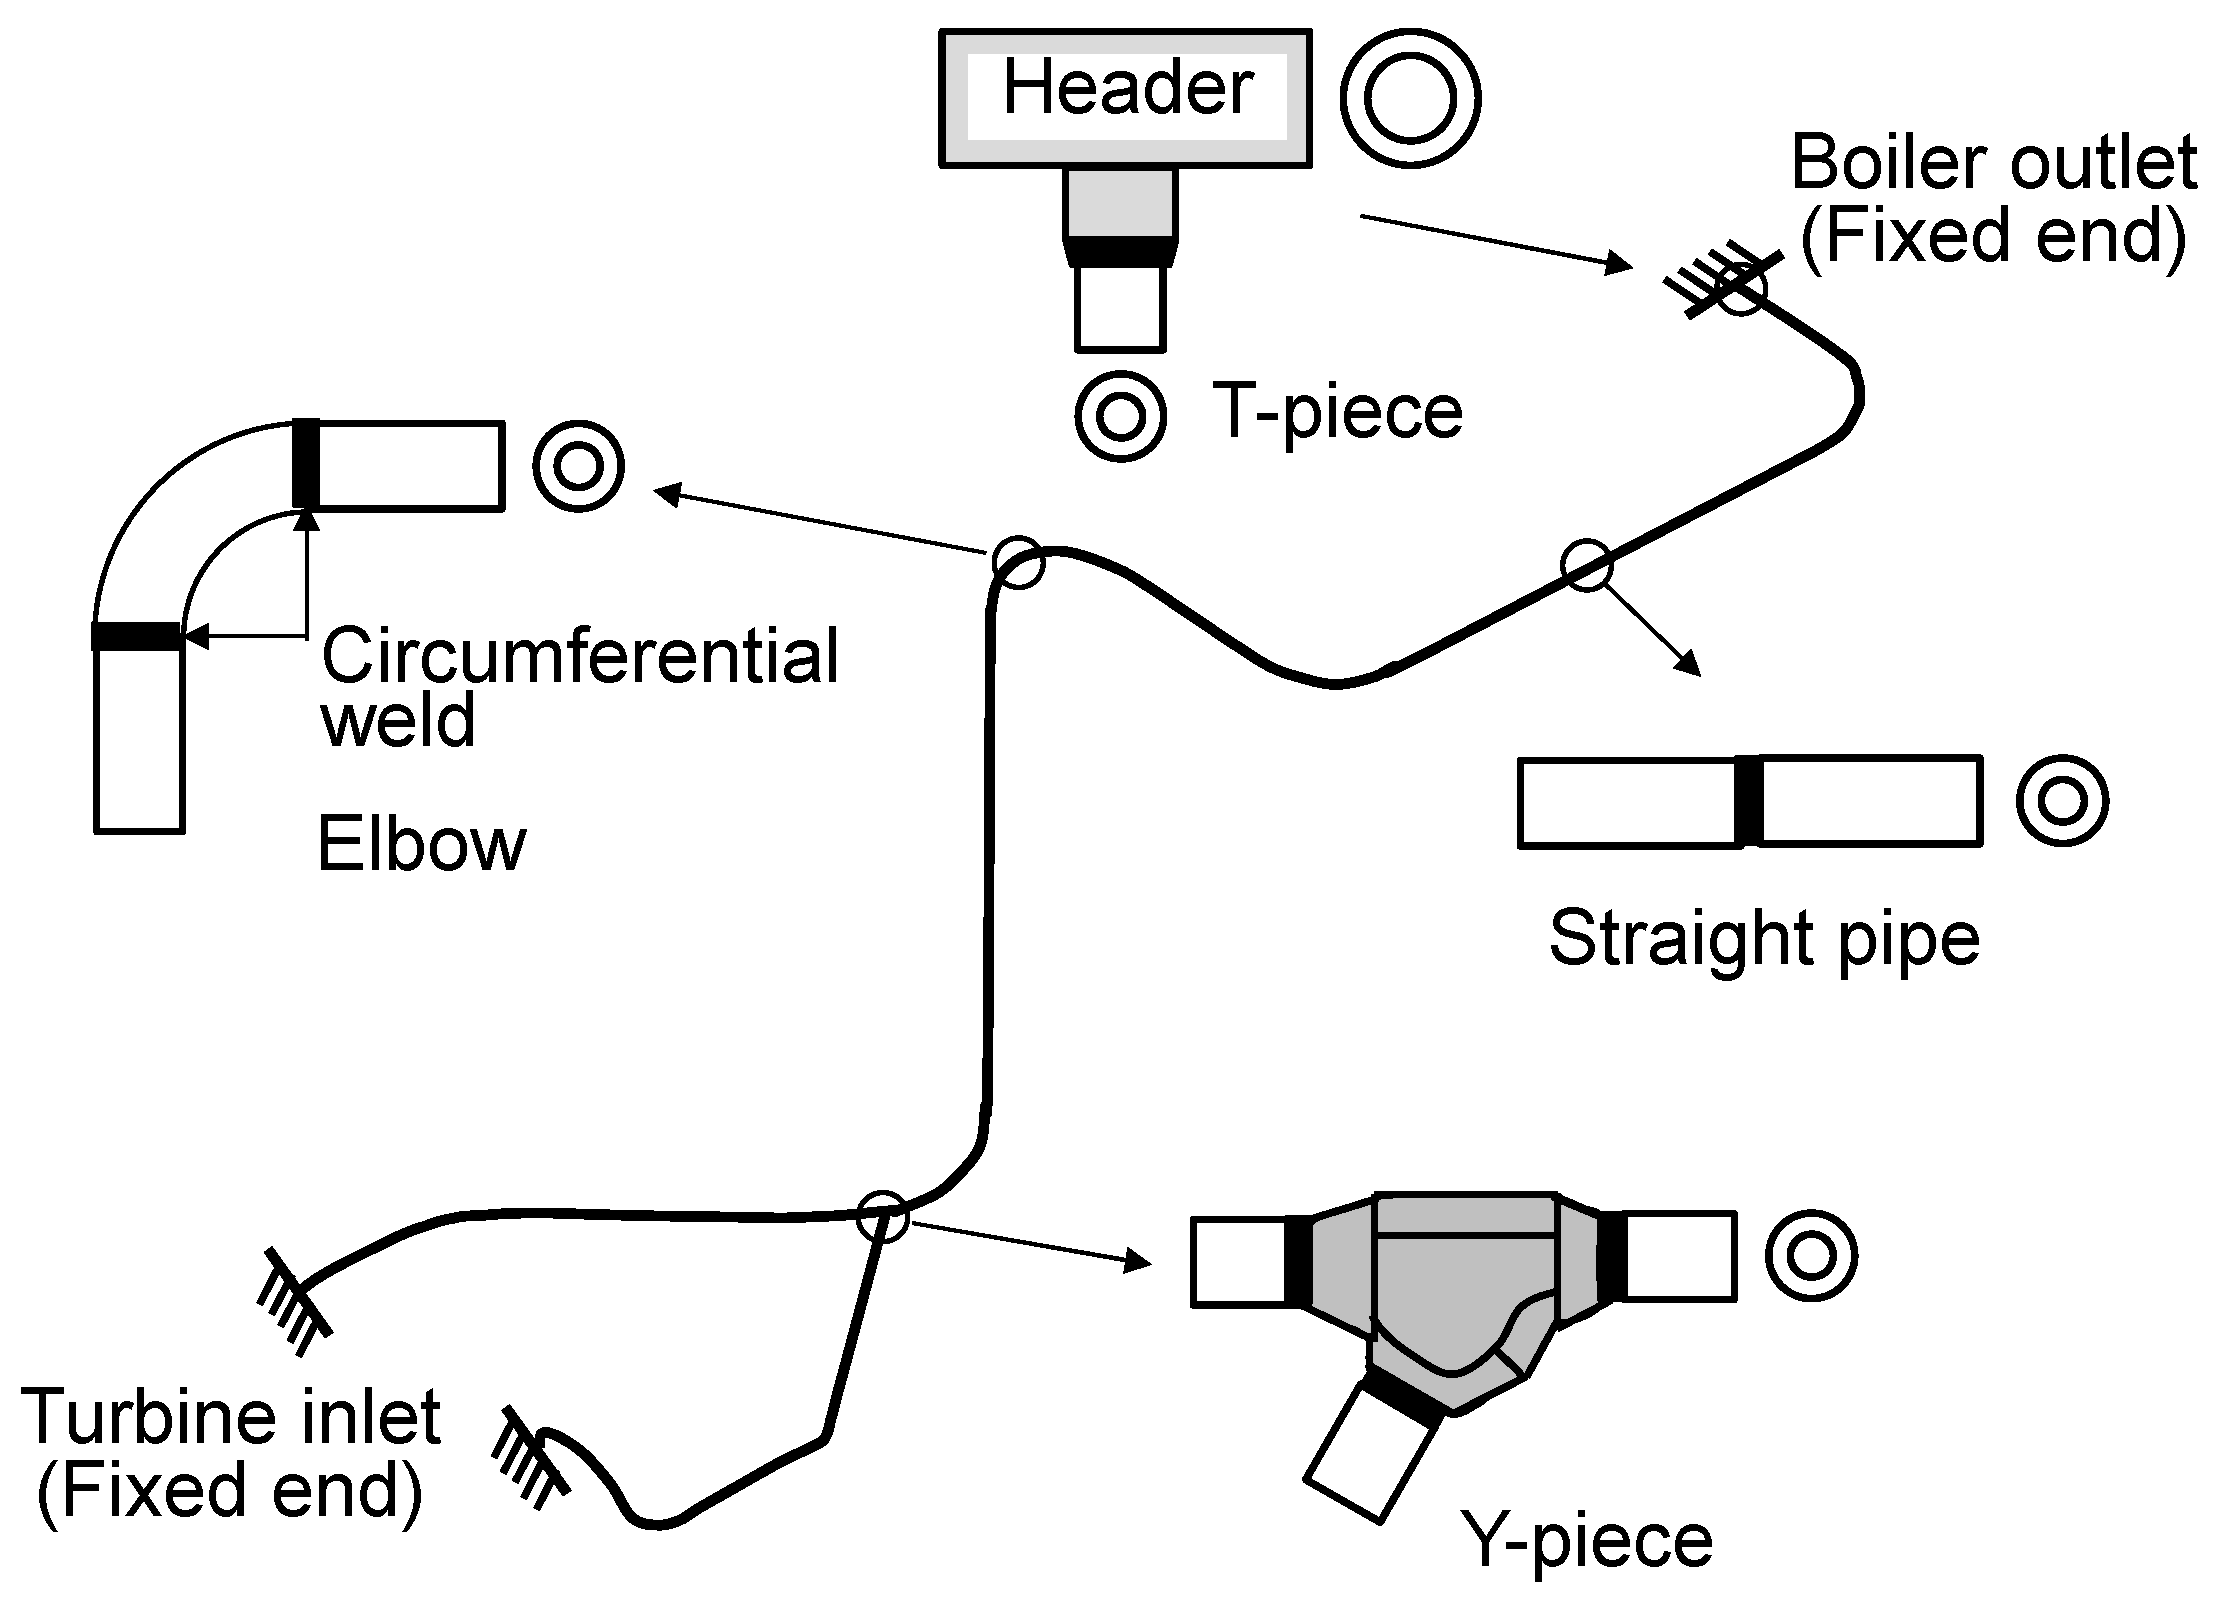
Figure 3.
Loading waveform.
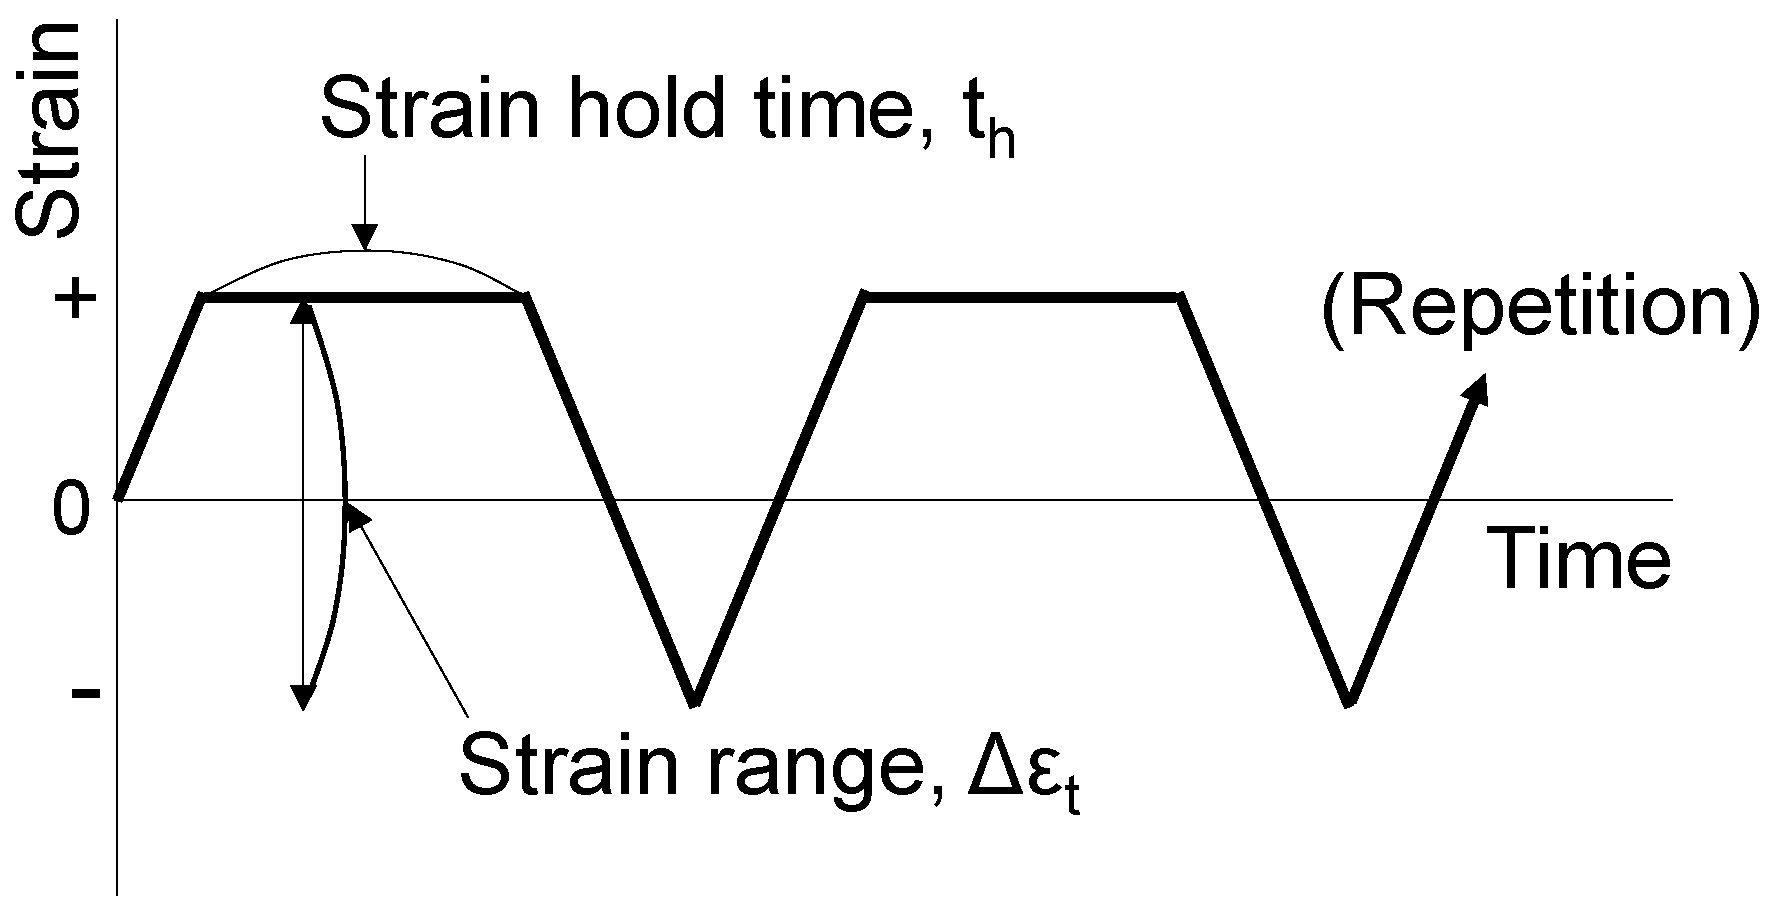
Figure 4.
Creep–fatigue test results for Gr.91 steel at 600 °C [7]. permissioned from Japan Society of Materials Science in 2023.
Figure 4.
Creep–fatigue test results for Gr.91 steel at 600 °C [7]. permissioned from Japan Society of Materials Science in 2023.
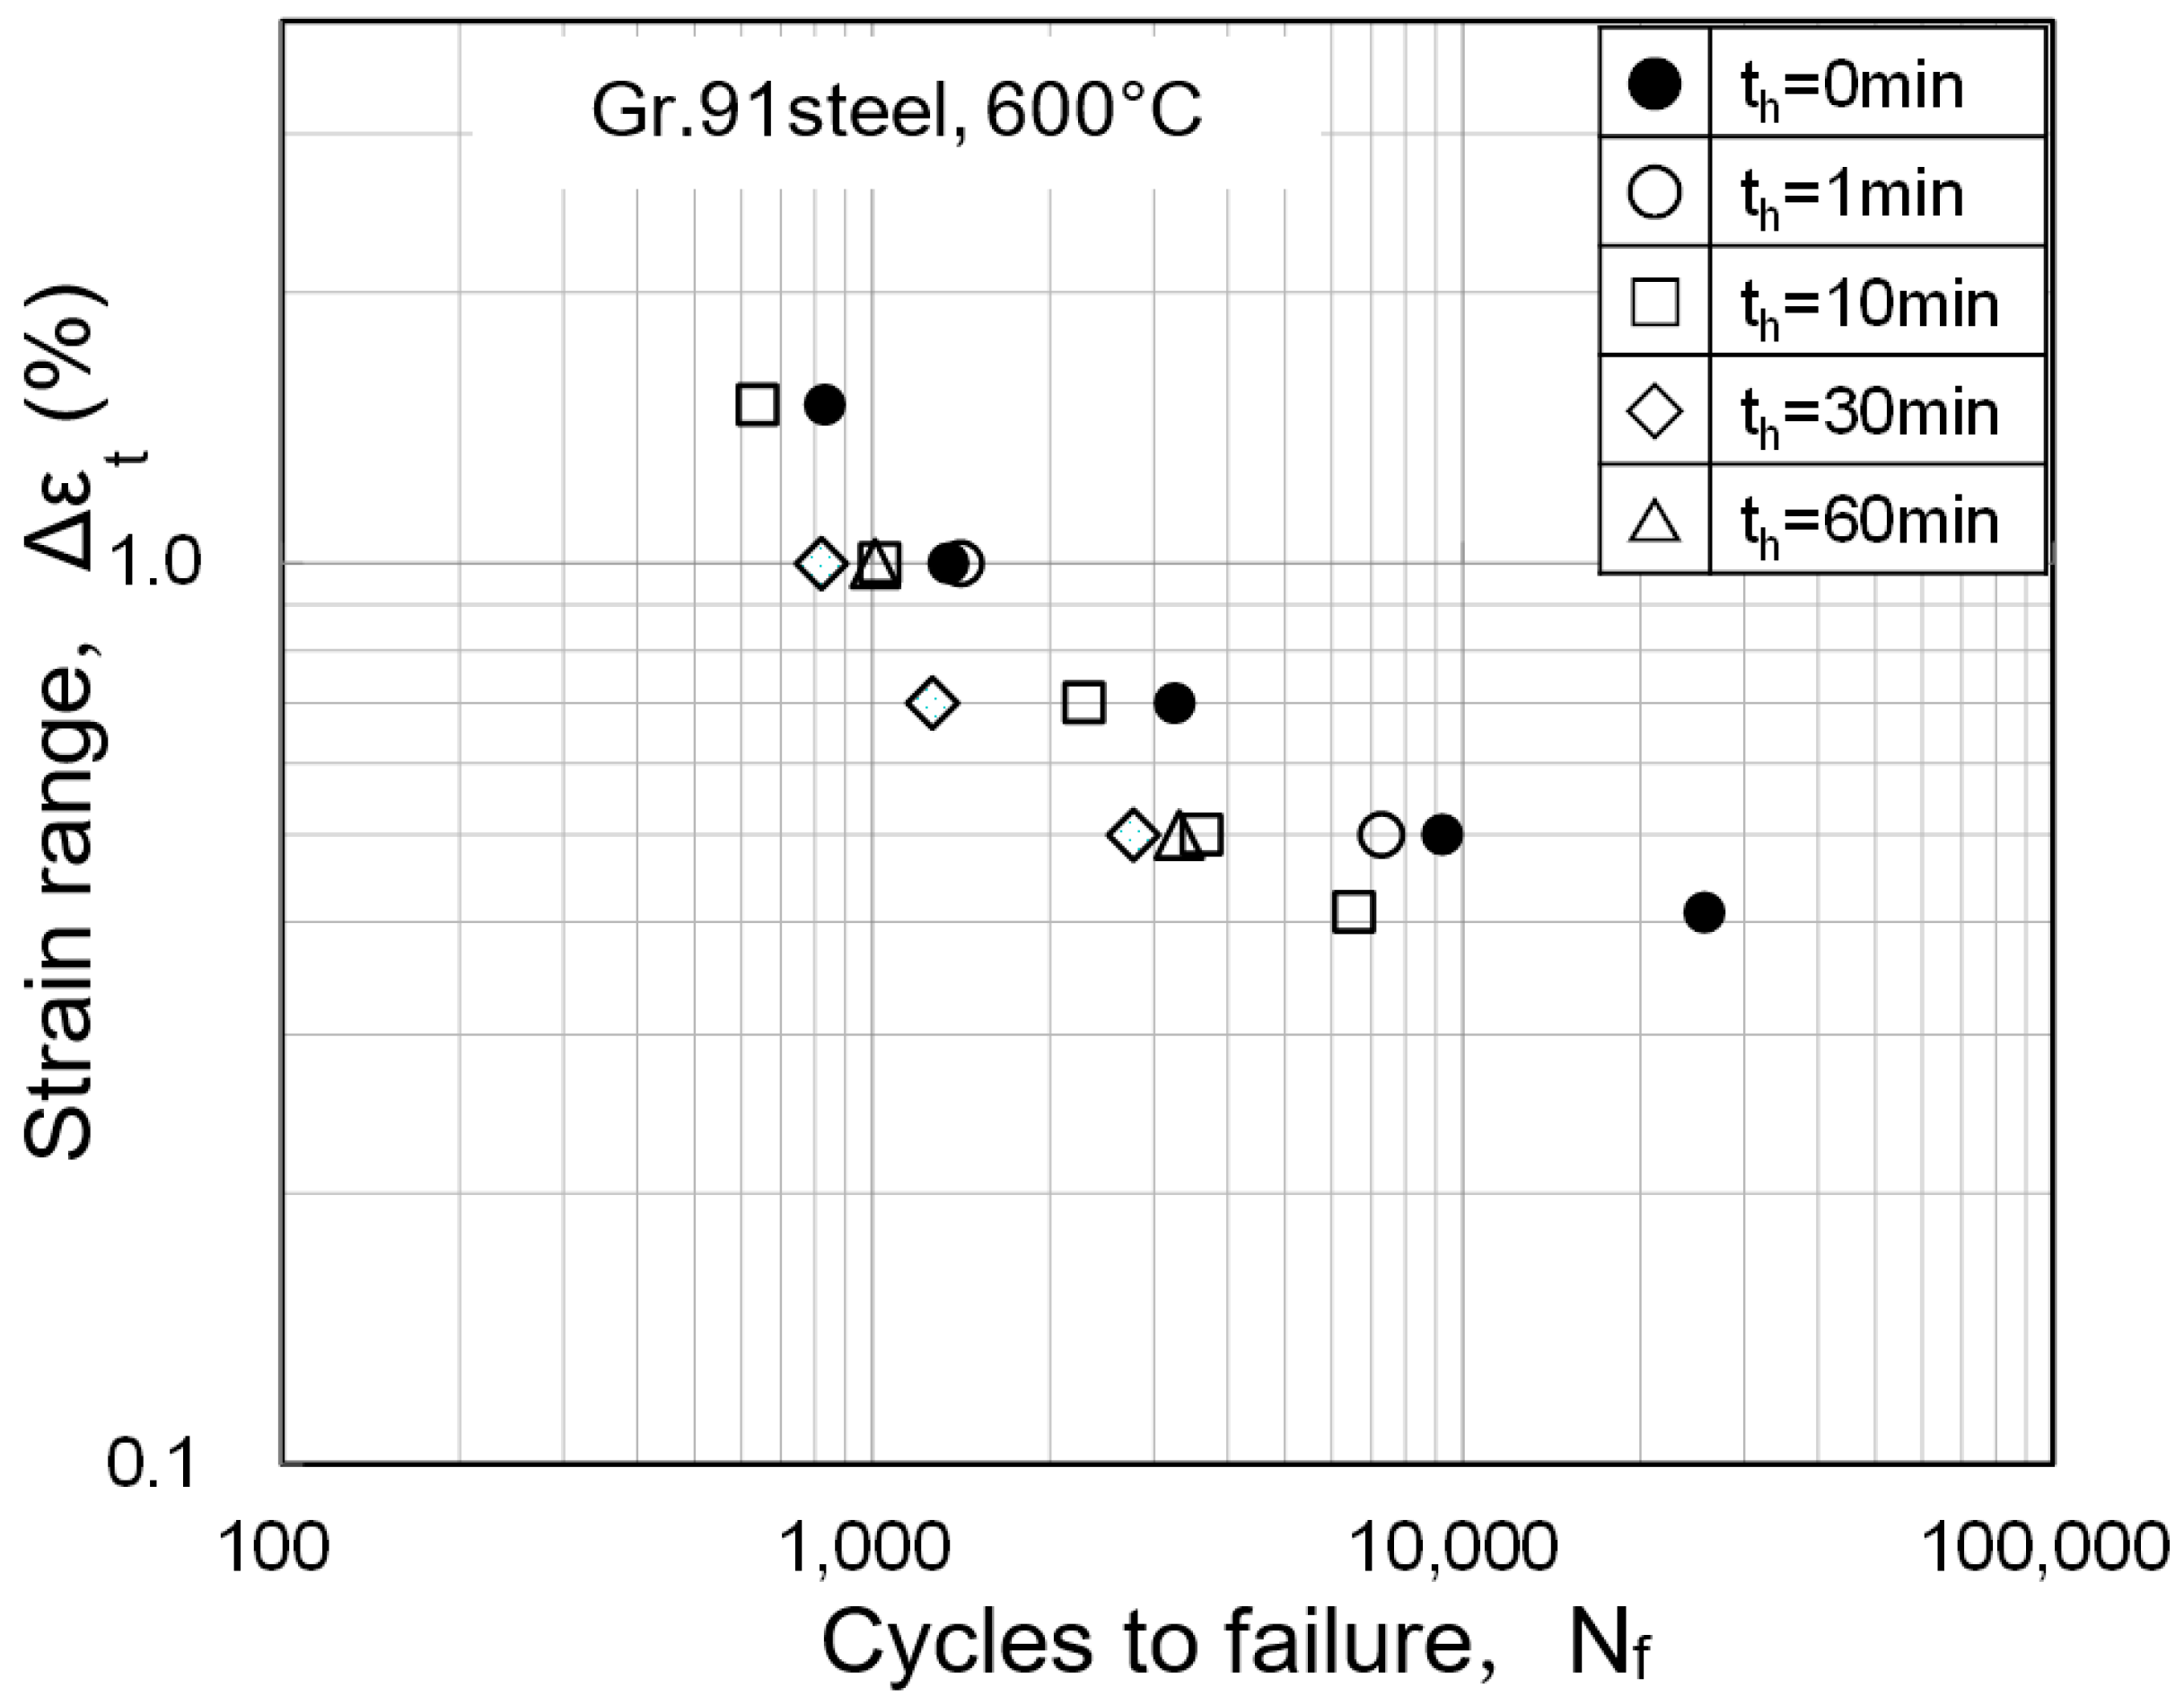
Figure 5.
Fatigue life reduction factors for Gr.91 steel.
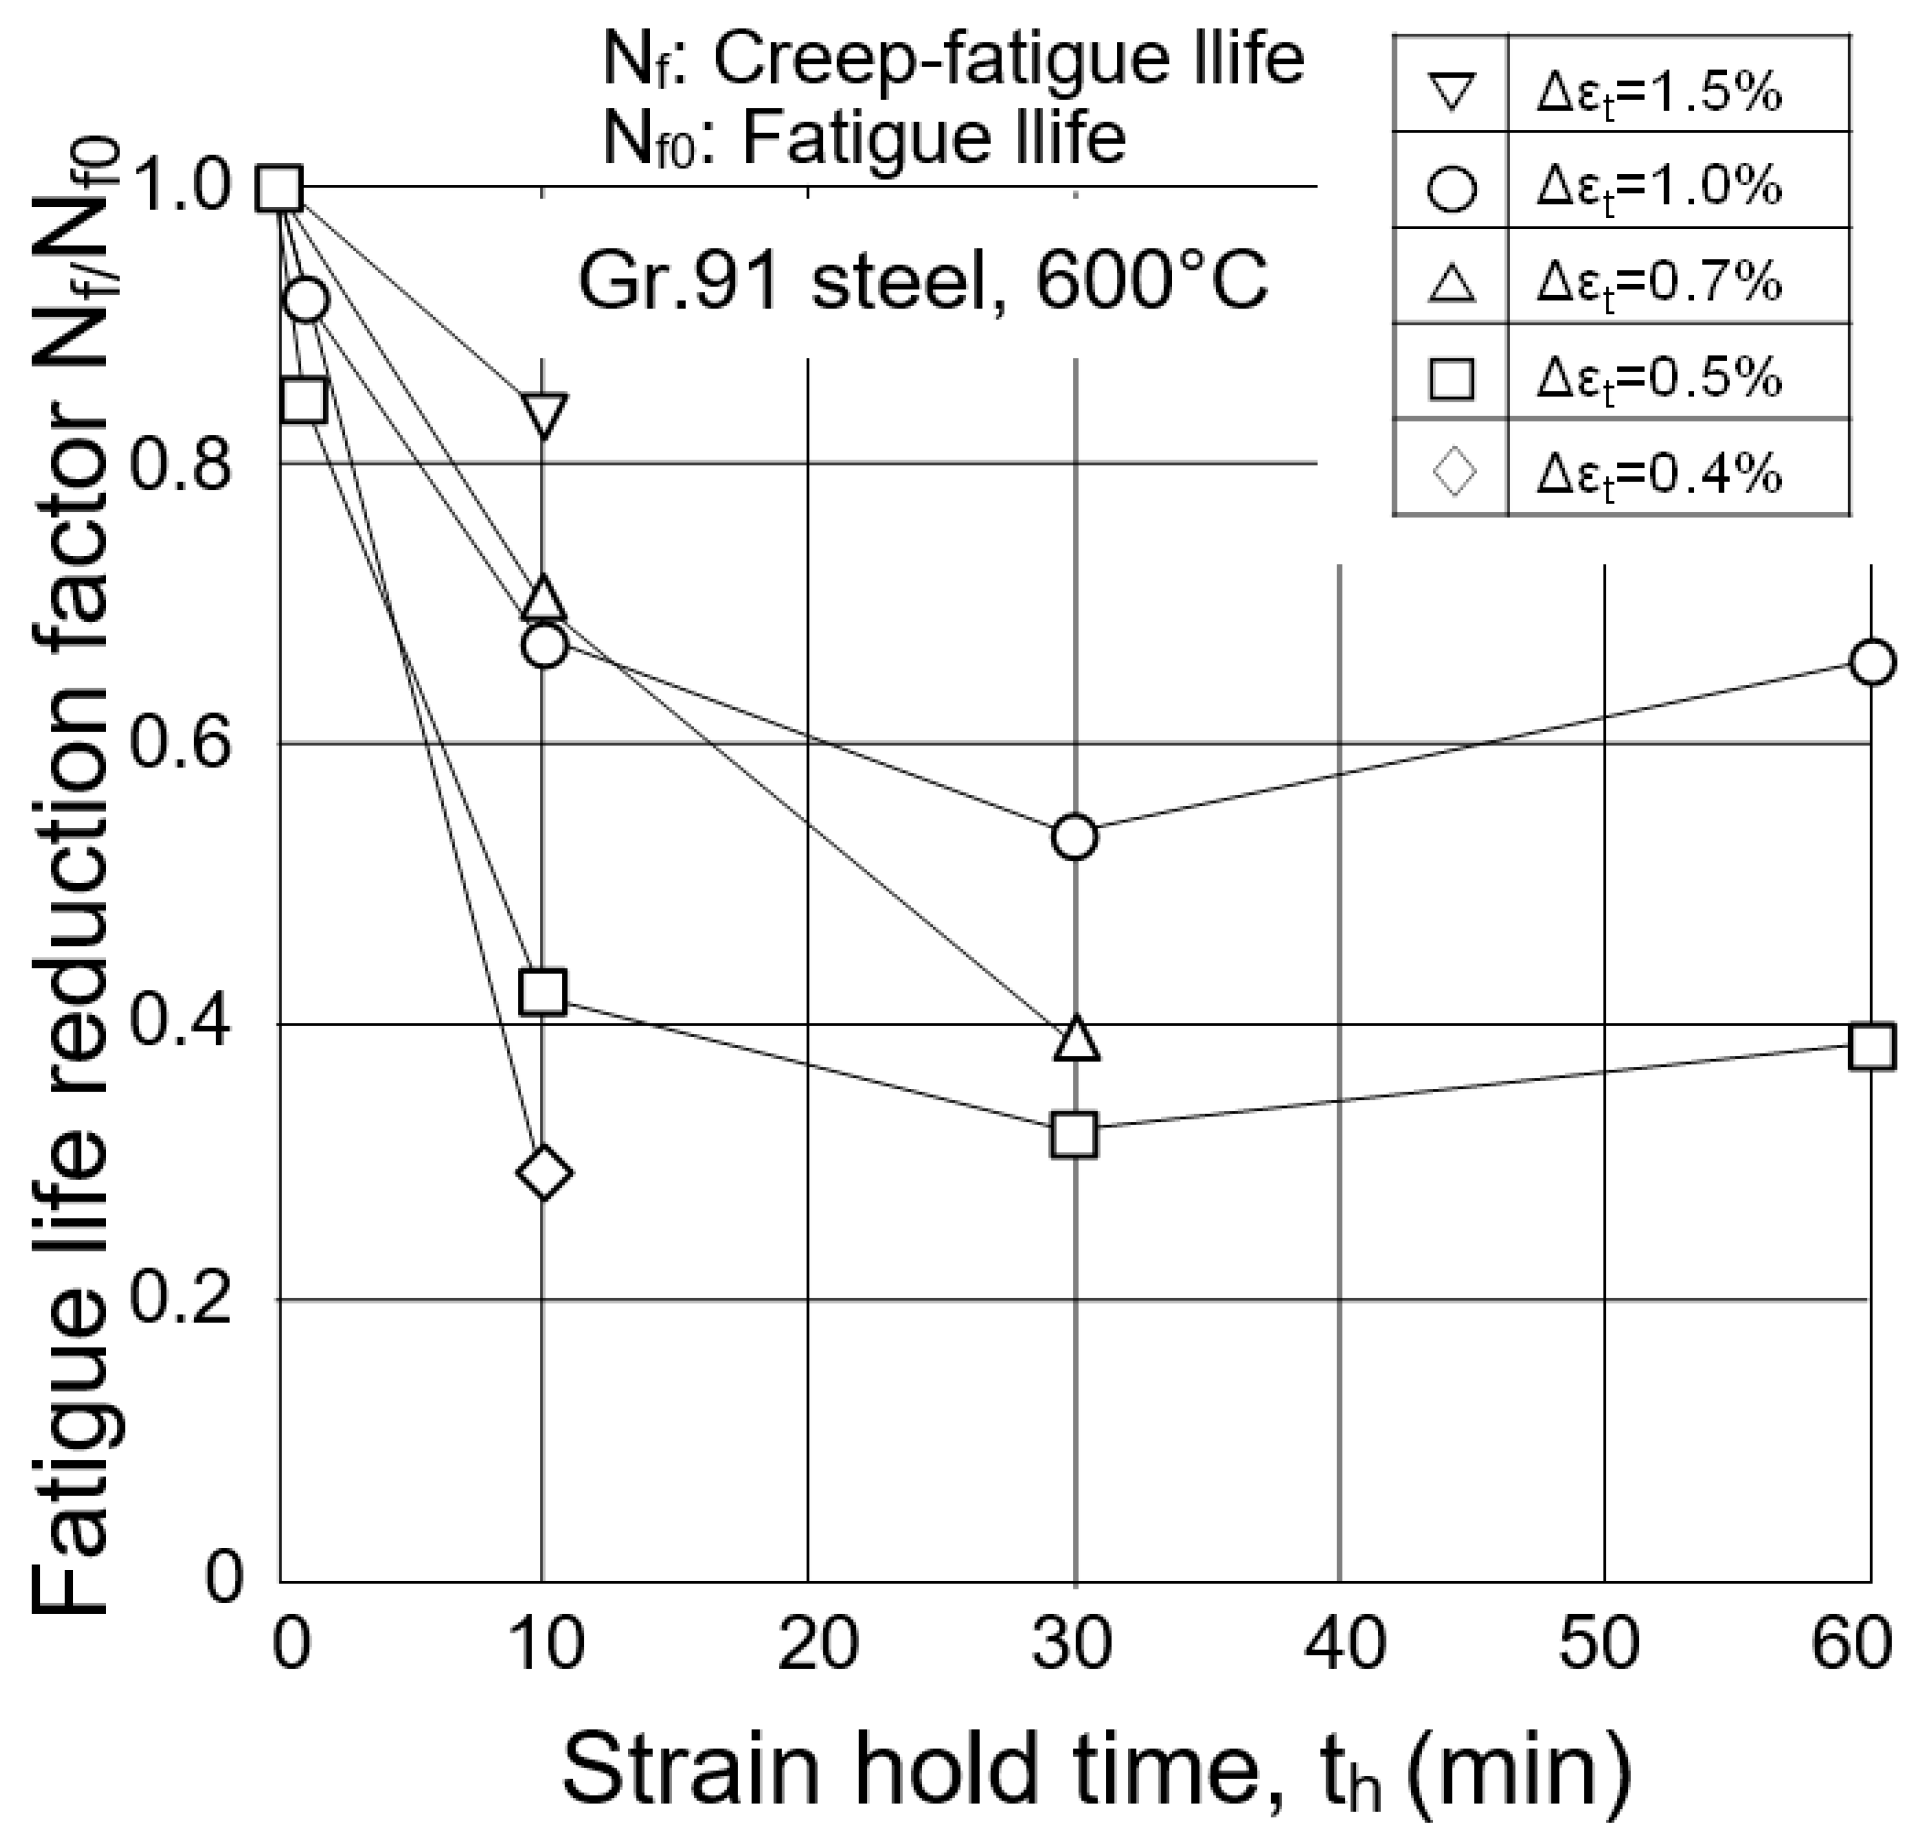
Figure 6.
Comparison of the fatigue life reduction factors among three materials.

Figure 7.
The calculation methods for the fatigue damage and creep damage [7].
Figure 7.
The calculation methods for the fatigue damage and creep damage [7].
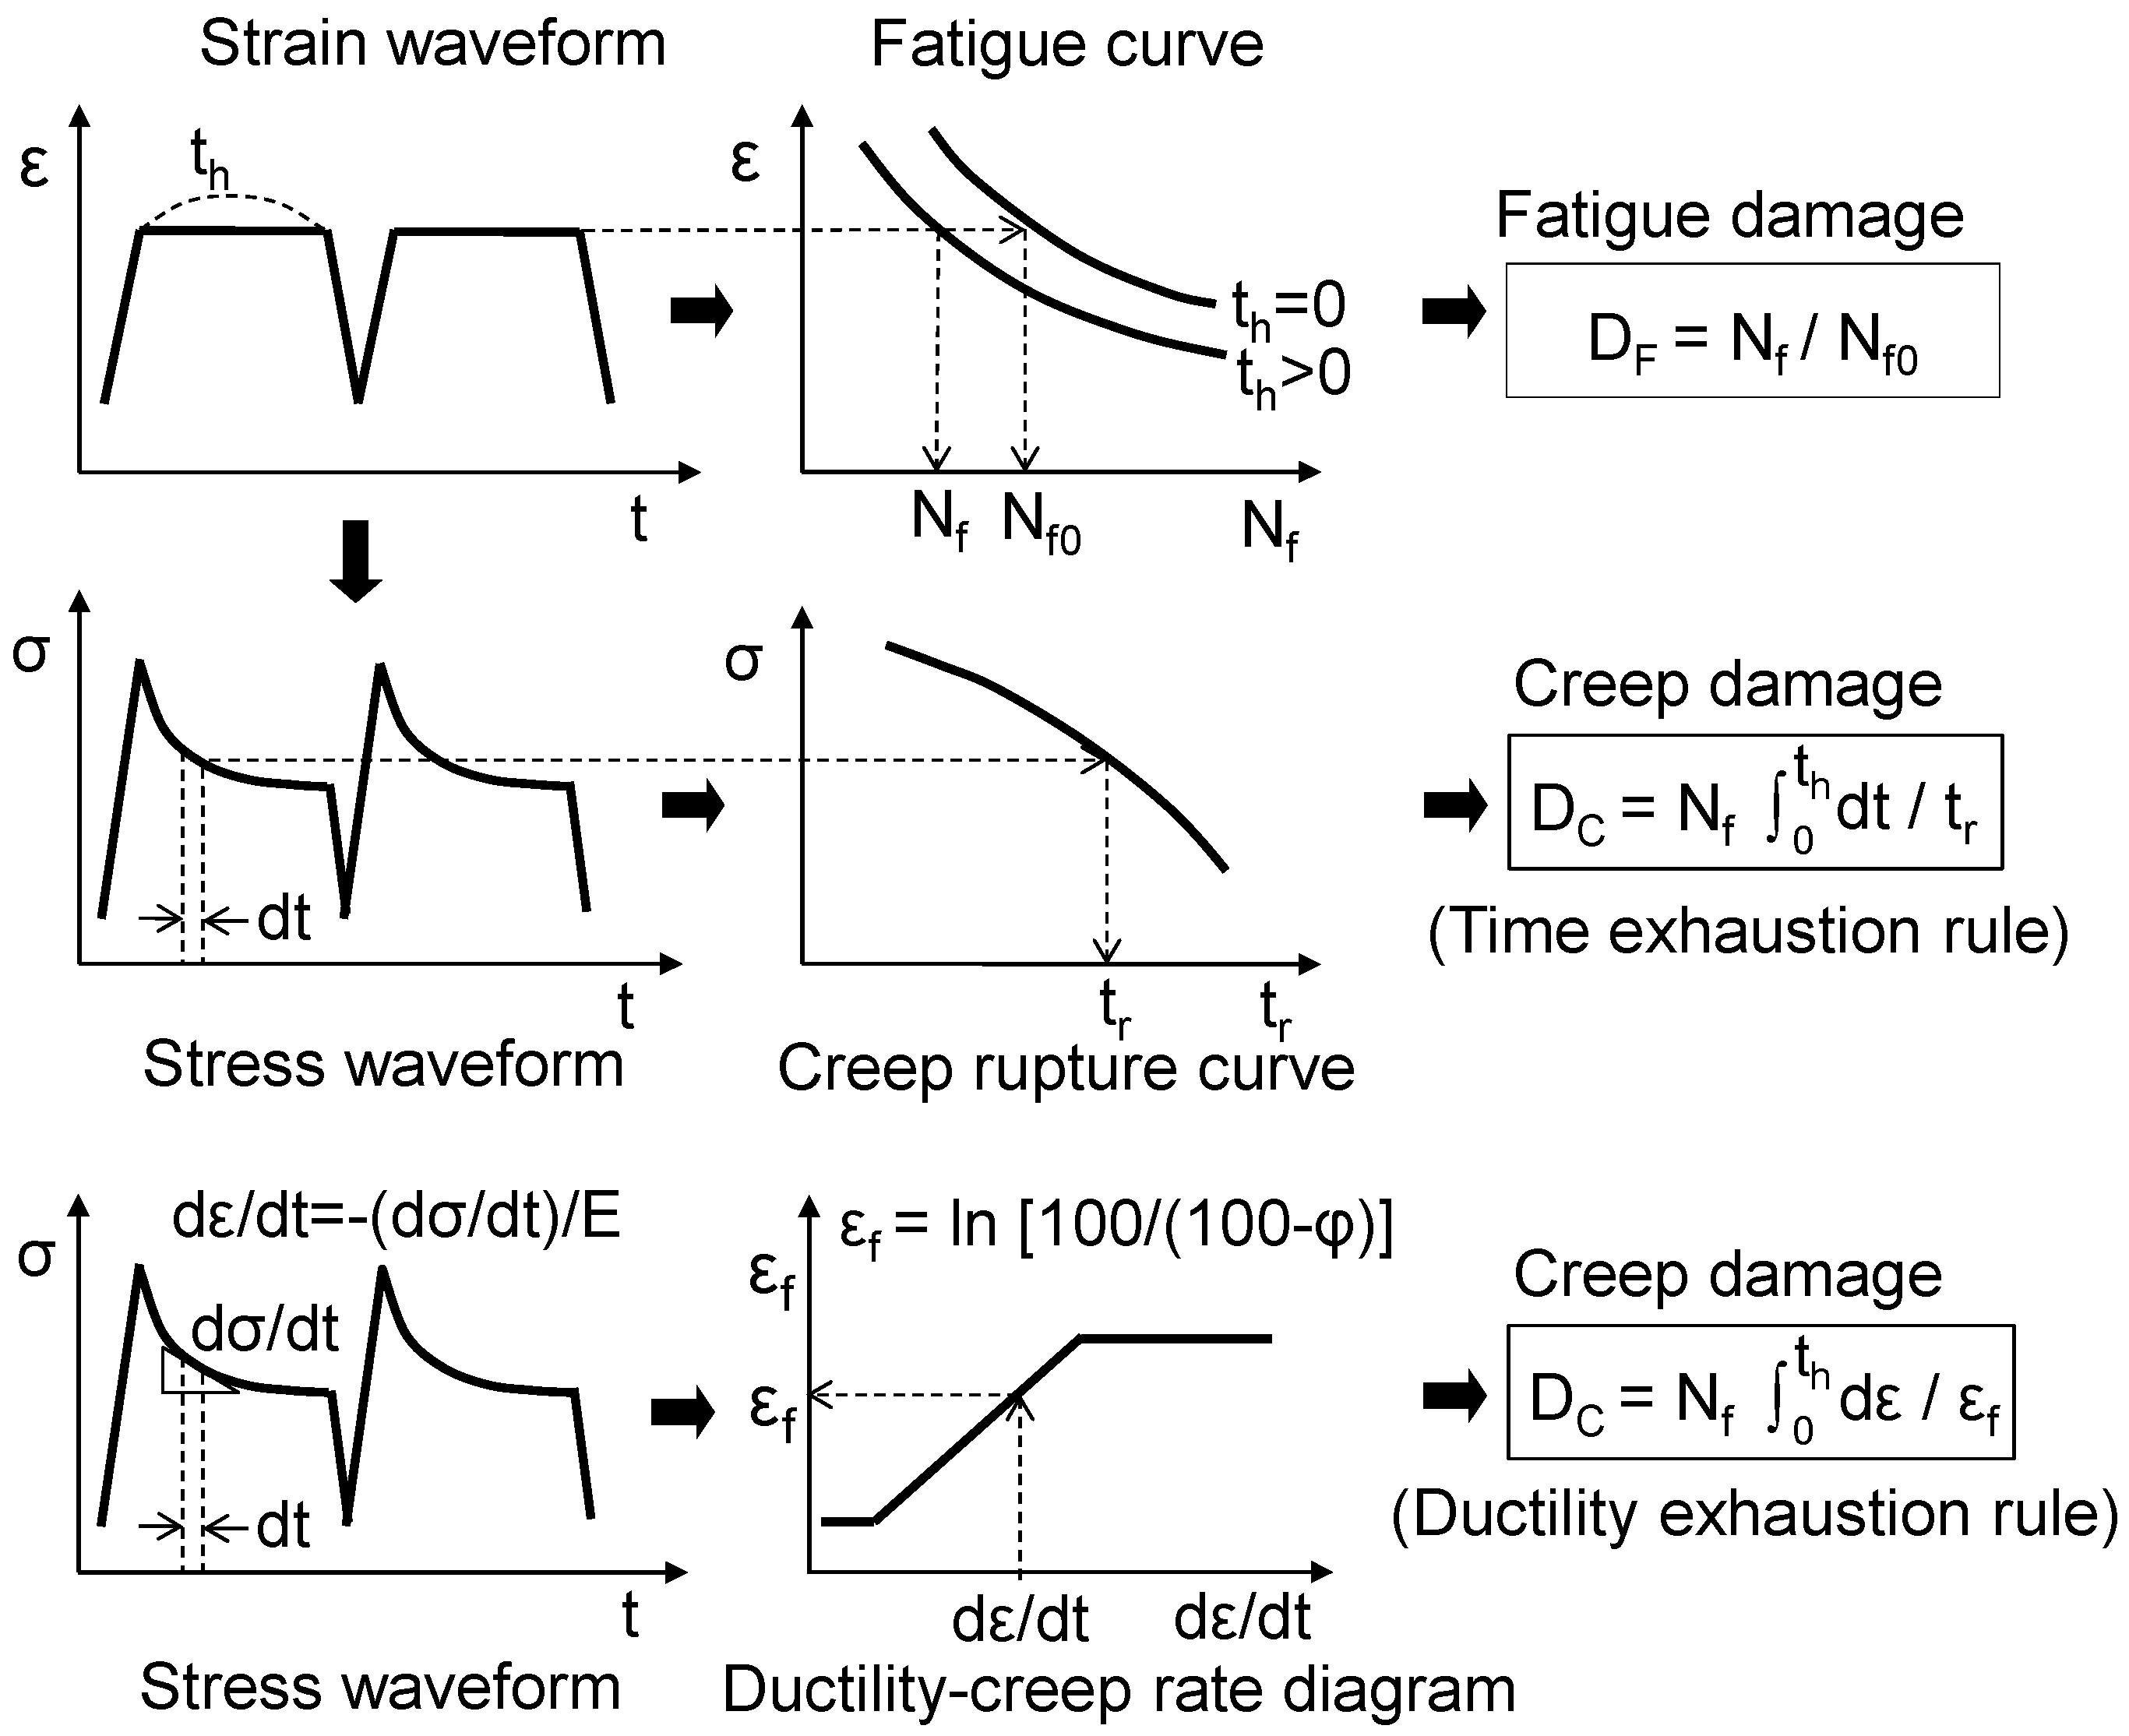
Figure 8.
Accumulated fatigue damage and creep damage until failure [7].
Figure 8.
Accumulated fatigue damage and creep damage until failure [7].
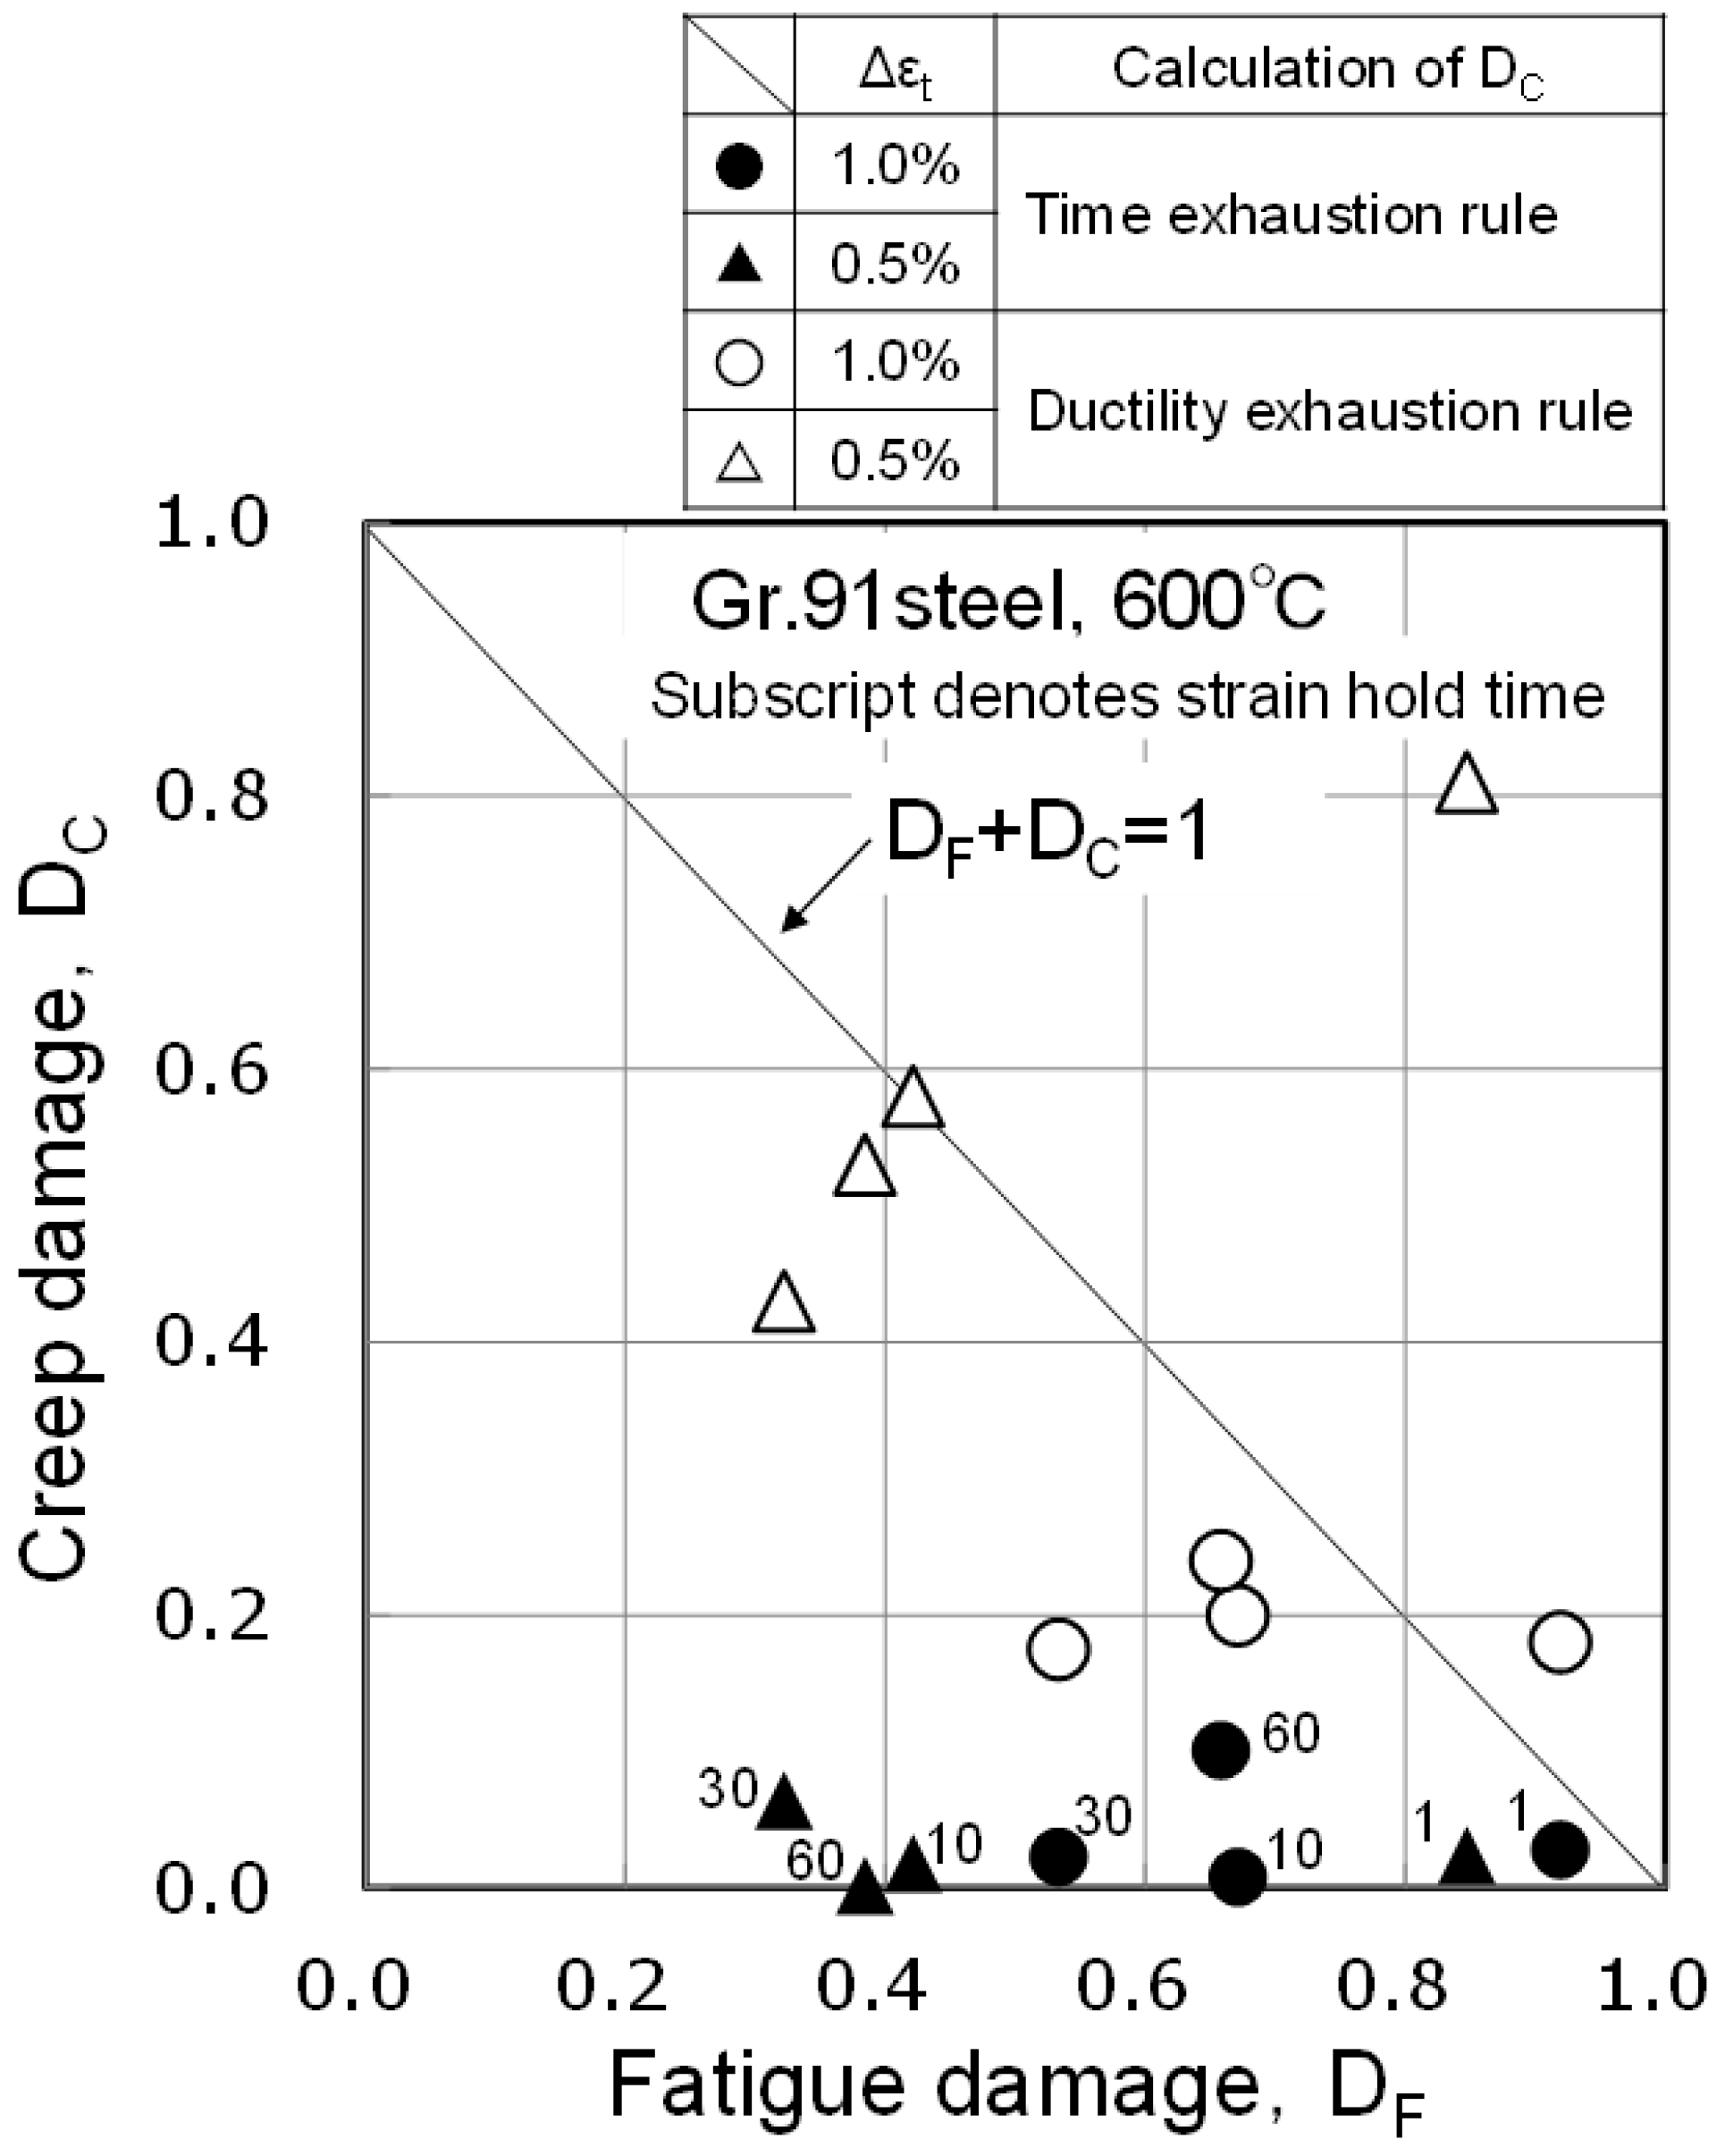
Figure 9.
Two interpretations of the creep–fatigue life estimation results.

Figure 10.
An improved linear damage summation rule considering the creep–fatigue interaction.
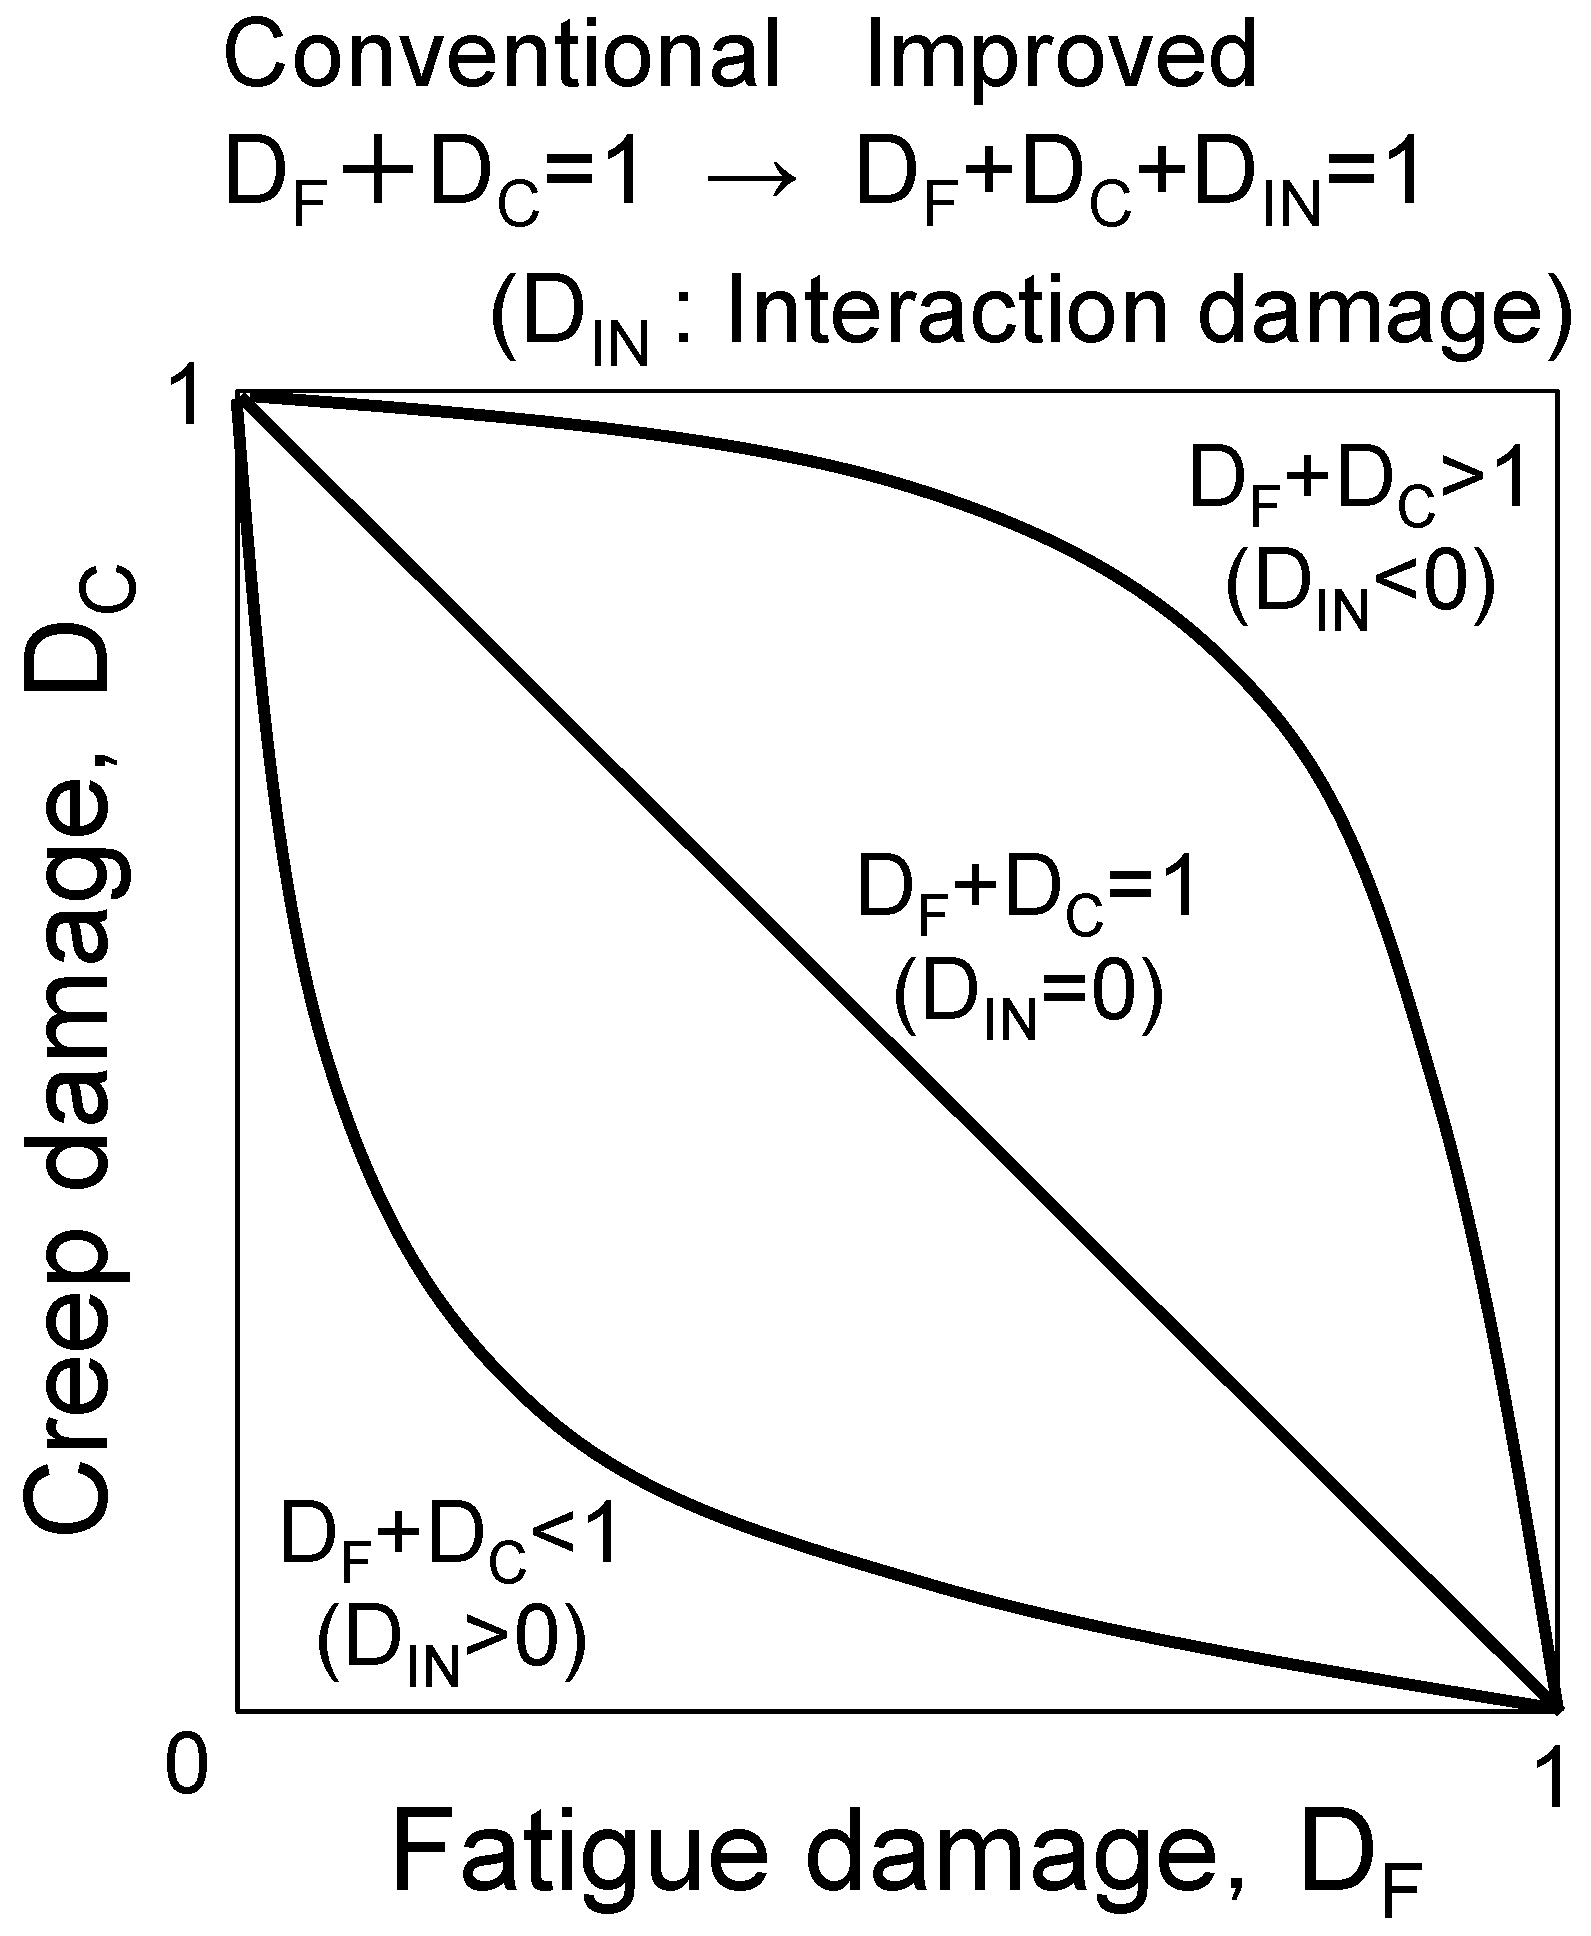
Figure 11.
Procedure for the creep–fatigue interaction analysis [19].
Figure 11.
Procedure for the creep–fatigue interaction analysis [19].
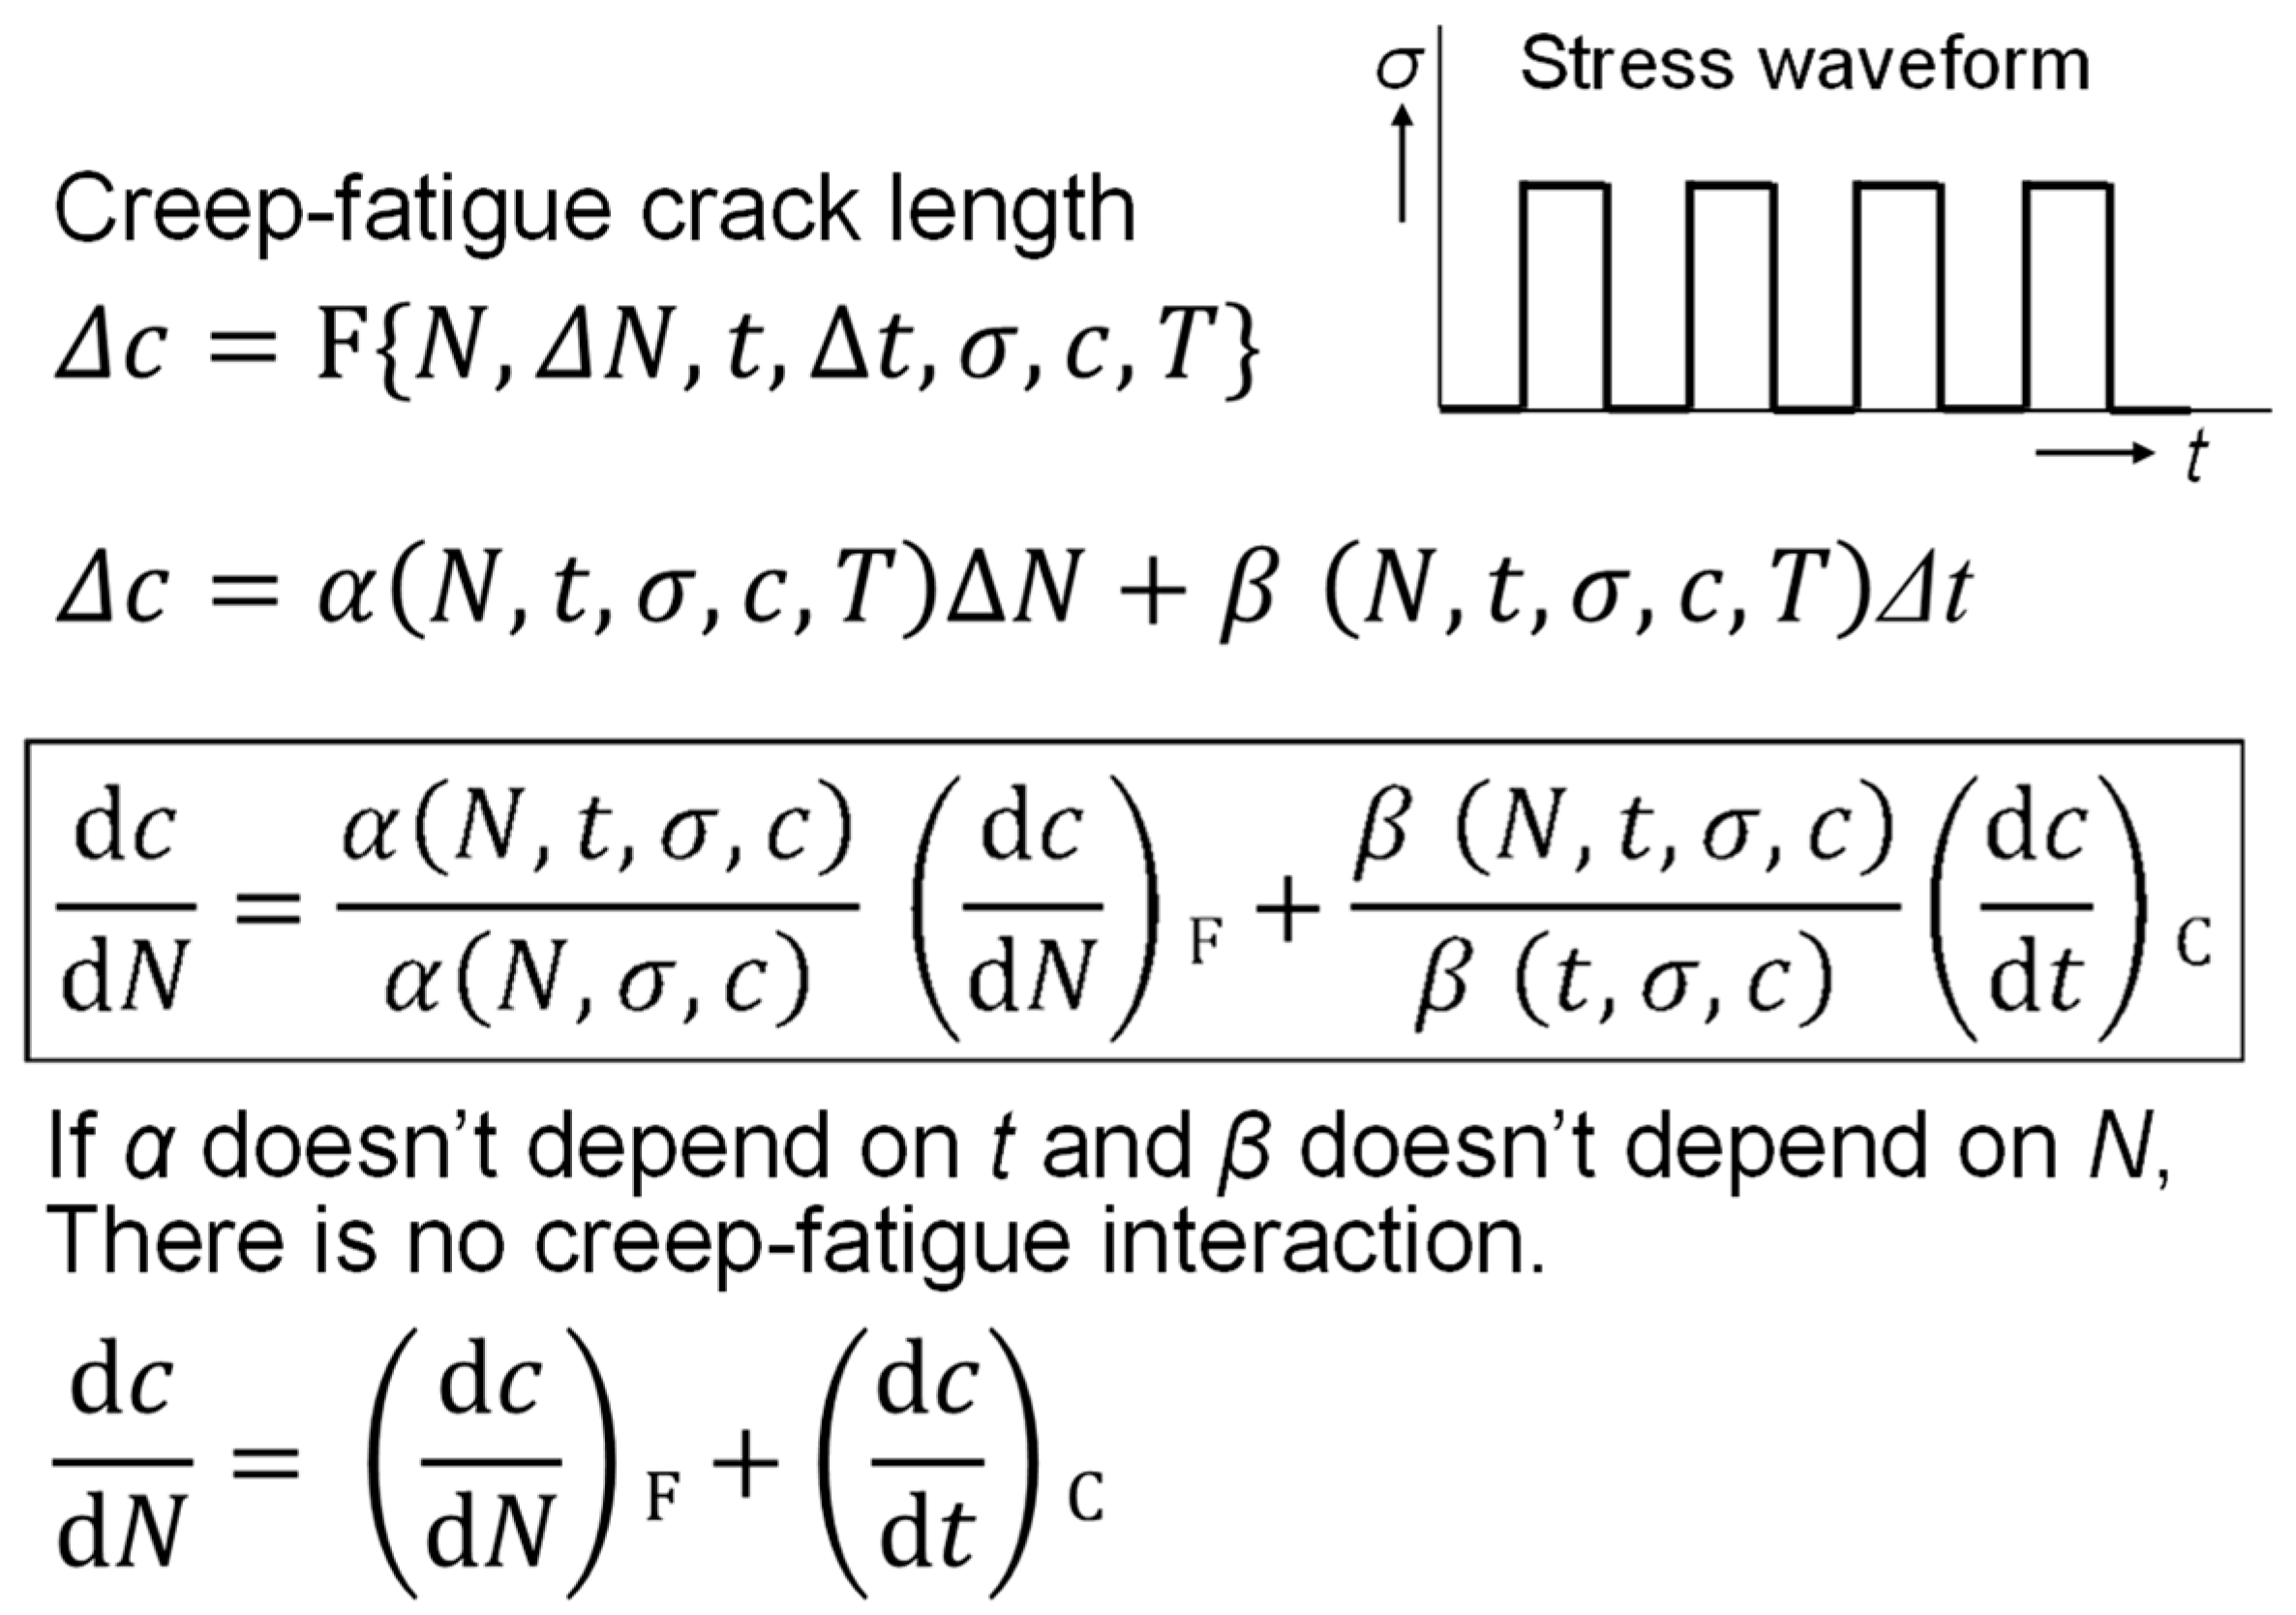
Figure 12.
Test pieces of Gr.91 steel welded joints [20].
Figure 12.
Test pieces of Gr.91 steel welded joints [20].
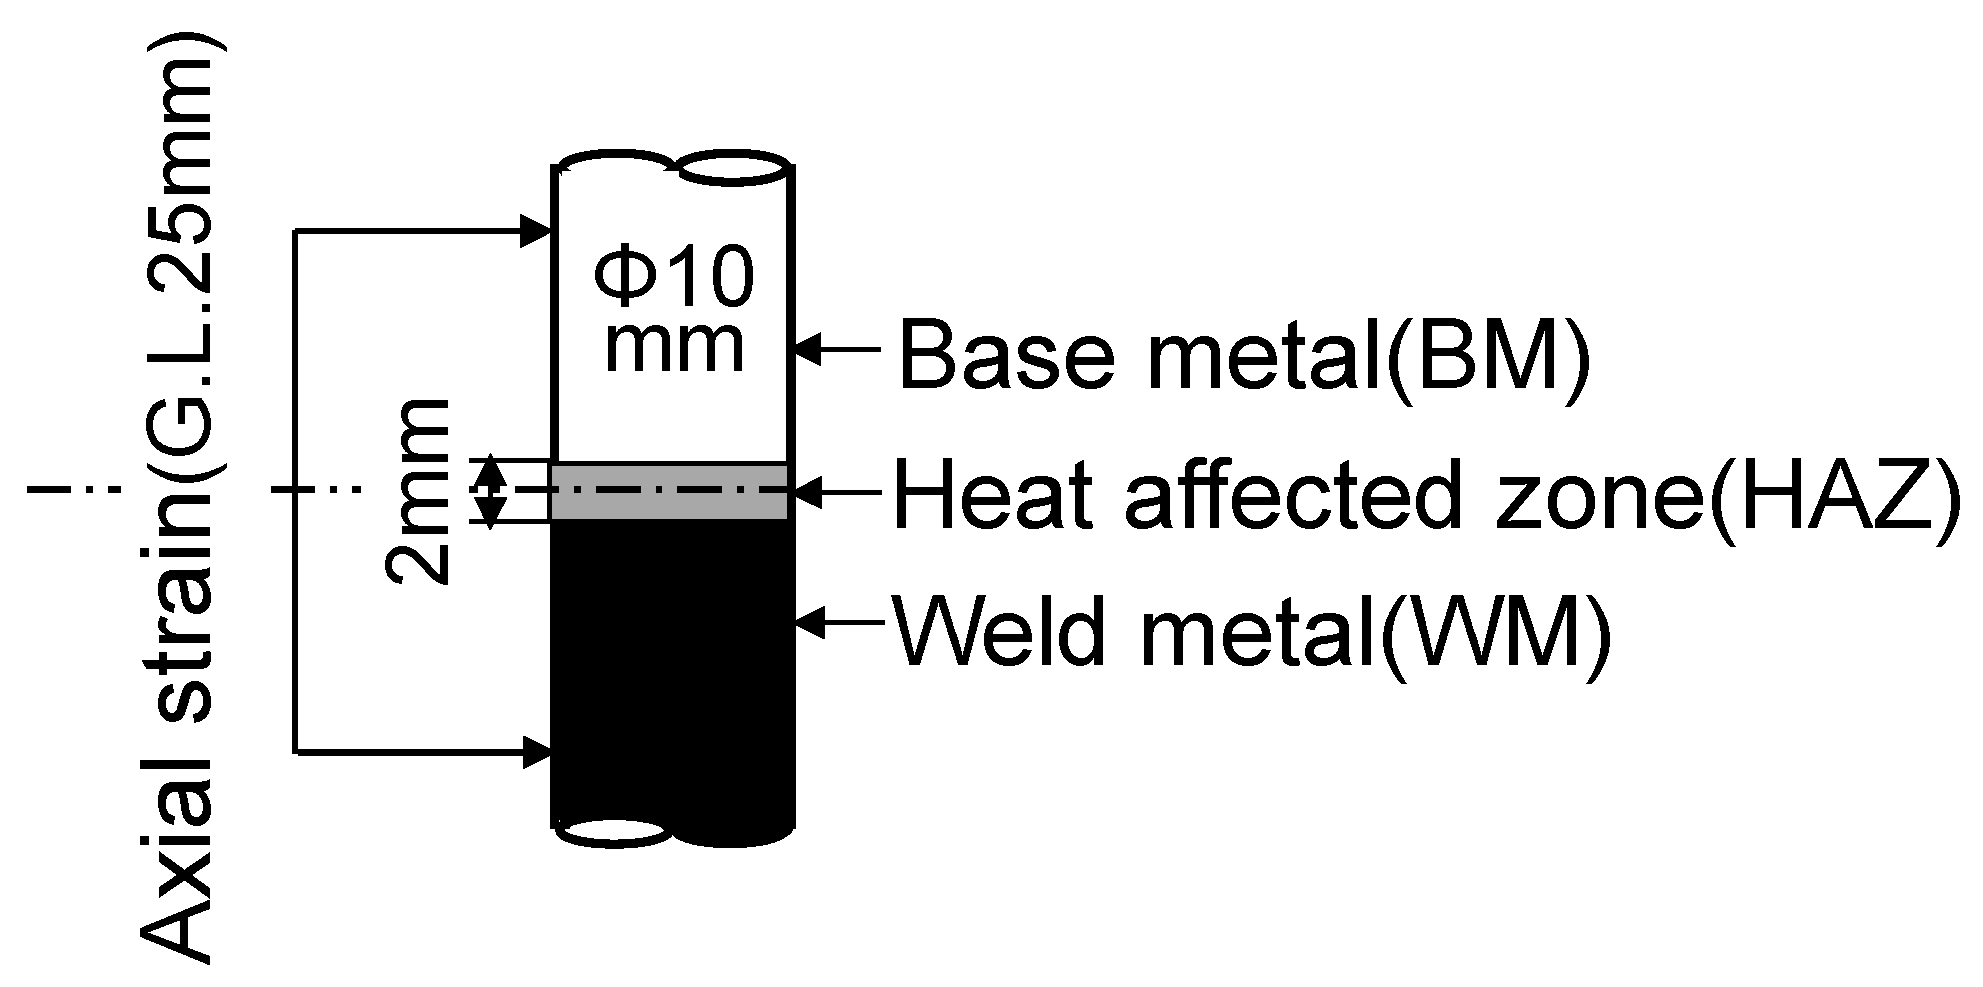
Figure 13.
Hardness distribution of the welded joints [20].
Figure 13.
Hardness distribution of the welded joints [20].

Figure 14.
Fracture location from a cross-sectional view [20].
Figure 14.
Fracture location from a cross-sectional view [20].

Figure 15.
Cross-sectional view of the fractured test piece [20].
Figure 15.
Cross-sectional view of the fractured test piece [20].
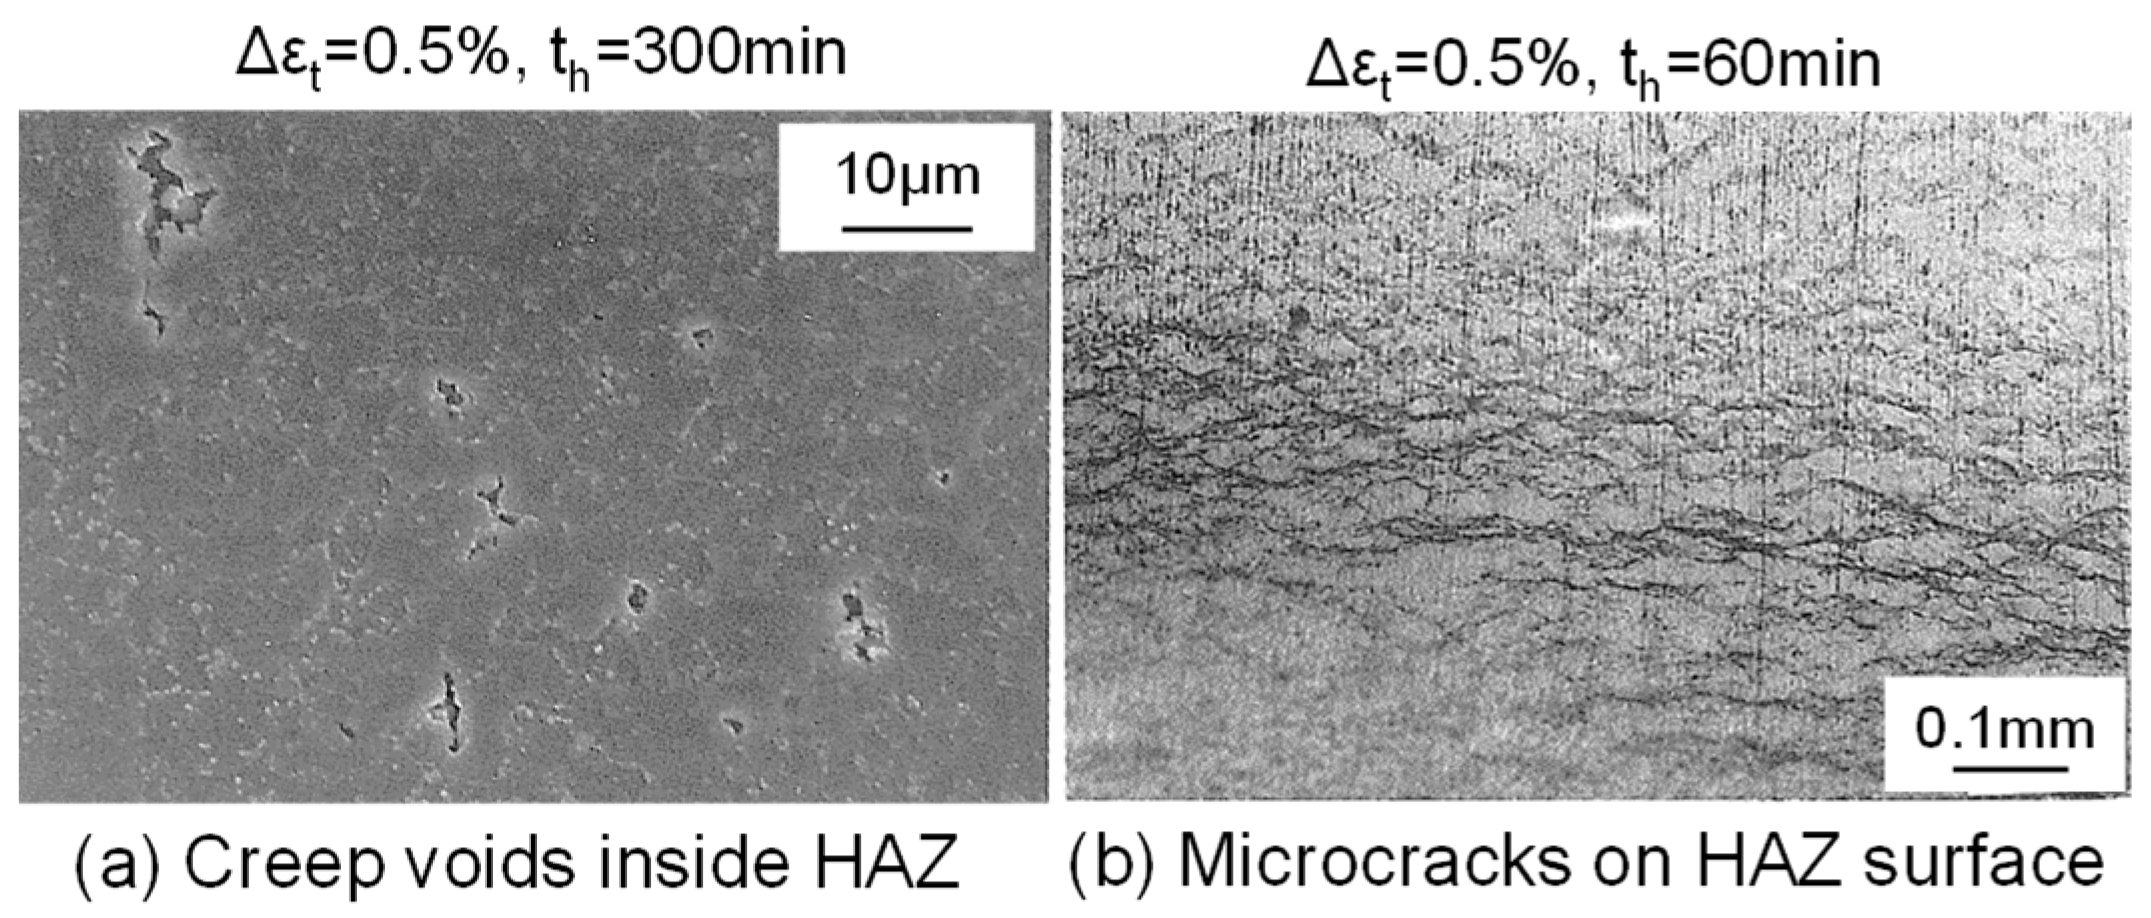
Figure 16.
Fatigue life reduction factor of the Gr.91 steel welded joint [20].
Figure 16.
Fatigue life reduction factor of the Gr.91 steel welded joint [20].
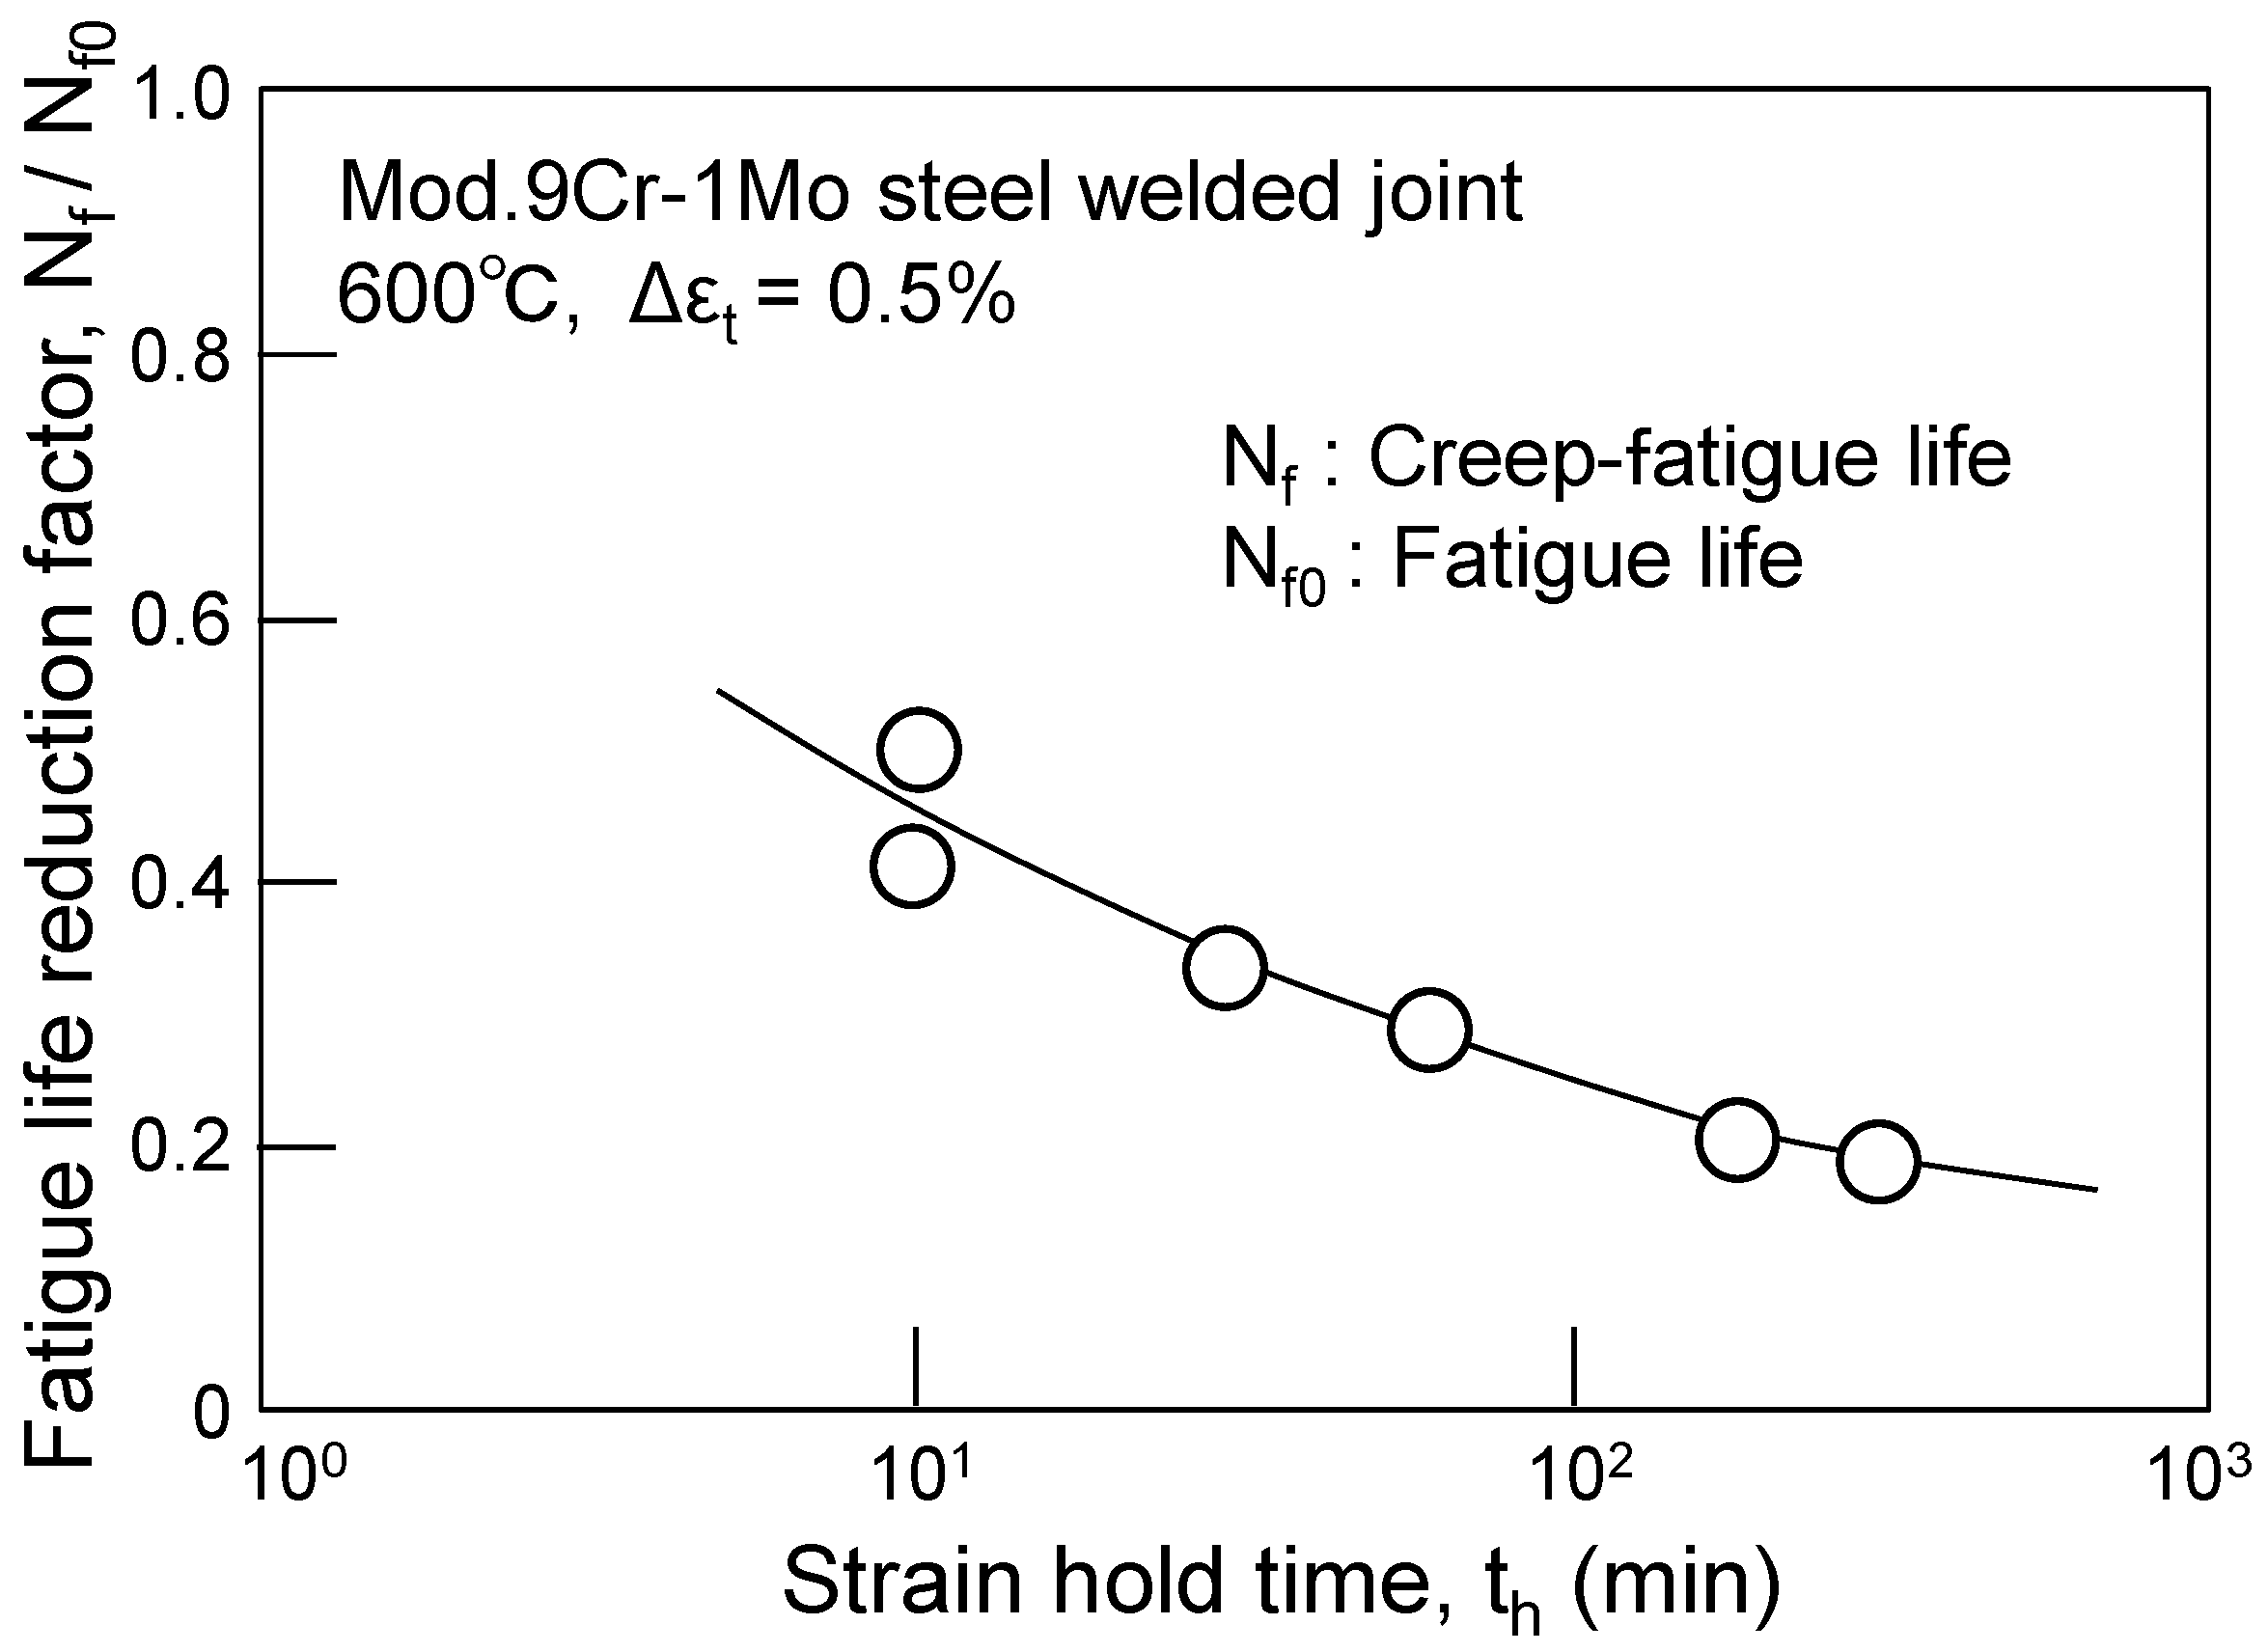
Figure 17.
Calculation method for the fatigue damage and creep damage of welded joints [20].
Figure 17.
Calculation method for the fatigue damage and creep damage of welded joints [20].
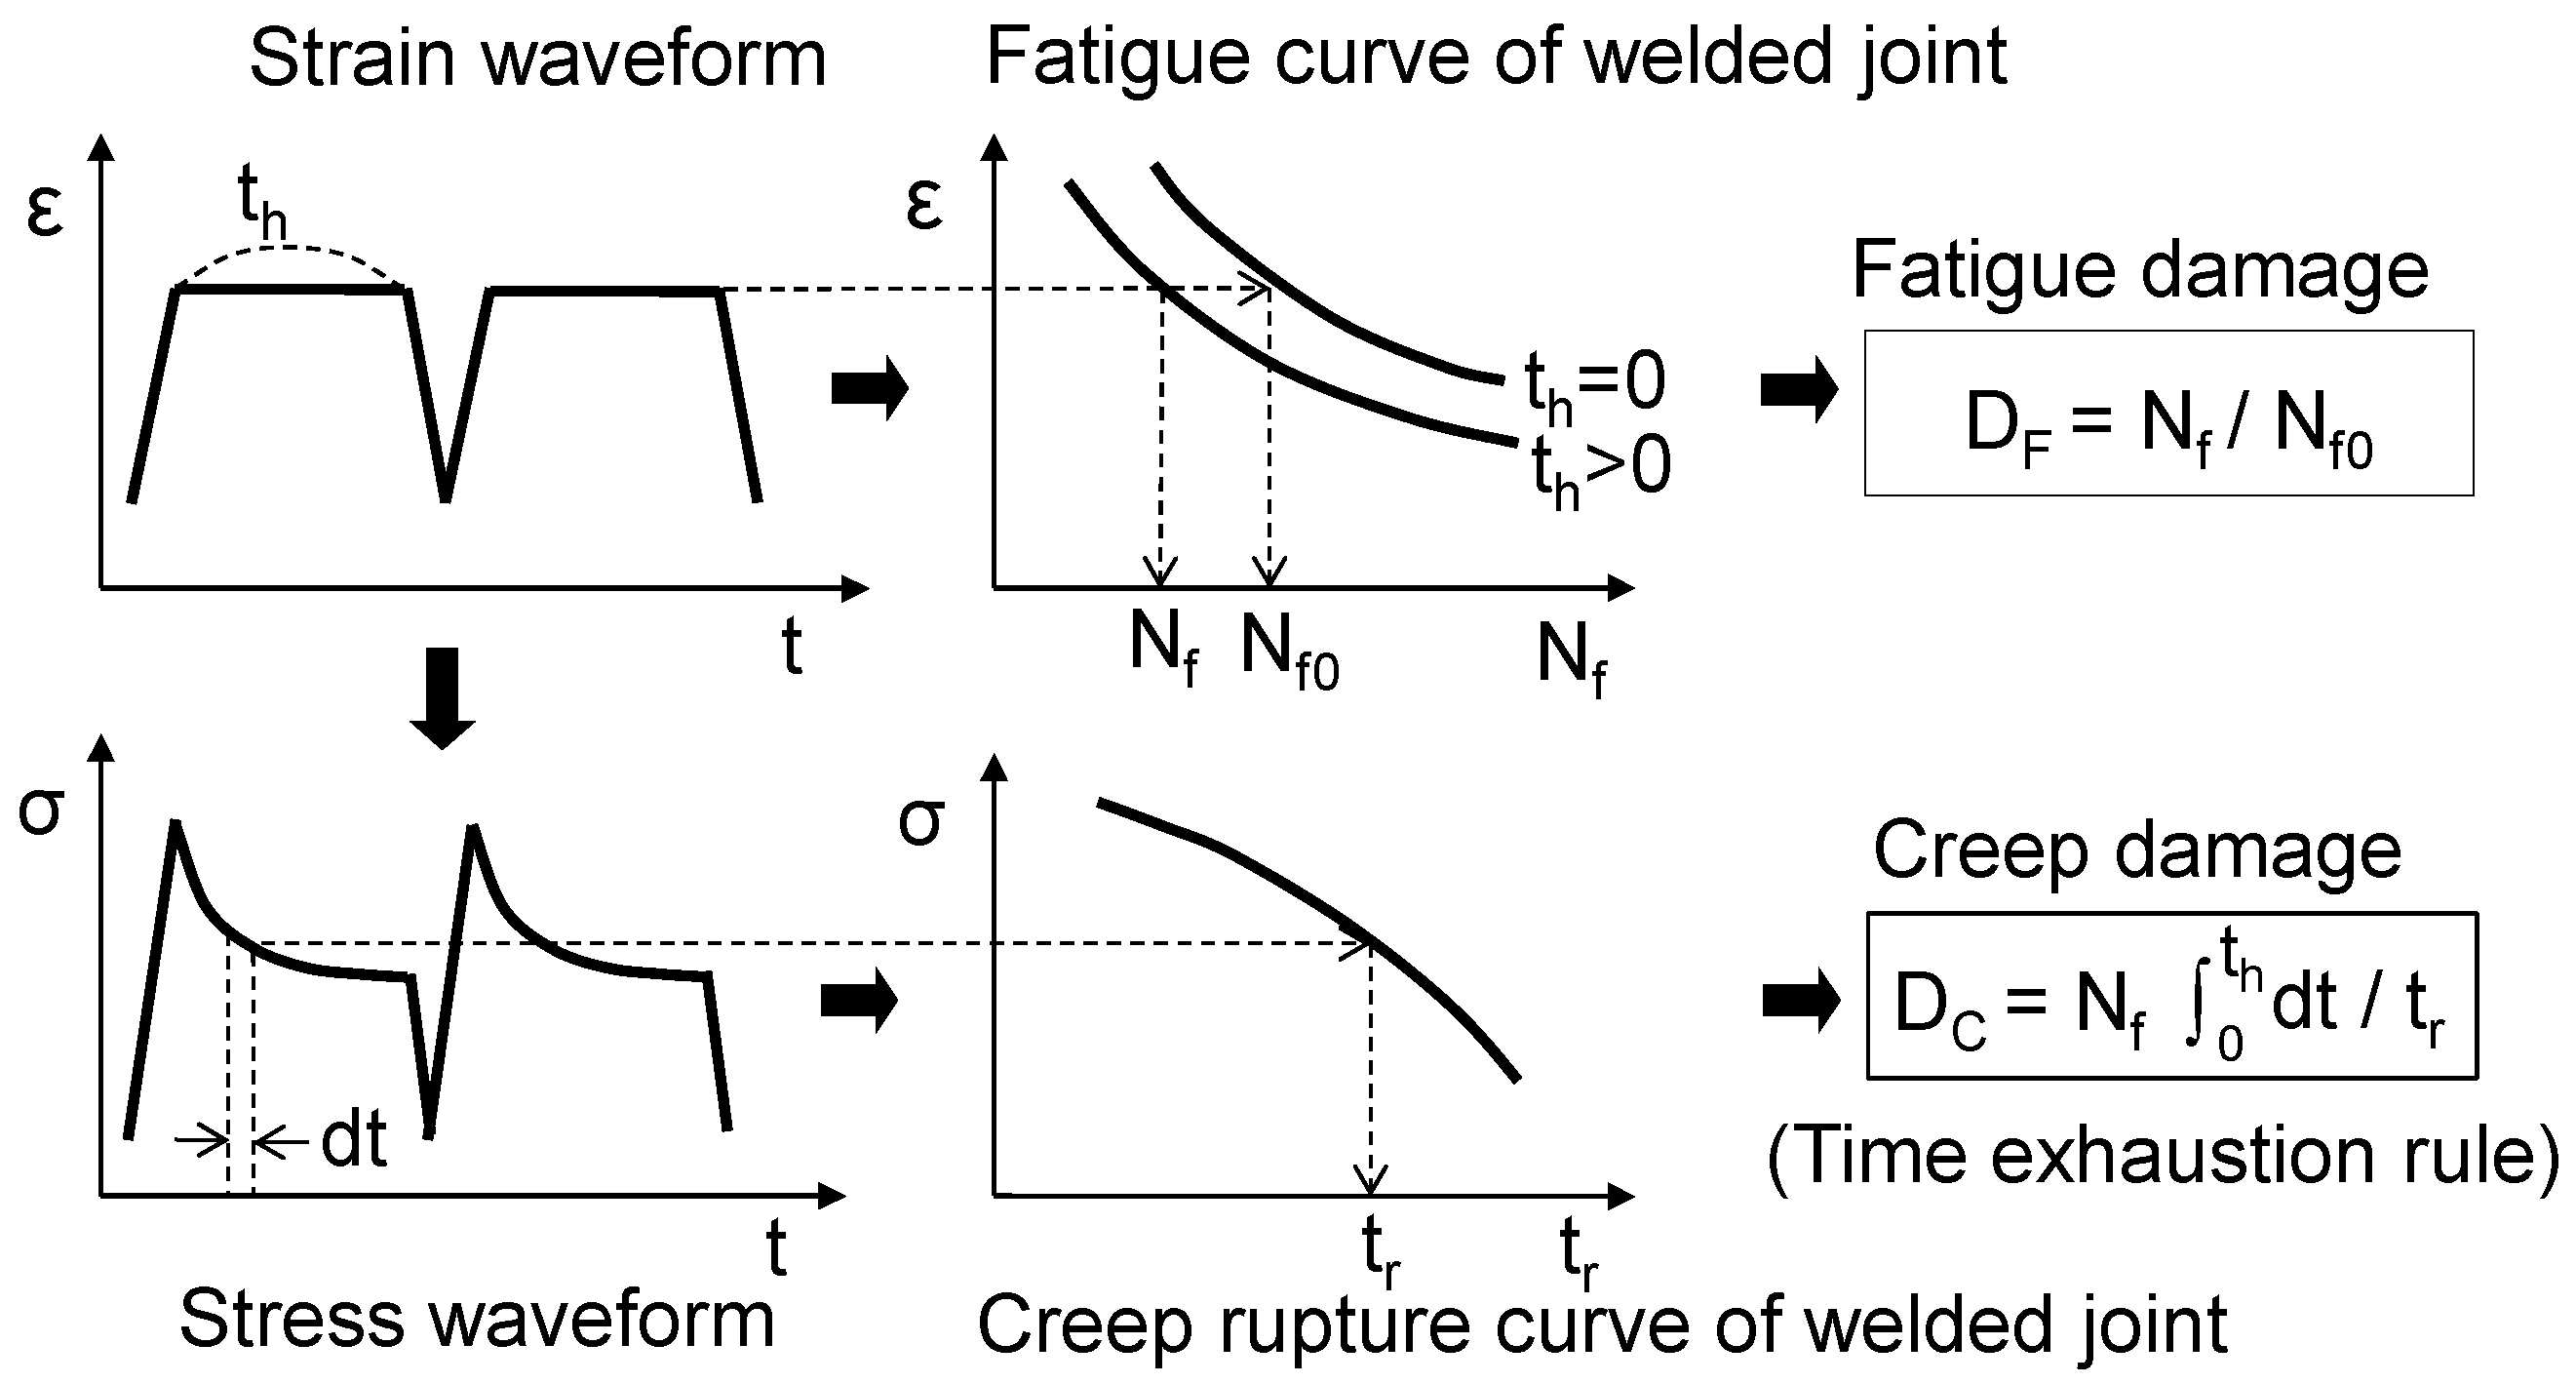
Figure 18.
Creep rupture curve for the welded joints [20].
Figure 18.
Creep rupture curve for the welded joints [20].
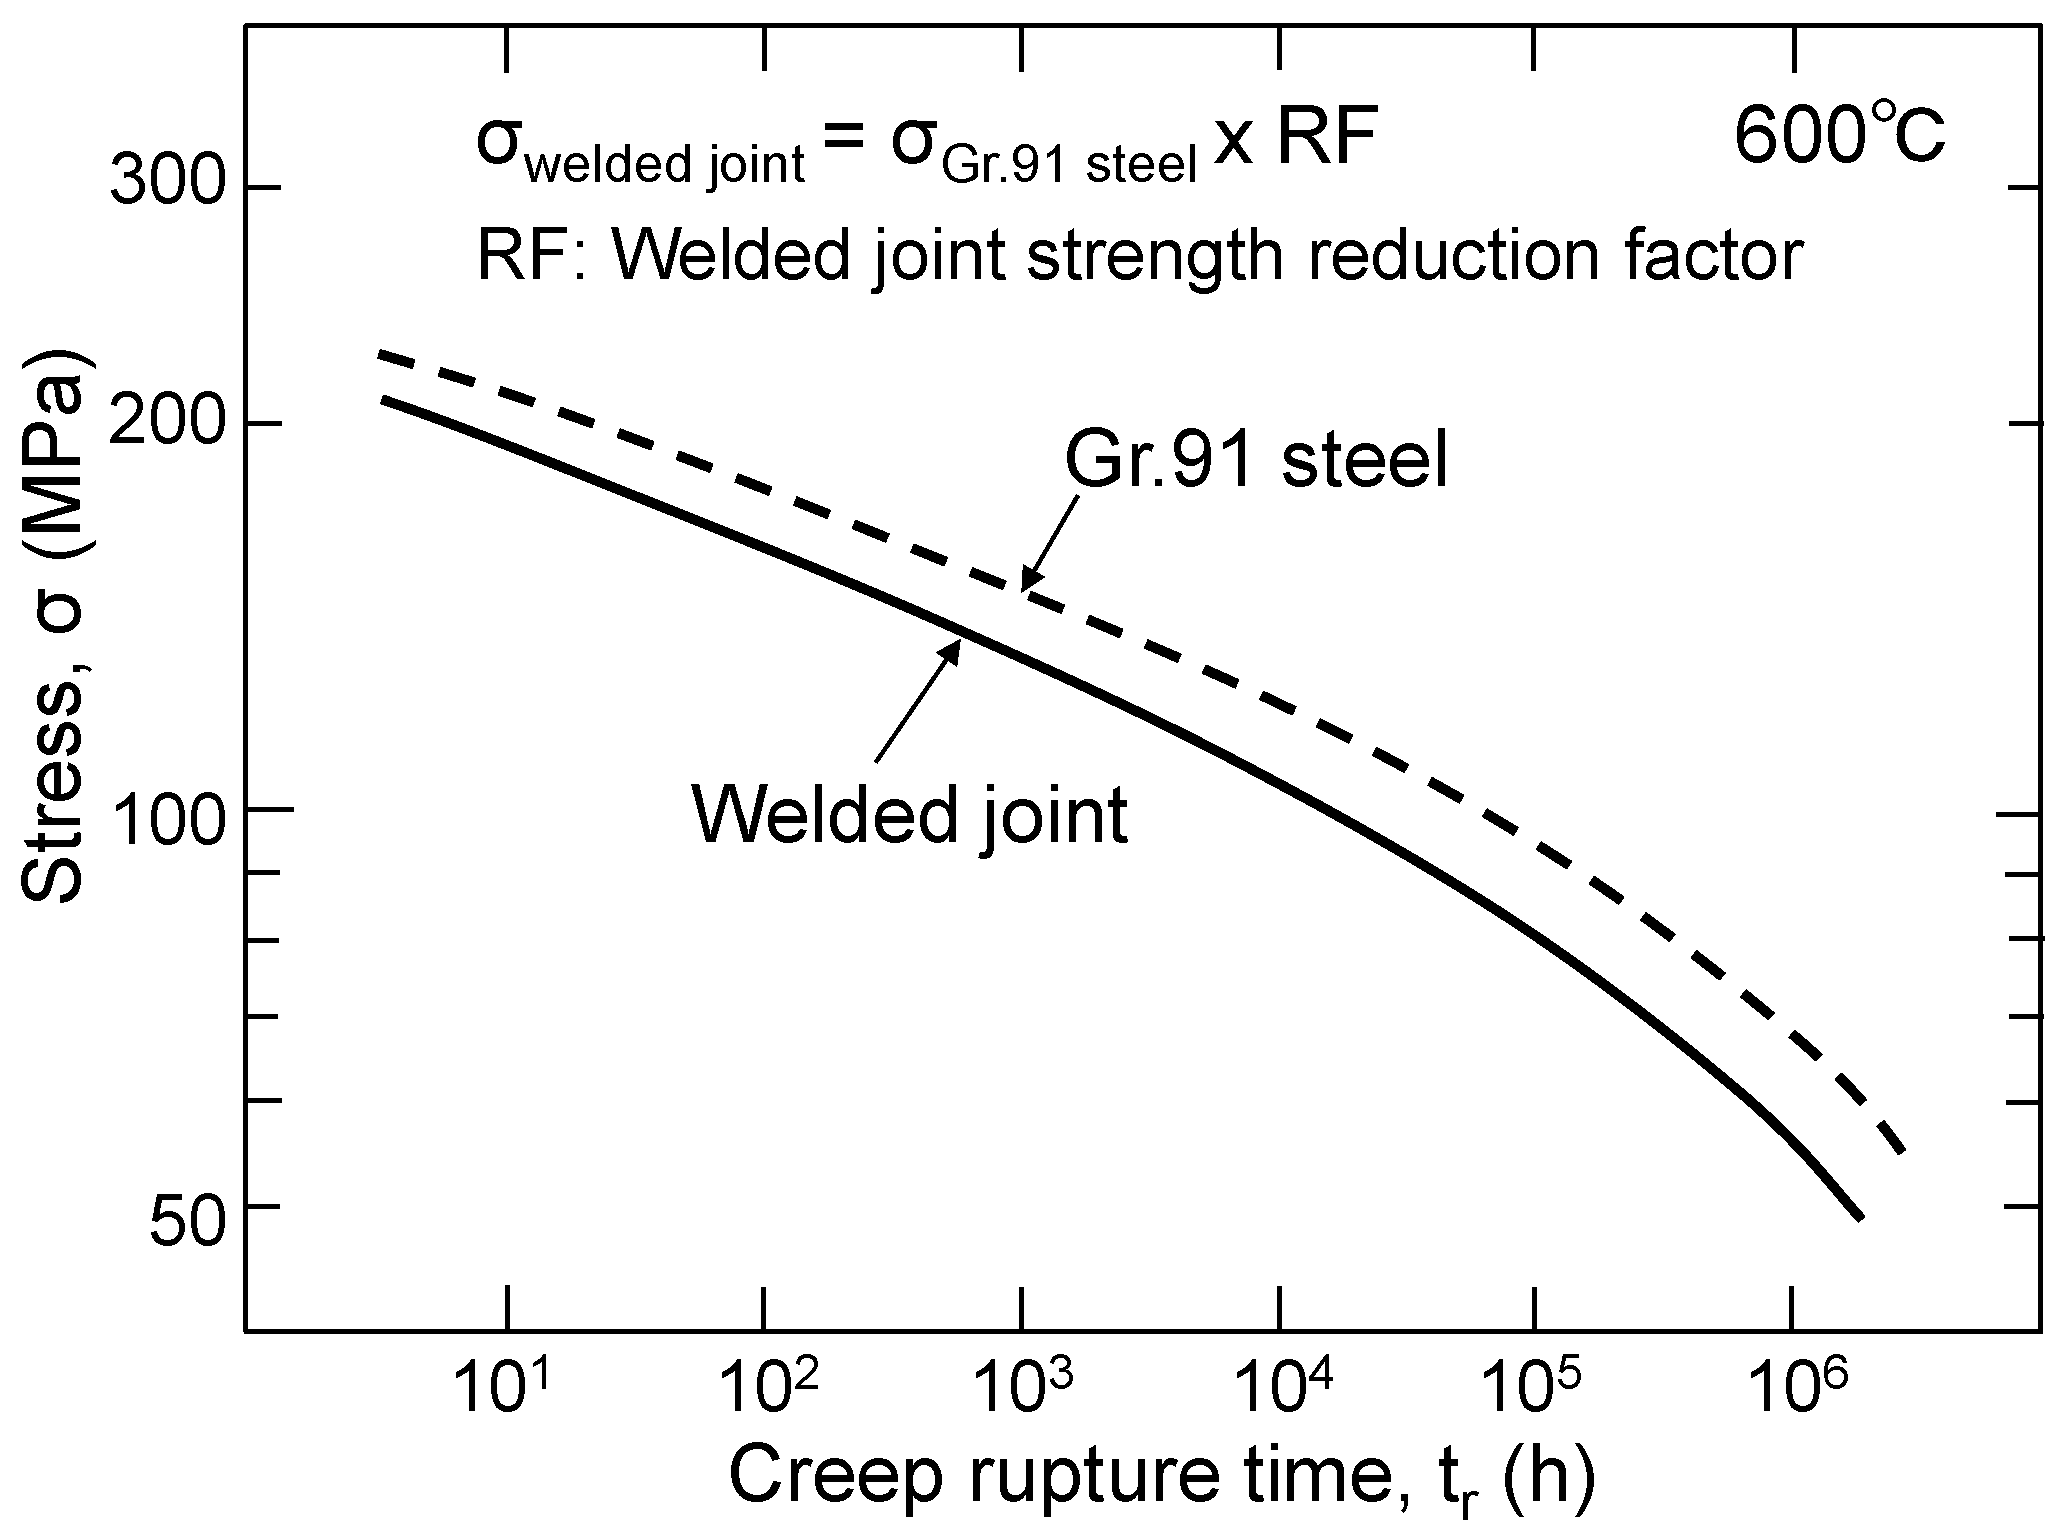
Figure 19.
Accumulated fatigue damage and creep damage until failure [20].
Figure 19.
Accumulated fatigue damage and creep damage until failure [20].
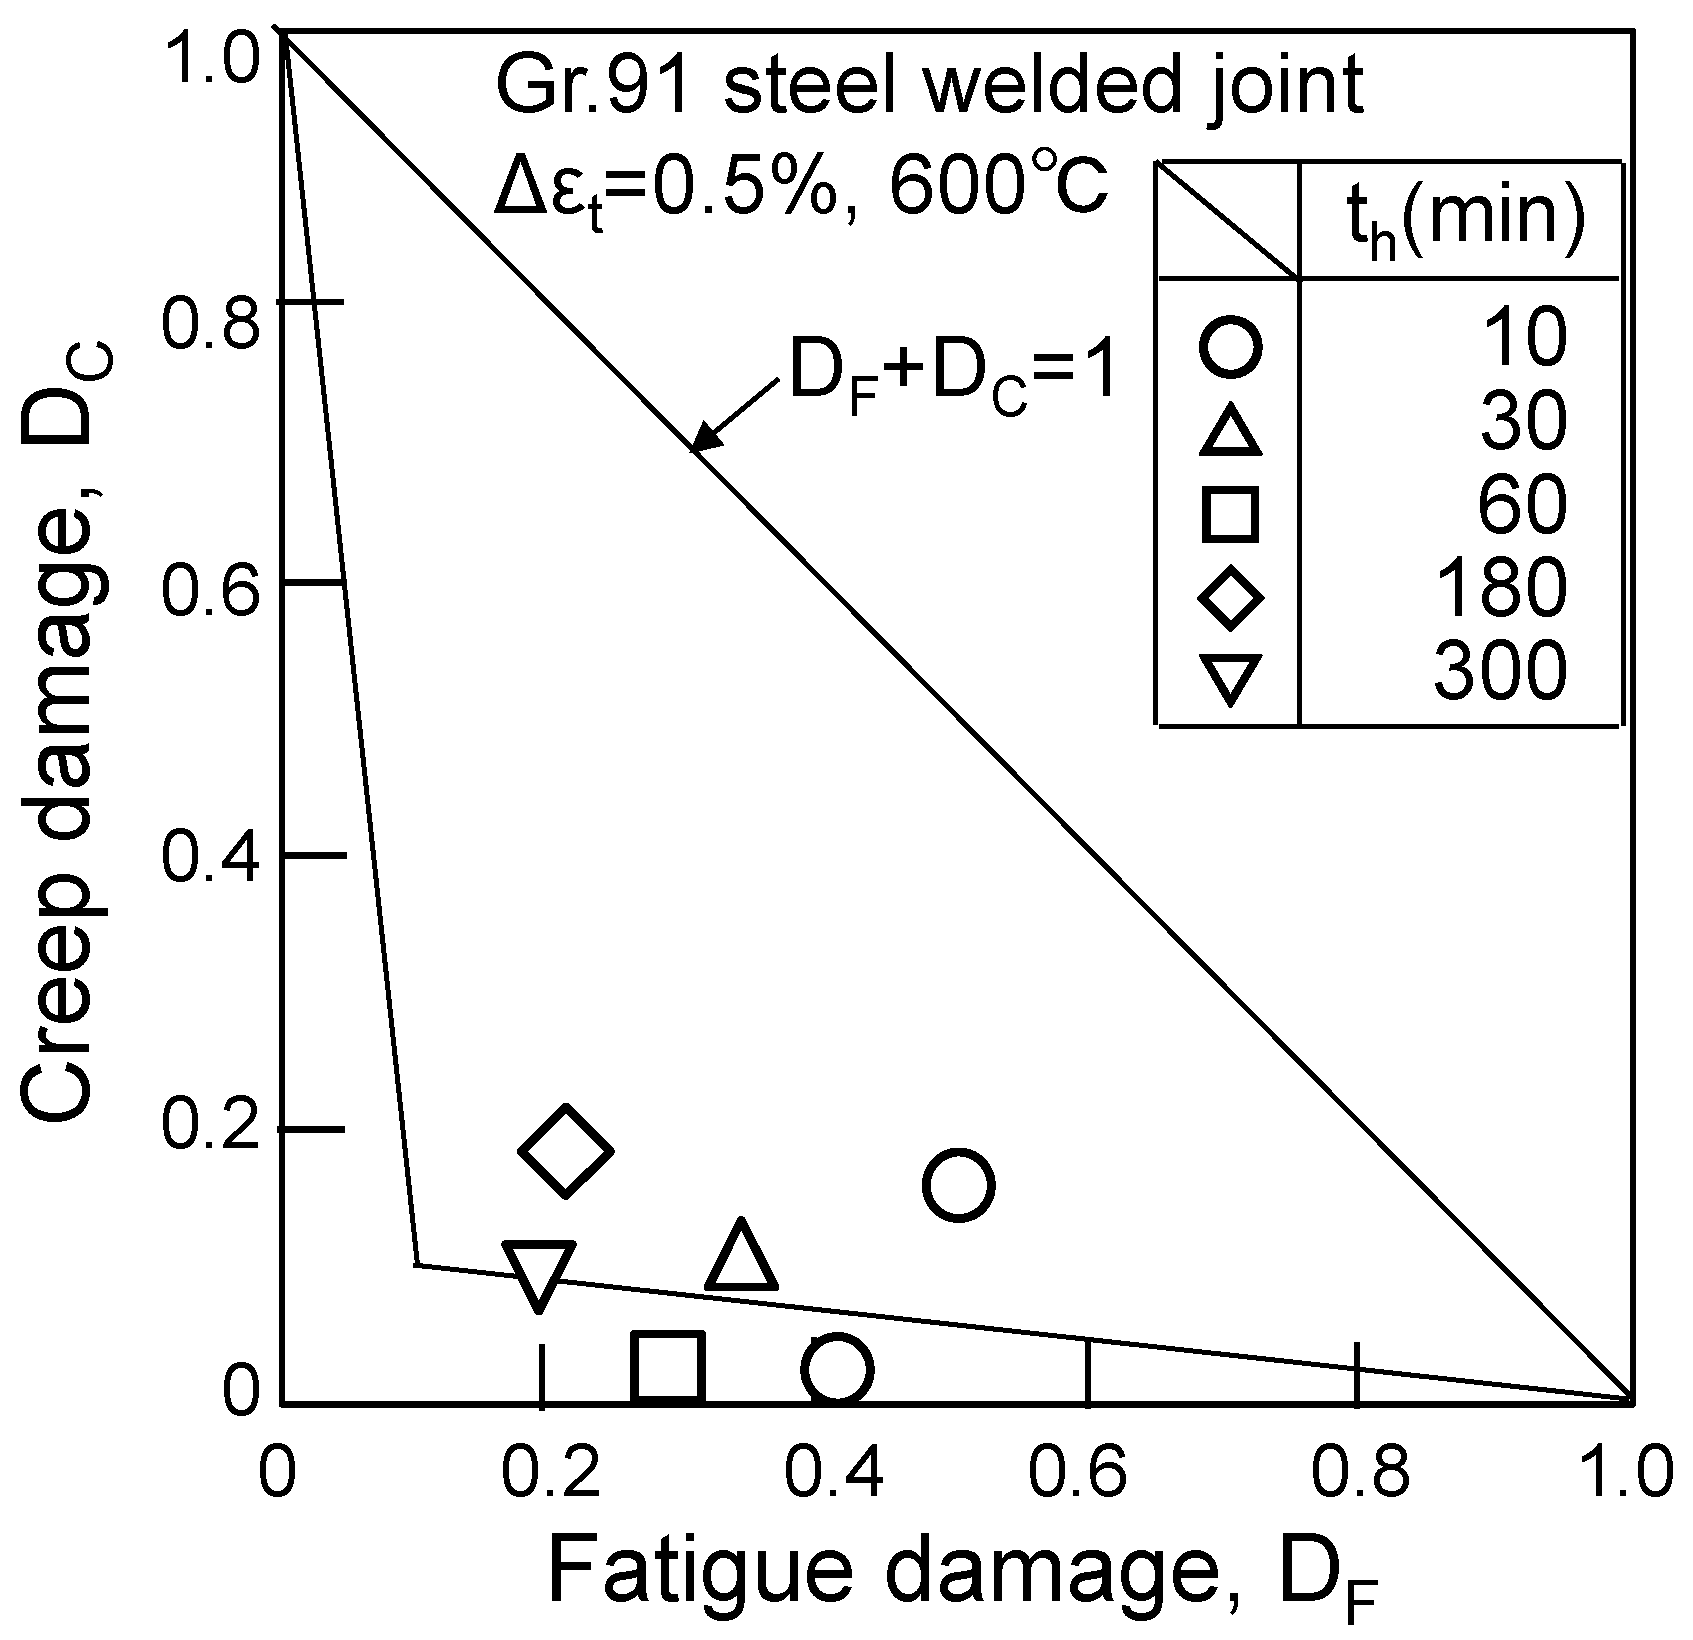
Figure 20.
Concept of elastic follow-up [22].
Figure 20.
Concept of elastic follow-up [22].
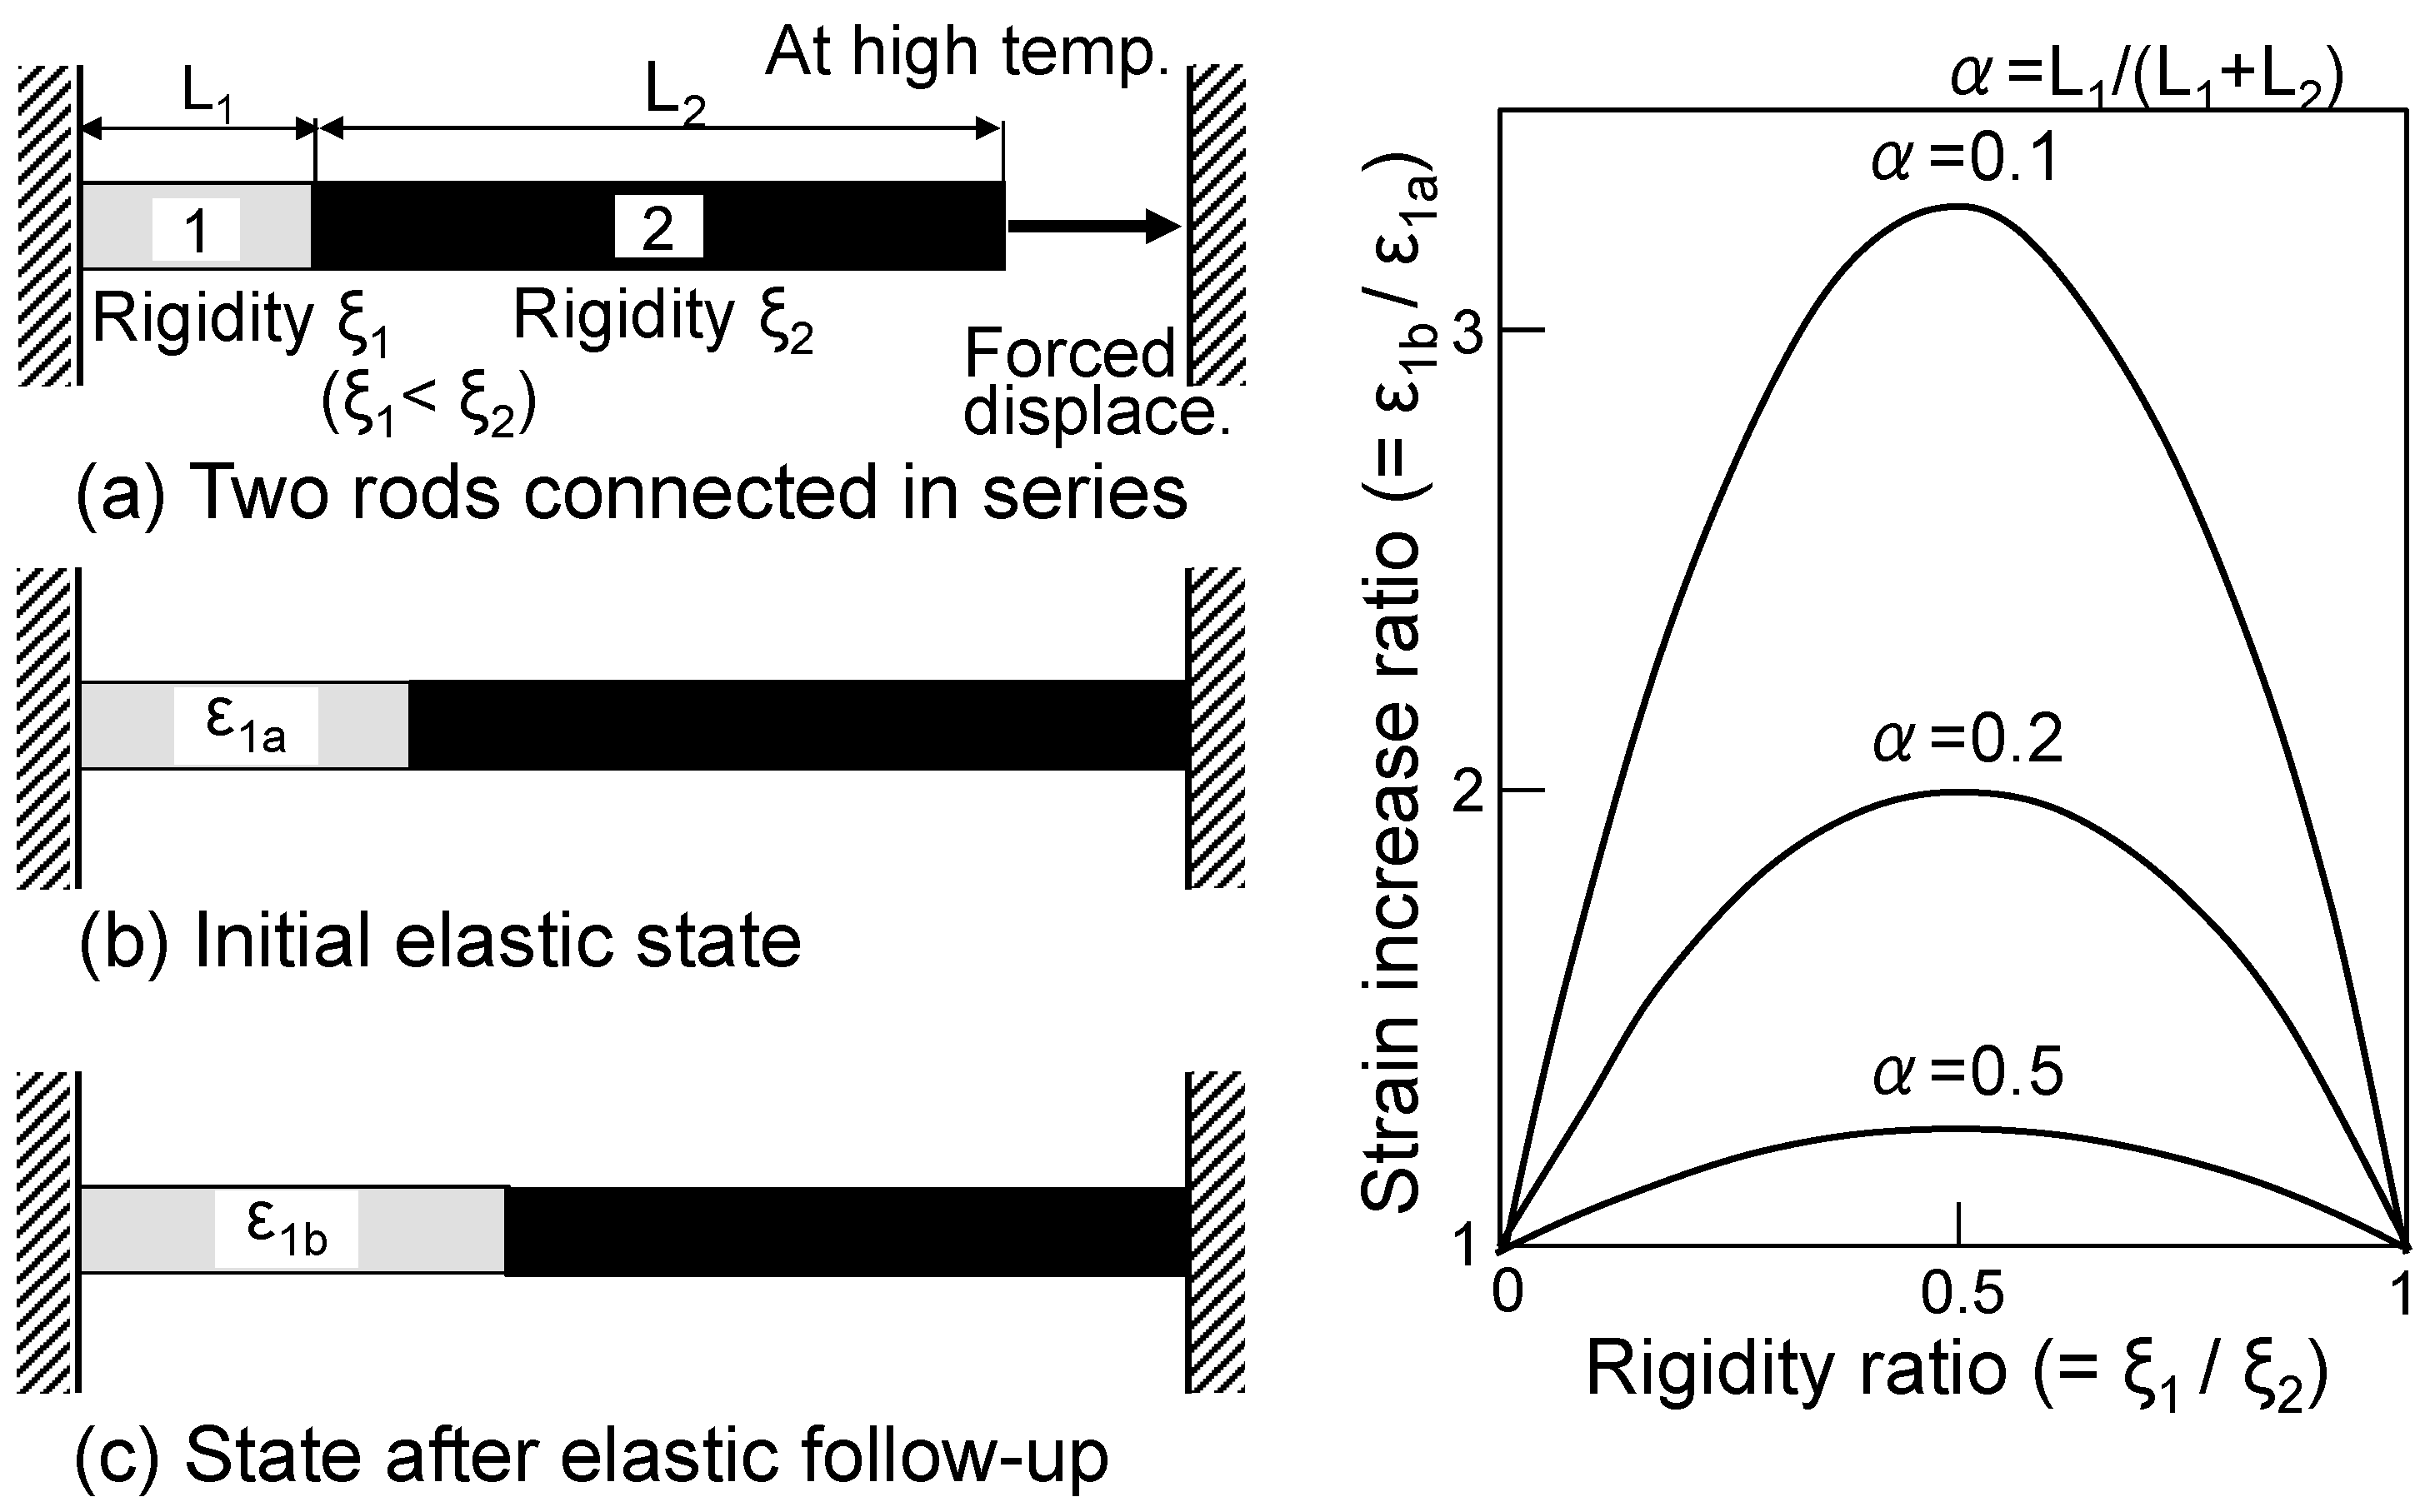
Figure 21.
Schematic diagram of the creep strain increase in the HAZ due to elastic follow-up.
Disclaimer/Publisher’s Note: The statements, opinions and data contained in all publications are solely those of the individual author(s) and contributor(s) and not of MDPI and/or the editor(s). MDPI and/or the editor(s) disclaim responsibility for any injury to people or property resulting from any ideas, methods, instructions or products referred to in the content. |
© 2023 by the author. Licensee MDPI, Basel, Switzerland. This article is an open access article distributed under the terms and conditions of the Creative Commons Attribution (CC BY) license (https://creativecommons.org/licenses/by/4.0/).
Share and Cite
MDPI and ACS Style
Nonaka, I. Creep–Fatigue Life Estimation of Gr.91 Steel and Its Welded Joints. Metals 2023, 13, 1880. https://doi.org/10.3390/met13111880
AMA Style
Nonaka I. Creep–Fatigue Life Estimation of Gr.91 Steel and Its Welded Joints. Metals. 2023; 13(11):1880. https://doi.org/10.3390/met13111880
Chicago/Turabian StyleNonaka, Isamu. 2023. "Creep–Fatigue Life Estimation of Gr.91 Steel and Its Welded Joints" Metals 13, no. 11: 1880. https://doi.org/10.3390/met13111880
Note that from the first issue of 2016, this journal uses article numbers instead of page numbers. See further details here.