Article

Effects of SMAT Temperature and Stacking Fault Energy on the Mechanical Properties and Microstructure Evolution of Cu-Al-Zn Alloys

Faculty of Materials Science and Engineering, Kunming University of Science and Technology, Kunming 650093, China
*
Author to whom correspondence should be addressed.
Metals 2023, 13(12), 1923; https://doi.org/10.3390/met13121923
Submission received: 10 October 2023 / Revised: 16 November 2023 / Accepted: 20 November 2023 / Published: 22 November 2023
(This article belongs to the Special Issue Advanced Hterogeneous Metallic Materials)

Abstract

:
Alloys with a gradient structure (GS) exhibit a superior combination of strength and ductility. However, the effects of treatment temperature and stacking fault energy on the tensile behavior and microstructure evolution of GS alloys have not been systematically investigated. In this study, GS Cu-Al-Zn alloys with different stacking fault energy (SFE, 40/7 mJ/m2) were prepared using surface mechanical attrition treatment (SMAT) at cryogenic and room temperature, respectively. The microstructure results indicate that more stacking faults and deformation twins were activated in the SFE-7 alloys at cryogenic temperature, which led to higher strength compared to that of the alloys SMAT-ed at room temperature. In addition, it was found that the yield strength and hetero-deformation-induced (HDI) stress of the SFE-7 alloy were significantly higher than those of the SFE-40 alloy, resulting in a good combination of strength and ductility. Furthermore, more dispersed strain bands were observed in the SFE-7 sample during whole tensile deformation, which contributes to higher ductility.

1. Introduction

Copper alloys have been extensively employed in the production of industrial products and engineering fields, such as aerospace, communications, etc., due to their many advantages, including strong electrical conductivity, good plastic molding, superior wear resistance, and corrosion resistance, but their low strength limits their application. However, it is commonly known that there is high strength [1,2] but limited ductility in nano-grained (NG) and ultrafine-grained (UFG) materials which are prepared via severe plastic deformation (SPD) [3,4] methods. The main reason for the limited ductility of nanostructured and UFG-structured materials is the low strain-hardening capability which is caused by the small grain size and the inability of dislocations to accumulate [5,6]. There is a growing demand in various fields for metal materials to possess a good combination of strength and ductility.
Heterostructured materials, such as heterogeneous lamella-structured materials [7], gradient-structured materials [8], harmonic-structured materials [9], etc., refer to materials that include zones of heterogeneity with a significant variation in mechanical and physical characteristics. The emergence of gradient structure (GS) materials provides a promising solution to alleviate the strength–ductility trade-off. GS materials can be obtained via processes such as SMAT [8], SMGT [10], etc. The SMAT process utilizes high-power vibration of steel balls within a closed chamber to impact the surface of the material. The specimen is usually attached to the rigid lid of the chamber, and the vibration process causes the steel balls to impact the surface of the target material. The entire surface of the material to be treated is subjected to a very high number of impacts in a short time [11]. Over the past 20 years, it has been found that a gradient nano-grained (GNG) surface layer can be introduced on a coarse-grained (CG) Cu substrate via surface mechanical grinding treatment (SMGT), and the ductility can be as high as 31% with high strength [10]. In addition, high yield strength and good ductility were found in GS AISI316L, titanium, copper, etc. [12,13,14,15,16]. Additionally, stacking fault energy (SFE) is a primary factor that affects the mechanical properties of materials [17,18,19]. Precisely, decreasing SFE can change the deformation mode from dislocation slide to plane slip, stacking faults, and twinning. For example, deformation twins and stacking faults in lower SFE samples increased the strain-hardening capability, which produced a good combination of strength and ductility [20,21,22]. Temperature is also a primary factor that affects the mechanical properties of materials [23,24,25]. It has been reported that dislocation slip is the main deformation mode when copper is severely deformed at room temperature [26,27]. However, the deformation of SMAT at cryogenic temperatures reduces dynamic recovery and recrystallization, and the deformation mechanism of grain refinement changes from dislocation to twin [28], which promotes the formation of twins. Therefore, a higher density of twins can be obtained through processing at cryogenic temperatures. SFE and SMAT processing temperatures are two important influences on mechanical properties. However, there are few studies on the effects of different SMAT processing temperatures on the mechanical properties of different SFE materials.
This work aims to investigate the microstructural evolution and mechanical properties of SFE-40/7 Cu-Al-Zn alloys at cryogenic and room temperatures during SMAT. The mechanical properties are obtained via load–unload–reload (LUR) and tensile tests. In addition, deformation behaviors were analyzed using digital image correlation (DIC). Microstructural features were observed and discussed using electron backscatter diffraction (EBSD), transmission electron microscopy (TEM), and scanning electron microscopy (SEM).

2. Experimental Method

Commercial copper (purity ≥ 99.9 wt%), Al (purity ≥ 99.8 wt%), and Zn (purity ≥ 99.9 wt%) were used in this paper. Cu-1.08 wt% Al-2.6 wt% Zn and Cu-5.5 wt% Al-4.5 wt% Zn (the SFEs of Cu-1.08 wt%Al-2.6 wt% Zn and Cu-5.5 wt% Al-4.5 wt% Zn were 40 and 7 mJ/m2 [29], respectively) alloys were prepared using a vacuum induction melting furnace. The obtained alloy ingot with a size of 40 × 10 × 4 cm3 was treated at 900 °C for 5 h, and then the surface defects were removed. Before hot rolling, the samples were heated at 800 °C for 30 min. Then, the alloy ingot was cold-rolled at room temperature after hot rolling. The rolled sheet was divided into 100 × 80 × 4 mm3 sheets using an EDM wire-cutting CNC machine. The annealing temperature was set according to the theoretical recrystallization temperature formula:
TR = nTm
where Tm is the absolute melting temperature and TR is the recrystallization temperature. For some commercial alloys, the recrystallization temperature may run as high as 0.7 Tm. The Tm for commercial copper was found to be 1087 °C, so according to the formula, the annealing temperature was chosen to be 700 °C. Then, the samples were annealed at 700 °C for 2 h using a vacuum induction melting furnace to obtain a homogeneous CG structure.
The annealed samples were processed using SMAT on both sides for 8 min at room temperature (RT) and liquid nitrogen temperature (LNT), respectively. The SMAT has been described in detail previously [11,30]. A total of 208 stainless steel balls with a diameter of 8 mm were placed inside the chamber and the vibration frequency was 50 Hz. Table 1 provides a detailed description of the abbreviations for the two different SFE samples.
A universal testing machine SHIMADZU AG-X with a maximum load of 100 KN was used to conduct the tensile tests. The tensile samples with a dog-bone shape and a gauge length of 18 mm, a width of 5 mm, and a thickness of 4 mm were tested at room temperature with a quasi-static strain rate of 5.0 × 10⁻⁴ s−1. The speed of the tensile strain rate was 0.45 mm/min. The tensile tests were repeated at least three times for each sample to ensure the reliability of the tensile results. The loading–unloading–reloading (LUR) tests were carried out at an unloading speed of 1000 N/min to 20 N and a loading speed of 0.375 mm/min. The strains of 1%, 3%, 5%, 7%, 9%, 11%, 13%, 15%, 17%, and 19% were chosen to conduct the LUR tests. Three samples were tested in each condition to ensure the reliability of the experimental results. The Vickers hardness test was carried out using a SHIMADAZU HMV-G, with a load of 0.245 N for 15 s, measured from the sample surface to the core with an interval of 50 μm between the indentations. The hardness value at each depth was the average of 8 measurements. Samples for EBSD observation were first prepared using a sandpaper and polishing machine following the metallographic sample preparation procedure, and then surface stresses created via mechanical polishing were eliminated via electrolytic polishing. The orientation and boundary misorientation of SMAT samples were acquired using a field emission scanning electron microscope (FE-SEM, NOVA SEM 450) equipped with an EBSD detector. HKL Channel 5 software (Version:5.0.9.0) was used to analyze the EBSD data. TEM samples were prepared via twin-jet polishing. The samples were initially thinned to 500 μm with sandpaper and then were further thinned to about 100 μm using an electrolytic twin-jet polishing method. The electrolyte was a mixture of 25% phosphoric acid, 25% ethanol, and 50% distilled water. The voltage was 11 V and the flow rate was 32 during room temperature polishing. The TEM images were observed using a JEM-2100Pluse with an accelerating voltage of 200 kV. The strain distribution and evolution on the surface of specimens during the tension strain process were captured using a DIC technique with a short-focus optical lens. A random speckle pattern was prepared on the SMATed surface by spraying black paints on a white background before performing DIC imaging. DIC imaging was analyzed using GOM Correlate software (Version:2018.0.7.55202). Observations of the fracture characterization were made possible using a VEGA3 TESCAN scanning electron microscope (SEM) at an acceleration voltage of 30 kV.

3. Results and Discussion

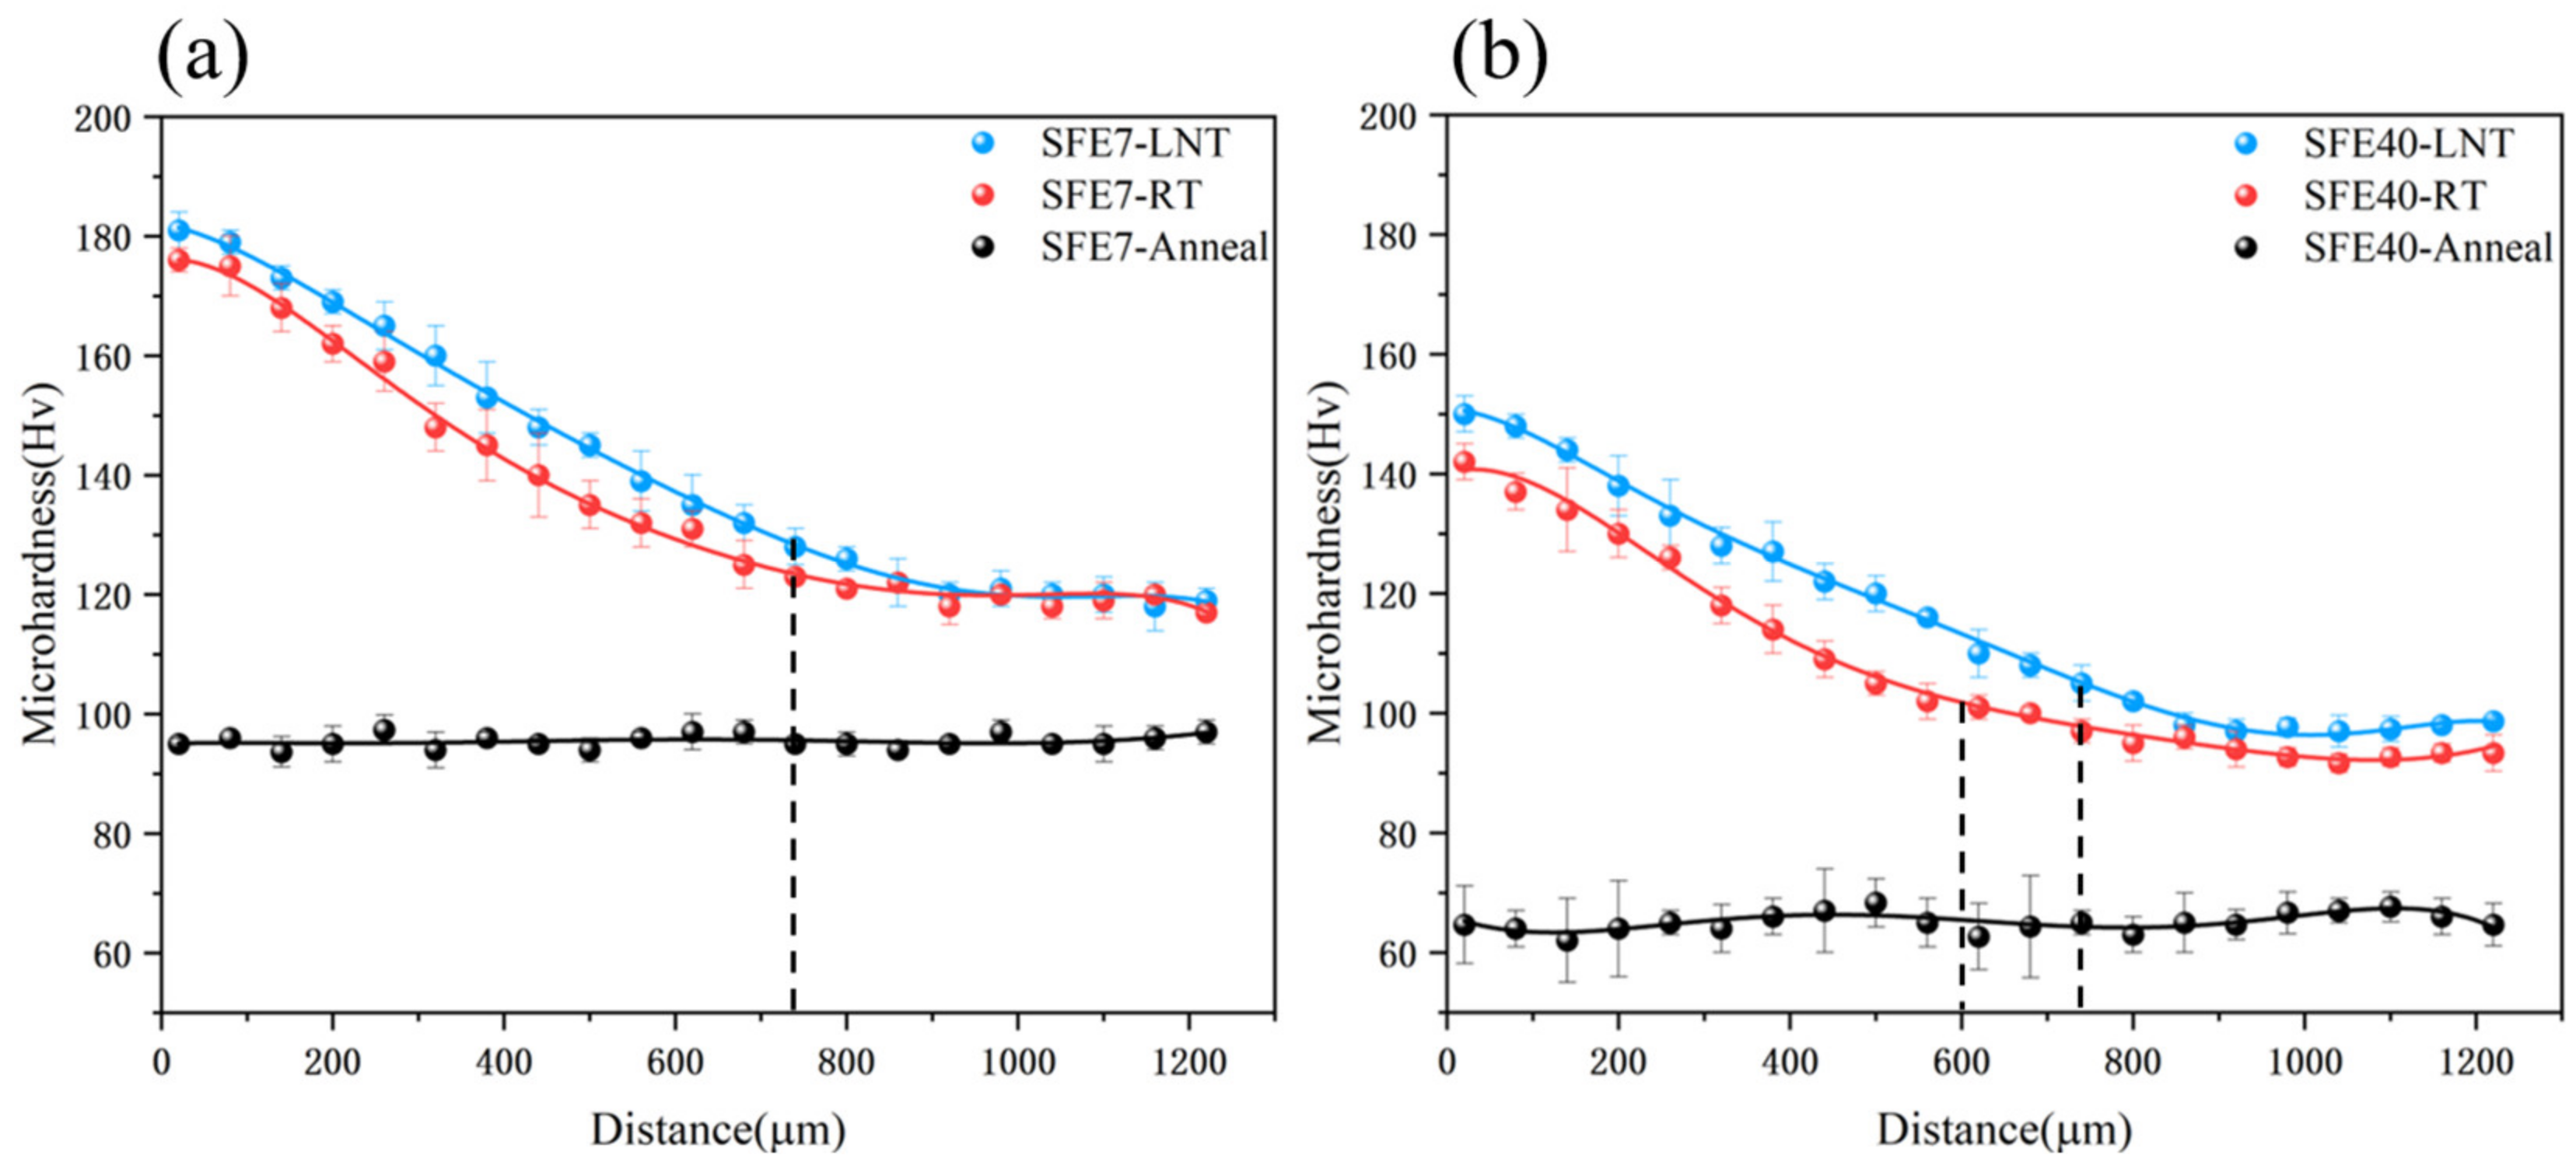
3.1. Microhardness Results

Figure 1a,b shows the variation in the microhardness for the two different SFEs according to depth. As can be seen from Figure 1, the surface hardness of the SMAT-ed samples was significantly increased, and the hardness gradually decreased from the SMAT surface to the core of the samples, indicating that a hardness gradient was formed from the surface to the center. The surface hardness of the SFE-7 sample subjected to SMAT at cryogenic temperature was 181 Hv, while the sample subjected to SMAT at room temperature had a surface hardness of 176 Hv. The surface hardness of the SFE-40 sample subjected to SMAT at cryogenic temperature was 151 Hv, while the sample subjected to SMAT at room temperature had a surface hardness of 142 Hv. In addition, the gradient thickness of the SFE-7 sample was 720 μm, while the SFE-40-LNT and SFE-40-RT samples had gradient layer thicknesses of 720 μm and 600 μm, respectively.
It can be seen that there is a large difference between the thickness of the GS layer of SFE-40 treated at room temperature and liquid nitrogen temperature, and the yield strength of SFE-40-LNT is higher than that of SFE-40-RT due to its thicker GS layer. In contrast, the GS layer thicknesses of SFE-7-RT and SFE-7-LNT are almost equal, indicating that the SMAT temperature has little effect on the thickness of the SFE-7 GS layer.
The SFE-40 sample is a high-level SFE material, and the main deformation mechanism is dislocation during SMAT. When SMATed at room temperature, the sample is warmed up due to mechanical work, and the dislocation recovery occurs when the temperature rises [31]. In the case of SMAT at cryogenic temperature, the samples will not be heated up due to the cryogenic processing temperature, and so the dislocation recovery will not occur. At the same time, the cryogenic temperature also inhibits the dislocation recovery, and the dislocations are accumulated and piled up. Therefore, the SMAT temperature has a great influence on the thickness of the GS layer of SFE-40. While SFE-7 is a low SFE material, the main deformation mechanisms are twinning and stacking faults [32], and the effect of temperature on twins and stacking faults is not significant compared to dislocations. Therefore, there is little effect of SMAT temperature on the thickness of the SFE-7 GS layer.

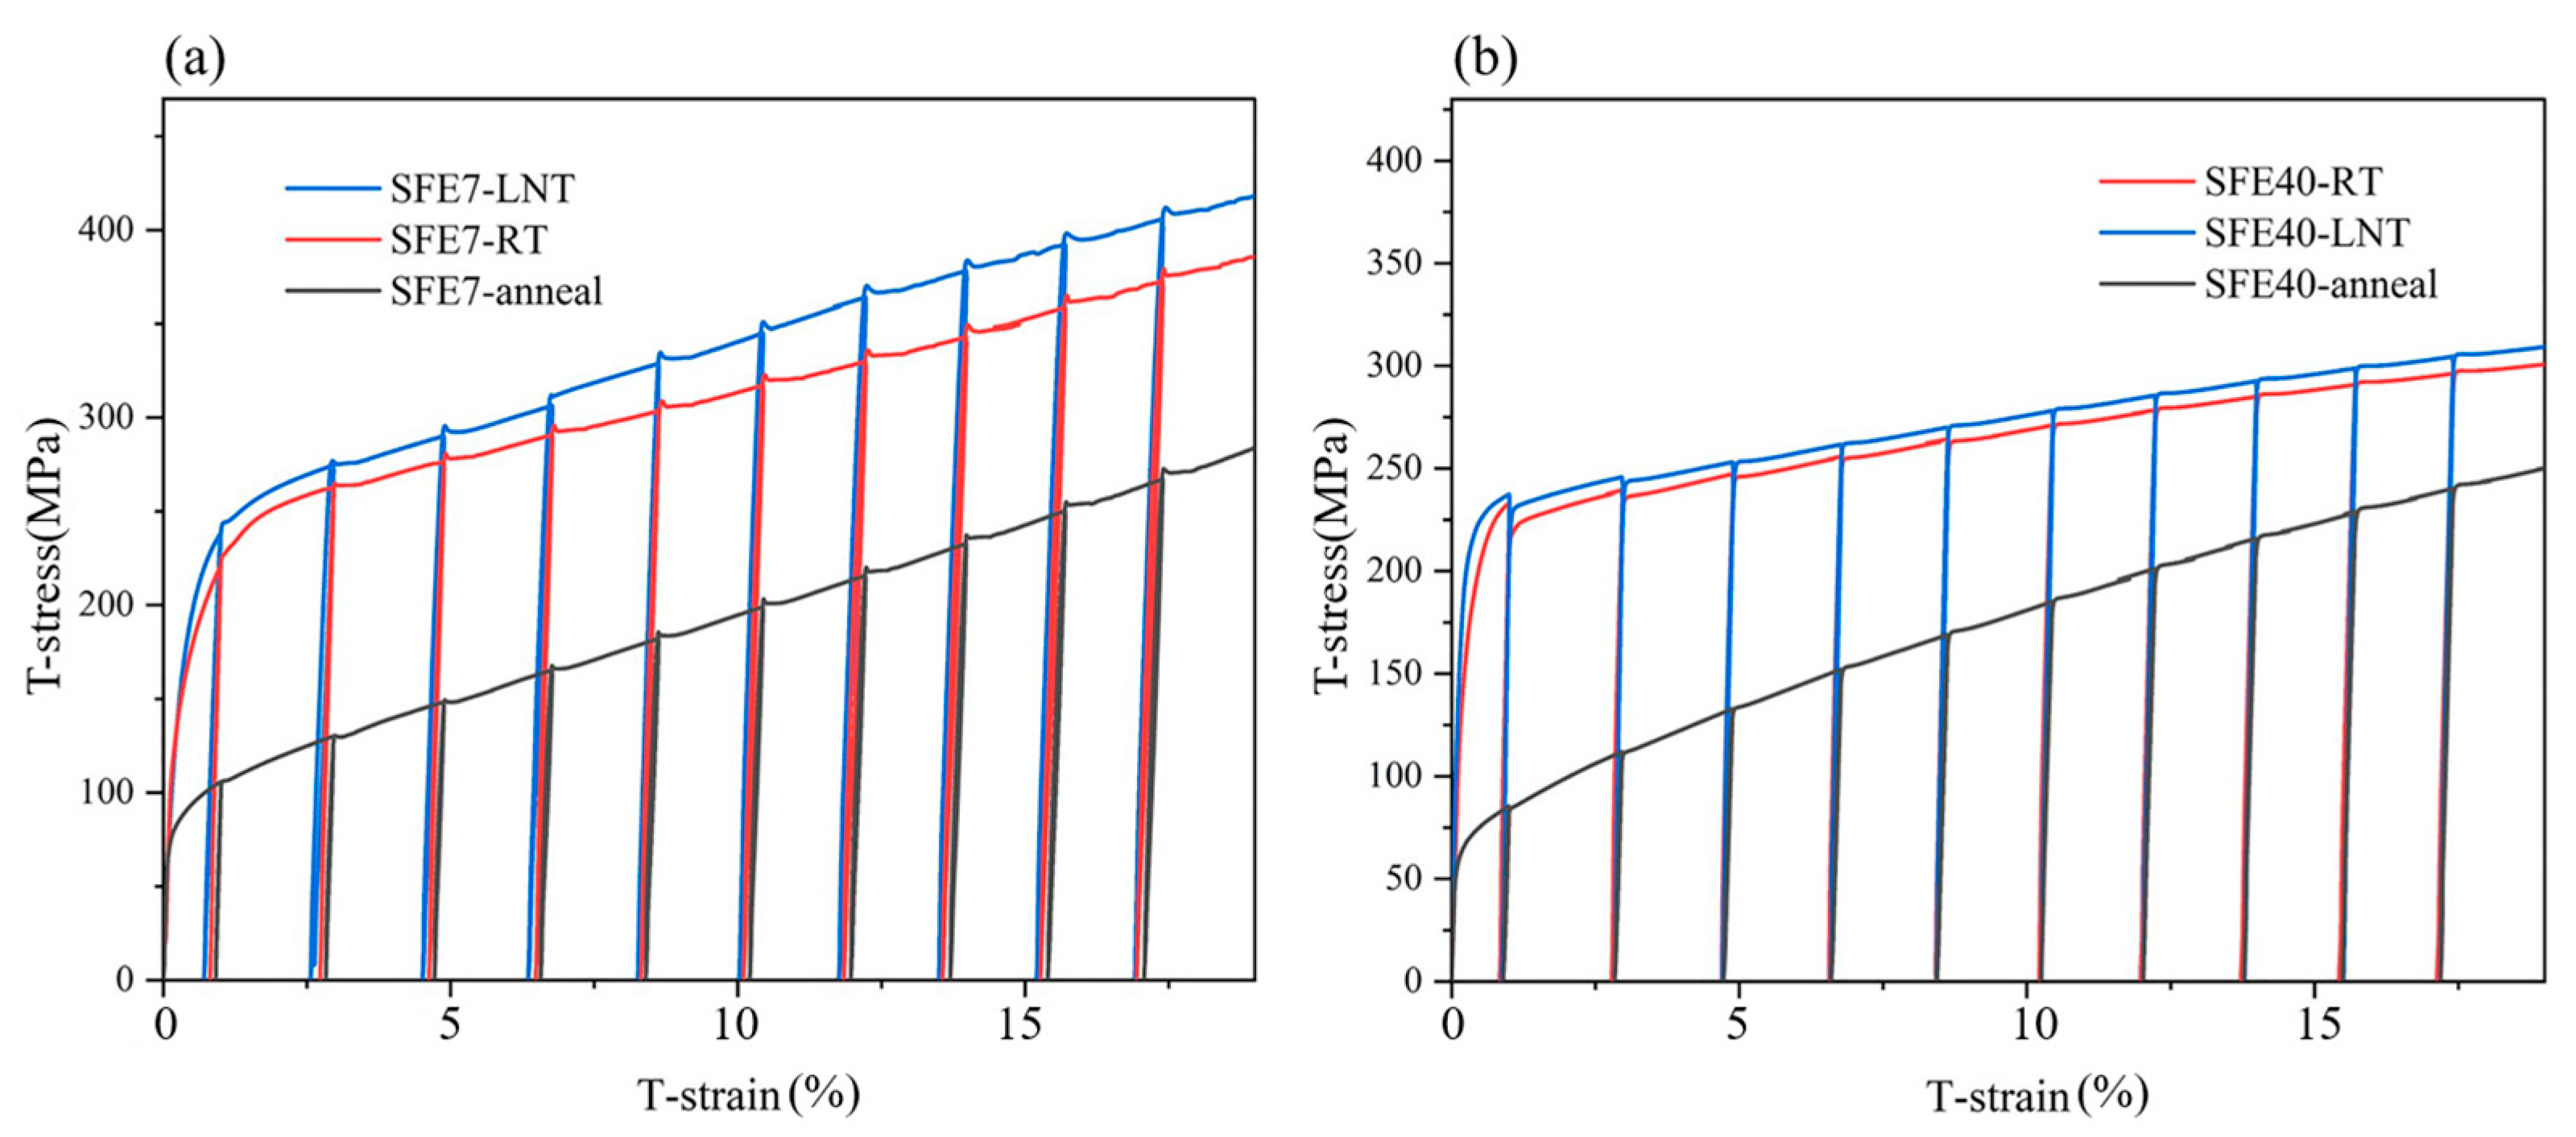
3.2. Mechanical Behaviors

Figure 2 shows the engineering stress–strain and strain-hardening capability curves for the annealed samples and samples at different SMAT temperatures (RT and LNT) with different SFEs (SFE, 40/7 mJ/m2). The yield strength (YS) of the SFE-7-Annealed sample and the SFE-40-Annealed sample were 92 MPa and 60 MPa, respectively. It can be inferred that SFE-40 alloys are more easily deformed than SFE-7 alloys during SMAT, which corresponds to the hardness of the SFE-7-Annealed and SFE-40-Annealed samples in Figure 1. When the SMAT temperature was changed from RT to LNT, the YS and ultimate tensile strength (UTS) of both SFE-7-LNT and SFE-40-LNT increased, and the increase was particularly significant for SFE-7-LNT compared to SFE-7-RT. Subsequent EBSD analyses also showed more intense surface deformation and grain refinement for SMAT at LNT temperatures. The results show that the strength of the alloy is increased by lowering the SFE or temperature during SMAT, while the uniform elongation (UE) is slightly reduced. Figure 2 demonstrates that the UE of SFE-40 is lower than that of SFE-7. Table 2 shows the specific values of YS, UTS, and UE for SFE-7 and SFE-40 under LNT and RT conditions, respectively.
The intersection point of the true stress and strain-hardening capacity curves represents the beginning of necking, as shown in Figure 2b,d. The true stress–strain curve was calculated from the measured engineering stress–strain curve using the following equations:
ε T = ln ( ε e + 1 ) σ T = σ e ( ε e + 1 )
where εT and σT are the true strain and stress and εe and σe are the engineering strain and stress. SFE has a significant effect on the trend of the strain-hardening capacity curves of Cu-Al-Zn alloys, and the strain-hardening capacity of SFE-7-RT and SFE-7-LNT tends to increase between ε = 6% and ε = 14%. On the contrary, the strain-hardening capacity of SFE-40 decreases with increasing strain. The strain-hardening capacity of high SFE materials decreases with increasing strain [32]. It should be noted that alloys with a lower SFE generally show a better balance between strength and ductility [33]. The rising trend observed in SFE-7-LNT and SFE-7-RT (ε = 6%) can be explained by the formation of structures such as stacking faults and deformation twins during the SMAT [34,35]. It can be obtained that SFE-7-LNT exhibits excellent performance in terms of strength–ductility combination, with YS up to 278 MPa and UE down to 51%. Compared with the SFE-7 and SFE-40 samples [34], the increase in strain hardening with decreasing SFE is the main reason for the increase in UE. The main reason for the enhancement of the strain-hardening capacity curve of SFE-7 is that the twinning promotes the accumulation of dislocations and inhibits the annihilation of dislocations [26,36].
In conclusion, there are two main reasons for the difference in mechanical properties: one is the effect of different temperatures during SMAT and the other is the effect of different SFEs. The cryogenic temperature inhibits the recovery of dislocations, and so it is beneficial for high strain hardening. It is easier to obtain a better balance between strength and ductility with a lower SFE. The HDI effect also enhances the strain-hardening capacity, as evidenced via LUR experiments on SFE-7 and SFE-40 samples.
Figure 3a,b display the LUR results for the SFE-7 and SFE-40 samples, respectively. It can be seen that the HDI stress of the SFE-7-LNT sample greatly exceeds that of the SFE-7-RT sample. The ratio of HDI stress to flow stress (Figure 4b) also shows the same phenomenon, that is, the degree of mechanical incompatibility varies with increasing strain. However, the HDI stresses for SFE-40-RT and SFE-40-LNT are comparable, and the ratio of HDI stress to flow stress shown in Figure 4d is not significantly different.
GS materials exhibit significant HDI strengthening and HDI strain hardening due to their heterogeneous structure [37,38]. The heterogeneous structure consists of a GS layer and a CG layer, and the order of plastic deformation of the GS layer and the CG layer does not match. The CG layer deforms first during the elastic–plastic stage, while the GS layer remains in the elastic stage. It has been found that the ductility of GS copper is mainly related to the CG core and is limited by the surface NG layer [10,39], which leads to dislocation pile-up on the boundary between GS and CG [7,40]. In addition, high HDI stresses make it easier to activate slip systems in the NG and CG domains [41]. This process promotes dislocation nucleation and entanglement, leading to a rapid increase in stress at high strains, thus maintaining a high strain-hardening capacity.
The geometrically necessary dislocation (GND) density of SFE-7 and SFE-40 were calculated in subsequent EBSD analyses. Therefore, GND induces HDI strengthening, which increases strain hardening and contributes to maintaining ductility [38]. To quantify the HDI stress of the SFE-7 and SFE-40 samples after SMAT, LUR tests were performed on the SMATed and annealed samples (Figure 3a,b). Details of the estimation of HDI stresses and flow stresses are given in the literature [42].
It is worth noting that in Figure 3, the LUR hysteresis loop is more pronounced for the SFE-7 sample than for the SFE-40, which suggests that the Bauschinger effect is stronger for the SFE-7 sample. Figure 4 shows the results of HDI stress calculations and HDI/flow stress ratios for the SFE-7 and SFE-40 samples. It can be seen that the HDI/flow stress of the SFE-7-LNT sample increases rapidly to a maximum value after the true strain reaches 3% and then increases slowly (Figure 4b). Maintaining a high HDI/flow stress ratio contributes to the strain-hardening capability (Figure 2b). The variation trend of the HDI/flow stress ratio is similar for SFE-7-RT. In contrast, the HDI stress of the SFE-40-RT and SFE-40-LNT samples increases slowly when true strain is increasing. In addition, the HDI/flow stress ratio of the SFE-7-LNT samples is significantly higher than that of the SFE-7-RT samples, suggesting significant HDI strengthening and hardening during the early stages of deformation of the SFE-7-LNT samples.
The accumulation of twins and dislocations plays an important role in improving the ductility of the SFE-7 samples. The lower SFE of the SFE-7 samples affects their mechanical behavior in several ways. Firstly, the lower SFE makes it easier for perfect dislocations to split into two parts with a wider stacking fault zone between them. This makes perfect dislocations more likely to be hindered during planar slip [20]. Secondly, the lower SFE usually results in higher strain hardening due to the accumulation of dislocations and the hindered recovery of dislocations. Lower SFE is more susceptible to the formation of deformation twins. The twins, acting as dislocation barriers, also contribute to the strength of the alloy.
To further investigate the deformation behavior of GS samples with different SFEs, the deformed microstructures of SFE-7 and SFE-40 were observed using EBSD.

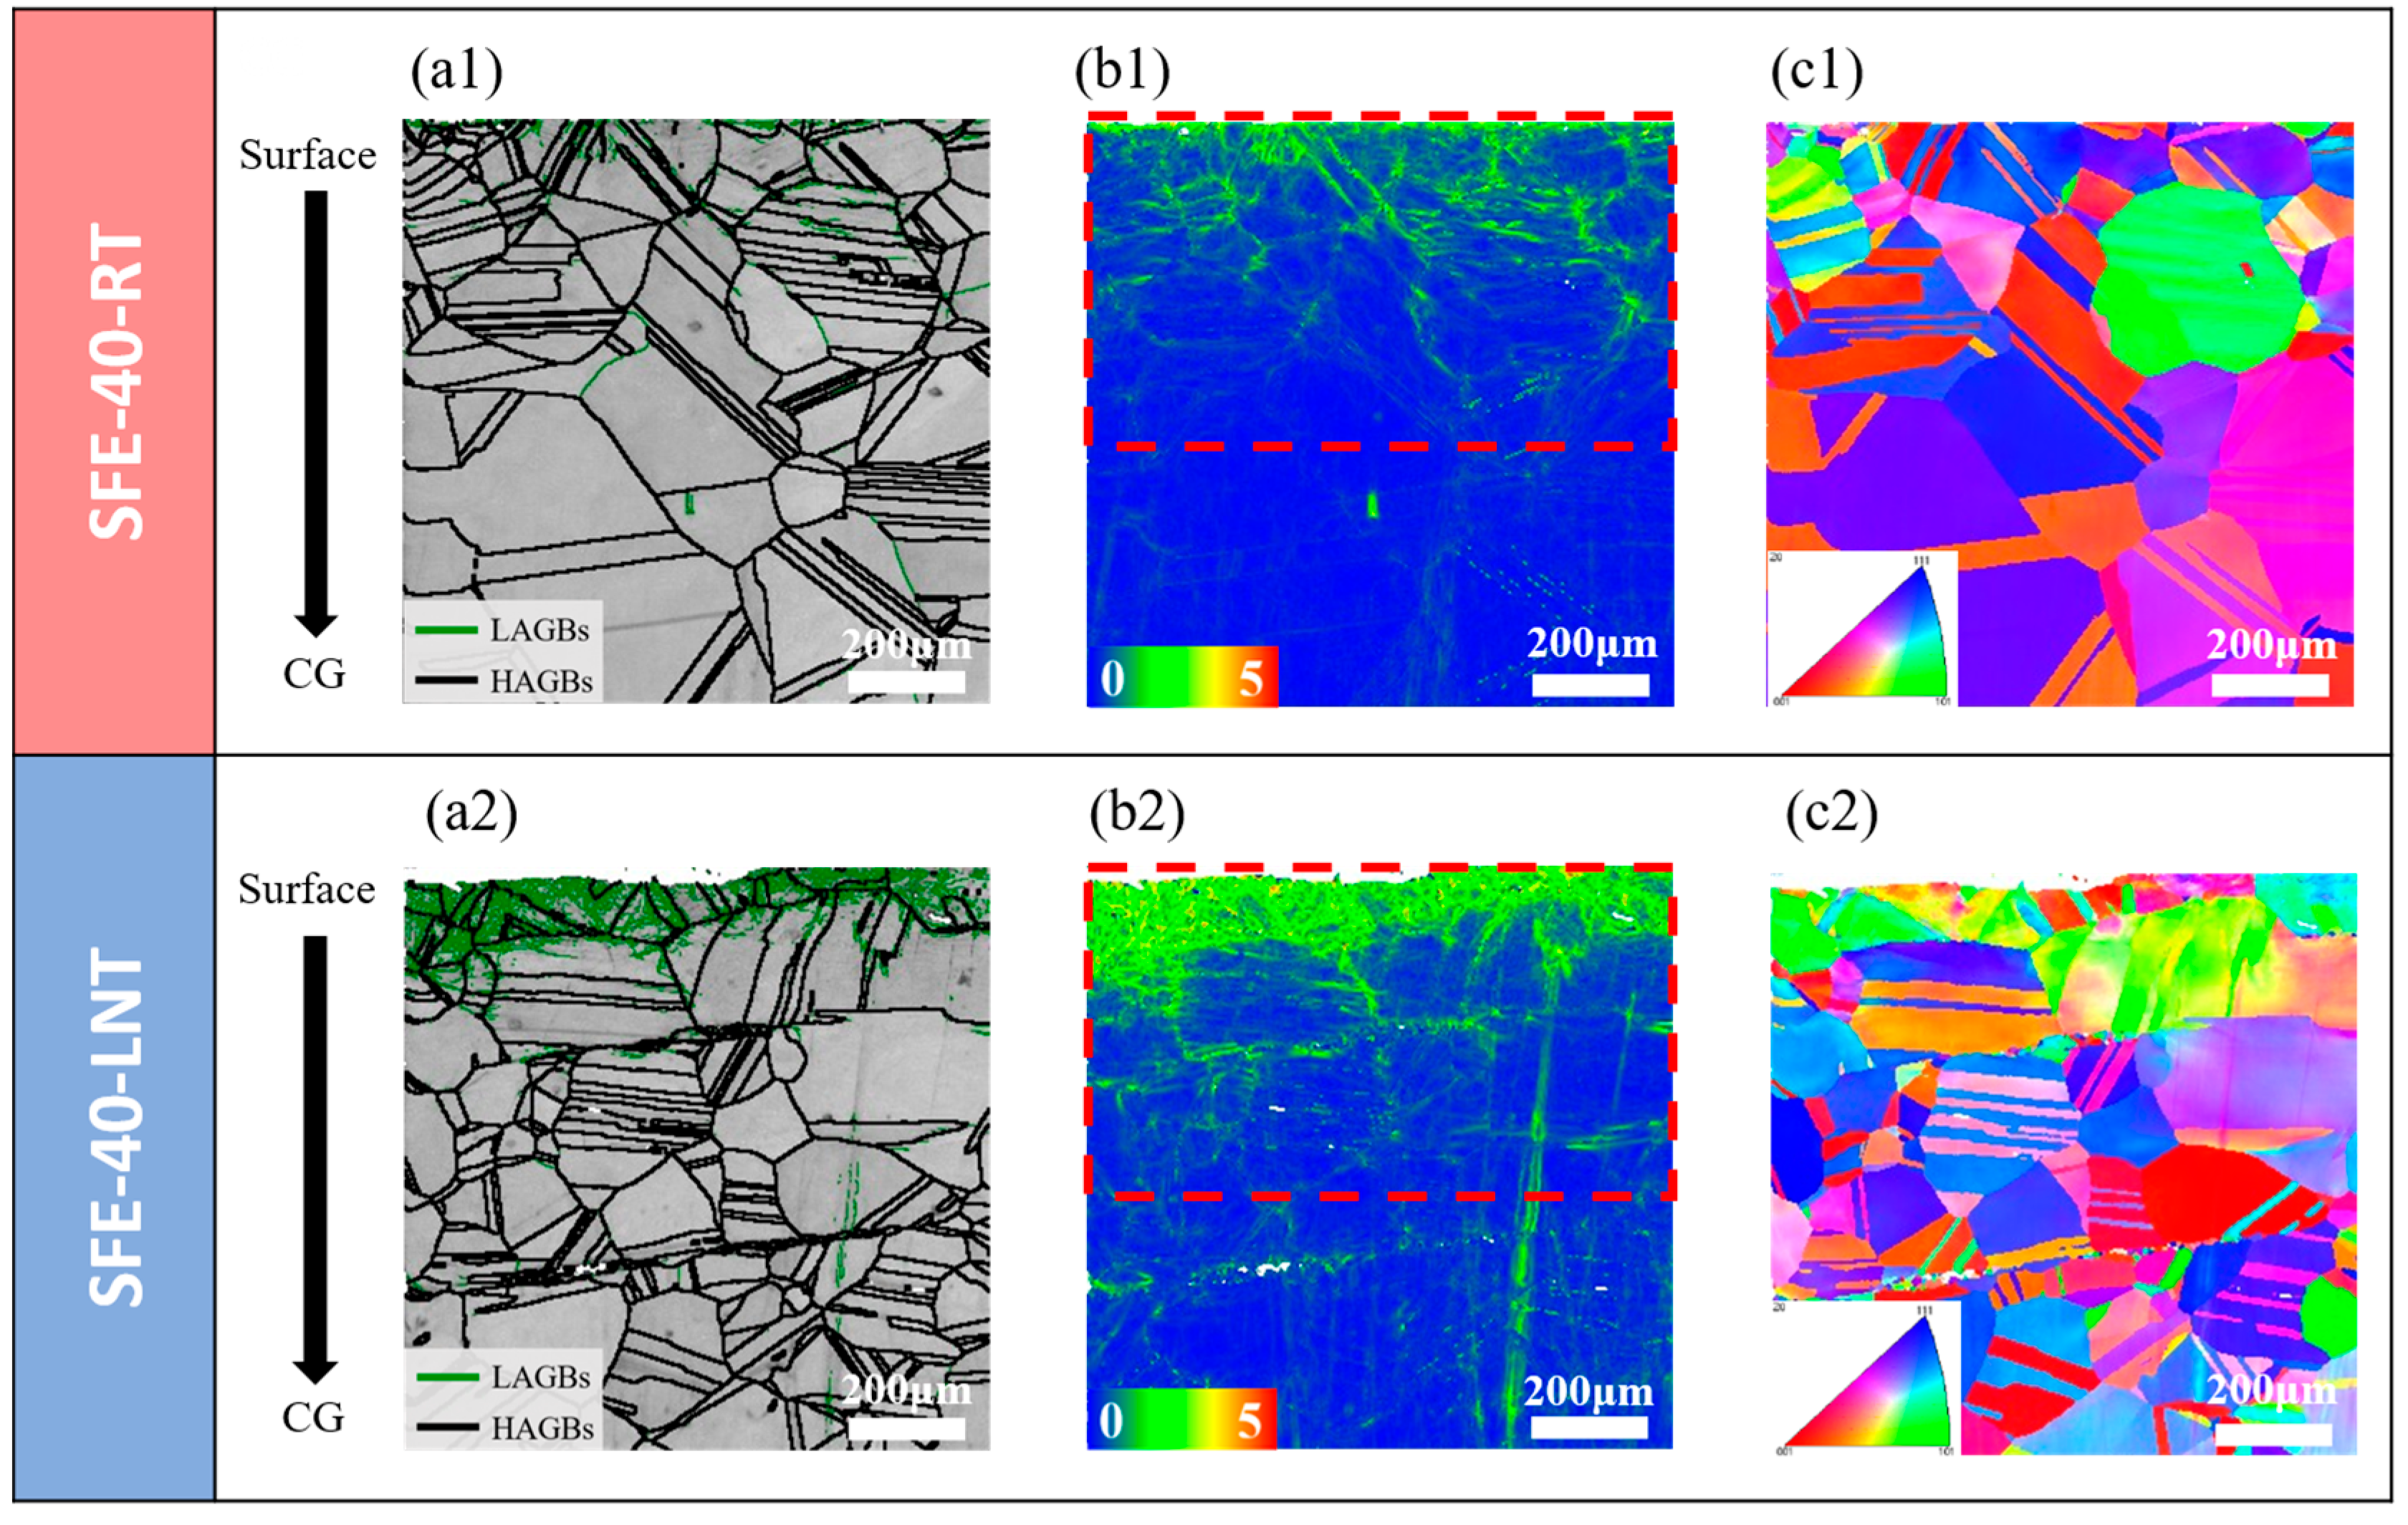
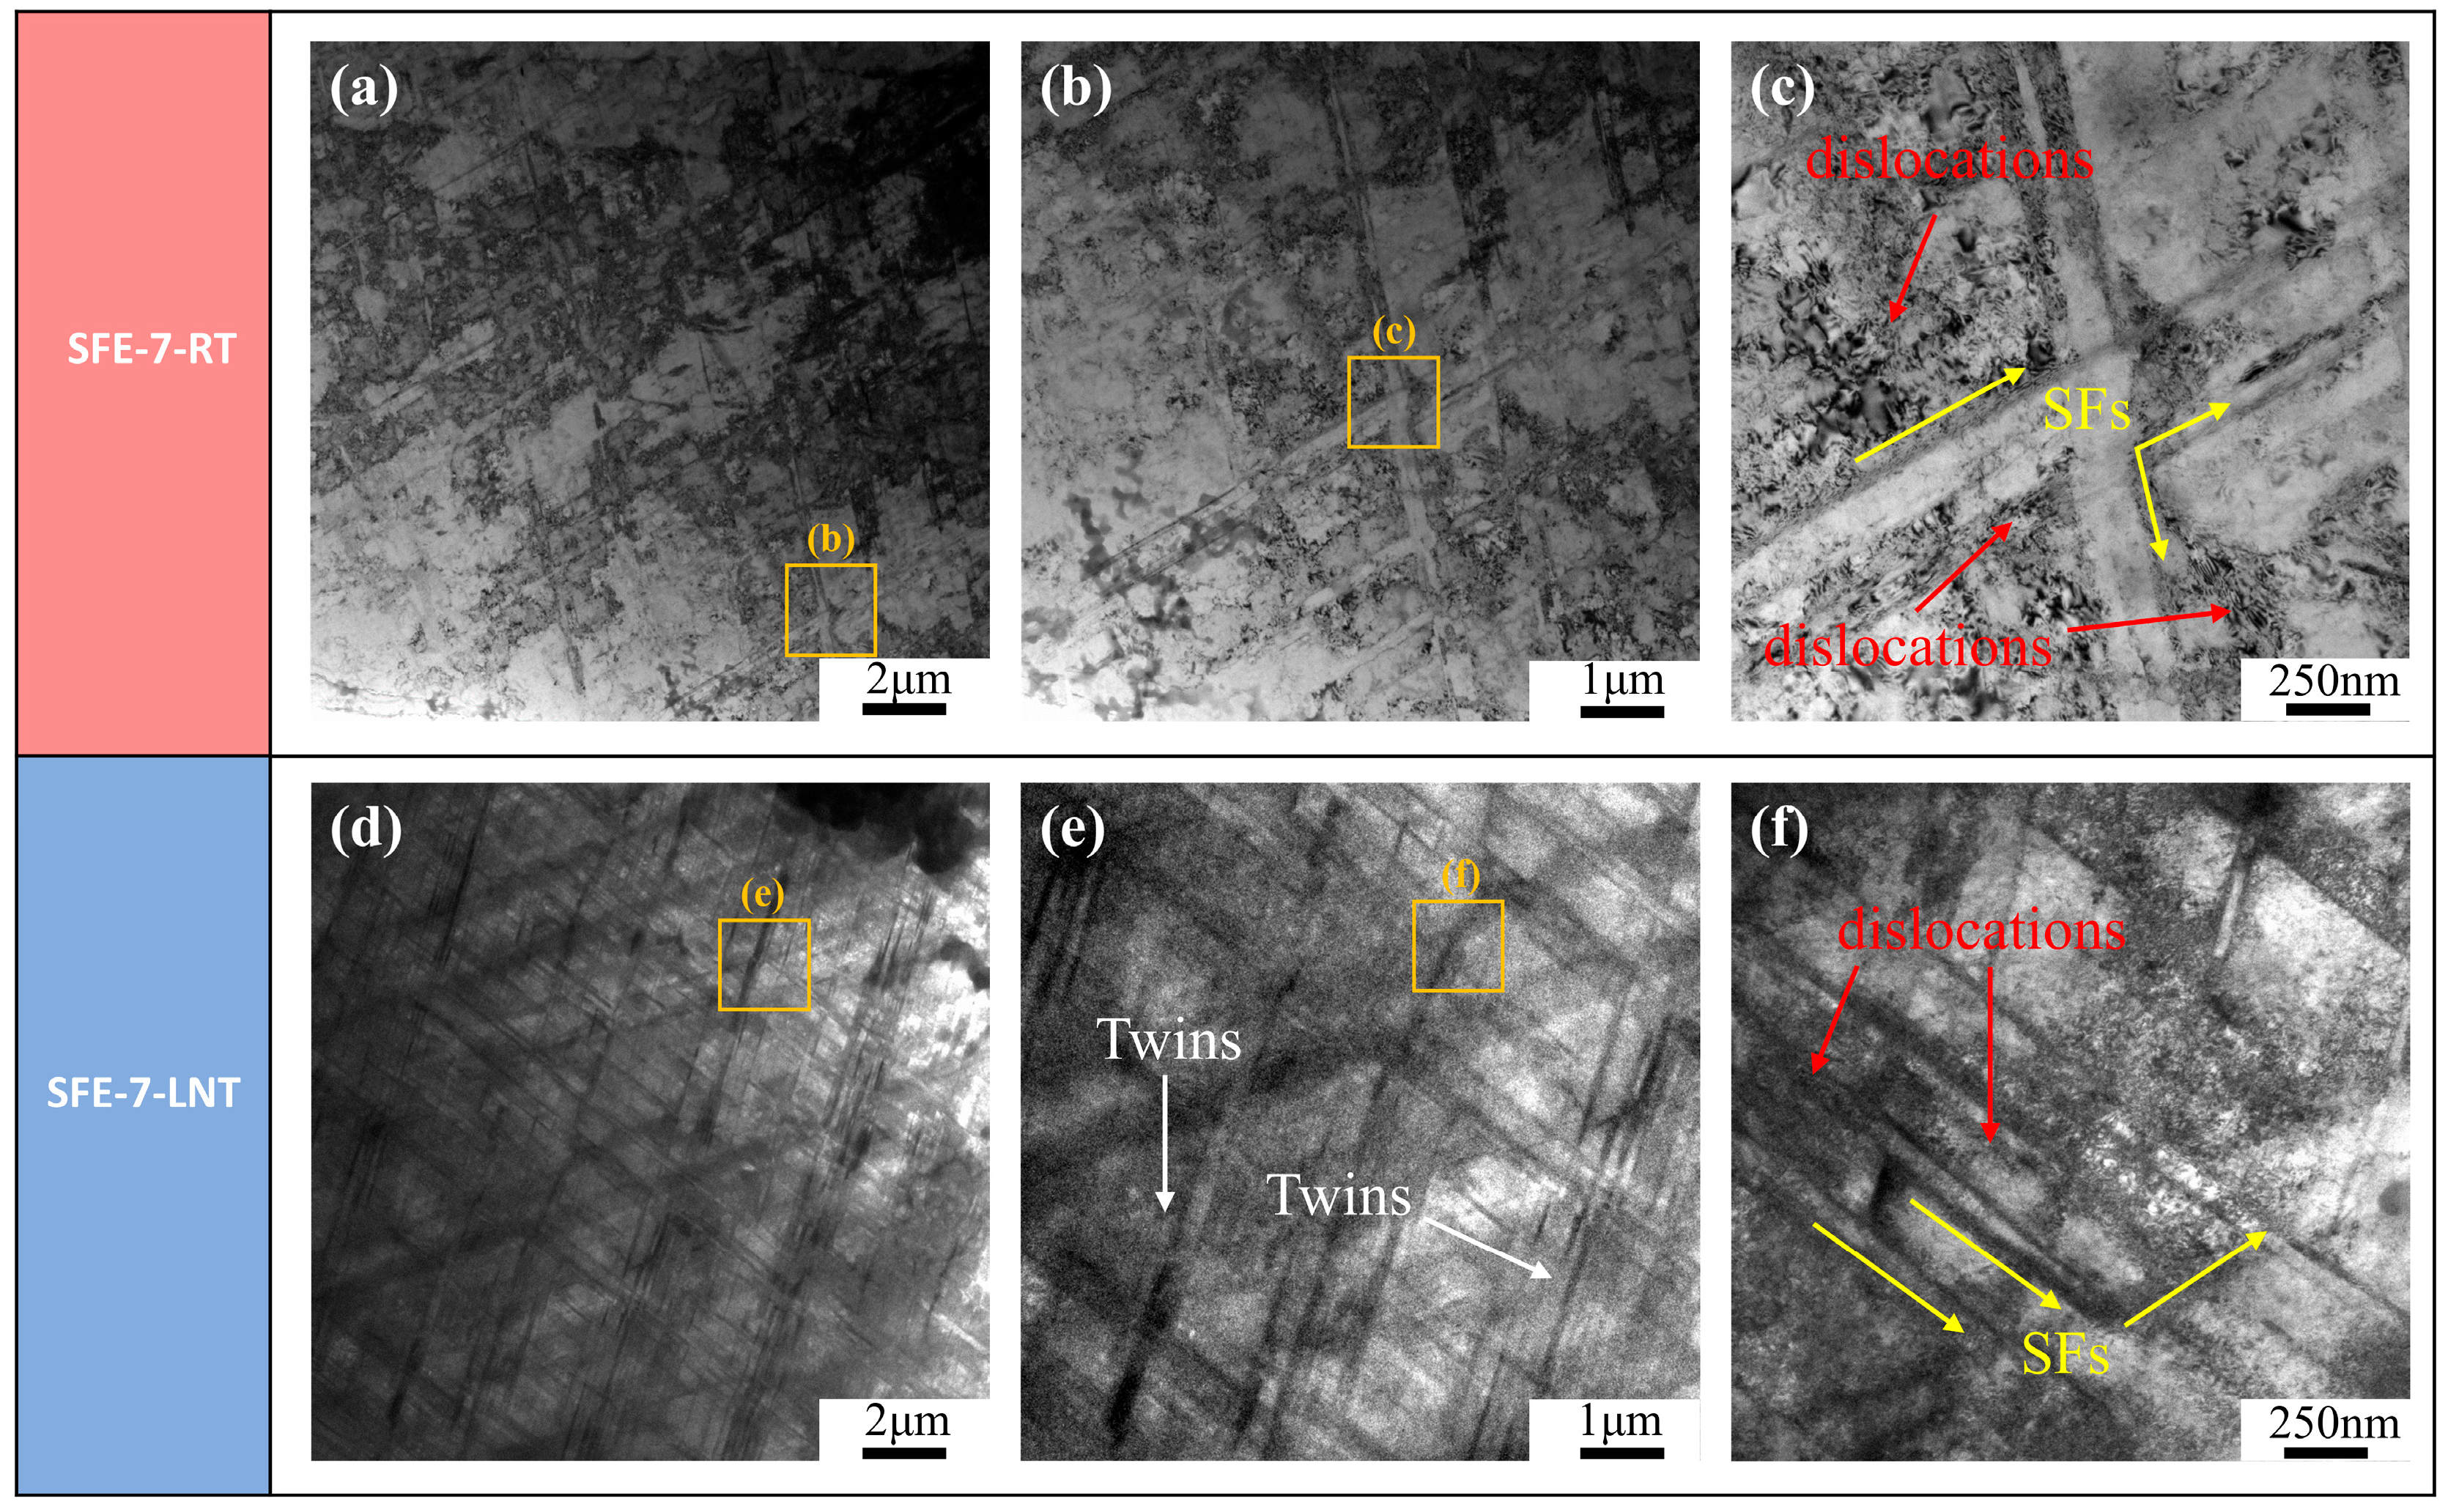
3.3. Deformed Microstructure

Figure 5 and Figure 6 present EBSD images exhibiting the grain boundaries, kernel average misorientation (KAM), and inverse pole figure (IPF) images of SFE-7 and SFE-40-Annealed samples after 8 min SMAT at room and cryogenic temperatures. The green and black lines indicate low-angle grain boundaries (LAGBs) (2° < θ < 15°) and high-angle grain boundaries (HAGBs) (θ > 15°), respectively. Different deformation mechanisms were observed during the deformation due to different SFEs. From the above results, it can be seen that the deformation of SFE-7 is dominated by twinning, while the deformation of SFE-40 is dominated by dislocation activity. The distribution density of LAGB during deformation can be observed in Figure 5(b1,b2) and Figure 6(b1,b2). It was found that the surface grains of the Cu-Al-Zn samples were significantly refined after SMAT, while the center grains were CG.
The density of LAGBs is lower in SFE-7 compared to SFE-40. After SMAT, the density of the LAGBs decreases with decreasing SFE. In addition, the decrease in SMAT temperature enhances the deformation depth of SFE-7-LNT. On the other hand, the density of LAGBs is higher under the surface of SFE-40-LNT compared to SFE-40-RT. The density distribution of LAGBs for SFE-7 and SFE-40 decreases gradually from surface to core, which is consistent with the Vickers hardness (Figure 1).
The GND density and kernel average misorientation were quantitatively analyzed using EBSD data within a statistical region marked in red dashed lines in the surface zone. It should be noted that the GND density ρGND was calculated using the kernel average misorientation (KAM) distribution values obtained from the EBSD characterization in [43].
ρGND = 2θ/ub
where θ, u, and b represent the average KAM value, step size, and Burgers vector magnitude, respectively. A comparison of the results within the dashed red boxes in Figure 5 and Figure 6 shows that the average misorientation and GND density of SFE-7-RT and SFE-7- LNT are almost the same (Figure 7a). In contrast, SFE-40-RT and SFE-40-LNT have a significant difference in the average misorientation and GND density. The values of average KAM of SFE-40-RT and SFE-40-LNT are 0.35°and 0.59°, respectively.
SFE-7 is a material with a low SFE value, and its microstructures are mainly deformation twins and stacking faults during the SMAT. The twinning activity has little effect on the LAGB and misorientation, and so the EBSD image of SFE-7 has a lower density of LAGB and misorientation. The deformation mechanism of SFE-40 is dominated by perfect dislocation activity [44], which is less prone to forming stacking faults or deformation twins during plastic deformation processing [45]. In addition, materials with higher SFE are more prone to dynamic recovery and cross-slipping of dislocations. Furthermore, compared with the SFE-40-RT sample (Figure 6(b2)), the SFE-40-LNT sample shows impeded dynamic recovery at cryogenic temperatures, resulting in higher GND density (Figure 7b), and a deeper impact region of SFE-40-LNT.
Figure 8 illustrates the bright-field TEM images of SFE-7 treated with SMAT for 8 min at both room and cryogenic temperatures. Deformation twins and dislocations are observed in the SFE-7-LNT (Figure 8e). The presence of deformed twins in Figure 8d–f is attributed to the low SFE and the presence of more dislocations near the twin boundaries [46,47,48]. High-density twins can provide abundant twin boundaries, effectively preventing dislocation recovery and dislocation slip, resulting in good ductility of the SFE-7-LNT samples [49]. Deformation twins are not observed in the SFE-7-RT sample, and the dislocation density is low. The decrease in SMAT temperature leads to an increase in twins and dislocation density, and thus twinning is the main deformation mechanism of SFE-7 subjected to SMAT at cryogenic temperatures [50].
As a result of the effective blocking of the dynamic recovery of dislocations, the SFE-7 alloy subjected to SMAT processing at cryogenic temperatures achieves high strength with no serious compromise of its ductility. At cryogenic temperature, the dislocation activity process is blocked. In addition, a large number of twins are observed in SFE-7-LNT compared to SFE-7-RT samples (Figure 8a,b,d,e). These observations are the same as those of Li et al. [26]. Due to the effect of the high strain rate at cryogenic temperature, twin bundles appear on the surface of the SFE-7-LNT alloy. The strain-hardening capacity of SFE-7 is significantly increased because the accumulation of twins and stacking faults can more effectively prevent dislocation slipping [51]. The reduction in SFE has been reported to lead to an increase in the strength of CG alloys. However, the increase in strength is accompanied by a decrease in strain-hardening capacity and ductility [52]. The good combination of strength and ductility of SFE-7-LNT can be attributed to its higher density of twins and stacking faults [22]. The decrease in ductility is not significant compared to SFE-7-RT. Therefore, it can be inferred that deformation twins and stacking faults enhance the ductility of the SFE-7 sample. At room temperature, the deformation mode of higher SFE materials such as SFE-40 is mainly dislocation slip [53].
Figure 9a–c and d show the evolution of strain bands (SBs) in the Y-direction on the SMAT surface of the SFE-7-RT, SFE-40-RT, SFE-7-LNT, and SFE-40-LNT samples, respectively. The dispersed SBs in Figure 9a are uniformly distributed on the surface of the SFE-7-RT sample. These dispersed SBs carry a large amount of applied strain. It is well known that stable plastic deformation is an essential requirement for metals to remain ductile. Although the SFE-7-LNT samples showed localized SBs at ε = 13% (Figure 9c), the overall strain concentration was lower than that of SFE-7-RT. The SFE-40 sample first shows a localized strain band at ε = 9% (Figure 9b,d), and then extends to the entire region. At the same SFE conditions, the strain was more uniform for samples treated with SMAT at RT temperature. In addition, SFE-7 showed a more uniform strain than that of SFE-40 at the same SMAT temperature. Overall, SFE-40 showed a more pronounced strain concentration compared to SFE-7.
Such stabilized SBs have never been observed in nanostructures, which may be mainly due to the inhomogeneity of their microstructure [54]. Figure 9 shows that the strain concentration area grows preferentially and then extends to the whole DIC test surface (i.e., the SMATed surface) [55]. This localization process results in stress release, which effectively prevents the deformation instability caused by stress concentration. These results indicate that the heterogeneity of the microstructure leads to the formation of dispersed SBs. In general, it was found that the stress dispersion of SFE-7 was more uniform than that of SFE-40 in Figure 9.

3.4. Fracture Characterization

Figure 10a–c and Figure 11a–c show the fracture patterns along the depth direction for the SFE-7 and SFE-40 samples, respectively. The annealed samples exhibit typical dimple fracture, with deeper dimples observed in SFE-40. Figure 10a and Figure 11a demonstrate deep dimples, micro-cracks, and micro-voids, which are commonly thought to be indicative of ductile fracture [56]. Figure 10(b3,c3) and Figure 11(b3,c3) demonstrate that the fracture morphology is composed of two different zones: a fast fracture zone in the edge region and a crack propagation zone in the center region (red dashed lines are used to distinguish the differences between the two zones). In contrast, the two distinct regions cannot be observed from Figure 10a and Figure 11a. The CG region in Figure 10(b3,c3) and Figure 11(b3,c3) shows deep dimples, micro-cracks, and micro-voids, indicating that the fracture in the center region is a ductile fracture. The dimples in Figure 11(b3,c3) are shallower and fewer in number compared to Figure 10(b3,c3), which may be a result of the poor ductility in the SFE-40 samples. Meanwhile, it can be found that the depth of the dimples in the fast fracture zone is smaller than the center region, and the brittle fracture region covered by smooth parts and tiny dimples can be observed in the region close to the SMATed surface, which indicates that there is momentary breaking caused by a brittle fracture in these regions. In contrast, the entire region of the annealed homogenized CG samples without SMAT is characterized by ductile fracture. In summary, after SMAT, the fracture mode includes ductile fracture in the center region and brittle fracture in the SMATed surface region. It can be seen that the SFE-7 and SFE-40 samples subjected to SMAT at different temperatures have two fracture modes.
Due to the formation of nano-grains after SMAT, the fracture morphology in the region near the surface exhibits a smooth area which is usually considered to be a sign of brittle fracture [57], as shown in Figure 10(b3,c3) and Figure 11(b3,c3). In contrast, the fracture morphology in the region of the undeformed coarse-grained matrix reveals extensive dimples, indicating ductile fracture in this region. Because the matrix of the GS materials comprises a coarse-grained structure with excellent ductility, the undeformed area features deep dimples. As a result, the difference in fracture characterization is related to the varied grain sizes.

4. Conclusions

This work has investigated the effect of different SMAT processing temperatures on the mechanical properties of Cu-Al-Zn alloys with different SFE. The mechanical properties of the Cu-Al-Zn alloys SMATed at cryogenic temperature were improved, and the gradient structure of Cu-Al-Zn alloys with low SFE led to a superior strength–ductility combination. SFE and the SMAT temperatures play an important role in the mechanical properties of Cu-Al-Zn alloys. The main findings from this study are as follows:
(1)
The mechanical properties of Cu-Al-Zn alloys with different SFE prepared via SMAT at cryogenic temperatures could be significantly improved. In particular, the SFE-7 sample shows a superior combination of strength and ductility compared to the SFE-40 sample. SFE-7-LNT has a YS of 278 MPa and maintains a high UE of 51%; SFE-40-LNT has a YS of 230 MPa and a UE of 20%.
(2)
The HDI stress of the gradient-structured SFE-7 sample is higher than that of the gradient-structured SFE-40 sample, especially at cryogenic temperatures. The HDI/flow stress ratio of the gradient-structured SFE-7 sample has a high value above 0.6.
(3)
The EBSD results indicate that for both the SFE-7 and SFE-40 alloys, the kernel average misorientation of grains of samples SMATed at cryogenic temperatures is higher than that at room temperature. The TEM results reveal that SFE-7-LNT has more deformation twins and dislocations compared to SFE-7-RT.
(4)
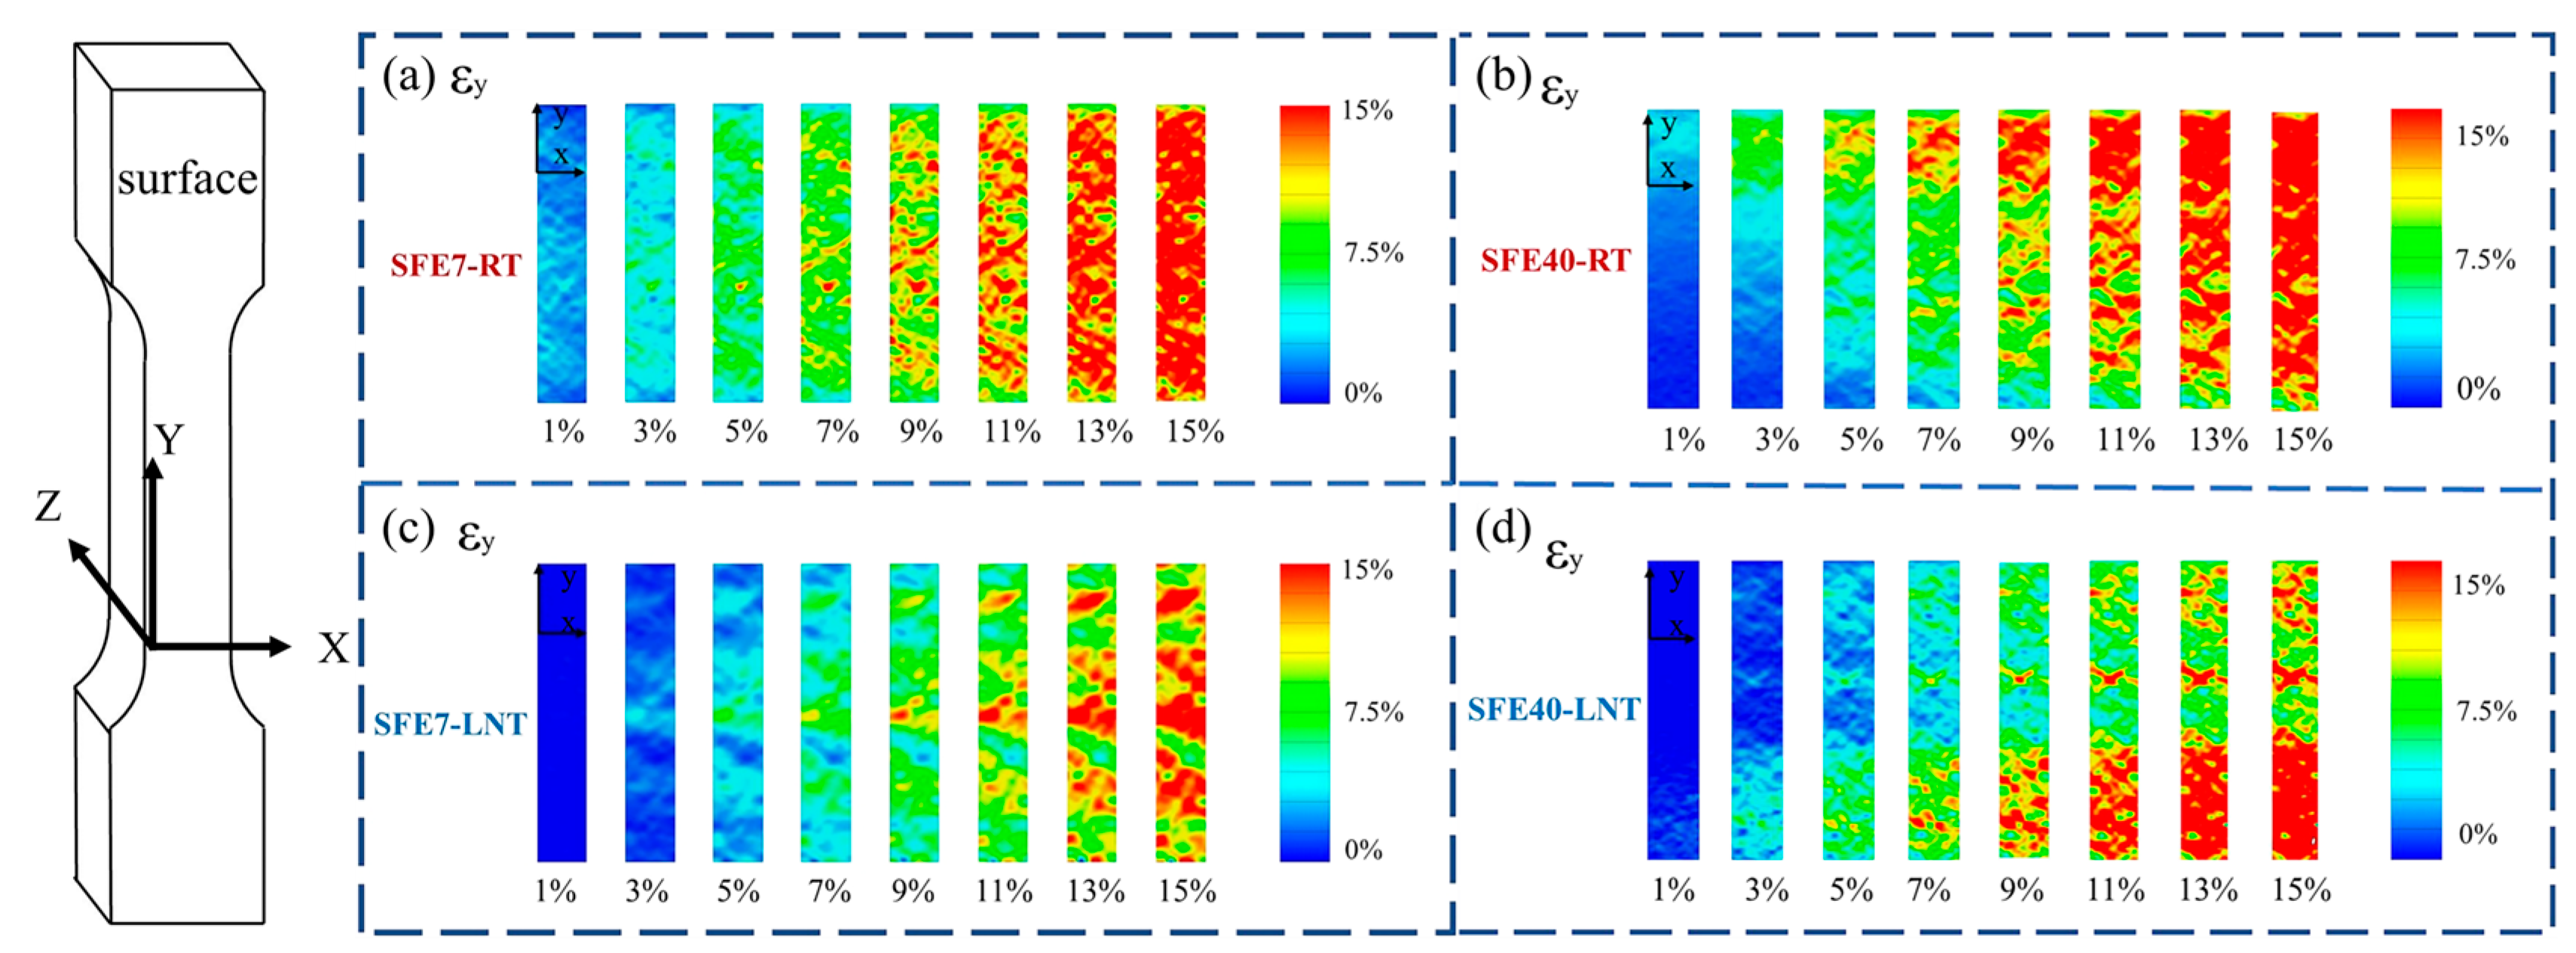
The DIC results show that the stress dispersion of SFE-7 is performed more uniformly than that of SFE-40. Significant strain bands appear after 9% strain in the tensile tests of SFE-40 samples, but SFE-7 samples maintain a more uniform strain development with increasing strain.
(5)
Due to the generation of the GS layer, the fracture features of the SMATed SFE-7 and SFE-40 samples show brittle and ductile fracture. The annealed homogenized CG samples without SMAT are characterized by ductile fracture.

Author Contributions

Conceptualization and writing—original draft preparation, Z.Z.; methodology and formal analysis, Y.G. and C.L.; supervision and writing—review and editing, X.Z.; data curation, Z.K., L.S. and J.Y.; investigation, validation, and visualization, S.Q. (Shen Qin) and S.Q. (Shuwei Quan). All authors have read and agreed to the published version of the manuscript.

Funding

This research was funded by the Natural Science Foundation of China (NSFC) under grant nos. 51664033, 51861015, and 51931003, the Yunnan Science and Technology Program under grant nos. 202305AF150014 and 2019IC004, and the Basic Research Project of Yunnan Science and Technology Program under grant no. 202001AU070081.

Data Availability Statement

The data and analysis in this study are available upon request from the corresponding authors. The data are not publicly available due to privacy.

Acknowledgments

The authors would like to acknowledge Shimadzu Management China Co, Ltd.

Conflicts of Interest

The authors declare no conflict of interest.

References

  1. Meyers, M.A.; Mishra, A.; Benson, D.J. Mechanical properties of nanocrystalline materials. Prog. Mater. Sci. 2006, 51, 427–556. [Google Scholar] [CrossRef]
  2. Gleiter, H. Nanocrystalline materials. Prog. Mater. Sci. 1989, 33, 223–315. [Google Scholar] [CrossRef]
  3. Heinzelmeier, A.; Guitton, A.; Novelli, M.; Yu, W.; Grosdidier, T. Improving embrittlement in the Ti-Al-C MAX phase system: A composite approach for surface severe plastic deformation. J. Alloys Compd. 2023, 950, 169946. [Google Scholar] [CrossRef]
  4. Azzeddine, H.; Bradai, D.; Baudin, T.; Langdon, T.G. Texture evolution in high-pressure torsion processing. Prog. Mater. Sci. 2022, 125, 100886. [Google Scholar] [CrossRef]
  5. Zhu, Y.T.; Wu, X.L. Ductility and plasticity of nanostructured metals: Differences and issues. Mater. Today Nano 2018, 2, 15–20. [Google Scholar] [CrossRef]
  6. Hu, K.; Yi, J.; Huang, B.; Wang, G. Grain-size effect on dislocation source-limited hardening and ductilization in bulk pure Ni. J. Mater. Sci. Technol. 2023, 154, 9–21. [Google Scholar] [CrossRef]
  7. Xu, N.; Xu, Y.; Zhang, B.; Song, Q.; Zhao, J.; Bao, Y. Effect of Heterogeneous Lamella Structure on Mechanical Properties of Double-Pass Friction Stir Processed Cu–30%Zn Alloy. Met. Mater. Int. 2023, 29, 3222–3234. [Google Scholar] [CrossRef]
  8. Li, X.; Zhang, Z.; Bai, Y.; Liu, Y.; Liu, Y.; Li, C.; Fu, Z.; Pan, H.; Yang, J.; Zhu, X. The effect of mechanical incompatibility and strain delocalization on the mechanical properties of gradient structure Cu-4.5Al alloy. Mater. Sci. Eng. A 2022, 853, 143693. [Google Scholar] [CrossRef]
  9. Wang, P.-J.; Zhou, D.; Guo, H.-H.; Liu, W.-F.; Su, J.-Z.; Fu, M.-S.; Singh, C.; Trukhanov, S.; Trukhanov, A. Ultrahigh enhancement rate of the energy density of flexible polymer nanocomposites using core–shell BaTiO3@MgO structures as the filler. J. Mater. Chem. A 2020, 8, 11124–11132. [Google Scholar] [CrossRef]
  10. Fang, T.H.; Li, W.L.; Tao, N.R.; Lu, K. Revealing extraordinary intrinsic tensile plasticity in gradient nano-grained copper. Science 2011, 331, 1587–1590. [Google Scholar] [CrossRef]
  11. Olugbade, T.O.; Lu, J. Literature review on the mechanical properties of materials after surface mechanical attrition treatment (SMAT). Nano Mater. Sci. 2020, 2, 3–31. [Google Scholar] [CrossRef]
  12. Ghosh, S.; Bibhanshu, N.; Suwas, S.; Chatterjee, K. Micro-mechanisms underlying enhanced fatigue life of additively manufactured 316L stainless steel with a gradient heterogeneous microstructure. Mater. Sci. Eng. A 2023, 886, 145665. [Google Scholar] [CrossRef]
  13. Zhao, W.; Li, C.; Lin, T.; Gao, J.; Si, X.; Qi, J.; Dai, X.; Cao, J. Low-temperature diffusion bonding of Ti6Al4V alloy via nanocrystallization and hydrogenation surface treatment. J. Mater. Res. Technol. 2023, 24, 7599–7613. [Google Scholar] [CrossRef]
  14. Li, X.; Nakatani, M.; Yang, J.; Zhang, J.; Sharma, B.; Pan, H.; Ameyama, K.; Fang, J.; Zhu, X. Investigation of mechanical properties and microstructural evolution in Cu─Al alloys with gradient structure. J. Alloys Compd. 2022, 890, 161835. [Google Scholar] [CrossRef]
  15. Ran, M.; Wang, Q.; You, S.; Wang, H.; Zhou, H.; Zheng, W. Effect of laser shock peening and surface mechanical attrition treatment on the oxidation resistance of a 20Cr-25Ni-Nb stainless steel. Mater. Charact. 2023, 203, 113065. [Google Scholar] [CrossRef]
  16. Ebrahim, M.R.; Labeeb, A.M.; Battisha, I. Electrical properties of Al-Si surface composites through surface mechanical alloying on severe plastic deformed Al substrates. J. Alloys Compd. 2023, 961, 170925. [Google Scholar] [CrossRef]
  17. Kang, G.C.; Hong, S.H.; Park, H.J.; Lee, J.P.; Lee, J.K.; Wang, W.-M.; Kim, K.B. Influence of grain boundary modification on color transition behavior of Cu-Al-Zn-Sn alloys with low stacking fault energy. J. Alloys Compd. 2023, 960, 171033. [Google Scholar] [CrossRef]
  18. Ma, X.L.; Xu, W.Z.; Zhou, H.; Moering, J.A.; Narayan, J.; Zhu, Y.T. Alloying effect on grain-size dependent deformation twinning in nanocrystalline Cu–Zn alloys. Philos. Mag. 2015, 95, 301–310. [Google Scholar] [CrossRef]
  19. Van Swygenhoven, H.; Derlet, P.M.; Froseth, A.G. Stacking fault energies and slip in nanocrystalline metals. Nat. Mater. 2004, 3, 399–403. [Google Scholar] [CrossRef]
  20. Zhao, Y.H.; Zhu, Y.T.; Liao, X.Z.; Horita, Z.; Langdon, T.G. Tailoring stacking fault energy for high ductility and high strength in ultrafine grained Cu and its alloy. Appl. Phys. Lett. 2006, 89, 121906. [Google Scholar] [CrossRef]
  21. Zhao, Y.H.; Horita, Z.; Langdon, T.G.; Zhu, Y.T. Evolution of defect structures during cold rolling of ultrafine-grained Cu and Cu–Zn alloys: Influence of stacking fault energy. Mater. Sci. Eng. A 2008, 474, 342–347. [Google Scholar] [CrossRef]
  22. Pan, Q.; Zhang, L.; Feng, R.; Lu, Q.; An, K.; Chuang, A.C.; Poplawsky, J.D.; Liaw, P.K.; Lu, L. Gradient cell–structured high-entropy alloy with exceptional strength and ductility. Science 2021, 374, 984–989. [Google Scholar] [CrossRef] [PubMed]
  23. Chinnasamy, M.; Rathanasamy, R.; Pal, S.K.; Palaniappan, S.K. Effectiveness of cryogenic treatment on cutting tool inserts: A review. Int. J. Refract. Met. Hard Mater. 2022, 108, 105946. [Google Scholar] [CrossRef]
  24. Chinnasamy, M.; Rathanasamy, R.; Samanta, B.; Pal, S.K.; Palaniappan, S.K.; Korrayi, R.R.; Muthuswamy, P.; Roy, S. Microstructure evolution, phase formation, mechanical and tribological response of deep cryogenically treated hard WC-6%Co cutting bits. J. Mater. Res. Technol. 2023, 27, 1293–1306. [Google Scholar] [CrossRef]
  25. Chinnasamy, M.; Rathanasamy, R.; Samanta, B.; Pal, S.K.; Palaniappan, S.K.; Muthuswamy, P.; Korrayi, R.R.; Roy, S. Implications of cryogenic treatment on microstructure, phase formation, mechanical and tribological properties of tungsten carbide cutting bits with varying cobalt content for mining applications. Int. J. Refract. Met. Hard Mater. 2023, 117, 106421. [Google Scholar] [CrossRef]
  26. Li, Y.S.; Tao, N.R.; Lu, K. Microstructural evolution and nanostructure formation in copper during dynamic plastic deformation at cryogenic temperatures. Acta Mater. 2008, 56, 230–241. [Google Scholar] [CrossRef]
  27. Wang, K.; Tao, N.R.; Liu, G.; Lu, J.; Lu, K. Plastic strain-induced grain refinement at the nanometer scale in copper. Acta Mater. 2006, 54, 5281–5291. [Google Scholar] [CrossRef]
  28. Kumar, G.V.S.; Mangipudi, K.R.; Sastry, G.V.S.; Singh, L.K.; Dhanasekaran, S.; Sivaprasad, K. Excellent Combination of Tensile ductility and strength due to nanotwinning and a biamodal structure in cryorolled austenitic stainless steel. Sci. Rep. 2020, 10, 354. [Google Scholar] [CrossRef]
  29. Denanot, M.; Villain, J. The Stacking Fault Energy in Cu-Al-Zn Alloys. In Physica Status Solidi/A.; Görlich, Ed.; De Gruyter: Berlin, Germany, 1971; Volume 8, pp. 685–689. [Google Scholar]
  30. Lu, K.; Lu, J. Nanostructured surface layer on metallic materials induced by surface mechanical attrition treatment. Mater. Sci. Eng. A 2004, 375–377, 38–45. [Google Scholar] [CrossRef]
  31. Darling, K.A.; Tschopp, M.A.; Roberts, A.J.; Ligda, J.P.; Kecskes, L.J. Enhancing grain refinement in polycrystalline materials using surface mechanical attrition treatment at cryogenic temperatures. Scr. Mater. 2013, 69, 461–464. [Google Scholar] [CrossRef]
  32. Sinclair, C.W.; Poole, W.J.; Bréchet, Y. A model for the grain size dependent work hardening of copper. Scr. Mater. 2006, 55, 739–742. [Google Scholar] [CrossRef]
  33. Lu, X.; Gui, Y.; Fu, Z.; Ao, N.; Wu, S.; Zhang, X. Mechanical behavior and microstructure-property correlation of a metastable interstitial high entropy alloy with hierarchical gradient structures. Mater. Charact. 2023, 204, 113232. [Google Scholar] [CrossRef]
  34. Qu, S.; An, X.H.; Yang, H.J.; Huang, C.X.; Yang, G.; Zang, Q.S.; Wang, Z.G.; Wu, S.D.; Zhang, Z.F. Microstructural evolution and mechanical properties of Cu–Al alloys subjected to equal channel angular pressing. Acta Mater. 2009, 57, 1586–1601. [Google Scholar] [CrossRef]
  35. An, X.; Lin, Q.; Qu, S.; Yang, G.; Wu, S.; Zhang, Z.-F. Influence of stacking-fault energy on the accommodation of severe shear strain in Cu-Al alloys during equal-channel angular pressing. J. Mater. Res. 2011, 24, 3636–3646. [Google Scholar] [CrossRef]
  36. Zhang, Z.J.; Duan, Q.Q.; An, X.H.; Wu, S.D.; Yang, G.; Zhang, Z.F. Microstructure and mechanical properties of Cu and Cu–Zn alloys produced by equal channel angular pressing. Mater. Sci. Eng. A 2011, 528, 4259–4267. [Google Scholar] [CrossRef]
  37. Wang, Y.F.; Huang, C.X.; Wang, M.S.; Li, Y.S.; Zhu, Y.T. Quantifying the synergetic strengthening in gradient material. Scr. Mater. 2018, 150, 22–25. [Google Scholar] [CrossRef]
  38. Zhu, Y.; Wu, X. Perspective on hetero-deformation induced (HDI) hardening and back stress. Mater. Res. Lett. 2019, 7, 393–398. [Google Scholar] [CrossRef]
  39. Fang, T.H.; Tao, N.R.; Lu, K. Tension-induced softening and hardening in gradient nanograined surface layer in copper. Scr. Mater. 2014, 77, 17–20. [Google Scholar] [CrossRef]
  40. Song, S.C.; Moon, J.; Kim, H.S. Hetero-deformation-induced strengthening of multi-phase Cu–Fe–Mn medium entropy alloys by dynamic heterostructuring. Mater. Sci. Eng. A 2021, 799, 140275. [Google Scholar] [CrossRef]
  41. Wu, X.; Jiang, P.; Chen, L.; Yuan, F.; Zhu, Y.T. Extraordinary strain hardening by gradient structure. Proc. Natl. Acad. Sci. USA 2014, 111, 7197–7201. [Google Scholar] [CrossRef]
  42. Wu, X.; Yang, M.; Yuan, F.; Wu, G.; Wei, Y.; Huang, X.; Zhu, Y. Heterogeneous lamella structure unites ultrafine-grain strength with coarse-grain ductility. Proc. Natl. Acad. Sci. USA 2015, 112, 14501–14505. [Google Scholar] [CrossRef] [PubMed]
  43. Kubin, L.P.; Mortensen, A. Geometrically necessary dislocations and strain-gradient plasticity: A few critical issues. Scr. Mater. 2003, 48, 119–125. [Google Scholar] [CrossRef]
  44. Liao, X.Z.; Srinivasan, S.G.; Zhao, Y.H.; Baskes, M.I.; Zhu, Y.T.; Zhou, F.; Lavernia, E.J.; Xu, H.F. Formation mechanism of wide stacking faults in nanocrystalline Al. Appl. Phys. Lett. 2004, 84, 3564–3566. [Google Scholar] [CrossRef]
  45. Youngdahl, C.J.; Weertman, J.R.; Hugo, R.C.; Kung, H.H. Deformation behavior in nanocrystalline copper. Scr. Mater. 2001, 44, 1475–1478. [Google Scholar] [CrossRef]
  46. Tian, Y.Z.; Zhao, L.J.; Chen, S.; Shibata, A.; Zhang, Z.F.; Tsuji, N. Significant contribution of stacking faults to the strain hardening behavior of Cu-15%Al alloy with different grain sizes. Sci. Rep. 2015, 5, 16707. [Google Scholar] [CrossRef] [PubMed]
  47. Zhao, W.; Tao, N.; Guo, J.; Lu, Q.; Lu, K. High density nano-scale twins in Cu induced by dynamic plastic deformation. Scr. Mater. 2005, 53, 745–749. [Google Scholar] [CrossRef]
  48. Zhang, Y.; Tao, N.R.; Lu, K. Effect of stacking-fault energy on deformation twin thickness in Cu–Al alloys. Scr. Mater. 2009, 60, 211–213. [Google Scholar] [CrossRef]
  49. Yin, Z.; Sun, L.; Yang, J.; Gong, Y.; Zhu, X. Mechanical behavior and deformation kinetics of gradient structured Cu-Al alloys with varying stacking fault energy. J. Alloys Compd. 2016, 687, 152–160. [Google Scholar] [CrossRef]
  50. Shen, Y.; Wen, C.; Yang, X.; Pang, Y.; Sun, L.; Tao, J.; Gong, Y.; Zhu, X. Ultrahigh Strength Copper Obtained by Surface Mechanical Attrition Treatment at Cryogenic Temperature. J. Mater. Eng. Perform. 2015, 24, 5058–5064. [Google Scholar] [CrossRef]
  51. Song, Y.; Li, T.; Fu, X.; Zhang, Z.; Sheng, G.; Zhu, Y.; Lu, Y.; Yu, Q. Dislocation-twin interaction in medium entropy alloy containing a high density of oxygen interstitials. J. Alloys Compd. 2023, 947, 169522. [Google Scholar] [CrossRef]
  52. Rohatgi, A.; Vecchio, K.S.; Gray, I.G.T. A metallographic and quantitative analysis of the influence of stacking fault energy on shock-hardening in Cu and Cu–Al alloys. Acta Mater. 2001, 49, 427–438. [Google Scholar] [CrossRef]
  53. Tao, N.R.; Wang, Z.B.; Tong, W.P.; Sui, M.L.; Lu, J.; Lu, K. An investigation of surface nanocrystallization mechanism in Fe induced by surface mechanical attrition treatment. Acta Mater. 2002, 50, 4603–4616. [Google Scholar] [CrossRef]
  54. Wang, Y.; Wei, Y.; Zhao, Z.; Long, H.; Lin, Z.; Guo, F.; He, Q.; Huang, C.; Zhu, Y. Activating dispersed strain bands in tensioned nanostructure layer for high ductility: The effects of microstructure inhomogeneity. Int. J. Plast. 2022, 149, 103159. [Google Scholar] [CrossRef]
  55. Wu, H.; Fan, G. An overview of tailoring strain delocalization for strength-ductility synergy. Prog. Mater. Sci. 2020, 113, 100675. [Google Scholar] [CrossRef]
  56. Yang, C.; Liu, Y.G.; Shi, Y.H.; Li, M.Q. Microstructure characterization and tensile properties of processed TC17 via high energy shot peening. Mater. Sci. Eng. A 2020, 784, 139298. [Google Scholar] [CrossRef]
  57. Dang, N.; Chen, S.; Liu, L.; Maire, E.; Adrien, J.; Cazottes, S.; Xiao, W.; Ma, C.; Zhou, L. Analysis of hybrid fracture in α/β titanium alloy with lamellar microstructure. Mater. Sci. Eng. A 2019, 744, 54–63. [Google Scholar] [CrossRef]
Figure 1. Microhardness of SMAT samples under different temperature conditions: (a) SFE-7, (b) SFE-40. The dashed line indicates the thickness of the gradient layer.
Metals 13 01923 g001
Figure 2. Mechanical properties of the SFE-7 and SFE-40 samples. (a,c) The engineering stress–strain curves of the SFE-7 and SFE-40 samples, respectively. (b,d) The true stress–strain curves (dashed lines) and the strain-hardening capability curves of the SFE-7 and SFE-40 samples, respectively. The insets in the upper right are the local magnification diagrams of the strain-hardening capability curves of the SFE-7 and SFE-40 samples for ε = 10% and ε = 6%, respectively. (e) Schematic diagram of the tensile sample.
Metals 13 01923 g002
Figure 3. Loading–unloading–reloading tensile curves for the samples (a) SFE-7 and (b) SFE-40.
Metals 13 01923 g003
Figure 4. (a,c) HDI stress; (b,d) the ratio of HDI stress to flow stress at different strains for the samples of SFE-7 and SFE-40, respectively.
Metals 13 01923 g004
Figure 5. EBSD analysis related to SFE-7 samples. (a1,a2) Grain boundary diagram, (b1,b2) KAM, and (c1,c2) IPF of SFE-7-RT and SFE-7-LNT, respectively. The black lines in (a1,a2) represent HAGBs and the green lines represent LAGBs. The red dashed lines in (b1,b2) represent the areas where the data were selected for the relevant calculations.
Metals 13 01923 g005
Figure 6. EBSD analysis related to SFE-40 samples. (a1,a2) Grain boundary, (b1,b2) KAM, and (c1,c2) IPF of SFE-40-RT and SFE-40-LNT, respectively. The black lines in (a1,a2) represent HAGBs and the green lines represent LAGBs. The red dashed lines in (b1,b2) represent the areas where the data were selected for the relevant calculations.
Metals 13 01923 g006
Figure 7. Local misorientation of (a) SFE-7 and (b) SFE-40 samples within the selected zone. The data were selected from the red dashed boxes in Figure 5 and Figure 6.
Metals 13 01923 g007
Figure 8. Bright-field TEM images of (ac) SFE-7-RT sample and (df) SFE-7-LNT sample at 100 μm from the treated surface, respectively. The white arrowheads indicate twins, the red arrowheads indicate dislocations, and the yellow arrowheads indicate SFs.
Metals 13 01923 g008
Figure 9. The distributions of strain εy on the surface of SFE-7-RT (a), SFE-40-RT (b), SFE-7-LNT (c), and SFE-40-LNT (d). The left side of the figure shows a schematic diagram of the GS tensile sample, Y is the tensile loading direction, X is the sample width direction, and Z is the sample gradient thickness direction. The right side of each figure shows the strain scale, and the number below the DIC image represents the strain value of the tensile stage.
Metals 13 01923 g009
Figure 10. Typical fracture microstructure of SFE-7 samples. (a1a3) SFE-7-Annealed samples; (b1b3) SFE-7-RT samples; (c1c3) SFE-7-LNT samples. The red dashed line indicates the boundary between the dimples and the smooth surface.
Metals 13 01923 g010
Figure 11. Typical fracture microstructure of SFE-40 samples. (a1a3) SFE-40-Annealed samples; (b1b3) SFE-40-RT samples; (c1c3) SFE-40-LNT samples. The red dashed line indicates the boundary between the dimples and the smooth surface.
Metals 13 01923 g011
Table 1. Abbreviations and detailed descriptions for the samples.
SampleDescription
SFE-7-AnnealThe annealed alloy with SFE of 7 mJ/m2 without SMAT
SFE-7-RTThe alloy with SFE of 7 mJ/m2 SMATed at room temperature (RT)
SFE-7-LNTThe alloy with SFE of 7 mJ/m2 SMATed at liquid nitrogen temperature (LNT)
SFE-40-AnnealThe annealed alloy with SFE of 40 mJ/m2 without SMAT
SFE-40-RTThe alloy with SFE of 40 mJ/m2 SMATed at room temperature (RT)
SFE-40-LNTThe alloy with SFE of 40 mJ/m2 SMATed at liquid nitrogen temperature (LNT)
Table 2. Tensile properties of RT, LNT, and annealed samples with different SFEs.
CompositionSFE (mJ/m2)SampleYS (MPa)UTS (MPa)UE (%)
Cu-5.5 wt% Al-4.5 wt% Zn7SFE-7-RT22039964
SFE-7-LNT27841951
SFE-7-Anneal9237071
Cu-1.08 wt% Al-2.6 wt% Zn40SFE-40-RT20224522
SFE-40-LNT23025520
SFE-40-Anneal6023735
Disclaimer/Publisher’s Note: The statements, opinions and data contained in all publications are solely those of the individual author(s) and contributor(s) and not of MDPI and/or the editor(s). MDPI and/or the editor(s) disclaim responsibility for any injury to people or property resulting from any ideas, methods, instructions or products referred to in the content.

