Article

Investigation of Situational Correlations of Wire Electrical Discharge Machining of Superhard Materials with Acoustic Emission Characteristics

by
Sergey N. Grigoriev
,
Mikhail P. Kozochkin
,
Artur N. Porvatov
,
Alexander P. Malakhinsky
and
Yury A. Melnik
*
Department of High-Efficiency Processing Technologies, Moscow State University of Technology STANKIN, Vadkovskiy per. 3A, 127055 Moscow, Russia
*
Author to whom correspondence should be addressed.
Metals 2023, 13(4), 775; https://doi.org/10.3390/met13040775
Submission received: 26 March 2023 / Revised: 12 April 2023 / Accepted: 14 April 2023 / Published: 15 April 2023

Abstract

:
The purpose of this research is to find relationships between the parameters of the acoustic emission signals accompanying the electroerosive processing with a wire electrode of metals and hard alloys and the most important process indicators. These indicators include an increase in the concentration of erosion products in the interelectrode gap, an increase in the probability of wire electrode breakage, the efficiency of the supplied energy, the current productivity. This article presents the results of the study of acoustic emission signals during the processing of hard alloys with a cutting machine. The main focus is on the period preceding the breakage of the wire electrode. Changes in the parameters of acoustic emission a few seconds before failure are shown, and the possibility of preventing wire breakage by monitoring the parameters of acoustic emission signals is established. To evaluate the efficiency of the energy supplied to the processing zone, a dynamic model is proposed, with the help of which the processing efficiency is estimated by changing the transmission coefficients in one or several frequency ranges. To explain the situation that occurs in the processing zone with an increase in the concentration of erosion products, the article draws a parallel between electroerosive and laser processing, related to technologies of processing with concentrated flows of energy. Studies have shown that acoustic emission signals can be used to search for rational processing modes and improve automatic control systems for electroerosive equipment.

1. Introduction

Wire electrical discharge machining (WEDM) is increasingly used in mechanical engineering for the processing of critical parts made of heat-resistant and superhard materials. Although WEDM technology is an expensive processing method and does not have increased productivity, it is widely used for processing metals and alloys [1,2,3,4,5]. The applicability of WEDM only to conductive materials is one of the disadvantages and limitations of this technology. The expansion of the field of application of WEDM is achieved by introducing conductive components into ceramic compositions [6,7]. As such components, metal carbides are used in rational proportions, allowing ceramic materials to retain physical and mechanical properties and, simultaneously, provide the possibility of applying WEDM to them.
The reasons for the low performance of WEDM, in addition to the very nature of the process, are many disturbing factors, the occurrence of which and the degree of influence on the treatment process are predominantly random variables. The instability of the WEDM process is a consequence of the influence of these factors. The steady-state processing mode can exist for a relatively long time only under favorable conditions and regulation of the interelectrode gap (IEG). However, even under the most favorable conditions and in the presence of additional systems for stabilizing the WEDM process due to electrode vibrations, forced pumping of the liquid medium, etc., significant deviations of the controlled parameter (for example, IEG) from the optimal value can be observed, up to the occurrence of short circuits and electrode breaks [8,9,10].
The main disturbing factors of WEDM processes include the following: a continuous change in the breakdown conditions of the liquid medium caused by chaotic local changes in the concentration of erosion products when solid particles, vapors, and gases pass through the IEG; a change in the conditions for the evacuation of erosion products associated with the introduction of the tool electrode into the processed part, with a change in the geometry of the tool trajectory; heterogeneity of the structure of the processed material and a specific part; disturbances from the mechanical components of the machine; changes in temperature, composition, and viscosity of the working fluid. Even such a parameter as a change in the section of the workpiece being cut, if it is not considered in the control program, refers to random factors [10,11].
Although the automatic process control system strives to eliminate the emerging deviations of the treatment process, it cannot ensure the strict stability of the controlled value, since deviations occur spontaneously, regardless of the operation of the control system. However, the quality of control determines how accurate the system’s response to natural disturbances will be, and whether this response can minimize the probability of violating the stability of the WEDM process [10,11,12].
Adaptive control systems for traditional machining processes (turning, milling) are based on well-developed methods of direct or indirect measurements of parameters such as rate, temperature, cutting force and power, and vibration amplitude [13,14,15,16]. In matters of regulating processes on WEDM machines, it is necessary to use other approaches. With WEDM, there is no single parameter that accurately reflects the flow of the process. Any known parameter used as an adjustable value in conventional machines turns out to be more or less defective or inaccessible for measurements [11,12].
When choosing a parameter for regulating the WEDM process, you should strive to meet the following requirements:
-
the availability of adjustable value measuring instruments and the possibility of their use in WEDM conditions;
-
the ability to control the adjustable value when it deviates under the influence of disturbing factors and maintain its value within the required limits;
-
the adjustable parameter should be such that, when controlling it, it is possible to ensure a rational level of indicators of the WEDM process—performance, efficiency, wear of the tool electrode, processing accuracy, etc.
To date, no such parameter has been determined to meet all the listed requirements, and all the regulated values used in practice have significant disadvantages. This makes it relevant to search for new parameters that meet the listed requirements and have fewer disadvantages compared to known parameters. A suitable option may be multi-parameter diagnostics, in which rational effects on the WEDM process are carried out based on the analysis of several informative parameters.
The IEG value is considered the main one today since the quality indicators of WEDM largely depend on it [10,11,12]. IEG determines the space in which the phenomena that cause electrical erosion occur. A slight increase in the gap can change the breakdown conditions and even stop them completely. A decrease in the gap leads to a deterioration in the evacuation of the generated sludge, localization of discharges, electrode slagging, short circuits, and breaks in the wire electrode [10,11]. These phenomena reduce WEDM performance and degrade the quality of machined surfaces. The absence of high-quality automatic gap control on the machine significantly reduces the efficiency of WEDM processes [12,13]. The above indicates the need for research to find additional informative parameters to improve the management of WEDM processes.
Currently, the monitoring of WEDM processes relies on controlling electrical parameters in the discharge pulse generation circuit. The use of additional parameters that make it possible to find more rational effects on IEG is complicated by the specifics of WEDM, which takes place in an area with a volume of less than 10−4 mm3 immersed in the working fluid. Of all the existing diagnostic parameters, except for electrical ones, acoustic emission (AE) signals are practically the only ones that are available for monitoring and visualization of WEDM processes [5,17,18]. The study of the relationships of AE parameters with the most critical characteristics of WEDM processes is a complex scientific task, and this was the research subject of this article.

2. Materials and Methods

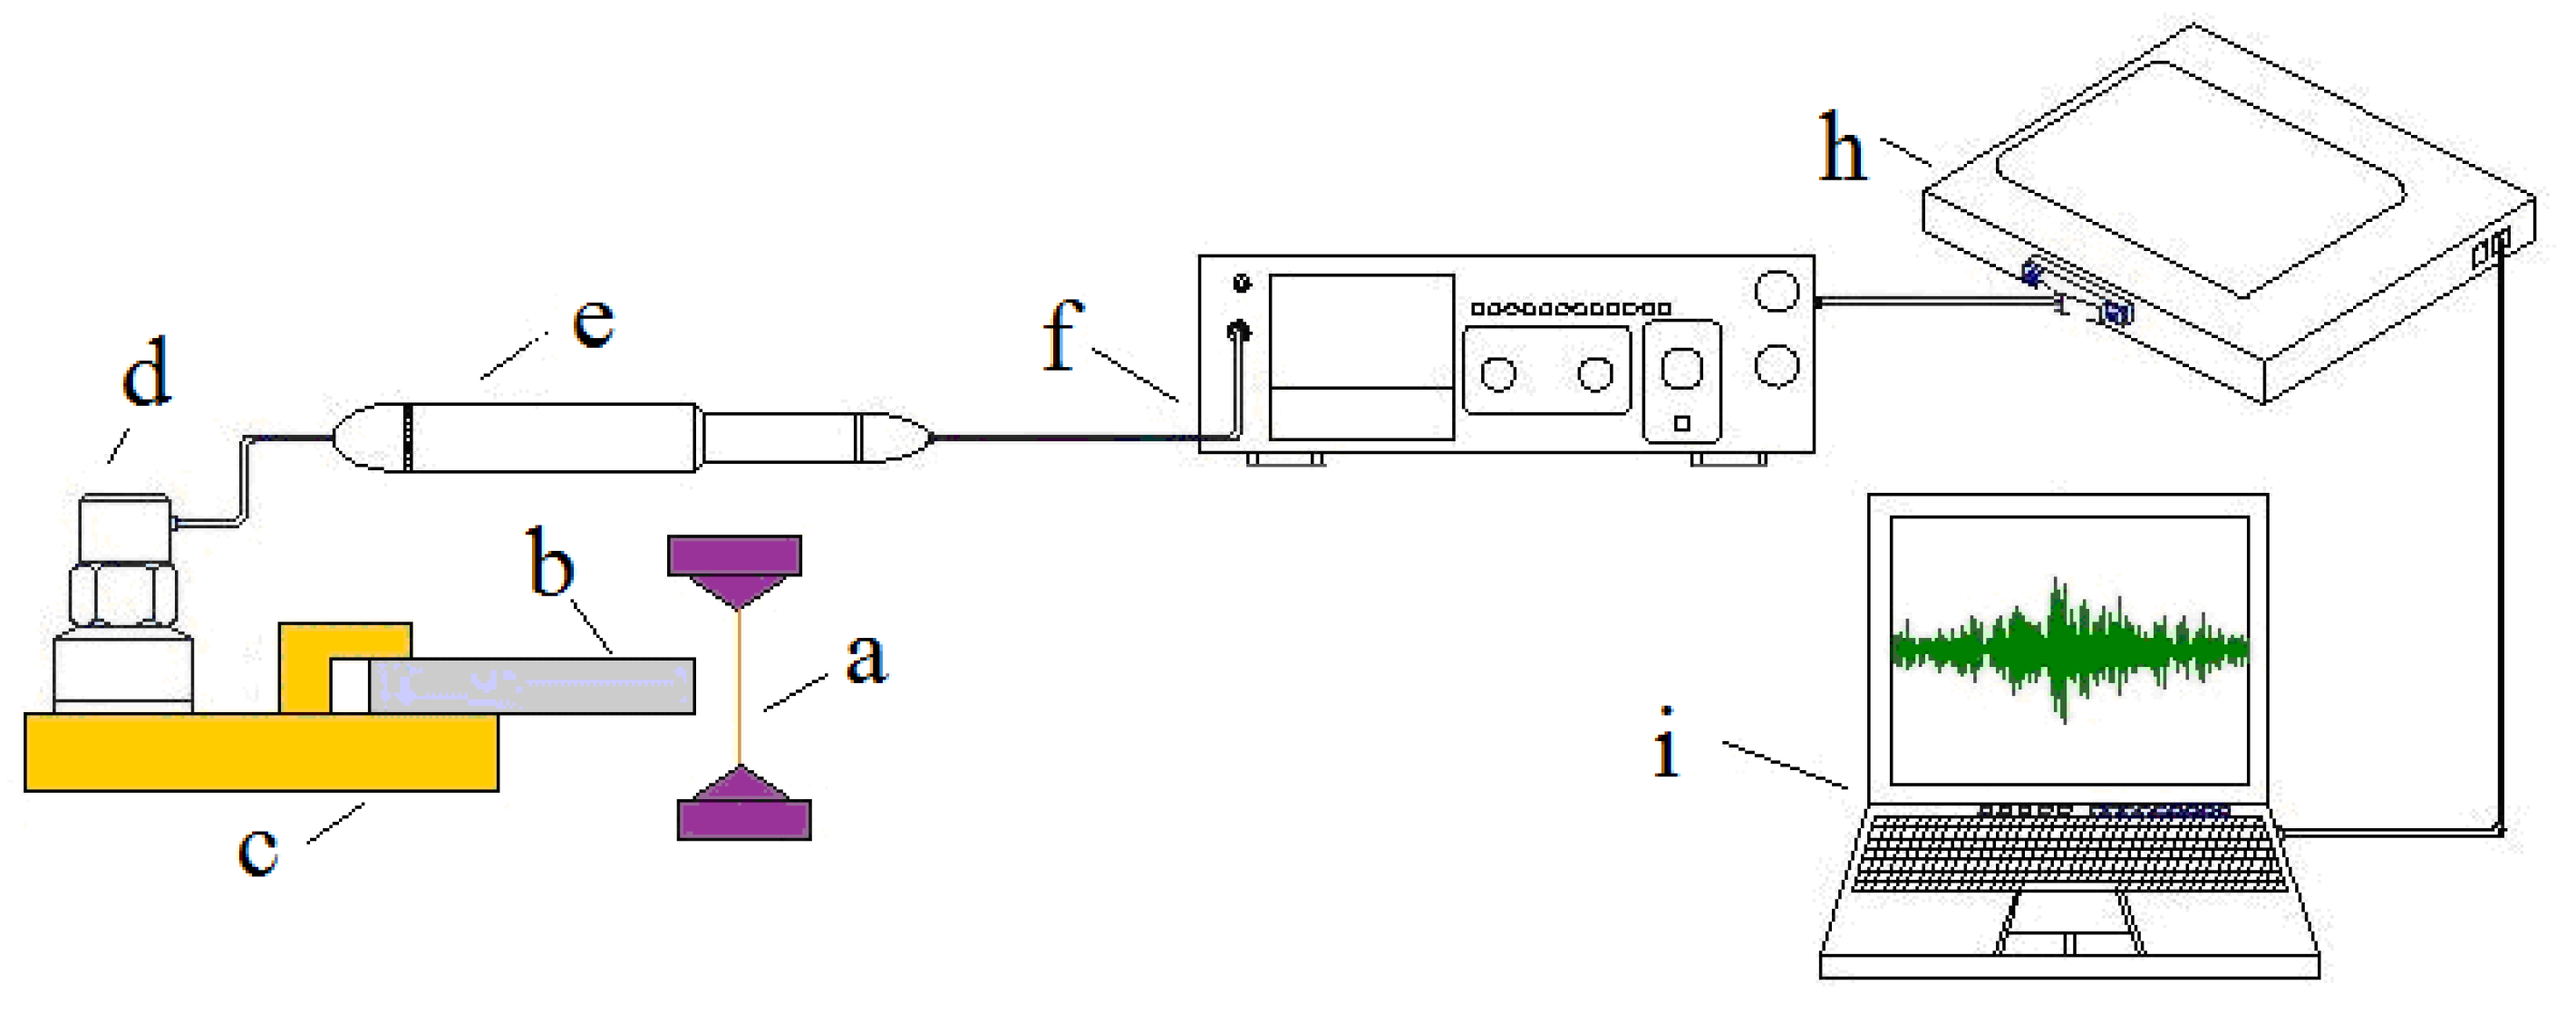
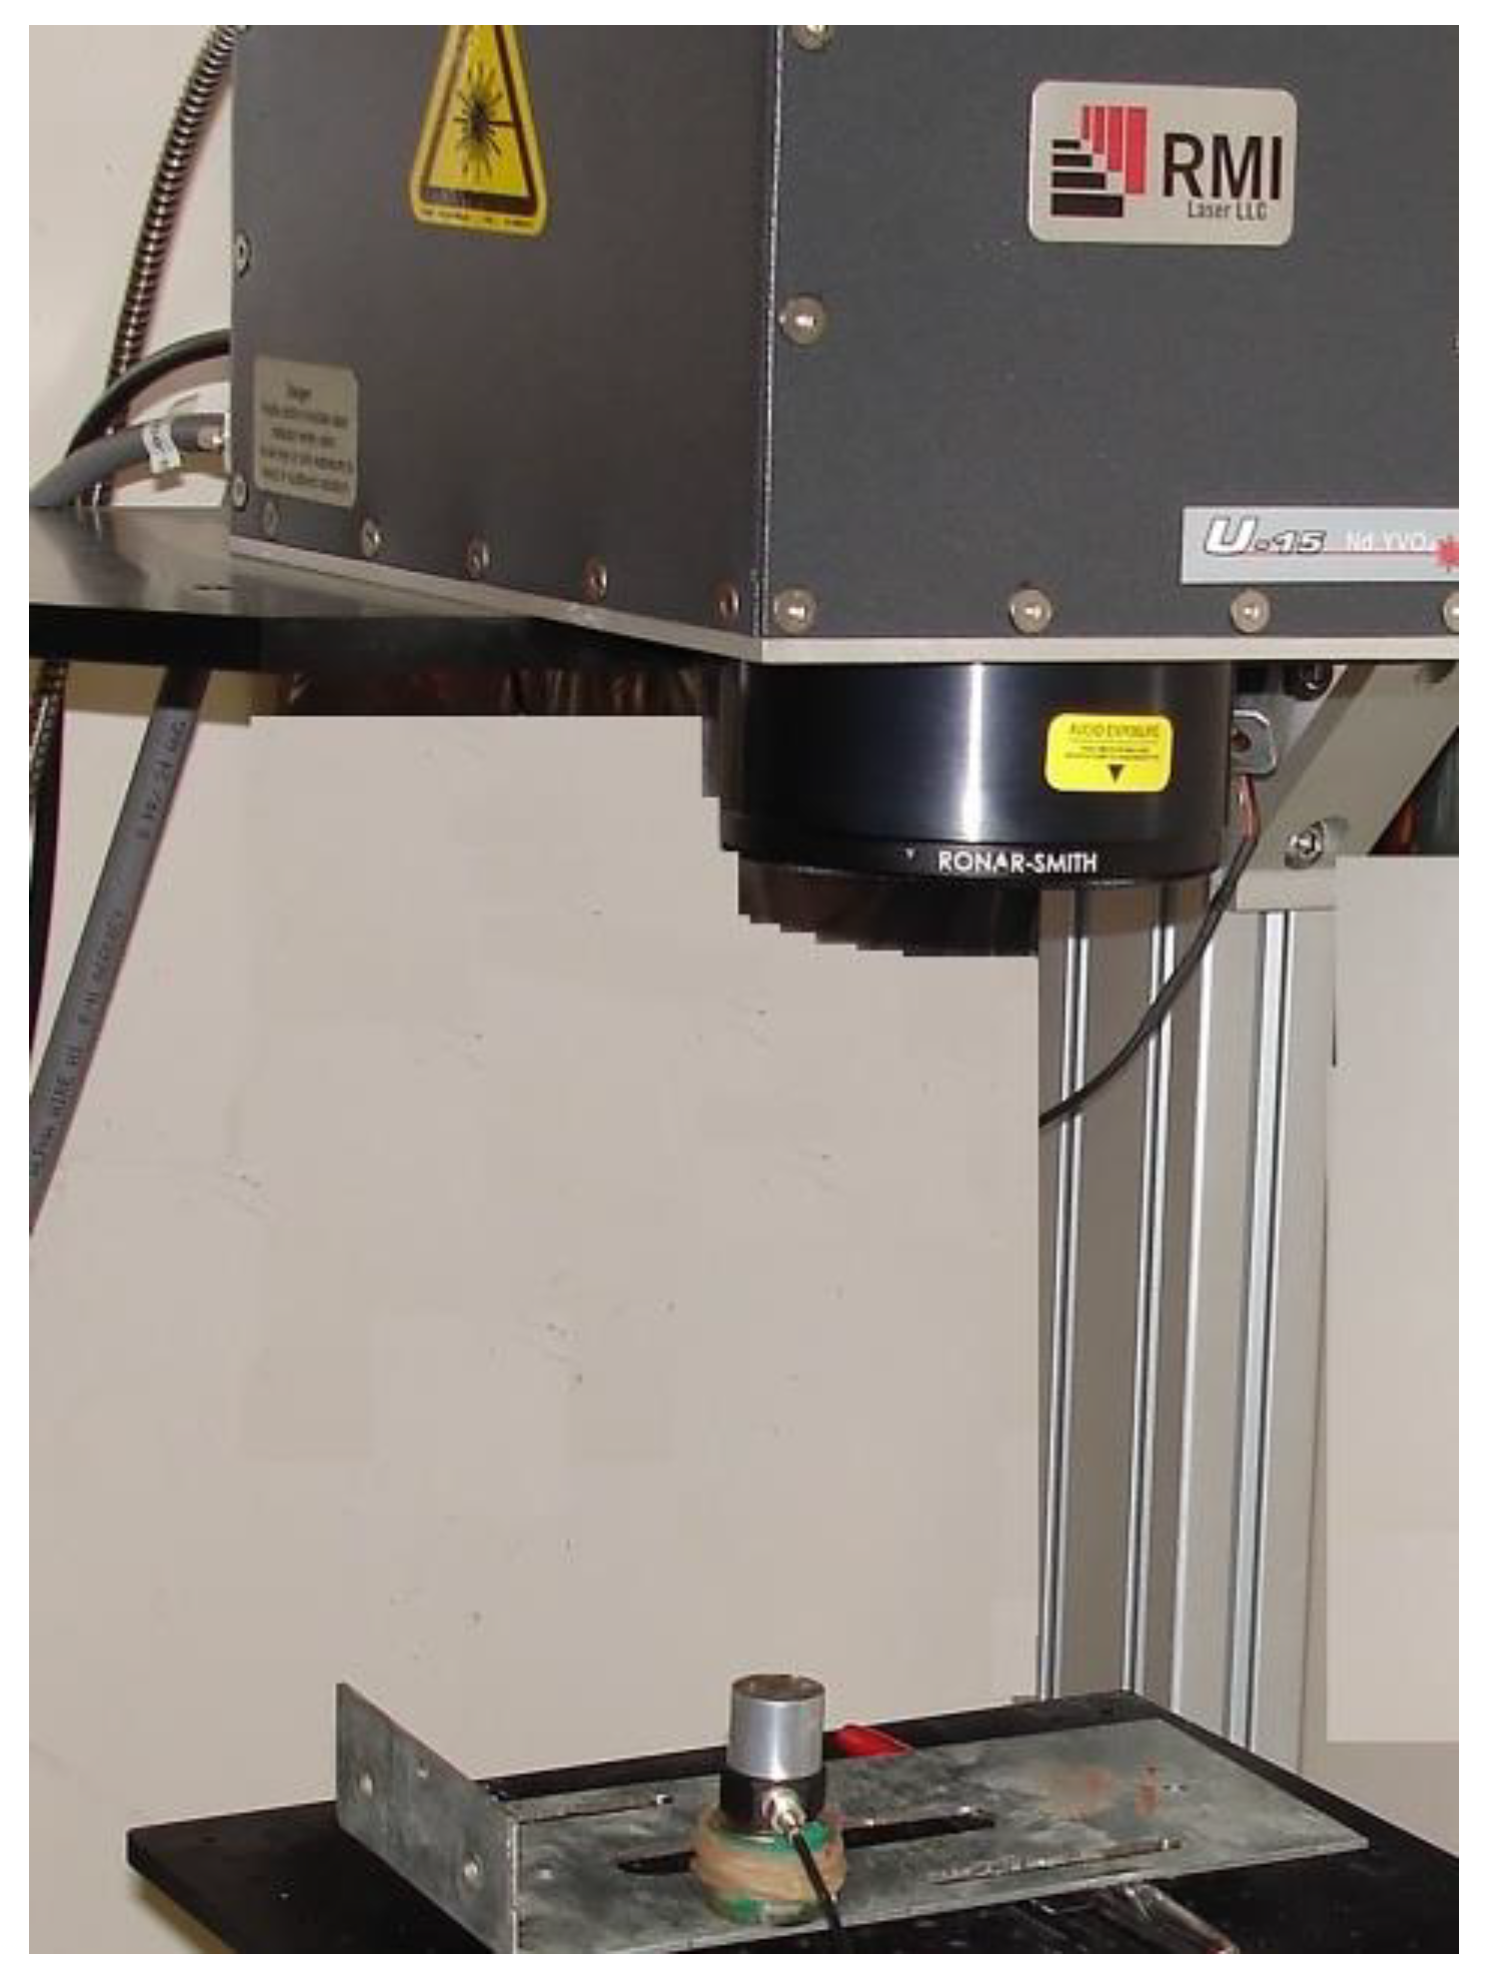
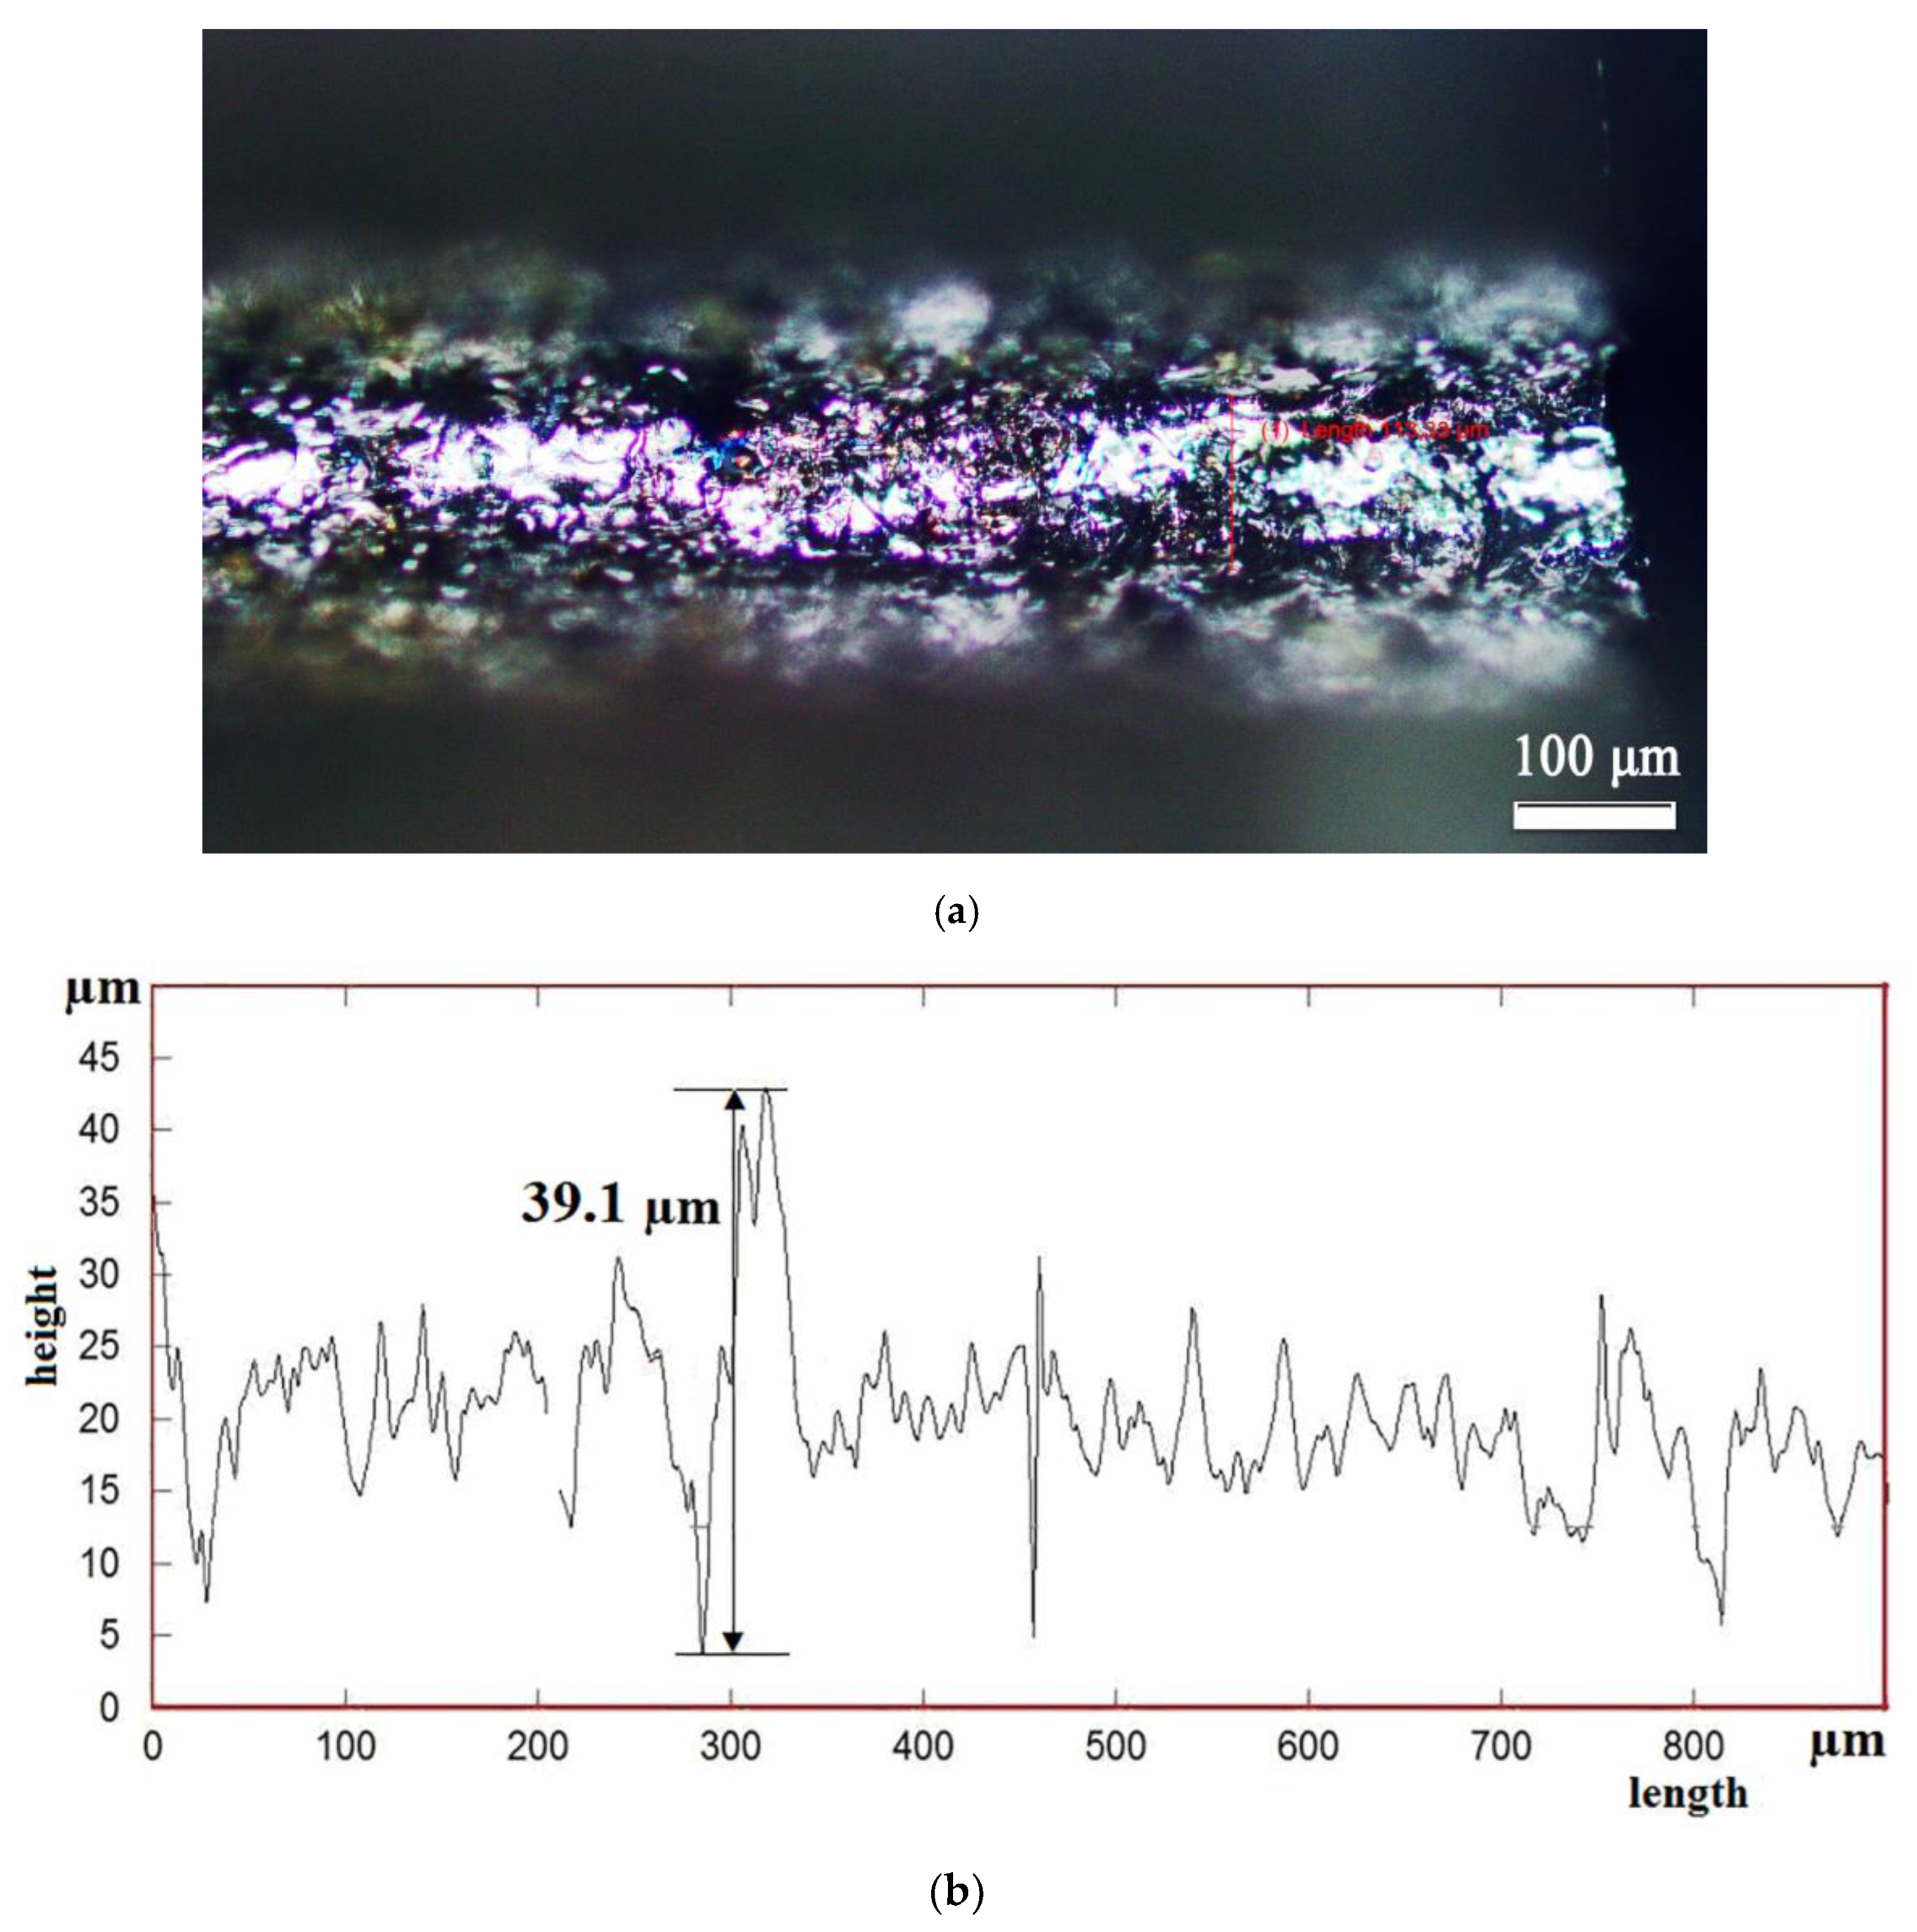
2.1. Equipment and Materials for Experimental Research

The experiments were conducted on a CUT1000 WEDM machine (GF Agie Charmilles, Basel, Switzerland). Brass wire CuZn35 with a diameter of 0.25 mm was used as a tool electrode, and deionized water was used as a dielectric medium. The processed materials were workpieces made of carbides of refractory metals W, Ti, and Ta with a metal binder of Co obtained via sintering. Information about the chemical composition and physical and mechanical properties of the used hard alloys grades HG012 and HS123 (DIN standard) is presented in Table 1 and Table 2. The processing modes in all experiments were set the same: the frequency of the applied pulses was 5 kHz; duty cycle—14; root-mean-square voltage and current on the monitor were 7 V and 0.4 A, respectively.
Figure 1 shows the composition of the equipment for monitoring AE signals during WEDM of hard alloy workpieces, and Figure 2 shows a photograph of the processing area of the CUT 1000 machine with accelerometers installed.
Figure 2 shows that the accelerometers were installed on the machine table at an additional elevation. This made it possible to keep the accelerometer and its cable dry after the treatment area was immersed in the working fluid. At the initial stage of the research, accelerometers were installed in different directions to select the best position in terms of channel sensitivity. It was found that in the frequency range of up to 50 kHz, the direction of the accelerometer axis is of no fundamental importance. To monitor the discharge current, a current sensor (electric clamps) using the Hall effect was installed on the voltage supply cable to the processing area.
A pulsed laser was additionally used to simulate and monitor the discharge localization process in the experiments. Laser processing and WEDM are technologies that use concentrated energy flows with high power density to influence the workpiece, which determines the general properties of AE signals. In experiments with a laser, a pulsed solid-state diode-pumped laser model U15 (RMI Laser LLC, Lafayette, CO, USA) was used as a radiation source. Figure 3 shows a general view of the U15 laser with a workpiece and an accelerometer attached to the workpiece with a magnet.

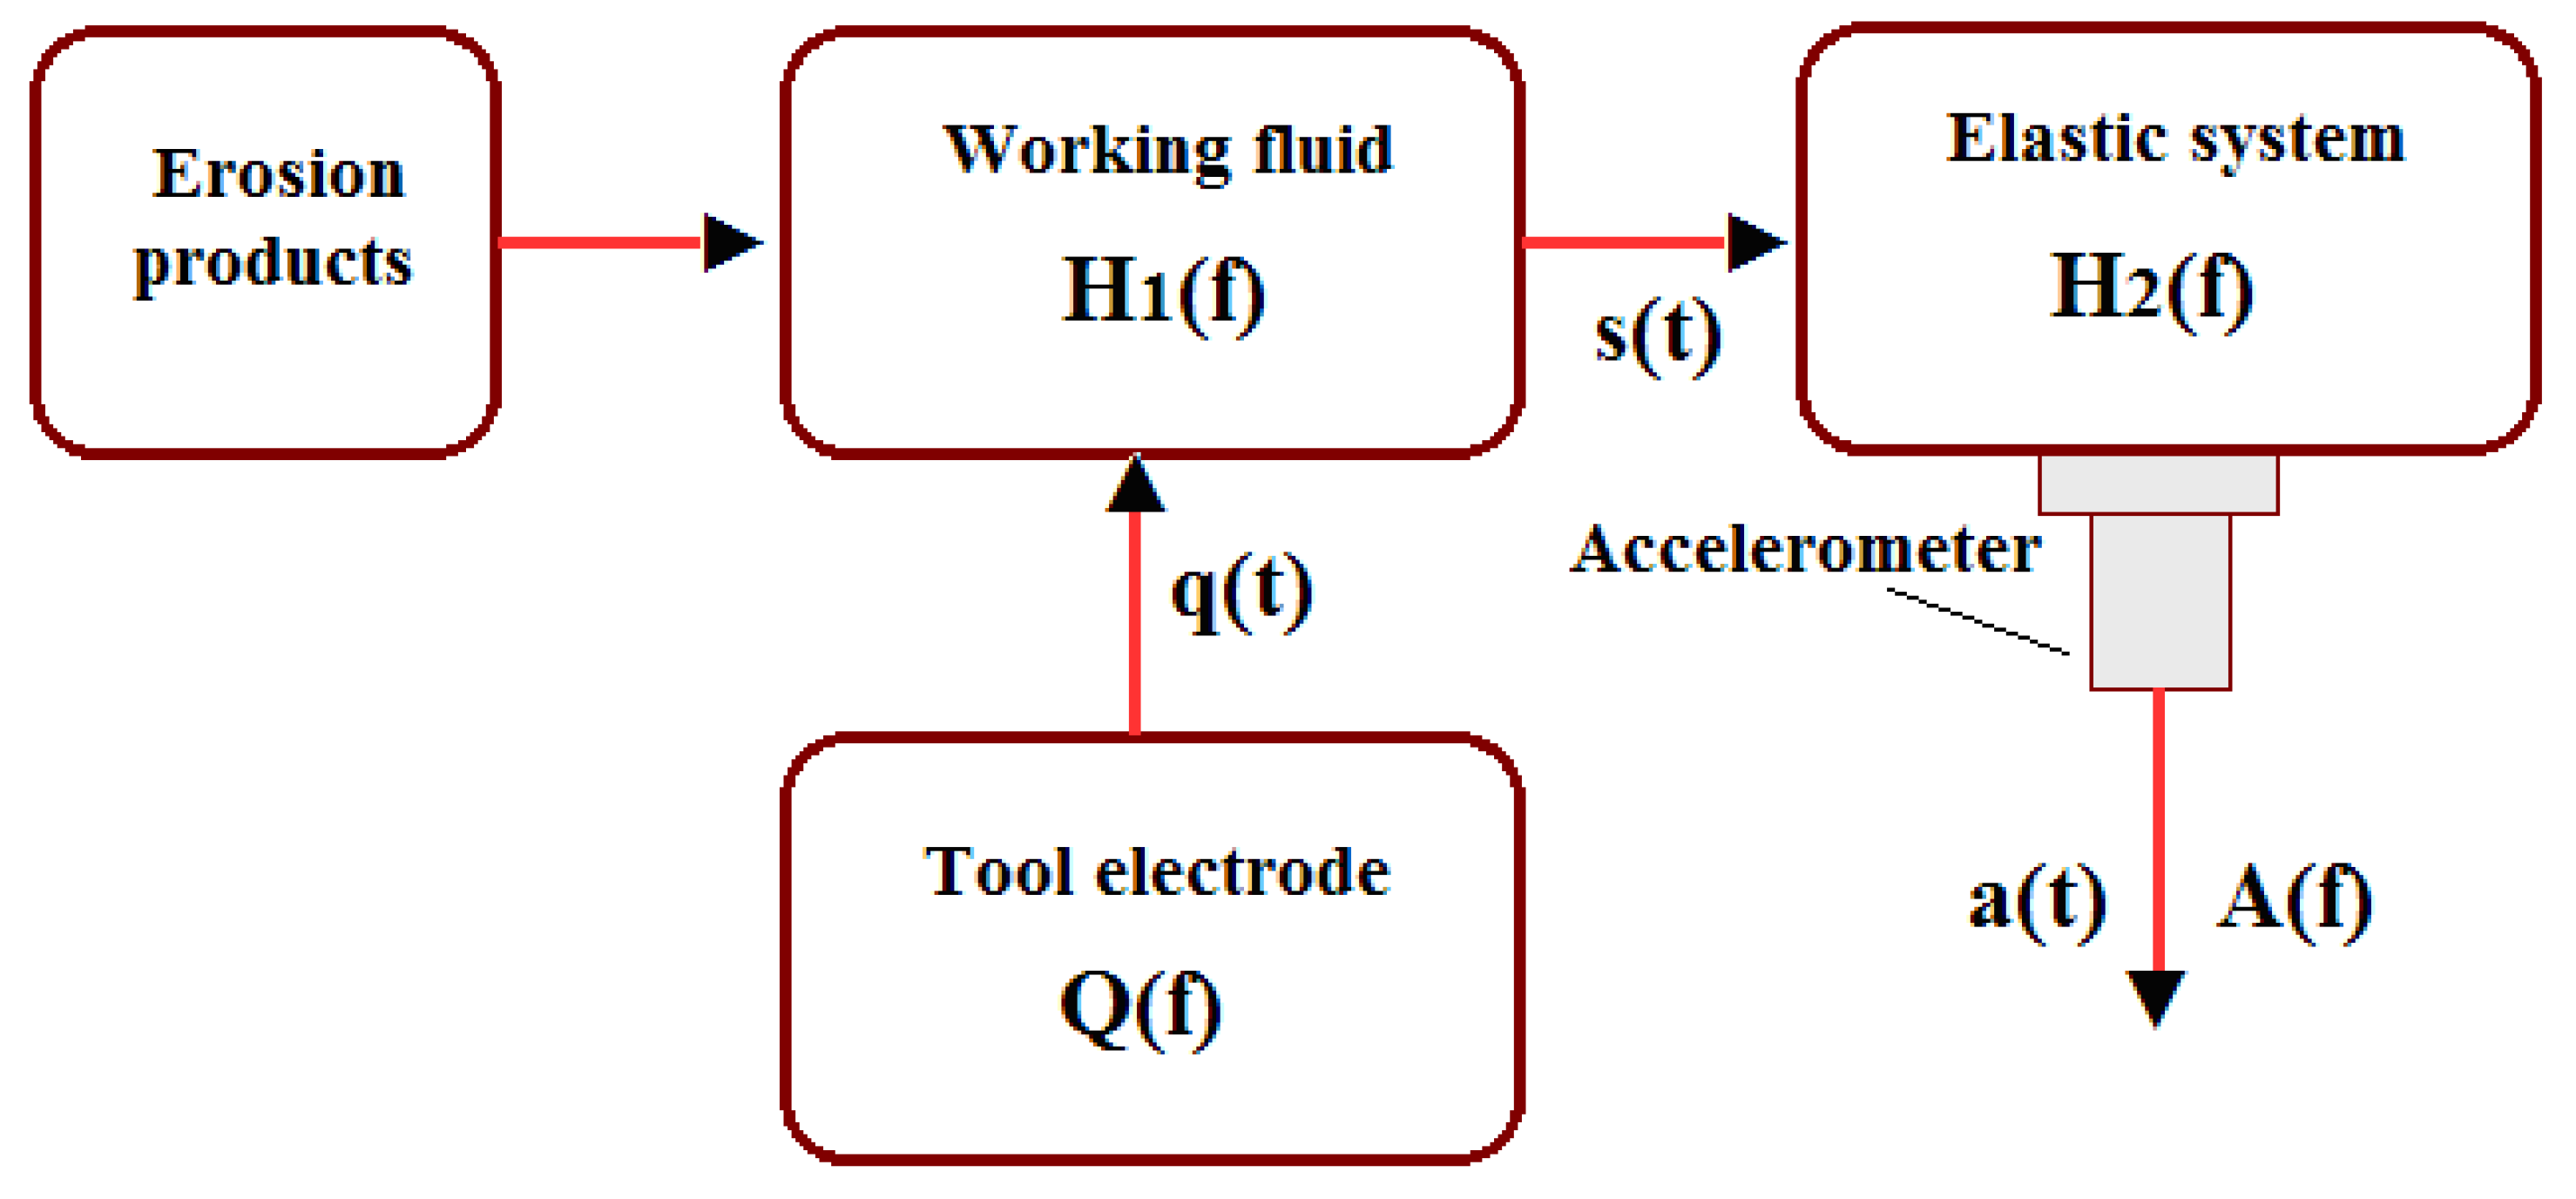
2.2. Dynamic Model of the WEDM Process

Although WEDM is considered a non-contact process, the level of AE signals on the machine table surface is commensurate with similar signals received, for example, on the lathe support stand during finishing. The dynamic characteristics of the machining process are determined by the mutual influence of the elastic system of the machine and the cutting process. This influence significantly complicates acoustic phenomena during cutting, in particular, defines the dynamic system of the cutting process as nonlinear, which can lead to the appearance of intense self-oscillations that change the nature of the force interaction of the tool and the part, the quality of the resulting surface and the wear rate of the cutting tool [19,20,21,22,23,24]. Unlike traditional mechanical processing, a dynamic system with WEDM can be considered open when the impact of the machining process does not change the dynamic characteristics of the elastic system. Due to the absence of direct contact between the part and the tool electrode, there is no additional friction on the surfaces and the dissipative properties of the elastic system do not change [19,22,25,26,27,28]. The workpiece is affected by flows of electrons and neutral particles, and the electrode is affected by ion flows, which have a disturbing effect on their elastic systems, causing forced oscillations and oscillations at natural frequencies in a wide frequency range. Figure 4 shows a diagram of the dynamic system of the WEDM process when installing the recording accelerometer on the elastic system from the part side.
Electric pulses consisting of electron beams coming from the tool electrode act on the part’s surface, having previously passed through the medium of the working fluid with the formation of the corresponding discharge channels. The dynamic characteristics of the working fluid change as the concentration of erosion products changes, as do the gas composition, temperature, and distance between the electrodes. Not only the weight fraction of erosion products is essential, but the size of the particles themselves that make up these products is also fundamental [9,10,11,12]. This determines the rate of their removal from the treatment area and the electrical strength of the working fluid. Since changing the characteristics of the working fluid during WEDM in many respects retains the features of a random process, the formation of the amplitude-frequency characteristic (AFC) of the working fluid H1(f) can be mainly considered a random process.
The pulses that have passed through the working medium with AFC H1(f) and transformed in it (in Figure 4—process s(t)), have a dynamic effect on the elastic system, which has its dynamic characteristic with AFC H2(f). The accelerometer, installed on the side of the part, perceives vibrations (in Figure 4—process a(t)), which result from the impact of pulse flows transformed by the working medium and the elastic system of the part. The amplitude spectrum A(f) of the signal a(t) perceived by the accelerometer is determined as in Expression (1):
A(f) = H1(f) H2(f) Q(f)
The characteristic H2(f), in contrast to H1(f), can only change when the configuration of the workpieces changes. When processing one workpiece, the dynamic characteristics can change due to a change in the area of action of the discharge pulses. However, these changes occur very slowly due to the slow processing rate. Thus, on sufficiently long time intervals, H2(f) can be considered unchanged. Experiments show that variations in H2(f), even when processing thin-walled workpieces are negligible compared to changes occurring in critical situations, such as short circuits, the unacceptable concentration of erosion products, localization of discharges, etc.
It is not possible to obtain separately the characteristics of H1(f) and H2(f). It is possible to obtain only the general characteristic H(f) = H1(f) H2(f), which is the general AFC of the dynamical system (Figure 4). Knowing the amplitude spectra of the input and output signals, it is possible to construct H(f) according to Expression (2):
H(f) = A(f)/Q(f)
The characteristic H(f) may change during the WEDM process, however these changes come at the expense of changes in H1(f), i.e., due to changes in IEG values. The process of working impact on the workpiece s(t) can be represented in a simplified form of short power pulses. However, it should be understood that in reality, the electron flow causes an abrupt heating of the local volume of the workpiece material. This leads to an abrupt change in stresses and volume in the local area and creates a wave of elastic stresses propagating through the elements of the equipment. The instantaneous evaporation of a part of the substance and the ejection of the liquid phase into the working fluid cause reactionary recoil, affecting the elastic system. Abrupt heating and cooling cause some other phenomena that create wave processes in an elastic system. These are the formation of cracks and plastic deformations, structural and phase rearrangement of matter, intergranular friction, etc. It is difficult to determine the share of acoustic energy from each process, but their total activity increases with the volume of removed material [29,30,31].

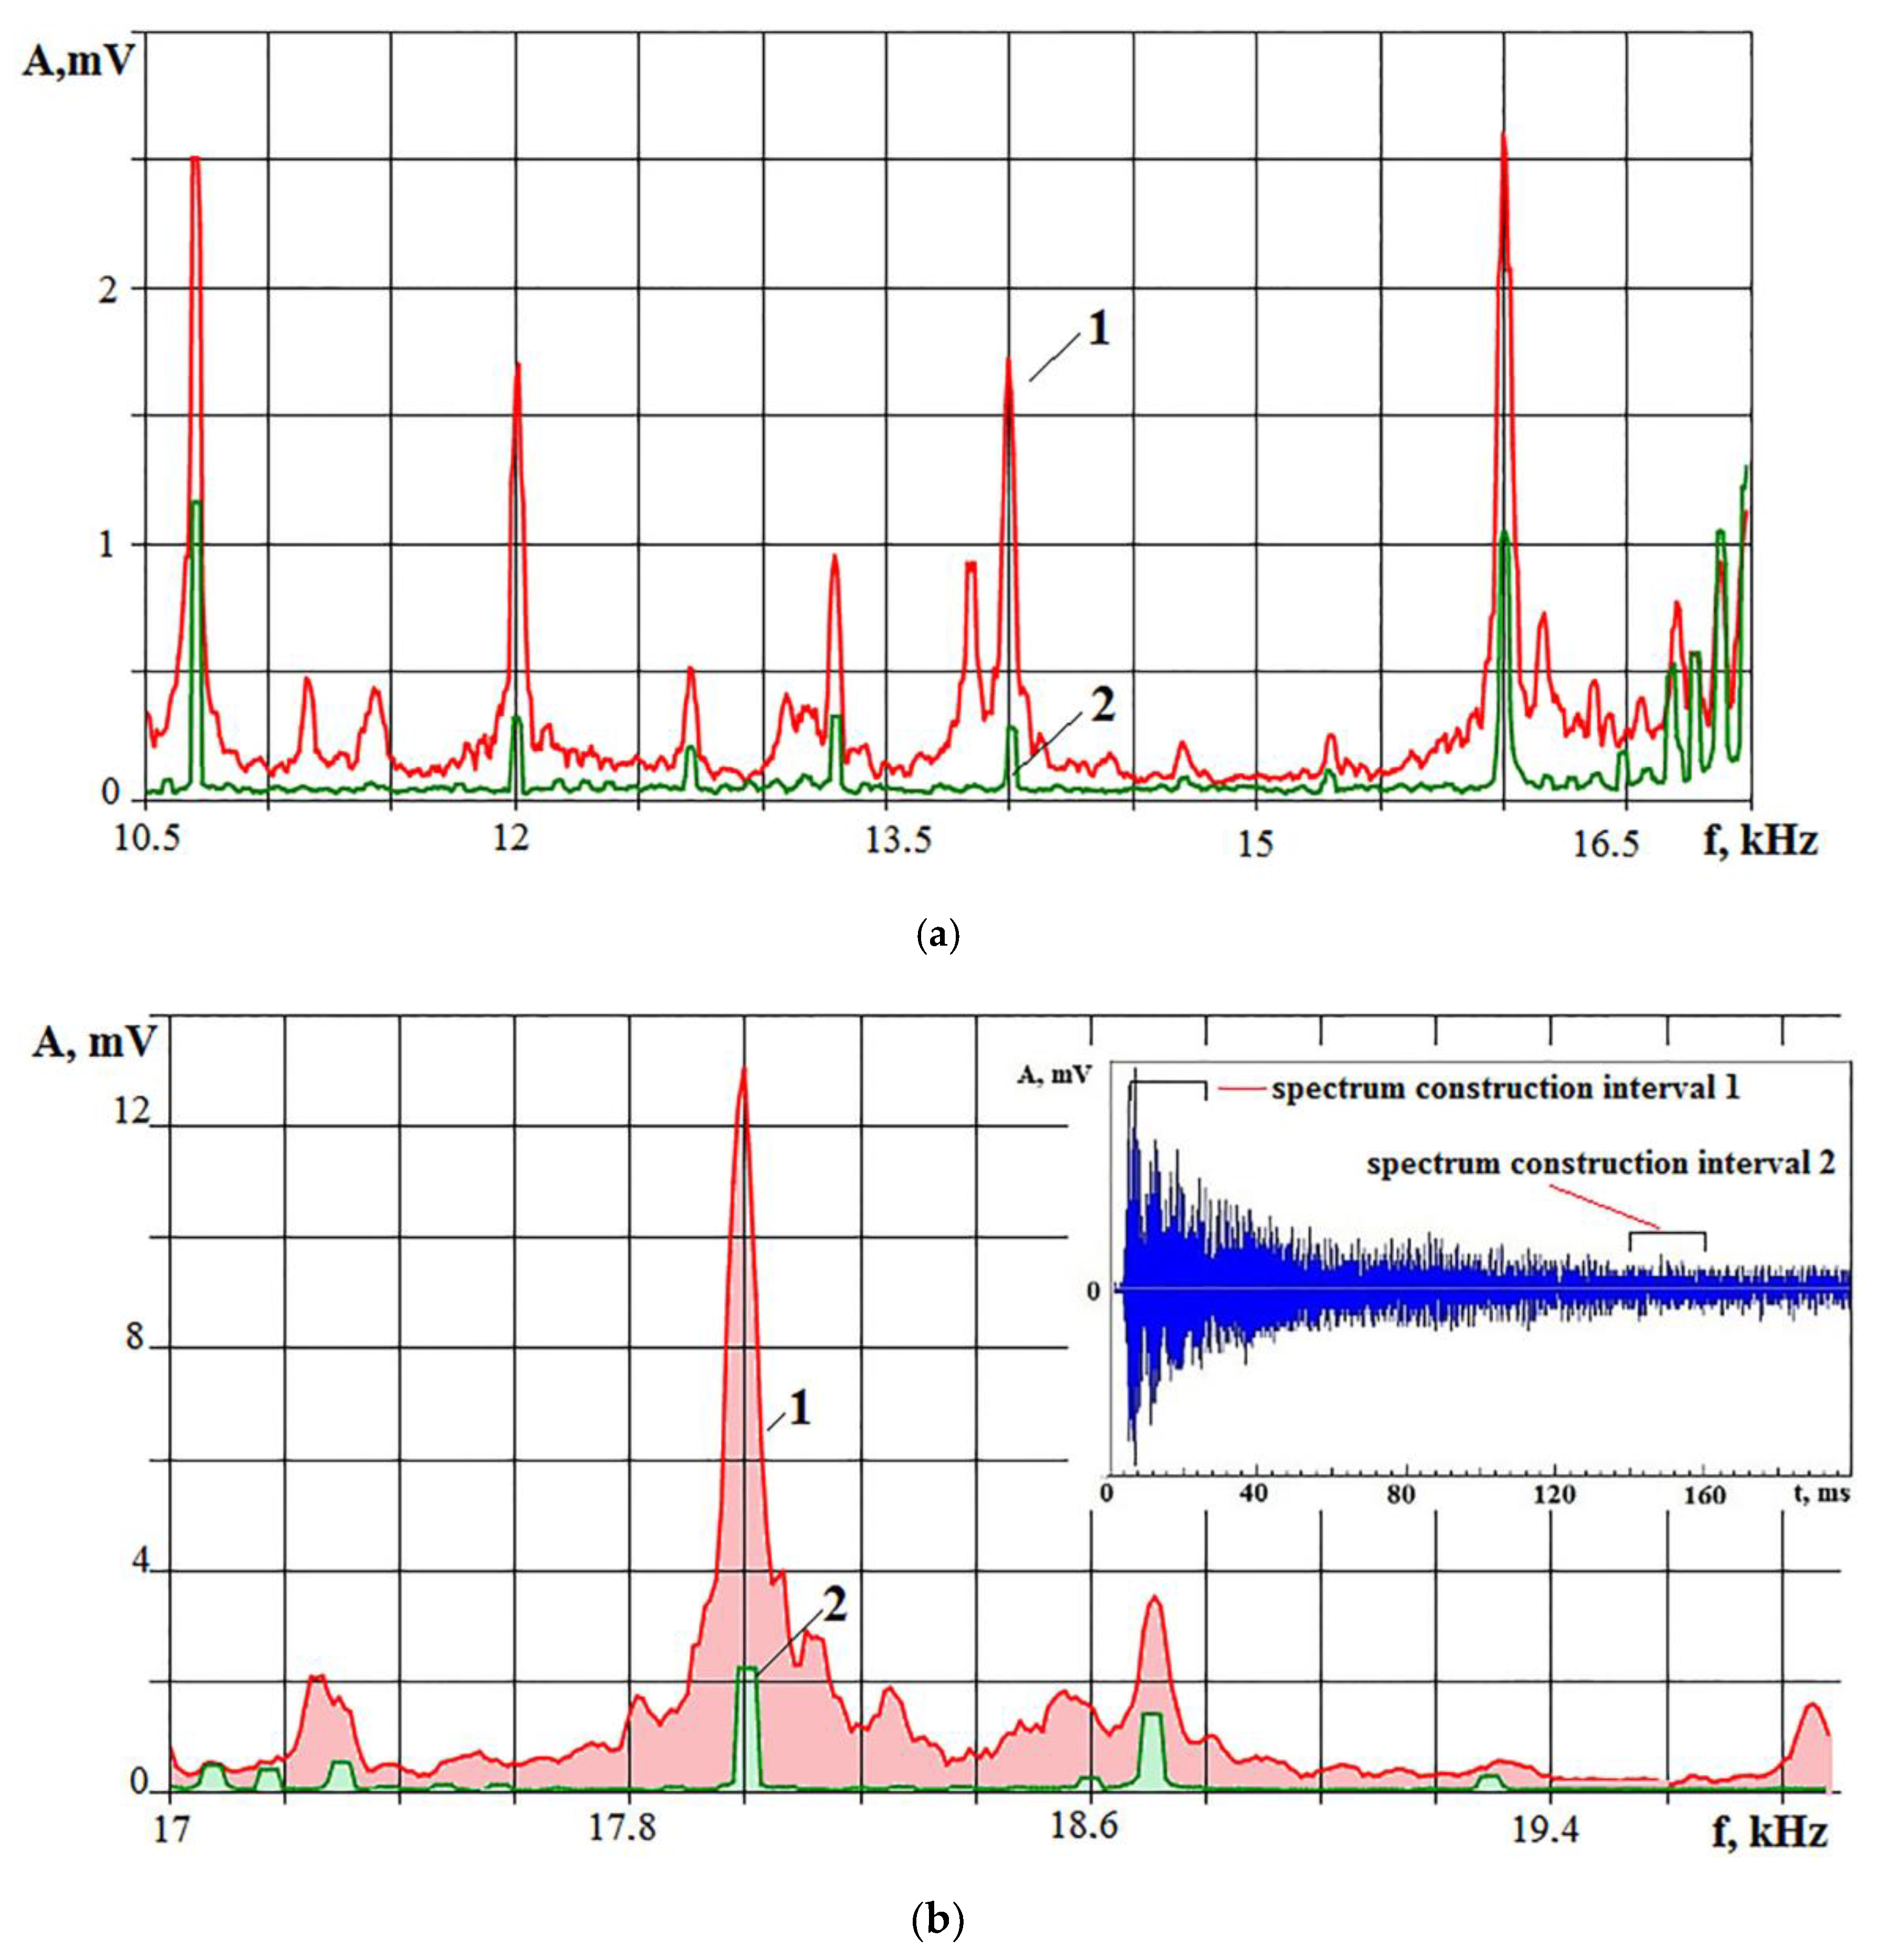
2.3. Estimation of the Information Content of the Amplitude-Frequency Characteristics (AFC) during WEDM

To construct the AFC, the discharge current signal q(t) and its amplitude spectrum Q(f) are considered as input signals. The output signal of the accelerometer a(t) and its spectrum A(f) are used as an output signal. Following Expression (2), it is possible to obtain a general characteristic of the observation channel H(f). Since the amplitudes of the input and output signals were fixed in mV units, AFC H(f) is a dimensionless quantity (mV/mV). Value H(f) for any frequency characterizes the transmission (gain) coefficient Kp for a given frequency or frequency range. It displays the efficiency of the discharge current to the processes of material destruction in a given frequency range. In [26,27], it was shown that the amplitude of AE signals monotonically increases with increasing WEDM performance. Figure 5 shows the dependences of the root-mean-square (RMS) of the AE signal amplitude range of 30–40 kHz on the volume of the removed material V and the depth of the hole L in 30 s with WEDM on the Drill 20 AgieCharmilles piercing machine.
Figure 5 shows that RMS amplitude correlates closely with WEDM performance. However, when varying the three processing modes (Figure 5a), the spread of results is more significant than when only the set current values were varied (Figure 5b). It follows from these data that the amplitude of the AE signal in the high-frequency range is closely related to the destruction of the material, i.e., to performance. Since electric discharges can expend their energy not only on the destruction of the workpiece material but also on the destruction of erosion products, the role of acoustic monitoring increases significantly. If AFC control of the dynamic model allows one to track changes in the efficiency of the discharge current and the current state of the IEG, then this will provide the most critical information for managing the WEDM [10,11].
Figure 6 shows graphs of H(f) during the WEDM of HG012 and HS123 hard alloys (for each processed material, AFCs are shown at the initial stage of processing and before the wire electrode breaks).
In Figure 6, when comparing the AFC at the initial stage of processing and immediately before the wire electrode break, one can see a characteristic change in the initial form of the AFC compared to the moment of the electrode break. In both cases, before the wire breaks, the values of H(f) at high frequencies decrease noticeably, and even slightly increase at low frequencies. Figure 6a additionally shows an intermediate type of the AFC corresponding to the middle of the recording, where the drop in H(f) values at high frequencies is already noticeable. This indicates that the concentration of erosion products in the IEG increased, and a smaller amount of energy reaches the surface of the workpiece [10,11,25,26,32,33].
If AFC changes are controlled, then it is possible, based on information about the decrease in the transmission coefficient Kp in the high-frequency range before the electrode breaks, to change the processing modes or to carry out IEG relaxation.

3. Results

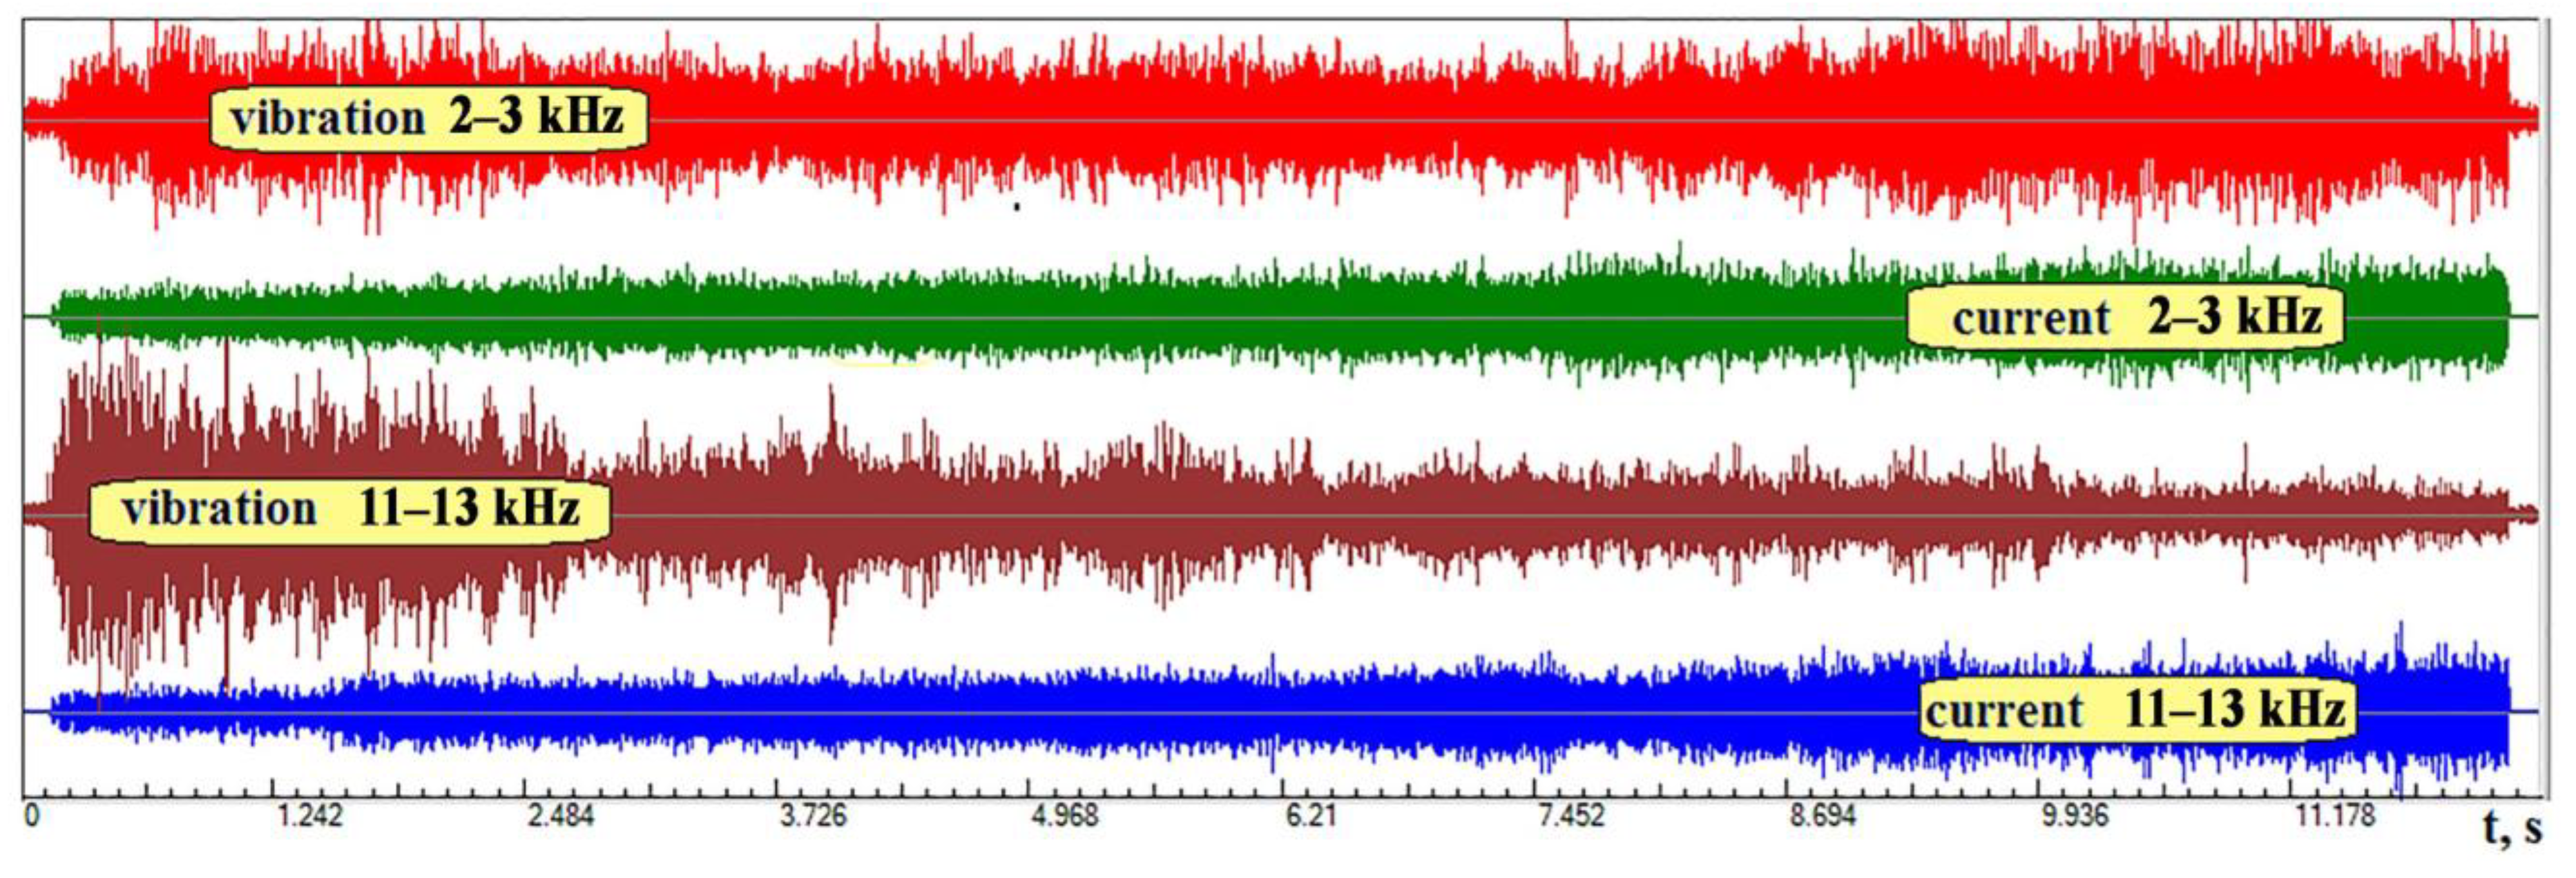
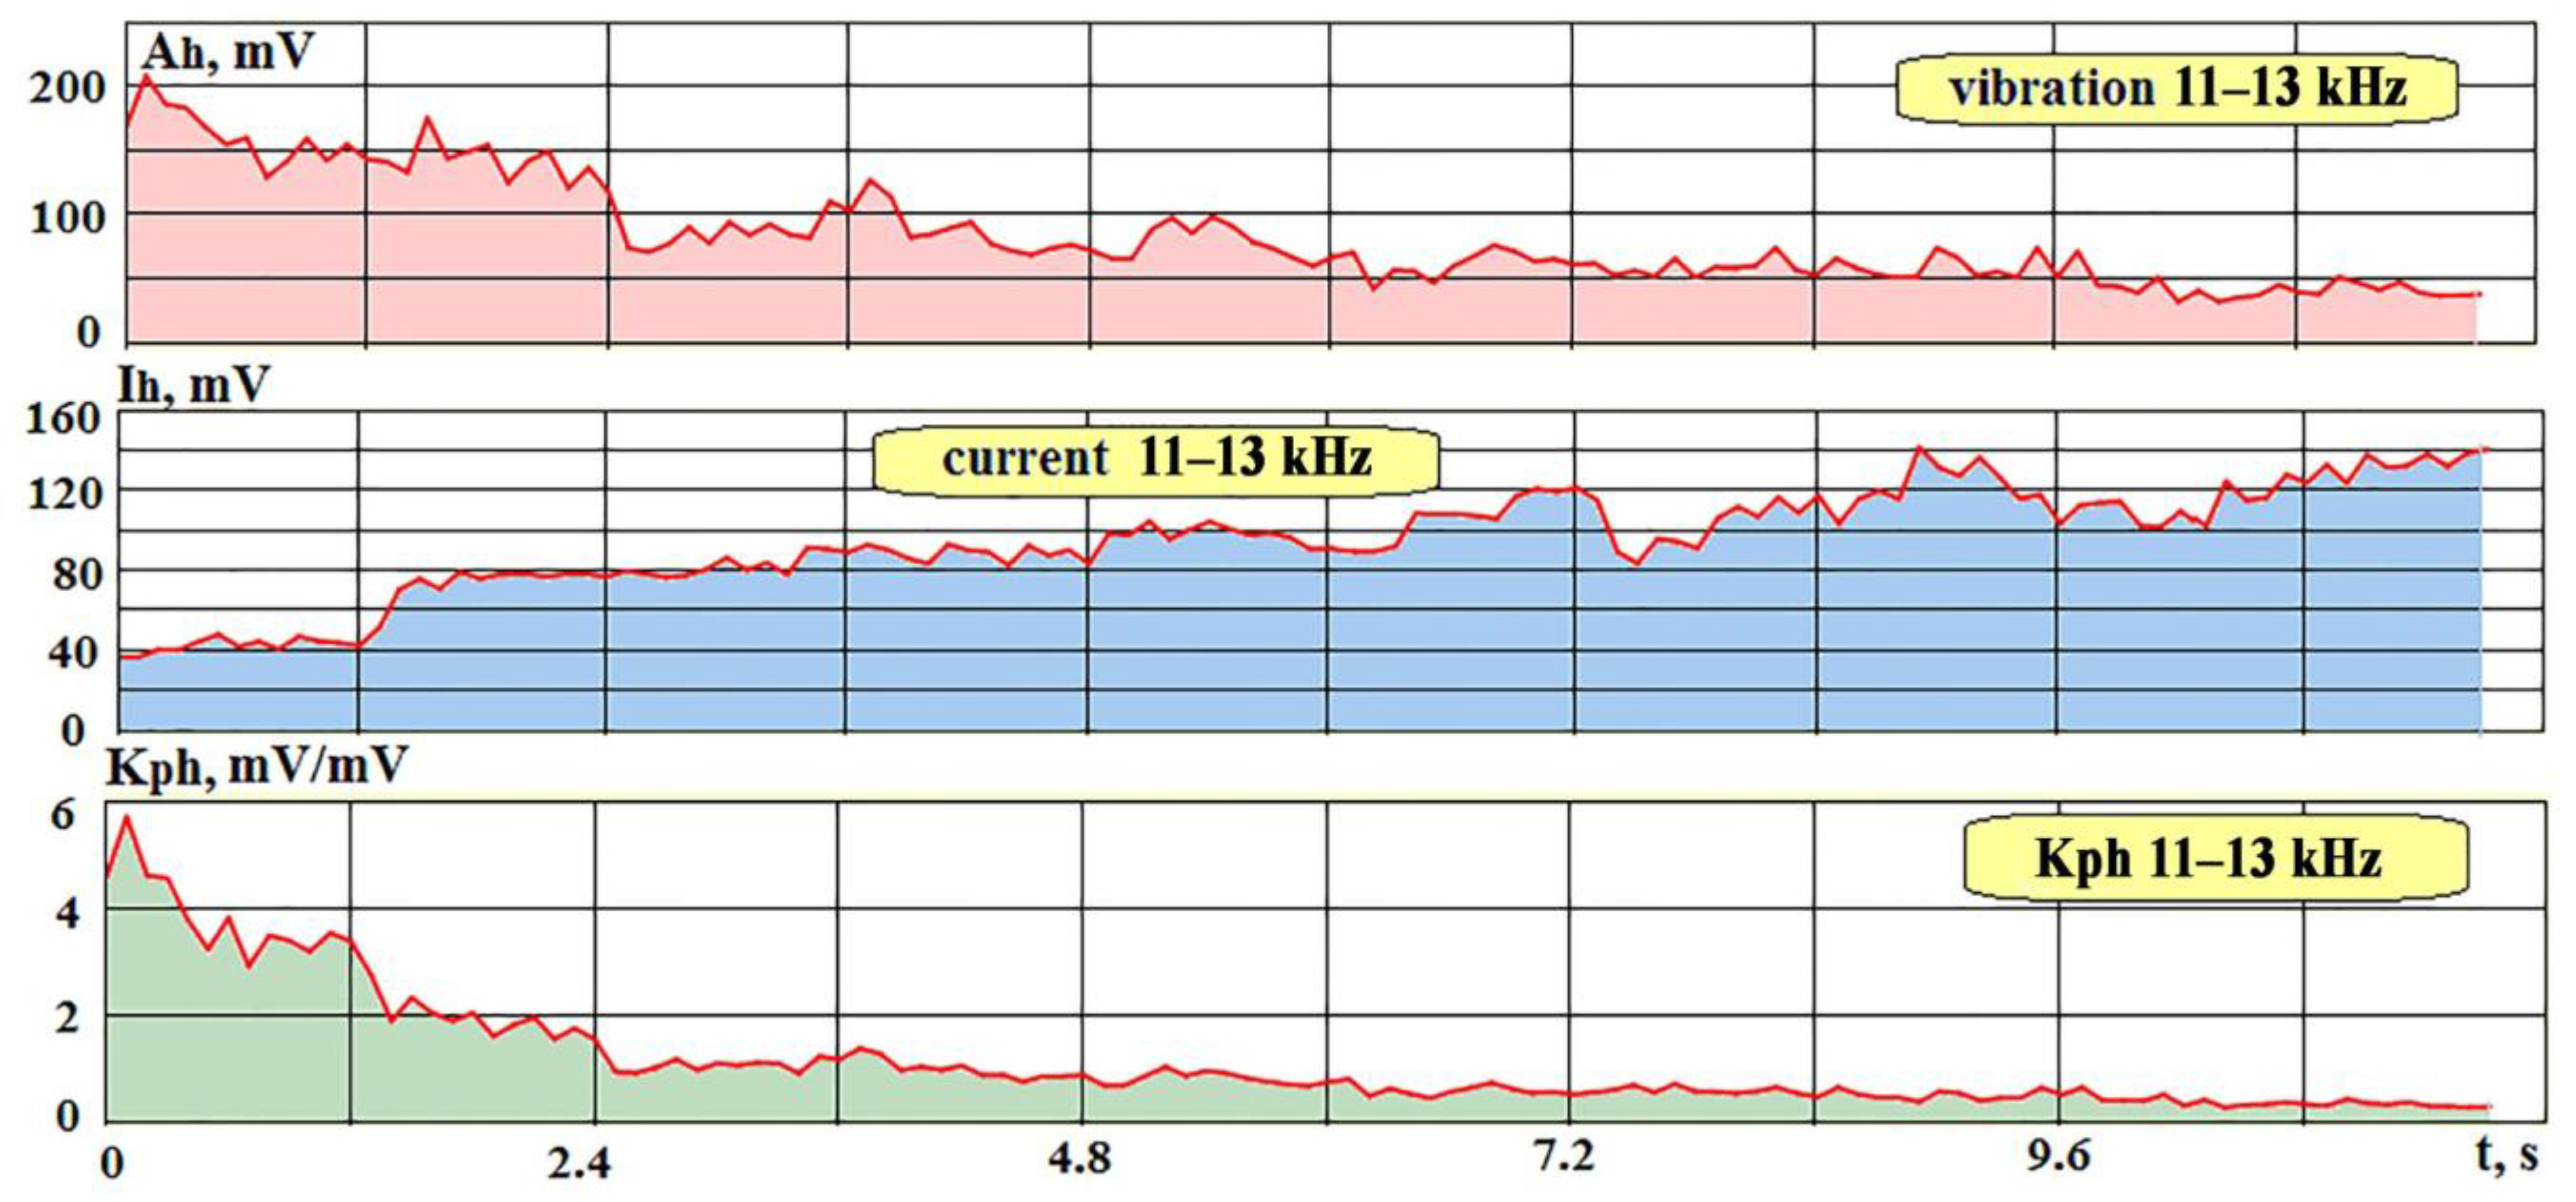
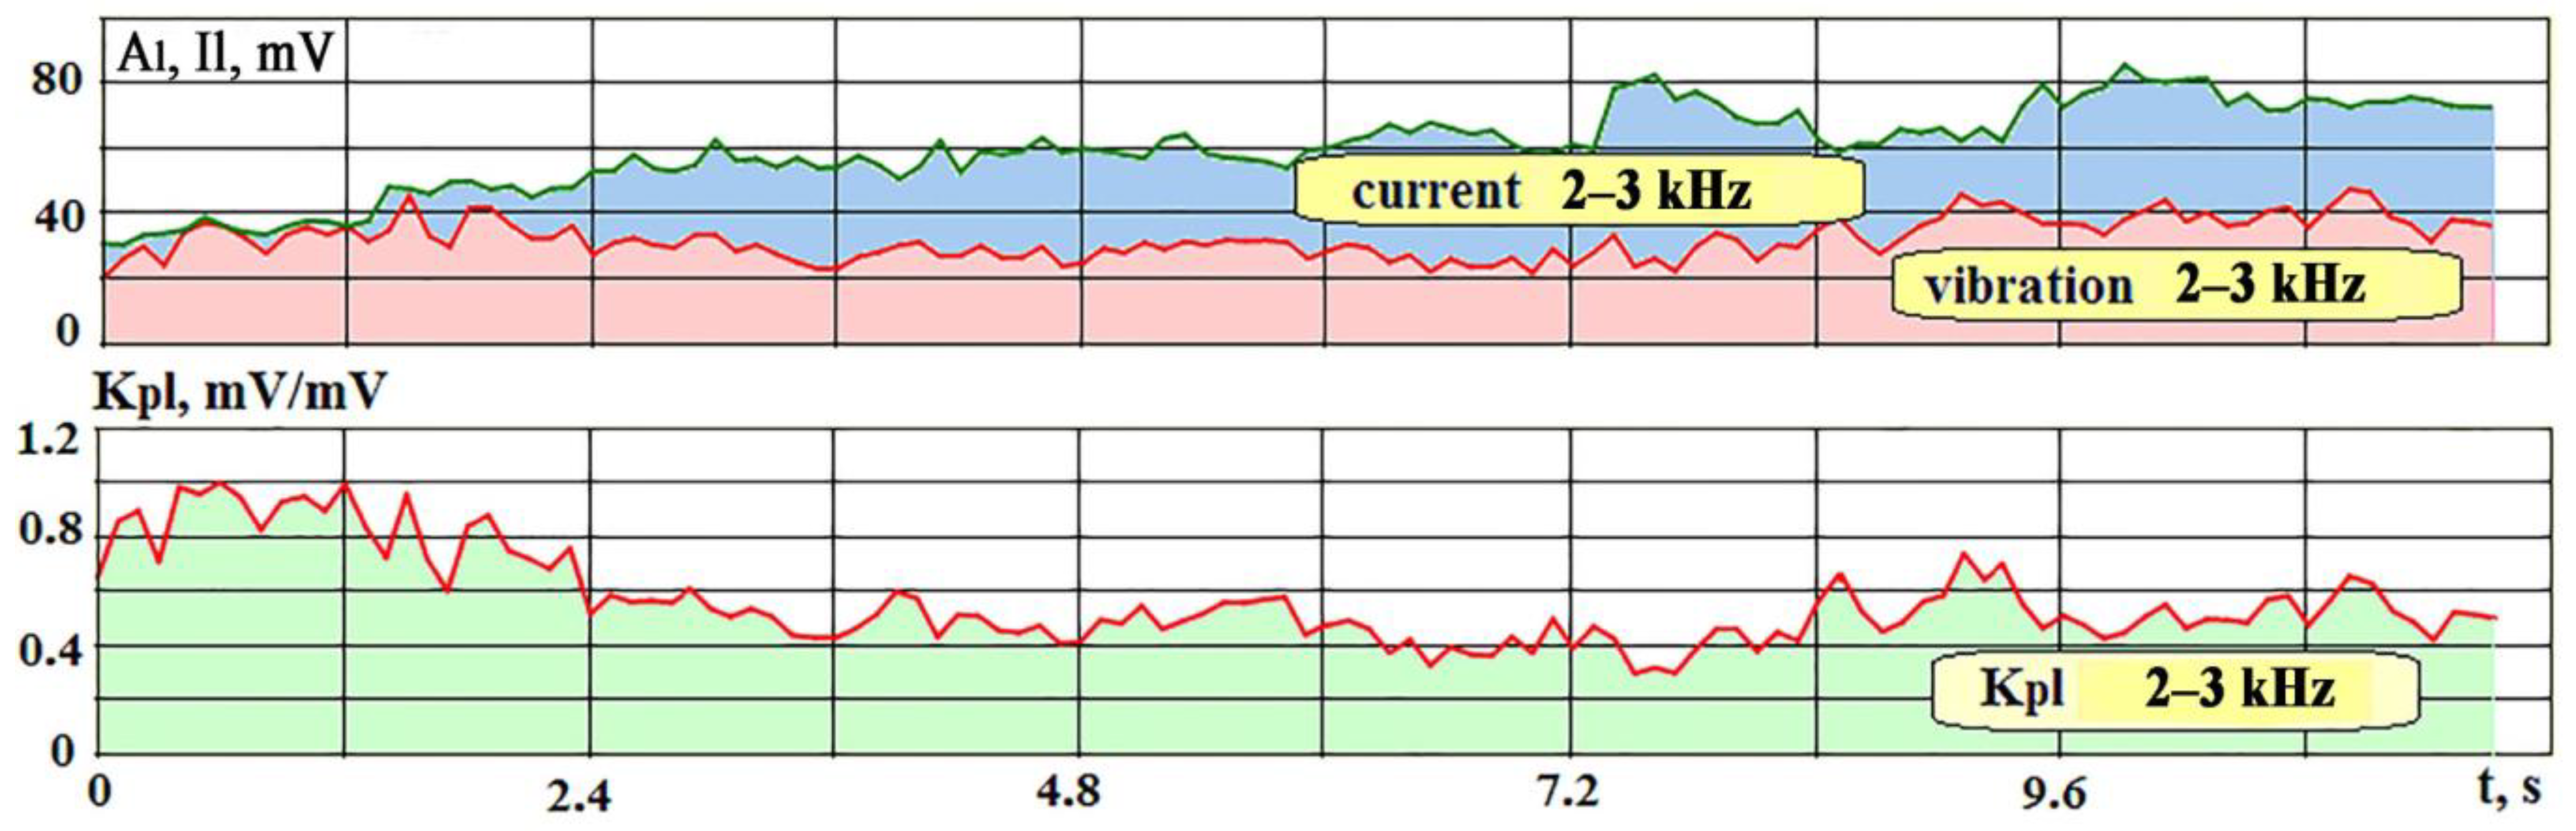
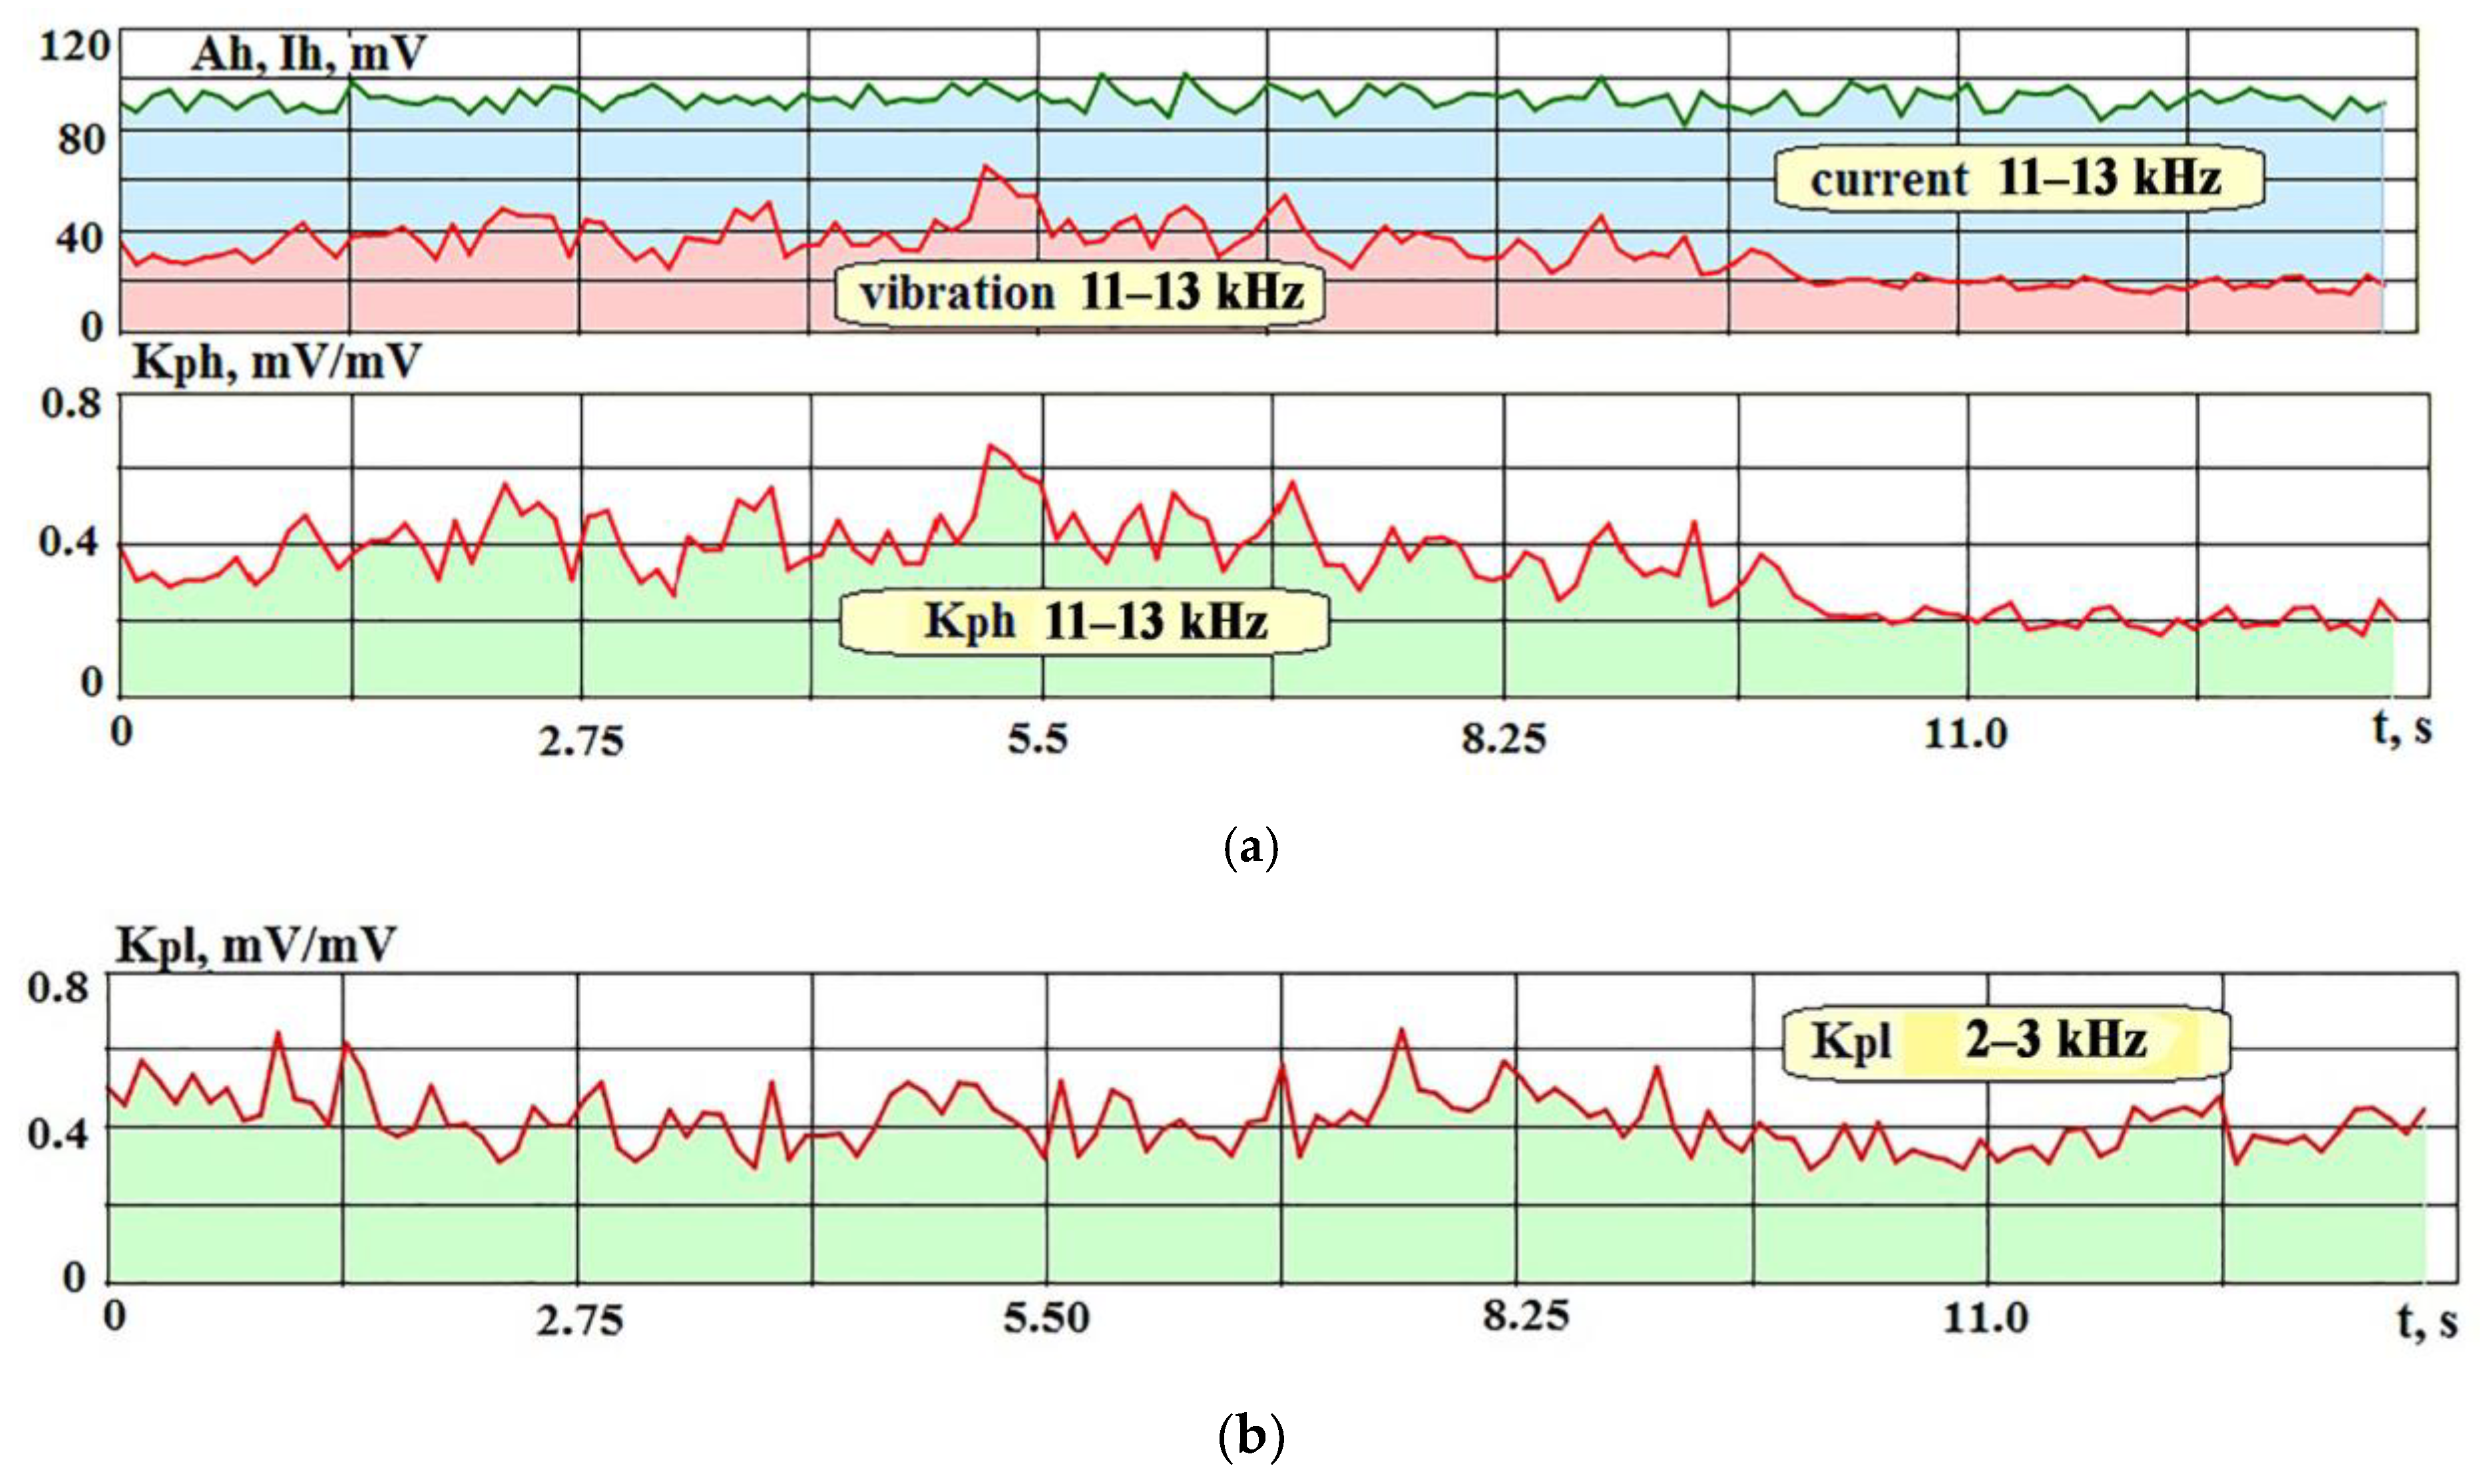
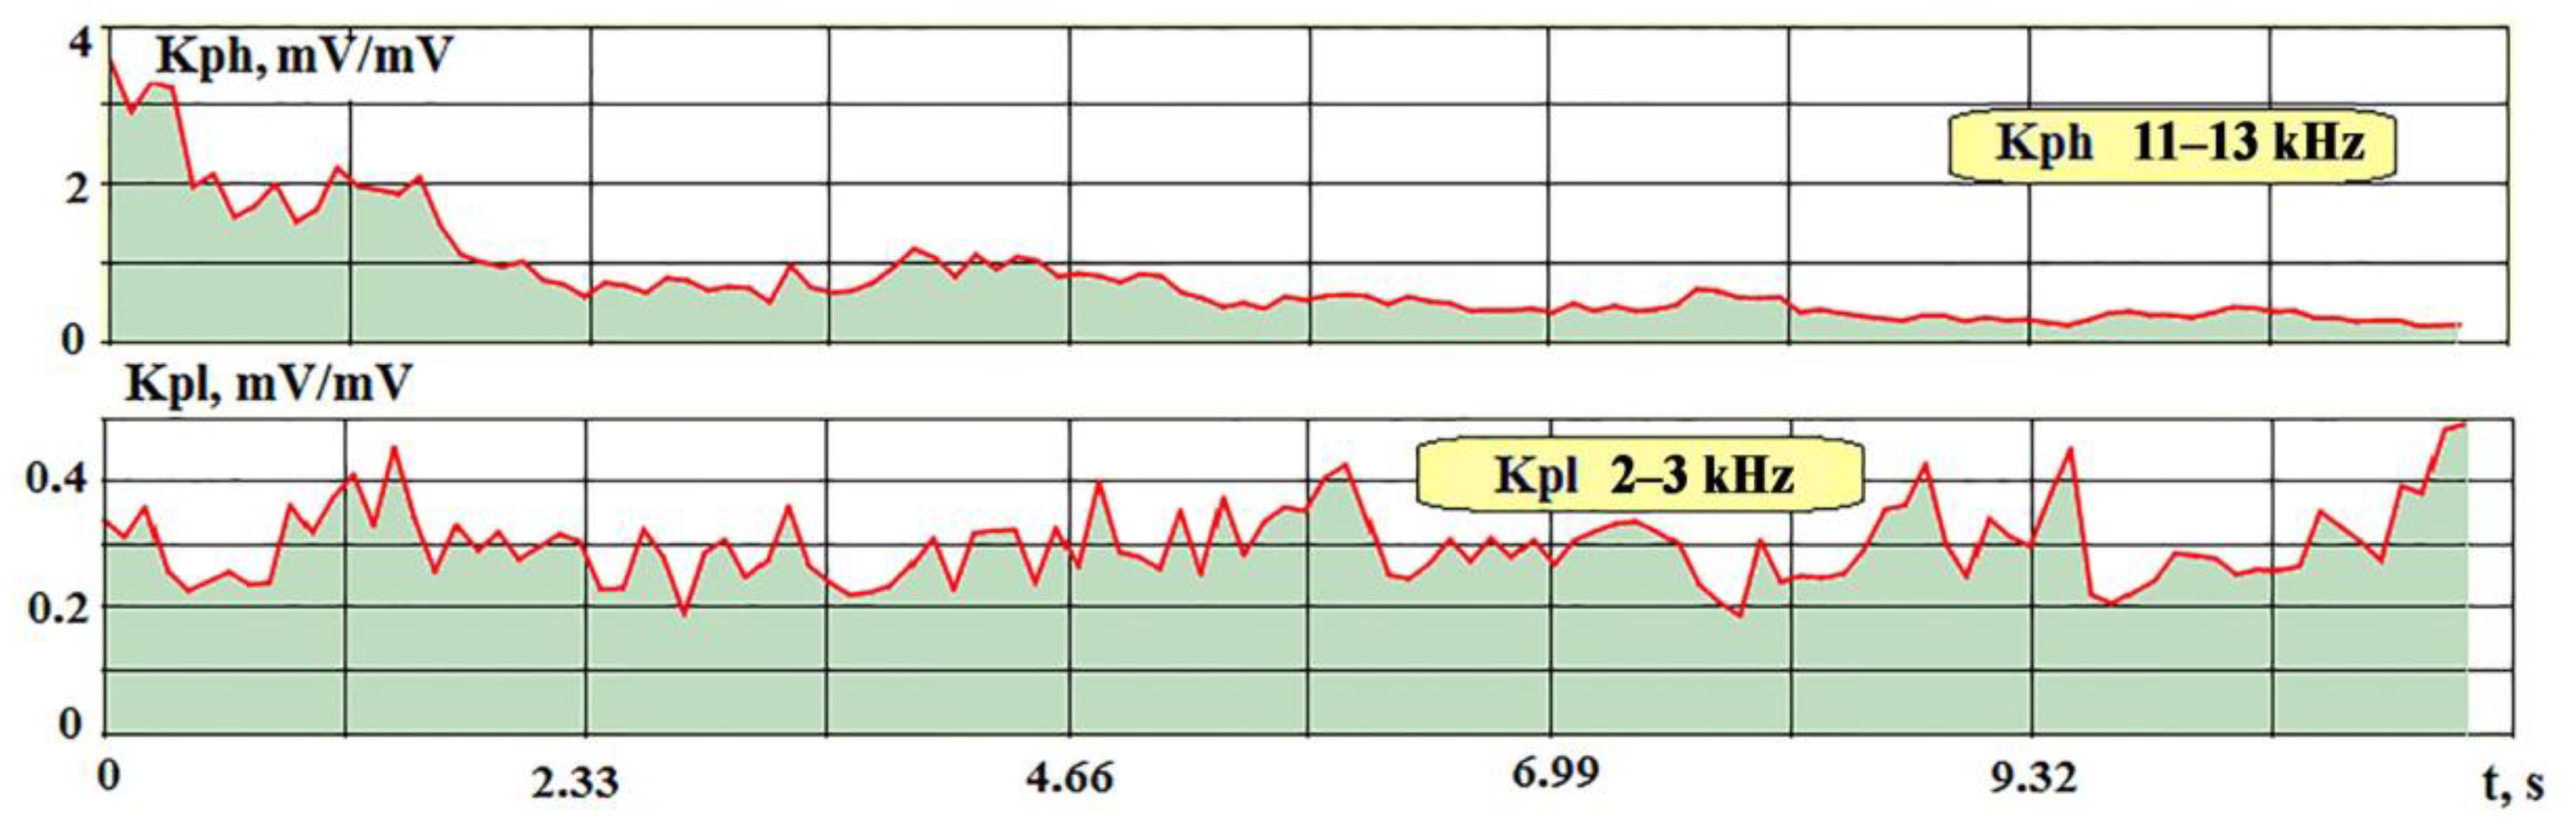
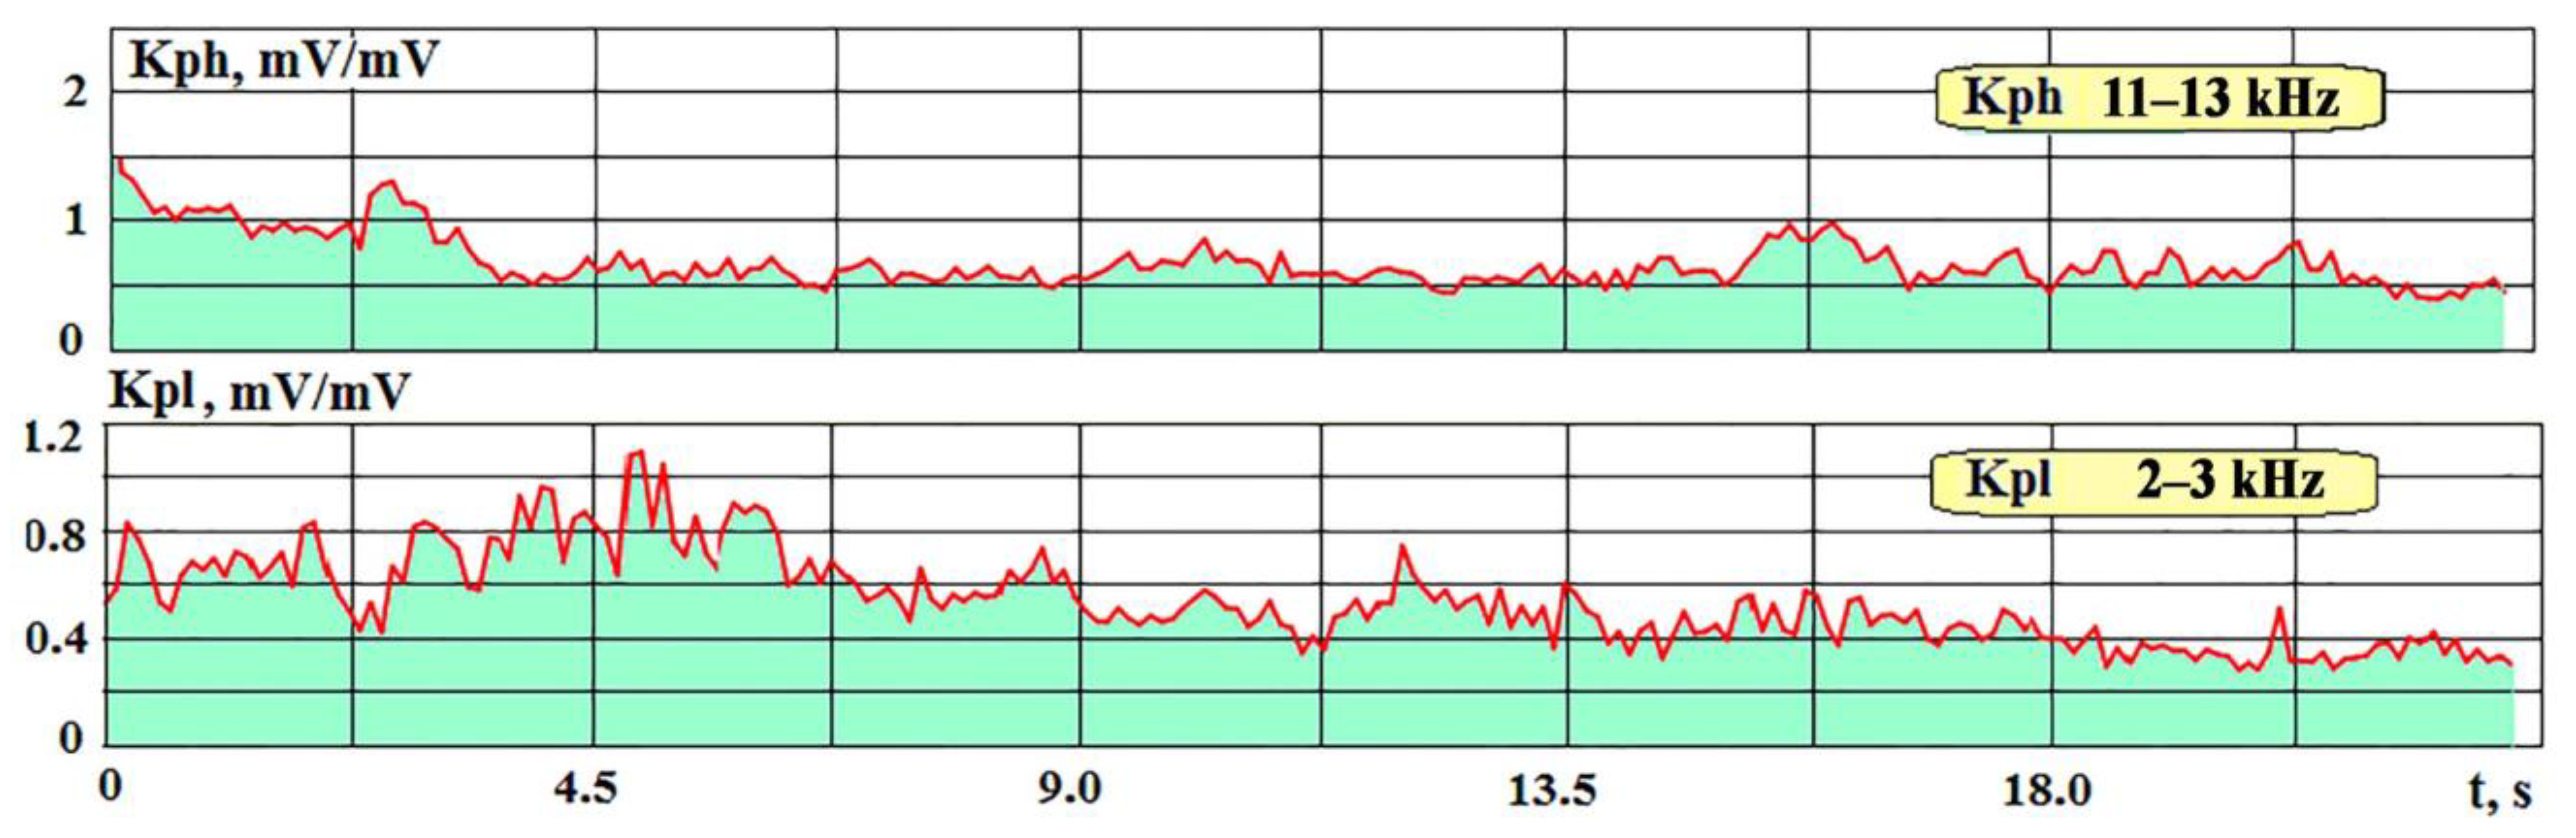
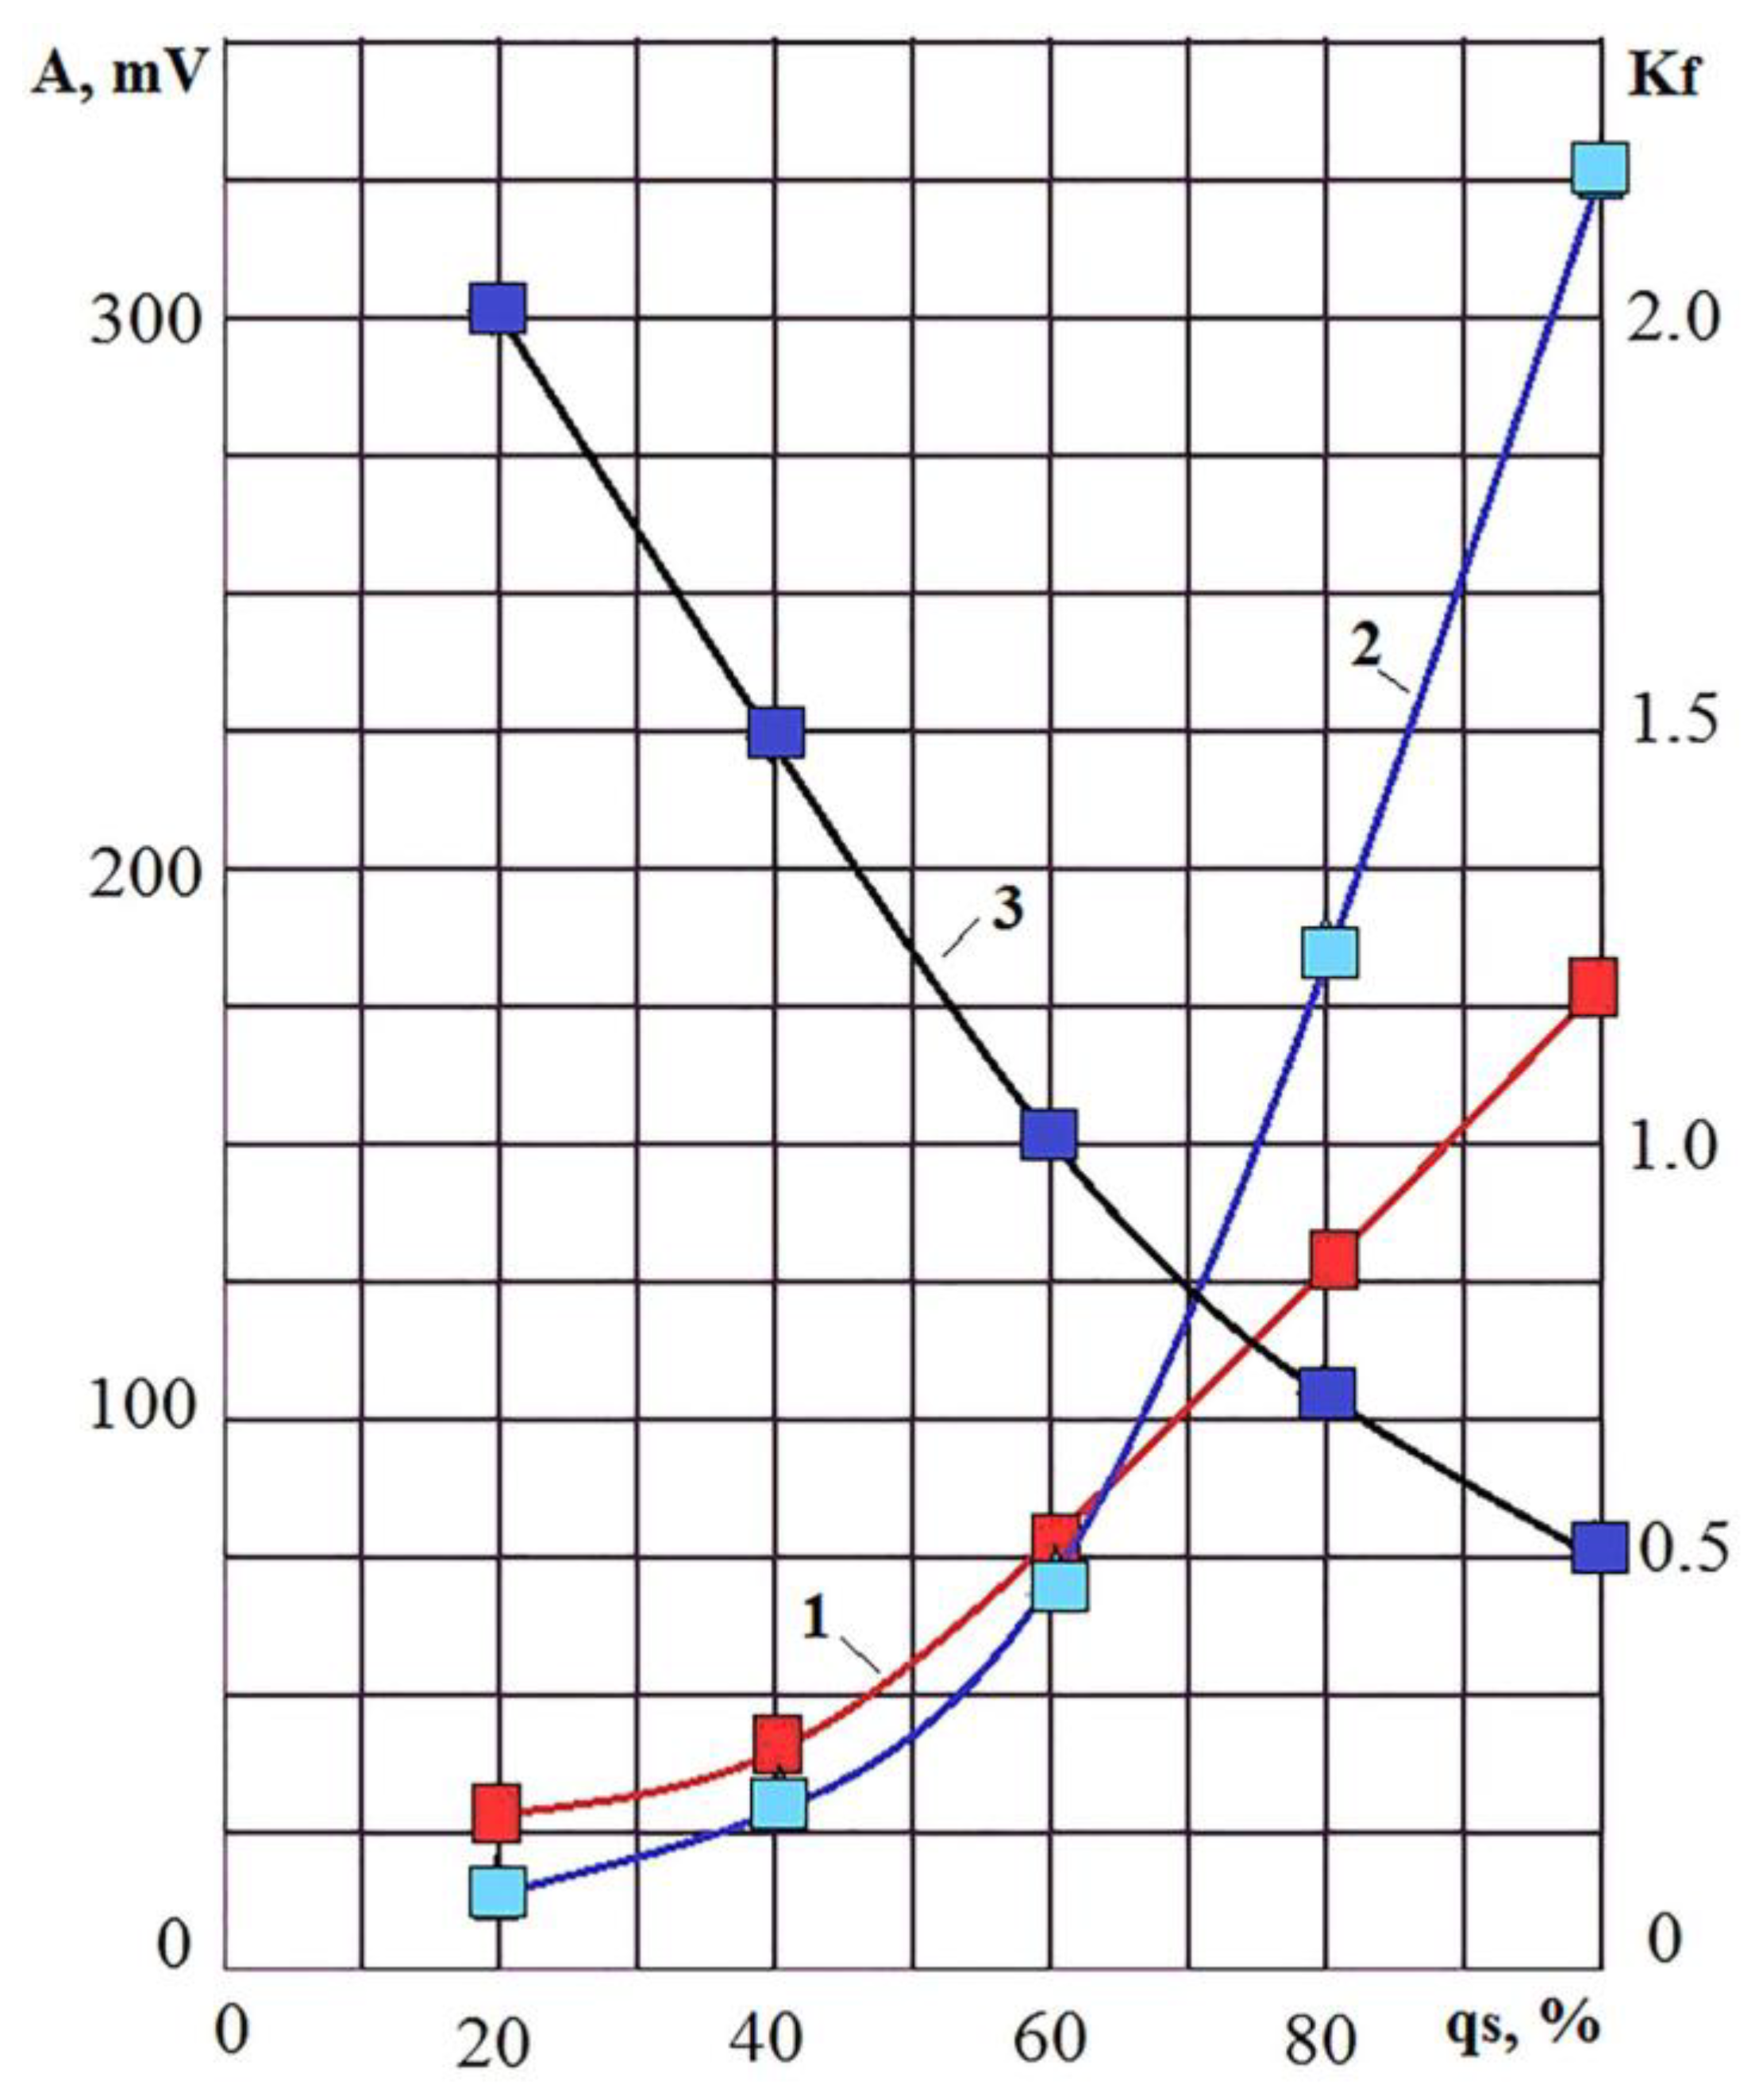
3.1. WEDM Monitoring Using Transmission Coefficients in the Selected Frequency Ranges

The data presented in Figure 6 show that the approach of the moment of electrode break leads to a decrease in the values of H(f) for a wide frequency range [29,30]. It follows from this that to monitor the WEDM process, it is not necessary to monitor the entire AFC spectrum, however it is sufficient to monitor the transmission coefficient RMS in one or more of the most informative frequency ranges. This is much easier than building an AFC for each point in time. Figure 7 shows an example of recordings of AE signals and discharge current in two frequency ranges with the WEDM of the hard alloy HG012 from the moment of embedding to the break of the electrode. Frequency ranges for further analysis were selected based on the analysis of spectra similar to those shown in Figure 6. Frequency ranges were selected where the amplitude changes are most noticeable.
In Figure 7, the amplitude of the AE signal changes over time: in the high-frequency range, it decreases, and in the low-frequency range, it increases. Nevertheless, at the same time, the discharge current also increases. The increase in current is created by the machine control system, which controls only electrical parameters (for example, the proportion of operating current pulses [12]). The control system tries to compensate for the decrease in the supply of the electrode tool by increasing the supplied energy, but this does not reduce the concentration of erosion products, the processing efficiency continues to decrease, and a short circuit occurs, leading to the break of the wire electrode [10,11,12].
Figure 8 shows the construction of the transmission coefficient for the high-frequency range (Kph) and its changes from the moment of embedding to the break of the electrode.
It follows from Figure 8 that after constructing Kph, the decrease in WEDM efficiency becomes more pronounced. The transmission coefficient decreased by 18 times during processing. Figure 9 shows the construction of the transmission coefficient for the low-frequency range (Kpl). RMS of vibration and current amplitudes are shown on the same graph, but the construction order is similar to that of Figure 8. In this frequency range, the changes in the transmission coefficient are not so noticeable, however the Kpl decreased by 40–50% before the electrode break.
The changes in AE signal parameters and transmission coefficients shown in Figure 7, Figure 8 and Figure 9 indicate that it was possible to prevent wire electrode break without waiting for a break. For example, when the Kph transmission coefficient dropped 4–5 times, it was necessary to give the command to relax.
The experiment shown in Figure 7, Figure 8 and Figure 9 continued after the wire electrode was repaired, and the same workpiece was further processed. The continuation of processing began with a working fluid without erosion products, but it quickly ended with another break. This case is attractive due to the nature of the change in the transmission coefficients from the beginning of the operation to the break of the electrode, which are shown in Figure 10.
It is interesting to compare the change in the transfer coefficients Kph in Figure 8 and Figure 10a. In Figure 8, Kph started at 6 units and dropped to 0.4 before the break of the electrode. During repeated cutting (Figure 10), Kph immediately started from the level of 0.4–0.5, dropping to the level of 0.2 just before the break. There is an assumption that the remaining trace of the wire electrode after the first break contains anomalies that immediately change the nature of the WEDM process, increasing the probability of breaking the electrode.

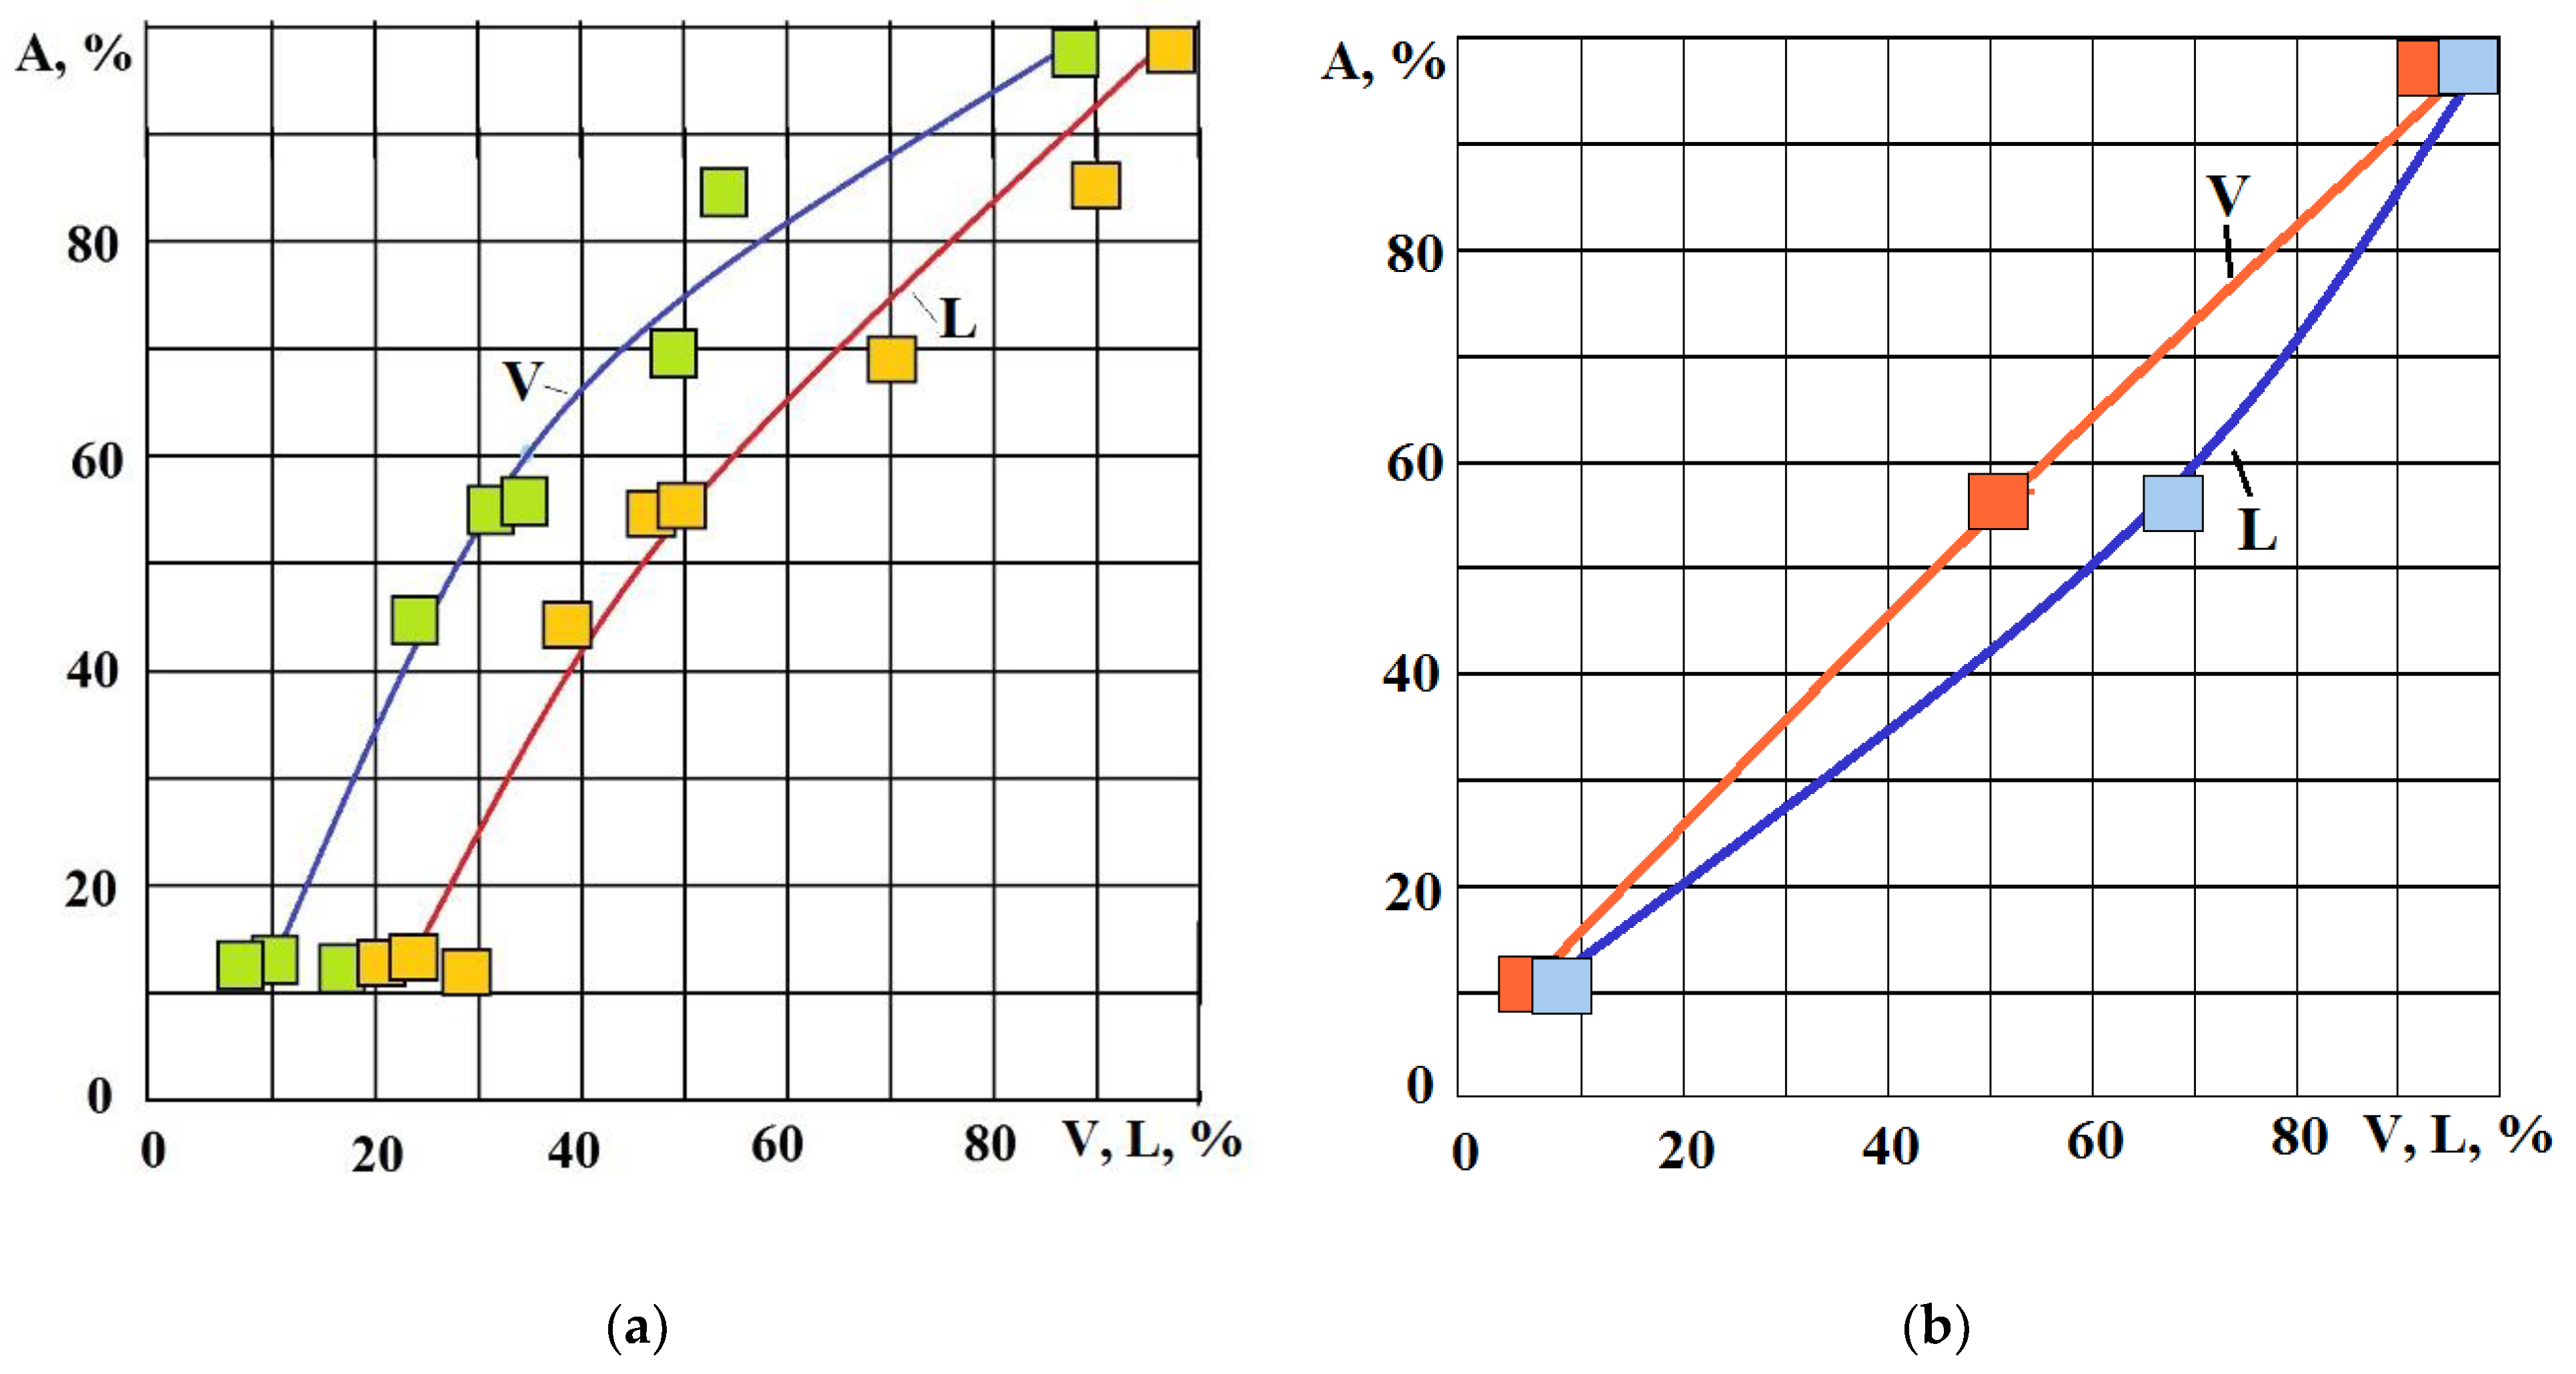
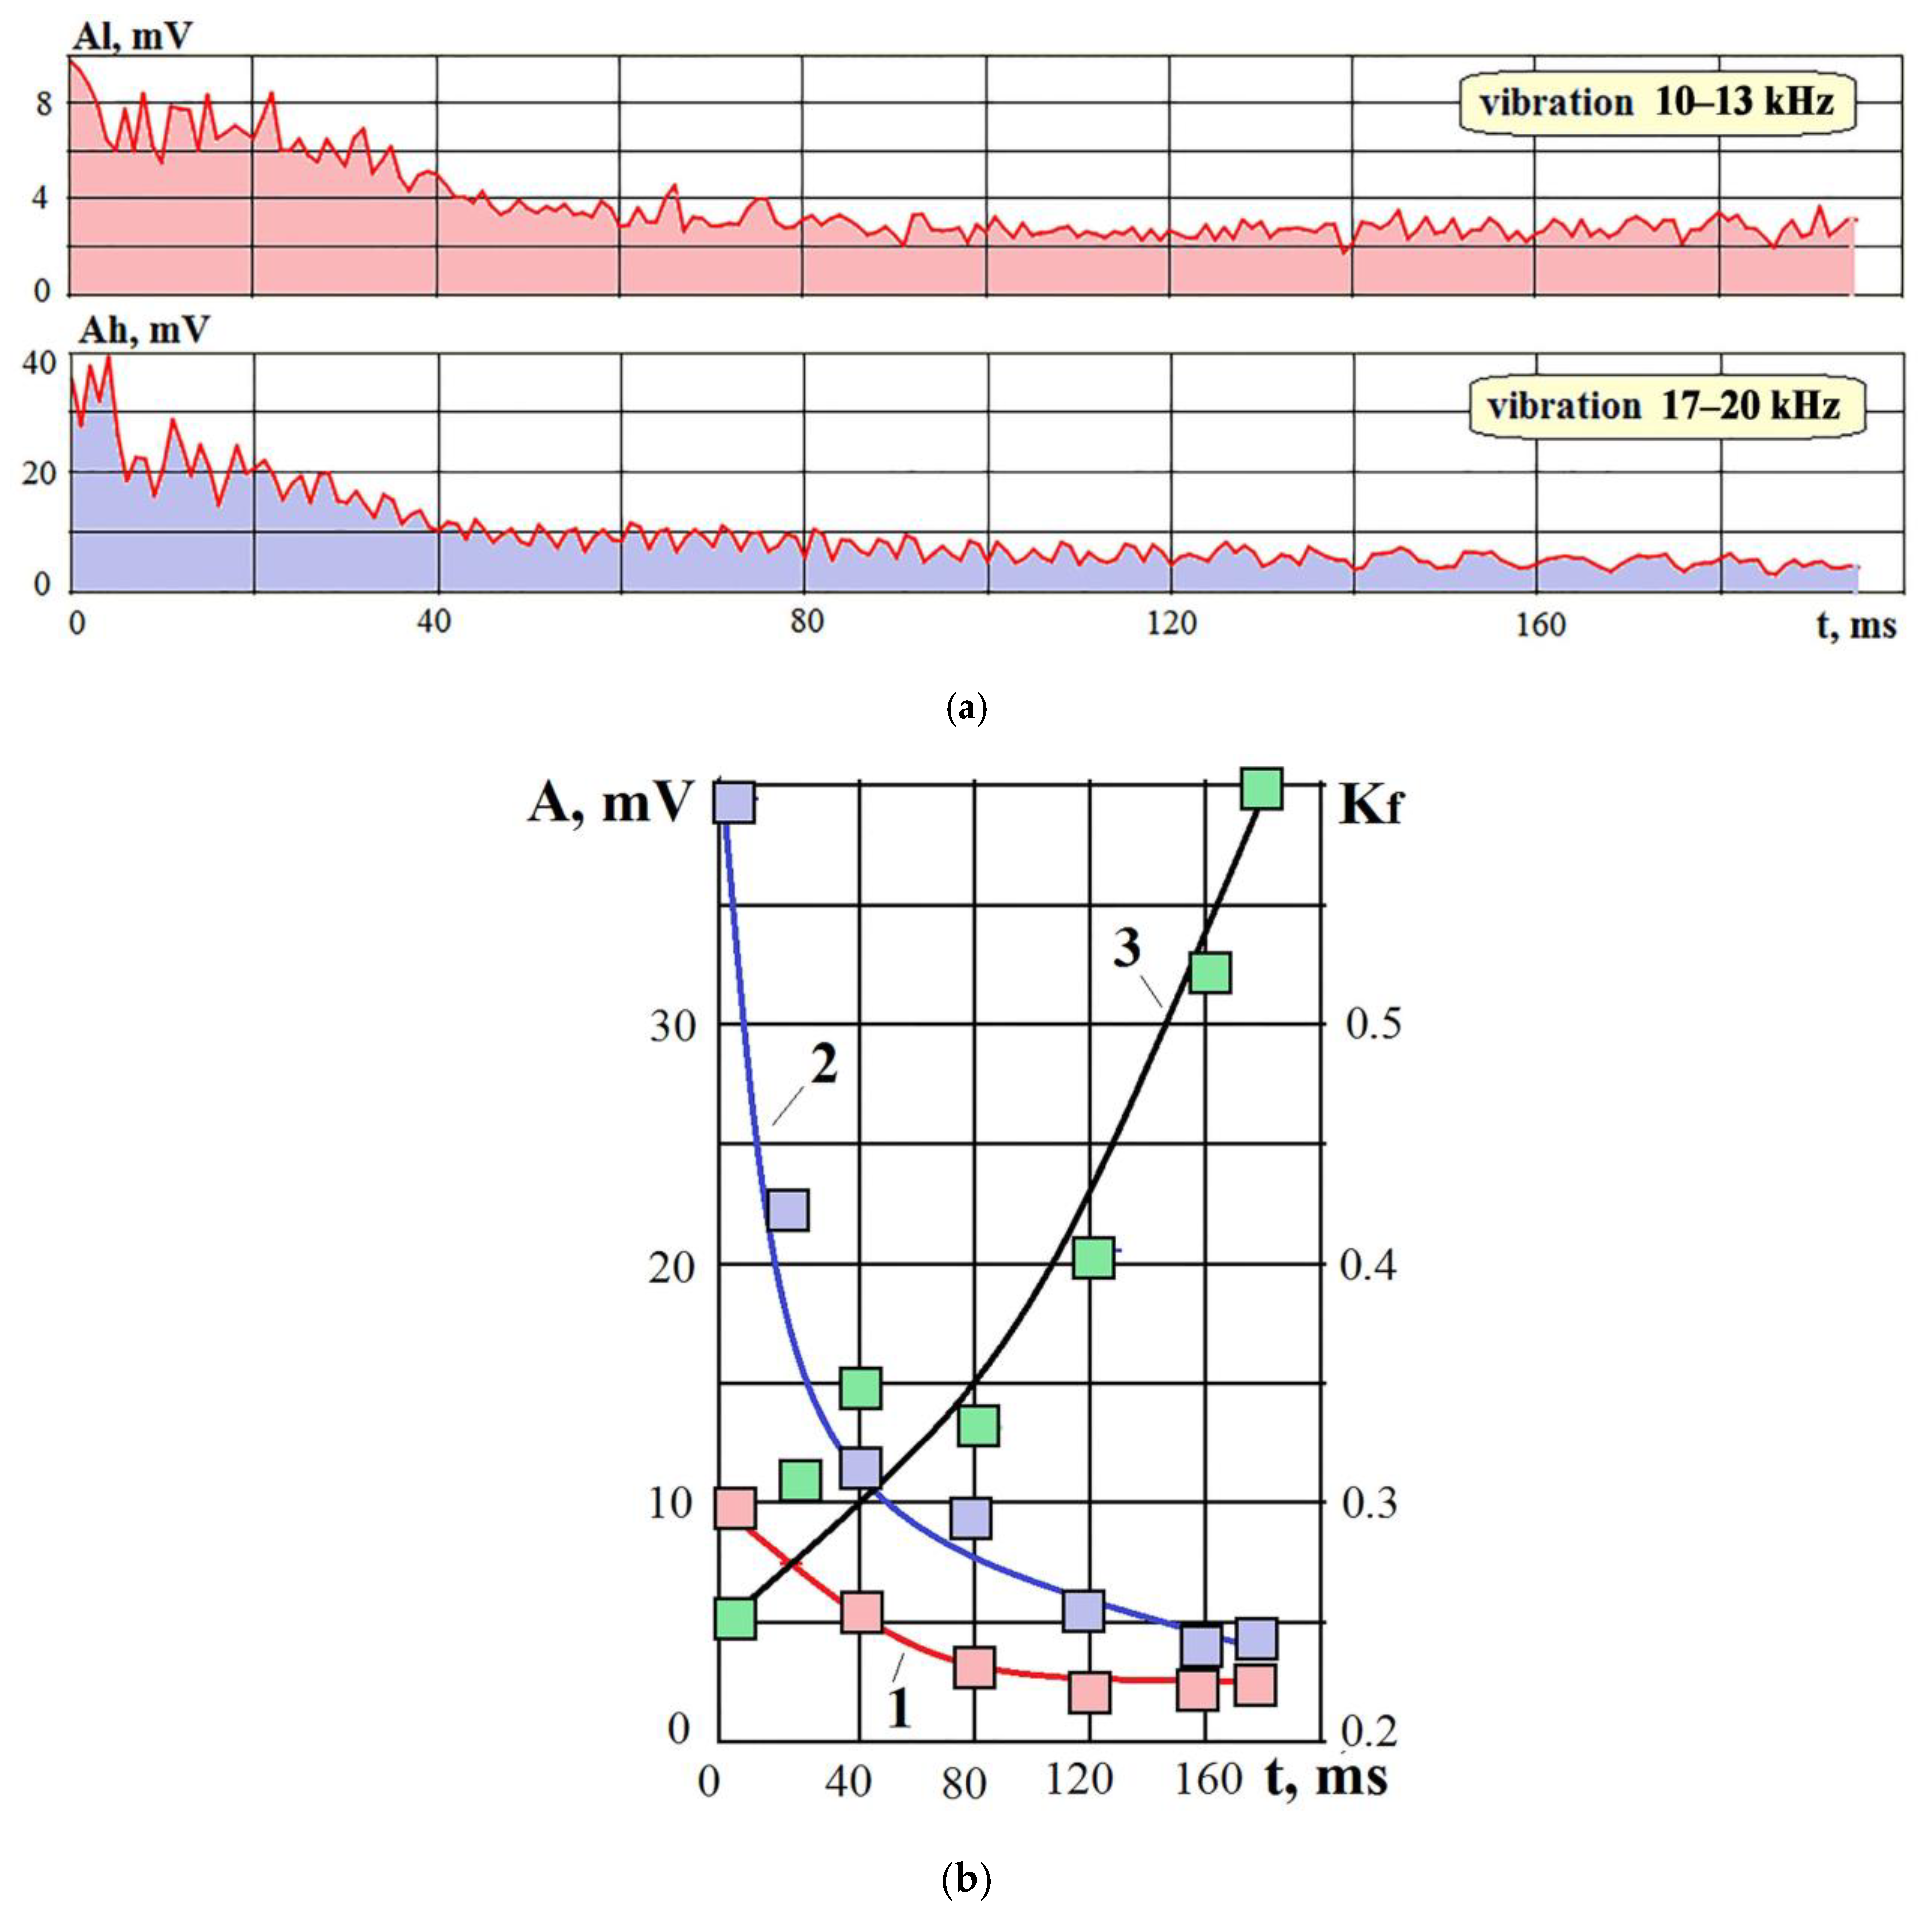
3.2. Verification of Assumptions during WEDM

Similar to the results presented in Figure 7, Figure 8, Figure 9 and Figure 10, made with WEDM of the hard alloy HG 012, the WEDM of the HS123 alloy was carried out under similar conditions. Figure 11 shows recordings of AE signal parameters in the same frequency ranges from the moment of embedding to the wire electrode break.
The change in the parameters of the AE signal in Figure 11 is very similar to the vibration records in Figure 7. One can observe a noticeable decrease in the signal amplitude in the high-frequency range and an increase in amplitude at low frequencies. Since the control system regulated the energy supply to the processing area, after constructing the transfer coefficients, their change during processing began as shown in Figure 12.
The character of the Kph change shown in Figure 12 is similar to that of HG012 (Figure 8). In this case, the transmission coefficient also has large values at the initial stage, and then gradually drops to values of 0.3–0.4 by the time of the break. In this case, Kpl increases slightly, but not as noticeably as the amplitude of the AE signal in the range of 2–3 kHz in Figure 11.
Figure 13 shows the changes in the transmission coefficients at different frequencies when the WEDM of the HS123 hard alloy is resumed after the wire electrode break is eliminated.
When the cutting was resumed after the elimination of the broken electrode, the frequency of the discharge pulses was reduced by 15%. Despite this, the graph of Kph change in Figure 13 began to differ from the similar graph in Figure 12. It almost immediately starts from the level of 1.0 units and, after 3 s, reaches the level of 0.5 units, i.e., the level where the break occurred on the previous pass. Thus, the described case was repeated similarly to the experiment with WEDM of the hard alloy HG012.
The presented results suggest that the resumption of WEDM in the trace of the previous wire electrode break increases the likelihood of repeated wire break. It is revealed that the trace from the previous cut preserves the “memory” of the accident that occurred. These results require an explanation of the physical causes of the influence of previous cases on the current reliability of processing.

4. Discussion

It has been experimentally found that wire electrode breaks during WEDM are usually preceded by short circuits and localization of discharges resulting from a series of pulses in a tiny area of the workpiece. Localization of discharges occurs at the place IEG, where the distance between the electrodes is the smallest. In this area, instead of forming a hole, an inflow occurs, consisting of a melt of the workpiece material and erosion products present in the surrounding working fluid. All these phenomena are initially associated with an increase in the concentration of erosion products. As a result, part of the discharge energy is spent on destroying erosion products, which leads to a decrease in the power density (qs) acting on the surface of the workpiece [10,12,34].
For a deeper understanding and modeling of the process of discharge localization, pulsed laser processing was used in the research, based, as with the WEDM process, on the effect of concentrated energy flows on the workpiece. These processes have different energy carriers by nature, however both technologies affect the substance with a flow of thermal energy with a high power density. This also determines the generality of the properties of AE signals accompanying these processes [25,26,27,35,36]. Pulses of laser radiation were delivered in a series of 1000 pulses at each point. Figure 14 shows the recording of AE signals in the high-frequency range for six series that have a similar pattern of changing the amplitude of the AE signal: high amplitude when the first pulses are applied, which quickly decreases several times. Figure 15 shows the amplitude spectra of the AE signal for the initial moment of the pulses and for the period when the amplitude stopped decreasing.
Comparing the spectra in Figure 15, we can note that the amplitudes at frequencies above 17 kHz (Figure 15b) decreased significantly more by 140 ms compared to those in the frequency range up to 17 kHz (Figure 15a). Figure 16 shows the change in RMS amplitudes in two frequency ranges, 10–13 and 17–20 kHz.
Figure 16a shows a continuous change in RMS amplitudes in two frequency ranges, and Figure 16b presents graphs constructed from discrete values of the amplitudes of AE signals in two ranges. Curve 3 in Figure 16b shows the ratio (Kf) of RMS amplitudes in the low-frequency range (10–13 kHz) to amplitudes in the high-frequency range (17–20 kHz). Despite the small spread of discrete results near graph 3, the tendency to increase the Kf ratio over time is very noticeable. At the initial moment Kf = 0.25, and after 160 ms Kf = 0.6. This means that the decrease in amplitudes at high frequencies is ahead of similar processes at lower frequencies. This, in turn, indicates a drop in the power density of radiation affecting the processed material [29,30,31].
The change in the Kf parameter shown in Figure 16b indicates a decrease in the power density qs (the ratio of the heat flow power to the impact area). With a constant diameter of the laser spot, the qs value can be changed by changing the laser radiation power [29,30]. Figure 17 shows an example of a change in Kf with variable power density qs.
It follows from curve 3 in Figure 17 that an increase in Kf indicates a decrease in the power density qs of the thermal energy flow. It is concluded out that the parameters of the laser radiation pulses did not change, and the power density decreased rapidly when the pulses were applied to one point (Figure 16b). The noted effect can be explained as follows. The products of destruction during laser exposure to the substance in the form of vapor-gas jets spread into the surrounding space. Part of the radiation energy is absorbed and dissipated by the destruction products. The steam phase absorbs and dissipates energy especially strongly. As a result, the initial power density decreases rapidly. As shown in Figure 15b, after 40–50 ms, the amplitude of the AE signal at high frequencies drops and reaches a constant level (the equilibrium level). There is no further decrease in the power density because its decrease reduces the volume of destruction products and, accordingly, energy dissipation and absorption decrease. A decrease in the power density in the case of laser processing does not mean the termination of the melting and evaporation of the material, however if the proportion of evaporation decreases, and the productivity of the process also decreases. A change in the power density forms a variety of laser technologies: at low qs, the material can be heated and hardened without removal. At high qs values, the material evaporates, and plasma forms, and the workpiece material is removed [29,37,38,39].
During WEDM, another case is observed. At the first pulse of the discharge, a cloud consisting of erosion products and a vapor-gas mixture is formed. If the subsequent discharge occurs at the same point of the cutting area, then its power density will be weakened, and the proportion of vapors will become smaller. As a result, part of the destroyed material will not be thrown into the working fluid but will settle on the edges of the hole, increasing their elevation relative to other irregularities. This provokes subsequent discharges at the same point, causing a further growth of the irregularity, forming the localization of the discharge. Such a development of events leads to a short circuit, heating of the electrodes, and wire break. There are no breaks during laser treatment, but the proportion of the liquid phase increases, which can settle on the edges of the hole and spread in the form of droplets, creating other defects in the quality of processing.
As a result of the break of the wire electrode, which occurred due to the localization of discharges, its trace may already contain prerequisites that contribute to the formation of a new break. Figure 18a shows an optical image of the wire electrode trace after a break, which shows the inflow of material on the surface. Figure 18b shows a profilogram of the trace, where there is a dominant protrusion, which was not present at the initial stages of cutting.
The presented interpretation of the wire electrode destruction processes is consistent with the experimental data shown in Section 3. It emphasizes the importance of monitoring the WEDM process to prevent the development of discharge localization leading to short circuits and electrode breaks.

5. Conclusions

The electrical discharge machining considered in the studies is associated with such processes as the transfer of thermal energy to the substance, the heating of the substance volume, the development of the processes of melting, evaporation, ionization, and expansion of the evaporated substance, the cooling of the substance after the end of the energy exposure. These processes are accompanied by structural and phase rearrangements, chemical reactions that cause local changes in the volume of matter, and abrupt changes in elastic stresses. All this causes elastic waves to propagate through the structural elements of the equipment, which can be detected using vibration sensors. The monitoring of vibroacoustic signals accompanying the machining process allows us to visualize the kinetics of the process and receive advanced information about the development of negative phenomena affecting the quality and reliability of the technological process. By analyzing the parameters of acoustic emission signals, one of the prominent anomalies accompanying the electrical discharge process associated with tool electrode breaks is considered. The processes preceding breaks are also considered: an increase in the concentration of erosion products in the interelectrode gap, localization of discharges, and short circuits.
The consideration of the WEDM process as dynamic model allows us to harmonize and simplify the idea of complex phenomena that change the state of the interelectrode gap. The paper presents experimental data showing a change in the amplitude-frequency characteristics linking discharge pulses to acoustic emission signals from the beginning of processing to the moment of wire electrode break. The prospects of presenting WEDM in the form of a dynamic model follow from the examples shown of a positive correlation between the AE amplitude at high frequencies and the processing performance. Further development in this direction will allow us to monitor the performance of WEDM in real-time.
Based on the dynamic model, it is proposed to monitor cases associated with an increase in the concentration of erosion products by changing the transmission coefficient in the selected frequency ranges most characteristic of this type of WEDM. Experiments with the treatment of hard alloys have shown that monitoring the transmission coefficients in the high-frequency range allows you to detect an increase in the probability of electrode break a few seconds before it occurs. A decrease in the transmission coefficient in the high-frequency range with an increase in the concentration of erosion products is also stably manifested in the processing of other alloys, including cermets. It is proposed to visualize the change in the efficiency of WEDM using the monitoring of transmission coefficients.
To explain the relationship between changes in the parameters of AE signals and the phenomenon of localization of discharges, an analogy between discharge pulses during WEDM and pulses during laser radiation is considered. It is shown that there is a close relationship between the parameters of AE signals when laser pulses are applied to a single point and discharge pulses during the localization of discharges, which reveals the nature of the phenomenon.
Based on the experimental data, it was assumed that in case of electrode breaks, the trace itself retains the “memory” of the accident, increasing the likelihood of the subsequent electrode break.
The presented research results allow us to highly appreciate the information content of AE signals, which can be used not only to improve monitoring systems [40] and regulate WEDM modes but also to analyze various options for processing new materials and products to select the most rational WEDM algorithm.

Author Contributions

Conceptualization, S.N.G.; methodology, S.N.G. and M.P.K.; software, A.N.P. and Y.A.M.; validation, A.N.P. and A.P.M.; formal analysis, Y.A.M.; investigation, M.P.K. and A.P.M.; resources, Y.A.M.; data curation, M.P.K.; writing—original draft preparation, S.N.G.; writing—review and editing, S.N.G. and M.P.K.; visualization, Y.A.M.; supervision, S.N.G. and M.P.K.; project administration, M.P.K.; funding acquisition, S.N.G. All authors have read and agreed to the published version of the manuscript.

Funding

This work was supported financially by the Ministry of Science and Higher Education of the Russian Federation (project No FSFS-2021-0003).

Data Availability Statement

Data will be made available on request.

Acknowledgments

The study was carried out on the equipment of the center of collective use of MSUT “STANKIN” supported by the Ministry of Higher Education of the Russian Federation (project No. 075-15-2021-695 from 26 July 2021, unique identifier RF 2296.61321X0013).

Conflicts of Interest

The authors declare no conflict of interest.

References

  1. Conde, A.; Arriandiaga, A.; Sanchez, J.A.; Portillo, E.; Plaza, S.; Cabanes, I. High-accuracy wire electrical discharge machining using artificial neural networks and optimization techniques. Robot. Comput. Integr. Manuf. 2018, 49, 24–38. [Google Scholar] [CrossRef]
  2. Trung, K.H. Development of a WEDM system with high machining efficiency. In Proceedings of the 2017 International Conference on System Science and Engineering (ICSSE), Ho Chi Minh City, Vietnam, 21–23 July 2017; pp. 397–399. [Google Scholar] [CrossRef]
  3. Ho, K.H.; Newman, S.T.; Rahimifard, S.; Allen, R.D. State of the Art in Wire Electrical Discharge Machining (WEDM). Int. J. Mach. Tool. Manu. 2004, 44, 1247–1259. [Google Scholar] [CrossRef]
  4. Han, F.; Chen, L.; Yu, D.; Zhou, X. Basic study on pulse generator for micro-EDM. Int. J. Adv. Manuf. Technol. 2007, 33, 474–479. [Google Scholar] [CrossRef]
  5. Grigor’ev, S.N.; Kozochkin, M.P.; Okun’kova, A.A. Investigation of monitoring perspectives for electroerosion processes by vibration parameter variation. Russ. Aeronaut. (Iz VUZ) 2015, 58, 488–494. [Google Scholar] [CrossRef]
  6. Nakamura, M.; Takeo, K.; Osada, T.; Ozaki, S. Finite Element Analysis of Self-Healing and Damage Processes in Alumina/SiC Composite Ceramics. Technologies 2017, 5, 40. [Google Scholar] [CrossRef]
  7. Aimable, A.; Goure Doubi, H.; Stuer, M.; Zhao, Z.; Bowen, P. Synthesis and Sintering of ZnO Nanopowders. Technologies 2017, 5, 28. [Google Scholar] [CrossRef]
  8. Ma, H.; Zhou, X.; Liu, W.; Kong, C. A feature-based approach towards integration and automation of CAD/CAPP/CAM for EDM electrodes. Int. J. Adv. Manuf. Technol. 2018, 98, 2943–2965. [Google Scholar] [CrossRef]
  9. Chen, X.; Wang, Z.; Xu, J.; Wang, Y.; Li, J.; Liu, H. Sustainable production of micro gears combining micro reciprocated wire electrical discharge machining and precision forging. J. Clean. Prod. 2018, 188, 1–11. [Google Scholar] [CrossRef]
  10. Grigoriev, S.N.; Martinov, G.M. Research and development of a cross-platform CNC kernel for multi-axis machine tool. Procedia CIRP 2014, 14, 517–522. [Google Scholar] [CrossRef]
  11. Artamonov, B.A.; Volkov, Y.S. Analiz Modelei Elektrokhimicheskoi i Elektroerozionnoi obrabotki. Chast’ 2, Modeli Protsessov Elektroerozionnoi Obrabotki. Provolochnaya Vyrezka (Analysis of Models of Electrochemical and Electrodischarge Treatment, Part 2: Models of Electrodischarge Treatment. Wire Cutting), 1st ed.; Vseross. Nauchno-issled. Inst. Patent. Inform.: Moscow, Russia, 1991; pp. 98–101. (In Russian) [Google Scholar]
  12. Yan, M.T. An adaptive control system with self-organizing fuzzy sliding mode control strategy for micro wire-EDM machines. Int. J. Adv. Manuf. Technol. 2010, 50, 315–328. [Google Scholar] [CrossRef]
  13. Kang, X.; Liang, W.; Yang, Y.; Zhao, W. Maximum free distance method for electrode feeding path planning in EDM machining of integral shrouded blisks. Precis. Eng. 2018, 51, 514–520. [Google Scholar] [CrossRef]
  14. Kishawy, H.A.; Hegab, H.; Umer, U.; Mohany, A. Application of acoustic emissions in machining processes: Analysis and critical review. Int. J. Adv. Manuf. Technol. 2018, 98, 1391–1407. [Google Scholar] [CrossRef]
  15. Belyi, V.A.; Kholodilov, O.V.; Sviridyonok, A.I. Acoustic Spectrometry as Used for the Evaluation of Tribological Systems. Wear 1981, 69, 309–319. [Google Scholar] [CrossRef]
  16. Ravindra, H.V.; Srinivasa, Y.G.; Krishnamurthy, R. Acoustic emission for tool condition monitoring in metal cutting. Wear 1997, 212, 78–84. [Google Scholar] [CrossRef]
  17. Grigoriev, S.N.; Nadykto, A.B.; Volosova, M.A.; Zelensky, A.A.; Pivkin, P.M. WEDM as a Replacement for Grinding in Machining Ceramic Al2O3-TiC Cutting Inserts. Metals 2021, 11, 882. [Google Scholar] [CrossRef]
  18. Grigoriev, S.; Dosko, S.; Vereschaka, A.; Zelenkov, V.; Sotova, C. Diagnostic Techniques for Electrical Discharge Plasma Used in PVD Coating Processes. Coatings 2023, 13, 147. [Google Scholar] [CrossRef]
  19. Grigoriev, S.N.; Okunkova, A.A.; Volosova, M.A.; Hamdy, K.; Metel, A.S. Electrical Discharge Machining of Al2O3 Using Copper Tape and TiO2 Powder-Mixed Water Medium. Technologies 2022, 10, 116. [Google Scholar] [CrossRef]
  20. Okunkova, A.A.; Volosova, M.A.; Kropotkina, E.Y.; Hamdy, K.; Grigoriev, S.N. Electrical Discharge Machining of Alumina Using Ni-Cr Coating and SnO Powder-Mixed Dielectric Medium. Metals 2022, 12, 1749. [Google Scholar] [CrossRef]
  21. Grigoriev, S.N.; Hamdy, K.; Volosova, M.A.; Okunkova, A.A.; Fedorov, S.V. Electrical Discharge Machining of Oxide and Nitride Ceramics: A Review. Mater. Des. 2021, 209, 109965. [Google Scholar] [CrossRef]
  22. Grigoriev, S.N.; Volosova, M.A.; Okunkova, A.A.; Fedorov, S.V.; Hamdy, K.; Podrabinnik, P.A.; Pivkin, P.M.; Kozochkin, M.P.; Porvatov, A.N. Electrical Discharge Machining of Oxide Nanocomposite: Nanomodification of Surface and Subsurface Layers. J. Manuf. Mater. Process. 2020, 4, 96. [Google Scholar] [CrossRef]
  23. Altintas, Y. Manufacturing Automation: Metal Cutting Mechanics, Machine Tool Vibrations, and CNC Design, 2nd ed.; Cambridge University Press: Cambridge, UK, 2012; p. 382. [Google Scholar]
  24. Webster, J.; Dong, W.P.; Lindsay, R. Raw acoustic emission signal analysis of grinding process. CIRP Ann. 1996, 45, 335–340. [Google Scholar] [CrossRef]
  25. Grigor’ev, S.N.; Kozochkin, M.P. Improvement of Machining by the Vibroacoustic Diagnostics of Electrophysical Processes. Russ. Engin. Res. 2015, 35, 801–806. [Google Scholar] [CrossRef]
  26. Kozochkin, M.P.; Grigor’ev, S.N.; Okun’kova, A.A.; Porvatov, A.N. Monitoring of electric discharge machining by means of acoustic emission. Russ. Engin. Res. 2016, 36, 244–248. [Google Scholar] [CrossRef]
  27. Kozochkin, M.P.; Porvatov, A.N.; Grigor’ev, S.N. Vibroacoustic Monitoring of the Major Parameters of Electrical Discharge Machining. Meas. Tech. 2017, 59, 1228–1233. [Google Scholar] [CrossRef]
  28. Kozochkin, M.P.; Porvatov, A.N. Effect of Adhesion Bonds in Friction Contact on Vibroacoustic Signal and Auto oscillations. J. Frict. Wear 2014, 35, 389–395. [Google Scholar] [CrossRef]
  29. Grigoriev, S.N.; Kozochkin, M.P.; Volosova, M.A.; Okunkova, A.A.; Fedorov, S.V. Vibroacoustic Monitoring Features of Radiation-Beam Technologies by the Case Study of Laser, Electrical Discharge, and Electron-Beam Machining. Metals 2021, 11, 1117. [Google Scholar] [CrossRef]
  30. Grigoriev, S.N.; Kozochkin, M.P.; Porvatov, A.N.; Fedorov, S.V.; Malakhinsky, A.P.; Melnik, Y.A. Investigation of the Information Possibilities of the Parameters of Vibroacoustic Signals Accompanying the Processing of Materials by Concentrated Energy Flows. Sensors 2023, 23, 750. [Google Scholar] [CrossRef]
  31. Grigoriev, S.N.; Kozochkin, M.P.; Porvatov, A.N.; Volosova, M.A.; Okunkova, A.A. Electrical discharge machining of ceramic nanocomposites: Sublimation phenomena and adaptive control. Heliyon 2019, 5, E02629. [Google Scholar] [CrossRef]
  32. Tseng, K.-H.; Chung, M.-Y.; Chang, C.-Y. Parameters for Fabricating Nano-Au Colloids through the Electric Spark Discharge Method with Micro-Electrical Discharge Machining. Nanomaterials 2017, 7, 133. [Google Scholar] [CrossRef]
  33. Yue, X.; Yang, X.; Tian, J.; He, Z.; Fan, Y. Thermal, mechanical and chemical material removal mechanism of carbon fiber reinforced polymers in electrical discharge machining. Int. J. Mach. Tool Manuf. 2018, 133, 4–17. [Google Scholar] [CrossRef]
  34. Ozerkan, H.B. Simultaneous machining and surface alloying of AISI 1040 steel by electrical discharge machining with boron oxide powders. J. Mech. Sci. Technol. 2018, 32, 4357–4364. [Google Scholar] [CrossRef]
  35. Mujumdar, S.S.; Curreli, D.; Kapoor, S.G. Effect of Dielectric Conductivity on Micro-Electrical Discharge Machining Plasma Characteristics Using Optical Emission Spectroscopy. ASME. J. Micro Nano-Manuf. 2018, 6, 031001. [Google Scholar] [CrossRef]
  36. Salmanov, V.M.; Guseinov, A.G.; Mamedov, R.M.; Salmanova, A.A.; Gasanova, L.G.; Magomedov, A.Z.; Akhmedova, F.S. Effect of laser radiation on InSe and GaSe thin films grown via laser sublimation and chemical deposition. Russ. J. Phys. Chem. 2018, 92, 1790–1793. [Google Scholar] [CrossRef]
  37. Grigoryants, A.G.; Safonov, A.N. Methods of surface laser processing. In Laser Technique and Technology; Textbook for Universities; Grigoryants, A.G., Ed.; Higher School: Moscow, Russia, 1988; Volume 3, p. 159. [Google Scholar]
  38. Trushin, Y.V. Theory of Radiation Processes in Metal Solid Solutions; Nova Science Publishers Inc.: New York, NY, USA, 1996; p. 406. [Google Scholar]
  39. Schaaf, P. (Ed.) Laser Processing of Materials: Fundamentals, Applications and Developments; Springer Series in Materials Science; Springer: Berlin/Heidelberg, Germany, 2010; Volume 139, p. 241. [Google Scholar] [CrossRef]
  40. Kozochkin, M.P.; Porvatov, A.N. Estimation of Uncertainty in Solving Multi-Parameter Diagnostic Problems. Meas. Tech. 2015, 58, 173–178. [Google Scholar] [CrossRef]
Figure 1. Composition of equipment for monitoring AE signals in WEDM of hard alloys: a—wire-tool; b—workpiece; c—working table; d—accelerometers; e—preamplifiers; f—amplifiers model VShV003 (Izmeritel Ltd., St. Petersburg, Russia); h—external ADC module model E440 (L-CARD Ltd., Moscow, Russia); i—signal-recording device.
Metals 13 00775 g001
Figure 2. Processing area of the CUT 1000 machine with placed accelerometers: 1—wire tool; 2—workpiece; 3—accelerometers.
Metals 13 00775 g002
Figure 3. General view of the processing area of the U15 laser machine with a placed accelerometer.
Metals 13 00775 g003
Figure 4. The dynamic model of the WEDM process: Q(f)—spectrum of the discharge current signal q(t); H1(f)—AFC of the working fluid; s(t)—working impact on the workpiece, destroying its material; H2(f)—AFC of the elastic system together with the workpiece; a(t)—vibration signal at the output of the accelerometer with the spectrum A(f); f—frequency; t—time.
Metals 13 00775 g004
Figure 5. Dependence of the RMS amplitude of the AE signal in the range of 30–40 kHz on the volume of the removed material (V) and the depth of the hole (L): (a)—with variations in discharge energy, pulse duration and frequency; (b)—with variations in discharge energy only. On the graphs, all values along the axes are indicated as a percentage of the maximum values.
Metals 13 00775 g005
Figure 6. AFC during WEDM of alloys HG012 (a) and HS123 (b): 1—AFC at the initial stage of processing; 2—AFC before wire electrode break; 3—the intermediate type of AFC.
Metals 13 00775 g006
Figure 7. Recording of AE signals and discharge current in the ranges of 2–3 kHz (upper graphs) and 11–13 kHz (lower graphs) during WEDM of hard alloy HG012 from the moment of embedding to the break of the wire electrode.
Metals 13 00775 g007
Figure 8. The procedure for constructing the transmission coefficient at high frequencies and its change from the moment of embedding to the break of the wire electrode: Ah—RMS amplitude in the high-frequency range; Ih—RMS amplitude of the discharge current; Kph—transmission coefficient in the high-frequency range.
Metals 13 00775 g008
Figure 9. The procedure for constructing the transmission coefficient at low frequencies (upper graph) and its change (lower graph) from the moment of embedding to the break of the wire electrode: Al—RMS amplitude in the low-frequency range; Il—RMS amplitude of the discharge current; Kpl—transmission coefficient in the low-frequency range.
Metals 13 00775 g009
Figure 10. Changes in the transmission coefficients at high and low frequencies from the moment of embedding to the break of the wire electrode during repeated cutting of the hard alloy HG012: (a)—RMS of vibration amplitudes, current, and transmission coefficient Kph for the range 11–13 kHz; (b)—change in the Kpl coefficient for the range 2–3 kHz.
Metals 13 00775 g010
Figure 11. Recording of AE signals in the ranges of 2–3 GHz (upper graph) and 11–13 kHz (lower graph) during the WEDM of HS123 hard alloy from the moment of embedding to the break of the wire electrode.
Metals 13 00775 g011
Figure 12. Changes in transmission coefficients at high and low frequencies from the moment of embedding to the break of the wire electrode during HS123 hard alloy WEDM: transmission coefficient Kph for the 11–13 kHz range (upper graph); change in the Kpl coefficient for the 2–3 kHz range (lower graph).
Metals 13 00775 g012
Figure 13. Changes in transmission coefficients at high frequencies (upper graph) and low frequencies (lower graph) from the moment of embedding to the break of the wire electrode when resuming the WEDM of the HS123 hard alloy after the electrode break is eliminated.
Metals 13 00775 g013
Figure 14. Recording of AE signals when a steel workpiece is exposed to a series of laser pulses.
Metals 13 00775 g014
Figure 15. Comparison of AE signal spectra for the initial pulse period (spectrum 1) and after 140 ms (spectrum 2): (a)—spectra for the frequency range of 10–17 kHz; (b)—spectra for the frequency range of 17–20 kHz and recording of the AE signal with time interval marks for constructing spectra.
Metals 13 00775 g015
Figure 16. Change of RMS amplitudes of AE signals in two frequency ranges when laser pulses are applied to one point: (a)—recordings of RMS amplitudes in the ranges of 10–13 kHz and 17–20 kHz; (b)—graphs of AE parameter changes during pulse exposure (1—AE in the range of 10–13 kHz; 2—AE in the range of 17–20 kHz; 3—change in the ratio of amplitudes Kf).
Metals 13 00775 g016
Figure 17. Changes in AE signal parameters with increasing laser power density: 1—RMS amplitude of the AE signal in the octave frequency range of 8 kHz; 2—RMS amplitude of the AE signal in the octave frequency range of 16 kHz; 3—Kf parameter (ratio of the amplitudes of curves 1 and 2).
Metals 13 00775 g017
Figure 18. Trace left by the wire electrode on the surface after its break: (a)—photo of the trace; (b)—profilogram of the trace.
Metals 13 00775 g018
Table 1. The chemical composition of HG012 and HS123 hard alloys.
MaterialComponent Content, %
WCTaCTiCCo
HG012922-6
HS12379-156
Table 2. The physical-mechanical properties of HG012 and HS123 hard alloys.
MaterialBending Strength σ, MPaHardness HRADensity ρ·10−3, kg/m3Specific Electrical Resistance ρ,
Ω mm2 /m
HG01212809114.80.099
HS12311809011.50.079
Disclaimer/Publisher’s Note: The statements, opinions and data contained in all publications are solely those of the individual author(s) and contributor(s) and not of MDPI and/or the editor(s). MDPI and/or the editor(s) disclaim responsibility for any injury to people or property resulting from any ideas, methods, instructions or products referred to in the content.

