
Effect of Residual Stresses on Fatigue Strength on the Smooth and Splined Parts of Spring Torsion Bars

Faculty of Mechanical Engineering, University of Maribor, 2000 Maribor, Slovenia
*
Author to whom correspondence should be addressed.
Metals 2023, 13(6), 1004; https://doi.org/10.3390/met13061004
Submission received: 30 March 2023
/
Revised: 13 May 2023
/
Accepted: 17 May 2023
/
Published: 23 May 2023
(This article belongs to the Special Issue New Trends in Fatigue of Metals)
Abstract
:The article discusses the effect of residual stresses on the fatigue strength of torsion bars by using the Dang Van fatigue criterion, at the stress concentration at the root of the tooth and at the smooth part of the torsion bar. Residual compressive stresses were induced on the surface during the technological processes by cold surface rolling and torsional pre-strain (pre-setting) to the plastic range, to increase the elastic linear range and to reduce the stress state during torsional loading. Normally, the stress reduction in the torsion bar at the mounting point is provided by the increased diameter of the splined part, compared to the smooth part of the torsion bar. In the case of a small difference between the diameter of the splined and the smooth parts of the torsion bar, a fatigue crack can be initiated in the notch, which causes the torsion bar to break during operation after a few hundred loading cycles. FEM stress analysis of a torsion bar was performed in the article. The actual residual stresses were measured by the non-destructive X-ray method at the place of stress concentration on the smooth and splined parts with a notch of the torsion bar, and Dang Van’s failure criterion was used to determine the fatigue behavior during torsional loading. Therefore, in the paper, the three methods were combined to determine the optimum lifetime of a torsion bar exposed to the required cyclic torque. The results of the analysis showed that the residual compressive stresses are useful up to a certain limit where the retarded fatigue crack initiation occurred, but a further increase of compressive stress caused an increase of the maximum shear stresses, which, in turn, caused the initiation of fatigue and failure at the splined part of the torsion bar before achieving the required number of cycles.
1. Introduction
Torsion bars are used as springs in suspensions to mitigate road irregularities and impacts on vehicles and tracks [1,2,3]. To achieve higher linear suspension properties, compressive residual stresses are introduced into the torsion bar [1]. The compressive residual stresses are usually introduced by cold surface rolling and plastic pre-strain in the operational torsion direction. Figure 1 shows a finished torsion bar while it is placed in a clamp that loads it exactly as it will be loaded during operation, but above its (shear) yield strength. The torsion bar returns to the new shape desired for assembly when the load is released. However, the elastic recovery has now placed the resulting material in a state of residual stress that is in the opposite direction from the applied load. The pre-strain to the plastic area introduces residual stresses to the cross-section of the torsion bar [2,3].
The crack initiation can appear in the splined part in the root of the tooth under cyclic loading. The root of a tooth has a higher stress concentration. In the case of torsion bars the splined part has a larger diameter to reduce the stress concentration, as shown in Figure 2a. In addition, the torsion bar is surface-rolled in the cold state to apply compressive residual stresses to the layers on the surface and to reduce the surface roughness of the torsion bar. The teeth roots are also cold rolled to reduce the roughness, Figure 2b.
Figure 3a shows a cracked torsion bar with the initiation of a crack in the tooth root, while Figure 3b shows secondary cracks in the cracked surface at the initiation point, after 300,000 loading cycles. The required lifetime of the torsion bar was 250,000 loading cycles. In this paper, a Finite Element Method (FEM) stress analysis of a torsion bar was performed by using the ABAQUS 2020 standard solver [4]. The introduced residual stresses by plastic torsional pre-strain and the operating stresses` magnitude were considered on a smooth part of the torsion bar [1]. In a torsion spring bar, these residual stresses on and below the surface will act to protect the surface from the maximum shear stress gradient of the applied torsional stress [5,6]. For a torsion bar it is crucial to survive the prescribed service life in terms of the number of cycles for the required torque [7,8,9,10,11,12]. This approach is relevant for a smooth straight torsion bar part, but failure sometimes appeared in the stress concentration tooth’s root area, as can be seen in Figure 3.
The still open question remains, namely, whether is it possible to protect a splined area from fatigue crack initiation and fatigue failure if the ratio Df/d is slightly higher than 1, e.g., 1.05.
Some papers deal with biaxial loading with both torsion and axial forces on solid and cylindrical specimens. Tschegg in [13] studied a longer continued growth of crack and the crack-tip closure and demonstrated for a mode III. Makabe and Socie [14] tested 4340 steels under modes III and I. They stated that the cracked branches did not continue symmetrically from the initial crack when the complex stress state occurred. Yang and Kuang [15] additionally studied the crack paths and growth rates on S45 steel specimens under various combinations of torsion and constant axial force. They stated that the crack propagation angle was approximately 45° for various loading amplitudes. They found that the static tension axial force in phase with cyclic torsion caused the accelerated crack growth rate of a crack, and therefore reduced the service lifetime. It was found that the compression axial force, together with torsion, increased the lifetime, and did not change the crack propagation angle. They also stated that the crack propagation direction depends on the alternating stress amplitude, and not on median stress. Tanaka et al. in [16] tested hollow specimens made of lead-free solder. The specimens were tested under torsion and a combination of torsion and compression in the axial direction. They concluded that the crack propagated in the direction of the maximum shear stress, and later in the direction perpendicular to the maximal principal stresses. Mrzyglod and Zielinski [17] presented the biaxial high-cycle fatigue phenomena by using the Finite Element Method-FEM. The Dang Van fatigue criterion was implemented to investigate the structural optimization process. Peridas and Hills [18] studied the criteria for fatigue crack initiation by applying the Dang Van Criterion. The effects were investigated on load reversal, overall load amplitude, and stress concentration as well. Zenner and Simbürger [19] analyzed the fatigue limit of ductile materials under complex multiaxial loading.
In [20,21,22,23,24,25,26,27,28,29], studies were also carried out on shear-loaded beams made of different materials, such as reinforced concrete to reinforced polymers. We also used the Finite Element Method and the ABAQUS solver for numerical simulations.
The manufacturing process of a torsion bar [3], termed technology A, consists of cold surface rolling, and then pre-deformation into a plastic region with up to 4.3% shear strain on the surface of the torsion bar. The second manufacturing process, termed technology B, consists of pre-strain of the torsion bar into the plastic region to 2.15% of the shear strain on the surface, then cold rolling the surface and finishing with an additional pre-strain of 2.15% of the shear strain. Cold surface rolling was performed to reduce surface roughness and introduce residual stresses into the surface layer of the torsion bar. A plastic pre-strain was performed in the torsion direction to introduce the residual stress below the surface layer [3].
Močilnik et al. [1] presented the lifetime prediction of a torsion bar at the smooth part, manufactured by both technologies, A and B, compared by using the Druker-Prager fatigue criterion [13]. The analysis was based on using residual stresds measurements and modeling from a study by Perenda et al. [3]. They concluded that the increasing compressive residual stress at the surface of the torsion bar by technology B did not affect the enlargement of the life until the fracture of the torsion bar in comparison to technology A. It shifts the loading path far into the unsafe zone of the fatigue crack initiation and propagation [1].
Also in this article, the conditions on the smooth part of the torsion bar were discussed, only this time using the Dang Van criterion. The result was very comparable to the result according to the Drucker–Prager criterion [1], except that the safety factor according to the Dang Van criterion was slightly higher compared to the result according to Drucker-Prager. Also interesting is the fact that both the Druker-Prager and Dang Van criteria showed that technology B is useless for the manufacture of torsion bars, because it places the entire load cycle outside the safe area, although the compressive residual stresses in the surface layers of the torsion bar are much higher in the case of technology B than in the case of technology A.
The influence of compressive constant stress on the service life of a torsion bar was discussed in the article [21]. It was found that, as the compressive stress increases, the lifetime increases for a while and then starts to decrease. The problem was treated as comparable with five failure criteria: Coulomb–Mohr, Drucker–Prager, Dang Van, Sines, and Crossland. All the listed criteria were interesting for the considered case because the results were comparable. In all five cases, the highest safety factor was shown by the Dang Van criterion, followed by the Drucker–Prager and Coulomb–Mohr criteria, and, finally, the Sines and Crossland criteria with a minimum safety factor.
In this paper, we analyzed the effect of residual stresses introduced by pre-strain and cold rolling on the surface of the smooth part, and at the notch of the splined part of the torsion bar. The analysis was performed by using the Dang Van fatigue criterion [20].
2. Multi-Axial Fatigue Criterion
Experimental investigations in recent decades resulted in numerous hypotheses of multi-axial fatigue. Dang Van (1989) and Dang Van and Papadopoulos (1999) formulated a hypothesis by observing the local plastic deformations on a microscopic scale on the level of crystallites [20]. They can initiate micro-cracks even then when the studied structure remains in the macroscopic scale in a range of elastic strains.
The physical interpretation of this hypothesis is that, after a certain number of loading cycles, the response is purely elastic (or at least the plastic dissipation rate becomes negligible), when using the shakedown (Melan’s) theorem and its generalization. It is possible to derive a method for estimating the stabilized stress cycle at the macroscopic and mesoscopic levels, which intervenes in the proposed fatigue criteria, provided that the material considered is a structure made of grains of different crystallographic orientations [20].
For practical applications, it is only necessary to derive local parameters from macroscopic stress cycles near the fatigue limit.
The relation between the macroscopic and local stress tensor [20] is given by:
This relationship is well-known in the theory of polycrystalline aggregates. In this equation, Σij(M, t) is the macroscopic stress tensor at time t in the representative volume element V(M) surrounding M, and σij(m, t) and are the local stress tensor and the time-independent residual stress tensor at any point m of V(M).
Assuming that approximate elastic shakedown occurs if the load cycles are close to the fatigue limit, there must be a local fixed residual stress tensor and a fixed set of local hardening parameters α(m), so that:
If the von Mises criterion is chosen, then σ (m, t) belongs to the hypersphere in a five-dimensional space, which represents the limit value of the Mises norm for which elastic shakedown is possible. With this construction, the local stress state is known at any moment t of the apparent stabilized state [20].
According to Dang Van, the fatigue damage appears at a definite time, when the combination of local shear stress τ(t) and the hydrostatic stress σH(t) cut the borders of an admissible fatigue area–fatigue limit, Figure 4. Initially complicated, the calculation method of shear stress amplitude became simplified:
within the area of the studied object for local shear stress τ(t) and the hydrostatic stress σH(t):
Where a and b are material parameters that should be determined by two simple types of fatigue experiments: A uniaxial tension-compression test and alternating torsion on conventional fatigue testing machines. σ1, σ2 and σ3 are principal stresses. The material parameters for the material used were a = 0.75 and b = 600 MPa.
Figure 4 shows the τmax–σH space and Dang Van’s fatigue limit. If the stress cycle is completed below the line the mechanical component is not expected to fail. However, if the stress cycle extends beyond this line, the mechanical component will break down. We say that operating a mechanical component below the Dang Van fatigue limit is safe, or above it is dangerous.
The Dang Van criterion Equation (3) proposes the analysis with respect to cycles’ loading and, consequently, vs. time [30]. The following pattern of reduction of the load time history was proposed for optimization: Determination of the equivalent amplitude and mean stress values in the way described above, and calculations of two load levels (t1 and t2), which would be checked in every single fatigue analysis, as is shown in Figure 5.
3. Descriptions of the Material and Manufacturing Technology [1]
Torsion bars are made from high-strength fine-grain spring steel grade 150VCN (according to the EN 10027-1 norm 50CrV4 and by W. Nr. 1.8159). The chemical composition as weight % and mechanical characteristics are listed in Table 1 and Table 2, respectively [2]. The material used was hot rolled, forged, and soft annealed during the manufacturing process. The final shape and properties were achieved with the following mechanical processes: Programmed turning, milling, and polishing. The torsion bar had a diameter of d = 38 mm, root split part diameter Df = 39.81 mm, and length of l = 1971 mm. The spring’s surface was polished to a surface roughness of Ra ≤ 0.2 μm. The torsion bars were hardened via technology A to the required hardness level of 54 ± 1 HRC. Surface rolling and pre-setting were performed as described in [3].
4. Residual Stress Measured at the Splined Part of the Torsion Bar
Measurement of residual stresses was performed using the X-ray method, Pulstec-μ-360 [31]. Measurements with energy X-ray diffraction (EXRD) are based on the Bragg law. The Pulstec μ-X360 portable X-ray analyzer was used in the diffraction method cosα for determining the values of residual stresses. The cosα method also enables high-precision measurements for samples with a certain degree of crystal deformation. They were measured at the point where the stress concentration occurred using numerical analysis. Figure 6 shows the directions in which the individual residual stress components were measured, σx, σy, and both shear stresses τxy and τyx. Table 3 shows the measured stress components on the surface at the root of the tooth. The direction x is longitudinal (parallel with the main center line (CL) of the spring), y is perpendicular to the CL and tangential in the circular direction, and direction z is normal to the surface. The principal stresses, local shear stress τ(t) and the hydrostatic stress σH(t), were calculated on the basis of the measured residual stresses in each direction, taking into account the applied stresses obtained by the FEM analysis [32,33,34,35].
5. Numerical Modeling and Simulation
A detailed 3D geometric model consisting of the torsion bar and clamping ring was used for the finite element model, as is shown in Figure 7. The region of main interest, close to the left splined part, was modeled due to the diminished finite element model. Around one million linear 4 nodes of tetrahedrons describe the finite element model [36]. The elements were finer close to the stress concentration regions, where grooves start on the curved surface and failure can appear. The parts are connected on the interface surfaces with contact properties for normal and tangential behavior [37]. The friction coefficient was set to 0.05 [38]. The ring was fixed on the left frontal surface by fixing all three displacements to zero. The load acted on the right cut surface of the torsion bar [39,40].
Figure 8 shows in more detail the stress concentration (Von Mises) at the root of the torsion bar tooth, in the case of the maximum applied torque Mx = 10.77 kNm, and maximum applied surface shear strength of γ = 0.0125 rad. In the lower-left corner of Figure 8, the stress components of the plane stress state are displayed at the point where the concentration appears, according to the coordinate system.
Figure 8 also shows that, in the case of the maximum applied torque Mx = 10.77 kNm, and maximum applied surface shear strength of γ = 0.0125 caused maximum shear stress τxy = 1075.5 MPa. Shear stress calculated by using shear modulus G (Table 2) the result will be τxy = 1000 MPa. Therefore, the difference between numerical FEM simulation considering complex geometry and theoretical calculation will be 7.5%. Therefore, this brief simple validation shows that the FEM simulation provides quite reliable stresses necessary for further simulation of torque loading of the spring torsion bar.
6. Strain—Stress Analysis
Stress-strain analysis in the roots of the teeth takes into account the residual stresses on the surface, which are the result of the technological processes of manufacturing the teeth and are presented in Section 4. These residual stresses stay permanent in the material. To these stresses are added the applied stresses on the surface at the same point, which are calculated numerically in Section 5, and change over time during the testing of the torsion bar, R = 0. The applied stresses in the load cycle change from 0 to the maximum value defined by the maximum applied shear surface strain of the torsion bar, which is 0.0125 rad, or the maximum applied torque, which is 10.77 kNm. The indicated sum of stresses represents the macroscopic stress tensor Σ(t1) and Σ(t2) at times t1 and t2, as is shown in Figure 9.
The same is considered on the smooth part of the torsion bar, except that the residual stresses on the surface were taken from article [1], and amounted to σx = −460 MPa, σy = −300 MPa, and τxy = −352 MPa, if the x-axis was directed along the body of the torsion bar, and the y axis in a tangential direction transverse to the torsion bar. A plane stress state prevailed on the surface.
According to Equation (1), the local stress tensor follows:
From the local stress tensor, the hydrostatic pressure and the local shear stress were calculated at times t1 and t2, where the maximum shear stress was taken into account.
Figure 10 shows the increase in local shear as a function of hydrostatic stress for different levels of residual stress at the splined part of the torsion bar at points 1 and 2, respectively, Figure 6. The local shear stress τ(t) and the hydrostatic stress σH(t) were determined by the Dang Van criterion, Equation (3). At the mentioned points the stresses in the operation of the external load and the measured residual stresses were taken into account at the same time. The residual stresses were measured by an X-ray device with the cos(α) method (listed in Table 3), while the applied stresses were determined by FEM analysis, as shown in Figure 8.
The actual stress situation is shown by the third curve on the right, Figure 10, i.e., the curve with exactly measured residual stresses (100%). The other curves in Figure 10 were simulated with respect to the level of residual stress (0%—without, 150%, and 175% of the measured residual stresses). The loading path is not linear. The path started in the safe area with increasing and decreasing the local shear stresses until the maximum shear stress overcame the safe area line. It means that fatigue failure will occur after a certain number of cycles. The blue area under the straight line in the graph is the safe area, and the white area above is the unsafe area where crack initiation occurs. The Dang Van fatigue limit represents the starting point of initiation when local shear increases during the load cycle. Figure 10 shows the dependence of the safety factor SF on the residual stresses during the load cycle in the space τ—σH. Safety factor SF is the ratio between the highest calculated local shear stress of the loading path and local shear stress at the point where the Dang Van line crosses the stress loading path. The maximum local shear stress path is a curve that passes through all the last points of the stress paths. Where the curve comes closest to the Dang Van fatigue limit line, the torsion bar will reach the maximum number of load cycles to failure, Figure 10.
Figure 11 shows a different loading path with respect to the residual stresses’ magnitude. Each point on the loading path (with different residual stresses) corresponding to the same loading of torque, was distributed linearly by the step 1.07 kNm. The maximum local shear stress path indicates the optimum residual compressive stresses when the number of load cycles until the failure of the torsion bar was the highest.
Figure 11 shows the change in local shear, depending on the increasing surface shear strain of the smooth part of the torsion bar. Similar to Figure 10, there is a curve that describes the actual stress distribution, taking into account the measured residual stresses’ loading path as 100%. The other curves were simulated with the reduction or enlargement of residual stresses. Figure 11 shows that all points on the straight (green) line are without residual stresses (0%).
Therefore, residual stress in the splined part with an increasing shear strain angle comes together to green points and has the trend to decrease local shear stress τ(t) under higher shear strain than the path with zero residual stresses. It is also possible to recognize that higher residual stress (e.g., 150% path or 175% path) contributed to higher local shear stress τ(t), as can be seen in Figure 12 for the 175% residual stress level.
Figure 12 shows the increase in local shear as a function of hydrostatic stress for different levels of residual stress at the surface of the smooth part of the torsion bar. The stresses in the operation of the external load and the residual stresses were considered at the same loading stage. The residual stresses were defaulted from [1], while the externally applied stresses were determined by analytical calculation, as follows:
where d is the diameter of the smooth part and Mx is the torque.
The actual stress situation is shown by the third (green) curve on the right, Figure 12, i.e., the curve with 100% residual stresses. The other curves in Figure 12 were simulated with respect to reduced (0% and 50%), or with respect to increased, residual stresses (150%, 200%, and 250%). The blue area in the graph is the safe area, and the white area is the unsafe area where crack initiation occurs. The Dang Van fatigue limit represents the starting point of initiation when local shear increases during the load cycle. Figure 12 shows the change in local shear, depending on the increasing surface shear strain of the smooth part of the torsion bar. Similar to Figure 11, there is a curve that describes the actual stress distribution, taking into account 100% of the measured residual stresses. The other curves were simulated with the reduction or enlargement of the residual stresses. The maximum local shear stress path is a curve that passes through all the last points of the stress paths. Where the curve comes closest to the Dang Van fatigue limit line, the torsion bar will reach the maximum number of load cycles to failure, Figure 13.
Figure 13 shows that the smooth part compresses residual stresses in a path of 100% with respect to the local shear stress at the highest shear strain because the higher residual stresses reduced the local shear stress when the points lay under the straight line (0% of residual stresses). Figure 13 also shows that more compressed residuals e.g., 200% (double) stress do not, because the increase of the gradient becomes steeper.
Figure 14 shows the principal stress path considering the maximum constant torque loading and varying residual stresses from zero to σx = −460 MPa, σy = −300 MPa, and τxy = −352 MPa. Figure 14 shows the maximum local shear stress paths vs. hydrostatic stress, which represent a curve that passes through the last stages of load cycles with different residual stress values, for the splined part, blue, and red for the smooth part of the torsion bar. Where the curve comes closest to the Dang Van fatigue limit line, the torsion bar will reach the maximum number of load cycles to failure, then the size of the residual stress is optimal.
The maximum local shear stress path curves can be approximated as analytical functions as follows:
- (a)
- Splined part:
- (b)
- Smooth part:
The same approach was applied for the estimation of the benefit of both mentioned technologies, A and B, as was mentioned in the Introduction chapter of this paper. Figure 15 shows the increase in local shear as a function of hydrostatic stress at the smooth part of the torsion bar comparatively, independent of the residual stress introduced by technologies A and B. The stresses in the service of the external load and the residual stresses were taken into account at the same stage of the loading cycle, as shown in Figure 14, with the relevant points used in the analysis. The residual stresses were defaulted from [1], while the external stresses were determined by Equation (6). The Dang Van fatigue limit represents the starting point of initiation when local shear increases during the load cycle.
Figure 16 shows the change in local shear, depending on the increasing surface shear strain of the smooth part of the torsion bar. Similar to Figure 15, the residual stresses were defaulted from [1]. One can see that technology A for cold pre-stress provides a similar maximum of local stresses as the solid line without residual stresses, while technology B contributed to higher local shear stress all the time of the loading cycle.
7. Conclusions
The article discusses the effect of residual stresses on torsion bars by using the Dang Van fatigue criterion at the stress concentration at the root of the tooth and the smooth part of the torsion bar. The torsion bar is designed properly when the splined part root diameter Df is higher than the smooth part diameter d. In the case when the difference between those diameters is small, Df/d < 1.05, the root zone of the tooth is more sensitive to fatigue crack initiation and propagation than the smooth part of the torsion bar. In the smooth part of the torsion bar residual stresses are introduced by the processes of surface rolling and pre-deformation in the torsional direction, so that the torsional stress in the outer layers of the cross-section exceeds the plasticity limit. In this way, sufficiently high compressive stresses are introduced so that there is a significant retardation in the initiation of the fatigue crack, and, consequently, a longer lifetime of the torsion bar.
At the splined part, at the point of the stress concentration, it is difficult to influence the residual stresses with a controlled technological process, and the complex stress state of residual stresses is due to the manufacturing process and is random. The magnitude of the stress concentration at this point can be reduced structurally by increasing the Df/d ratio.
The results show that high compress residual stresses have a negative effect on the lifetime unless they are half as low as measured. Since the safety factor at the splined part is slightly higher than on the smooth part of the torsion bar, we can expect the torsion bar to break in the smooth part earlier than in the splined part. Therefore, it can explain when fatigue cracks and failure can appear in the smooth part and when in the splined part.
However, the results show that the introduction of residual stresses by rolling in the splined part of the torsional bar should, under control, produce approximately half of the yield stress of spring steel.
Due to the residual stresses a drop in the local shear occurs during the load cycle, which, in principle, leads to retardation of the crack initiation.
At the smooth part of the torsion bar, where the induction of residual stresses is controlled by the manufacturing process, the compressed residual stresses increase the lifetime. The opposite effect, decreasing lifetime, is achieved when it comes to exaggeration in compression.
In practice, there are two methods of applying residual stresses, technologies A and B. A comprehensive analysis of both technologies shows that the too-high compressive residual stresses achieved by technology B did not retard fatigue crack initiation in the outer layers of the torsion bar cross-section. In this paper, we provided an explanation of the reduction of safety with respect to different residual stress levels in both parts of the torsional bar, the smooth and splined parts, during the whole loading cycle. The analysis showed that, for both parts of the spring, the overdose of residual stress magnitude introduced by cold rolling can have a negative influence on local shear stress.
Here, again, using the Dang Van criterion, we proved that technology B is useless for the manufacture of torsion bars because it moves the entire load cycle outside the safe area.
In any case, the paper proved that is possible to determine the optimal values of compressive residual stresses, separately in the smooth and splined parts, in order to achieve the maximum lifetime of each area of the torsion bar.
Author Contributions
Conceptualization, N.G.; methodology, N.G.; software, J.P.; formal analysis, V.M.; investigation, V.M.; writing—original draft preparation, V.M. All authors have read and agreed to the published version of the manuscript.
Funding
This research received no external funding.
Data Availability Statement
Not applicable.
Acknowledgments
The authors acknowledge the Slovenian Research Agency ARRS for funding the Research Program P2-0137 “Numerical and experimental analysis of nonlinear mechanical systems”.
Conflicts of Interest
The authors declare no conflict of interest.
References
- Močilnik, V.; Gubeljak, N.; Predan, J. Effect of Residual Stresses on the Fatigue Behavior of Torsion Bars. Metals 2020, 10, 1056. [Google Scholar] [CrossRef]
- Močilnik, V.; Gubeljak, N.; Predan, J. Model for fatigue lifetime prediction of torsion bars subjected to plastic Pre-setting. Teh. Vjesn. 2011, 18, 537–546. [Google Scholar]
- Perenda, J.; Trajkovski, J.; Žerovnik, A.; Prebil, I. Modeling and experimental validation of the surface residual stresses induced by deep rolling and Pre-setting of a torsion bar. Int. J. Mater. Form. 2016, 9, 435–448. [Google Scholar] [CrossRef]
- ABAQUS6.13SolverSimulia. Available online: https://www.3ds.com/products-services/simulia/products/abaqus/ (accessed on 28 March 2023).
- Cerullo, M. Application of Dang Van criterion to rolling contact fatigue in wind turbine roller bearings. In Proceedings of the 13th International Conference on Fracture, Beijing, China, 16–21 June 2013. [Google Scholar]
- Korsunsky, A.M.; Peridas, G.; Hills, D. An Extension of the Dang Van Fatigue Criterion to Finite Life Predictions. J. Mech. Behav. Mater. 2009, 19, 269–278. [Google Scholar] [CrossRef]
- Charkaluk, E.; Constantinescu, A.; Maitournam, H.; Dang Van, K. Revisisting the Dang Van criterion. Procedia Eng. 2009, 1, 143–146. [Google Scholar] [CrossRef]
- Hofmann, F.; Gratiela, B.; Constantinescu, A.; Ferjani, M. Numerical Exploration of the Dang Van High Cycle Fatigue Criterion: Application to Gradient Effects. J. Mech. Mater. Struct. 2009, 2, 293–308. [Google Scholar] [CrossRef]
- Araujo, A.J.; Mamiya, N.E.; Castro, V.R. On the Application of the Dang Van Criterion in Fretting Fatigue. Part I: Assesment of Contact Size Effects. In Proceedings of the 17th International Congress of Mechanical Engineering, Sao Paulo, Brazil, 10–14 November 2003. [Google Scholar]
- Brandao, J.A.; Meheux, M.; Seabra, J.H.O.; Ville, F.; Castro, J. Traction curves and ~ rheological parameters of fully formulated gear oils. Proc. Inst. Mech. Eng. Part J J. Eng. Tribol. 2011, 225, 577–593. [Google Scholar] [CrossRef]
- Desimone, H.; Bernasconi, A.; Beretta, S. On the application of Dang Van criterion to rolling contact fatigue. Wear 2006, 260, 567–572. [Google Scholar] [CrossRef]
- Lieshout, P.S.; Besten, J.H.; Kaminski, M.L. Validation of the corrected Dang Van multiaxial fatigue criterion applied to turret bearings of FPSO offloading buoys. Ships Offshore Struct. 2017, 4, 521–529. [Google Scholar] [CrossRef]
- Tschegg, E.K. A contribution to mode III fatigue crack propagation. Mater. Sci. Eng. 1982, 54, 127–136. [Google Scholar] [CrossRef]
- Makabe, C.; Socie, D.F. Crack growth mechanisms in precracked torsion fatigue specimens. Fatigue Fract. Eng. Mater. Struct. 2001, 24, 607–615. [Google Scholar] [CrossRef]
- Yang, F.P.; Kuang, Z.B. Fatigue crack growth for a surface crack in a round bar under multi-axial loading condition. Fatigue Fract. Eng. Mater. Struct. 2005, 28, 963–970. [Google Scholar] [CrossRef]
- Tanaka, K.; Kato, T.; Akinawa, Y. Prediction of fatigue crack propagation behaviour from a pre-crack under combined torsional and axial loadings. In Proceedings of the International Conference on Fatigue Crack Paths, Parma Italy, 18–20 September 2003. [Google Scholar]
- Mrzyglod, M.; Zielinski, P.A. Numerical implementation of multiaxial high-cycle fatigue criterion to structural optimisation. J. Theor. Appl. Mech. 2006, 44, 691–712. [Google Scholar]
- Peridas, G.; Hills, D.A. Crack initiation: The choice of tests available to calibrate Dang Van’s criterion. Fatigue Fract. Eng. Mater. Struct. 2002, 25, 321–330. [Google Scholar] [CrossRef]
- Zenner, H.; Simbürger, A.; Liu, J. On the fatigue limit of ductile metals under complex multiaxial loading. Int. J. Fatigue 2000, 22, 137–145. [Google Scholar] [CrossRef]
- Dang Van, K. Multiaxial fatigue criteria based on a multiscale approach. J. Lemaître. Handb. Mater. Behav. Model. Acad. Press 2001, 2, 457–463. [Google Scholar]
- Močilnik, V.; Gubeljak, N.; Predan, J.; Flašker, J. The influence of constant axial compression pre-stress on the fatigue failure of torsion loaded tube springs. Eng. Fract. Mech. 2010, 77, 3132–3142. [Google Scholar] [CrossRef]
- Zhang, L.; Liu, D.; Song, Q.; Liu, S. An analytical expression of reliability solution for Drucker-Prager criterion. Appl. Math. Mech. 2008, 29, 121–128. [Google Scholar] [CrossRef]
- Bernasconi, A.; Foletti, S.; Papadopoulos, I.V. A study on combined torsion and axial load fatigue limits tests with stresses of different frequencies. Int. J. Fatigue 2008, 30, 1430–1440. [Google Scholar] [CrossRef]
- Golos, K.M. Multiaxial fatigue criterion with mean stress effect. Int. J. Press. Vessel. Pip. 1996, 69, 236–266. [Google Scholar] [CrossRef]
- Susmel, L.; Tovo, R.; Lazzarin, P. The mean stress effect on the high-cycle fatigue strength from a multiaxial fatigue point of view. Int. Journao Fatigue 2005, 27, 928–943. [Google Scholar] [CrossRef]
- Wang, C.H.; Miller, K.J. The effect of mean shear stress on torsional fatigue behaviour. Fatigue Fract. Eng. Mater. Struct. 1991, 14, 293–307. [Google Scholar] [CrossRef]
- Pishro, A.A.; Zhang, Z.; Pishro, M.A.; Liu, W.; Zhang, L.; Yang, Q. Structural Performance of EB-FRP-Strengthened RC T-Beams Subjected to Combined Torsion and Shear Using ANN. Materials 2022, 15, 4852. [Google Scholar] [CrossRef] [PubMed]
- Piotrowski, R.; Szychowski, A.; Vičan, J. Elastic Critical Resistance of the Simple Beam Grillage Resulting from the Lateral Torsional Buckling Condition: FEM Modelling and Analytical Considerations. Materials 2023, 16, 1346. [Google Scholar] [CrossRef]
- Piotrowski, R.; Szychowski, A. The Effect of Steel Beam Elastic Restraint on the Critical Moment of Lateral Torsional Buckling. Materials 2022, 15, 1275. [Google Scholar] [CrossRef] [PubMed]
- Dang Van, K. Macro-Micro Approach in High-Cycle Multiaxial Fatigue. In ASTM STP 1191; McDowel, D.L., Ellis, R., Eds.; ASTM International Philadelphia: West Conshohocken, PA, USA, 1993; pp. 120–130. [Google Scholar]
- Pulstec Ltd. μ-X360s Portable X-ray Residual Stress Analyzer; Pulstec Industrial Co., Ltd.: Shizuoka, Japan, 2015. [Google Scholar]
- Gross, D.; Seilig, T. Fracture Mechanics; Springer: Berlin/Heidelberg, Germany, 2016. [Google Scholar]
- Papuga, J.; Halama, R. Mean stress effect in multiaxial fatigue limit criteria. Arch. Appl. Mech. 2019, 89, 823–834. [Google Scholar] [CrossRef]
- Sines, G. Behaviour of metals under complex static and alternating stresses. In Metal Fatigue; Sines, G., Waisman, J.L., Eds.; Mc Graw Hill: New York, NY, USA, 1959; pp. 145–169. [Google Scholar]
- Močilnik, V.; Gubeljak, N.; Predan, J. Surface residual stresses induced by torsional plastic pre-setting of solid spring bar. Int. J. Mech. Sci. 2015, 92, 269–278. [Google Scholar] [CrossRef]
- Lamprecht, M.; Leonhartsberger, M. Tool Stiffness Calculation in Roll Forming. Int. J. Simul. Model. 2021, 20, 40–51. [Google Scholar] [CrossRef]
- Sun, L.Q.; Jiang, K.; Zeng, Q.L.; Gao, K.D.; Zhang, X.D. Influence of Drum Cutting Height on Shearer Cutting Unit Vibration by Co-Simulation Method. Int. J. Simul. Model. 2021, 20, 111–122. [Google Scholar] [CrossRef]
- Dang Van, K.; Griveau, B.; Message, O. On a New Multiaxial Fatigue Limit Criterion: Theory and Application, Biaxial and Miltiaxial Fatigue. In EGF 3; Brown, M.W., Miller, K.J., Eds.; Mechanical Engineering Publications: London, UK, 1989; pp. 479–496. [Google Scholar]
- Nishimura, Y.; Yanase, K.; Tanaka, Y.; Miyamoto, N.; Miyakawa, S.; Endo, M. Effect of mean shear stress on the torsional fatigue strengthn of a spring steel with small scratches. Int. J. Damage Mech. 2020, 29, 4–18. [Google Scholar] [CrossRef]
- Mayer, H.; Schuller, R.; Karr, U.; Fitzka, M.; Irrasch, D.; Hahn, M.; Bacher-Horst, M. Mean stress sensitivity and crack initiation mechanisms of spring steel for torsional and axial VHCF loading. Int. J. Fatigue 2016, 93, 309–317. [Google Scholar] [CrossRef]
Figure 1.
Finished torsion bar with a smooth part length of 1971 mm.

Figure 2.
Initiation causes of the splined torsion bar (a) drawing of detail with splined and smooth part and (b) top view on smooth and splined bar of spring.
Figure 2.
Initiation causes of the splined torsion bar (a) drawing of detail with splined and smooth part and (b) top view on smooth and splined bar of spring.

Figure 3.
Broken torsion bar due to initiation at the root of the spline after 300,000 loading cycles. (a) Fracture surface; (b) Secondary cracks at the initiation point after a metallographic cut.
Figure 3.
Broken torsion bar due to initiation at the root of the spline after 300,000 loading cycles. (a) Fracture surface; (b) Secondary cracks at the initiation point after a metallographic cut.

Figure 4.
Dang Van fatigue limit corresponding to a = 0.75 and b = 600 MPa.
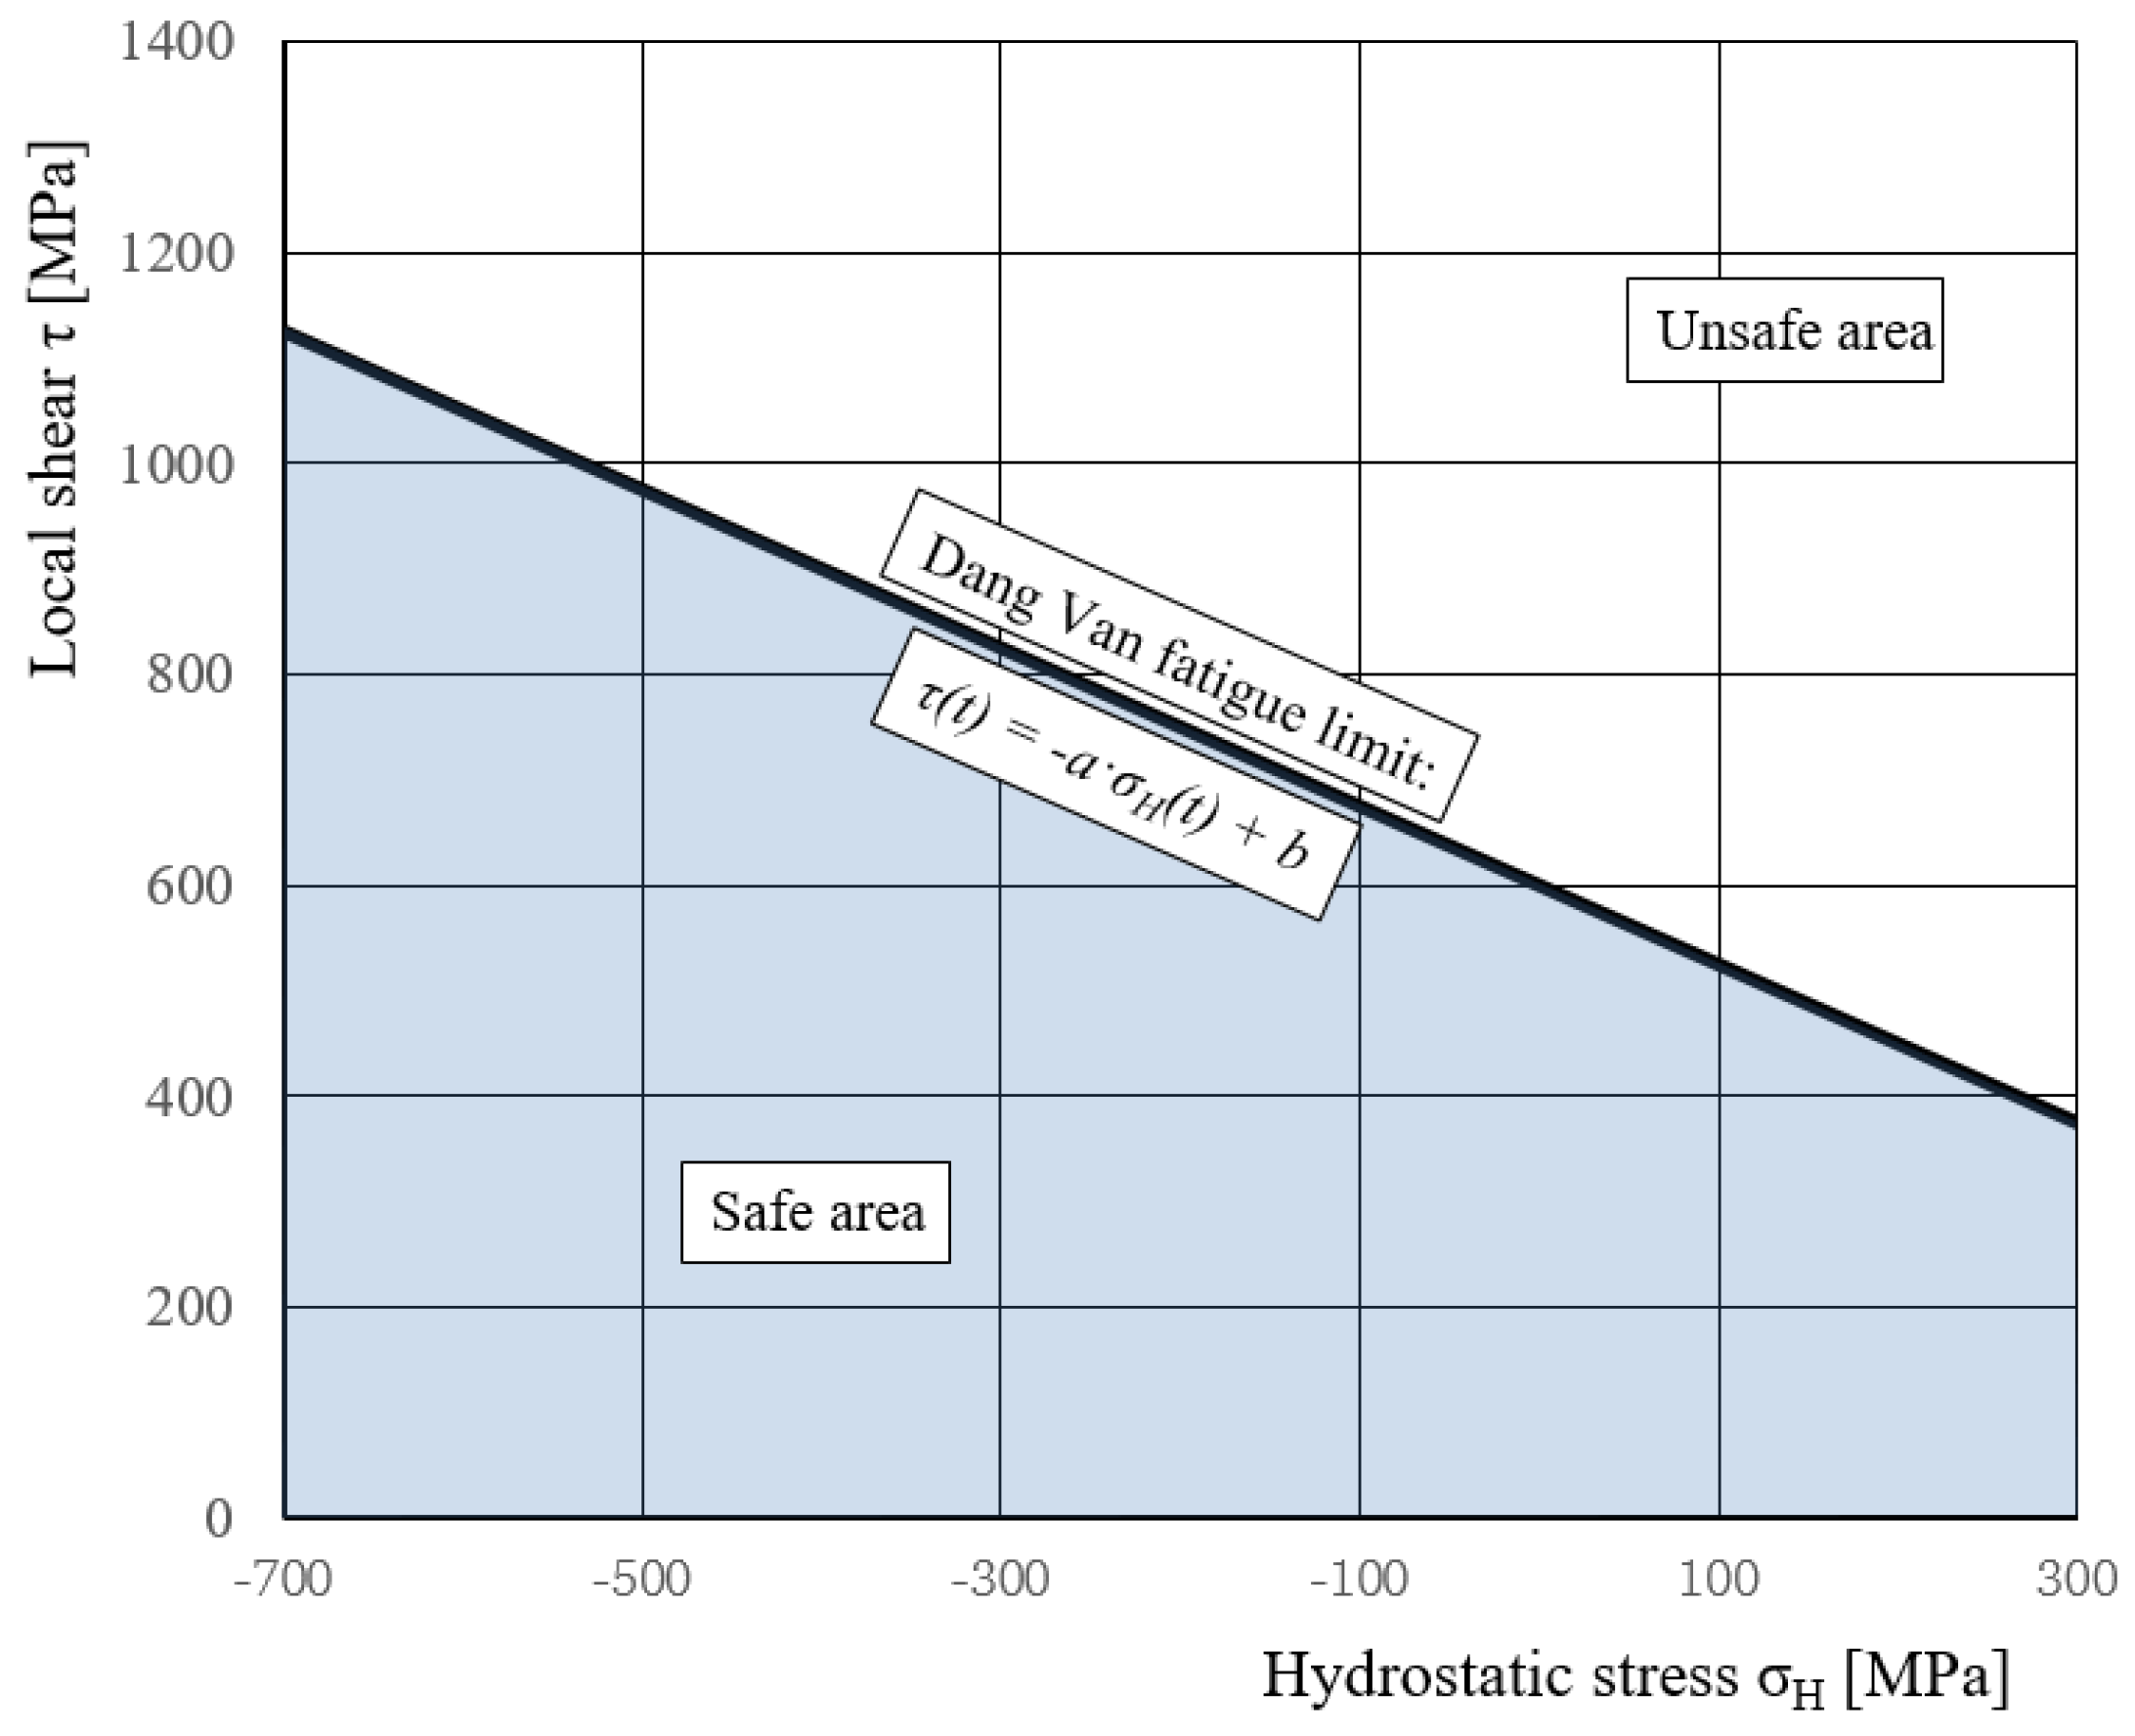
Figure 5.
Dang Van loading cycle with schematic σmin and σmax points.

Figure 6.
Coordinate system of the measured stress components, where 1 and 2 are marked points where measurements of residual stresses have been performed.
Figure 6.
Coordinate system of the measured stress components, where 1 and 2 are marked points where measurements of residual stresses have been performed.

Figure 7.
The 3D finite element model, boundary conditions, and load.

Figure 8.
Von Mises stress state at the maximum applied torsion surface shear strength γ = 0.0125 rad.
Figure 8.
Von Mises stress state at the maximum applied torsion surface shear strength γ = 0.0125 rad.

Figure 9.
Time-dependent macroscopic stress tensor.

Figure 10.
Local shear as a function of hydrostatic stress according to the Dang Van criterion for different levels of the residual stress of the splined part at points 1 and 2 (Figure 6), respectively.
Figure 10.
Local shear as a function of hydrostatic stress according to the Dang Van criterion for different levels of the residual stress of the splined part at points 1 and 2 (Figure 6), respectively.
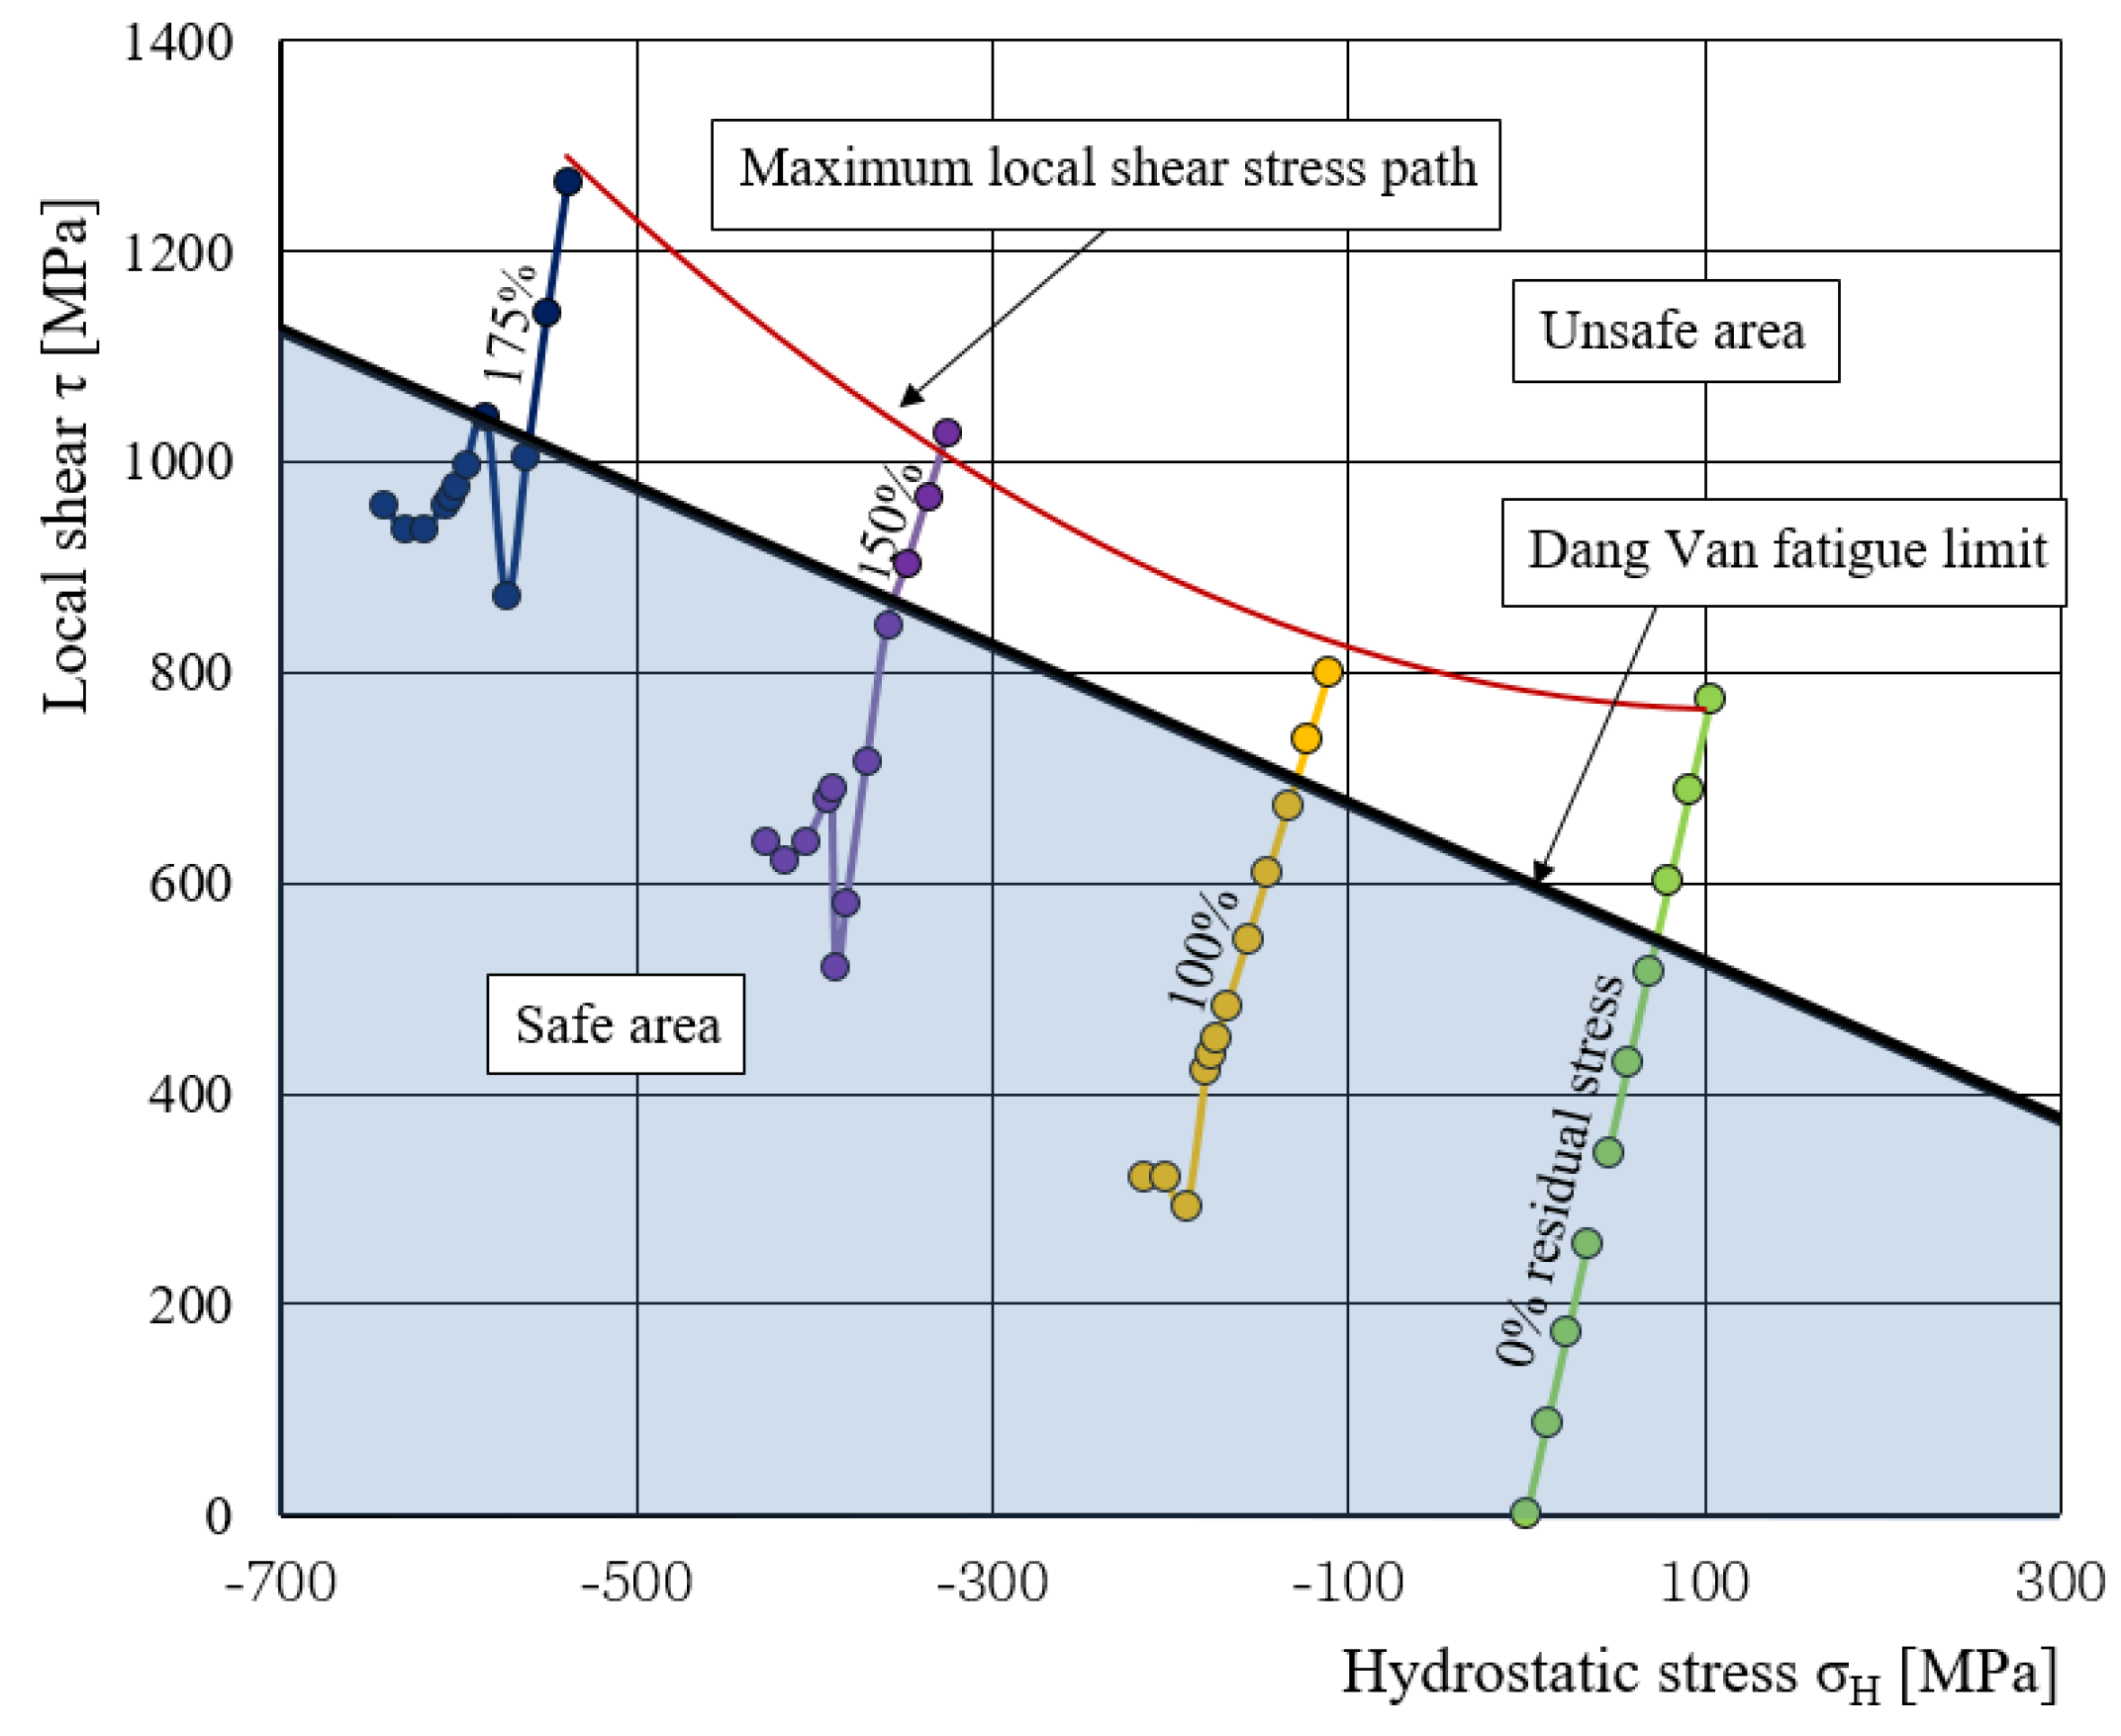
Figure 11.
Local shear as a function of the applied surface shear strain of the splined part.

Figure 12.
Local shear as a function of hydrostatic stress according to the Dang Van criterion for different levels of the residual stress of the smooth part of the torsion bar.
Figure 12.
Local shear as a function of hydrostatic stress according to the Dang Van criterion for different levels of the residual stress of the smooth part of the torsion bar.

Figure 13.
Local shear as a function of the applied surface shear strain of the smooth part.

Figure 14.
Maximum local shear stress paths in the splined part and at the smooth part of the torsion bar, where the optimums are at different points.
Figure 14.
Maximum local shear stress paths in the splined part and at the smooth part of the torsion bar, where the optimums are at different points.

Figure 15.
Local shear as a function of hydrostatic stress according to the Dang Van criterion for the case without residual stresses, with residual stresses according to technologies A and B, respectively.
Figure 15.
Local shear as a function of hydrostatic stress according to the Dang Van criterion for the case without residual stresses, with residual stresses according to technologies A and B, respectively.

Figure 16.
Local shear as a function of the applied surface shear strain of the smooth part, with residual stresses according to technologies A and B, respectively.
Figure 16.
Local shear as a function of the applied surface shear strain of the smooth part, with residual stresses according to technologies A and B, respectively.


Table 1.
Chemical composition in wt % of the material used, is equal to that in [3].
Table 1.
Chemical composition in wt % of the material used, is equal to that in [3].
| C | Si | Mn | Ni | Cr | Mo | V | Cu | S | P | |
|---|---|---|---|---|---|---|---|---|---|---|
| Actual val. | 0.44 | 0.28 | 0.56 | 1.41 | 0.87 | 0.26 | 0.11 | 0.12 | 0.002 | 0.009 |
| Min. | 0.42 | 0.17 | 0.5 | 1.3 | 0.8 | 0.2 | 0.1 | 0 | 0 | 0 |
| Max. | 0.5 | 0.37 | 0.8 | 1.8 | 1.1 | 0.3 | 0.18 | 0.25 | 0.002 | 0.009 |
Table 2.
Average mechanical properties of the torsion bar for different loading ratios R = σmin/σmax.
Table 2.
Average mechanical properties of the torsion bar for different loading ratios R = σmin/σmax.
| Yield Strength Rp0.2 [MPa] | UTS Rm [MPa] | Poisson ν - | Torsion Elastic Limit τe [MPa] | Shear Modulus G [GPa] | Modulus E [GPa] | Tensile Fatigue Limit R = 0 [MPa] | Tensile Fatigue Limit R = −1 [MPa] | Torsion Fatigue Limit R = −1 [MPa] |
|---|---|---|---|---|---|---|---|---|
| 1570 ± 3 | 2010 ± 8 | 0.206 | 800 ± 4 | 80 | 193 | 1200 ± 5 | 800 ± 5 | 520 ± 3 |
Table 3.
Measured stress components at the point of the stress concentration in MPa.
| Measurement | σx | σy | τxy | τyx | σz |
|---|---|---|---|---|---|
| 1 | −648.4 | −381.6 | −42.8 | −147.1 | 0 |
| 2 | −1016.8 | −521.2 | −48.8 | −120.5 | 0 |
| Average | −832.6 | −451.4 | −45.8 | −133.8 | 0 |
Disclaimer/Publisher’s Note: The statements, opinions and data contained in all publications are solely those of the individual author(s) and contributor(s) and not of MDPI and/or the editor(s). MDPI and/or the editor(s) disclaim responsibility for any injury to people or property resulting from any ideas, methods, instructions or products referred to in the content. |
© 2023 by the authors. Licensee MDPI, Basel, Switzerland. This article is an open access article distributed under the terms and conditions of the Creative Commons Attribution (CC BY) license (https://creativecommons.org/licenses/by/4.0/).
Share and Cite
MDPI and ACS Style
Močilnik, V.; Predan, J.; Gubeljak, N. Effect of Residual Stresses on Fatigue Strength on the Smooth and Splined Parts of Spring Torsion Bars. Metals 2023, 13, 1004. https://doi.org/10.3390/met13061004
AMA Style
Močilnik V, Predan J, Gubeljak N. Effect of Residual Stresses on Fatigue Strength on the Smooth and Splined Parts of Spring Torsion Bars. Metals. 2023; 13(6):1004. https://doi.org/10.3390/met13061004
Chicago/Turabian StyleMočilnik, Vinko, Jožef Predan, and Nenad Gubeljak. 2023. "Effect of Residual Stresses on Fatigue Strength on the Smooth and Splined Parts of Spring Torsion Bars" Metals 13, no. 6: 1004. https://doi.org/10.3390/met13061004
Note that from the first issue of 2016, this journal uses article numbers instead of page numbers. See further details here.