Article

Evolutions of Microstructure and Impact Toughness of Submerged Arc Weld Metal via Introducing Varied Si for Weathering Bridge Steel

1
State Key Laboratory of Metastable Materials Science and Technology, Yanshan University, Qinhuangdao 066004, China
2
China Railway Science & Industry Group Co., Ltd., Changsha 410131, China
3
Hebei Key Lab for Optimizing Metal Product Technology and Performance, Yanshan University, Qinhuangdao 066004, China
*
Author to whom correspondence should be addressed.
Metals 2023, 13(9), 1506; https://doi.org/10.3390/met13091506
Submission received: 28 July 2023 / Revised: 18 August 2023 / Accepted: 20 August 2023 / Published: 22 August 2023
(This article belongs to the Special Issue Advances in Weathering Bridge Steels)

Abstract

:
In this paper, the influence of the silicon (Si) content on microstructure and impact property of submerged arc weld metals (WMs) for weathering bridge steel was clarified. Actual submerged arc welding (SAW) was carried out to produce WMs with 0.18 wt.%, 0.36 wt.%, 0.51 wt.%, and 0.60 wt.% of Si. The low temperature impact property of weld metal was detected, and the weld microstructures were characterized by optical microscopy (OM), scanning and transmission electron microscope (SEM and TEM), and electron backscatter diffraction (EBSD). The results indicate that WMs consist of polygon ferrite (PF), acicular ferrite (AF), granular bainitic ferrite (GBF), and martensite/austenite (M/A) constituents in each Si content. With increasing Si, the proportion of PF increased, while AF and GBF coarsened, the area fraction, fM/A, and the mean size, dM/A, of M/A constituents increased, the number of inclusions decreased, but the size increased. Further, the fraction of high-angle grain boundaries (HAGBs) with the misorientation tolerance angles (MTAs) greater than 15° reduced, while the mean equivalent diameter, MEDMTA≥15°, of ferrite grains with HAGBs increased. Accordingly, the impact toughness of WM was degraded from 108.1 J to 39.4 J with the increase in Si. The increase in M/A constituents and inclusions size reduced the critical fracture stress, thereby formation of larger microcracks and cleavage planes occurred. The reduced HAGBs exhibited a low hindering effect on crack propagation, and, consequently, the impact toughness decreased with increasing Si content.

1. Introduction

The weathering bridge steels, containing Cu, Cr, and Ni, can attain robust mechanical properties via a thermo-mechanical controlled process, as well as enough atmospheric corrosion resistance by forming a stable rust layer [1,2,3]. Generally, a traditional arc welding process is applied for this type of low-alloy steel structure manufacturing. In particular, the SAW with high cladding efficiency is preferred in the welding of medium and thick plates [4,5,6]. It is widely required in engineering that the corrosion resistance and strength of the WMs should match with the base metal, and alloying elements, such as Cu, Cr, and Ni, are also commonly added to the weld [7,8]. However, abundant alloying elements cause a poor weld ability of weathering steel, and gas holes and a large number of inclusions are often found in welds, and contain a high proportion of granular bainitic ferrite (GBF) and coarse hard-phase martensite/austenite (M/A) constituents, which cause serious damage to the metallurgical quality and impact performance of WMs [9,10,11].
Optimization of alloy elements can modulate the properties of WMs. Some scholars [12,13,14,15] reported that the toughness of WMs of weathering steel can be improved by optimizing the content of Cu, Cr, and Ti. Among these reports, Si, as an indispensable alloying element for weathering steel welds, improves corrosion resistance and also plays a role of solid solution strengthening for WMs of weathering steel [16,17,18]. Meanwhile, Si triggers deoxidation with Mn in the welding process, i.e., reduces the oxygen content in the weld and minimizes the oxidation of beneficial alloying elements [19]. In addition, Si can improve the flow and wetting characteristics of the weld pool [20], thereby enhancing the metallurgical quality of WMs. Nevertheless, Chai et al. [21] reported that Si content in WMs of low-alloy steel should not exceed 0.6 wt.% to ensure good elongation and toughness. John et al. [22] pointed out that 0.14 wt.% to 0.63 wt.% of Si progressively lowered the impact values of WMs in Si–Mn steel due to the hard phase M/A constituents. Boniszewski [23] reported that more than 0.2 wt.% Si can prevent porosity. Moreover, the limit of Si content of submerged arc welding wires of YS-Cu (≤0.30 wt.% for YS-CuC2 and ≤0.50 wt.% for YS-CuC3 and YS-CuC4), TH500/550/600-NQ (≤0.35 wt.%) have been specified by Japanese JIS Z3351 [24] and Chinese TB/T 2374 [25] standards, respectively. Accordingly, it is essential to study the influence of Si content on weld toughness and metallurgical quality for weathering steel. This study further reveals the role of Si in WMs of weathering steel. However, as far as we know, similar research has not been reported yet.
For this attempt, we prepared the submerged arc welding atmospheric corrosion resisting wires with Si content of 0.15 wt.%, 0.32 wt.%, 0.45 wt.%, and 0.56 wt.% to be subjected to SAW. The weld microstructure, inclusions, and impact properties were examined systematically after welding. In particular, the difference in the crack initiation and propagation behavior of WMs caused by varying Si content was studied. Finally, the range of Si content for favorable weldability of weathering steel is proposed.

2. Experimental Procedure

The welding wire steels with varied Si contents were melted by an 80 kg vacuum induction furnace; the chemical composition of ingots is shown in Table 1. The preparation process of the atmospheric corrosion resisting wires was subjected to the forging of welding wire ingots, hot rolling of wire rods (φ 6.5 mm), rough drawing (φ 5.5 mm), fine drawing (φ 4.0 mm), and copper plating. In addition, four pair of plates with dimensions of 32 × 400 × 150 (RD) mm3 were cut from weathering bridge steel for butt welding; the chemical composition of base metal is shown in Table 2. The symmetrical Double-V type grooves with an angle of 60° were machined (Figure 1a). Panasonic single-wire SAW machine was used in the welding process. High basicity agglomerated flux (2.0 ≤ BIIW ≤ 2.1) was prepared and baked at 350 °C for 2 h before welding; the chemical composition of flux is also compiled in Table 2. The parameters used during the SAW process were: voltage of 31–33 V, current of 560–580 A, welding speed of 20 m·h−1, inter-pass temperature below 130 °C, and the corresponding heat input of ~30 kJ·cm−1. After no defects were found through ultrasonic testing (after 24 h of welding), the composition of the weld was tested, as given in Table 3. Next, the impact toughness of WMs was detected. The samples were taken 2 mm below the center of the weld, the pre-machined size was 80 (RD) × 10 × 10 mm3, and samples etched by 4% nitric acid alcohol, and Charpy V-notch (CVN) position of the WMs was determined (V-notch was made in the direction of thickness). Further samples were machined into the standard impact dimensions of 55 × 10 × 10 mm3 for impact test (Figure 1a–c). The impact property of the WMs was tested three times using JB-300B impact tester for each Si content. Moreover, the round bars with the dimensions of 80 (RD) × φ6 mm2 were taken from the WMs. Typical 30 kJ·cm−1 welding thermal cycle was simulated by Gleeble-3500 thermal simulation machine for varied Si content. The influence of Si on the critical temperature of γ (austenite)→α (ferrite) transformation was measured via a dilatometer attached to the thermal simulated round bars (Figure 1d).
The weld microstructure for each Si content from the fracture was observed after impact testing performance (cutting the fractures 3 mm below the upper surface perpendicular to V-notch). Microstructural examination was performed by optical microscopy (OM, Axiover-200MAT, Germany), scanning electron microscopy (SEM, SU-5000, JPN), and transmission electron microscope (Talos F200x, Germany). The specimens for OM and SEM were sanded, polished, and etched in 4% nitric acid alcohol. Samples were first directly used under OM for the observation of inclusions, and then re-polished and etched with LePera’s reagent for observing M/A constituents by OM. The number of inclusions in the field of view of 1 mm2 was calculated, and more than 1000 inclusions were randomly selected from 20 fields of view. The size distribution characteristics of inclusions were analyzed using Image-Pro software. Further, samples of 3 mm were cut from WMs with different Si contents and prepared for TEM examination. Samples were sanded to ~50 μm thickness using coarse and thin sandpapers, and then thinned to perforation on twin-jet equipment (TenuPol-5, Germany) with an electrolyte consisting of 5% perchloric acid and 95% ethyl alcohol. Orientation of the weld microstructures was investigated by the electron-backscattered diffraction microscopy (EBSD, JPN) equipped on SEM (the corresponding specimens were prepared by electrolytic polishing with a solution of 90% methyl alcohol and 10% perchloric acid).
Furthermore, the macro- and micro-morphologies of impact fractures for each WM were analyzed by SEM. The fracture surfaces were cut perpendicular to V-notch; the internal fracture characteristics were observed after sanding, polishing, and etching with 4% nitric acid alcohol (Figure 1e).

3. Results

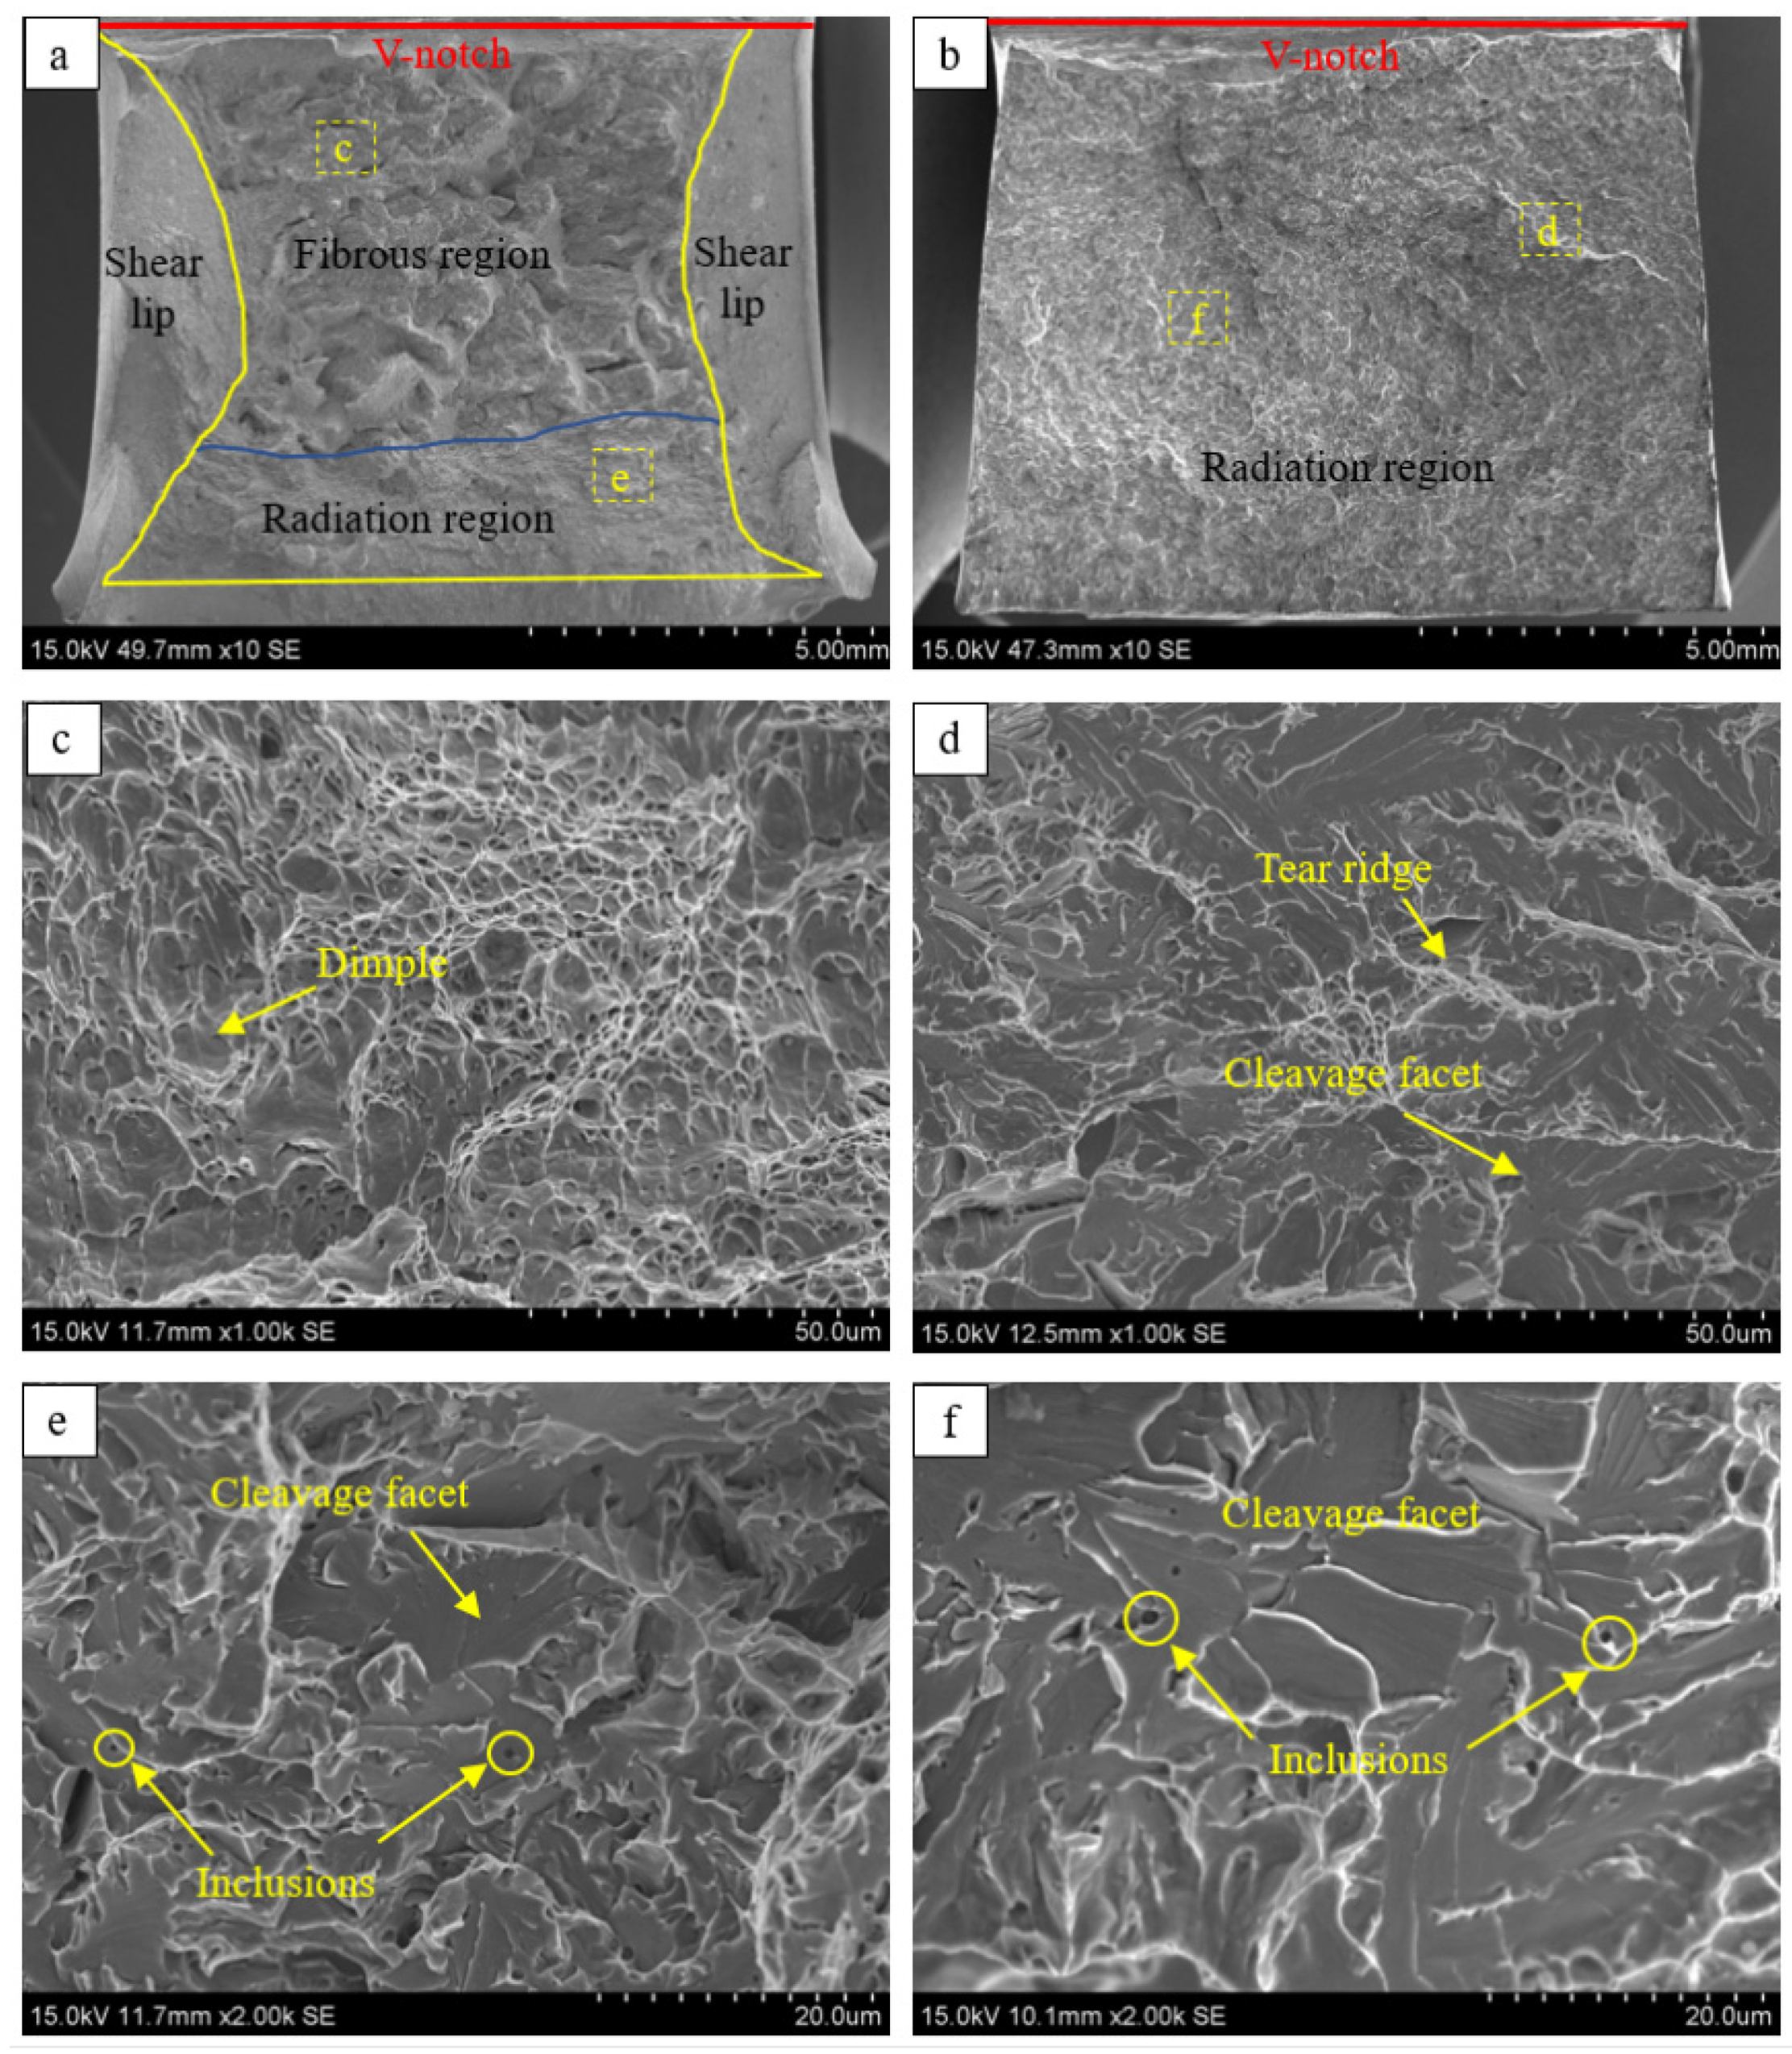
3.1. Impact Toughness and Fracture Characteristics

Figure 2 presents the CVN impact absorbed energy of WMs with varied Si content. As Si increases from 0.18 wt.% to 0.36, 0.51 wt.%, and 0.60 wt.%, the low-temperature impact energy decreases monotonously, and its average value decreases from 108.1 J to 90.6 J, 69.3 J, and 39.4 J, respectively. The growing Si content leads to a gradual deterioration in the toughness of the WM.
SEM images of the fracture surface of the WM are shown in Figure 3. The fracture surface of welds with 0.18 wt.% of Si is mainly a ductile fracture, and shear lips are observed at the fracture edge. The fiber zone accounts for a high proportion, i.e., mainly consisting of small circular and deep dimples (Figure 3c). The radiation zone consists of cleavage surfaces, and small inclusions occur in the center of some small cleavage surfaces (Figure 3e). As Si content increases to 0.60 wt.%, the fracture surface exhibits typical cleavage fracture morphology. By zooming in on local areas, a few tear ridges with ductile characteristics can be seen, but the tear ridges possess small cleavage surfaces and shallow dimples. The size of the cleavage surface of WM60 is significantly larger than that of WM18. Relatively large inclusions are observed in the center of the large cleavage surface.

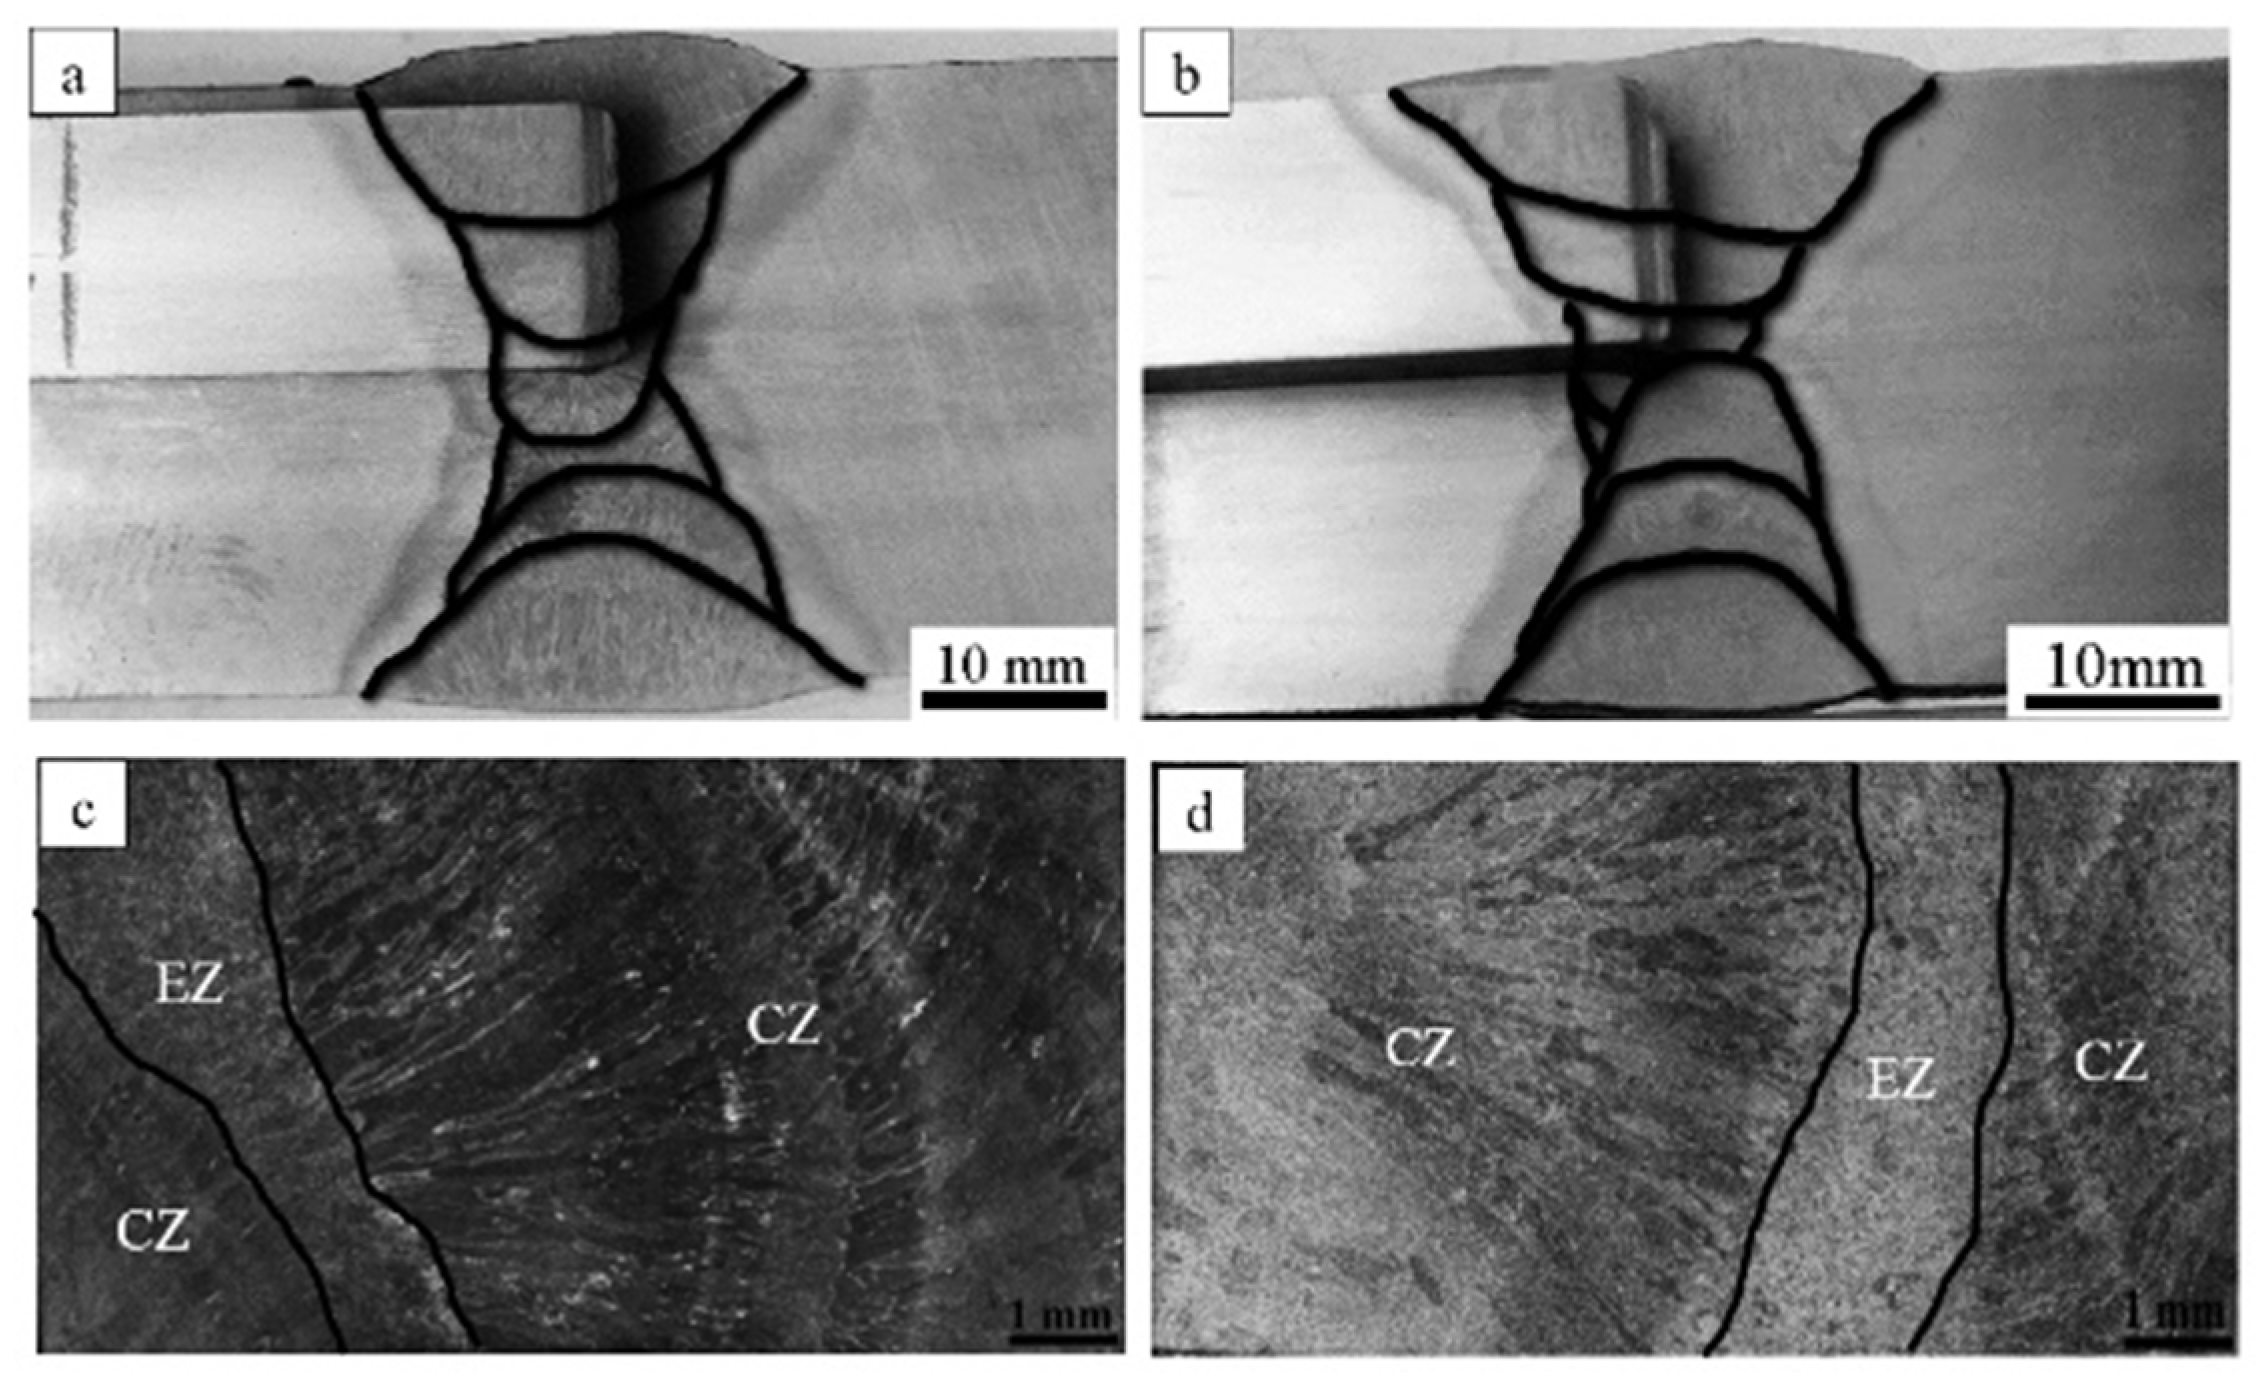
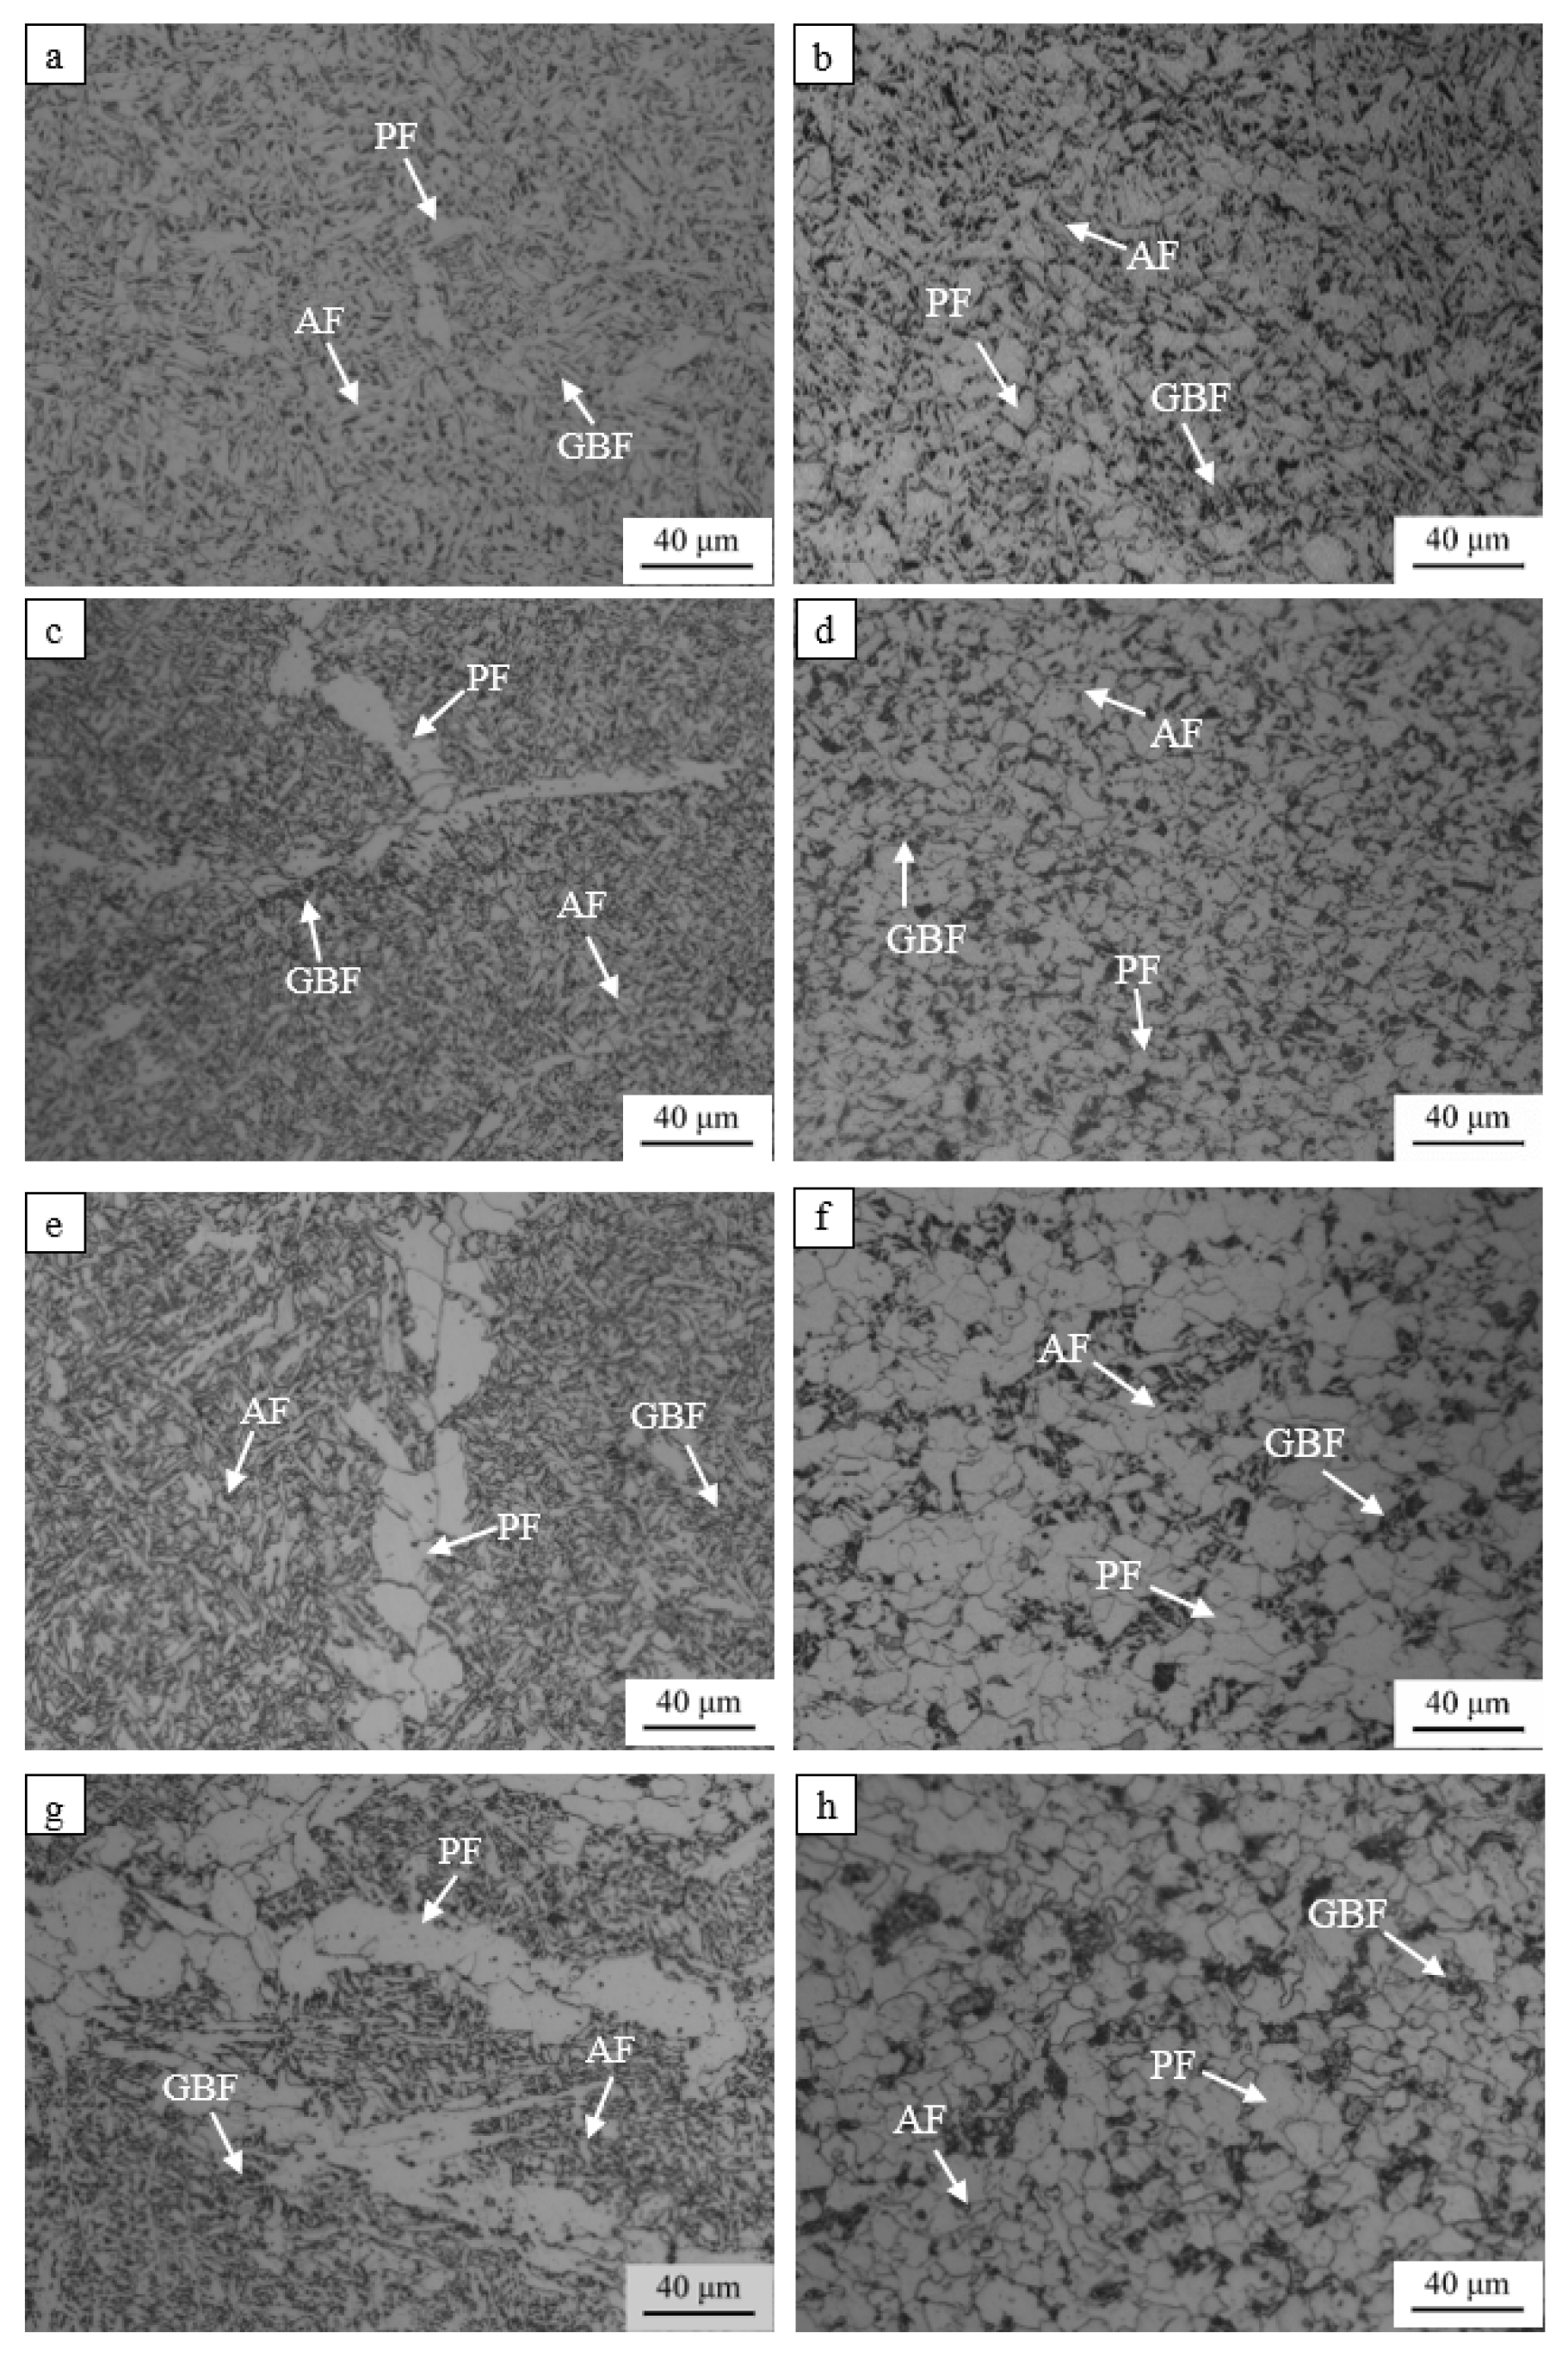
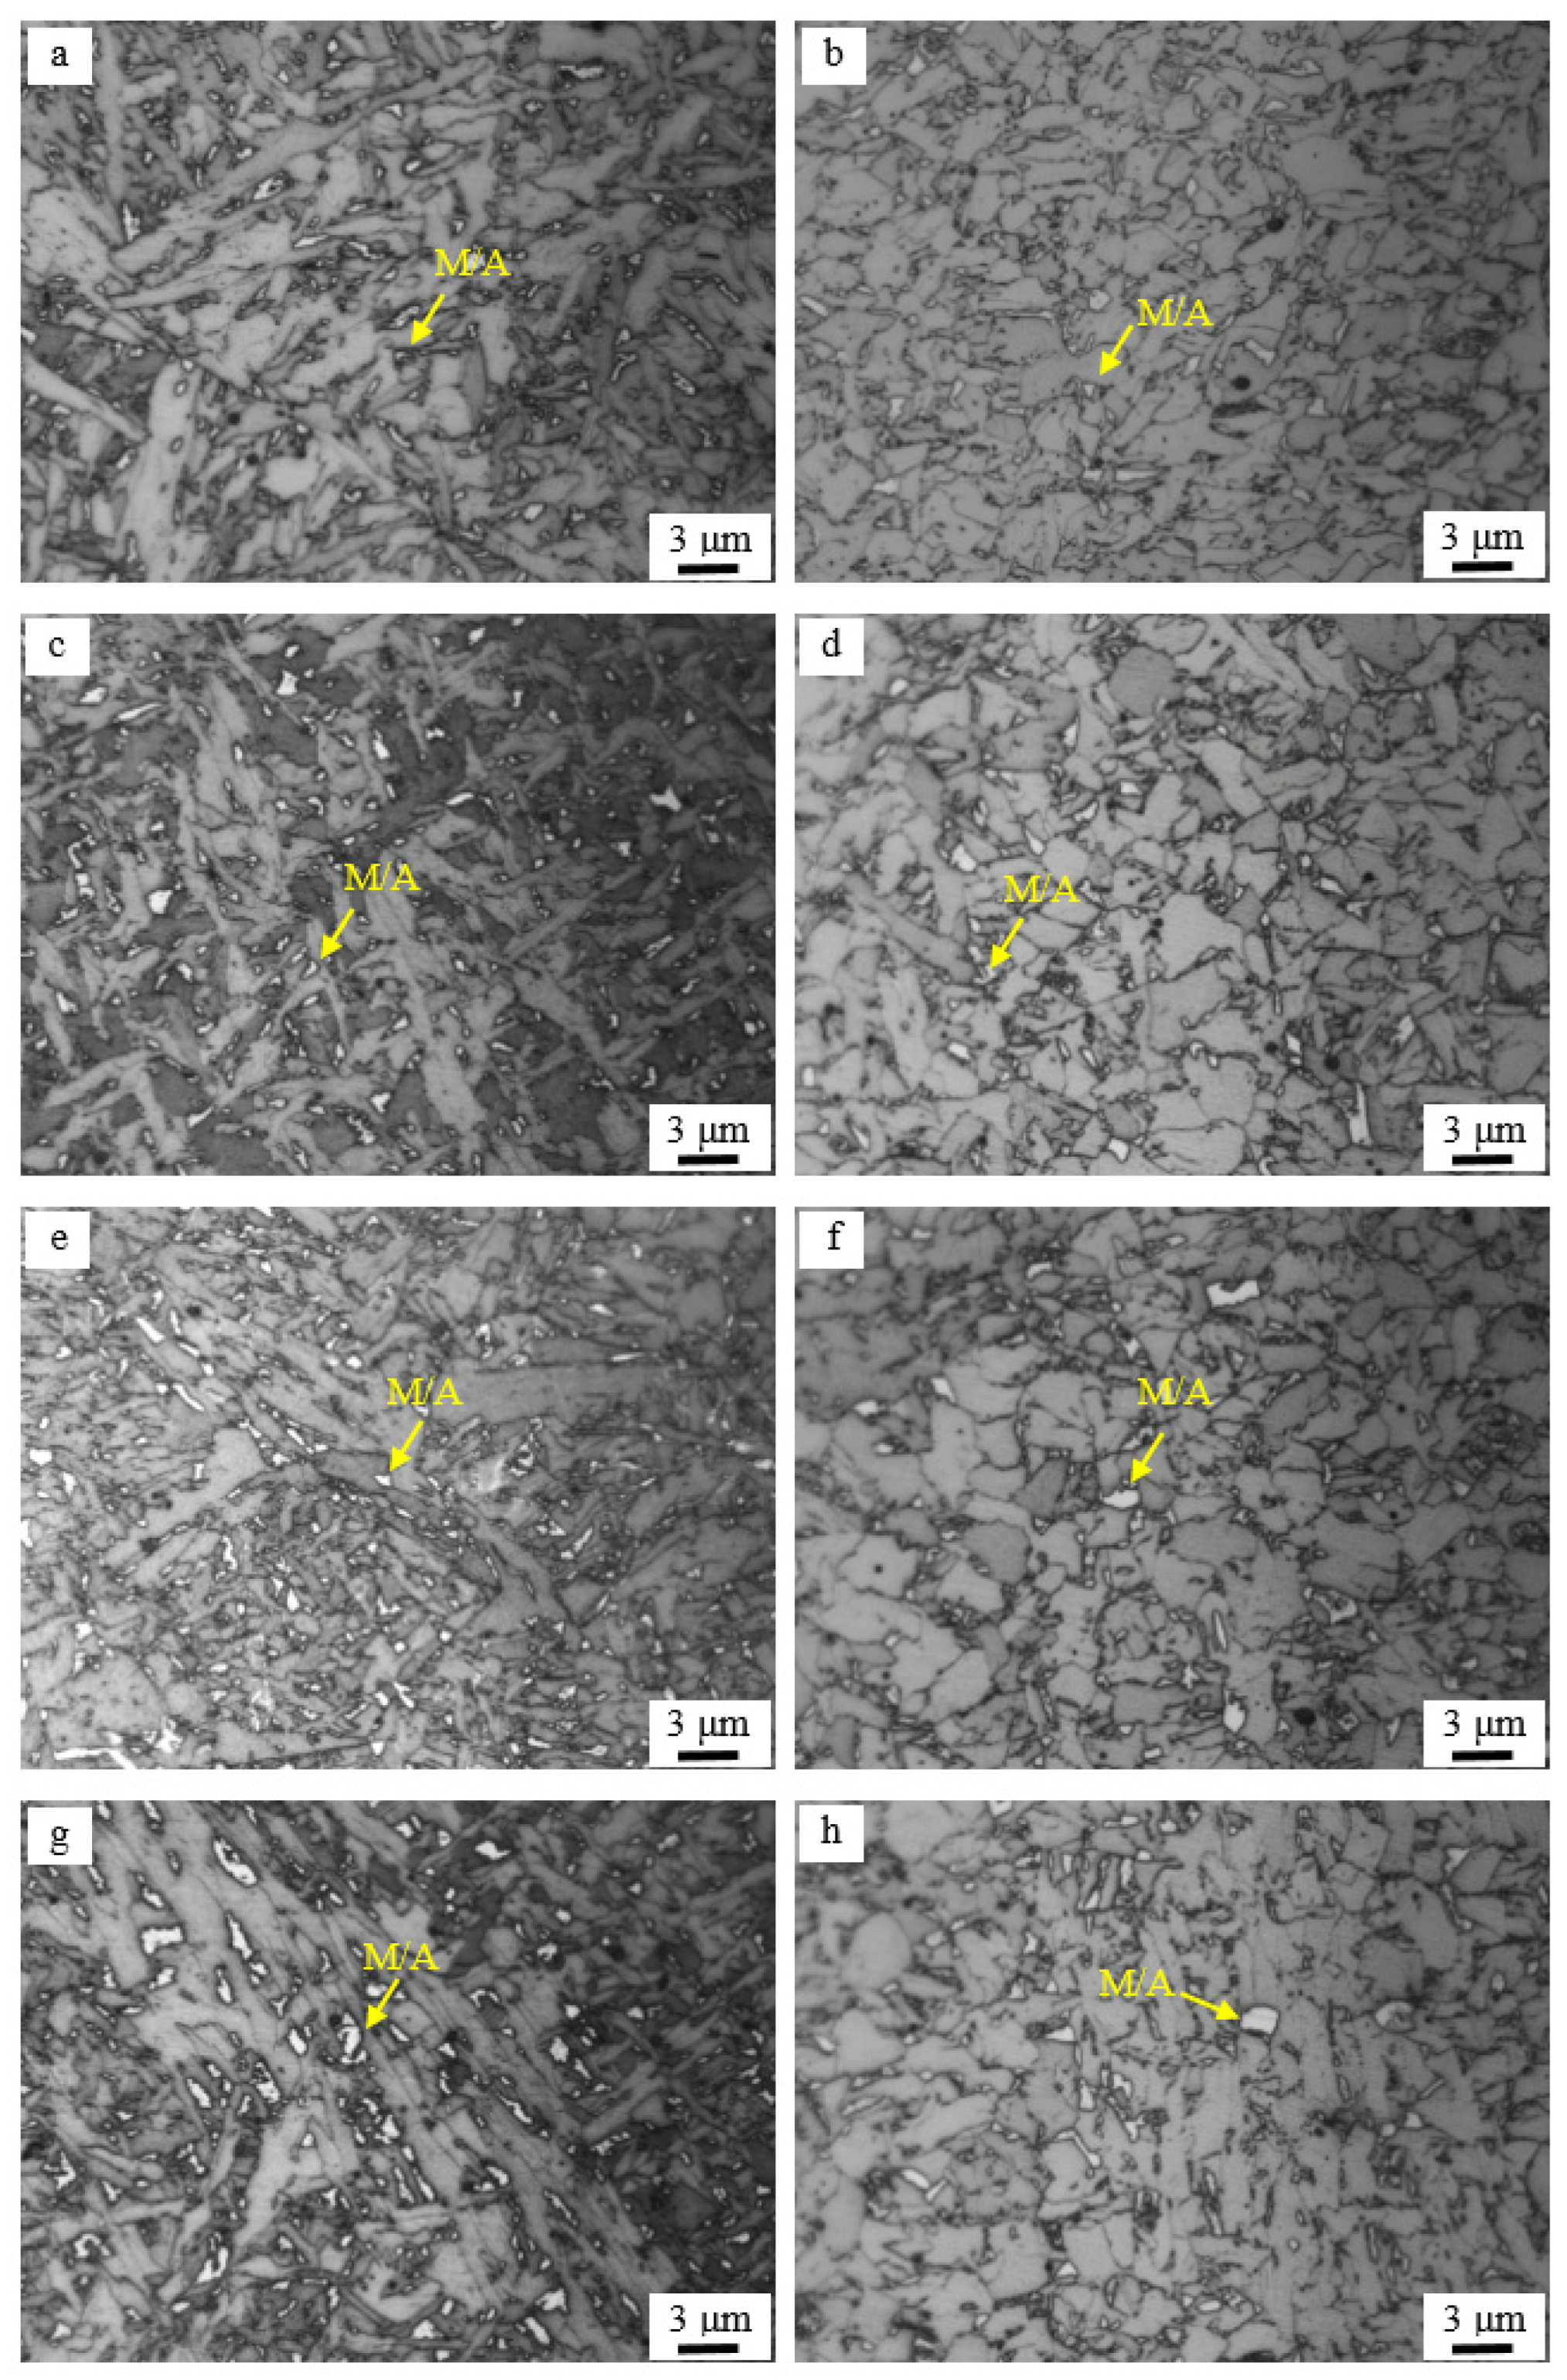
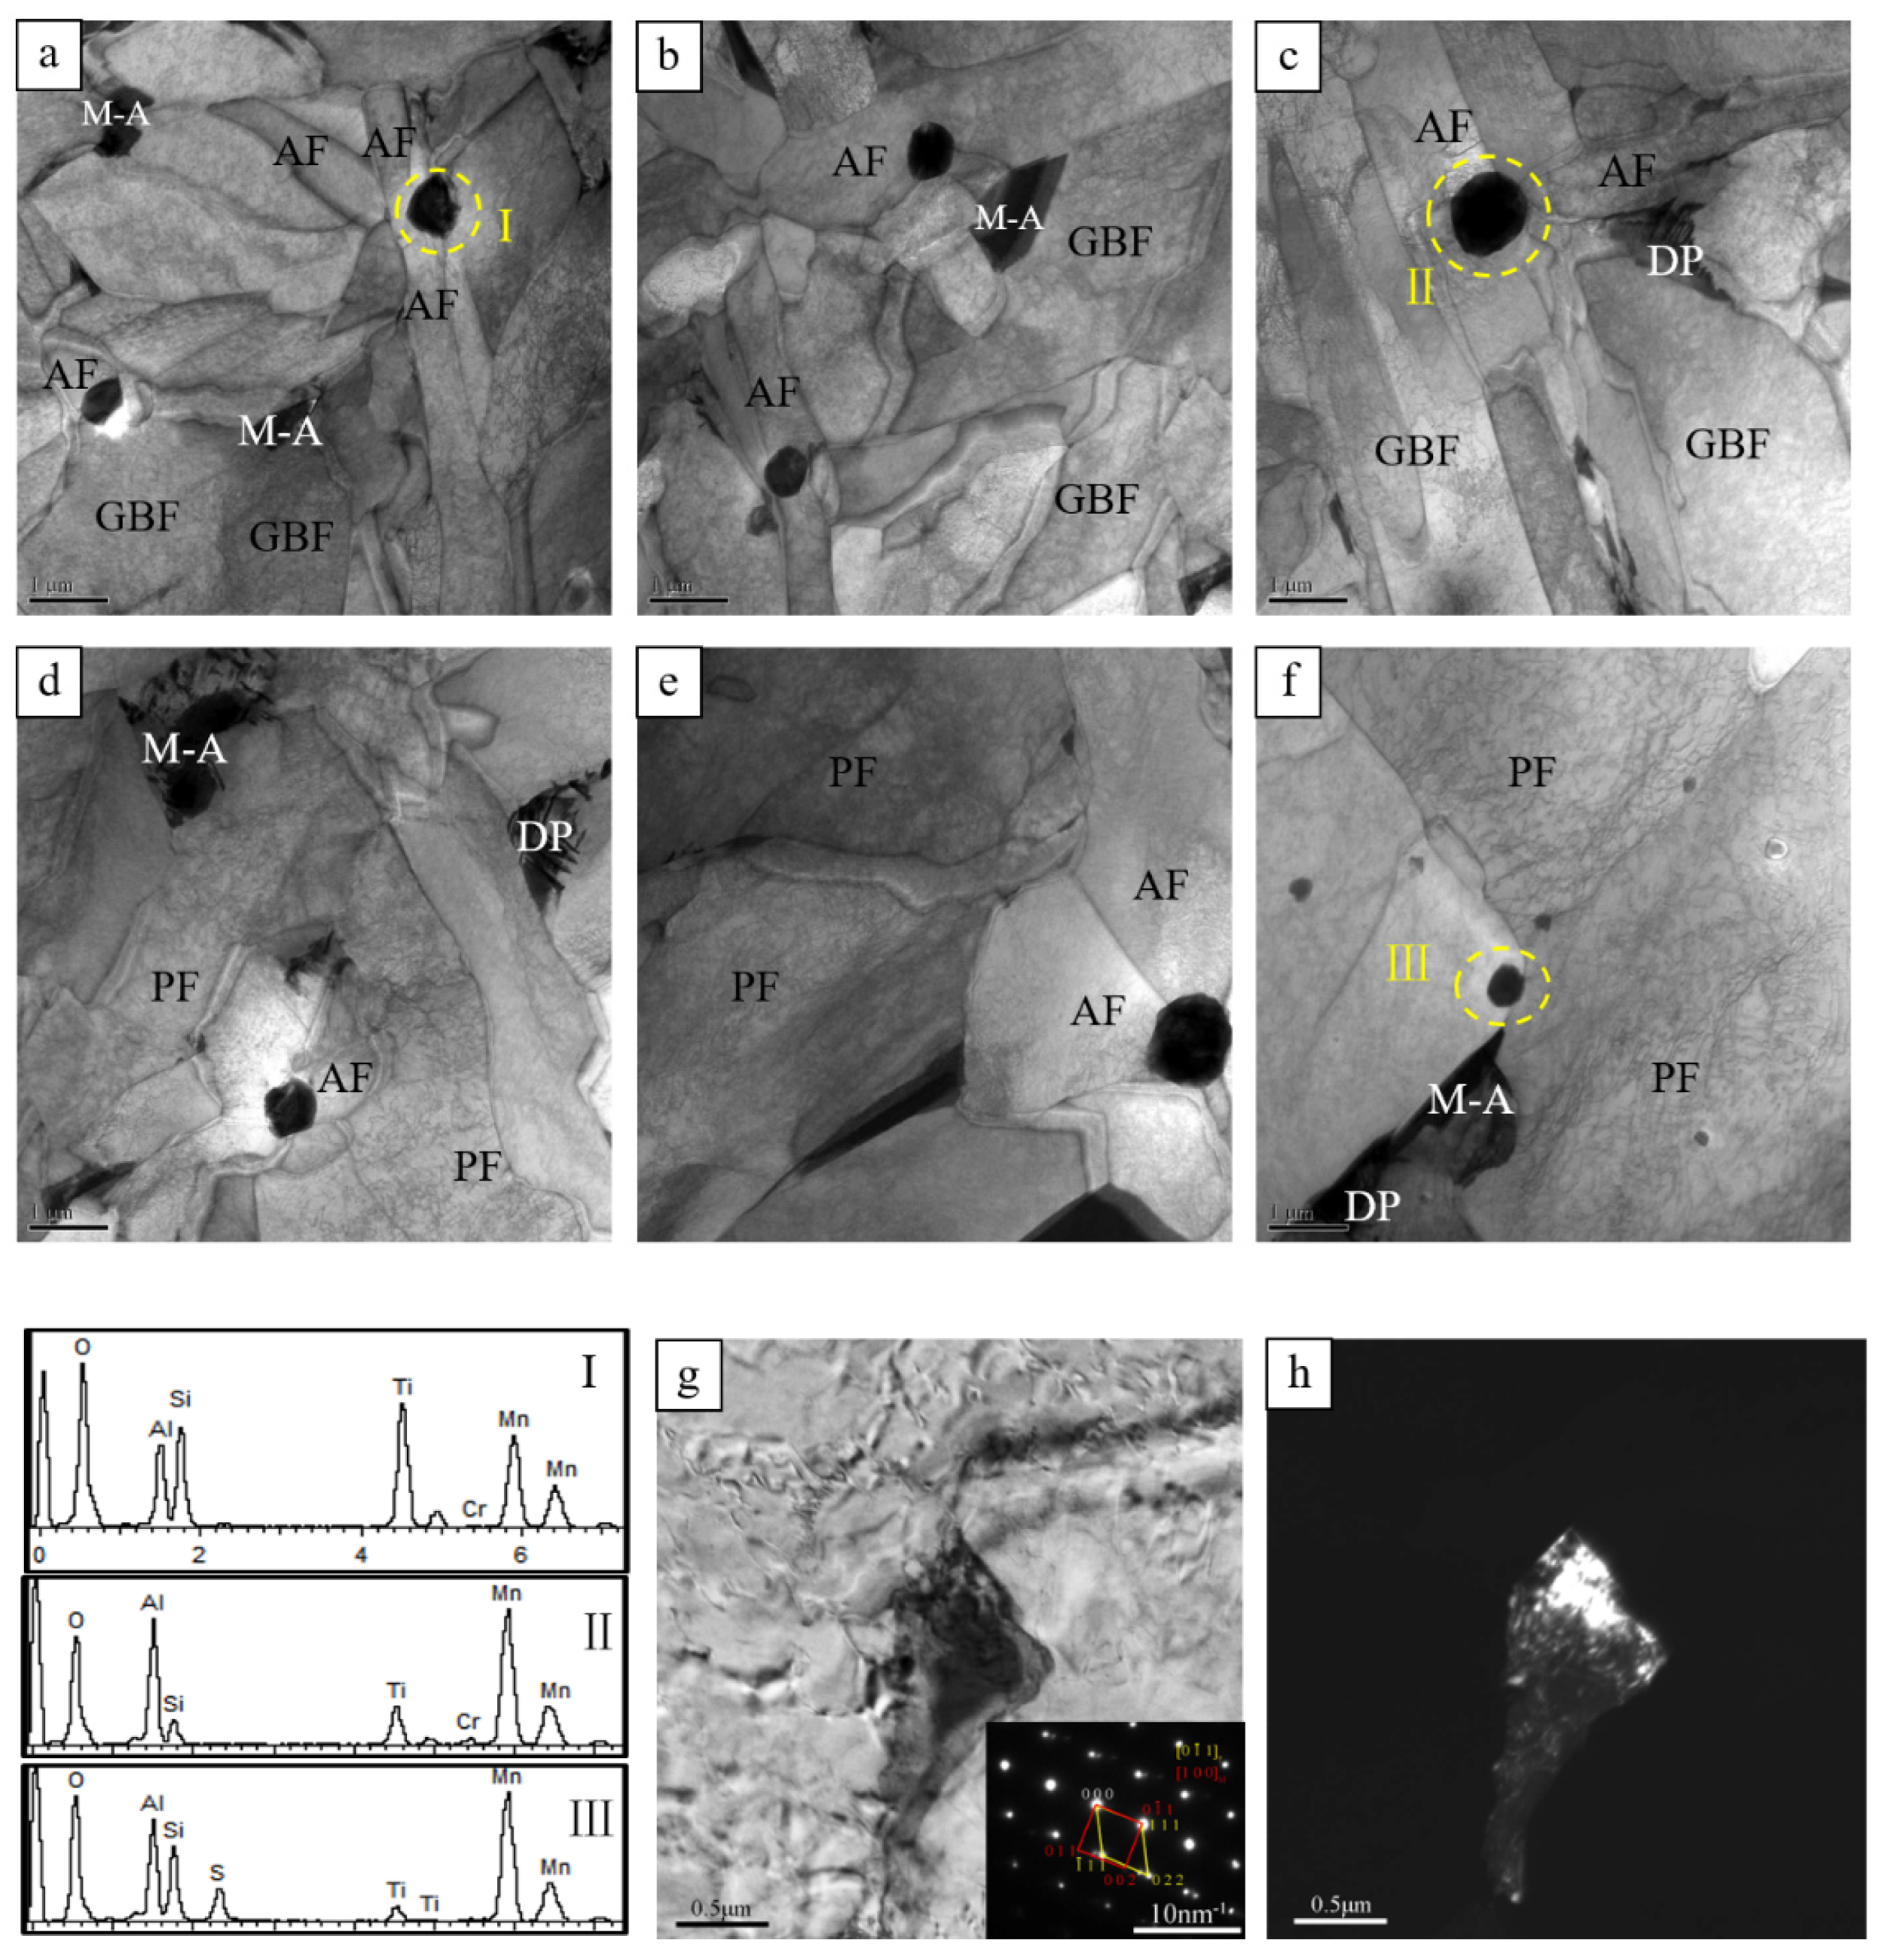
3.2. Microstructural Characteristics

The impact specimens and the macro sections of the welded joint were etched with 4% nitric acid and alcohol, respectively. The location of impact sampling and weld area in the impact specimens are shown in Figure 4a,b. In addition, the weld area in the impact specimen was restored by Panorama Studio 3Pro software (Figure 4c,d). The weld impact specimen included two areas, namely, the columnar crystal zone (CZ) and the equiaxed crystal zone (EZ). The CZ structure grows at a certain angle along the centerline of the weld, while EZ mainly refers to the heat-affected area of the upper layer of weld bead to the next layer of weld bead in multi-layer multi-pass welding [26,27].
The microstructure of CZ and EZ is further observed by OM, as shown in Figure 5. For the CZ region, the microstructures include acicular ferrite (AF), granular bainitic ferrite (GBF), and polygonal ferrite (PF) phases, with the increase in Si content in weld, the number fraction of PF is increased, and AF and GBF coarsened. For the EZ region, the microstructures are also composed of AF, GBF, and PF phases; PF occupies a higher proportion compared to CZ region, and the size and number fraction of PF are increased with a growing amount of Si in the weld, while the AF and GBF also experience coarsening.
M/A constituents in WMs after corrosion are shown in Figure 6. It corroded and transformed into a bright white color in CZ and EZ regions. With the increase in Si content in the WM, the size and area fraction of M/A constituents in CZ and EZ are obviously increased. Further, more than 1000 M/A constituents in 15 fields of view were used to estimate the impact of Si on their size and area fraction via the Image-Pro software, as shown in Table 4. For the CZ region, as Si increases from 0.18 wt.% to 0.60 wt.%, the area fraction of M/A constituents increases from 5.50% to 8.43%, while the mean size increases from 0.60 μm to 0.87 μm, respectively. For the EZ region, the area fraction of M/A constituents increases from 5.18% to 7.90%, while the average size of M/A constituents increases from 0.68 μm to 0.98 μm, respectively.
OM images of weld inclusions are shown in Figure 7; the corresponding statistics of the number and size distributions of inclusions are shown in Figure 8a,b, respectively. With the increase in Si content (from 0.18 wt.% to 0.60 wt.%) in the WM, the number of inclusions is decreased sharply, but the grain size of inclusions is increased. The number of inclusions in 1 mm2 field of view is reduced from 535 to 305, however, the average diameter of inclusions is increased from 0.47 μm to 0.81 μm.
Inverse pole figure maps of CZ and EZ regions were obtained from EBSD analysis, as shown in Figure 9. The HAGBs are defined as MTAs of boundaries higher than 15° and marked by black lines, while the low-angle grain boundaries (LAGBs) with MTAs ranging from 2° to 15° are marked by white lines [28]. The mean equivalent diameter (MED) of grains with boundaries at MTAs higher than 15° (MEDMTA>15°) and the fraction of boundaries at MTAs higher than 15° (fMTA>15°) for each Si content were estimated, as shown in Figure 10 and Table 4. As Si content in WM increases from 0.18 wt.% to 0.60 wt.%, the fraction of fMTA>15° is decreased (CZ: 55% → 41%; EZ: 46% → 37%). Meanwhile, MEDMTA>15° is stimulated (CZ: 3.3 μm → 5.3 μm; EZ: 4.3 μm → 6.5 μm).
Moreover, weld microstructure of CZ (Figure 11a–c) and EZ (Figure 11d,f) were also characterized via TEM. The microstructure of weld was composed of ferrite laths and black island structures. In addition, heterogeneous nucleation of AF is observed on complex inclusions, and some inclusions are covered by ferrite growth and do not show nucleation ability. The energy dispersive spectroscopy (EDS) analysis of inclusions (with/without nucleation) is counted in Figure 11 (I–III), and the results show that the inclusions are composed of Al-Mn-Si-Ti-O composites. With the increase in Si content in WMs from 0.18 wt.% to 0.60 wt.%, the width of the ferrite laths is increased for CZ and EZ. The island structure is identified as an M/A constituent by selected area electron diffraction (SAED) pattern and the light/dark field, as shown in Figure 11g,h.

4. Discussion

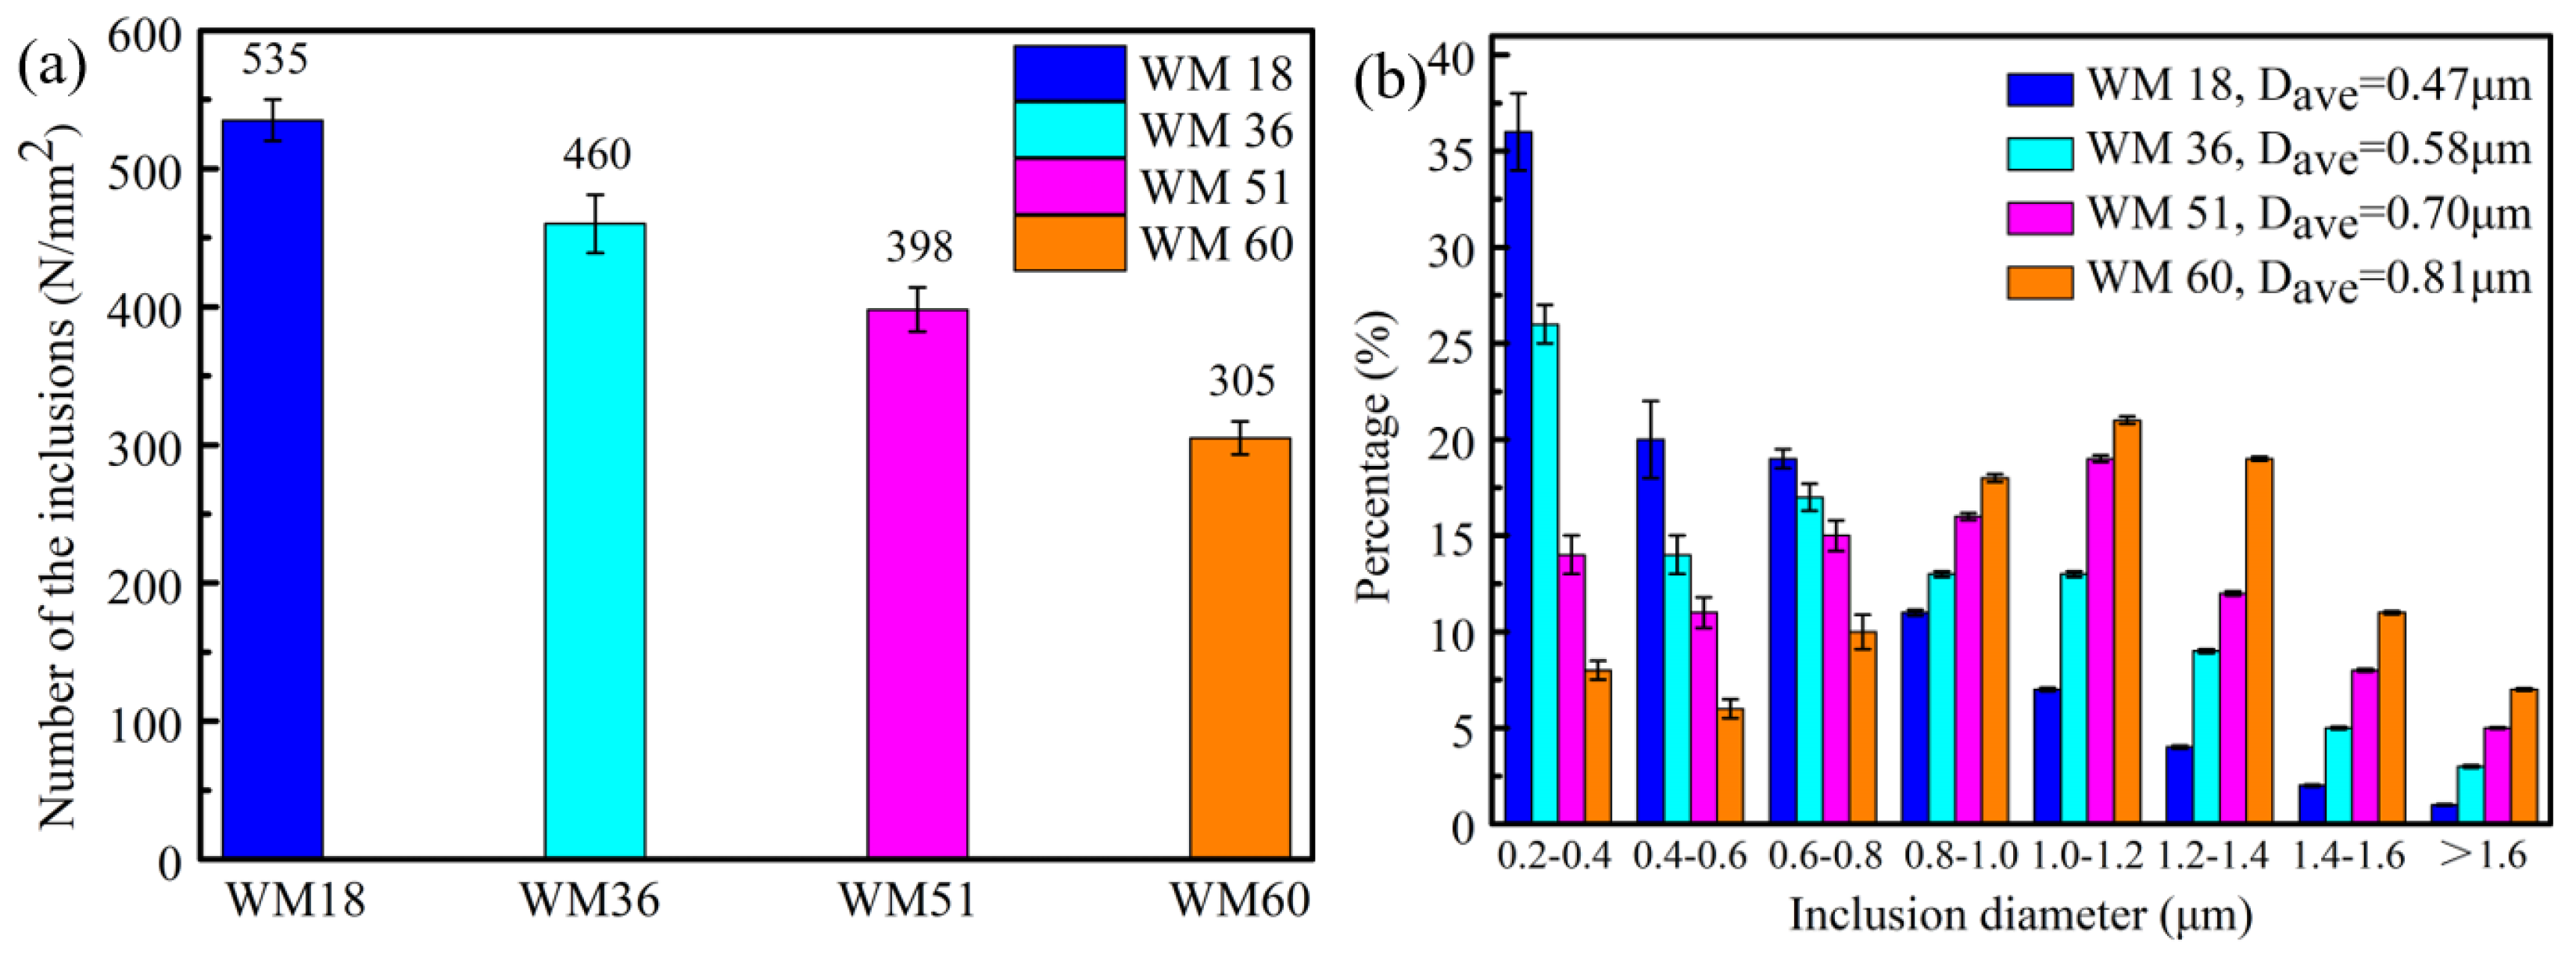
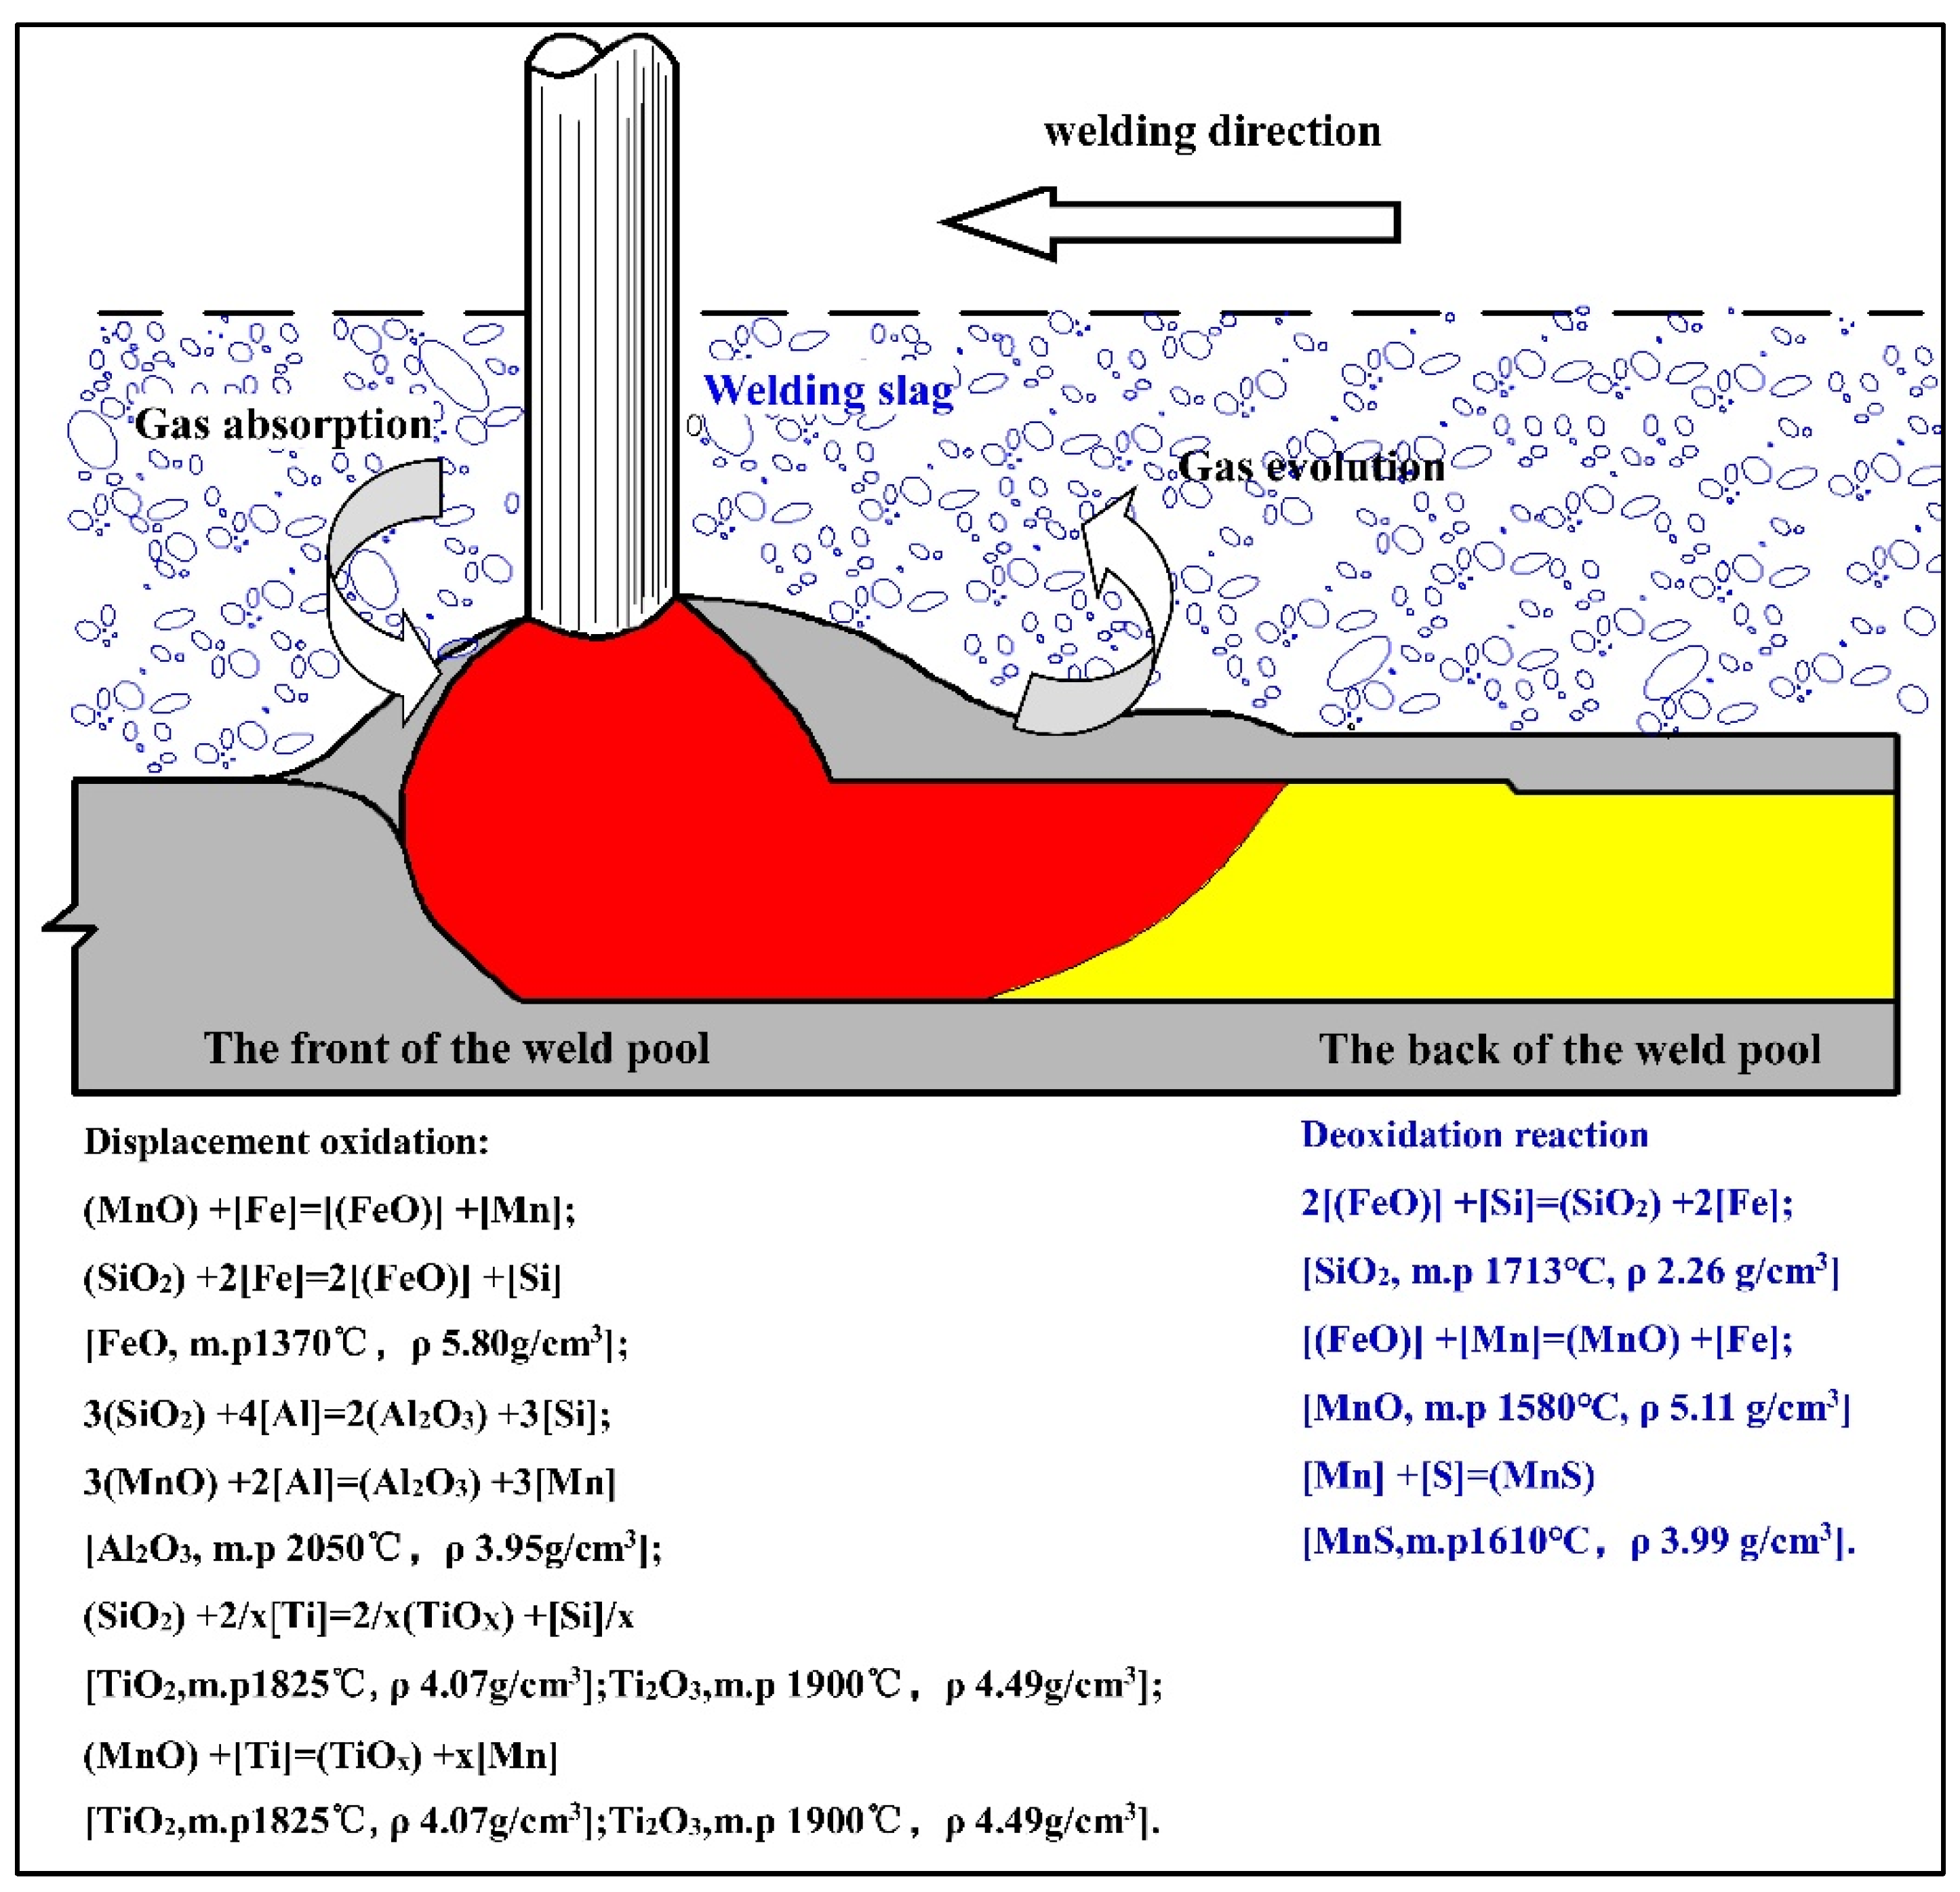
4.1. Deoxidation Reaction of Weld Pool and Origin of Inclusions Reduction

The deoxidation reaction of SAW refers to the displacement oxidation reaction and deoxidation. Deoxidation reaction involves alloy elements with high oxygen affinity and occurs in the region where the molten droplets and slag are mixed with the molten welded metal [29,30]. Metal melting and replacement reactions occurred at the front of the weld pool, while metal solidification and deoxidation reactions occurred at the back of the weld pool. According to the TEM results (Figure 11), the inclusions in the weld are composite inclusions—Al-Mn-Si-Ti-O-S. Thus, the possible metallurgical reactions during the metallurgical process of the weld are summarized in Figure 12.
The statistical results of inclusions indicate that with increasing Si content, the number of inclusions in 1 mm2 area of the weld is decreased, while the size of the inclusions is increased (Figure 8). A combination of multiple factors can contribute to such variation in inclusions. Smith et al. [31,32,33] reported that inclusions in the weld pool can be eliminated within a limited time depending on their floating speed, which is approximated by Stokes’ law, as shown in Equation (1). From the formula, the floating speed of inclusions depends on the density (ρ), viscosity, and radius of inclusions. The effect of Si content on viscosity was calculated using JmatPro, and the results show that the viscosity decreases with the increase in Si (Figure 13), which is consistent with previous research [20], i.e., Si can improve the flow characteristics of the molten pool. Vezzu [34] pointed out that the higher the content of Ti, Mn, Si, etc., in molten steel, the higher the degree of segregation of solute elements at the interface of the inclusions, and this mechanism could lead to a gradual increase in the size of the inclusion. As a strong deoxidizing element (Si), more silicon is transited into the weld pool to participate in the reaction, and the degree of segregation is increased, accordingly, the tendency for inclusions to grow may increase. Further, the deoxidized products (SiO2, MnO, Al2O3, etc.) can form complex inclusions such as silicate with low density and a low melting point [31,35]. The incorporation of Si increases such inclusions with a decline in their average density. Accordingly, increasing Si content leads to high floating velocity of inclusions, i.e., more conducive to the removal of inclusions. However, inclusions might collide and recombine during the upward floating process, as the cooling speed of the welding pool is faster, resulting in some composite inclusions not being discharged in a timely manner and remaining in the weld seam. Thus, their size is further coarsened.
v = 2 g · r 2 ( ρ Fe ρ i ) 9 η
where v—floating velocity of inclusion; g—gravitational acceleration (9.8m/s2); ρFe, ρi—density of Fe and inclusions (ρFe = 7.85 g/cm3); η—viscosity of molten pool; and r—radius of the metal inclusion.

4.2. Effect of Si on the Weld Microstructure

After the solidification of weld pool, solid phase transformation occurred during the continuous cooling, and the microstructure after phase transformation was closely related to chemical composition and cooling conditions. Figure 5 depicts the microstructure of CZ and EZ under different Si contents. In order to analyze the effect of Si on the phase transformation behavior of welds, the thermal expansions of welds with different Si contents were measured using a thermal dilatometer to determine the onset temperature (Ar3) and end temperature (Ar1) of γ (austenite)→α (ferrite) phase transition, as shown in Figure 14. As Si increases from 0.18 wt.% to 0.60 wt.%, Ar3 is increased from 679 °C to 719 °C, i.e., stability of austenite is decreased, leading to a high phase transformation temperature of γ → α, as mentioned [36]. Phase transformation occurring at high temperatures is conducive to the diffusion of C, leading to the formation of a large number of PF at the prior austenite grain boundaries (PAGBs). As the phase transformation temperature decreases, the diffusion of C is inhibited, which promotes the transformation of GBF and AF. The AF is heterogeneous nucleated on the inclusions, while GBF is nucleated at PAGBs [37]. The increase in Si transitioning to WMs causes an increase in Ar3, leading to a high content of PF in the CZ of the weld. Compared to the lower Si content, GBF and AF undergo coarsening. The EZ of the weld is the heat-affected region of the previous layer of weld bead to the next layer of weld bead in multi-layer multi-pass welding. When the CZ region undergoes the filling of the next layer of weld bead, the EZ region is formed. Increasing Si increases the amount of PF in the microstructure of the CZ, and GBF and AF are grown; when the CZ undergoes a heating process again, the microstructure further coarsens accordingly, resulting in an obvious coarsening of the microstructure in the EZ as the Si content increases.
The solubility of C atoms in α is significantly lower than that of γ. During the transformation process of γ → α, there is always accompanied by the diffusion of C atoms from α to γ, and the enrichment of C atoms occurs to form metastable austenite(γ’). γ’ is transformed into M/A constituents during the rapid air cooling [38,39]. High doping of Si in the weld enhances Ar3, consequently, the diffusion time of C atoms increases and becomes more sufficient. It leads to the formation of large-sized γ’, and in the subsequent rapid cooling, the formation of large-sized M/A constituents occurs (Figure 6). Due to non-uniformity in heat in the weld, lamellar DP is formed in some areas that experience long residence time at high temperatures (Figure 11).

4.3. Effect of Si Content on Impact Property of Weld Metal

With the gradually increased amount of Si (0.18 wt.% to 0.60 wt.%) in the weld, the impact toughness of WM at −40 °C is dropped from 108.1 J to 39.4 J, and the fracture mode changes from ductile to brittle. Impact toughness generally consists of two parts: crack initiation energy and crack propagation energy, thereby the effect of Si is discussed in terms of crack initiation and propagation.
The hard phase M/A constituents and non-metallic inclusions in the microstructure had a significant effect on the crack initiation process [3,40]. Both their hardness values were significantly higher than that of the matrixes, which could easily cause local embrittlement. The main reason for this phenomenon was that under the impact load, due to the uneven plastic deformation between the M/A constituents, inclusions, and ferrite matrix, local stress concentration occurs near the M/A constituents and inclusions. When the local stress concentration level around the M/A constituents or inclusions exceeds the critical fracture stress, microcracks may occur. The kernel average misorientation (KAM) map obtained by EBSD can be used to measure the degree of local microscopic strain concentration [41,42]. As shown in Figure 15, with the increase in Si content, the degree of local microscopic strain clearly increases. At the same time, the critical fracture stress could be evaluated according to the classical fracture theory [43,44], as shown in formula (2). An increase in the size of M/A constituents and inclusions leads to a decrease in critical fracture stress. Doping of Si can boost the size of M/A constituents and inclusions, which stimulates the degree of local stress concentration, and, consequently, the critical fracture stress decreases. The impact fracture surface and cross-section observations are shown in Figure 3e,f and Figure 16a,b, respectively. When the Si content in the WM was low, the small cleavage surface caused by inclusions could be clearly observed, and the merging of micro-voids was also generated. When the Si content was high, the cleavage surface also occurred near the inclusions, and, compared to the low Si content, the size of the cleavage surface increased, and large-sized microcracks also generated around M/A constituents. Therefore, with the increase in Si content, it was easier to initiate cracks and increase their size, and the corresponding energy consumption during the crack initiation stage continued to decrease.
σ c = 2 E γ s 1 / 2 ( 1 ν 2 ) d
The critical fracture stress, σc, is measured in terms of Young’s modulus E, effective surface energy γs, Poisson’s ratio ν, and size of the microcrack d (d can be regarded as the size of inclusions/M/A constituents).
Figure 16c,d show the crack propagation behavior in the radial region of the impact fracture surface. It could be observed that the crack deflection or arrest occur at ferrite boundaries, and the crack propagation length is increased with the increase in Si. Generally, the deviation and/or retardation of microcracks propagation mainly depends on the orientation deviation between adjacent grains [45,46]. Figure 17 shows the crack propagation behavior in the radiation zone (EBSD image), and the blue and red lines are distinguished between HAGBs with MTAs higher than 15° and LAGBs with MTAs between 2–15°, respectively. As can be seen, the cracks pass through LAGBs and stop at HAGBs. Zhang et al. [47] mentioned that HAGBs can significantly impede crack propagation and improve toughness, i.e., the density of HAGBs was a key factor in determining crack propagation resistance. With the increase in Si doping, the proportion of HAGBs in CZ and EZ is decreased from 55% and 46% to 41% and 37%, respectively; meanwhile, MEDMTA≥15° in CZ and EZ regions increases accordingly. This indicates that the density of HAGBs unit area is reduced as Si doping increases, and the corresponding energy consumption during the crack propagation is decreased.

5. Conclusions

This paper studies the effect of Si on the microstructure and impact properties for 500 MPa weathering bridge steel weld metals of submerged arc welding. The correlation between the microstructure and impact properties was pointed out. The following conclusions were drawn in this article:
(1)
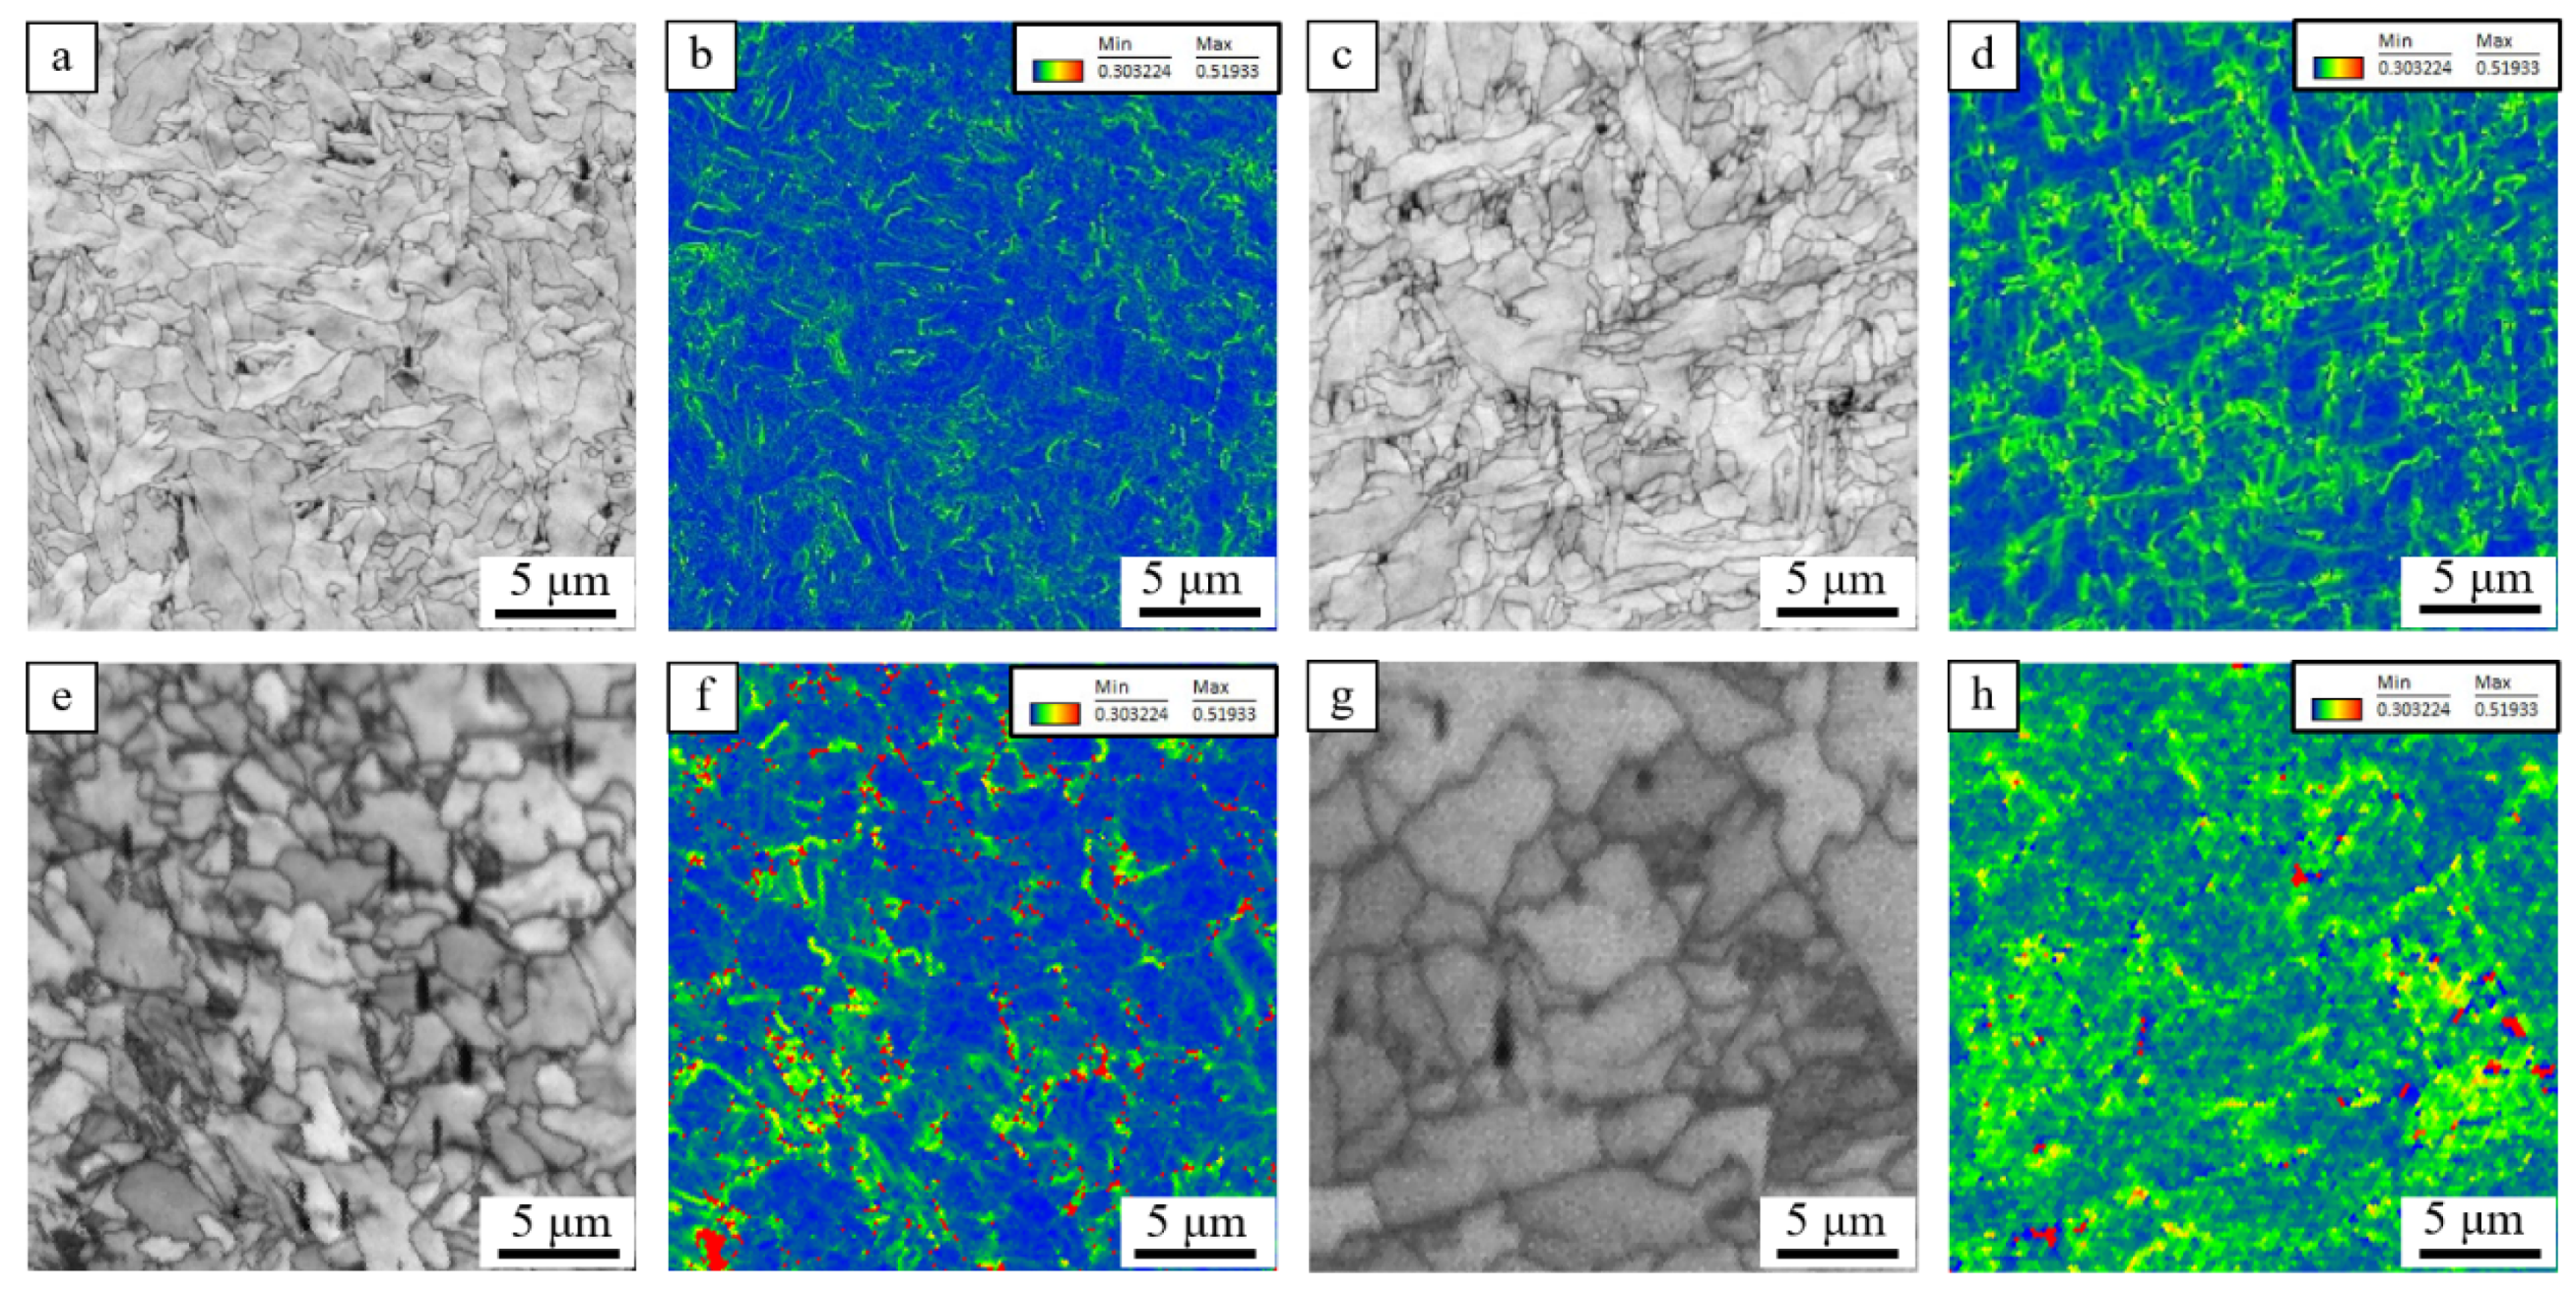
Weld metals with varied doping of Si in columnar crystal zone and equiaxed crystal zone formed a mixed microstructure of acicular ferrite and granular bainitic ferrite and polygon ferrite and M/A constituents. With the increase in Si doping in weld metals, the phase transformation occurred at high Ar3, resulting in more polygon ferrite and coarsening of the sizes of acicular ferrite, granular bainitic ferrite, and M/A constituents;
(2)
With the increase in Si content from 0.18 wt.% to 0.36, 0.51 wt.%, and 0.60 wt.%, the impact energy decreased monotonously, and its average value decreased from 108.1 J to 90.6 J, 69.3 J, and 39.4 J, respectively. Considering that the impact toughness of 500 MPa weathering bridge steel joints needs to be higher than the limit of 54 J, to ensure good toughness of the weld metals, doping of Si in weld metals should not exceed 0.51 wt.%;
(3)
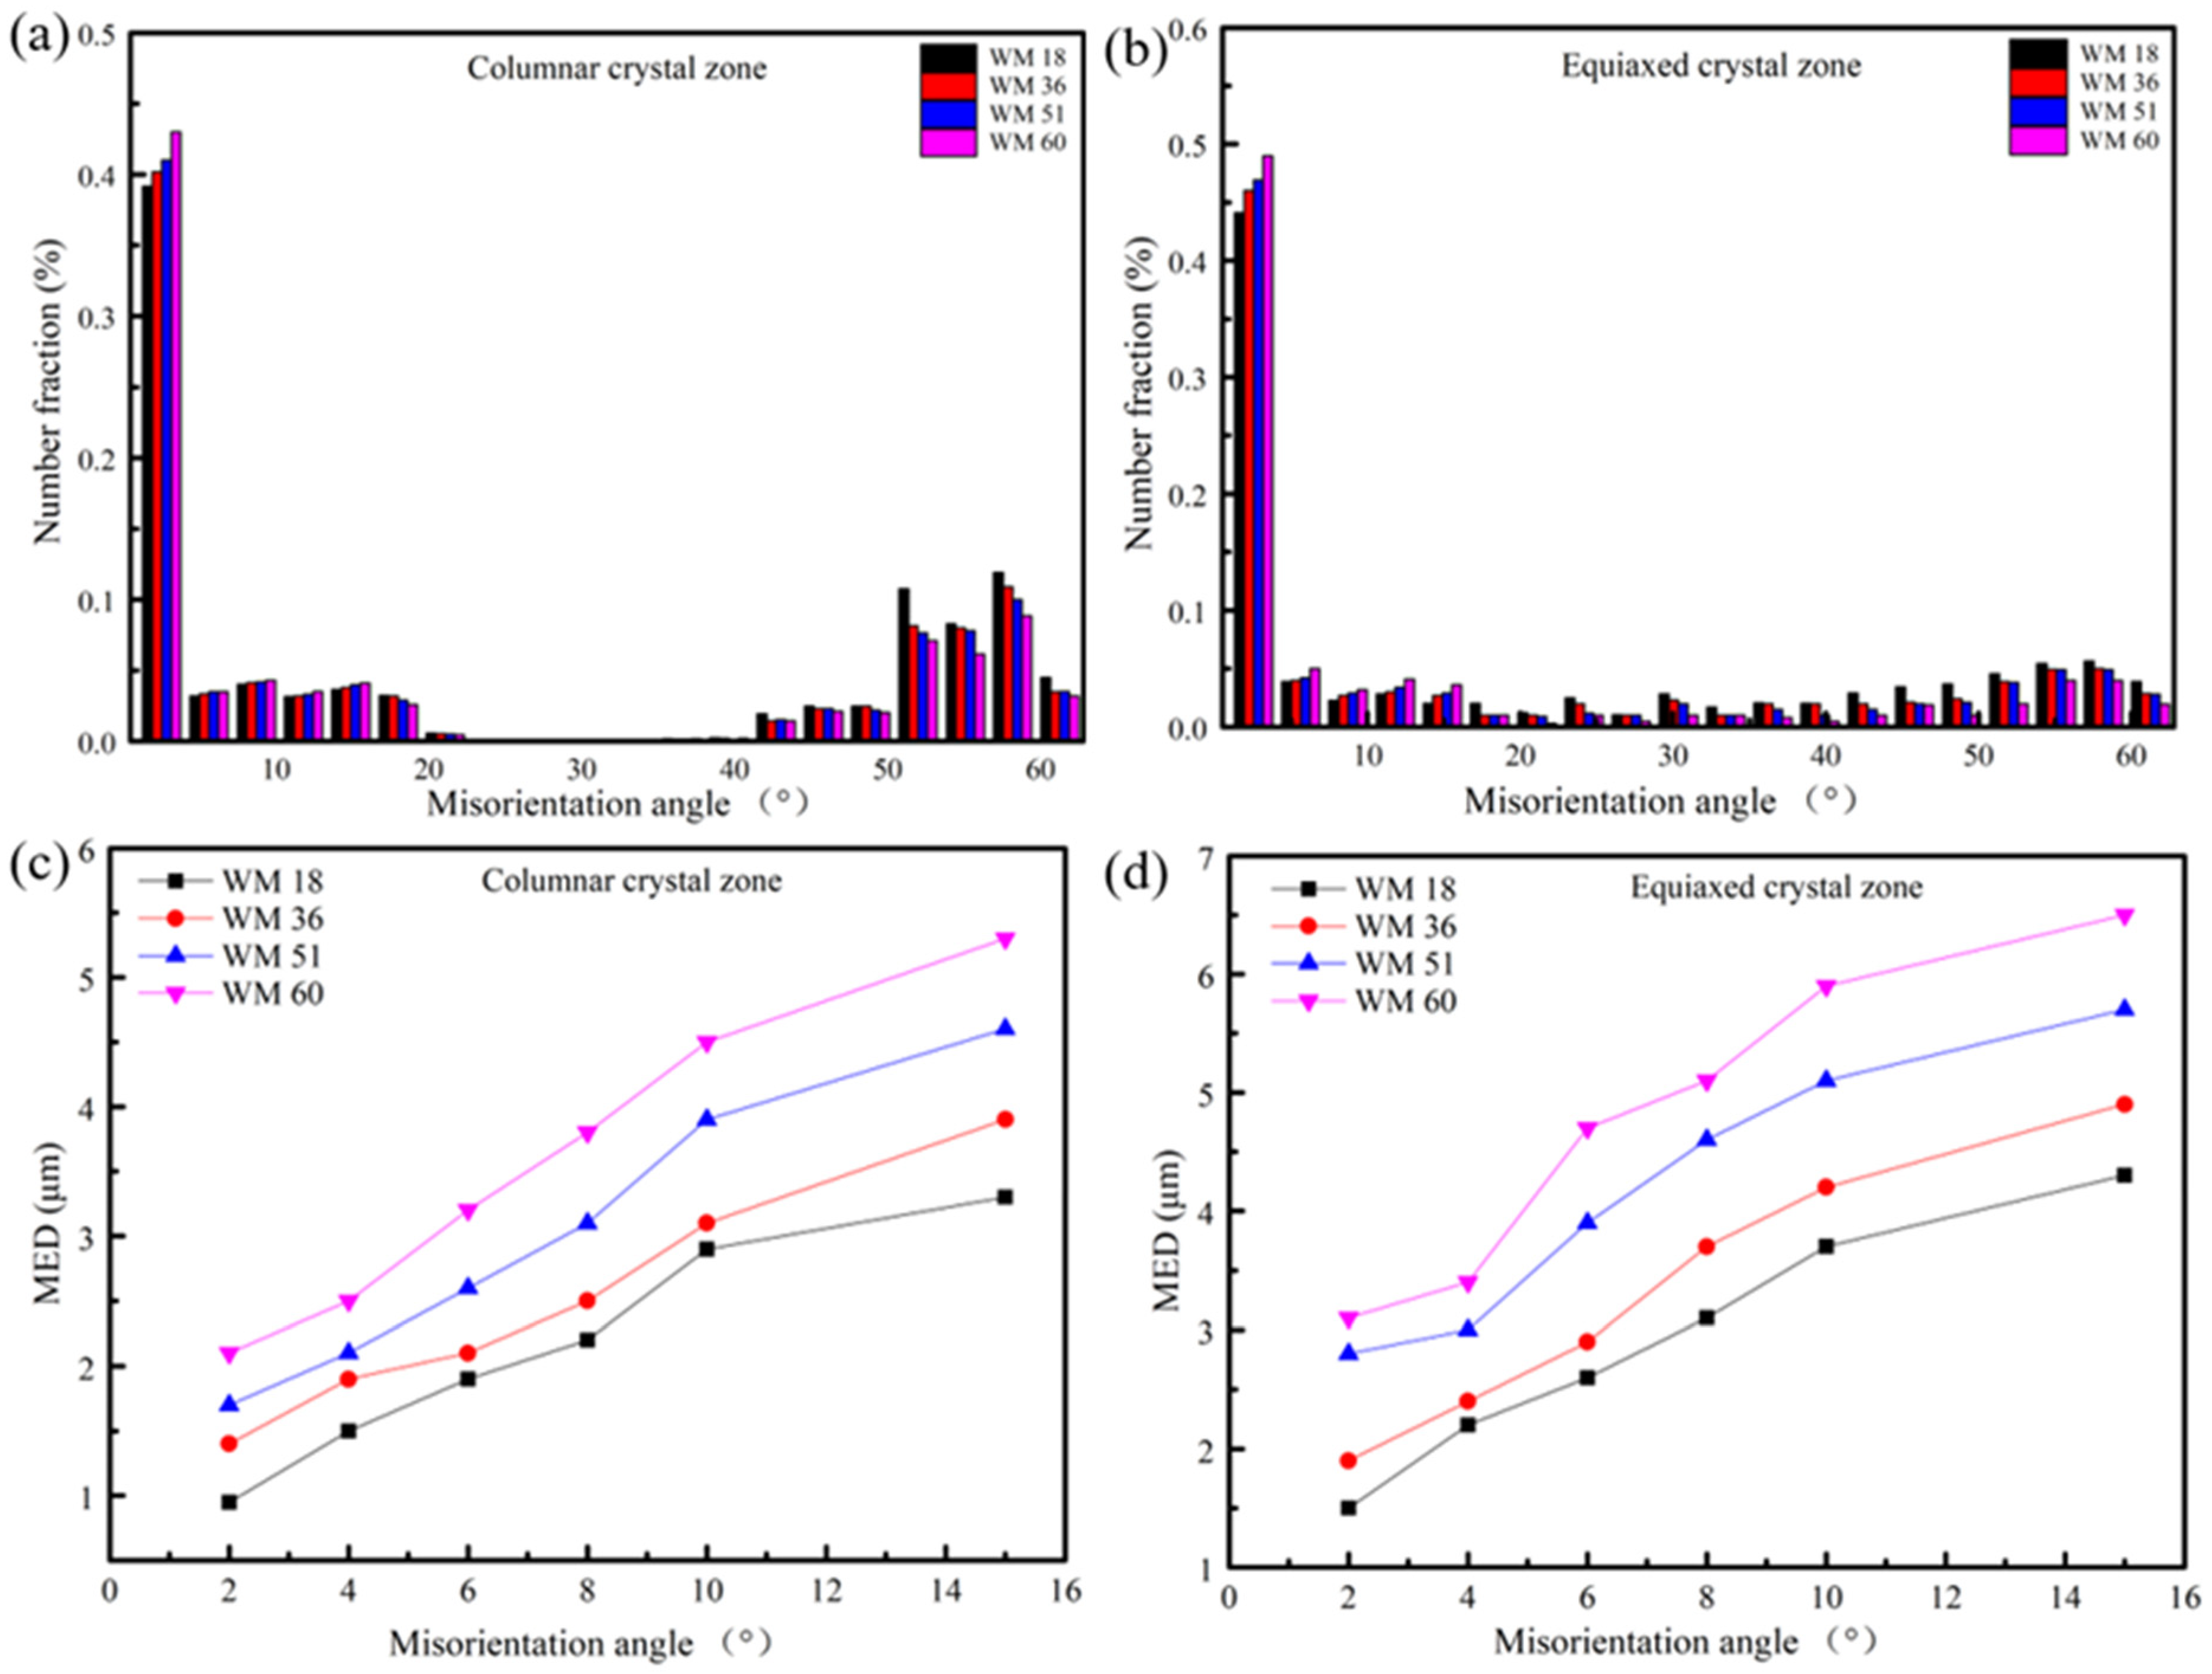
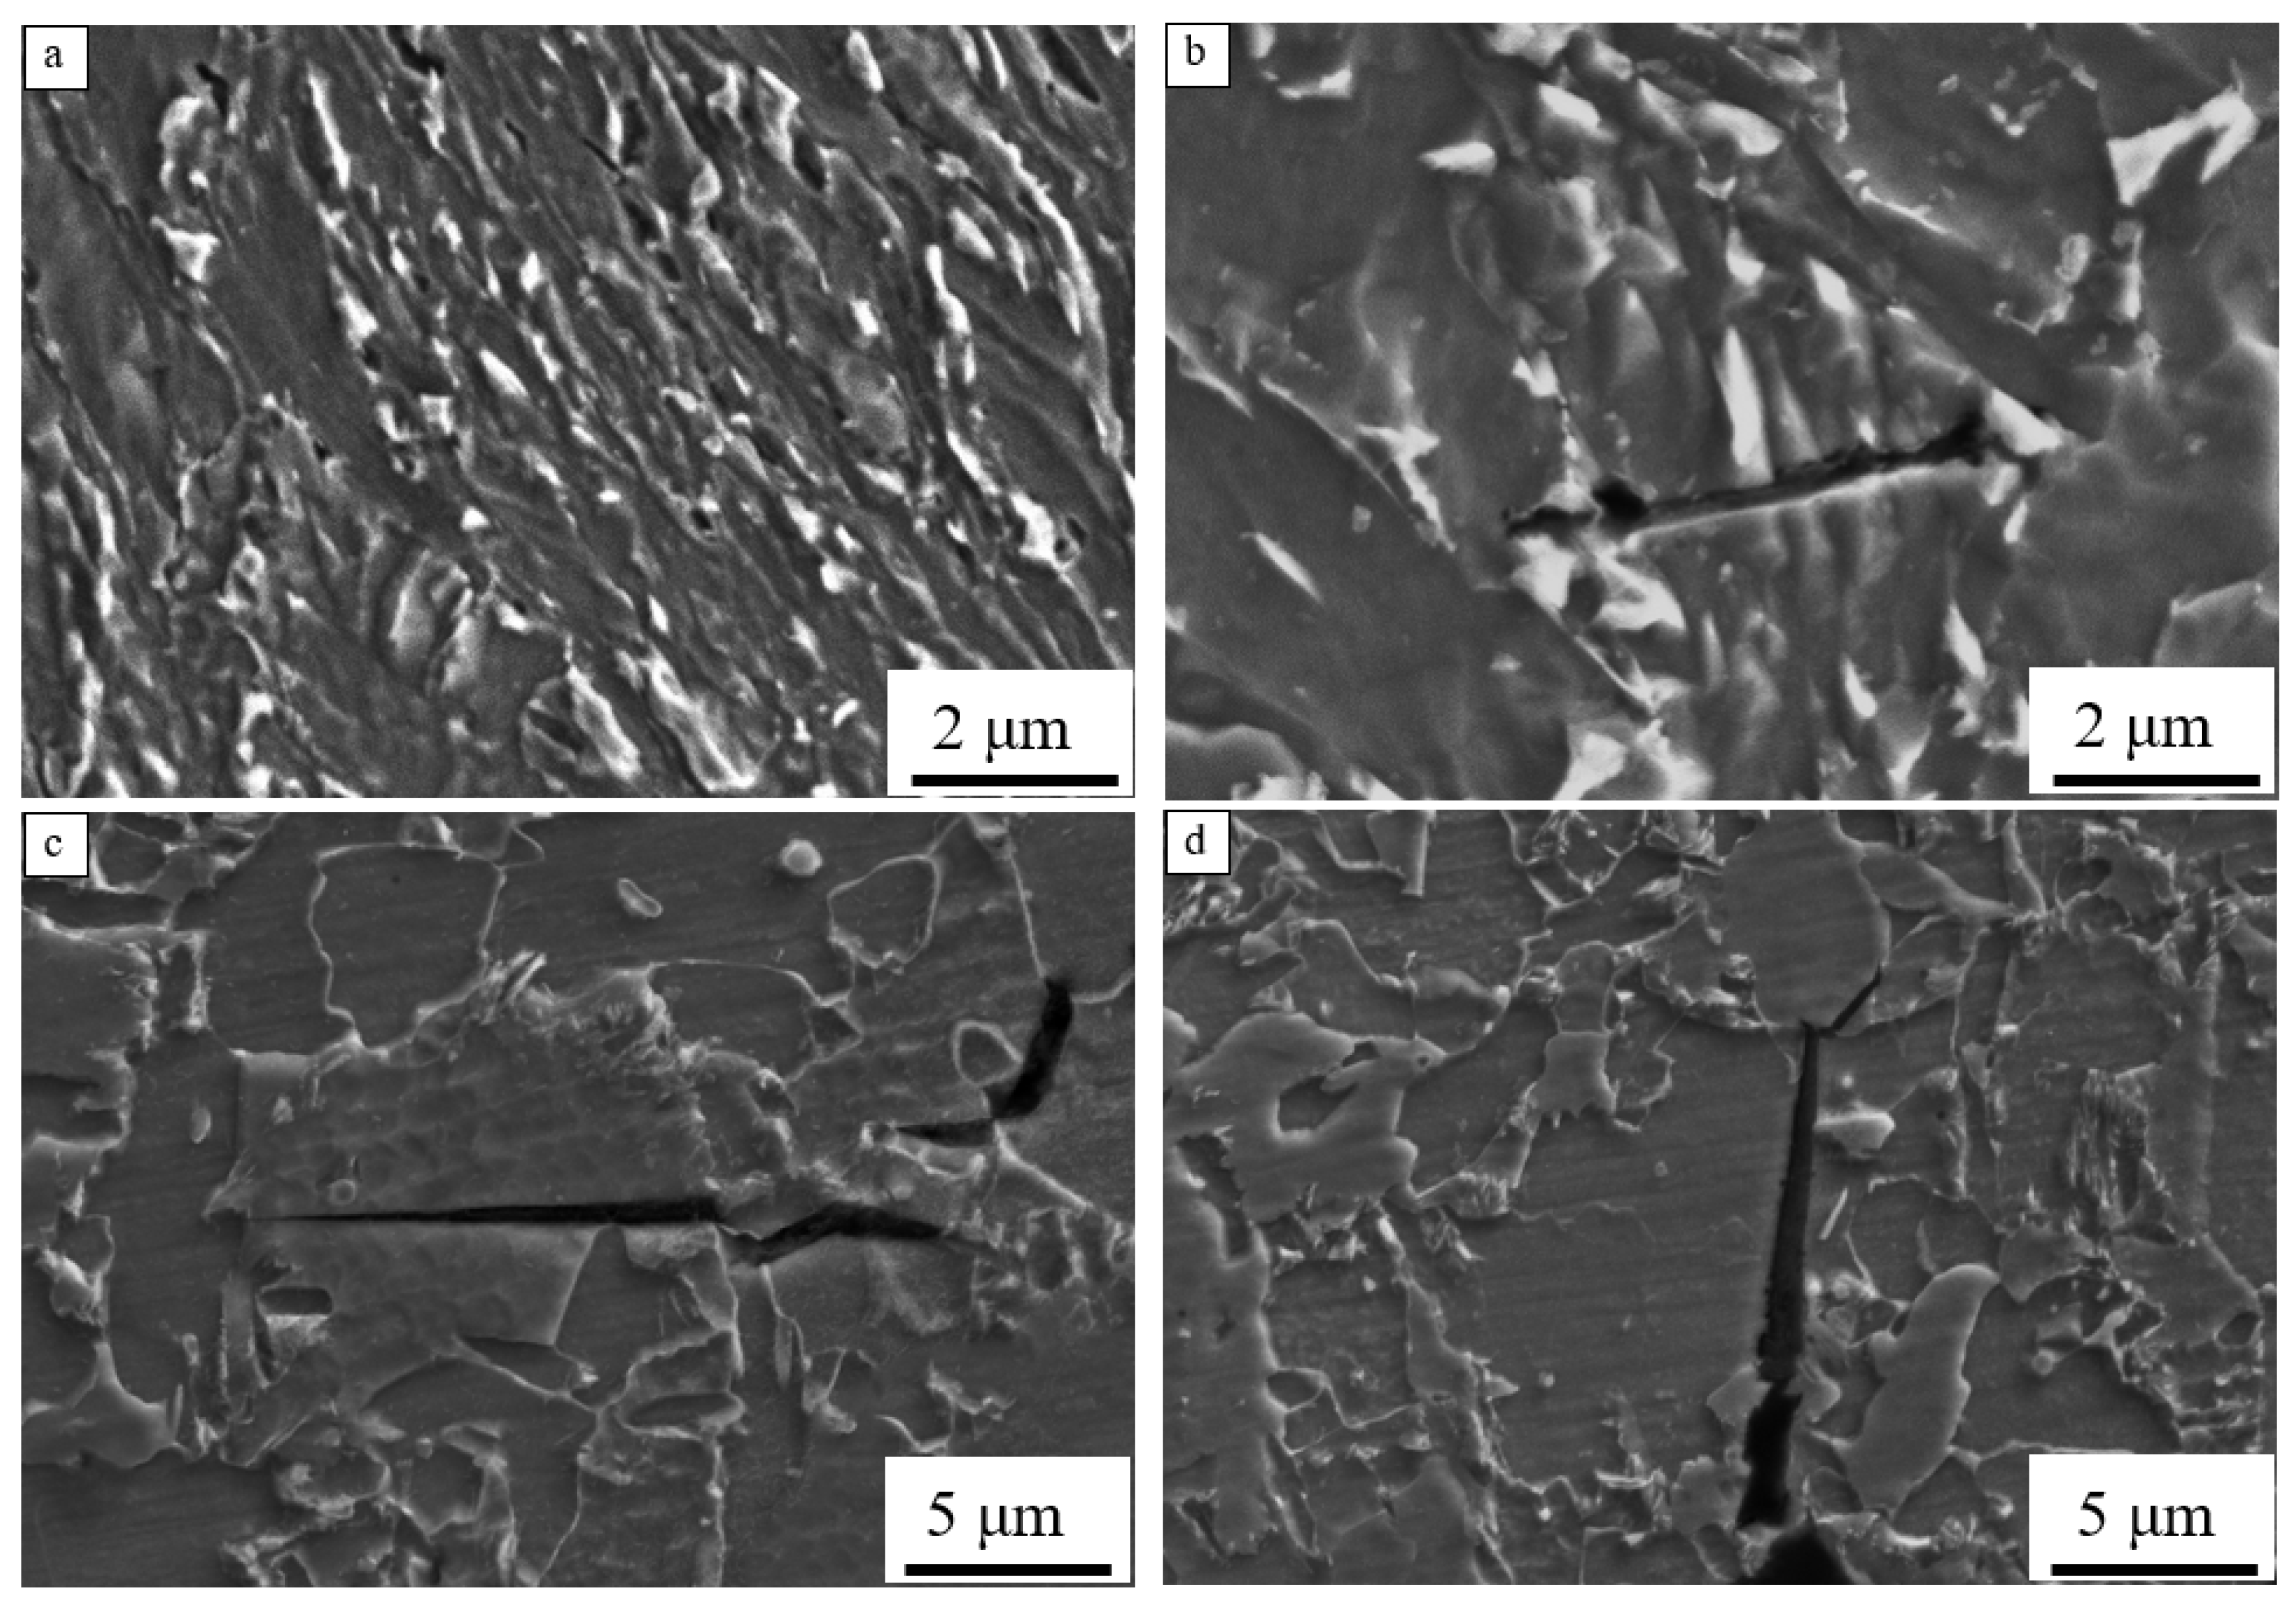
The increase in Si content in the weld metals led to an increase in the size of M/A constituents and inclusions, resulting in a decrease in crack initiation energy, while the decrease in high-angle grain boundaries density reduced crack propagation energy. Both of these reasons led to a decrease in the impact toughness of the welded metal with an increase in Si content;
(4)
The research and development of submerged arc welding wires matching 500 MPa weathering bridge steel with excellent welding process performance and mechanical properties is of great significance for promoting the application of high-strength weathering steel in the field of bridges. In addition, we will continue to pay attention to the matching problem of strength, toughness, and corrosion resistance between high-strength weathering bridge steel and weld metals in future research.

Author Contributions

Q.W. (Qingfeng Wang) and F.L. conceived and designed the experiments; B.H. performed the experiments; Q.W. (Qiuming Wang) analyzed the data; L.Z., Y.Y. and J.L. contributed the experimental material and analysis tools; and Q.W. (Qingfeng Wang) and F.L. wrote the paper. All authors have read and agreed to the published version of the manuscript.

Funding

This research was funded by National Natural Science Foundation of China (grant number 52127808), Innovation Ability Promotion Program of Hebei (grant number 22567609H), and National Key Research and Development Program of China (grant number 2017YFB0304802).

Data Availability Statement

Not available.

Conflicts of Interest

The authors declare no conflict of interest.

References

  1. Wang, Y.; Li, J.; Zhang, L.; Zhang, L. Structure of the rust layer of weathering steel in A high chloride environment: A detailed characterization via HRTEM, STEM-EDS, and FIB-SEM. Corros. Sci. 2020, 177, 108997. [Google Scholar] [CrossRef]
  2. Zhao, L.; Wang, Q.; Shi, G.; Yang, X.; Qiao, M.; Wu, J.; Zhang, F. In-depth understanding of the relationship between dislocation substructure and tensile properties in a low-carbon microalloyed steel. Mater. Sci. Eng. A 2022, 854, 143681. [Google Scholar] [CrossRef]
  3. Hu, B.; Shi, G.; Wang, Q. Elucidating the heat input on CGHAZ microstructure and its irregular effect on impact toughness for a novel V–N microalloying weathering steel. J. Mater. Res. Technol. 2023, 25, 5888–5906. [Google Scholar] [CrossRef]
  4. Kiran, D.V.; Basu, B.; Shah, A.K.; Mishra, S. Three-dimensional heat transfer analysis of two wire tandem submerged arc welding. ISIJ Int. 2011, 51, 793–798. [Google Scholar] [CrossRef]
  5. Beidokhti, B.; Koukabi, A.H. Influences of titanium and manganese on high strength low alloy SAW weld metal properties. Mater. Charact. 2009, 60, 225–233. [Google Scholar] [CrossRef]
  6. Fujiyama, N.; Shigesato, G. Effects of Mn and Al on acicular ferrite formation in SAW weld metal. ISIJ Int. 2021, 61, 1614–1622. [Google Scholar] [CrossRef]
  7. AWS Structural Bundle C: AWS A2.4 2012 and AASHTOAWS D1.5M/D1.5 2010. 2015. Available online: https://webstore.ansi.org/standards/aws/awsbundle2010a2aashtod15m (accessed on 1 June 2023).
  8. Zhao, D.; Bezgans, Y.; Vdonin, N. Mechanical performance and microstructural characteristic of gas metal arc welded A606 weathering steel joints. Int. J. Adv. Manuf. Technol. 2022, 119, 1921–1932. [Google Scholar] [CrossRef]
  9. Bang, K.S.; Park, C.; Chang, W.S.; Park, C.G. Influence of heat input on mechanical properties of multipass low-alloy steel weld metal. Mater. Sci. Forum 2008, 580–582, 17–20. [Google Scholar] [CrossRef]
  10. Bang, K.S.; Kim, W.Y.; Park, C.; Ahn, Y.H. Effects of nitrogen on weld metal microstructure and toughness in submerged arc welding. Mater. Sci. Forum 2007, 539–543, 3906–3911. [Google Scholar] [CrossRef]
  11. Cao, R.; Han, C.; Guo, X. Effects of boron on the microstructure and impact toughness of weathering steel weld metals and existing form of boron. Mater. Sci. Eng. A 2022, 833, 142560. [Google Scholar] [CrossRef]
  12. Sun, D.; Zhou, Z. Effects of Cu, Ni, Mn and Mo on the austemperability, microstructures and mechanical properties of ADI weld metal. China Weld. 1996, 1, 59–65. [Google Scholar]
  13. Avazkonandeh-Gharavol, M.H.; Haddad-Sabzevar, M.; Haerian, A. Effect of chromium content on the microstructure and mechanical properties of multipass MMA, low alloy steel weld metal. J. Mater. Sci. Technol. 2009, 44, 186–197. [Google Scholar] [CrossRef]
  14. Liu, F.; Nelson, T.; McCracken, S. Nanoscale chromium carbides induced abnormal hardness in dissimilar metal welds. Sci. Technol. Weld. Join. 2021, 26, 324–331. [Google Scholar] [CrossRef]
  15. Wang, C.; Zhang, J. Fine-tuning weld metal compositions via flux optimization in submerged arc welding: An overview. Acta Metall. Sin. 2021, 57, 1126–1140. [Google Scholar]
  16. Evans, G.M. Effects of silicon on the microstructure and properties of C-Mn all-weld-metal deposits. Met. Constr. 1986, 18, 438–444. [Google Scholar]
  17. Zhang, J.; Peng, L.; Zhou, L.; Chen, Y. On the Si content prediction for submerged arc welded metal via Calphad technique: A brief discussion. J. Mater. Res. Technol. 2022, 21, 1856–1862. [Google Scholar] [CrossRef]
  18. Polishko, S. Deoxidation and modification of steels with reduced silicon content. Technol. Audit. Prod. Reserves 2022, 2, 24–27. [Google Scholar] [CrossRef]
  19. Lianliu, D. Effect of Si, Mn and Al on the microstructure and mechanical properties of ADI weld metal. J. Mater. Sci. Technol. 2002, 18, 271–274. [Google Scholar]
  20. Lippold, J.C. Welding Metallurgy and Weldability; Wiley: Hoboken, NJ, USA, 2009. [Google Scholar]
  21. Chai, C.S. Slag-Metal Reactions during Flux Shielded Arc Welding. Ph.D. Thesis, Massachusetts Institute of Technology, Cambridge, MA, USA, 2009. [Google Scholar]
  22. John, R. Welding structural and pressure vessel steels for low temperature applications. Met. Constr. 1976, 8, 488–492. [Google Scholar]
  23. Boniszewski, T. Manual metal arc welding-old process, new developments. I: Introductory considerations. Metall. Mater. Technol. 1979, 11, 567–574. [Google Scholar]
  24. Tsuji, T.; Nakai, K.; Tsuyama, T. Development of submerged arc welding method using hot wire. Weld. World J. Int. Inst. Weld. 2014, 58, 713–718. [Google Scholar]
  25. TB/T 2374-2008; Welding Material of Atmospheric Corrosion Resisting Steel and Stainless Steel for Rolling Stock. Ministry of Railways of the People’s Republic of China: Beijing, China, 2008.
  26. Jorge, J.; De Souza, L.; Mendes, M. Microstructure characterization and its relationship with impact toughness of C–Mn and high strength low alloy steel weld metals—A review. J. Mater. Res. Technol. 2021, 10, 471–501. [Google Scholar] [CrossRef]
  27. Gürol, U.; Dilibal, S.; Turgut, B. Characterization of a low-alloy steel component produced with wire arc additive manufacturing process using metal-cored wire. Mater. Test. 2022, 64, 755–767. [Google Scholar] [CrossRef]
  28. Moshtaghi, M.; Loder, B.; Safyari, M. Hydrogen trapping and desorption affected by ferrite grain boundary types in shielded metal and flux-cored arc weldments with Ni addition. Int. J. Hydrogen Energy 2022, 47, 20676–20683. [Google Scholar] [CrossRef]
  29. Messler, R.W., Jr. Principles of Welding: Processes, Physics, Chemistry, and Metallurgy; Wiley: Hoboken, NJ, USA, 1999. [Google Scholar]
  30. Potapov, N.; Volobuev, Y.S.; Feklistov, S. Consequences of the reaction between metal and slag during melting welding. Weld. Int. 2021, 35, 454–458. [Google Scholar] [CrossRef]
  31. Babu, S.S.; David, S.A.; Vitek, J.M.; Mundra, K.; DebRoy, T. Development of macro- and microstructures of carbon–manganese low alloy steel welds: Inclusion formation. Mater. Sci. Technol. 1995, 11, 186–199. [Google Scholar] [CrossRef]
  32. Morgan, P. 8th European electric Steelmaking conference. Steel Times Int. 2005, 32, 397–400. [Google Scholar] [CrossRef]
  33. Sugden, A.A.B.; Bhadeshia, H.K.D.H. The nonunjform distribution of inclusions in low-alloy steel weld deposits. Metall. Trans. A 1988, 19, 669–674. [Google Scholar] [CrossRef]
  34. Vezzu, S.; Scappin, M.; Boaretto, D.; Timelli, G. On the effect of slight variations of Si, Mn and Ti on microstructure and mechanical properties of YS460 C-Mn steel welds. SSRN Electron. J. 2018, 8, 292–306. [Google Scholar] [CrossRef]
  35. Dowling, J.M.; Corbett, J.M.; Kerr, H.W. Inclusion phases and the nucleation of acicular ferrite in submerged arc welds in high strength low alloy steels. Metall. Trans. A 1986, 17, 1611–1623. [Google Scholar] [CrossRef]
  36. Dai, Z.; Chen, H.; Ding, R. Fundamentals and application of solid-state phase transformations for advanced high strength steels containing metastable retained austenite. Mater. Sci. Eng. R Rep. 2021, 143, 100590. [Google Scholar] [CrossRef]
  37. Baker, T.N. Microalloyed steels. Ironmak. Steelmak. 2016, 43, 264–307. [Google Scholar] [CrossRef]
  38. Shi, G.; Luo, B.; Zhang, S.; Wang, Q.; Zhao, H. Microstructural evolution and mechanical properties of a low-carbon V-N-Ti steel processed with varied isothermal temperatures. Mater. Sci. Eng. A 2021, 801, 140396. [Google Scholar] [CrossRef]
  39. Rodrigues, T.A.; Bairrão, N.; Farias, F.W.C. Steel-copper functionally graded material produced by twin-wire and arc additive manufacturing (T-WAAM). Mater. Des. 2022, 213, 110270. [Google Scholar] [CrossRef]
  40. Cao, R.; Chan, Z.S.; Yuan, J.J. The effects of silicon and copper on microstructures, tensile and charpy properties of weld metals by refined X120 wire. Mater. Sci. Eng. A 2018, 718, 350–362. [Google Scholar] [CrossRef]
  41. Fan, H.; Shi, G.; Peng, T.; Wang, Q.; Wang, L.; Wang, Q.; Zhang, F. N-induced microstructure refinement and toughness improvement in the coarse grain heat-affected zone of a low carbon Mo-V-Ti-B steel subjected to a high heat input welding thermal cycle. Mater. Sci. Eng. A 2021, 824, 824. [Google Scholar] [CrossRef]
  42. Zhao, X.; Huebsch, N.; Mooney, D.J.; Suo, Z. Stress-relaxation behavior in gels with ionic and covalent crosslinks. J. Appl. Phys. 2010, 107, 1869. [Google Scholar] [CrossRef]
  43. Lan, L.; Kong, X.; Qiu, C.; Zhao, D. Influence of microstructural aspects on impact toughness of multi-pass submerged arc welded HSLA steel joints. Mater. Des. 2016, 90, 488–498. [Google Scholar] [CrossRef]
  44. Alessi, R.; Ulloa, J. Endowing Griffith’s fracture theory with the ability to describe fatigue cracks. Eng. Fract. Mech. 2023, 281, 109048. [Google Scholar] [CrossRef]
  45. Zhang, S.; Qi, L.; Liu, S. Synergistic effects of Nb and Mo on hydrogen-induced cracking of pipeline steels: A combined experimental and numerical study. J. Mater. Sci. Technol. 2023, 158, 156–170. [Google Scholar] [CrossRef]
  46. Xu, T.; Shi, Y.; Jiang, Z. An extraordinary improvement in cryogenic toughness of K-TIG welded 9Ni steel joint assisted by alternating axial magnetic field. J. Mater. Res. Technol. 2023, 25, 3071–3077. [Google Scholar] [CrossRef]
  47. Zhang, Y.; Shi, G.; Sun, R.; Guo, K.; Zhang, C.; Wang, Q. Effect of Si content on the microstructures and the impact properties in the coarse-grained heat-affected zone (CGHAZ) of typical weathering steel. Mater. Sci. Eng. A 2019, 762, 1380–1382. [Google Scholar] [CrossRef]
Figure 1. Schematic diagram of submerged arc welding and sampling (a), preparation of weld impact samples (b), standard impact sample size (c), the phase transition temperature of welded metals (d), and observation of weld—microstructure and fracture surface (e). RD: rolling direction; ND: normal direction; TD: transverse direction.
Metals 13 01506 g001
Figure 2. Low temperature impact toughness of WMs with varied Si content.
Metals 13 01506 g002
Figure 3. Macroscopic morphologies (a,b) and microscopic surface morphologies (cf) of welded impact fractures. WM18 (a,c,e), WM60 (b,d,f). Red line—edge of the V-notch; yellow line—shear lip region; blue line—boundary between fiber and radiation region.
Metals 13 01506 g003
Figure 4. Impact sampling location and weld area in the impact specimens of WM18 (a) and WM 60 (b); crystal region (CZ) and equiaxed crystal region (EZ) of impact specimens via OM; WM18 (c) and WM60 (d).
Metals 13 01506 g004
Figure 5. Welded microstructure of CZ (a,c,e,g) and EZ (b,d,f,h): WM18 (a,b), WM36 (c,d), WM51 (ef), WM60 (g,h).
Metals 13 01506 g005
Figure 6. M/A constituents in CZ (a,c,e,g) and EZ (b,d,f,h) of the welded metals: WM18 (a,b), WM36 (c,d), WM51(e,f), WM60 (g,h).
Metals 13 01506 g006
Figure 7. Inclusion with varied Si content via OM: WM18 (a), WM36 (b), WM51(c), WM60 (d).
Metals 13 01506 g007
Figure 8. Statistical results of the number of welded inclusions in 1 mm2 region with varied Si (a), size distribution of welded inclusions (b). Dave—the average diameter of inclusions.
Metals 13 01506 g008
Figure 9. The inverse pole figure maps of EBSD for CZ (a,c,e) and EZ (b,d,f) of WMs with varied Si content. WM18 (a,b), WM36 (c,d), WM60 (e,f).
Metals 13 01506 g009
Figure 10. The number fraction of boundaries at different MTAs (a,b) and MED of the grains with boundaries defined by MTA from 2° to 15° (c,d) with varied Si content for welded microstructure. CZ (a,c) and EZ (b,d).
Metals 13 01506 g010
Figure 11. TEM micrographs of CZ (ac) and EZ (df) of WMs and elemental composition of inclusions (I–III); bright field (g), dark field (h), and inset SAED of M/A. WM18 (a,d), WM36 (b,e), WM60 (c,f) and WM 51 (g,h), DP—degenerated pearlite.
Metals 13 01506 g011
Figure 12. Oxidation reaction in submerged arc welding pool during welding; m.p—melting point of inclusion, ρ—density of inclusions.
Metals 13 01506 g012
Figure 13. Effect of Si content on weld pool viscosity.
Metals 13 01506 g013
Figure 14. The expansion curves during the cooling and onset/end temperature of phase transformation for each Si content in WMs.
Metals 13 01506 g014
Figure 15. Band contrast map (a,c,e,g) and kernel average misorientation map (b,d,f,h) of columnar crystal zone (ad) and equiaxed crystal zone (eh), WM18 (a,b,e,f), WM60 (c,d,g,h).
Metals 13 01506 g015
Figure 16. Micro-voids and microcracks beneath the fibrous regions of impact fracture at WM18 (a) and WM60 (b). Typical secondary crack propagation beneath the radiation regions of impact fracture at WM18 (c) and WM60 (d).
Metals 13 01506 g016
Figure 17. Typical secondary crack propagation behavior beneath the radiation regions at WM36.
Metals 13 01506 g017
Table 1. The chemical composition of atmospheric corrosion-resisting electrode (wt. %).
IngotCSiMnPSNiCrCuMoTi
E150.070.151.730.0070.0030.750.450.300.220.05
E320.070.321.740.0080.0050.740.450.290.230.05
E450.070.451.750.0060.0030.750.440.310.220.05
E560.070.561.740.0070.0040.750.450.300.230.05
Table 2. The chemical composition of base metal and flux (wt. %).
Base metalCSiMnPSCrNiCuMo
0.050.301.440.0120.0050.510.390.320.15
FluxSiO2 + TiO2CaO + MgOAl2O3 + MnOCaF2SP
20–3025–3515–3015–250.060.08
Table 3. Chemical compositions of the weld metals (wt. %).
WMCSiMnPSNiCrCuMoTi
WM180.050.181.560.0070.0030.700.430.300.310.012
WM360.050.361.530.0080.0050.710.420.290.320.014
WM510.050.511.540.0060.0030.700.410.310.310.014
WM600.050.601.540.0070.0040.690.420.300.310.012
Table 4. List of microstructure observations and quantifications.
WMfM/A/%dM/A/μmfMTA>15°/%MEDMTA≥15/μm
CZEZCZEZCZEZCZEZ
WM185.50 ± 0.205.18 ± 0.250.60 ± 0.040.68 ± 0.0355463.34.3
WM366.39 ± 0.156.12 ± 0.180.69 ± 0.030.79 ± 0.0447423.94.9
WM517.23 ± 0.166.97 ± 0.130.78 ± 0.030.87 ± 0.0446404.65.7
WM608.43 ± 0.177.90 ± 0.160.87 ± 0.040.98 ± 0.0341375.36.5
fM/A—Area fraction of M/A constituents, dM/A—average size of M/A constituents, fMTAs>15—the number fraction of boundaries at misorientation tolerance angle > 15°, MEDMTA≥15°—mean equivalent diameter of grains with boundaries at misorientation tolerance angle > 15°.
Disclaimer/Publisher’s Note: The statements, opinions and data contained in all publications are solely those of the individual author(s) and contributor(s) and not of MDPI and/or the editor(s). MDPI and/or the editor(s) disclaim responsibility for any injury to people or property resulting from any ideas, methods, instructions or products referred to in the content.

