Article

Effects of Fe, Si, Cu, and TiB2 Grain Refiner Amounts on the Hot Tearing Susceptibility of 5083, 6061, and 7075 Aluminum Ingots

1
Department of Materials Science and Engineering, National Taiwan University, Taipei 106, Taiwan
2
Institute of Materials Science and Engineering, National Central University, Taoyuan 320, Taiwan
3
Iron and Steel Research and Development Department, China Steel Corporation, Kaohsiung 812, Taiwan
*
Author to whom correspondence should be addressed.
Metals 2024, 14(1), 15; https://doi.org/10.3390/met14010015
Submission received: 28 November 2023 / Revised: 17 December 2023 / Accepted: 19 December 2023 / Published: 21 December 2023

Abstract

:
Aluminum alloys 5083, 6061, and 7075 are prone to hot tearing under direct-chill casting conditions; the defects that form during solidification of those alloys are highly sensitive to variation in the alloying elements, with these elements commonly being Si, Fe, Cu, and Ti. This study investigates the influence of the morphology, content, and size of intermetallic compounds on the hot tearing behavior of the 5083, 6061, and 7075 aluminum alloys by combining a constrained rod casting technique, phase diagram calculation, and multiscale microstructural characterizations. The fishbone-shaped α-Al15(Fe,Mn)3Si2 in 5083 can serve as a path for crack nucleation and growth, and an increase in Si content results in Mg2Si assuming fishbone morphology, thereby increasing hot tearing susceptibility. The amount of plate-like β-Al5FeSi is the primary factor controlling the hot tearing susceptibility of 6061. For 7075, increasing the Cu content can greatly enhance the remaining liquid fraction, feeding, and hot tearing susceptibility. For all three alloys, TiB2 grain refiner minimizes hot tearing. This study elucidates the influences of the amounts of Fe, Si, Cu, and TiB2 grain refiner on hot tearing susceptibility. The findings can help establish compositional control standards for the 5083, 6061, and 7075 aluminum alloy series, particularly when the recycling rate must be increased.

1. Introduction

Reducing greenhouse gas emissions is currently a global priority, and enhancing production efficiency and lowering energy consumption in metal processing technologies have become imperative. Aluminum alloys—owing to their high recyclability, low mass density, abundance in nature, and lower melting point compared with other structural engineering alloys—have gained considerable attention in terms of their applications in a wide variety of industries, such as the automotive, aerospace, and electronics industries. Wrought aluminum alloys are designed to be suitable for plastic working, such as rolling, extrusion, and forging processes. The amounts of alloying elements in wrought aluminum alloys are kept lower than in cast aluminum alloys to prevent the formation of excessive amounts of brittle eutectic phases, which are detrimental to formability [1]. Adding small amounts of alloying elements can widen the alloy’s non-equilibrium freezing range, thus reducing its fluidity during the later stages of solidification [2]. Due to their wide freezing range, wrought aluminum alloys thermally contract to a considerable degree during direct-chill (DC) casting, and this contraction results in the accumulation of internal tensile stress [3,4]. When this stress acts on the brittle high-solid-fraction zones of wrought 5083, 6061, and 7075 aluminum cast billets, internal shrinkage pores are prone to expand along the interdendritic liquid channels. This ultimately results in the most severe and irreversible defect of all solidification process defects—a hot tear [4,5].
DC casting is performed under non-equilibrium conditions, meaning that the solidification path can evolve toward the Scheil condition. The diffusion of solute in primary αAl dendrites is inefficient and results in lower-than-predicted concentrations for most solutes with a partition coefficient k < 1 —such as Mg, Si, Fe, Cu, Mn, and Zn—in equiaxed primary αAl grains. The solutes in the remaining liquid phase under the Scheil condition are more concentrated than is predicted on the basis of the equilibrium condition, leading to pronounced microsegregation and the formation of intermetallic compounds (IMCs) [3].
As aluminum alloys solidify, the solid fraction of the material increases from 0% to 100%, and the apparent viscosity rises by at least a factor of 108 [5]. At a critical point, named the dendrite coherency solid fraction g S . C o h , the semisolid alloy can be divided into slurry and mushy zones [6]. In the slurry zone, the solid fraction g S is smaller than g S . C o h , and the alloy behaves like a slurry; that is, it can flow freely. In the mushy zone, g S is higher than g S . C o h , and the primary aluminum dendrites become entangled, restricting the free flow of the alloy. This can lead to the continuous accumulation of residual stresses as the solid fraction increases. Given the morphology of equiaxed dendrites in the DC casting process and the addition of a moderate amount of grain refiner (e.g., Ti content of 0.05 wt.%), g S . C o h is approximately 0.3 [3]. Dahle et al. [6] proposed that the interdendritic feeding mechanism becomes prominent when the volumetric solid fraction g S is slightly higher than g S . C o h . In the aforementioned mechanism, mutually interlocking equiaxed dendrites form a robust skeleton as the crystals grow during solidification. This sudden increase in the bulk rigidity of the alloy results in a loss of flowability in the mushy zone. In the context of DC casting, Eskin [7] suggested that as g S continually increases until the remaining liquid network breaks down, the interdendritic separation mechanism becomes prominent. At this point, the permeability of the material is too low, and further thermal contraction of the αAl leads to the creation of shrinkage porosities and hot tears. Finally, when g S > 0.9, the solid feeding mechanism becomes predominant. Because the alloy’s tensile strength is generated by the coalescence of αAl grains, only the creep of αAl crystals can compensate for solidification contraction and thermal stresses [6,7]. In summary, increasing g S . C o h is one approach to improving the flowability of a solidifying alloy and mitigating hot tearing. Therefore, DC casting operations often involve grain refinement [8] or the use of a dendrite fragmentation method [9].
Molten aluminum is continuously fed under DC casting conditions; thus, the primary source of thermally induced strains is generally agreed to be a linear contraction in the horizontal direction [10]. Scholars have researched linear contraction during the solidification of aluminum alloys, and some trends have been observed [11]. First, the onset temperature of linear contraction is closely related to the interdendritic separation mechanism [12], and materials that exhibit major linear contraction tend to have severe hot tearing susceptibility (HTS). Second, if an insufficient amount of grain refiner is added, noticeable linear contraction often occurs in the material [10]. The addition of the grain refiner TiB2 was found to increase g S . C o h , thereby altering the feeding mechanism of the aluminum alloy [2] and lowering the onset temperature of contraction; this, in turn, reduces the extent of linear contraction in the alloy [9,11]. Scholars have also confirmed that adding a grain refiner to suppress the formation of coarse dendrite arms can effectively reduce the linear contraction of commercial alloys such as 1xxx, 2xxx, 5xxx, 6xxx, and 7xxx alloys [11]. For binary alloy systems not containing Ti, such as Al–Cu and Al–Mg alloys [10], researchers indicated λ-shaped trends in linear contraction, the non-equilibrium solidification range, and HTS. This implies a distinct peak in the plot of HTS versus solute concentration [4]. According to solidification theory, the generation of a λ-shaped curve can be divided into two stages. The first stage corresponds to the considerable reduction in the non-equilibrium solidus (NES) caused by the addition of solute atoms in the dilute concentration range. As the amount of solute atoms increases, the degree of NES reduction also increases until the peak of the λ-shaped curve is reached. In the second stage, however, as Cu or Mg atoms continue to be added, eutectic reactions can occur before the solid fraction of the primary aluminum reaches 0.9, and the liquidus will decrease significantly considerably. Consequently, both the degree of linear contraction and the crack length decrease [11].
Alloying elements such as Mn, Si, and Fe have low maximum solubility in αAl, making them prone to forming IMCs or reacting with other IMCs. Additionally, because aluminum alloys can undergo metallurgical reactions with mechanical devices such as steel molds in various stages of their processing, Fe can accumulate in the aluminum melt, forming compounds such as the irregularly shaped Al13Fe4. High Fe content is, thus, considered to have the most negative effect on an aluminum alloy’s mechanical performance. The composition of the alloy and type of IMCs present after solidification should ideally be controlled by adjusting the alloy’s composition and cooling rate. For example, replacing needle-like or plate-like Fe-rich IMCs with IMCs such as AlxFe (x > 4) or other ternary or quaternary compounds can yield metastable IMCs with Chinese script, fishbone, or polygonal shapes [13]. A standard method for classifying Al–Fe IMCs is based on their crystal structure [14]; α-type IMCs have a cubic or hexagonal crystal structure resembling a ‘Chinese-script’ shape, whereas β-type IMCs have a crystal structure that is monoclinic, orthorhombic, or tetragonal and exhibit plate-like or needle-like morphology. β-type Fe-rich IMCs, especially the commonly encountered coarse β-Al5FeSi [15,16], not only promote the initiation and growth of cracks but also induce the formation of shrinkage pores by impeding the flow of residual liquid. According to the review by conducted Wang [14], which included several studies on IMCs in cast aluminum alloys [17,18], IMCs that hinder the flow of the liquid phase include β-Al5FeSi, α-Al15(Fe,Mn)3Si2, and Al8FeMg3Si6. Additionally, Al2Cu clusters can aggregate on Fe-rich IMCs, further hindering flow. Studies have indicated that increasing the cooling rate helps refine the IMCs’ structure and strongly reduces porosity. The Cu content should be kept lower than 0.2 wt.% to prevent Al2Cu clusters from excessively hindering interdendritic liquid flow [17,18]. However, different aluminum alloy series have differing types of primary IMCs, and adding alloy components has nonlinear effects on HTS, such as that illustrated by the λ-shaped curve mechanism [4,19]. Therefore, how variations in elements such as Fe, Si, and Cu and that in TiB2 grain refiners affect IMCs and hot tearing behavior in widely used wrought aluminum alloys—including 5083, 6061, and 7075—should be systematically investigated.
In this study, the method to quantify HTS is known as the constrained rod casting (CRC) method [4,20], in which molten aluminum is poured into a gravity-casting mold composed of parallel rods of various lengths, which enables the efficient observation of hot tearing behavior in aluminum alloys. The hot tearing mechanism has been found to be influenced by various factors, such as the casting method, casting speed, thermomechanical routes in the processing parameters, alloy composition, and microstructural characteristics, including the size, shape, and distribution of αAl grains and IMCs. Using a hot tearing test device to quantify HTS yields considerable cost savings because it does away with the need for DC casting trials and allows for investigations to be conducted under isolated conditions [11]. Thus, the present study aimed to investigate the relationship of HTS and IMCs by (i) the CRC method for quantifying HTS value, (ii) thermodynamic analysis performed using the calculation of phase diagram (CALPHAD) method to understand types of phase that may form under the Scheil condition, and (iii) multiscale microstructural characterization and phase identification methods. Combining these approaches helped clarify the effects of Fe, Si, Cu, and the grain refiner TiB2 on the IMCs and how IMCs influence the hot tearing behavior of 5083, 6061, and 7075 aluminum alloys. The present findings can contribute to establishing composition control standards for these three series of aluminum alloys.

2. Materials and Methods

2.1. Alloy Designations

This study investigated the factors affecting the HTS values of 5083, 6061, and 7075 aluminum alloys containing various amounts of alloying elements. Initially, the weight fraction of each element in the alloys was determined using an optical emission spectrometer (GVM-1014S, Shimadzu, Japan). The CALPHAD simulation software Pandat (version 2021, CompuTherm, Middleton, WI, USA) was then employed to gain a preliminary understanding of the solidification path for each alloy and the types and weight percentages of IMCs these alloys contained. Subsequently, a CRC method [21] was used to quantify HTS under various conditions. Finally, the information gathered from these steps was integrated with observations of IMC morphology from scanning electron microscopy (SEM) images of hot tearing fracture surfaces and cross-sectional microstructure to summarize the factors that influence hot tearing.
The investigation of the alloy design in the present experiment primarily involved varying the Fe, Si, Cu, and TiB2 content of the alloy. For clarity and readability, this article uses the following abbreviations: 5083, 6061, and 7075 for 5083, 6061, and 7075; T, F, C, and S for more Ti, Fe, Cu, and Si solute addition than base compositions (abbreviated as b). Ti solute was added by Al-5Ti-1B (wt.%) grain refining agent. Table 1 presents the weight percentage of the base alloys and the alloys with increments after remelting and alloying.

2.2. HTS Measurement

Figure 1 shows the design of the CRC mold, which consisted of four rods of various lengths. Starting from the bottommost rod, the lengths of these rods were 150.5, 112.5, 74.5, and 36.5 mm, respectively; a sphere of radius 9.5 mm was present at the front end of each rod. At the base of each rod, a thermocouple was installed; the thermocouples ( L i in Table 2) are numbered in increasing order corresponding to the CRC hot tearing weighted index. The bottommost rod had an index of 1 because hot tearing was most likely in this location. The thermocouple numbering continued from the bottommost rod to the topmost rod, with the thermocouples labeled T b 1 to T b 4 . When the temperature measured by T b 3 reached 316 °C, the aluminum melt, heated by a melting furnace to 756 °C and held at that temperature for 1 h before being cast, was poured into the mold. The mold was opened to observe hot tearing when the temperature at T b 3 dropped to 400 °C. The liquidus temperature of the 6061 alloy is approximately 19 °C higher than those of the 7075 and 5083 alloys. However, using a casting temperature of 775 °C or 756 °C did not strongly affect the HTS of the 6061 aluminum alloy. Furthermore, to assess the effectiveness of the grain refiner, grain size was measured by examining the microstructure at the base of the longest rod in the mold (Table 3). All alloys underwent the CRC experiment at least three times to check for reproducibility.
Several studies on solidifying alloys in CRC molds [11,21,22] predicted an uneven thermal stress distribution, as shown in [Supplementary Figure S1] (see Supplementary Materials) [22]. These studies observed a notable temperature differential near the junction where the sprue and horizontal rod meet. The sprue and rod exhibit a relatively uniform temperature distribution, but the sprue consistently has a higher temperature than the rod. The temperature variations at the junction between the sprue and rod result in significant thermal strains, leading to the formation of hot tears. Simulation results also indicated that the middle of the rod experiences the lowest temperature variations, resulting in the lowest thermal stress. Accordingly, weighted indexes of 1, 1.5, and 2 were assigned to these fracture locations, as mentioned in Table 2. The index for crack i is denoted f i . The length of the cylindrical rod also strongly affects hot tearing. Longer rods are more prone to cracking. Thus, L i was used to reflect the tendency of hot tearing, and L i was varied from 1 to 4 (Table 2). On the basis of the severity of hot tearing (illustrated in Figure 2), scores from 1 to 4 were assigned for various levels of hot tearing: a hairline crack, a small crack, a severe crack, and complete separation, respectively. These scores are detailed in Table 2 and denoted W i . Finally, the following equation was used to calculate the HTS of each alloy given these weighted indexes and scores:
H T S = i ( W i × f i × L i )

2.3. Microstructure Analysis

Specimens for SEM observation were prepared by grinding samples with SiC sandpaper and polishing them with a diamond suspension. To measure grain sizes, optical microscopy was conducted by immersing the samples in room-temperature Keller etchant for 1 min. However, for the 5083 alloy, the corrosion effect of this etchant on grain boundaries was not ideal; thus, a 90-s anodization treatment was conducted at room temperature and 20 V by using Barker’s etchant in conjunction with polarized light microscopy. Transmission electron microscopy (TEM) specimens were prepared using a precision ion polishing system and focused ion beam techniques.
The SEM instrument used in this experiment was the FEI Nova NanoSEM 450 (Thermo Fisher Scientific, Waltham, MA, USA). Because of the differences in the average atomic number between the precipitates and αAl matrix, the backscattered electron (BSE) mode resulted in favorable image contrast. The secondary electron (SE) mode or through-lens detector under the SE mode was used to enhance the height variation on the sample surface for observing hot tearing fracture surfaces after CRC experiments. However, in some cases, the BSE mode was used to supplement microstructure observations for studying the distribution of various IMCs. When the content of IMCs and the weight percentage of various alloying elements were sufficient, energy-dispersive X-ray spectroscopy (EDS) mapping, combined with BSE images, enabled rapid identification of IMC morphology and contrast. A field-emission electron probe microanalyzer (EPMA; JEOL JXA-8530F Plus, JEOL Ltd., Tokyo, Japan) was used to detect elements present in lower amounts and provided a more accurate quantitative analysis of various parameters, such as IMC content and elemental mapping. The TEM devices used in this study were the FEI Tecnai G2 T20 and FEI Tecnai G2 F20 (Thermo Fisher Scientific, Waltham, MA, USA). The open-source software Fiji ImageJ v2.9.0 (National Institute of Health, Bethesda, MD, USA) was employed for the processing of optical and polarized light microscopy images. The threshold function was employed to measure the percentage of the total area in SEM-BSE images that was occupied by IMCs rather than the αAl matrix. The Weka image segmentation method [23] was used to identify areas occupied by different phases.

3. Results

3.1. Influence of Compositional Increments on HTS

The HTS of each alloy is illustrated in Figure 3. The HTS of the 5083 alloys was found to be lower than those of the 6- and 7075 alloys. Compared with the base material 5b, the alloys with single-component increments—5S, 5F, and 5C—exhibited more severe hot tearing behavior. However, the alloys with Ti increments—5T, 5ST, 5FT, and 5CT—had lower HTS values than the corresponding alloys without Ti increments.
Among the materials investigated in this study, the 6061 alloys had the highest HTS. The trends in this alloy series were the same as those for the 5083 alloys: higher HTS values for single-component incremental materials (6S, 6F, and 6C) and corresponding lower HTS values for the alloys with Ti increments (6T, 6ST, 6FT, and 6CT).
The HTS values of the 7075 alloys were between those of the 5083 and 6061 alloys. Notably, two differences were discovered in these alloys’ hot tearing behavior. First, the HTS values of the alloys with Fe and Si increments, 7S and 7F, were higher, whereas that for 7C was much lower, different from the results for 5C and 6C. Second, not all of the alloys with Ti increments had lower HTS values than the corresponding alloys without Ti increments. The values for 7ST, 7FT, and 7CT matched the trend discovered in the 5083 and 6061 alloys, but the alloy with only the Ti increment, 7T, had a much higher HTS.

3.2. Results of CALPHAD Evaluation

The types and amounts of the IMCs within each alloy were predicted via the PanPhaseDiagram module in the Pandat software with the PanAluminum 2021 database. Because the cooling conditions did not meet the equilibrium solidification (i.e., the infinite diffusion coefficient of solutes in the primary αAl phase) while casting, the Scheil model was utilized for discussion. This approach can be referenced in the literature [24,25]. The comparison between equilibrium solidification and Schiel solidification for a multicomponent aluminum alloy is shown in [Supplementary Figure S2] (see Supplementary Materials). The outcomes based on weight fractions are illustrated in Figure 4. For the 5083 alloys, a notable phase, T-Mg32(Al,Zn)49, was predicted to contain approximately 9 wt.% Cu; this was ascribed to the substitution of Zn with Cu, resulting in detectable Cu signals during EDS and EPMA analysis. For the 6061 alloys, three iron-rich IMCs were found to exist: α-Al15(Fe,Mn)3Si2, α-Al8Fe2Si, and β-Al5FeSi. Directly identifying these phases from SEM images is challenging, and TEM was thus needed for accurate identification. Pandat predicted that α-Al15(Fe,Mn)3Si2 and β-Al5FeSi contained small amounts of Mn, whereas α-Al8Fe2Si contained only Al, Fe, and Si. α-Al8Fe2Si was discovered to be absent in the 5083 and 6061 alloys. Therefore, α-Al15(Fe,Mn)3Si2 was considered the representative α-type Fe-rich IMC in this study [26]. Pandat also predicted trace amounts of reactant phases, such as Al13Cr2 and Al3Ti, but Al13Cr2 was not observed in this study. Scheil solidification condition does not account for this phenomenon due to the absence of consideration for peritectic reactions, but Al13Cr2 can undergo peritectic reactions and may be consumed. In the future, more advanced CALPHAD models can be employed to consider the finite diffusion of solutes in αAl, providing a more accurate capture of back-diffusion [5] and peritectic reactions. On the other hand, Although Al3Ti may occasionally be detected in small amounts, its nanosized nature means that it minimally influences hot tearing; Al3Ti is thus excluded from the discussion in this paper.

3.3. Phase Identification and IMC Distribution

Thread-like gray IMCs were found to be visible in specific regions of the 5083 alloys (Figure 5b). EDS revealed that no major Si signals came from these IMCs. According to the predictions made by Pandat, these gray, thread-like phases were Al3Mg2. The remaining areas (black arrow) emitted Si signals corresponding to Mg2Si. Additionally, signals for both Fe and Mn originated from the prominently observed white, fishbone-shaped IMCs (white arrow). Therefore, these IMCs were identified as α-Al15(Fe,Mn)3Si2. Signals for both Zn and Cu were obtained using an EPMA from white dots with sizes ranging from 2 to 5 μm (red arrow), which were identified as T-Mg32(Al,Zn)49, where Zn and Cu can be mutually substituted. In the cross-section shown in Figure 5b, four types of IMC—Al3Mg2, Mg2Si, α-Al15(Fe,Mn)3Si2, and T-Mg32(Al,Zn)49—are visible. Comparing this cross-section with the three-dimensional fracture surface shown in Figure 5a revealed that the fishbone-shaped α-Al15(Fe,Mn)3Si2 in two dimensions appeared as polyhedrally faceted IMCs in three dimensions. The small white dots of T-Mg32(Al,Zn)49 in two dimensions manifest as small spherical particles in three dimensions. Due to hot tearing involving intergranular fracture, the positions of T-Mg32(Al,Zn)49 on the fracture surface correspond to the locations of grain boundaries in three dimensions. Mg2Si was found to be distributed at grain boundaries in both two and three dimensions.
For the 6061 alloys, the EDS detector could barely detect Mn and Zn signals because the Mn and Zn contents were less than 0.07 wt.%. Therefore, through EDS, the existence of three IMCs could only be inferred on the basis of Fe and Si signals, namely signals from α-Al15(Fe,Mn)3Si2, α-Al8Fe2Si, and β-Al5FeSi. The black phase with high contrast in the images of the 6061 alloys was speculated to be from Mg and Si signals corresponding to Mg2Si because Q-Al5Cu2Mg8Si6 is expected to offer high contrast. Because the existence of α-Al15(Fe,Mn)3Si2, α-Al8Fe2Si, and β-Al5FeSi could not be conclusively determined solely using the EPMA and EDS, TEM was employed for phase identification. The results in Figure 6a confirm that the fishbone-shaped IMCs were indeed α-Al15(Fe,Mn)3Si2, not α-Al8Fe2Si (which has a hexagonal close-packed structure). α-Al15(Fe,Mn)3Si2 was discovered to have a cubic-I body-centered cubic structure with a lattice constant of 1.254 nm (the literature value [27] is 1.257 nm). The reason for the absence of the HCP α-Al8Fe2Si predicted by Pandat can also be explained by the fact that the equilibrium hexagonal form of α-AlFeSi is only thermodynamically stable in high-purity Al–Fe–Si alloys, but additions of V, Cr, Mn, Cu, Mo and W all promote a body-centered cubic structure for the α-AlFeSi phase (isostructural to α-Al(Fe,Mn)Si) [27]. Figure 6b reveals that the 6061 alloys also contained β-Al5FeSi, which connected the roots of the fishbone-shaped α-Al15(Fe,Mn)3Si2 and had a needle-shaped form. This phase had a monoclinic structure with the following lattice constants: a = 2.081 nm, b = 0.618 nm, c = 0.616 nm, and β = 90.42° [28]. Calculations revealed that the diffraction pattern in this zone was Z = [0 3 ¯ 1].
Overall, the TEM, EDS, EPMA, and Pandat results confirmed the existence of four types of IMC in the 6061 alloys: the white fishbone-shaped α-Al15(Fe,Mn)3Si2, needle- or plate-like β-Al5FeSi, irregular black Mg2Si, and light gray spherical Q-Al5Cu2Mg8Si6. From Figure 7a, Q-Al5Cu2Mg8Si6 was inferred to have formed within grains, which made its existence undetectable in images of the three-dimensional fracture surface. Similar to in the 5083 alloys, irregular black Mg2Si, in two or three dimensions, was observed at the grain boundaries, and white fishbone-shaped α-Al15(Fe,Mn)3Si2 on the fracture surface had a polyhedral faceted structure. Smaller α-Al15(Fe,Mn)3Si2 phases appeared as small white granules. By contrast, the cross-sectional (two-dimensional) view of the needle-shaped β-Al5FeSi indicated plate-like morphology on the fracture (three-dimensional) surface; this morphology leads to more severe stress concentration and offers potential nucleation sites for hot tearing.
Regarding the 7075 alloys, the black IMC shown in Figure 8 is Mg2Si, whereas the widespread white eutectic phase is MgZn2. Similar to T-Mg32(Al,Zn)49 in the 5083 alloys, Cu can substitute for Zn in the MgZn2 lattice; thus, the distributions of Cu and Zn in MgZn2 were nearly identical. In the middle of the BSE image shown in the upper left of Figure 8, a gray phase of approximately 16 μm in size can be observed. According to the Pandat predictions, Al, Cu, and Fe signals originated from two phases in the 7075 alloys: Al23CuFe4 and Al7Cu2Fe. A comparison of the EPMA results with those in the literature [29] confirmed that Cr and Mn signals came from Al23CuFe4 and that the composition ratio of Al23CuFe4 aligns closely with the result of this study. Similar to the figures for the 5083 and 6061 alloys, Figure 9 shows that black Mg2Si was located at the grain boundaries in two and three dimensions. The gray irregular Al23CuFe4 on the cross-sectional view also appeared irregularly at grain boundaries on the fracture surface. Mg(Zn,Cu,Al)2, which formed during solidification at the eutectic temperature, was primarily fishbone-shaped, with some portions being spherical. Furthermore, on the fracture surface shown in Figure 9a, a considerable amount of light gray Mg(Zn,Cu,Al)2 was found to be dispersed on the three-dimensional grain boundaries (also considered the surface of three-dimensional grains). Mg(Zn,Cu,Al)2 was also visible in the central pore in Figure 9b. Mg(Zn,Cu,Al)2 with this morphology was likely to be present in the form of thin slices on the surface of the grains. However, this morphology may not have been present in cross-sections due to the grinding and polishing procedures used in SEM sample preparation.
The Pandat, EDS, EPMA, and TEM results indicated the presence of the following IMCs in the 5083 alloys: white fishbone-shaped α-Al15(Fe,Mn)3Si2, black irregular Mg2Si, gray-black irregular fine lines of Al3Mg2, and gray dots of T-Mg32(Al,Zn)49. In the 6061 alloys, the identified phases included white α-Al15(Fe,Mn)3Si2 or β-Al5FeSi (as indicated by TEM), black irregular Mg2Si, and gray-white spherical Q-Al5Cu2Mg8Si6. In the 7075 alloys, white fishbone-shaped MgZn2, black irregular Mg2Si, and gray irregular Al23CuFe4 were identified.

3.4. Influence of Compositional Variation on Microstructure

In the 5083 alloys, four main types of IMC were found; their distributions are illustrated in Figure 10. In 5b, numerous irregular fine gray-black lines of Al3Mg2 were discovered (Figure 10a). Mg2Si mainly existed in granular form, with the grain sizes (maximum Feret diameter) being approximately 8–10 μm. Sometimes, Mg2Si had an irregular strip-like form. Additionally, the morphology of T-Mg32(Al,Zn)49 was not limited to spherical dots; this phase also had polygonal appearance and formed around α-Al15(Fe,Mn)3Si2. According to the solidification sequence provided by Pandat, this was because the formation temperature of α-Al15(Fe,Mn)3Si2 is approximately 600 °C, whereas that of T-Mg32(Al,Zn)49 is approximately 447 °C. The quantity of spherical Mg2Si in 5S was much lower than that in 5b (Figure 10b). However, because of the higher Si content, more Si atoms could combine with Mg atoms to form Mg2Si. Consequently, Mg2Si transitioned from an irregular form to larger fishbone-like structures that were approximately 15 μm in size (upper right corner of Figure 10b), and the amount of Al3Mg2 noticeably decreased. The increase in Fe content led to a major increase in the quantity of fishbone-shaped α-Al15(Fe,Mn)3Si2, and the morphology of this phase became more pronounced. Additionally, Al3Mg2 was not as abundant in 5F as in 5b (Figure 10c). More T-Mg32(Al,Zn)49 was present, and much less Al3Mg2 was present (to the point of being negligible) in 5C than in 5b (Figure 10d).
A comparison between 5b and 5T (with versus without the grain refiner) revealed that adding the refiner reduced the grain size from 78 to 71 μm and that IMCs were more dispersed and distributed more finely in 5T. Figure 10a shows that hot tearing occurred mainly near α-Al15(Fe,Mn)3Si2. On the basis of the microstructural evidence, this study observed that when a 5083 alloy was subjected to shrinkage-induced thermal stress, the inherently brittle fishbone-shaped IMCs turned into hot tearing nucleation points and fractured [Supplementary Figure S3] (see Supplementary Materials). Once hot tearing had occurred, the continuous-phase Al3Mg2 along the interdendritic spaces became a medium for transmitting and promoting crack growth (e.g., the distribution of Al3Mg2 shown in [Supplementary Figure S4] (see Supplementary Materials)), which may be similar to the role of Al3Mg2 in friction stir welding [30]. Moreover, due to the widely distributed fishbone-shaped α-Al15(Fe,Mn)3Si2 in 5b, continuous fractures such as local pore clusters (Figure 10f) or elongated irregular fracture patterns (Figure 10d) emerged upon crack expansion. For 5T, the refined grains provided more pathways during the solidification process, leading to a better ability to feed with the remaining liquid. Consequently, 5T exhibited fewer cracks and areas without feeding than did 5b. This was the primary reason for the lower HTS of 5T than 5b. Additionally, the fracture-prone α-Al15(Fe,Mn)3Si2 and crack-transmitting Al3Mg2 in 5T were finer and more widely dispersed than those in 5b. Taking the gray irregular Al3Mg2 as an example, its distribution range in 5b was greater and more continuous. By contrast, the IMCs in 5T were present in smaller localized areas within the aluminum alloy.
Most of the Mg2Si in 5S exhibited a fishbone-like morphology rather than irregular fine line or spherical morphology. This change contributed to the higher HTS of the 5083 alloys containing Mg2Si. Similar to what was observed in 5b, fishbone-shaped IMCs acted as crack nucleation points in the aluminum alloy, resulting in a higher HTS value for 5S than for 5b. This higher HTS was attributable to the formation of fishbone-shaped IMCs, making it more prone to internal fracture than 5b, similar to the statement in ref. [31]. The HTS of 5ST was lower than that of 5S, similar to the result for 5T, primarily due to improved feeding capability and IMC dispersion and refinement, which the ref. [32] has also clarified. Increasing the Fe content (i.e., 5F) further raised the α-Al15(Fe,Mn)3Si2 content, leading to higher pore density (Figure 10f). The grain refinement effect was also significant in 5FT, as demonstrated by the dispersed nature of pore clusters, which were less concentrated in specific areas with the dispersion of α-Al15(Fe,Mn)3Si2.
Finally, increasing the Cu content of the 5083 alloys led to an increase in the content of spherical T-Mg32(Al,Zn)49. Because the Zn content of the alloy was approximately 0.12 wt.%, much lower than the 0.68–0.70 wt.% required for T-Mg32(Al,Zn)49 to form both at grain boundaries and within grains [28], T-Mg32(Al,Zn)49 predominantly formed at grain boundaries, and such formation impeded liquid flow, which has also been observed in ref. [33]. Consequently, the feeding capability of 5C was low, leading to a high HTS value. By comparing the microstructural and HTS differences between 5b and 5C, the effects of Al3Mg2 and T-Mg32(Al,Zn)49 on hot tearing could be understood. The 5b alloy contained a considerable amount of Al3Mg2 but much fewer and smaller T-Mg32(Al,Zn)49 phases. In 5C, the opposite was found. According to Pandat, the difference in α-Al15(Fe,Mn)3Si2 content between 5b and 5C was not substantial (1.335 and 1.350 wt.%, respectively), suggesting similar trends in crack nucleation. The difference in HTS indicated the consequences of the effect of T-Mg32(Al,Zn)49 on feeding capability, revealing that T-Mg32(Al,Zn)49 has a stronger effect on the hot tearing behavior of 5083 alloys than Al3Mg2.
Figure 11 presents BSE images of the 6061 alloys. According to the EPMA and TEM analyses, these alloys mainly featured four types of IMC that contributed to HTS: white α-Al15(Fe,Mn)3Si2 and β-Al5FeSi, black Mg2Si, and gray-white spherical Q-Al5Cu2Mg8Si6. Figure 11a shows that the Fe-rich IMCs in 6b were predominantly white needle-like β-Al5FeSi. This was because when the Fe content was lower, β-Al5FeSi tended to form rather than α-Al15(Fe,Mn)3Si2. Consequently, the amount of α-Al15(Fe,Mn)3Si2 in 6b was relatively low. The black irregular strip-like IMCs at some grain boundaries were Mg2Si, and Q-Al5Cu2Mg8Si6 was present within the grains. The size of the Mg2Si particles had a slightly positive relationship with Si content. An increase in the Fe content enhanced the amount of fishbone-shaped α-Al15(Fe,Mn)3Si2, whereas the quantity and size of Mg2Si and Q-Al5Cu2Mg8Si6 phases were relatively consistent with those in 6b. In 6C, the quantity and size of Q-Al5Cu2Mg8Si6 were notably higher than in 6b; the presence of other phases had to be determined using Pandat.
Microstructural comparisons revealed that a large amount of needle-like β-Al5FeSi led to two problems. In terms of the feeding mechanism, these two-dimensional needle-like and three-dimensional plate-like IMCs severely hindered the flow of remaining liquid. This is because, according to the Pandat calculation, β-Al5FeSi forms at 580 °C, which is significantly higher than non-equilibrium solidus. As the solidification proceeds, the interdendritic liquid space becomes channel-like, which may be blocked by β-Al5FeSi. This phenomenon can be correlated with the statement in ref. [34]. Moreover, these less deformable plate-like β-Al5FeSi IMCs contributed to the stress concentration, making this phase more prone to fracture due to thermal stress accumulation than other IMCs [11]. In 6T, these problems were effectively alleviated. First, the addition of the grain refiner led to the grain size decreasing from approximately 64.0 to 51.5 μm, meaning that the feeding capability was higher in 6T than in 6b. Furthermore, the amount of plate-like β-Al5FeSi was much smaller (Figure 11b), and the domains of this IMC were smaller (shorter needle length), leading to less extensive fracturing caused by stress concentration. The 6S alloy was discovered to contain more β-Al5FeSi, consistent with the Pandat predictions. The β-Al5FeSi content of 6b was approximately 0.1 wt.%, whereas that of 6S was more than double at 0.23 wt.%. As was the case in 6b, excess Si atoms not only combined with Mg but also with Fe to form a Fe-rich phase. However, due to insufficient Fe, the amount of α-Al15(Fe,Mn)3Si2 remained relatively low, resulting in a higher HTS value for 6S than for 6b. The effect of the grain refiner was similar to that for 6T; the HTS value of 6ST was lower than that of 6S.
In discussing the HTS of 6F, understanding the roles of α-Al15(Fe,Mn)3Si2 and β-Al5FeSi in the 6061 alloys is essential. Similar to the 5083 alloys, α-Al15(Fe,Mn)3Si2 was a brittle IMC. However, in the 6061 alloys, the additional presence of β-Al5FeSi makes the alloys more prone to stress concentration, leading to crack initiation under thermal stress. Once localized cracking occurred, the residual thermal stress was released, preventing the stress within the aluminum alloy from inducing further fractures in α-Al15(Fe,Mn)3Si2. As indicated in Figure 11e,f, almost no hot tearing zones were present around α-Al15(Fe,Mn)3Si2 in the 6061 alloys, whereas severe hot tearing behavior was observed around β-Al5FeSi (Figure 11f). According to the Pandat predictions, the Fe content of α-Al15(Fe,Mn)3Si2 was expected to be much higher in 6F than 6b, whereas the β-Al5FeSi content decreased only slightly from 0.1 to 0.092 wt.%. However, the present observations indicated that although the amount of localized α-Al15(Fe,Mn)3Si2 was greater, the amount of β-Al5FeSi was also much greater. Therefore, 6F was expected to exhibit more severe hot tearing behavior than 6b. Similarly, the HTS value of 6FT was lower than that of 6F. Due to efficient grain refinement in 6FT, the formation of α-Al15(Fe,Mn)3Si2 was promoted, and that of β-Al5FeSi was suppressed, increasing the fraction of remaining liquid before solidification (Figure 4). This resulted in lower HTS in 6FT than in 6b.
Finally, doubling the amount of Cu caused two problems: (i) according to Pandat, the content of β-Al5FeSi increased slightly from 0.10 to 0.11 wt.%, and (ii) given the solidification behavior of Al–Cu binary alloy [10], the addition of dilute atoms lowered the NES of the aluminum alloy. When the Cu content was increased to approximately 0.5 wt.%, the peak HTS value was obtained, and the NES decreased to the maximum degree. As the liquidus slightly decreased and the NES dropped considerably, the solidification range of the aluminum alloy expanded with the concentration of dilute atoms, leading to greater shrinkage and the generation of more thermal stress. The spectrometry results revealed that 6b had a copper content of 0.31 wt.%, whereas 6C had a copper content of 0.5 wt.%. Pandat predicted the NES (where the solid fraction, g S , was taken to be 0.99) to be 531.3 °C and 520.7 °C for 6b and 6C, respectively. This difference aligns with the results in the literature. Therefore, 6C was expected to have a higher HTS value than 6b. Similarly, 6CT and other alloys with Ti increments were expected to have lower HTS values relative to 6C.
Figure 12 shows that the primary IMCs in the 7075 alloys were white fishbone-shaped Mg(Zn,Cu,Al)2, black irregular strip-like Mg2Si, and gray irregular Al23CuFe4. These IMCs were present in both the base and incremental alloys. According to the Pandat predictions, increases in Si led to increases in Mg2Si content, with the Mg2Si content of 7S being 0.474 wt.% compared with 0.272 wt.% for 7b. Additional Fe led to higher Al23CuFe4 content: 1.715 versus 0.825 wt.%. Because Al23CuFe4 formed at the interdendritic liquid spaces at about 600 °C as predicted by Pandat, which is much higher than the formation temperature of Mg(Zn,Cu,Al)2 and the non-equilibrium solidus, it can hinder the flow of interdendritic liquid. This phenomenon can be correlated with the statement in ref. [35]. Therefore, we can see that higher Al23CuFe4 content led to more severe hot tearing behavior (Figure 12a), resulting in a higher HTS value for 7F than for 7b. A similar hindrance was observed in 7S (Figure 12b). Additionally, higher Mg2Si content also led to lower Mg(Zn,Cu,Al)2 content of the remaining liquid. This not only hindered flow to a greater degree but also led to a smaller amount of feedable material, resulting in a higher HTS value for 7S than for 7b. Similar to the 5083 and 6061 alloys, the grain refiner had favorable effects on 7F and 7S. Finer grains led to better feeding capability, leading to a lower HTS value for 7FT and 7ST than for 7F and 7S. However, the 7075 alloys exhibited two hot tearing trends that were distinct compared with those in the 5083 and 6061 alloys. First, the lower HTS for 7C was due to Cu replacing Zn in Mg(Zn,Cu,Al)2 rather than due to the generation of more Al23CuFe4. This was evident from the Weka segmentation statistics, which indicated that the Mg(Zn,Cu,Al)2 area fraction for 7C was noticeably higher: 8.76% ± 0.34% for 7b (Figure 12d) versus 6.41% ± 0.18% for 7C (Figure 12c). Because Mg(Zn,Cu,Al)2 is the eutectic that solidifies last, more Mg(Zn,Cu,Al)2 indicated superior feeding capability, leading to a lower HTS for 7C than for 7b. Similarly, 7CT was found to have a lower HTS than 7C due to its finer grains. Furthermore, the higher HTS for 7T than for 7b was attributable to the excessive clustering of TiB2 particles at grain boundaries when the proportion of grain refiner was increased but the amounts of other elements were not increased. This clustering impeded the flow of residual liquid between dendrites (Figure 12f), a phenomenon also identified in the literature [36].

4. Discussion

Table 4 summarizes the microstructures of the IMCs found in the alloys and the effect of the grain refiner on hot tearing. In the 5083 alloys, four primary IMCs were identified. First, α-Al15(Fe,Mn)3Si2 was found to predominantly have fishbone-shaped morphology. Based on the statement in ref. [31] and the observation in this study, the fishbone-shaped IMCs are less deformable, which can be stress concentration points in the 5083 alloys. Second, at grain boundaries, Mg2Si with irregular morphology was discovered. This morphology does not affect HTS, but if Mg2Si exists in a fishbone shape, the HTS can be higher. Third, Al3Mg2 with irregular fine-line morphology exists at grain boundaries and forms a continuous phase, contributing to crack propagation and increasing the HTS. Similar descriptions can be found in ref. [30]. Finally, T-Mg32(Al,Zn)49 dots also form at grain boundaries, contributing to an increased HTS. Note that from ref. [33,37] and systematic investigations in this study, the mechanisms contributing to hot tearing in Al3Mg2 and T-Mg32(Al,Zn)49 are different. Al3Mg2 can cause stress concentration and continuous cracking along the interdendritic channel, whereas T-Mg32(Al,Zn)49 leads to reduced interdendritic liquid feeding capability [33].
Four primary IMCs were discovered in the 6061 alloys. The first two are α-Al15(Fe,Mn)3Si2 and β-Al5FeSi, which are predominant. α-Al15(Fe,Mn)3Si2 mainly has fishbone-shaped morphology but also appears as some small dots. By contrast, β-Al5FeSi has plate/needle-shaped morphology and is the primary factor influencing the HTS of the 6061 alloys. The plate/needle-shaped β-Al5FeSi is prone to causing stress concentration. Once cracking occurs, the residual thermal stress inside the material is relieved. Therefore, fishbone-shaped α-Al15(Fe,Mn)3Si2 is not the main contributor to hot tearing in the 6061 alloys, which can be correlated to the finding from ref. [38]. Additionally, Mg2Si, with irregular morphology similar to that in the 5083 alloys, and Q-Al5Cu2Mg8Si6, which has a spherical morphology, have no effect on HTS in the 6061 alloys.
Three main IMCs were identified in the 7075 alloys, with the primary determinant of hot tearing being Mg(Zn,Cu,Al)2. This phase is the last to solidify in the remaining liquid, and as the content of Mg(Zn,Cu,Al)2 increases, the feeding capability rises, resulting in lower HTS. Conversely, the irregular-shaped Al23CuFe4 and Mg2Si hinder the feeding of interdendritic liquid, contributing to the increase in HTS. This finding can also be related to ref. [35].
In all three series of aluminum alloys, fine TiB2 particles (approximately 100–200 nm in diameter) have a minimal effect on HTS. However, if these particles agglomerate considerably, these agglomerations can obstruct liquid flow in the semisolid state, reducing the feeding capability and increasing the HTS. Adding the Al-5Ti-1B grain refiner (containing TiB2 particles) can successfully refine needle-like or plate-like IMCs. However, similar to the result of ref. [36], this study also found that TiB2 particle aggregation can occur, which can block the liquid channels. The main IMCs in the 7075 alloys do not have the plate-like morphology seen in the 5083 and 6061 aluminum alloys. Therefore, increasing the amount of grain refiner without increments of other elements may reduce the HTS of the 5083 and 6061 aluminum alloys but, conversely, increase the HTS of the 7075 alloys. Additionally, the amount of grain refiner employed in this study was relatively high, which inhibited the growth of dendritic arms of the αAl phase [8]. This may have weakened the bridging effect of Fe-rich α-type IMCs. Consequently, this study did not observe a reduction in HTS from the bridging effect of Fe-rich IMCs, as suggested by some literature [20,39,40].

5. Conclusions

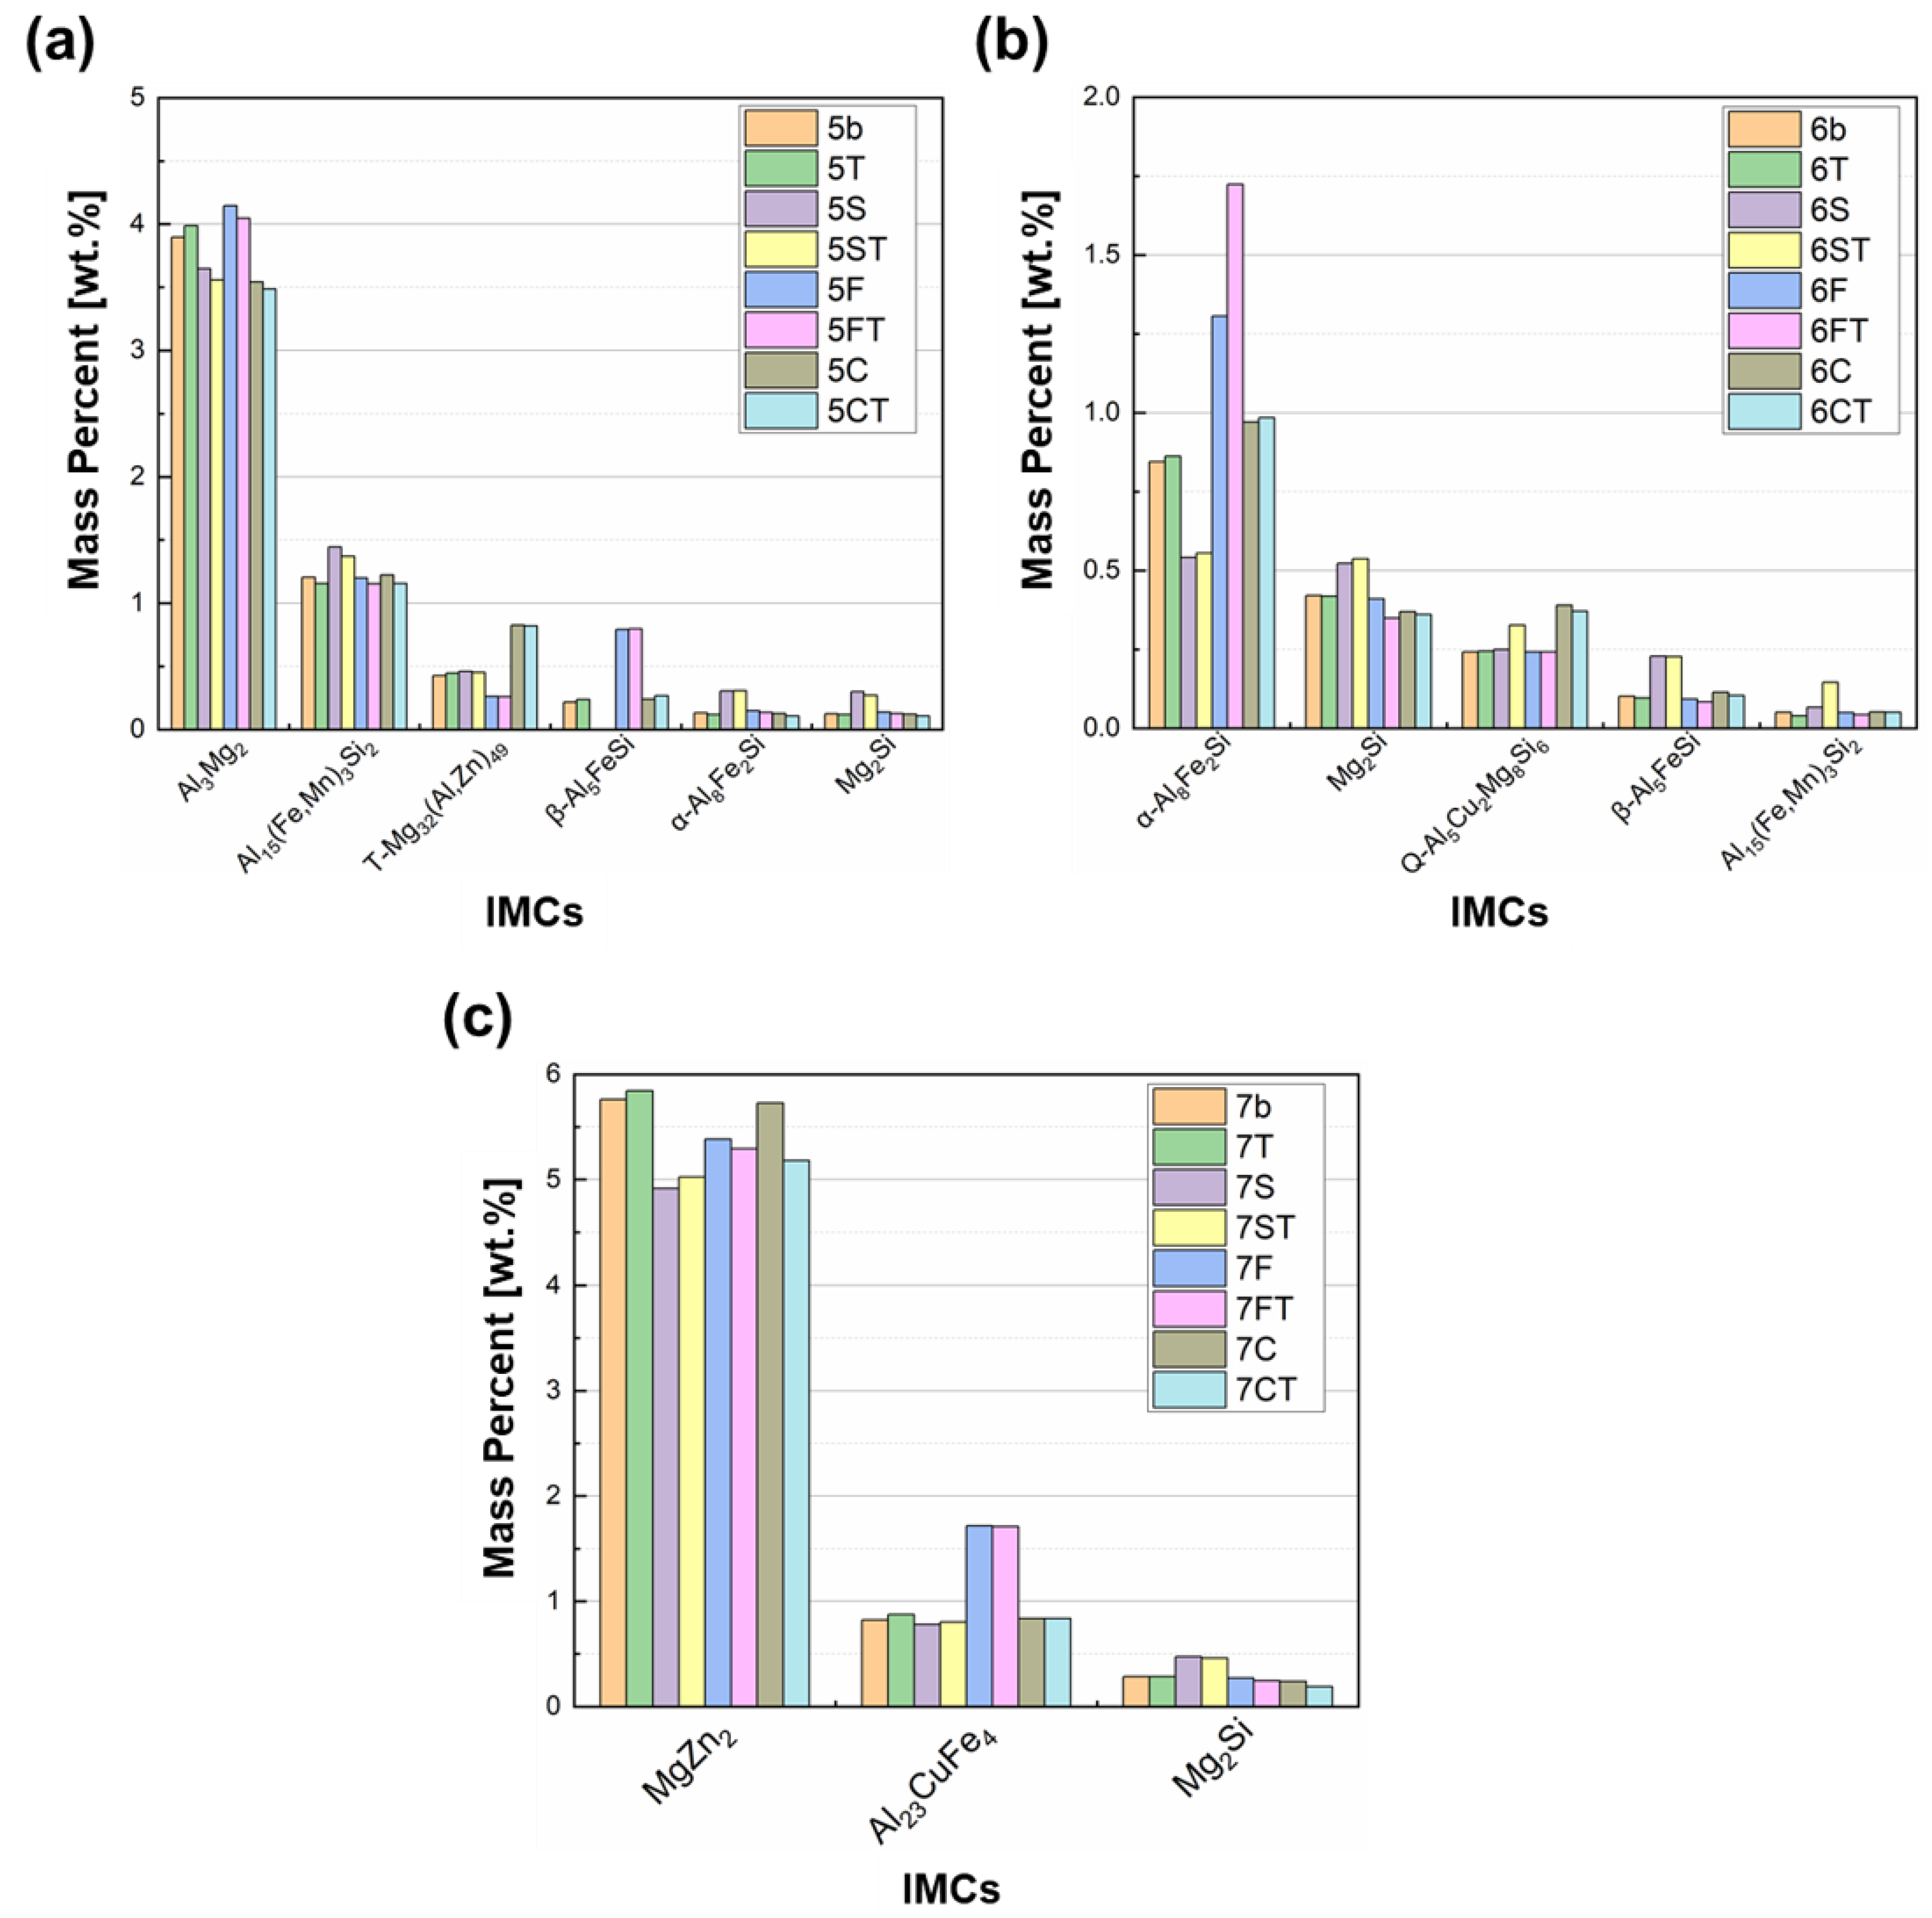
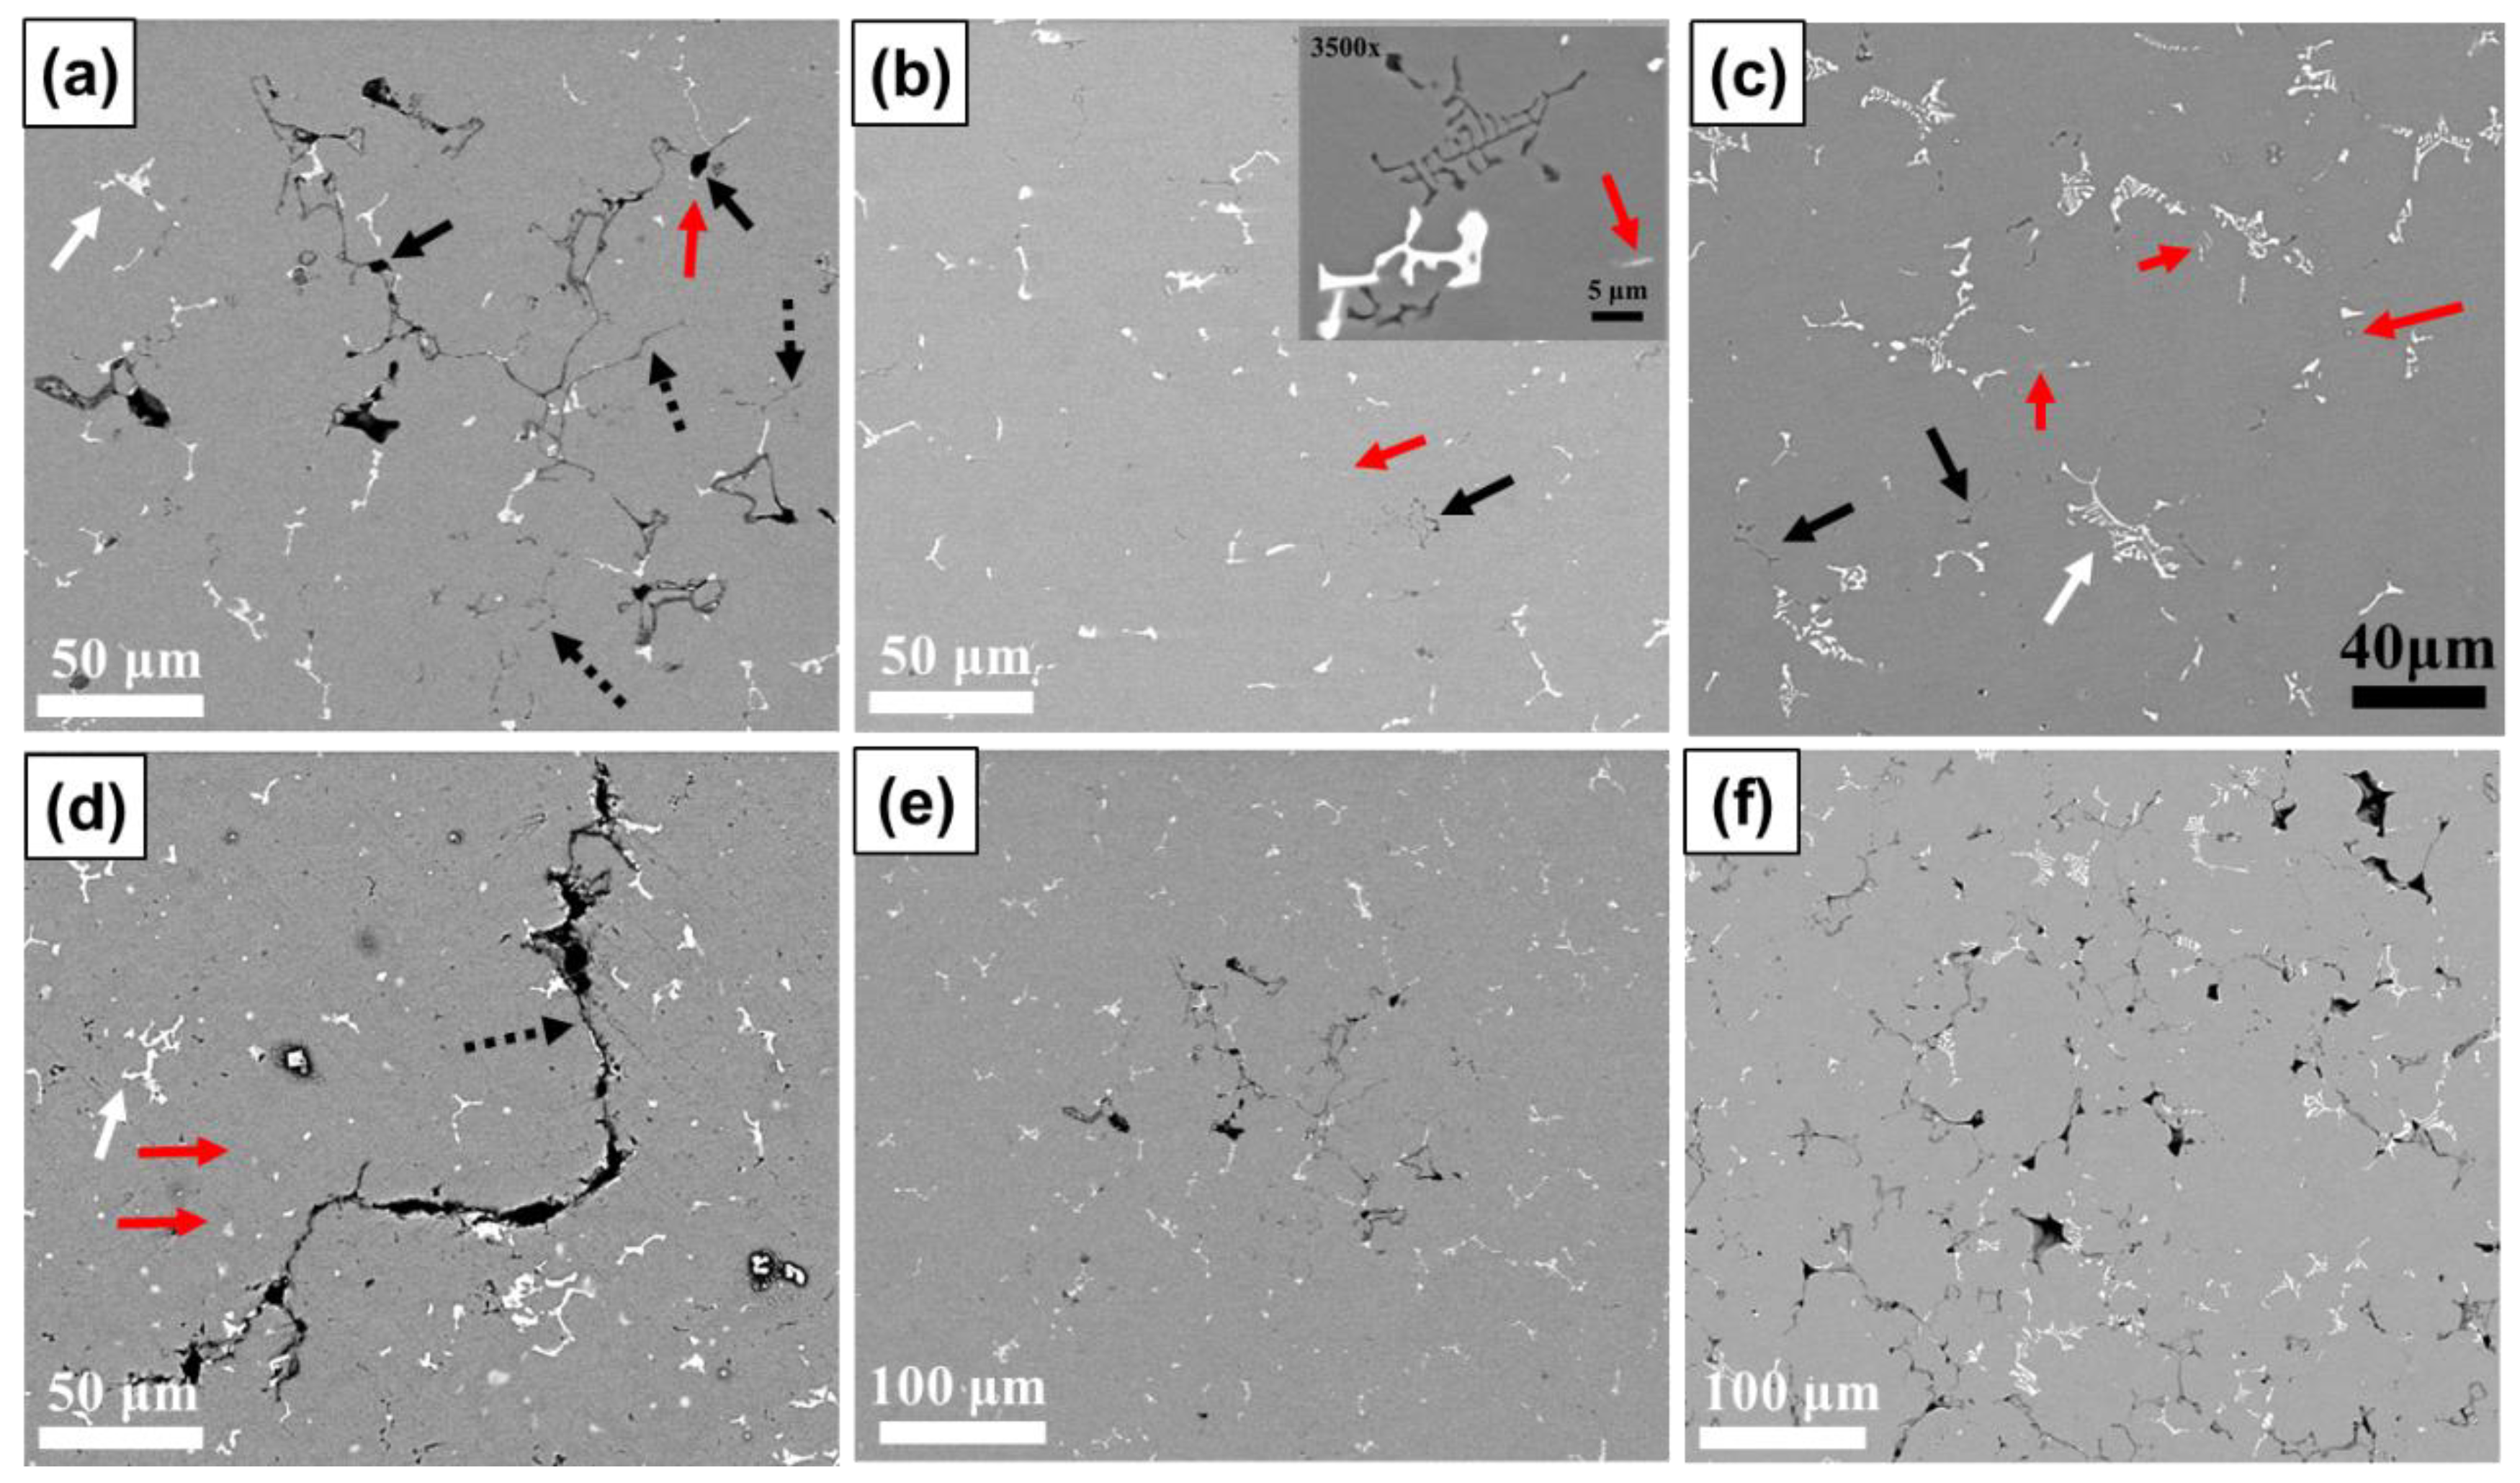
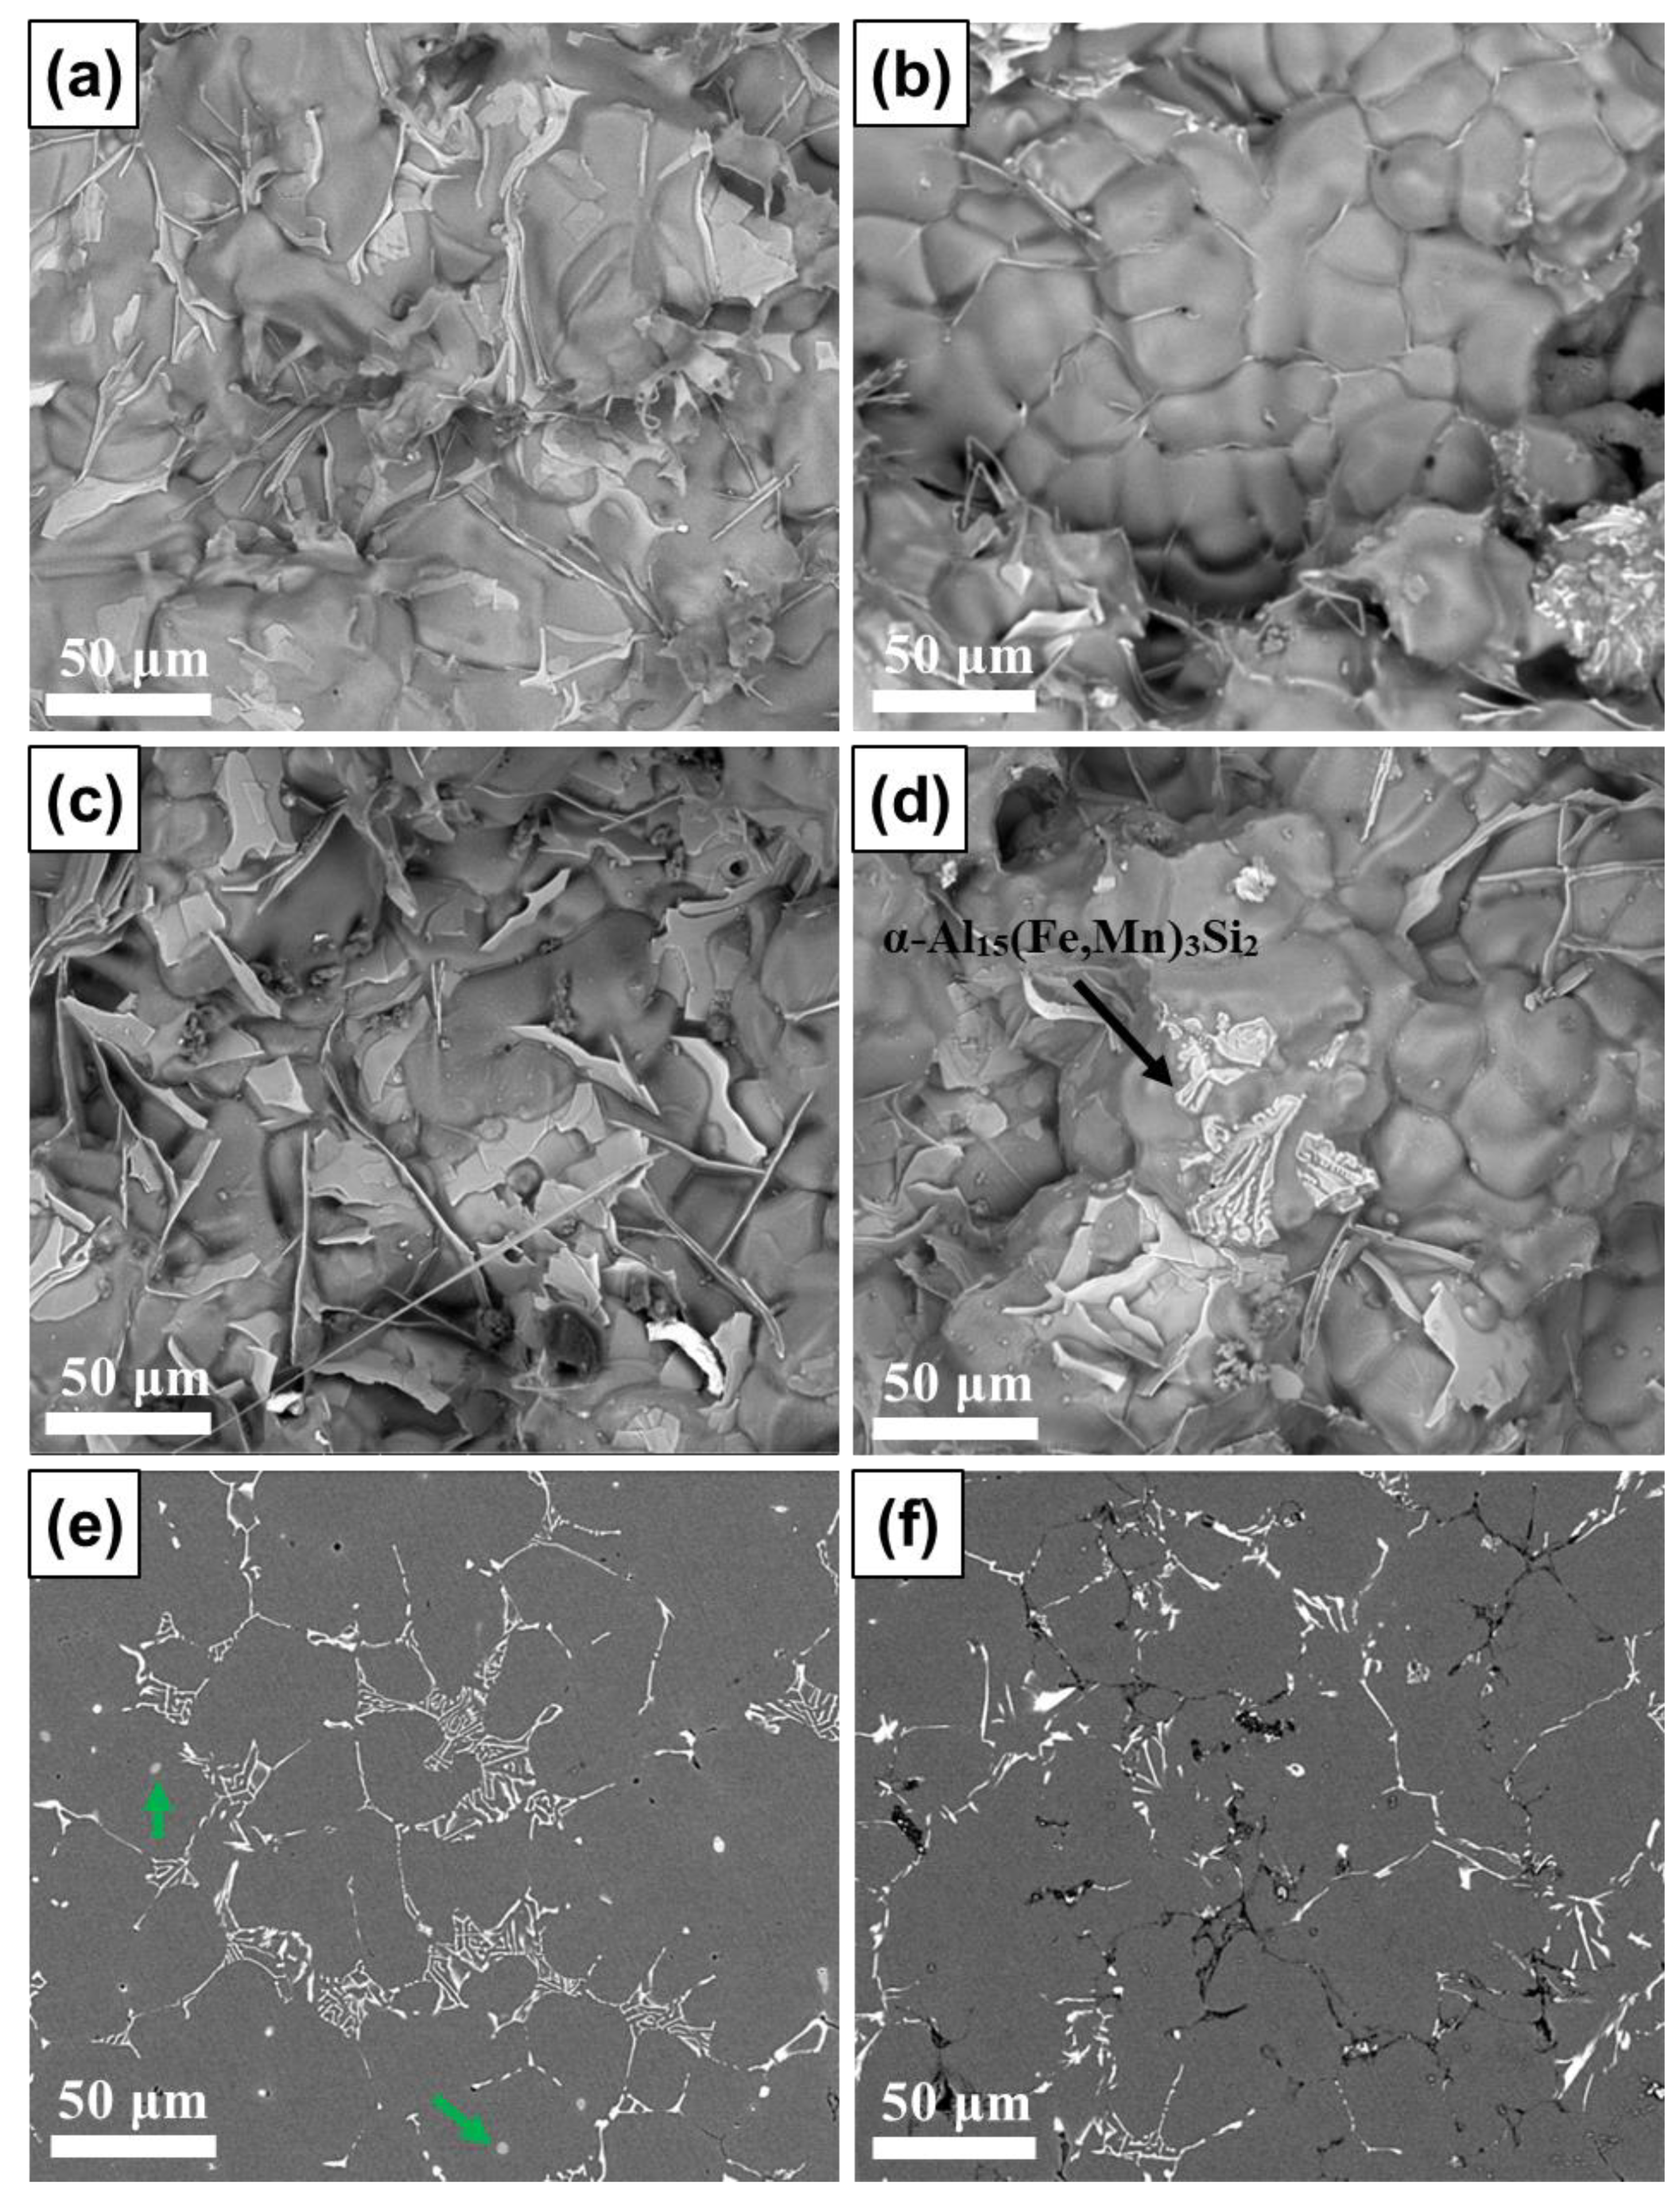
  • In aluminum alloy 5083, when the Si content is increased to 0.2 wt.% or higher, Mg2Si assumes fishbone morphology, whereas the amount and size of α-Al15(Fe,Mn)3Si2 remain almost unchanged. Increasing the Fe content from 0.3 to 0.5 wt.% greatly increases the amount of α-Al15(Fe,Mn)3Si2, the morphology of which tends to be a fishbone structure prone to stress concentration. When the Cu content is increased from 0.03 to 0.09 wt.%, T-Mg32(Al,Zn)49 greatly hinders feeding. Both T-Mg32(Al,Zn)49 and Al3Mg2 contribute to hot tearing, although through different mechanisms. T-Mg32(Al,Zn)49 leads to decreased feeding capability, whereas Al3Mg2 causes continuous cracking resulting from stress concentration. Increasing the amount of Ti from 0.05 to approximately 0.1 wt.% effectively refines the grains, enhancing the overall feeding capability and reducing the continuous cracking of fishbone-shaped IMCs.
  • In aluminum alloy 6061, when the Si content is increased from 0.6 to approximately 0.9 wt.%, the amount of α-Al15(Fe,Mn)3Si2 does not increase, but the amounts of Mg2Si and β-Al5FeSi do. Mg2Si does not affect HTS, whereas β-Al5FeSi positively affects HTS. Increasing the Fe content from 0.3 to 0.5 wt.% dramatically increases the amount of fishbone-shaped α-Al15(Fe,Mn)3Si2 but cannot effectively reduce the amount of harmful plate/needle-like β-Al5FeSi. Increasing the Cu content from 0.3 to 0.5 wt.% reduces the NES; it expands the solidification range, leading to an increase in the contraction rate and an increase in the amount of plate/needle-like β-Al5FeSi. Increasing the Ti content also effectively refines the grains, improving the overall feeding capability and reducing stress concentration and severe blockage of remaining liquid channels, thereby mitigating continuous cracking.
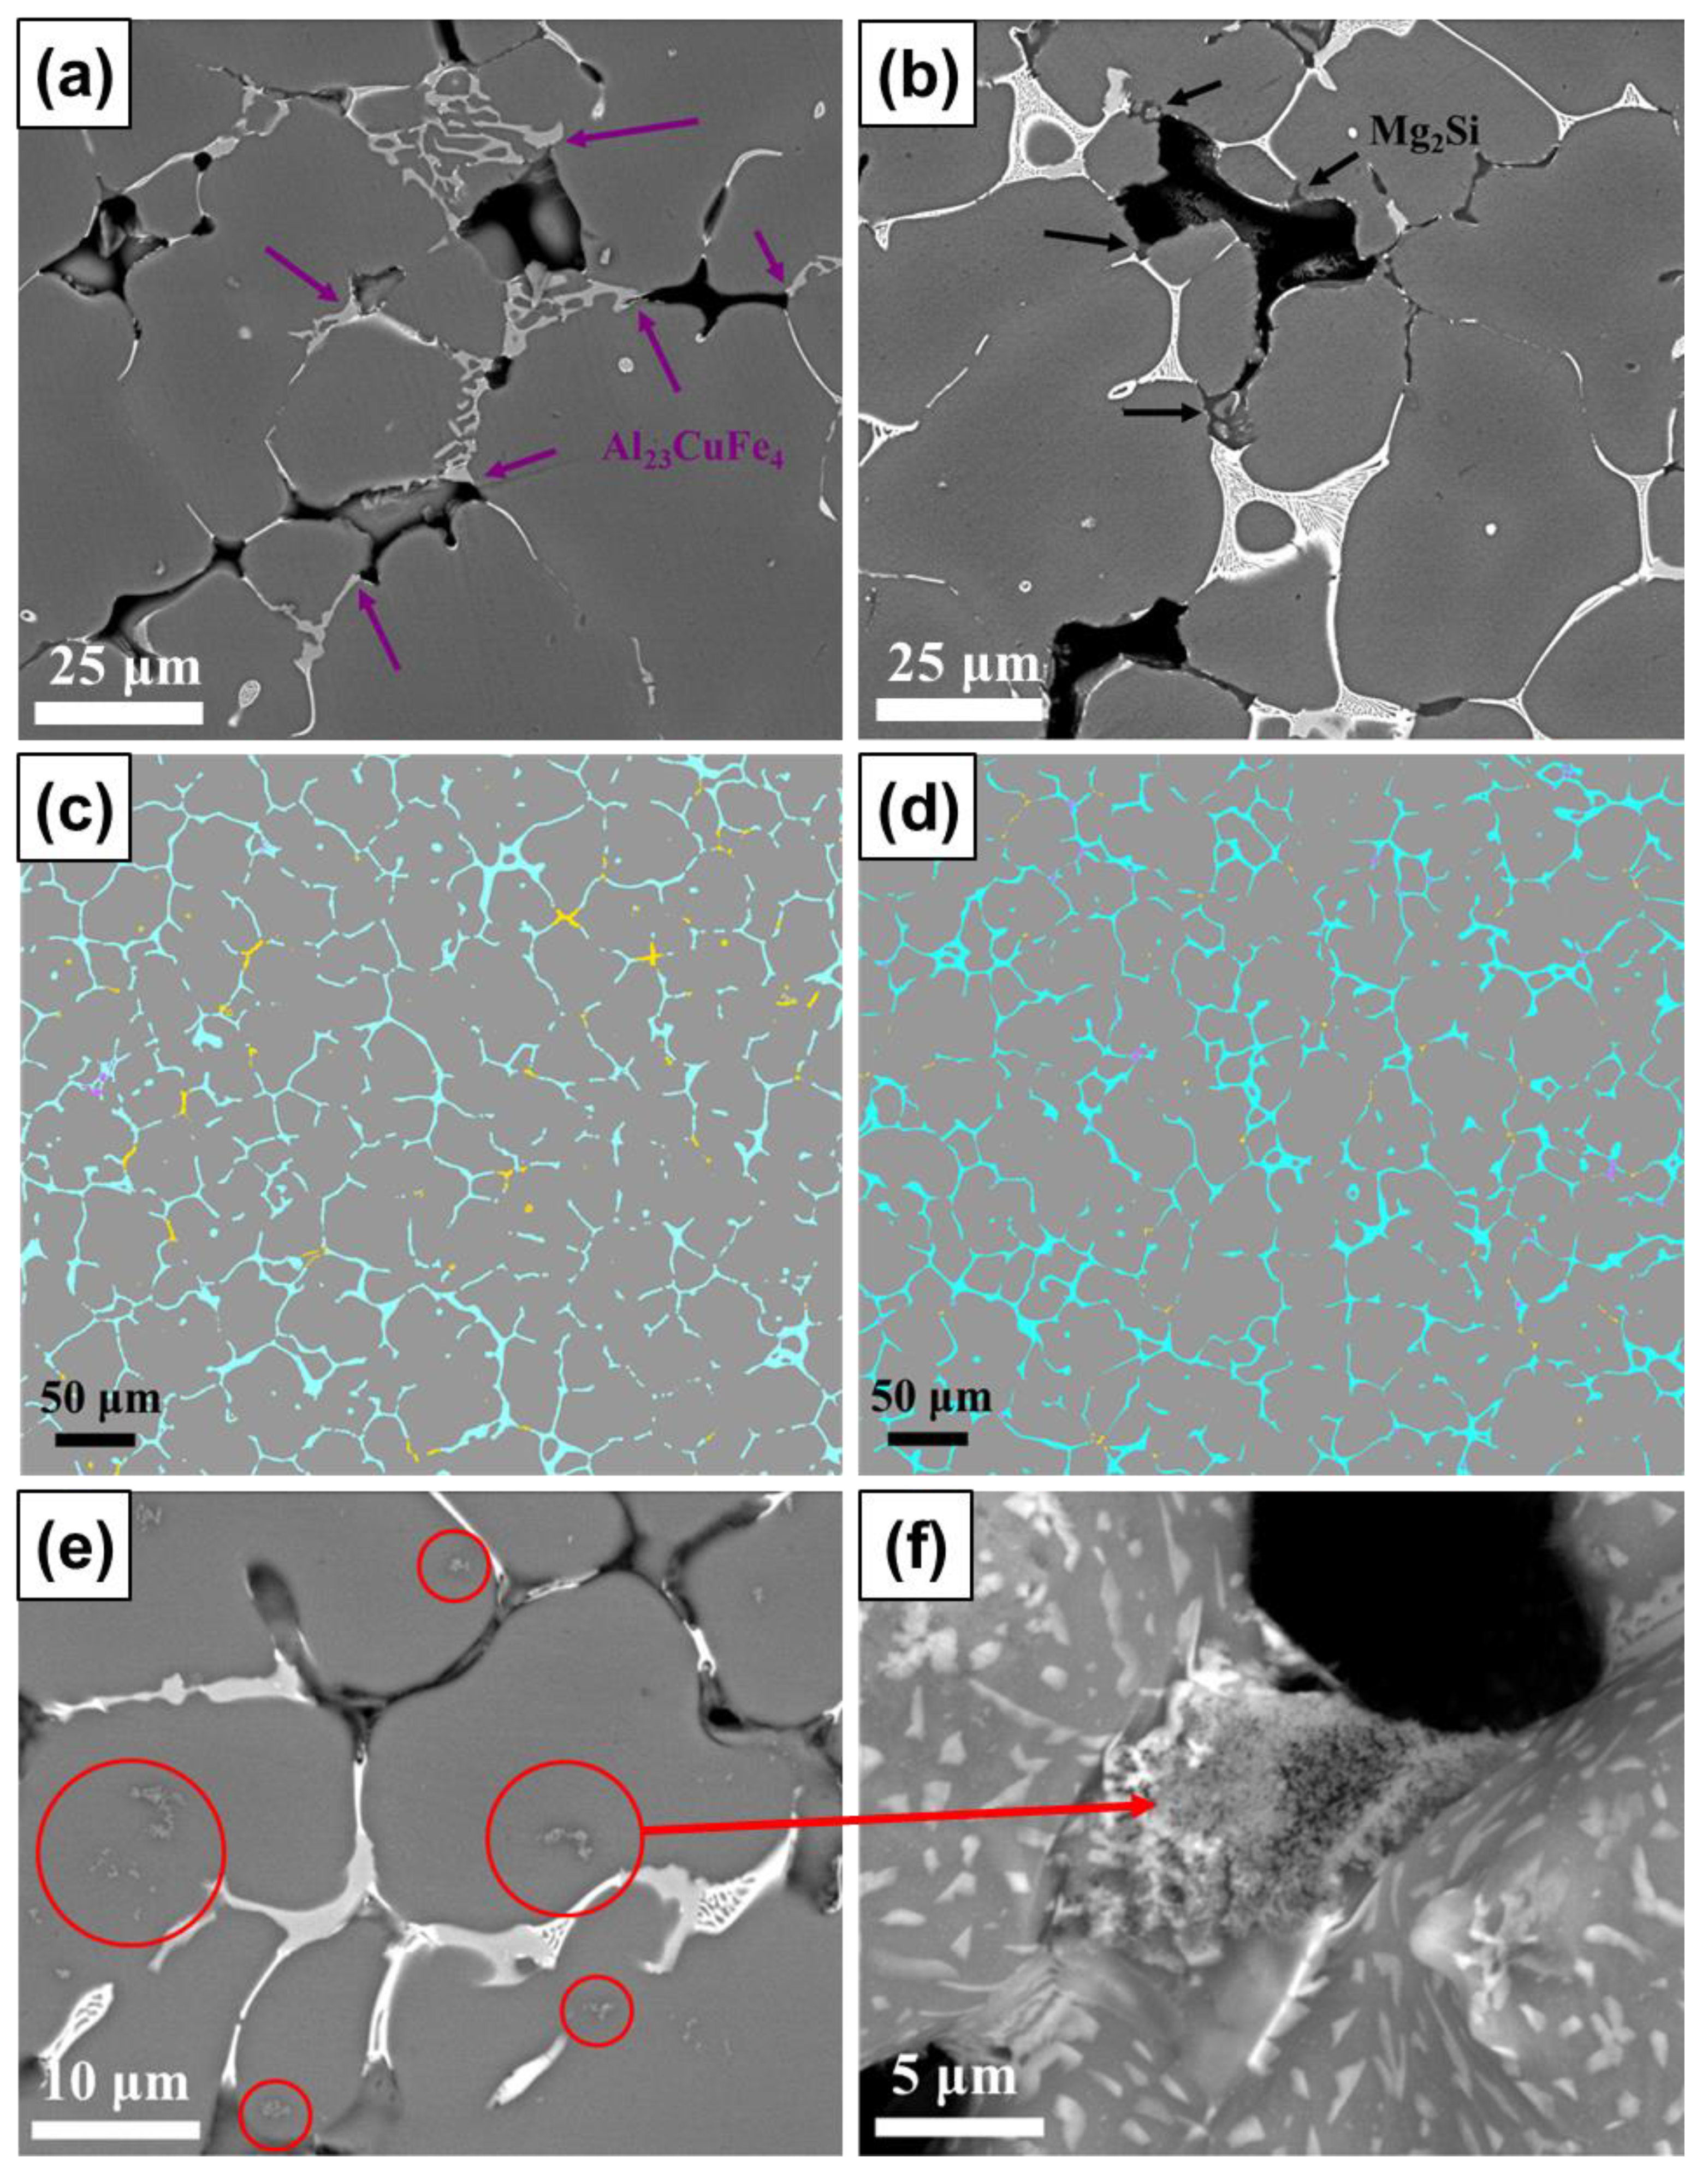
  • In aluminum alloy 7075, when the Si content is increased from 0.1 to approximately 0.2 wt.%, an increase in the Mg2Si content hinders the flow of remaining liquid and leads to a decrease in the amount of αAl+Mg(Zn,Cu,Al)2 eutectic. Increasing the Fe content from 0.2 to 0.45 wt.% greatly increases the amount of Al23CuFe4, which also impedes the flow of interdendritic liquid. When the Cu content is increased from 1.7 to approximately 2.3 wt.%, the content of Al23CuFe4 does not increase considerably; instead, the additional Cu tends to promote Mg(Zn,Cu,Al)2 formation, resulting in a substantial increase in the remaining liquid content. When the Ti content is increased from 0.05 to approximately 0.1 wt.%, the grain size decreases, and the overall feeding capability is improved. However, the grain refiner may not be fully dispersed, and this would lead to the formation of numerous TiB2 clusters, which hinder flow in the liquid channel. By contrast, in the 5083 and 6061 aluminum alloys, in which needle-shaped or fishbone-shaped IMCs tend to form, the benefit of reducing the size of needle-shaped or fishbone-shaped IMCs due to the addition of grain refiner outweighs the disadvantage of TiB2 clusters obstructing the flow of remaining liquid. Therefore, Ti increments rather than base material increments are found to lead to lower HTS in 5083 and 6061 aluminum alloys.

Supplementary Materials

The following are available online at https://www.mdpi.com/article/10.3390/met14010015/s1, Figure S1. Fields of temperature gradient and HTS indicator discussed in refs. [2,3]; Figure S2. Variation in phase fraction with temperature of A3527 core alloy under (a) Scheil and (b) equilibrium conditions. [5]; Figure S3. This image is from the magnification of 500× in Figure 5f, where the fishbone structure IMCs appears fractured; Figure S4. EDS data of 5b From the Si mapping, we could identify that the gray IMCs were Al3Mg2 rather than Mg2Si and can become channels of hot tearing propagation.

Author Contributions

Conceptualization, C.-C.L. and T.-C.S.; Methodology, M.-C.C. and S.-L.L.; Investigation, K.-Y.L., H.-C.H. and C.-Y.T.; Resources, C.-C.L.; Writing—Original Draft Preparation, K.-Y.L.; Writing—Review and Editing, K.-Y.L. and T.-C.S.; Visualization, K.-Y.L. and H.-C.H.; Supervision, T.-C.S.; Funding Acquisition, C.-C.L. All authors have read and agreed to the published version of the manuscript.

Funding

The authors acknowledge the financial support of the National Science and Technology Council through NSTC projects 109-2222-E-002-005-MY3, 111-2622-8-006-029, 112-2628-E-002-022-MY3, 112-2224-E-002-004, and through the China Steel Corporation–National Taiwan University (NTU) industry–academia collaboration project. The APC was funded by NSTC project 112-2628-E-002-022-MY3.

Data Availability Statement

The data presented in this study are available on request from the corresponding author. The data are not publicly available due to some information that could compromise the privacy of research participants.

Acknowledgments

The technical support from the Instrumentation Center at NTU for the EPMA experiments (NSTC 110-2731-M-002-001, EPMA000300) is greatly acknowledged. The authors would also like to express their appreciation for the valuable suggestions and support of Jer-Ren Yang from the Department of Materials Science and Engineering at NTU.

Conflicts of Interest

Author Chi-Cheng Lin was employed by the company China Steel Corporation. The remaining authors declare that the research was conducted in the absence of any commercial or financial relationships that could be construed as a potential conflict of interest. The authors declare that this study received funding from China Steel Corporation–National Taiwan University (NTU) industry–academia collaboration project. The funder was not involved in the study design, collection, analysis, interpretation of data, the writing of this article or the decision to submit it for publication.

References

  1. Smith, W.F. Structure and Properties of Engineering Alloys; McGraw-Hill: New York, NY, USA, 1993. [Google Scholar]
  2. Campbell, J. Complete Casting Handbook: Metal Casting Processes, Metallurgy, Techniques and Design; Butterworth-Heinemann: Oxford, UK, 2015. [Google Scholar]
  3. Nadella, R.; Eskin, D.G.; Du, Q.; Katgerman, L. Macrosegregation in direct-chill casting of aluminium alloys. Prog. Mater. Sci. 2008, 53, 421–480. [Google Scholar] [CrossRef]
  4. Eskin, D.G.; Suyitno; Katgerman, L. Mechanical properties in the semi-solid state and hot tearing of aluminium alloys. Prog. Mater. Sci. 2004, 49, 629–711. [Google Scholar] [CrossRef]
  5. Dantzig, J.A.; Rappaz, M. Solidification; EPFL Press: London, UK, 2009. [Google Scholar]
  6. Dahle, A.K.; StJohn, D.H. Rheological behaviour of the mushy zone and its effect on the formation of casting defects during solidification. Acta Mater. 1998, 47, 31–41. [Google Scholar] [CrossRef]
  7. Eskin, D.G. Physical Metallurgy of Direct Chill Casting of Aluminum Alloys; CRC Press: Boca Raton, FL, USA, 2008. [Google Scholar]
  8. Meylan, B.; Terzi, S.; Gourlay, C.M.; Dahle, A.K. Dilatancy and rheology at 0–60% solid during equiaxed solidification. Acta Mater. 2011, 59, 3091–3101. [Google Scholar] [CrossRef]
  9. Zhang, L. Ultrasonic Processing of Aluminum Alloys; Delft University of Technology: Delft, The Netherlands, 2013. [Google Scholar]
  10. Eskin, D.G.; Katgerman, L.; Suyitno; Mooney, J.F. Contraction of aluminum alloys during and after solidification. Metall. Mater. Trans. A 2004, 35, 1325–1335. [Google Scholar] [CrossRef]
  11. Li, Y.; Li, H.; Katgerman, L.; Du, Q.; Zhang, J.; Zhuang, L. Recent advances in hot tearing during casting of aluminium alloys. Prog. Mater. Sci. 2021, 117, 100741. [Google Scholar] [CrossRef]
  12. Li, Y.; Zhang, Z.R.; Zhao, Z.Y.; Li, H.X.; Katgerman, L.; Zhang, J.S.; Zhuang, L.Z. Effect of Main Elements (Zn, Mg, and Cu) on Hot Tearing Susceptibility During Direct-Chill Casting of 7xxx Aluminum Alloys. Metall. Mater. Trans. A 2019, 50, 3603–3616. [Google Scholar] [CrossRef]
  13. Pereira, L.H.; Asato, G.H.; Otani, L.B.; Jorge, A.M., Jr.; Kiminami, C.S.; Bolfarini, C.; Botta, W.J. Changing the solidification sequence and the morphology of iron-containing intermetallic phases in AA6061 aluminum alloy processed by spray forming. Mater. Charact. 2018, 145, 507–515. [Google Scholar] [CrossRef]
  14. Wang, J.S. In-Situ Observation and Mathematical Modelling of the Nucleation and Growth of Intermetallics and Micropores during the Solidification of Aluminium Alloys; Imperial College: London, UK, 2009. [Google Scholar]
  15. Samuel, F.H.; Samuel, A.M.; Doty, H.W.; Valtierra, S. Decomposition of Fe-intermetallics in Sr-modified cast 6XXX type aluminum alloys for automotive skin. Metall. Mater. Trans. A 2001, 32, 2061–2075. [Google Scholar] [CrossRef]
  16. Abou Khatwa, M.K.; Malakhov, D.V. On the thermodynamic stability of intermetallic phases in the AA6111 aluminum alloy. Calphad 2006, 30, 159–170. [Google Scholar] [CrossRef]
  17. Dash, M.; Makhlouf, M. Effect of key alloying elements on the feeding characteristics of aluminum–silicon casting alloys. J. Light Met. 2001, 1, 251–265. [Google Scholar] [CrossRef]
  18. Caceres, C.; Djurdjevic, M.; Stockwell, T.; Sokolowski, J. The effect of Cu content on the level of microporosity in Al-Si-Cu-Mg casting alloys. Scr. Mater. 1999, 40, 631–637. [Google Scholar] [CrossRef]
  19. Easton, M.A.; Wang, H.; Grandfield, J.; Davidson, C.J.; StJohn, D.H.; Sweet, L.D.; Couper, M.J. Observation and Prediction of the Hot Tear Susceptibility of Ternary Al-Si-Mg Alloys. Metall. Mater. Trans. A 2012, 43, 3227–3238. [Google Scholar] [CrossRef]
  20. Razaz, G.; Carlberg, T. Hot tearing susceptibility of AA3000 aluminum alloy containing Cu, Ti, and Zr. Metall. Mater. Trans. A 2019, 50, 3842–3854. [Google Scholar] [CrossRef]
  21. Cao, G.; Kou, S. Hot cracking of binary Mg–Al alloy castings. Mater. Sci. Eng. A 2006, 417, 230–238. [Google Scholar] [CrossRef]
  22. Wang, K.; Fu, P.; Peng, L.; Wang, Y.; Ding, W. A simplified hot-tearing criterion for shape castings based on temperature-field simulation. Metall. Mater. Trans. A 2019, 50, 5271–5280. [Google Scholar] [CrossRef]
  23. Arganda-Carreras, I.; Kaynig, V.; Rueden, C.; Eliceiri, K.W.; Schindelin, J.; Cardona, A.; Seung, H.S. Trainable Weka Segmentation: A machine learning tool for microscopy pixel classification. Bioinformatics 2017, 33, 2424–2426. [Google Scholar] [CrossRef]
  24. Wahlmann, B.; Leidel, D.; Markl, M.; Körner, C. Numerical alloy development for additive manufacturing towards reduced cracking susceptibility. Crystals 2021, 11, 902. [Google Scholar] [CrossRef]
  25. Jung, J.G.; Cho, Y.H.; Lee, J.M.; Kim, H.W.; Euh, K. Designing the composition and processing route of aluminum alloys using CALPHAD: Case studies. CALPHAD 2019, 64, 236–247. [Google Scholar] [CrossRef]
  26. Cinkilic, E.; Moodispaw, M.; Zhang, J.; Miao, J.; Luo, A.A. A New Recycled Al–Si–Mg Alloy for Sustainable Structural Die Casting Applications. Metall. Mater. Trans. A 2022, 53, 2861–2873. [Google Scholar] [CrossRef]
  27. Yan, L.Z.; Zhang, Y.A.; Li, X.W.; Li, Z.H.; Wang, F.; Liu, H.W.; Xiong, B.Q. Microstructural evolution of Al–0.66Mg–0.85Si alloy during homogenization. Trans. Nonferrous Met. Soc. China 2014, 24, 939–945. [Google Scholar] [CrossRef]
  28. Sweet, L.; Zhu, S.M.; Gao, S.X.; Taylor, J.A.; Easton, M.A. The Effect of Iron Content on the Iron-Containing Intermetallic Phases in a Cast 6060 Aluminum Alloy. Metall. Mater. Trans. A 2011, 42, 1737–1749. [Google Scholar] [CrossRef]
  29. Gao, M.; Feng, C.R.; Wei, R.P. An analytical electron microscopy study of constituent particles in commercial 7075-T6 and 2024-T3 alloys. Metall. Mater. Trans. A 1998, 29, 1145–1151. [Google Scholar] [CrossRef]
  30. Gao, W.; Ning, J.; Gu, X.; Chen, L.; Liang, H.; Li, W.; Lewandowski, J.J. Precipitation Behavior and Corrosion Properties of Stirred Zone in FSWed AA5083 Al-Mg Alloy after Sensitization. Metals 2023, 13, 1618. [Google Scholar] [CrossRef]
  31. Ceschini, L.; Boromei, I.; Morri, A.; Seifeddine, S.; Svensson, I.L. Microstructure, tensile and fatigue properties of the Al–10% Si–2% Cu alloy with different Fe and Mn content cast under controlled conditions. J. Mater. Process. Technol. 2009, 209, 5669–5679. [Google Scholar] [CrossRef]
  32. Takai, R.; Endo, N.; Hirohara, R.; Tsunoda, T.; Yoshida, M. Experimental and numerical analysis of grain refinement effect on hot tearing susceptibility for Al–Mg alloys. Int. J. Adv. Manuf. Technol. 2019, 100, 1867–1880. [Google Scholar] [CrossRef]
  33. Zhang, D.; Zhao, X.; Pan, Y.; Li, H.; Zhou, L.; Zhang, J.; Zhuang, L. Liquation Cracking Tendency of Novel Al-Mg-Zn Alloys with a Zn/Mg Ratio below 1.0 during Fusion Welding. Metals 2020, 10, 222. [Google Scholar] [CrossRef]
  34. Puncreobutr, C.; Lee, P.; Kareh, K.; Connolley, T.; Fife, J.; Phillion, A. Influence of Fe-rich intermetallics on solidification defects in Al–Si–Cu alloys. Acta Mater. 2014, 68, 42–51. [Google Scholar] [CrossRef]
  35. Ganjehfard, K.; Taghiabadi, R.; Noghani, M.T.; Ghoncheh, M.H. Tensile properties and hot tearing susceptibility of cast Al-Cu alloys containing excess Fe and Si. Int. J. Miner. Metall. 2021, 28, 718–728. [Google Scholar] [CrossRef]
  36. Li, Y.; Bai, Q.L.; Liu, J.C.; Li, H.X.; Du, Q.; Zhang, J.S.; Zhuang, L.Z. The Influences of Grain Size and Morphology on the Hot Tearing Susceptibility, Contraction, and Load Behaviors of AA7050 Alloy Inoculated with Al-5Ti-1B Master Alloy. Metall. Mater. Trans. A 2016, 47, 4024–4037. [Google Scholar] [CrossRef]
  37. Meng, C.; Zhang, D.; Cui, H.; Zhuang, L.; Zhang, J. Mechanical properties, intergranular corrosion behavior and microstructure of Zn modified Al–Mg alloys. J. Alloys Compd. 2014, 617, 925–932. [Google Scholar] [CrossRef]
  38. Nadim, A.; Taghiabadi, R.; Razaghian, A. Effect of Mn modification on the Tribological properties of in situ Al-15Mg2Si composites containing Fe as an impurity. J. Tribol. 2018, 140, 061610. [Google Scholar] [CrossRef]
  39. Nagaumi, H.; Suzuki, S.; Okane, T.; Umeda, T. Effect of Iron Content on Hot Tearing of High-Strength Al-Mg-Si Alloy. Mater. Trans. 2006, 47, 2821–2827. [Google Scholar] [CrossRef]
  40. Sweet, L.; Easton, M.A.; Taylor, J.A.; Grandfield, J.F.; Davidson, C.J.; Lu, L.; Couper, M.J.; StJohn, D.H. Hot Tear Susceptibility of Al-Mg-Si-Fe Alloys with Varying Iron Contents. Metall. Mater. Trans. A 2013, 44, 5396–5407. [Google Scholar] [CrossRef]
Figure 1. (a) Design of the CRC mold and (b) the CRC mold in Rhino 6 software. The red circles and numbers indicate the positions and numbering of the four thermocouples inserted into the mold from bottom to top, 1 to 4, which means Tb1 to Tb4, respectively.
Metals 14 00015 g001
Figure 2. Quantification of the severity of hot tearing: a hairline crack, a small crack, a severe crack, and complete separation.
Metals 14 00015 g002
Figure 3. HTS values for (a) 5083, (b) 6061, and (c) 7075 alloys of various compositions. From left to right, the bars in the charts represent the base material and alloys with Ti (T), Si (S), Si–Ti (ST), Fe (F), Fe–Ti (FT), Cu (C), and Cu–Ti (CT) increments.
Metals 14 00015 g003
Figure 4. Predictions of the types and amounts of IMCs within (a) 5083, (b) 6061, and (c) 7075 alloys. Predictions were made using Pandat software (version 2021) with the Scheil solidification model.
Metals 14 00015 g004
Figure 5. (a) Fracture surface (three-dimensional) and (b) cross-section (two-dimensional) of 5FT. Gray thread-like Al3Mg2 (orange arrow), black Mg2Si (black arrow), white fishbone-shaped α-Al15(Fe,Mn)3Si2 (white arrow), and white irregular small dots of T-Mg32(Al,Zn)49 (red arrow) can be observed.
Metals 14 00015 g005
Figure 6. (a) Bright-field image (left) and high-angle annular dark-field scanning transmission electron microscopy (right) image of white fishbone-shaped α-Al15(Fe,Mn)3Si2 in 6b, and (b) bright-field image (left) and diffraction pattern (right) of β-Al5FeSi.
Metals 14 00015 g006
Figure 7. (a) Fracture surface (three-dimensional) and (b) cross-section (two-dimensional) of 6C. Light gray spherical Q-Al5Cu2Mg8Si6 (yellow arrow), black Mg2Si (black arrow), white fishbone-shaped and granular α-Al15(Fe,Mn)3Si2 (solid white arrow), and white plate-like β-Al5FeSi (dashed white arrow) can be observed.
Metals 14 00015 g007
Figure 8. Results of EPMA mapping of 7FT.
Metals 14 00015 g008
Figure 9. (a) Fracture surface (three-dimensional) and (b) cross-section (two-dimensional) of 7C. Three morphologies of Mg(Zn,Cu,Al)2 (fishbone-shaped, solid white arrow; spherical, dashed white arrow; and widespread distribution), black Mg2Si (black arrow), and light gray Al23CuFe4 (purple arrow) can be observed.
Metals 14 00015 g009
Figure 10. BSE images of 5083 alloys: (a) 5b, (b) 5S, (c) 5F, (d) 5C, (e) 5b (at 500× magnification), and (f) 5F (at 250× magnification). The main phases affecting the feeding capacity are white fishbone-shaped or white circular α-Al15(Fe,Mn)3Si2 (white arrows), black Mg2Si (solid black arrows) or Al3Mg2 (dashed black arrows), and gray irregular T-Mg32(Al,Zn)49 (red arrows).
Metals 14 00015 g010
Figure 11. BSE images of 6061 alloys: (a) 6b, (b) 6T, (c) 6S, (d) 6ST, (e) 6F, and (f) 6F at 500× magnification. The main phases affecting the feeding capacity were white fishbone-shaped or white circular α-Al15(Fe,Mn)3Si2, white plate-like or needle-like β-Al5FeSi, black Mg2Si, and gray or white circular Q-Al15Cu2Mg8Si6 (green arrows).
Metals 14 00015 g011
Figure 12. BSE images of 7075 alloys: fracture surface of (a) 7F, (b) 7S, (e) 7T, and (f) 7T with magnifications of (a,b) 1000×, (e) 2500×, and (f) 5000×; images processed using Weka segmentation of (c) 7b and (d) 7C at a magnification of 250×. The main phases influencing the feeding capacity are Mg(Zn,Cu,Al)2 (solid white arrows for fishbone-shaped eutectic structures and dashed lines for spherical), black Mg2Si (black arrows), gray Al23CuFe4 (purple arrows), and TiB2 cluster (red circle).
Metals 14 00015 g012
Table 1. Weight percentages for all base alloys and alloys with increments, as measured using a spectrometer. Bold and underlined numbers emphasize the increase in the specific alloy composition.
5083MgSiFeCuCrMnZnTiAl
5b4.720.120.300.050.070.680.120.05Bal.
5T4.790.120.300.050.070.660.120.09
5S4.730.230.320.050.080.680.130.07
5ST4.630.220.310.050.080.670.130.13
5F4.810.130.520.030.070.520.120.06
5FT4.730.130.510.030.070.510.120.10
5C4.740.120.310.090.080.680.140.08
5CT4.680.120.310.090.080.670.130.12
6061MgSiFeCuCrMnZnTiAl
6b0.900.650.330.310.070.030.050.05Bal.
6T0.900.650.330.310.070.030.050.09
6S0.960.940.260.320.070.040.050.04
6ST0.980.970.270.330.070.040.050.08
6F0.890.660.480.310.070.040.050.04
6FT0.820.650.620.310.070.030.050.11
6C0.900.690.370.500.070.030.050.04
6CT0.880.680.380.480.070.030.050.09
7075MgSiFeCuCrMnZnTiAl
7b2.840.130.221.720.210.076.010.04Bal.
7T2.870.130.231.750.200.076.040.07
7S2.570.220.221.700.270.075.760.04
7ST2.590.220.221.790.210.075.770.08
7F2.570.120.441.690.210.075.880.03
7FT2.520.120.441.750.210.075.720.07
7C2.570.110.222.290.200.075.840.04
7CT2.350.100.222.300.220.075.460.10
Table 2. Weighted index for the location of hot tearing fractures.
Crack Width Rating W i Hot Tearing Location Rating f i Rod Length Rating [mm] L i
Hairline1Closed to the sprue1150.51
Light2At ball end1.5112.52
Severe3In the middle of the rod274.53
Complete separation4--36.54
Table 3. Size of grains at the base of the first rod for each alloy in the CRC experiment.
5083Grain Size (µm)6061Grain Size (µm)7075Grain Size (µm)
5b78.18 ± 12.686b64.78 ± 9.137b54.07 ± 8.33
5T71.18 ± 9.646T51.5 ± 7.677T50.43 ± 7.16
5S68.25 ± 8.706S64.61 ± 8.557S38.99 ± 3.94
5ST67.93 ± 8.636ST59.59 ± 6.007ST31.07 ± 4.70
5F74.45 ± 8.826F55.67 ± 8.517F40.87 ± 4.89
5FT67.94 ± 9.466FT50.28 ± 8.517FT37.74 ± 4.16
5C79.9 ± 10.676C82.61 ± 18.017C55.78 ± 7.63
5CT73.02 ± 10.436CT63.43 ± 10.807CT54.7 ± 9.80
Table 4. Information on IMCs, where “√” mark means visible, and their contribution to HTS. In addition, (5), (6), and (7) in the "HTS Value" column mean that the intermetallic phase is only present in 5083, 6061, and 7075 alloys, respectively.
IMCs508360617075ColorMorphologyHTS Value
Mg(Zn,Cu,Al)2 whitefishbone-shaped or small circular dots or irregular
α-Al15(Fe,Mn)3Si2 whitefishbone-shaped or small circular dots↑ (5)–(6)
β-Al5FeSi whiteplate or needle-like
Al23CuFe4 grayirregular
Q-Al15Cu2Mg8Si6 gray/whitespherical
Mg2Siblackirregular or small circular dots↑ (5, 7)–(6)
Al3Mg2 gray/blackirregular (thinner than Mg2Si)↑ (lower effect)
T-Mg32(Al,Zn)49 graysmall circular dots (about 3~5μm)↑ (higher effect)
TiB2grayirregular particle– (↑ if clustering)
Disclaimer/Publisher’s Note: The statements, opinions and data contained in all publications are solely those of the individual author(s) and contributor(s) and not of MDPI and/or the editor(s). MDPI and/or the editor(s) disclaim responsibility for any injury to people or property resulting from any ideas, methods, instructions or products referred to in the content.

