
On the Effect of Exposure Time on Al-Si10-Mg Powder Processed by Selective Laser Melting
by
 , and
, and
Paola Leo
1,* ,
,
Gilda Renna
1,
Neetesh Soni
1,
Fabio De Pascalis
2,
Teresa Primo
1 and
and
Antonio Del Prete
1 1
Department of Engineering for Innovation, University of Salento, Via Per Monteroni, 73100 Lecce, Italy
2
ENEA—Division for Sustainable Materials, Research Centre of Brindisi, S.S.7 Appia Km 706, 72100 Brindisi, Italy
*
Author to whom correspondence should be addressed.
Metals 2024, 14(1), 76; https://doi.org/10.3390/met14010076
Submission received: 9 November 2023
/
Revised: 1 January 2024
/
Accepted: 3 January 2024
/
Published: 8 January 2024
(This article belongs to the Special Issue Selective Laser Melting: Microstructure and Properties Optimization for Metals and Alloys, Metal Matrix Composites, Lattice and Hybrid Parts)
Abstract
:In this study, the effect of increasing exposure time on the microstructures, porosity, mechanical properties and corrosion behavior of selective laser melted sample Al-Si10-Mg powder was investigated. The samples were processed at the same power (375 W) and scan speed (2000 mm/s), but with increasing exposure time. Exposure time equal to 40, 50 and 60 µs was applied. The features of the analyzed samples show that with increasing exposure time, greater efficiency of the heat input was obtained, with a larger size of the melt pool and Si particles and lower porosity. Specifically, at the highest exposure time the melt pool showed an increase of 19% in width and 48% in depth, while the volume percentage of the voids decreased by 50% with respect to the lowest exposure time. Moreover, with the coarser microstructure being associated with a lower level of voids, the average hardness is similar for the analyzed samples. Corrosion resistance was evaluated, being one of the most important properties that may affect the service performance of Al-Si10-Mg alloy in the aerospace, marine and automotive industries. The potentiodynamic curves of the samples show that the voids occurrence is more significant with respect to the scale of the microstructure on corrosion behavior, with the sample processed at the highest exposure time being the more resistant to corrosion. The experimental techniques used in the present study were Optical Microscope (OM), Scanning Electron Microscope (SEM), hardness and X-Ray Computed Tomography.
Keywords:
Al-Si10-Mg; Selective Laser Melting; exposure time; microstructure; defects; corrosion; hardness1. Introduction
Al-Si10-Mg alloy is widely used for casting due to its near-eutectic composition. The role of Mg in the alloys is to increase hardness both by solid solution and aging treatment [1,2]. The main applications of Al-Si10-Mg alloys are in the fields of aerospace and automobiles, due to their high strength-to-weight ratio, low density, high specific strength and good corrosion resistance. These alloys also exhibit excellent electric and thermal conductivity [1,2].
Selective Laser Melting (SLM) is a 3D printing technology that uses a high-energy laser beam to completely melt a layer of powder in a protective atmosphere along the laser path [3,4]. Successive layers are added to the previous ones, and on each layer the laser path melts the powder according to the required geometry of the component and guarantees a bonding with the previous layer. Therefore, at the end of the building process, a three-dimensional component is formed “layer by layer” or with the additive method. SLM has been successfully applied to both ferrous and non-ferrous alloys [5,6]. With respect to the traditional subtractive manufacturing method, SLM can produce more complex geometry with reduced waste of material and post-machining procedures. Moreover, the production cycles are shortened. The quality of the parts is a function of the process parameters (such as energy density, scanning speed, laser power, layer thickness, hatching space, scan strategy and preheat temperature), the properties of the metallic powder and the behavior of the melt pool during the process. Specifically, the melt pool modes (keyhole or conduction) significantly affect microstructure and properties [7].
When processed by SLM, Al-Si10-Mg alloy exhibits a very fine microstructure compared to the traditional casting process, due to the high cooling rate involved in the process. Moreover, the high thermal gradient leads mainly to a cellular microstructure [8,9,10,11]. That cellular microstructure is an Al solid solution supersaturated by the alloying atoms because of the high cooling rate that limits particles precipitation and is mixed with Al-Si eutectic structure at the grain boundary [12]. This fine microstructure guarantees high strength and toughness.
SLM parts suffer from relatively low surface quality and voids occurrence [13,14], which reduces the fatigue strength (bypassing the initial stage of microcrack nucleation) [15,16,17,18] and the corrosion resistance [19]. Voids between adjacent scanning tracks have been observed for Al-Si10-Mg when the hatch scan space is increased to 150 µm and beyond [20]. Also, scan speed, scan strategies and laser volumetric energy density (VED) strongly affect porosity evolution [21].
The energy density received by metallic powder can be expressed by Equation (1), according to [22], where P is the laser power [W], v is the scanning speed [mm/s], h is the hatch spacing [mm] and lt is the layer thickness [mm].
VED = P/v · h · lt
But if the laser beam works with pulses spaced at a certain point distance (Pd) and exposure time (Et), the scanning speed can also be expressed as the ratio between the Pd [mm] and the Et [s], so the VED can also be expressed as in Equation (2) [23]:
VED = P · Et/Pd · h · lt
Therefore, the same value of VED can be obtained by properly combining Pd and Et.
In a previous study [12], the authors characterized the microstructure features of Al-Si10-Mg powder processed at different values of VED. Specifically, the investigated values were set equal to 68.4, 70.2, 70.7 and 86.0 J/mm3 by varying power (from 300 W to 350 W), Et and Pd, while h and lt were not changed. The authors found that the coarser microstructure occurred at the highest VED, associated with the lowest porosity. Moreover, comparing the closest value of VED (70.2 J/mm3 and 70.7 J/mm3) at 300 W, a coarser melt pool size and a decrease of 65% in the porosity level were found in the sample processed with higher Et. Therefore, in this paper, the authors intend to detail the previous results, isolating the role of the Et on the microstructure and defects of Al-Si10-Mg parts produced at a constant VED, and showing, consequently, that the properties of the parts can be controlled with minor modifications of the process parameters.
2. Materials and Methods
The composition of the gas-atomized powder of an average diameter equal to 40 µm is shown in Table 1. Cube samples (10 mm edge) were built along the Z axis (Figure 1) with a Renishaw AM 400 machine using Meander strategy. Scan rotation of 45 degrees was applied between consecutive layers. Moreover, contour scanning was applied to each layer, which was scanned twice.
Three samples were built for each set of process parameters. As shown in Table 2, all the samples were processed at the same power (375 W) and scan speed (2000 mm/s), but with increasing exposure time. Specifically, the exposure time is the duration time of the laser remaining on each fusion point before jumping to the next point (as a function of the set point distance) with a speed of 2000 mm/s. To better recall the samples’ process parameters during the analysis, the samples were named with S followed by t1, t2, or t3 suffixes according to the increasing exposure time of (respectively) 40, 50 and 60 μs. After processing, a stress relief treatment (300 °C for 2 h) was applied.
An optical microscope and scanning electron microscope were used for investigating the microstructure. In particular, the NIKON Ephiphot 200 OM (Nikon, Tokio, Japan) and the ZEISS EVO SEM (Zeiss, Oberkochen, Germany) equipped with a Bruker energy-dispersive X-ray spectrometer (EDX) were employed (Bruker, Billerica, MA, USA).
For the optical microscope microstructure analysis, after metallographic preparation, the longitudinal (L) and transversal (T) sections of the samples were etched using Keller etching (95 mL water, 2.5 mL HNO3, 1.5 mL HCl, 1.0 mL HF). On the L sections of the cubic specimens, the average depth and width of the melt pools were evaluated using NIS Nikon software for image analysis, supplied with an optical microscope. All the melt pools in the L sections were characterized. SEM analyses, supported by ImageJ software, were mainly focused on evaluating the number and size of the silicon particles as a function of the different process parameters and post-processing heat treatment.
The samples were also analyzed by X-ray microtomography. This technique allows for the non-destructive investigation of their internal structure, and it is useful for void and porosity analysis [24]. The computed tomographic (CT) system used was a GE Phoenix “nanotom s” present in the ENEA Research Centre laboratory at Brindisi (Italy). This instrument is equipped with a high-performance nano-focus X-ray tube (180 kV/15 W) and a tungsten transmission target. Microtomography can be used to study different materials, including geomaterials, biomaterials, polymers and metals. The latter generally require high-energy X-ray beams for sufficient transmission, and consequently only small metallic samples can be analyzed. The analysis was performed setting the acquisition parameters of the instrument as reported in Table 3. The size of the analyzed cuboid-shaped samples is shown in Table 4. The maximum achievable resolution also depends on the size of the sample; generally, the smaller the sample, the better the resolution. The tomography resolution (voxel size) is in fact the ratio between the pixel size of the CT-detector (50 µm) and the magnification set. The magnification is calculated as the ratio between the Focus–Detector Distance (FDD) and the Focus–Object Distance (FOD). Both the FDD and FOD can be varied by moving the detector or the sample holder along the optical axis direction of the X-ray tube. Due to the field of view limits, the maximum magnification to fully image the investigated samples was approximately six times, so we set FDD = 300 mm and FOD = 48 mm, resulting in a resolution of 8 μm. Figure 2 shows three orthogonal tomographic sections and the 3D virtual reconstruction related to the sample St1.
Observing the tomographic sections, the presence of small pores within the samples is evident. To identify and measure them, an automatic segmentation procedure based on Bernsen’s algorithm [25,26] and well described by F. H. Kim et al. [27] was applied. Figure 3 shows a 3D reconstruction of the specimen St1, where the pores are highlighted in red. For each pore, the volume, the equivalent diameter and the sphericity were calculated.
For a given particle, the equivalent diameter is defined as the diameter of the spherical particle of the same volume. Therefore, the equivalent diameter is given by the following formula:
whilst the sphericity represents a shape indicator expressed such as:
where V is the volume of a particle and A is its surface area. Sphericity ranges from 0 to 1 (sphere). As suggested by Kim et al. [27], only pores larger than 125 voxels in volume were used for the spherical analysis.
Once the pores had been detected, porosity was calculated as the ratio between the sum of their volumes and the total volume of the sample. In the pores volume evaluation, to avoid the pixel noise contribution, pores with a volume less than 4.09 × 10⁻⁶ mm3 (2 × 2 × 2 voxels) were excluded [28].
Vickers hardness was measured using an Affri Wiky 200JS digital instrument (Affri, Varese, Italy) employing 0.1 Kg for a holding time equal to 15 s (HV 0.1/15) [29]. Average hardness values were calculated from edge-to-edge indentation in the perpendicular direction, cutting the center of the section. The distance between indentations was equal to 100 µm on the T and L sections.
The corrosion resistance of the as-built samples was evaluated using Gamry Potentiostat 1010E (Gamry Instruments, Warminster, PA, USA) after grinding the exposed surface until 2000 grit paper. The measurements were carried out in an aqueous solution of 3.5% NaCl at room temperature, with naturally aerated, near-neutral conditions. A standard three-electrode cell configuration was used, consisting of graphite as the expanded mesh counter electrode, an Ag/AgCl reference electrode and the samples as the working electrode. All potentials were referenced to Ag/AgCl. To ensure accurate measurements, the samples were insulated using Teflon and electric connection by copper wire with soldering, covering their cut edges and back sides, leaving only a 1.0 cm2 surface area exposed to the electrolyte. The steady-state potential was determined after immersing the samples in the solution at open circuit potential (OCP) for 15 min. Subsequently, potentiodynamic polarization measurements were performed, scanning from −2 V to 0.5 V vs Ag/AgCl at a scan rate of 2 mVs−1.
3. Results and Discussion
3.1. Microstructure Characterization
The microstructure of the samples viewed by an optical microscope is shown in Figure 4, where micrographs taken from the center of the T (XY) and L (YZ) sections are shown. In particular, Figure 4a,c,e show the microstructural features of the T sections, and Figure 4b,d,f those of the longitudinal sections.
In both the sections, the boundaries of the melt pool are well highlighted by chemical etching. In the T sections, adjacent elongated tracks can be observed, sometimes interrupted by the circular zone due to the remelting of the track by laser action on the next layer. In the L section, the cup shape of the melt pool is also clearly highlighted. That near hemispherical shape gives information about the heat transfer mode, which should occur mainly by conduction and so be governed by the Rosenthal equation of the heat flow [22]. All the samples exhibit common microstructure features that characterize the boundaries of the melt pool and their inner parts. In Figure 5, the same portion of a melt pool boundary is highlighted by the red circles and has been observed at different magnifications. The darker phase is the eutectic structure surrounding the aluminum solid solution (α-Al phase), which usually remains supersaturated until room temperature, due to the fast cooling rate involved in the process. As the magnification increases (Figure 5b), the heterogeneity of the microstructure between the boundary and the inner part can be observed. Two main aspects are evident from optical analysis:
- The boundary microstructure is coarser compared to the inner part of the melting pool.
- The morphology is less elongated (more equiaxed) in the boundary compared to the inner part, where it appears mainly cellular.
According to solidification principles, the size and morphology of the solidified microstructure is related to the thermal gradient at the solidification front (G) and to the grow rate (R) of the solid [23,30]. Specifically, the solidification parameter G/R at the solid-liquid interface determines the solidification morphology, while the cooling rate (G × R) determines the size of the microstructure. The occurrence of the equiaxed morphology imposes a decrease of G/R with respect to a cellular morphology, and the microstructure becomes coarser as the cooling rate decreases [23,30]. The coarser equiaxed microstructure at the boundary of the melt pool could be explained by local overheating due to recalescence of the liquid in the remelted zone [23,30]. Recalescence can effectively cause a local reduction in the thermal gradient due to rapid local heat release [23], as well as in the cooling rate [30]. The lowered thermal gradient will promote the occurrence of equiaxed morphology, reducing the ratio between G and R. Moreover, in an alloy with high Si content, the occurrence of equiaxed microstructure at the melt pool is also promoted by the higher concentration of solute in the liquid at the solidification front. Therefore, this equiaxed zone has not been observed in Al-Si-Mg with Si content much lower than the eutectic composition [23], while it is observed in Al-Si10Mg [30], as well as in eutectic and hypereutectic Al-Si-Mg [23]. As the distance from the melt pool boundary increases and the effect of recalescence is reduced, the steepest temperature gradient favors both the cellular growth in the 100 crystallographic direction [22] and the occurrence of a finer microstructure [30]. Finally, also in the layer adjacent to the melt pool boundary, the temperature is increased by the processing and acts as a heat treatment, leading to the fragmentation of the eutectic network and the coarsening of Si particles [30].
Figure 6 shows the microstructure of the three samples close to a melting point boundary (in the red shape), analyzed by SEM. The main secondary phase (white particles) is silicon particles, as expected and verified by many previous studies [1,2,30], while the gray phase is the Al solid solution. Some black spots due to porosity can also be observed. The first observation is that, according to the microstructure analysis, the boundary region of non-cellular microstructure seems to extend as the exposure time increases. Moreover, in Figure 7, micrographs of the samples processed at the extreme exposure time (St1 and St3) close to melting pool boundaries are compared at high magnification. Larger grain size can be observed as the exposure time is increased (St3 sample). Moreover, a different distribution of the second phase particles seems to occur in the samples. Sample St1 should have a higher number of small fine particles that are also more uniformly distributed in the matrix. This last aspect can be observed also in Figure 6, despite the lower magnification.
To verify the role of the exposure time on the microstructure and therefore to validate the qualitative consideration suggested by the analysis of Figure 6 and Figure 7, the average size of the melt pool was evaluated on the L sections, as well as the average width of the track in the T sections.
The result of the analysis is shown in Table 5. Table 5 shows that at constant VED the size of the melt pool is increased, with the exposure time being slightly higher in the St3 sample. Indeed, with the increase in irradiation time, the powders are interested by a longer time in the temperature and therefore the actual heat input is increased. The increased heat input leads to a larger and deeper melt pool. As a consequence, the cooling rate is decreased, making the grain coarser, as shown by Figure 6 and Figure 7. The lower cooling rate is also responsible for a lower supersaturation and a coarser eutectic phase.
During the heat treatment at 300 °C-2 h, the metastable as-built systems move towards a state of greater equilibrium through rejection of silicon from the supersaturated matrix (leading to heterogeneous precipitation of silicon particles), and fragmentation of the continuous eutectic silicon network with subsequent spheroidization [31,32,33]. As the heat treatment time further increases, the Si particles become coarser. Finally, the Ostwald effect induces a decrease in the number of the smaller particles and an increase in size of the largest ones [32,33]. Indeed, the Ostwald ripening effect leads to further reduction of Gibbs free energy by reduction of the energy surface of the particles. The smaller particles dissolve in the matrix and the dissolved atoms increase the size of the biggest ones, leading to a state of greater equilibrium of the sample.
Comparing the St1 and St3 samples (Figure 6 and Figure 7), a higher density of small particle size in the St1 sample can be qualitatively observed. That observation was confirmed by Image J (version 1.54g) analysis of the particle’s density (Table 6) and size distributions (Figure 8). The particles density is reduced from 11.1 to 8.6 (N/ µm2) from the St1 to the St3 sample (Table 6), which is characterized by a lower occurrence of smaller particles (Feret’s diameter lower than 0.6 µm in Figure 8) and higher number of the coarsest ones.
The higher density (Table 6) and smaller size of the Si particles (Figure 8) in the St1 sample could be due to the finer as-built microstructure and the higher supersaturation induced by the lower exposure time. Upon the post-processing heat treatment, the higher supersaturation favors Si interdiffusion through the aluminum matrix that promotes the breaking up of the eutectic phases, leading to a small, distributed fragment. Moreover, as discussed previously, the average thickness of the eutectic phase is also reduced in the St1 sample, and therefore the fragmentation and spheroidization process is faster [34].
Bigger particles (Feret’s diameter higher than 0.6 µm) occur for both the samples at the melt pool boundaries (Figure 6 and Figure 7) due to the overall coarsening of those zones induced by the building process [23,30,35,36]. But the higher exposure time leads to a more effective coarsening at the melt pool boundary of the St3 sample and so, upon the 300 °C-2 h heat treatment, the Si particles remain coarser for that sample.
Moreover, the Ostwald ripening effect (which means more elongated and widely spaced particles) [34,37] is much more evident close to melt pool boundaries (Figure 6 and Figure 7), because the Si phase starts to be fragmented already during the building process [30,35,36], and so, with the post-processing heat treatment, the eutectic evolution reaches completion with the dissolution of the smaller particles and the growth of the bigger ones. The completion of the eutectic evolution by Ostwald ripening could be also favored in the St3 sample by the higher heat input during the building process. In any case, further study is required to clarify this last aspect.
3.2. Porosity and Hardness
The results of the X-ray microtomography analysis, including the value of porosity for each specimen, are reported in Table 7. In all the observed samples, the voids are characterized by a spherical shape (the average sphericity is around 0.9) and by an equivalent mean diameter in the range of 35–39 µm, being the minimum for the St3 sample. The porosity measured for sample St3 is 0.18%, while for the samples St1 and St2 it is around 0.37% and 0.33%, respectively. Therefore, as the efficiency of the heat increases due to the increase in the exposure time, the number per unit volume, the size and therefore the average volume of the pores are also decreased, while the exposure time does not significantly affect the morphology of the porosity that is mainly spherical. The accuracy of pore analysis depends on several factors: the signal-to-noise ratio of the acquired radiographs, the number of projections, the quality of the reconstructed tomographic sections and above all the segmentation algorithm used. Note, however, that although the absolute number of pores detected may depend on the segmentation algorithm, the relative variations from one sample to another are essentially independent of the choice of algorithm. Therefore, the identified trend has a general validity independent of the segmentation method used.
Considering the distribution of the equivalent diameter of the samples (Figure 9), it is observable that the pores occurring in the highest number are also characterized by the smallest equivalent diameter (approximately lower than 35/40 µm). For the bigger pores, the occurrence decreases with the equivalent diameter, but more sharply in the case of St3. Therefore, the effect of the highest exposure time is most evident in the reduction of the number of larger pores, while it is not significant for pores of equivalent diameter lower than 35/40 µm.
Furthermore, the local variation of the porosity along the X, Y and Z directions was studied (Figure 10). The graphs were obtained by measuring the level of porosity in each individual slice, like a virtual sectioning of the sample with 8 μm thick slices along the three orthogonal directions. The graphs show that the pores are uniformly distributed inside the volume of the specimens, except for the regions adjacent to the lateral faces, where a greater presence of defects was revealed along the X and Y axes. Along the build direction (Z), each slice receives the average value of a different XY plane and so the porosity value fluctuates around the average value.
In Figure 11, the edges of the XY surface of St1, St2 and St3 (without chemical etching) have been reconstructed with optical micrographs to provide evidence of the greater amount of defectiveness at the edge with respect to the porosity amount, close to a half of the X edge and the Y edge in the inner part of the section.
The increase in the porosity close to the edges may be due to the transition from conduction-mode to keyhole-mode induced by the process parameters of the contour [24], but also to the short time between the ending and starting points of the laser scan, which causes a local overheating, creating keyhole-mode melt pools [24].
The microhardness values are similar for all the investigated samples, as shown in Table 8. The coarser microstructure of the St3 sample should lead to a lower hardness with respect to the St1 and St3 samples, but the St3 sample is also characterized by the lowest amount of porosity, which therefore counterbalances the less hardening microstructure.
3.3. Corrosion Behavior
In Table 9 is shown the open circuit potential (OCP) of the samples. The corresponding potentiodynamic polarization curves and the optical micrographs of the corroded surfaces are shown in Figure 12 and Figure 13. The analysis of the potentiodynamic curves indicates that the corrosion current (ICorr) decreases at the highest exposure time, improving the sample corrosion resistance. In particular, the ICorr values are closer for the St1 and St2 samples, while decreasing for the St3 sample.
The analysis of the OCP shows that the samples are characterized by very proximate values. Those similar values of OCP highlight similar features of the native oxide layers on all samples [38,39]. In any case, the less noble OCP value (more negative) was found for the St1 and St2 samples, indicating a slightly lower electrochemical stability and higher activity of its surface. This could possibly be due to a less uniform microstructure and compositional inhomogeneity between the core and the boundaries of the melting pool or to a higher volume of porosity [39,40,41].
According to the previous analysis of the samples, it has been shown that a finer microstructure, together with smaller size and more uniform distribution of Si particles, was found in the St1 and St2 samples, even if associated with a higher porosity level. Therefore, the slightly less noble OCP values for those samples seem to be much more affected by the voids amount with respect to the microstructure and silicon particles scale. The same phenomenon could be also responsible for the higher ICorr of the St1 and St2 samples with respect to St3, as shown in Figure 12, due to the detrimental effects of the porosity on the corrosion behavior [39,40,41,42,43,44].
In fact, according to the literature [37,42,44], the corrosion rate of the aluminum alloys should improve with decreasing grain size due to the ability of high-grain boundary density surfaces to passivate more readily. Moreover, as shown by [40,42], coarser Si precipitates result in a higher potential difference between the Si and the Al matrix, favoring the corrosion process.
However, St1 and St2 show higher values of corrosion current with respect to the St3 sample. Therefore, the higher amount of porosity in the finer microstructure samples (St1 and St2) overcomes the positive effect of the microstructure on corrosion behavior, leading to poor corrosion resistance with respect to St3. Indeed, pores can be considered as pits already initiated and ready to grow [43]. The small amount of electrolyte inside the pores volume becomes enriched by Al positive ions. Those ions react with chloride ions within such cavities, building up more severe electrolytic conditions and so favoring the corrosion process [39,41,42,43,44]. Because the samples with the finer microstructure (St1 and St2) exhibit a porosity percentage that is double (St1) or almost double (St2) with respect to St3, the small decrease in corrosion resistance can be related to the voids occurrence [39,41,42,43,44]. Evidence of the results shown in Figure 12 is supplied in Figure 13a–c, where optical micrographs of the exposed surfaces after potentiodynamic testing are shown. The most corroded samples are indeed St1 and St2, confirming the role of porosity in corrosion behavior.
4. Conclusions
In this study, the authors have investigated the effect of the exposure time on Al-Si10-Mg powder processed by Selective Laser Melting at the same laser power (375 W), speed (2000 mm/s) and scanning strategy. The main conclusions are summarized as follows:
- The melt pool size increases with exposure time. Specifically, at the highest exposure time the melt pool showed an increase of 19% in width and 48% in depth with respect to the lowest exposure time.
- The number, the size and therefore the average volume of the voids decrease with increasing exposure time. Particularly, the volume percentage of the voids decreased by 50% at the highest exposure time with respect to the lowest exposure time.
- Due to the opposite effect of exposure time on voids occurrence and microstructure scale, the hardness values do not change with exposure time.
- After the stress relief heat treatment (300 °C-2 h), the lowest density and coarsest size of silicon particles have been found in the sample processed at the highest exposure time.
- The corrosion resistance increases with exposure time, despite the coarser microstructure, showing that corrosion behavior in the analyzed samples is much more sensitive to the voids occurrence than to the microstructural features.
Author Contributions
Conceptualization, P.L., G.R., T.P. and A.D.P.; formal analysis, P.L.; investigation, P.L., G.R., F.D.P. and N.S.; data curation, P.L.; writing—original draft preparation, P.L.; writing—review and editing, all the authors; visualization, P.L.; supervision, P.L.; validation, P.L. All authors have read and agreed to the published version of the manuscript.
Funding
This work has been supported by Ministry of Economic Development, Bando Horizon 2020—PON 2014/2020, Innovative Solutions for the quality and sustainability of ADDitive manufacturing processes—SIADD project.
Data Availability Statement
The data presented in this study are available in the article.
Acknowledgments
The authors thank very much the HB-Technology company of Taranto (Italy) for its support.
Conflicts of Interest
The authors declare no conflicts of interest.
References
- Polmear, I.J. Light Alloys-Metallurgy of the Light Metals, 3rd ed.; Arnold: London, UK, 1995; pp. 169–180. [Google Scholar]
- Smith, W.F. Structure and Properties of Engineering Alloys, 2nd ed.; McGraw-Hill: London, UK, 1993; pp. 218–223. [Google Scholar]
- Aboulkhair, N.T.; Simonelli, M.; Parry, L.; Ashcroft, I.; Tuck, C. 3D printing of Aluminium alloys: Additive Manufacturing of Aluminium alloys using selective laser melting. Prog. Mater. Sci. 2019, 106, 100578. [Google Scholar] [CrossRef]
- Zhang, J.; Song, B.; Wei, Q.; Bourell, D.; Shi, Y. A review of selective laser melting of aluminum alloys: Processing, microstructure, property and developing trends. J. Mater. Sci. Technol. 2019, 35, 270–284. [Google Scholar] [CrossRef]
- Maa, H.Y.; Wang, J.C.; Qin, P.; Liu, Y.J.; Chen, L.Y.; Wang, L.Q.; Zhang, L.C. Advances in additively manufactured titanium alloys by powder bed fusion and directed energy deposition: Microstructure, defects, and mechanical behavior. J. Mater. Sci. Technol. 2024, 183, 32–62. [Google Scholar] [CrossRef]
- Pan, S.H.; Yao, G.C.; Cui, Y.N.; Meng, F.-S.; Luo, C.; Zheng, T.-Q.; Singh, G. Additive manufacturing of tungsten, tungsten-based alloys, and tungsten matrix composites. Tungsten 2023, 5, 1–31. [Google Scholar] [CrossRef]
- Wang, J.; Zhu, R.; Liu, Y.; Zhang, L. Understanding melt pool characteristics in laser powder bed fusion: An overview of single- and multi-track melt pools for process optimization. Adv. Powder Mater. 2023, 2, 100137. [Google Scholar] [CrossRef]
- Aboulkhair, N.T.; Maskery, I.; Tuck, C.; Ashcroft, I.; Everitt, N.M. On the formation of AlSi10mg single tracks and layers in selective laser melting: Microstructure and nano-mechanical properties. J. Mater. Process. Technol. 2016, 230, 88–98. [Google Scholar] [CrossRef]
- Yadroitsev, I.; Krakhmalev, I.P.; Yadroitsava, S.J.; Smurov, I. Energy input effect on morphology and microstructure of selective laser melting single track from metallic powder. J. Mater. Process. Technol. 2013, 213, 606–613. [Google Scholar] [CrossRef]
- Lam, L.P.; Zhang, D.Q.; Liu, Z.H.; Chua, C.K. Phase analysis and microstructure characterisation of AlSi10Mg parts produced by selective laser melting. Virtual Phys. Prototyp. 2015, 10, 207–215. [Google Scholar] [CrossRef]
- Liu, Y.J.; Liu, Z.; Jiang, Y.; Wang, G.W.; Yang, Y.; Zhang, L.C. Gradient in microstructure and mechanical property of selective laser melted AlSi10Mg. J. Alloys Compd. 2018, 735, 1414–1421. [Google Scholar] [CrossRef]
- Leo, P.; Del Prete, A.; Primo, T.; Nacucchi, M. Al-Si10-Mg Manufactured by Selective Laser Melting: Microstructure Sensitivity to Close Values of the Heat Input. Metals 2023, 13, 590. [Google Scholar] [CrossRef]
- Maskery, I.; Aboulkhair, N.T.; Corfield, M.R.; Tuck, C.; Clare, A.T.; Leach, R.K.; Wildman, R.D.; Ashcroft, I.A.; Hague, R.J.M. Quantification and characterisation of porosity in selectively laser melted Al–Si10–Mg using X-ray computed tomography. Mater. Charact. 2016, 111, 193–204. [Google Scholar] [CrossRef]
- Patel, D.; Pandey, A. Powder bed fusion of aluminium alloys: A review of experimental explorations—Microstructure, mechanical properties, and recent advances. Mater. Today Proc. 2023, 82, 168–177. [Google Scholar] [CrossRef]
- Miller, K. The short crack problem. Fatigue Fract. Eng. Mater. Struct. 1982, 5, 223–232. [Google Scholar] [CrossRef]
- Schijve, J. Fatigue of Structures and Materials, 2nd ed.; Springer: Berlin/Heidelberg, Germany, 2009; pp. 13–21. [Google Scholar]
- Takahashi, K.; Murakami, Y. Quantitative evaluation of effect of surface roughness on fatigue strength. In Engineering against Fatigue; Benyon., J., Brown, M., Smith, R., Lindley, T., Tomkins, B., Eds.; Balkema Publishers: London, UK, 1999; pp. 693–703. [Google Scholar]
- Suraratchai, M.; Limido, J.; Mabru, C.; Chieragatti, R. Modelling the influence of machined surface roughness on the fatigue life of aluminium alloy. Int. J. Fatigue 2008, 30, 2119–2126. [Google Scholar] [CrossRef]
- Leon, A.; Aghion, E. Effect of surface roughness on corrosion performance of AlSi10Mg alloy produced by Selective Laser Melting (SLM). Mater. Charact. 2017, 131, 188–194. [Google Scholar] [CrossRef]
- Aboulkhair, N.T.; Everitt, N.M.; Ashcroft, I.; Tuck, C. Reducing porosity in AlSi10Mg parts processed by selective laser melting. Addit. Manuf. 2014, 1, 77–86. [Google Scholar] [CrossRef]
- Haboudou, A.; Peyre, P.; Vannes, A.B.; Peix, G. Reduction of porosity content generated during Nd: YAG laser welding of A356 and AA5083 aluminium alloys. Mater. Sci. Eng. A 2003, 363, 40–52. [Google Scholar] [CrossRef]
- Messler, R.W., Jr. Principles of Welding: Processes, Physics, Chemistry, and Metallurgy; Wiley: New York, NY, USA, 1999. [Google Scholar]
- Roehling, J.D.; Coughlin, D.R.; Gibbs, J.W.; Baldwin, J.K.; Mertens, J.C.E.; Campbell, G.H.; Clarke, A.J.; McKeown, J.T. Rapid solidification growth mode transitions in Al-Si alloys by dynamic transmission electron microscopy. Acta Mater. 2017, 131, 22–30. [Google Scholar] [CrossRef]
- Du Plessis, A.; Yadroitsev, I.; Yadroitsava, I.; Le Roux, S.G. X-Ray microcomputed tomography in additive manufacturing: A review of the current technology and applications. 3D Print. Addit. Manuf. 2018, 5, 227–247. [Google Scholar] [CrossRef]
- Bernsen, J. Dynamic thresholding of grey-level images. In Proceedings of the Eighth International Conference on Pattern Recognition, Paris, France, 27–31 October 1986; pp. 1251–1255. [Google Scholar]
- Sankur, B. Survey over image thresholding techniques and quantitative performance evaluation. J. Electron. Imaging 2004, 13, 146. [Google Scholar] [CrossRef]
- Kim, F.H.; Moylan, S.P.; Garboczi, E.J.; Slotwinski, J.A. Investigation of pore structure in cobalt chrome additively manufactured parts using X-ray computed tomography and three-dimensional image analysis. Addit. Manuf. 2017, 17, 23–38. [Google Scholar] [CrossRef] [PubMed]
- Du Plessis, A.; Sperling, P.; Beerlink, A.; Tshabalala, L.; Hoosain, S.; Mathe, N.; le Roux, S.G. Standard method for microCT-based additive manufacturing quality control 1: Porosity analysis. MethodsX 2018, 5, 1336–1345. [Google Scholar] [CrossRef] [PubMed]
- ISO 6507-1; Metallic Materials—Vickers Hardness Test—Part 1: Test Method. ISO: Geneva, Switzerland, 2018.
- Liu, X.; Zhao, C.; Zhou, X.; Shena, Z.; Liu, W. Microstructure of selective laser melted AlSi10Mg alloy. Mater. Des. 2019, 168, 107677. [Google Scholar] [CrossRef]
- Fiocchi, J.; Tuissi, A.; Bassani, P.; Biffi, C.A. Low temperature annealing dedicated to AlSi10Mg selective laser melting products. J. Alloys Compd. 2017, 217, 3402–3409. [Google Scholar] [CrossRef]
- Wei, L.; Shuai, L.; Jie, L. Effect of heat treatment on AlSi10Mg alloy fabricated by selective laser melting: Microstructure evolution, mechanical properties and fracture mechanism. Mater. Sci. Eng. A 2016, 663, 116–125. [Google Scholar]
- Li, X.P.; Wang, X.J.; Saunders, M. A selective laser melting and solution heat treatment refined Al–12Si alloy with a controllable ultrafine eutectic microstructure and 25% tensile ductility. Acta Mater. 2015, 95, 74–82. [Google Scholar] [CrossRef]
- Ogris, E.; Wahlen, A.; Luchinger, H.; Uggowitzer, P.J. On the silicon spheroidization in Al–Si alloys. J. Light Met. 2002, 2, 263–269. [Google Scholar] [CrossRef]
- Patakham, U.; Palasay, A.; Wila, P.; Tongsri, R. MPB characteristics and Si morphologies on mechanical properties and fracture behavior of SLM AlSi10Mg. Mater. Sci. Eng. A 2021, 821, 141602. [Google Scholar] [CrossRef]
- Wanga, L.Z.; Wanga, S.; Hongb, X. Pulsed SLM-manufactured AlSi10Mg alloy: Mechanical properties and microstructural effects of designed laser energy densities. J. Manuf. Process. 2018, 35, 492–499. [Google Scholar] [CrossRef]
- Ibrahim, M.; Abdelaziz, M.; Samuel, A.; Doty, H.; Samuel, F. Spheroidization and Coarsening of Eutectic Si Particles in Al-Si-Based Alloys. Adv. Mater. Sci. Eng. 2021, 2021, 6678280. [Google Scholar] [CrossRef]
- Rafieazad, M.; Mohammadi, M.; Gerlich, A.; Nasiri, A. Enhancing the corrosion properties of additively manufactured AlSi10Mg using friction stir processing. Corros. Sci. 2021, 178, 109073. [Google Scholar] [CrossRef]
- Rafieazad, M.; Chatterjee, A.; Nasiri, A.M. Effects of Recycled Powder on Solidification Defects, Microstructure, and Corrosion Properties of DMLS Fabricated AlSi10Mg. J. Miner. Met. Mater. Soc. 2019, 71, 3241–3252. [Google Scholar] [CrossRef]
- Rafieazad, M.; Mohammad, M.; Nasiri, A.M. On microstructure and early stage corrosion performance of heat treated direct metal laser sintered AlSi10Mg. Addit. Manuf. 2019, 28, 107–119. [Google Scholar] [CrossRef]
- Lu, W.Q.; Liu, Y.J.; Wu, X.; Liu, X.C.; Wang, J.C. Corrosion and passivation behavior of Ti-6Al-4V surfaces treated with high-energy pulsed laser: A comparative study of cast and 3D-printed specimens in a NaCl solution. Surf. Coat. Technol. 2023, 470, 129849. [Google Scholar] [CrossRef]
- Gatto, A.; Cappelletti, C.; Defanti, S.; Fabbri, F. The Corrosion Behaviour of Additively Manufactured AlSi10Mg Parts Compared to Traditional Al Alloys. Metals 2023, 13, 913. [Google Scholar] [CrossRef]
- Örnek, C. Additive manufacturing—A general corrosion perspective. Corros. Eng. Sci. 2018, 537, 531–535. [Google Scholar] [CrossRef]
- Leon, A.; Shirizly, A.; Aghion, E. Corrosion Behavior of AlSi10Mg Alloy Produced by Additive Manufacturing (AM) vs. Its Counterpart Gravity Cast Alloy. Metals 2016, 6, 148. [Google Scholar] [CrossRef]
Figure 1.
Building direction of the Al-Si10-Mg cube sample (Z).
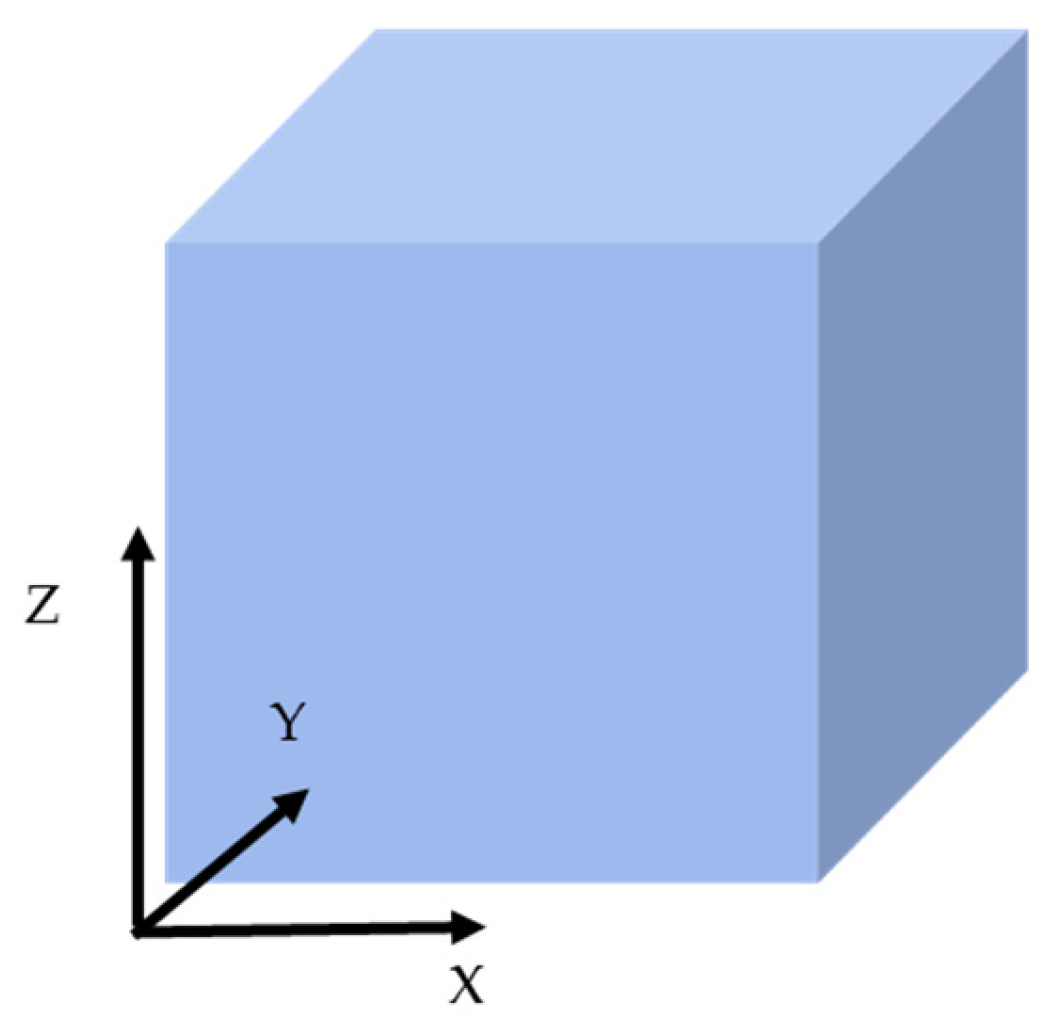
Figure 2.
Sample St1; 3D virtual reconstruction (a) and XY (b), XZ (c) and YZ (d) sections.
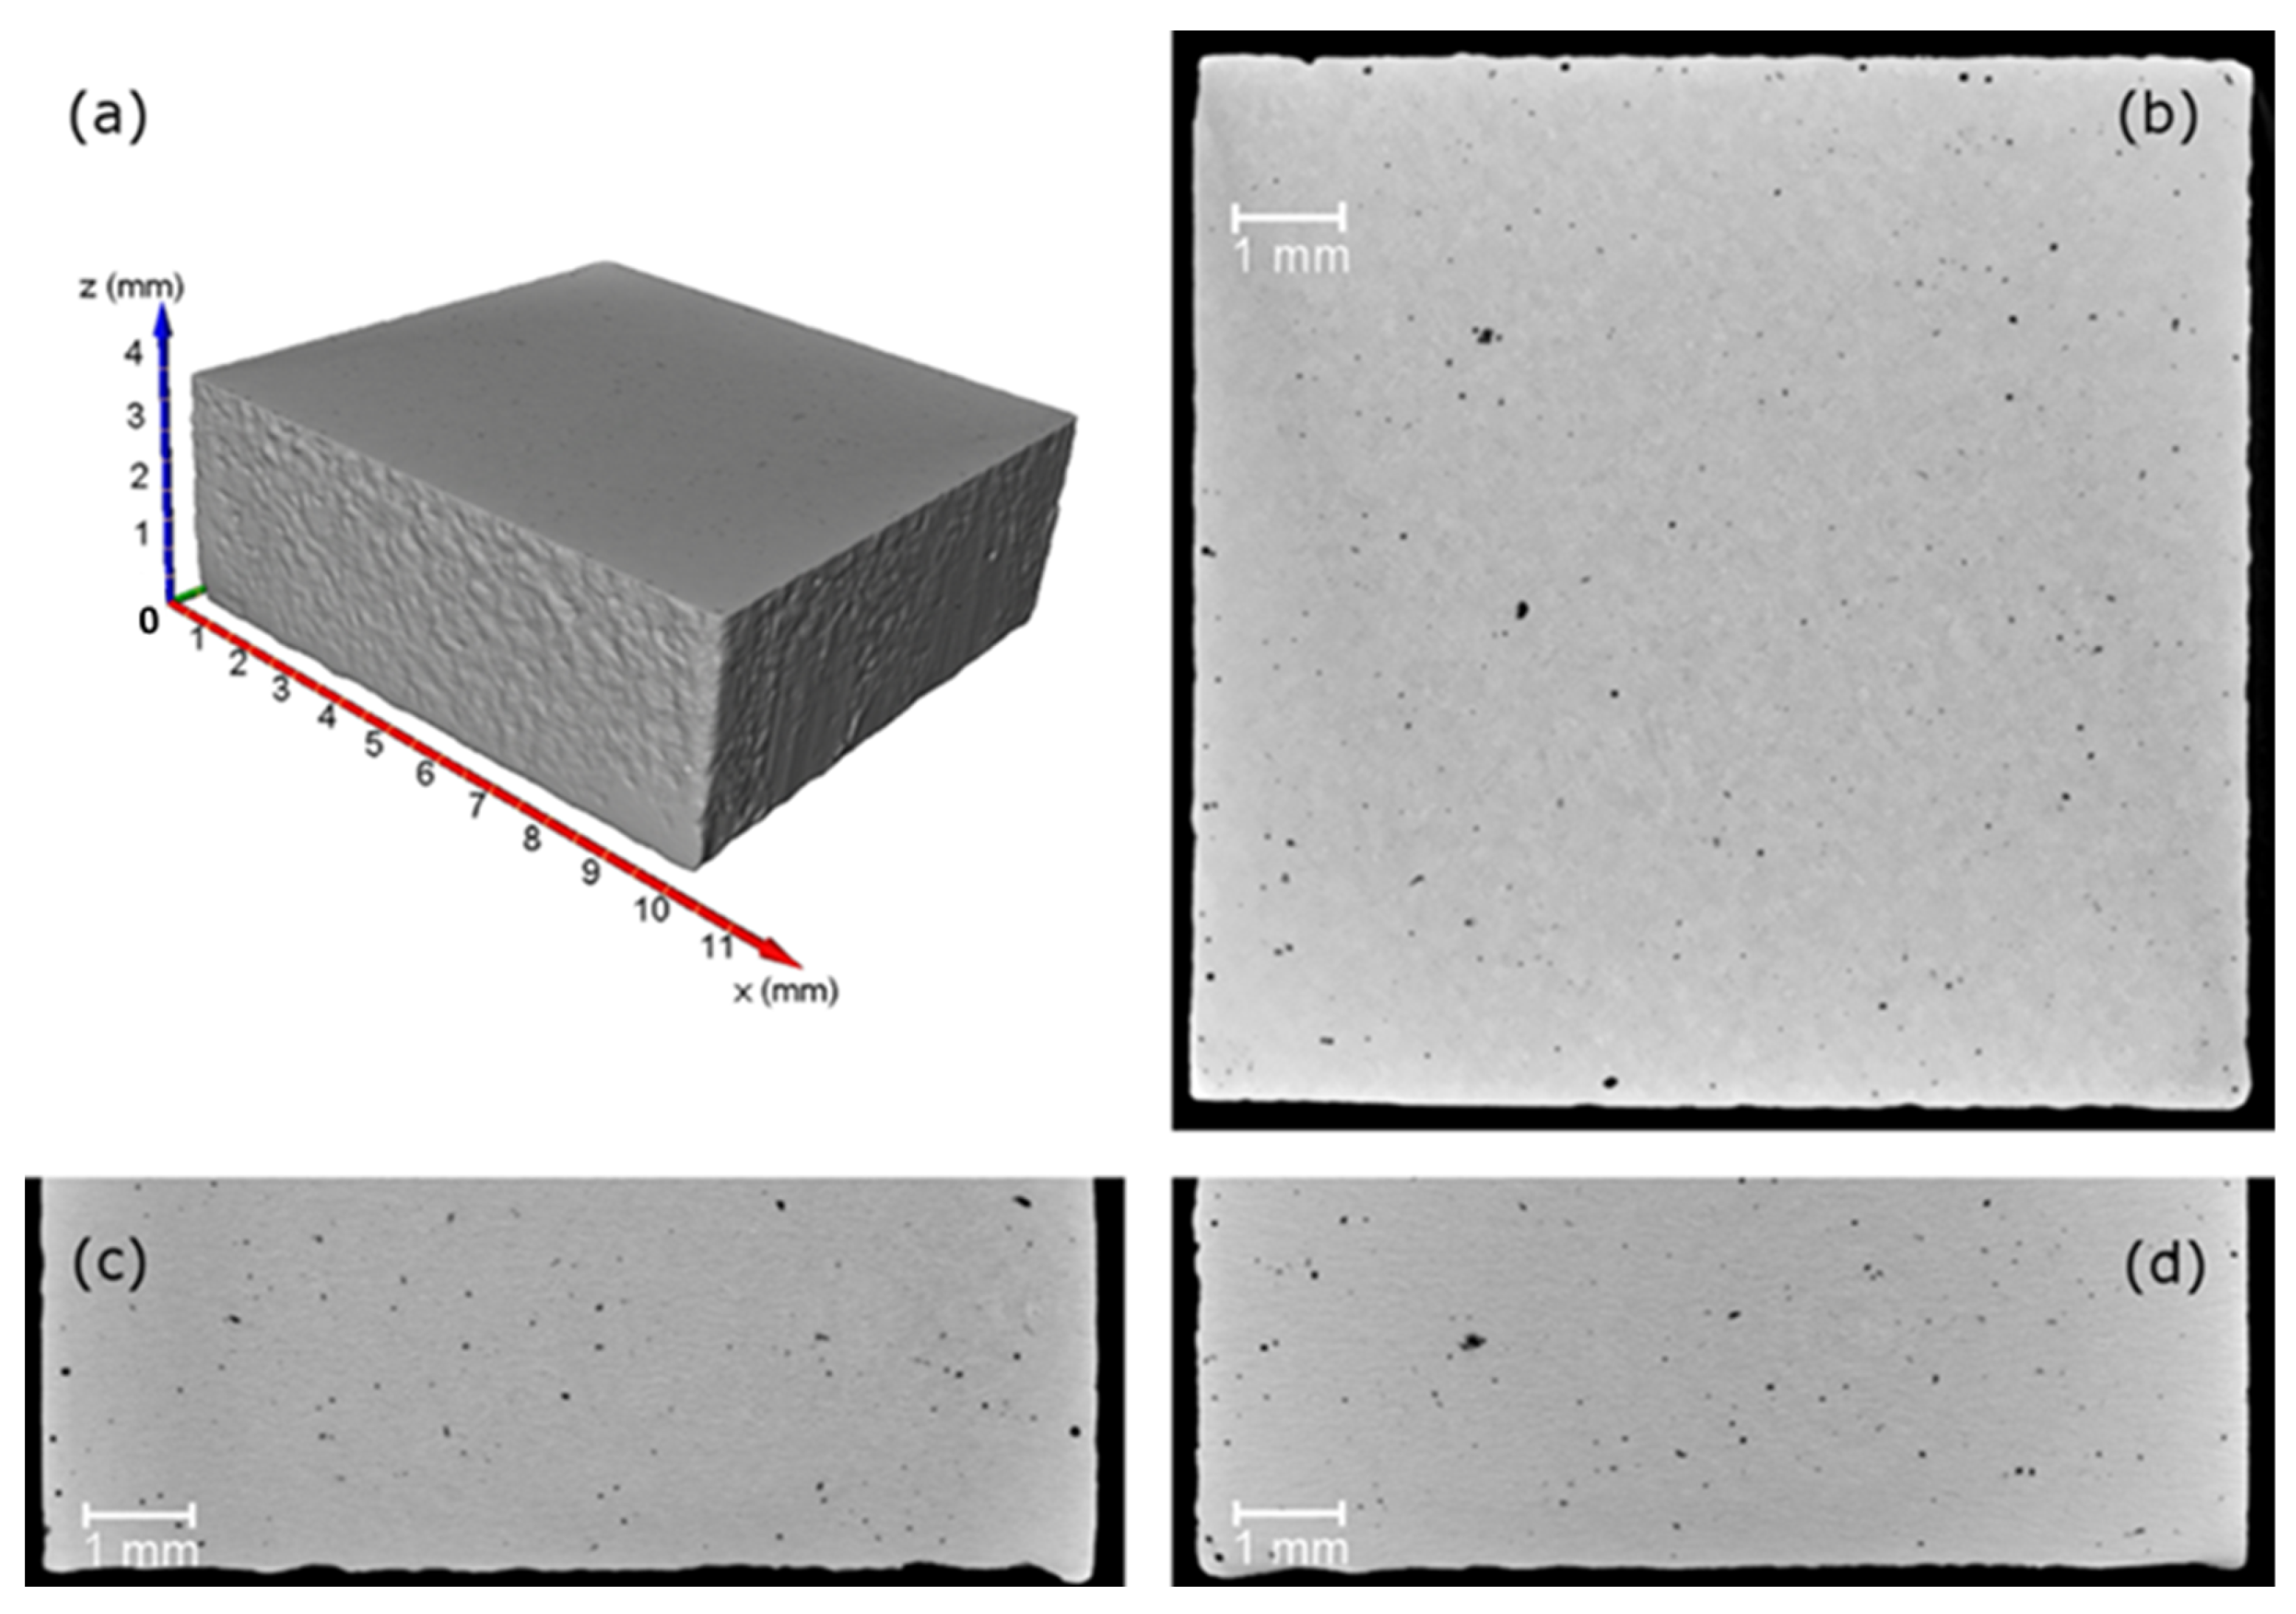
Figure 3.
3D transparent view of the porosity analysis for St1 sample.
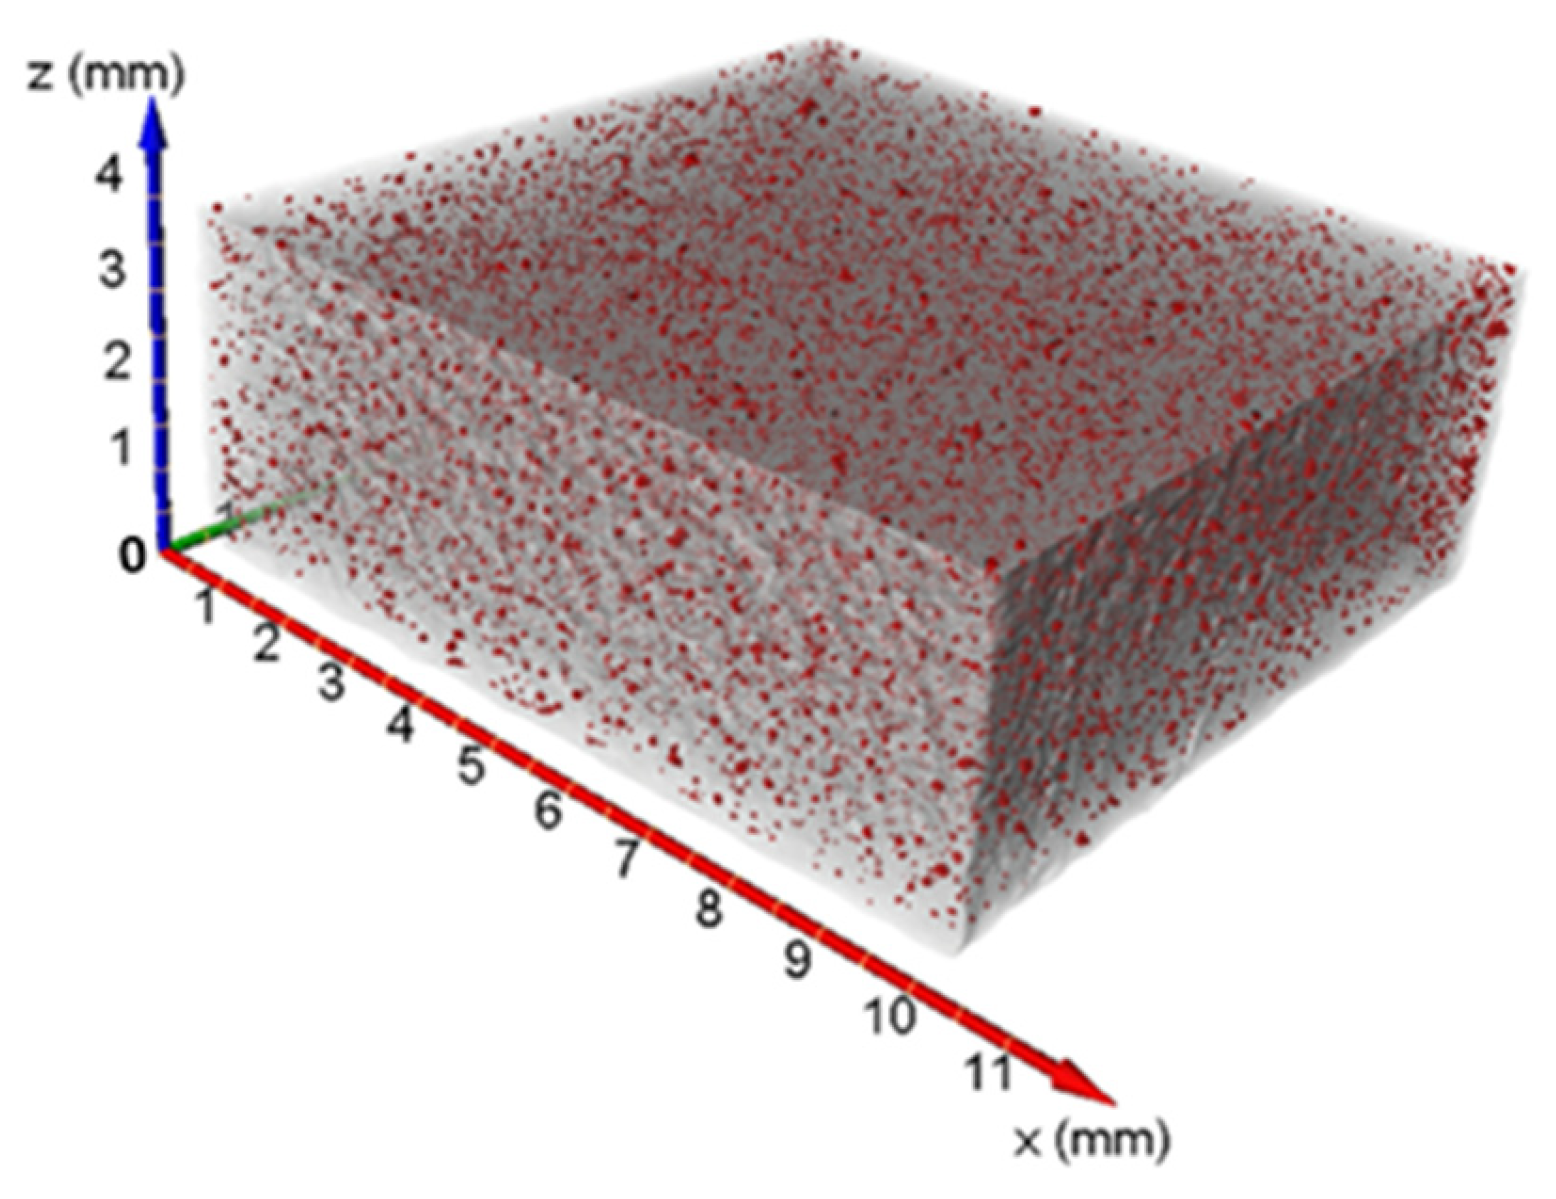
Figure 4.
Optical microscope microstructure for St1 (a,b), St2 (c,d) and St3 (e,f) as results in the T (a,c,e) and L (b,d,f) sections.
Figure 4.
Optical microscope microstructure for St1 (a,b), St2 (c,d) and St3 (e,f) as results in the T (a,c,e) and L (b,d,f) sections.
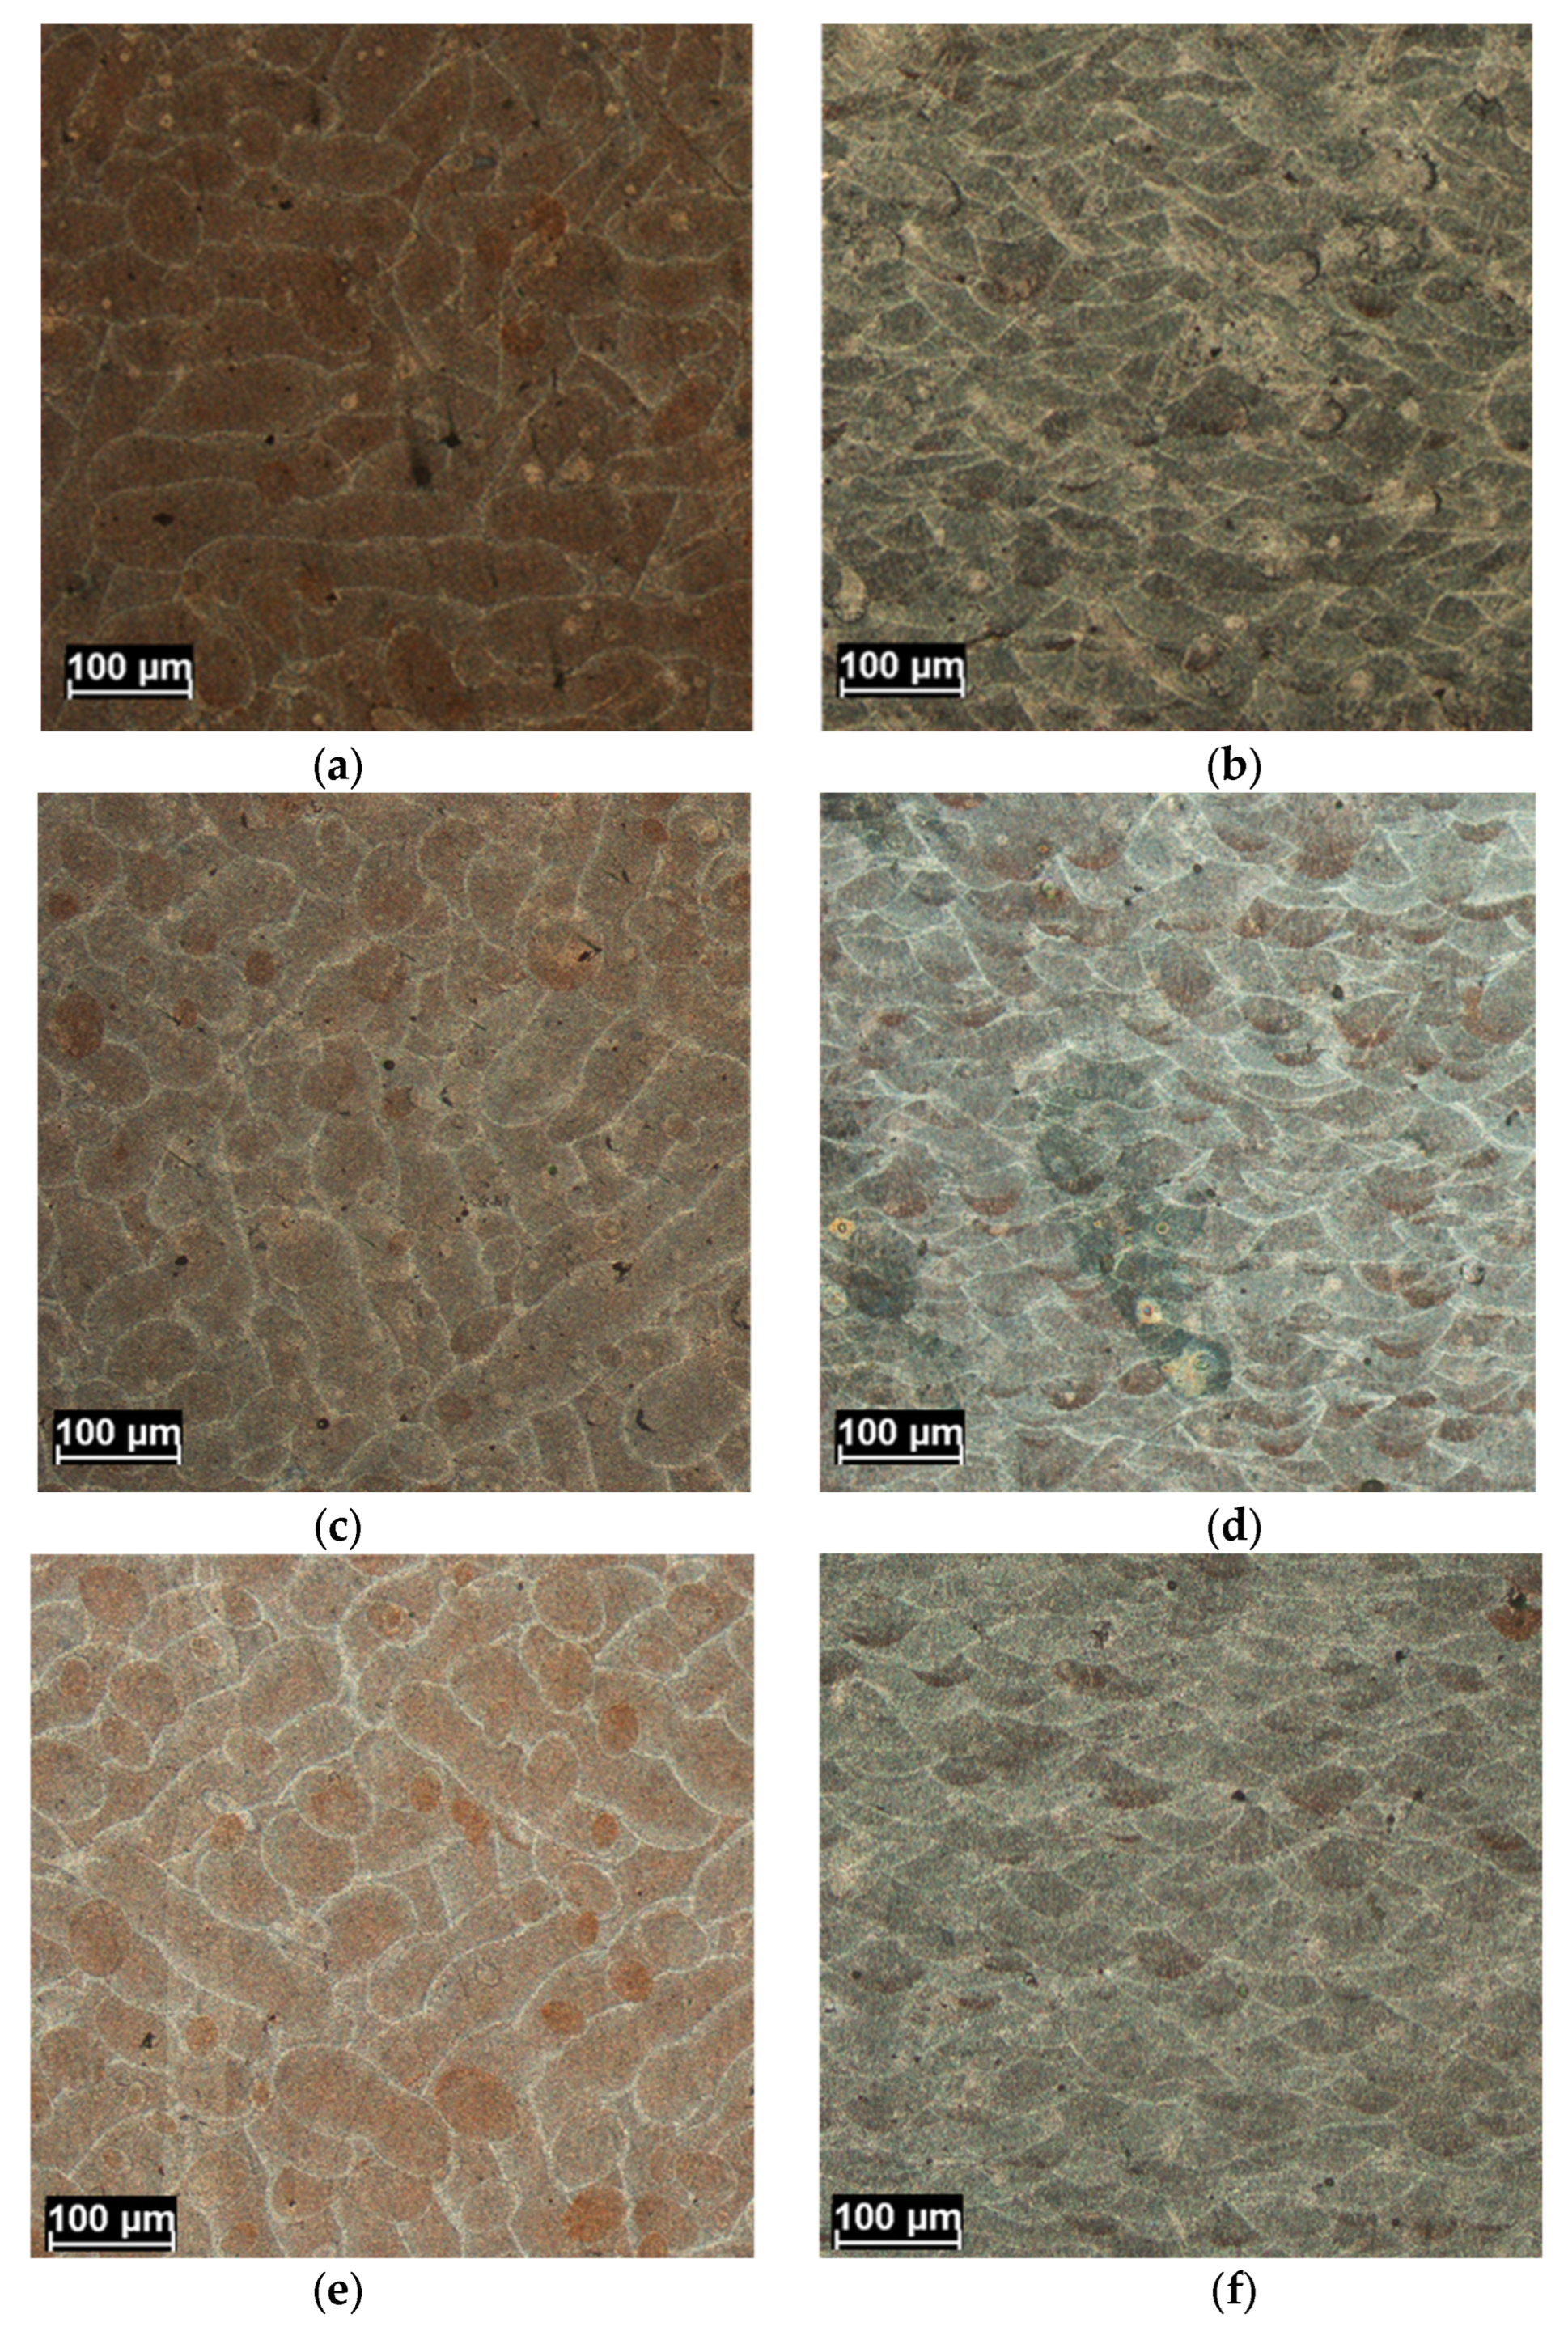
Figure 5.
Solidification morphology at the same boundary (red circle) and inside the melt pool evaluated at increasing magnification: (a) (500×), (b) (1000×).
Figure 5.
Solidification morphology at the same boundary (red circle) and inside the melt pool evaluated at increasing magnification: (a) (500×), (b) (1000×).
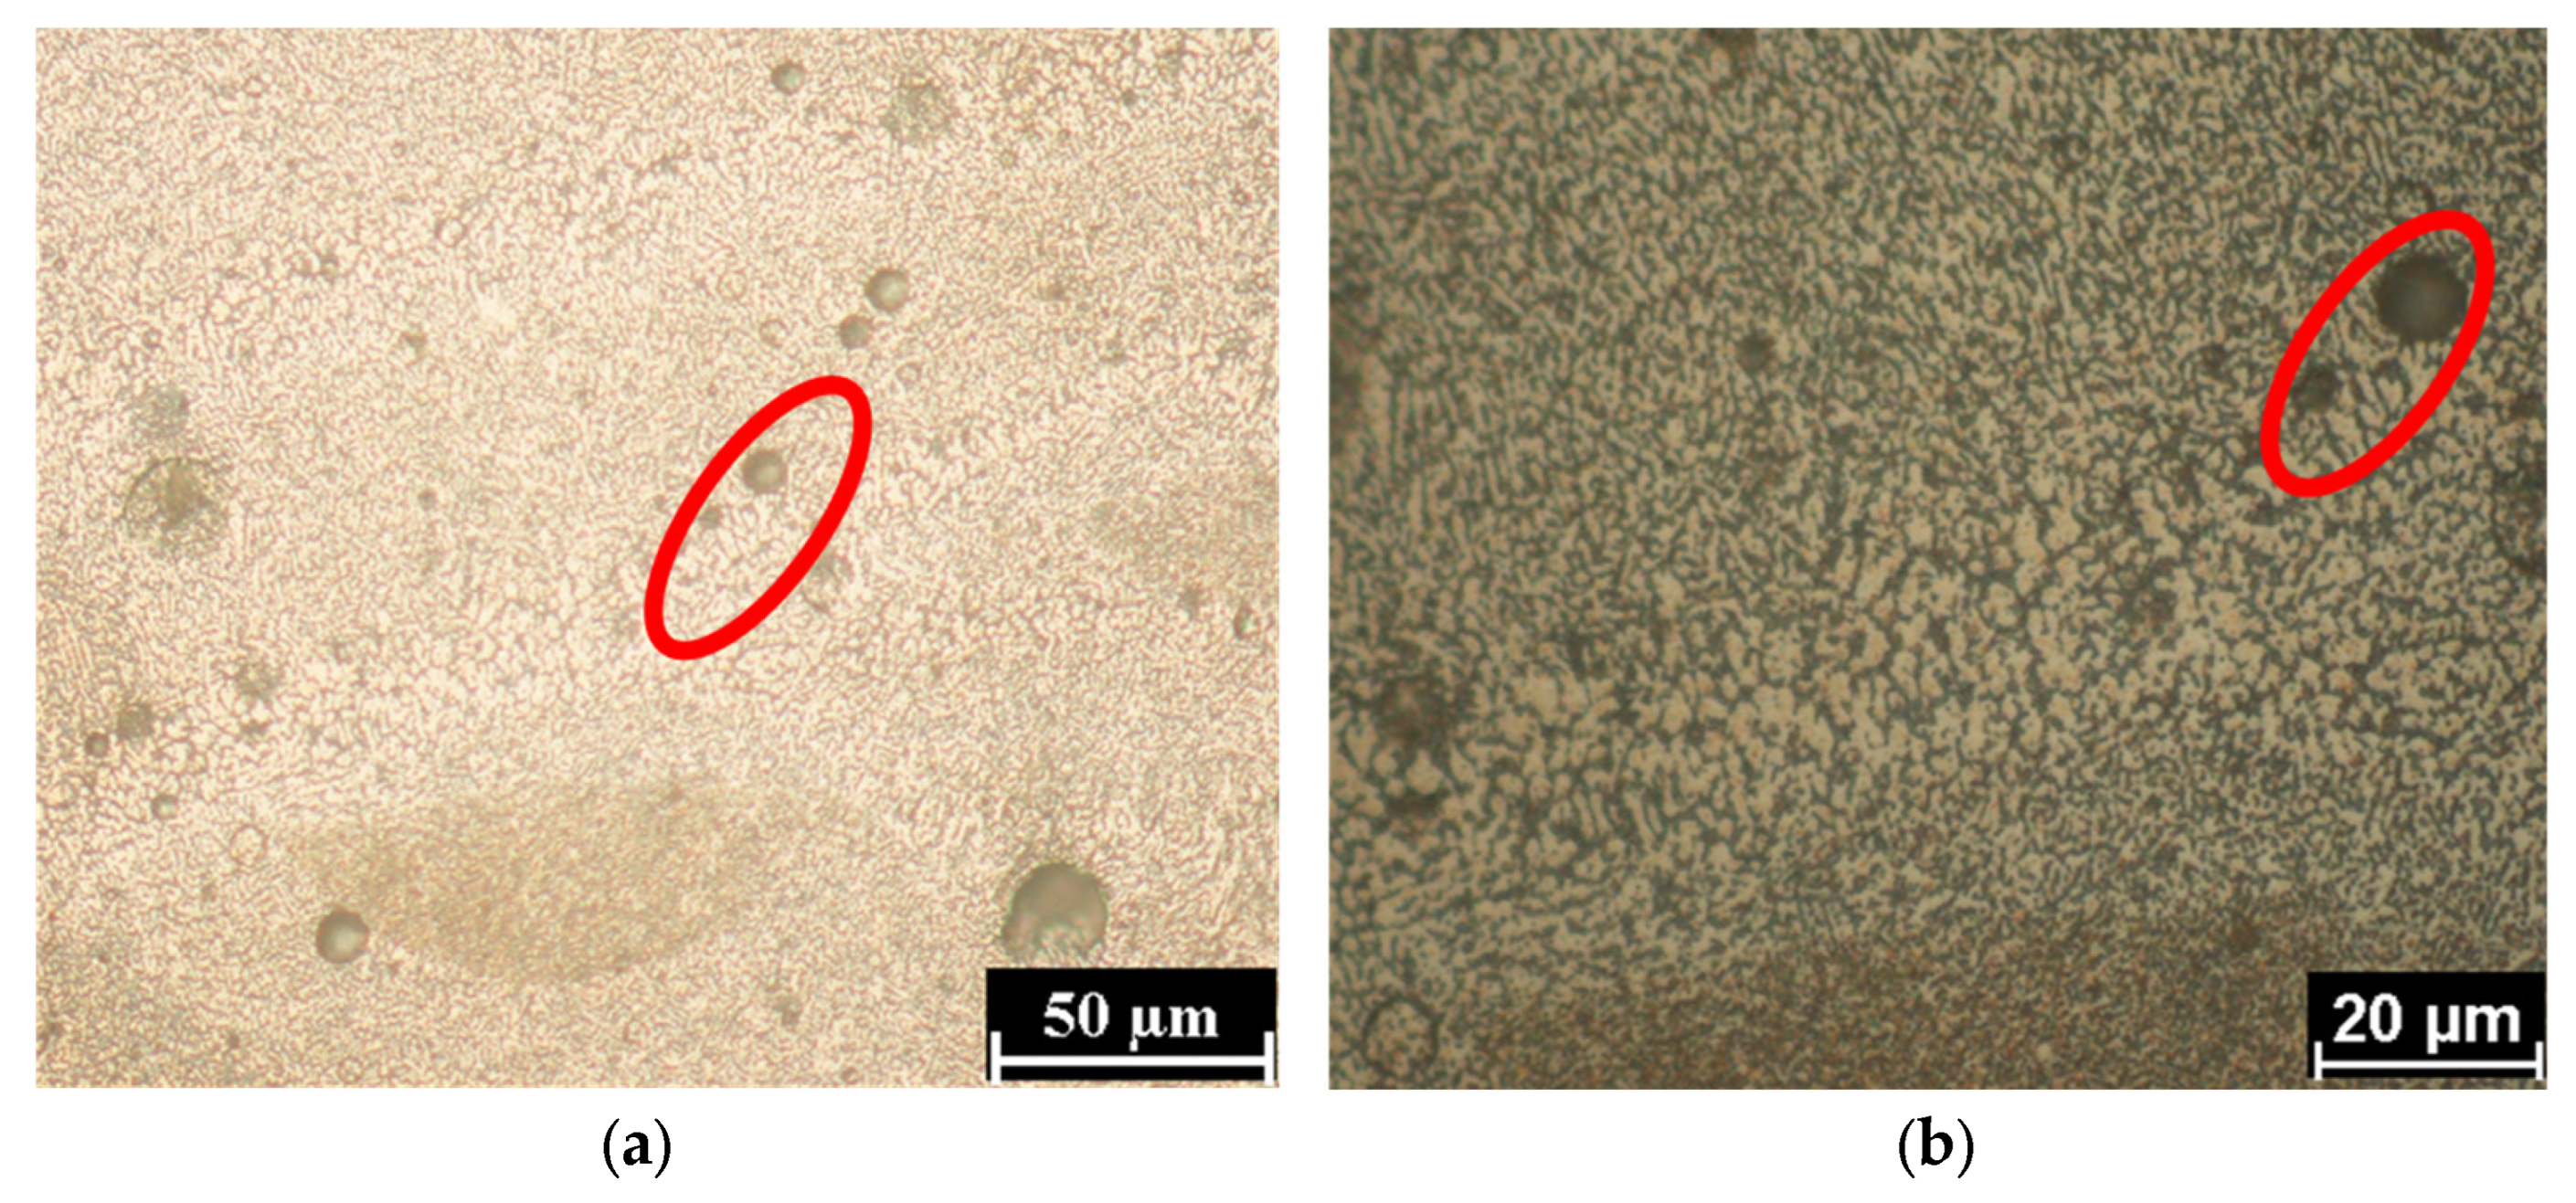
Figure 6.
SEM micrographs of St1 (a), St2 (b) and St3 (c). The red shape encloses a melt pool boundary.
Figure 6.
SEM micrographs of St1 (a), St2 (b) and St3 (c). The red shape encloses a melt pool boundary.
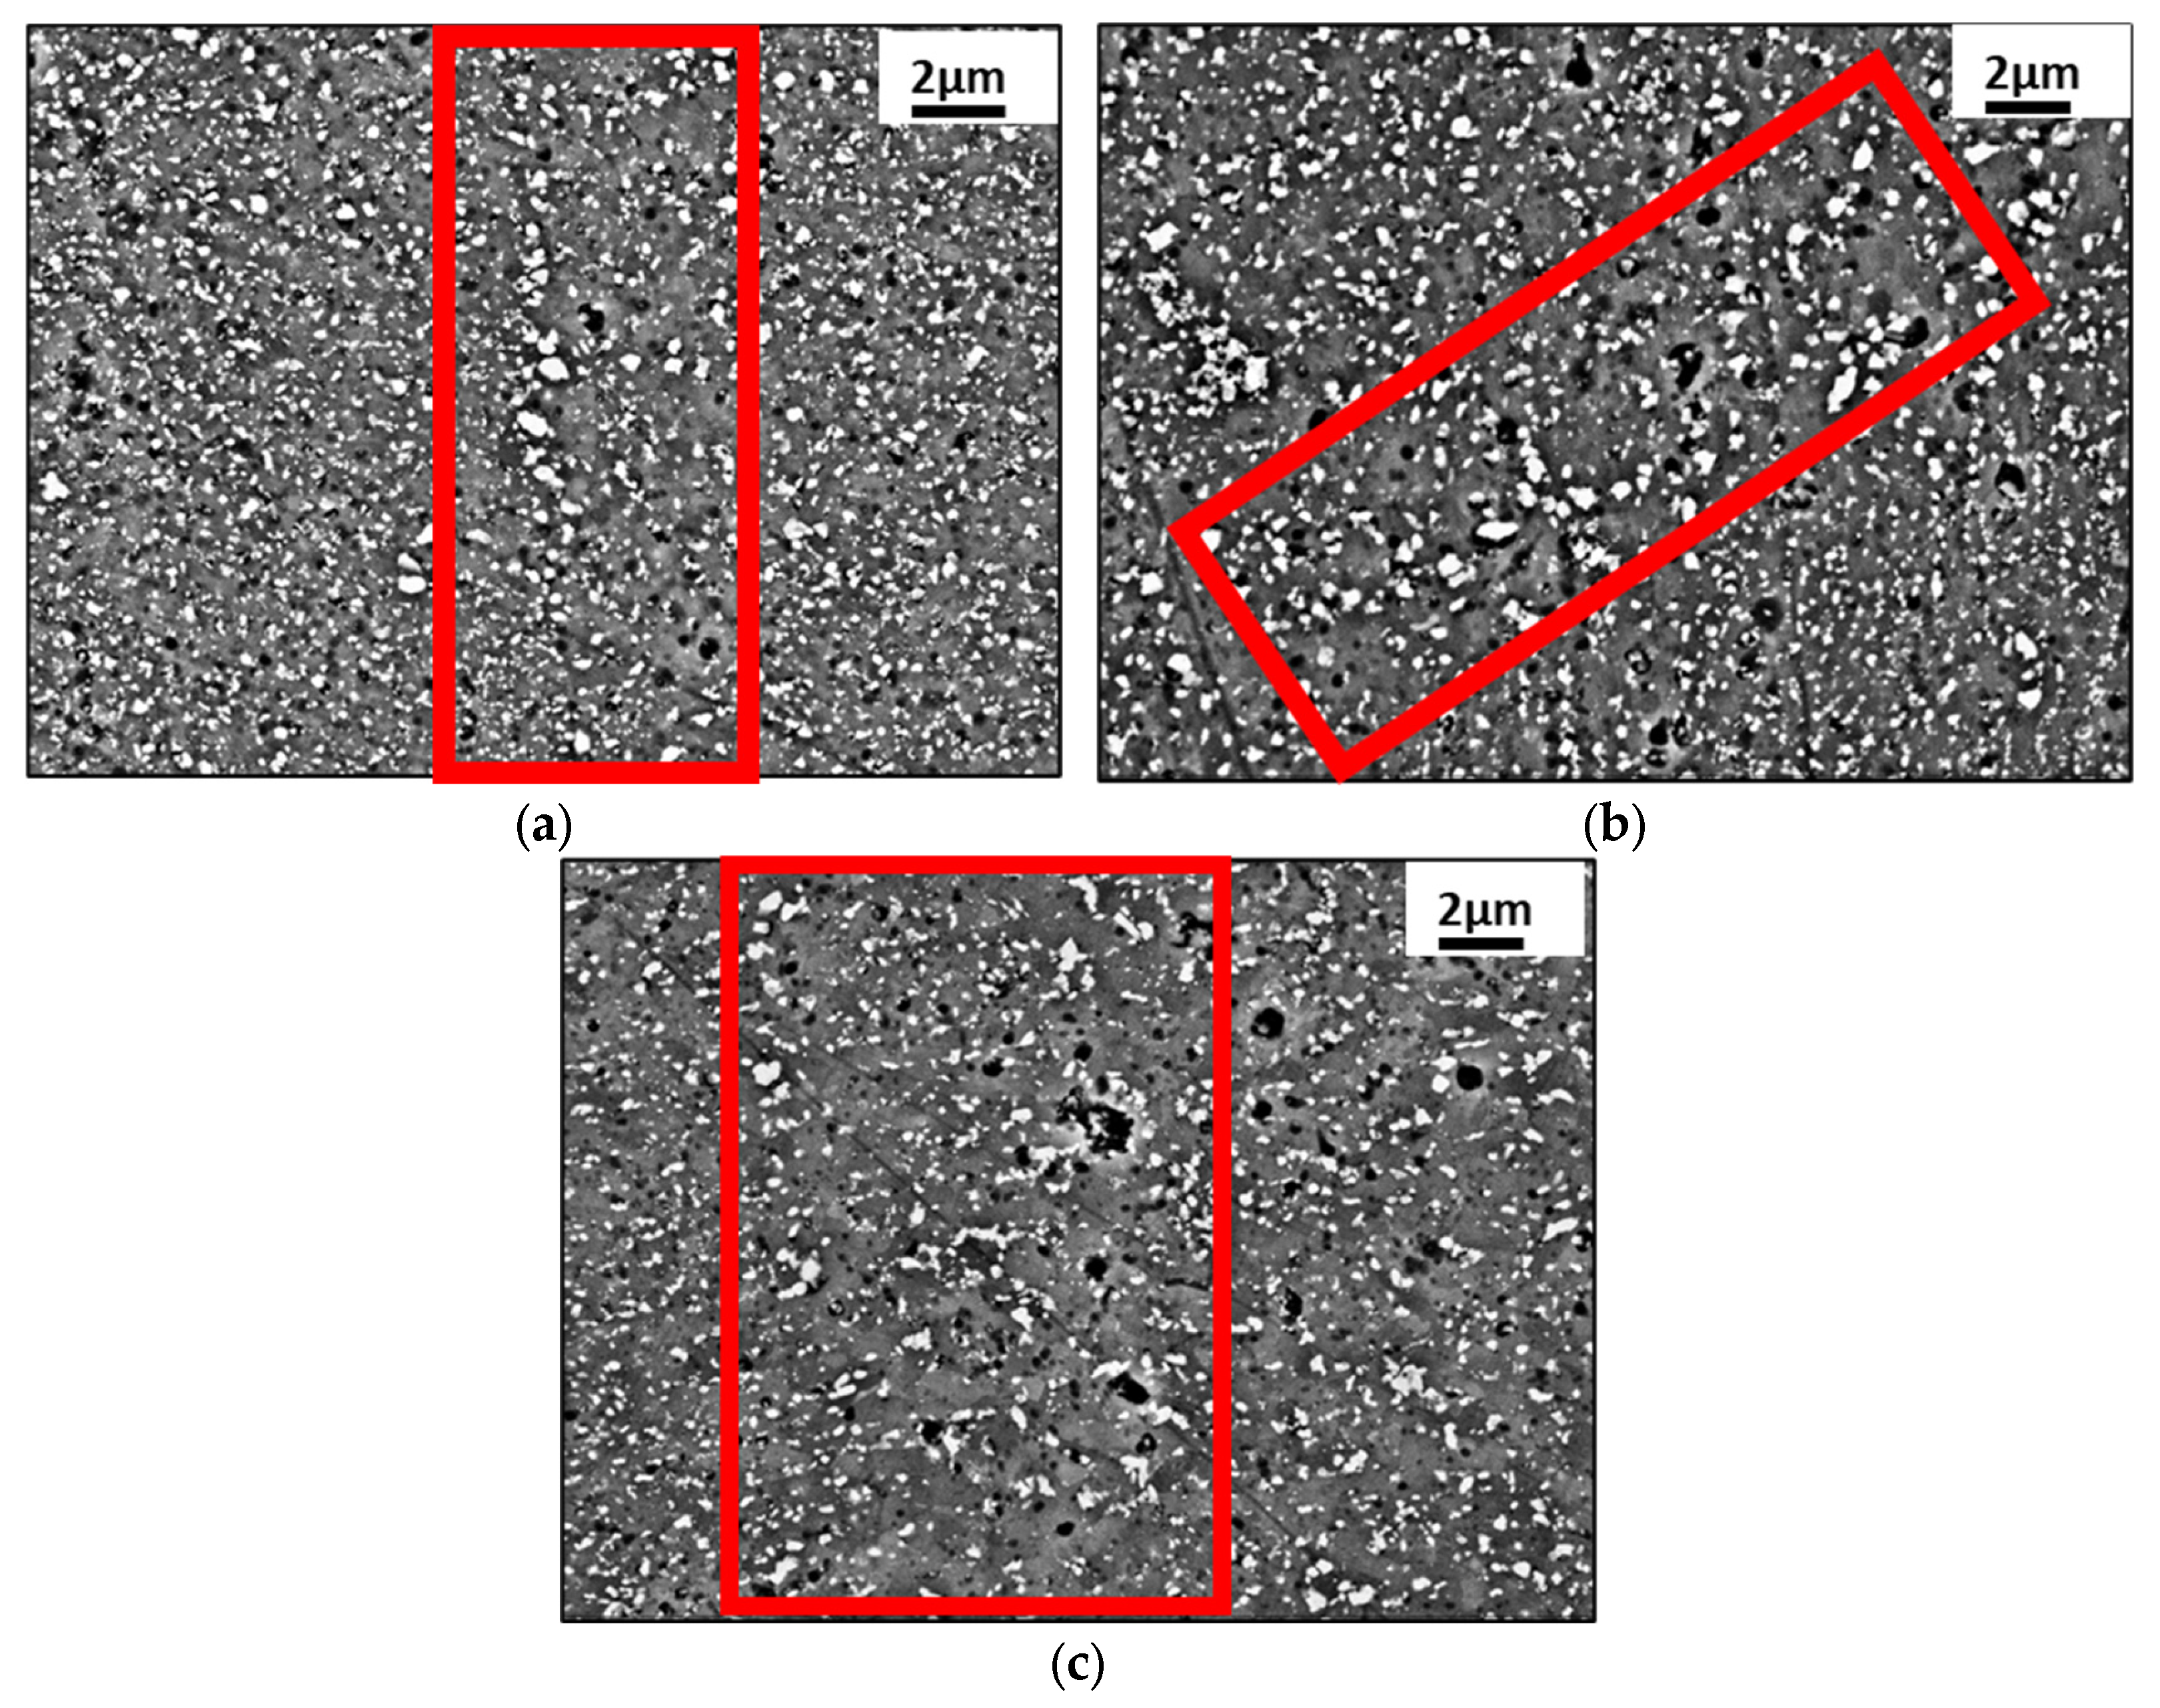
Figure 7.
High magnification SEM microstructure of St1 (a) and St3 (b) samples close to a melting pool boundary. The grains are much more visible in the St3 sample. Moreover, a lower number of small particles in St3 sample is evident.
Figure 7.
High magnification SEM microstructure of St1 (a) and St3 (b) samples close to a melting pool boundary. The grains are much more visible in the St3 sample. Moreover, a lower number of small particles in St3 sample is evident.
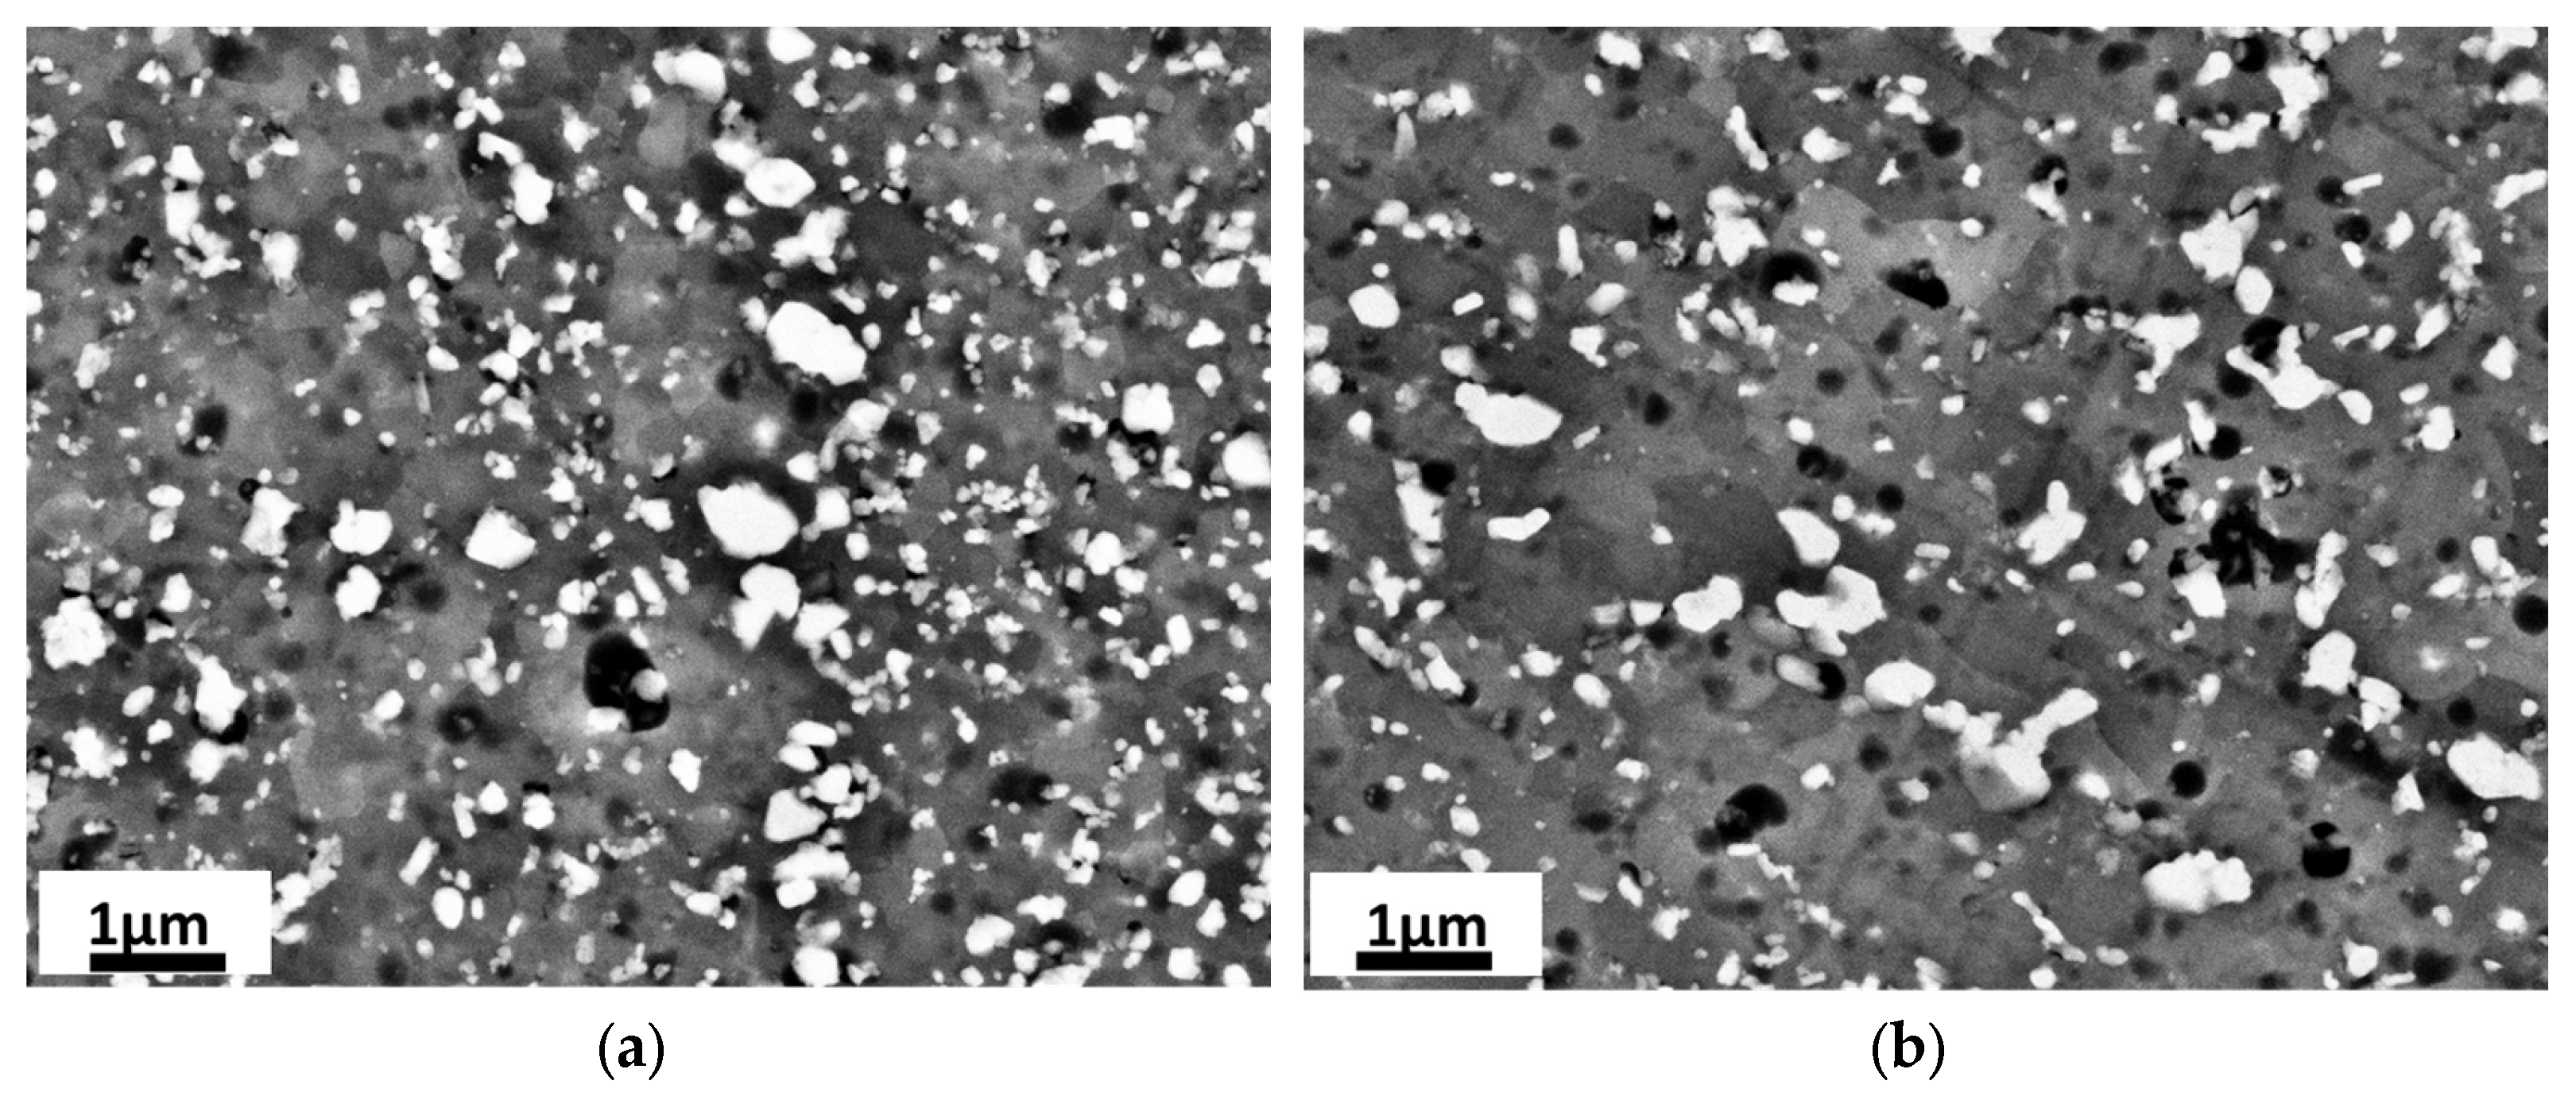
Figure 8.
Size distribution of silicon particles in St1 and St3 samples.
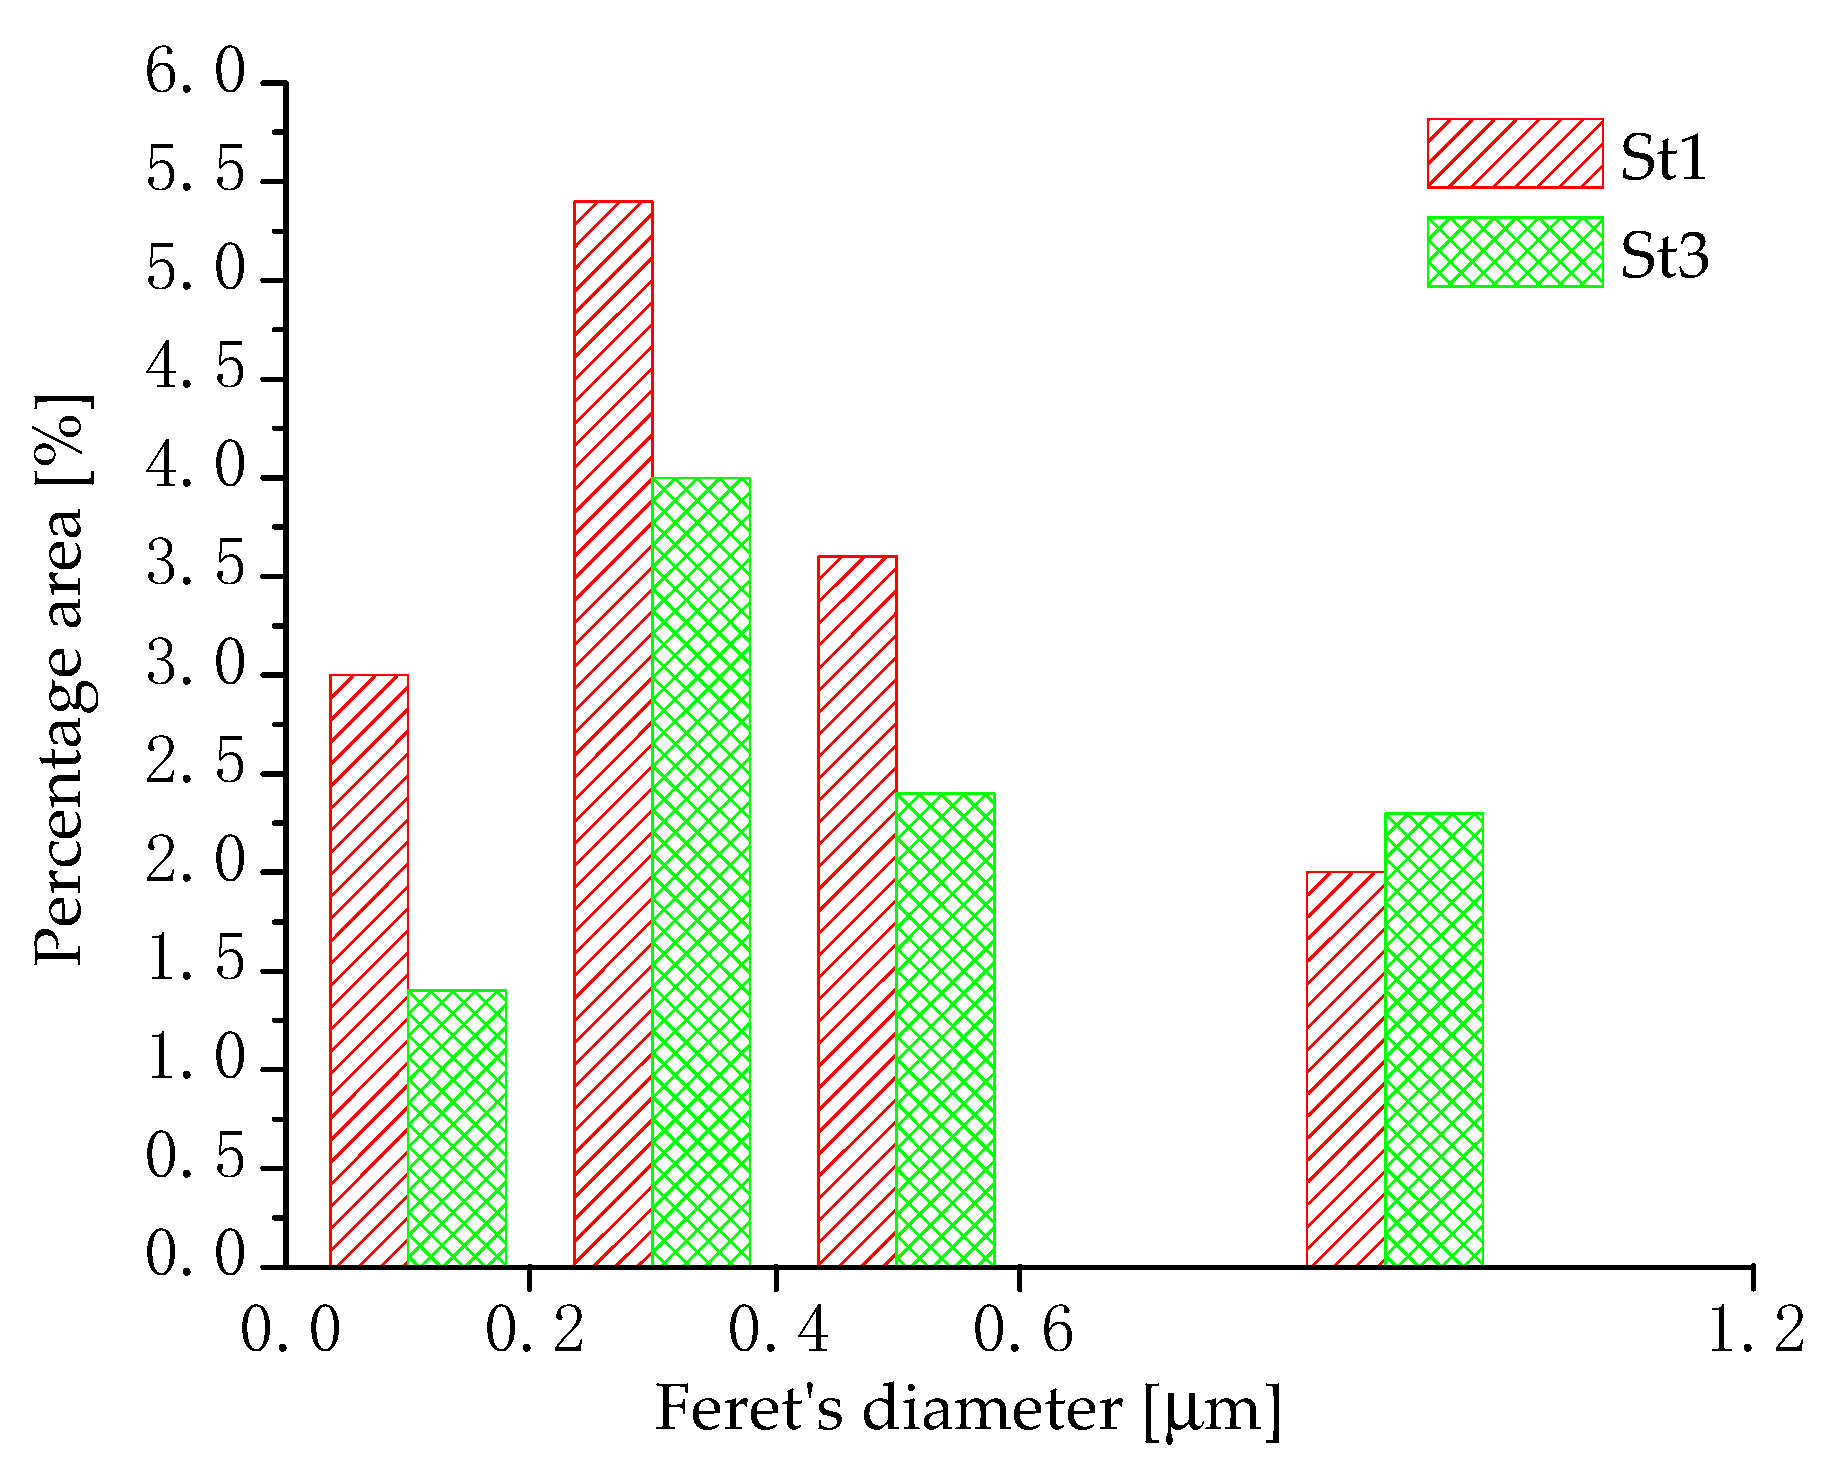
Figure 9.
Distribution of the equivalent diameter of the pores of St1 (a), St2 (b) and St3 (c) samples.
Figure 9.
Distribution of the equivalent diameter of the pores of St1 (a), St2 (b) and St3 (c) samples.

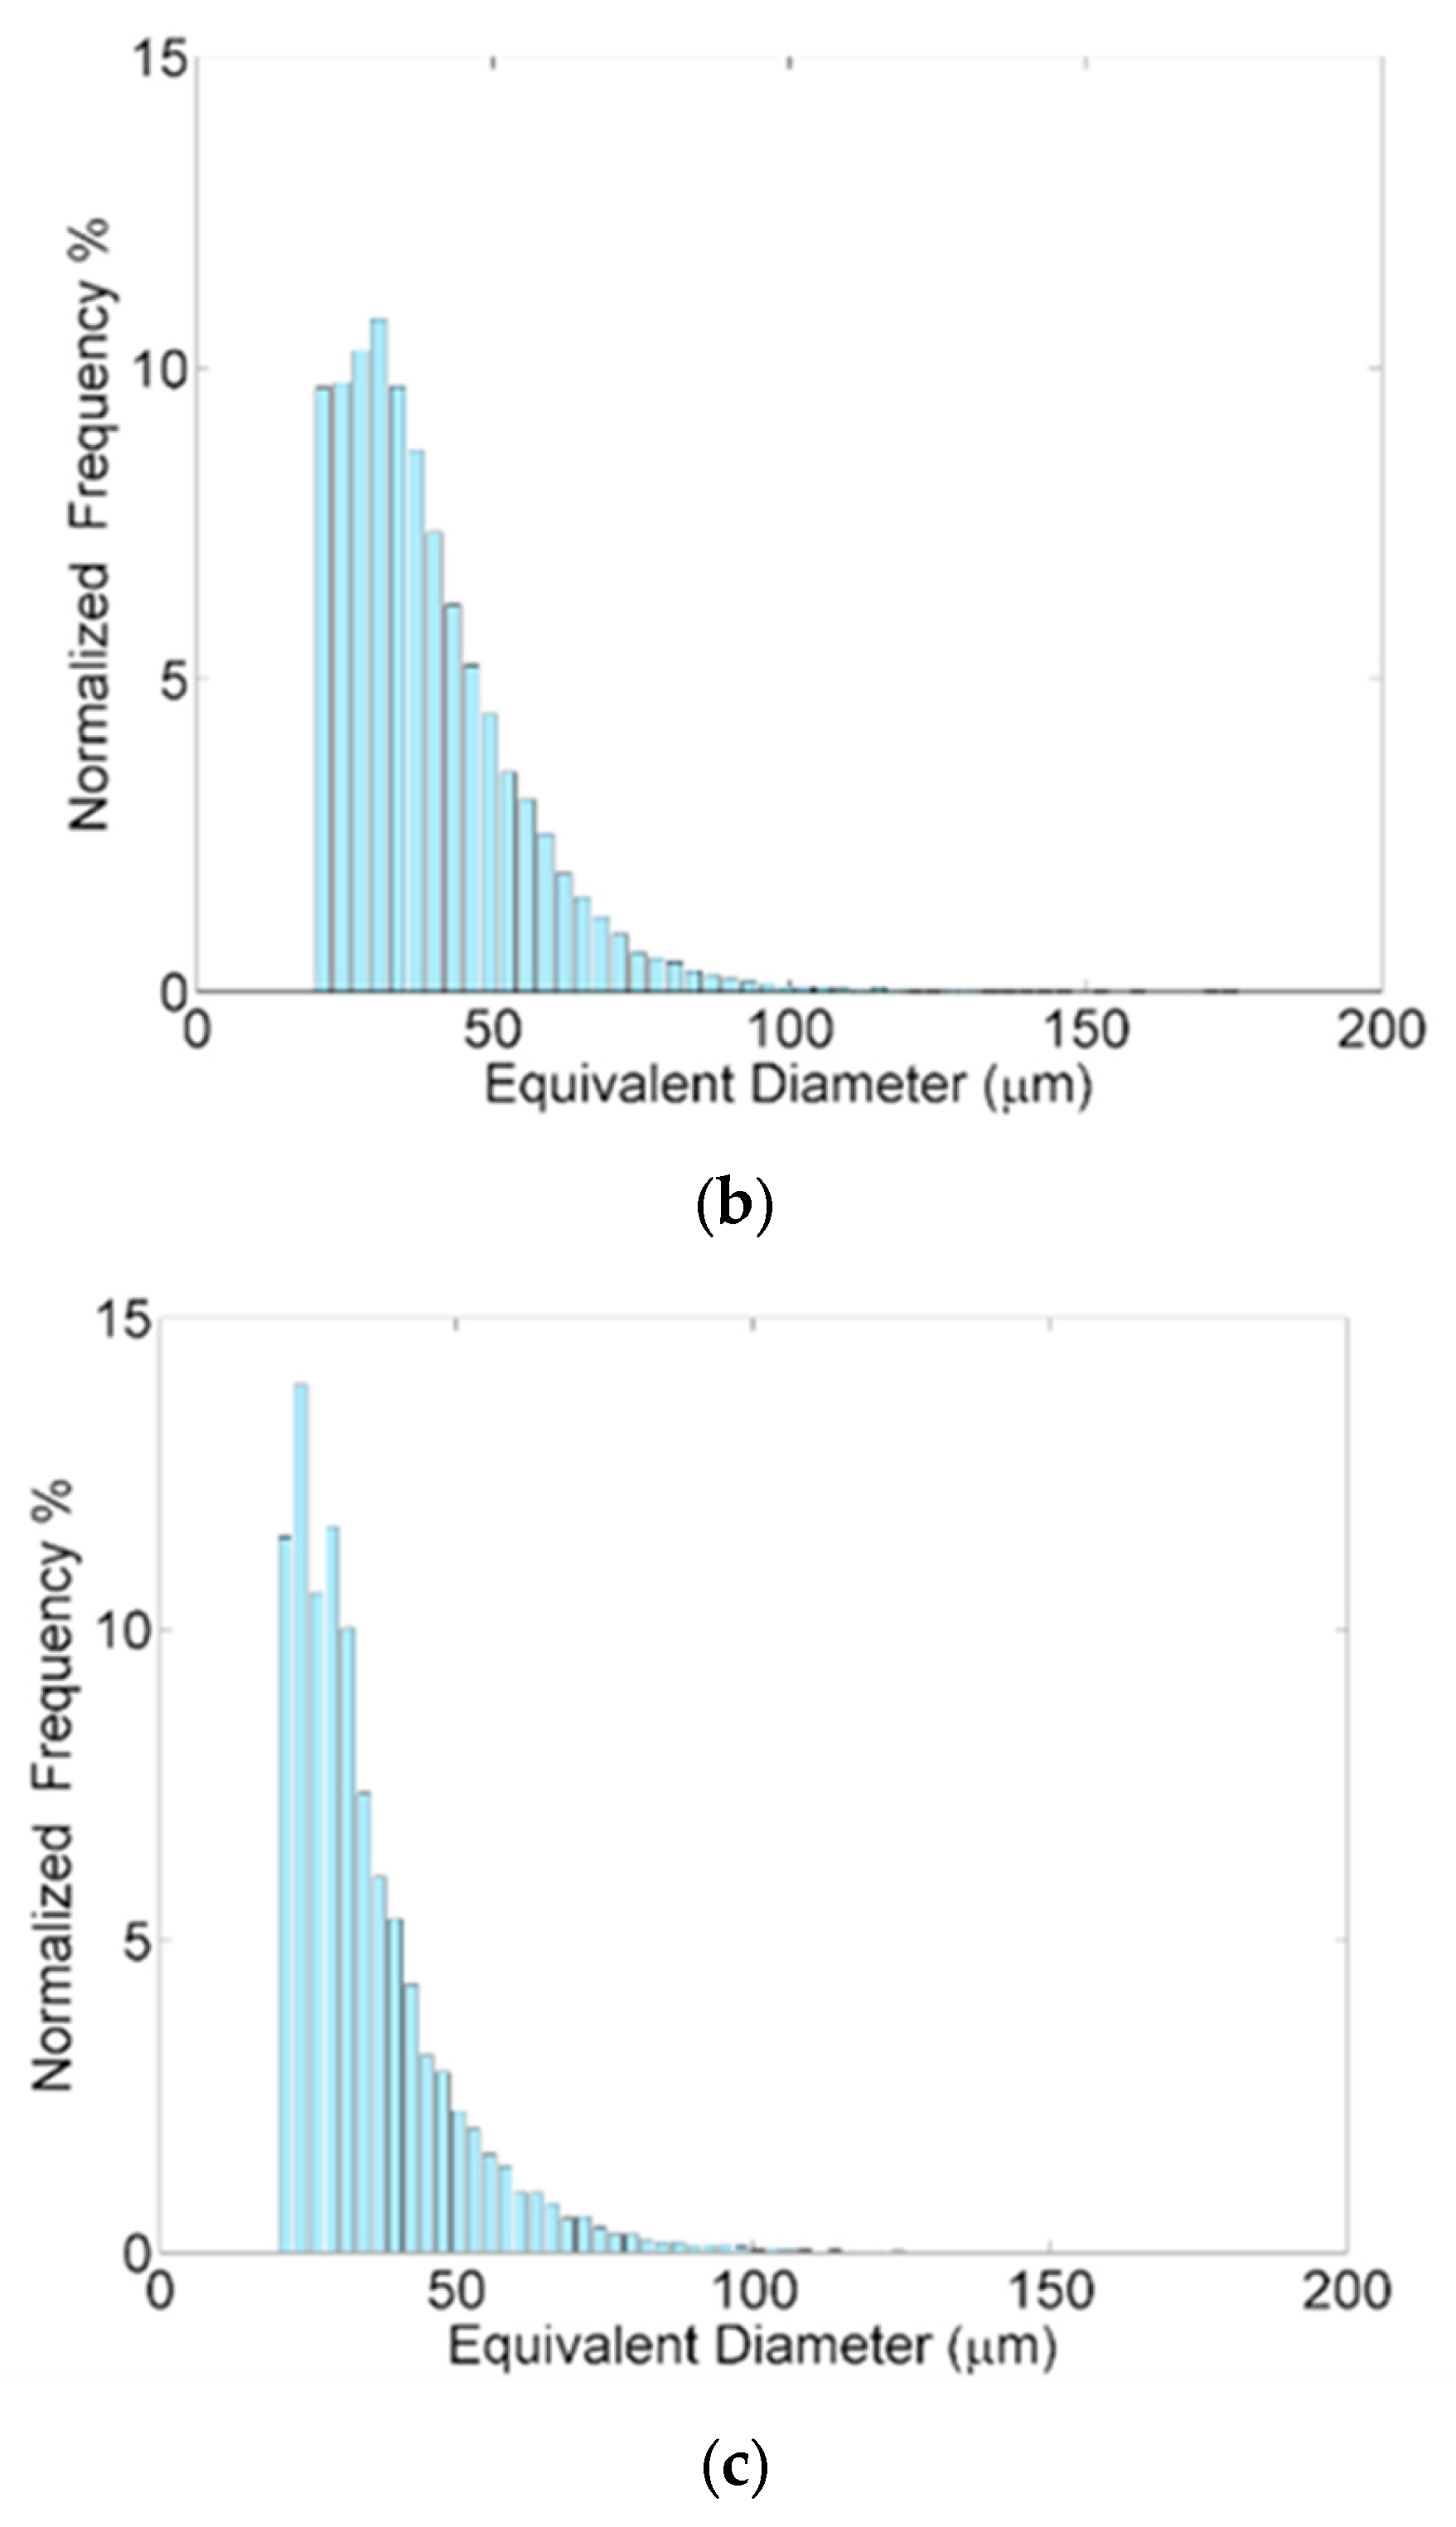
Figure 10.
Porosity distribution along X, Y and Z axes for St1 (a), St2 (b) and St3 (c) samples.

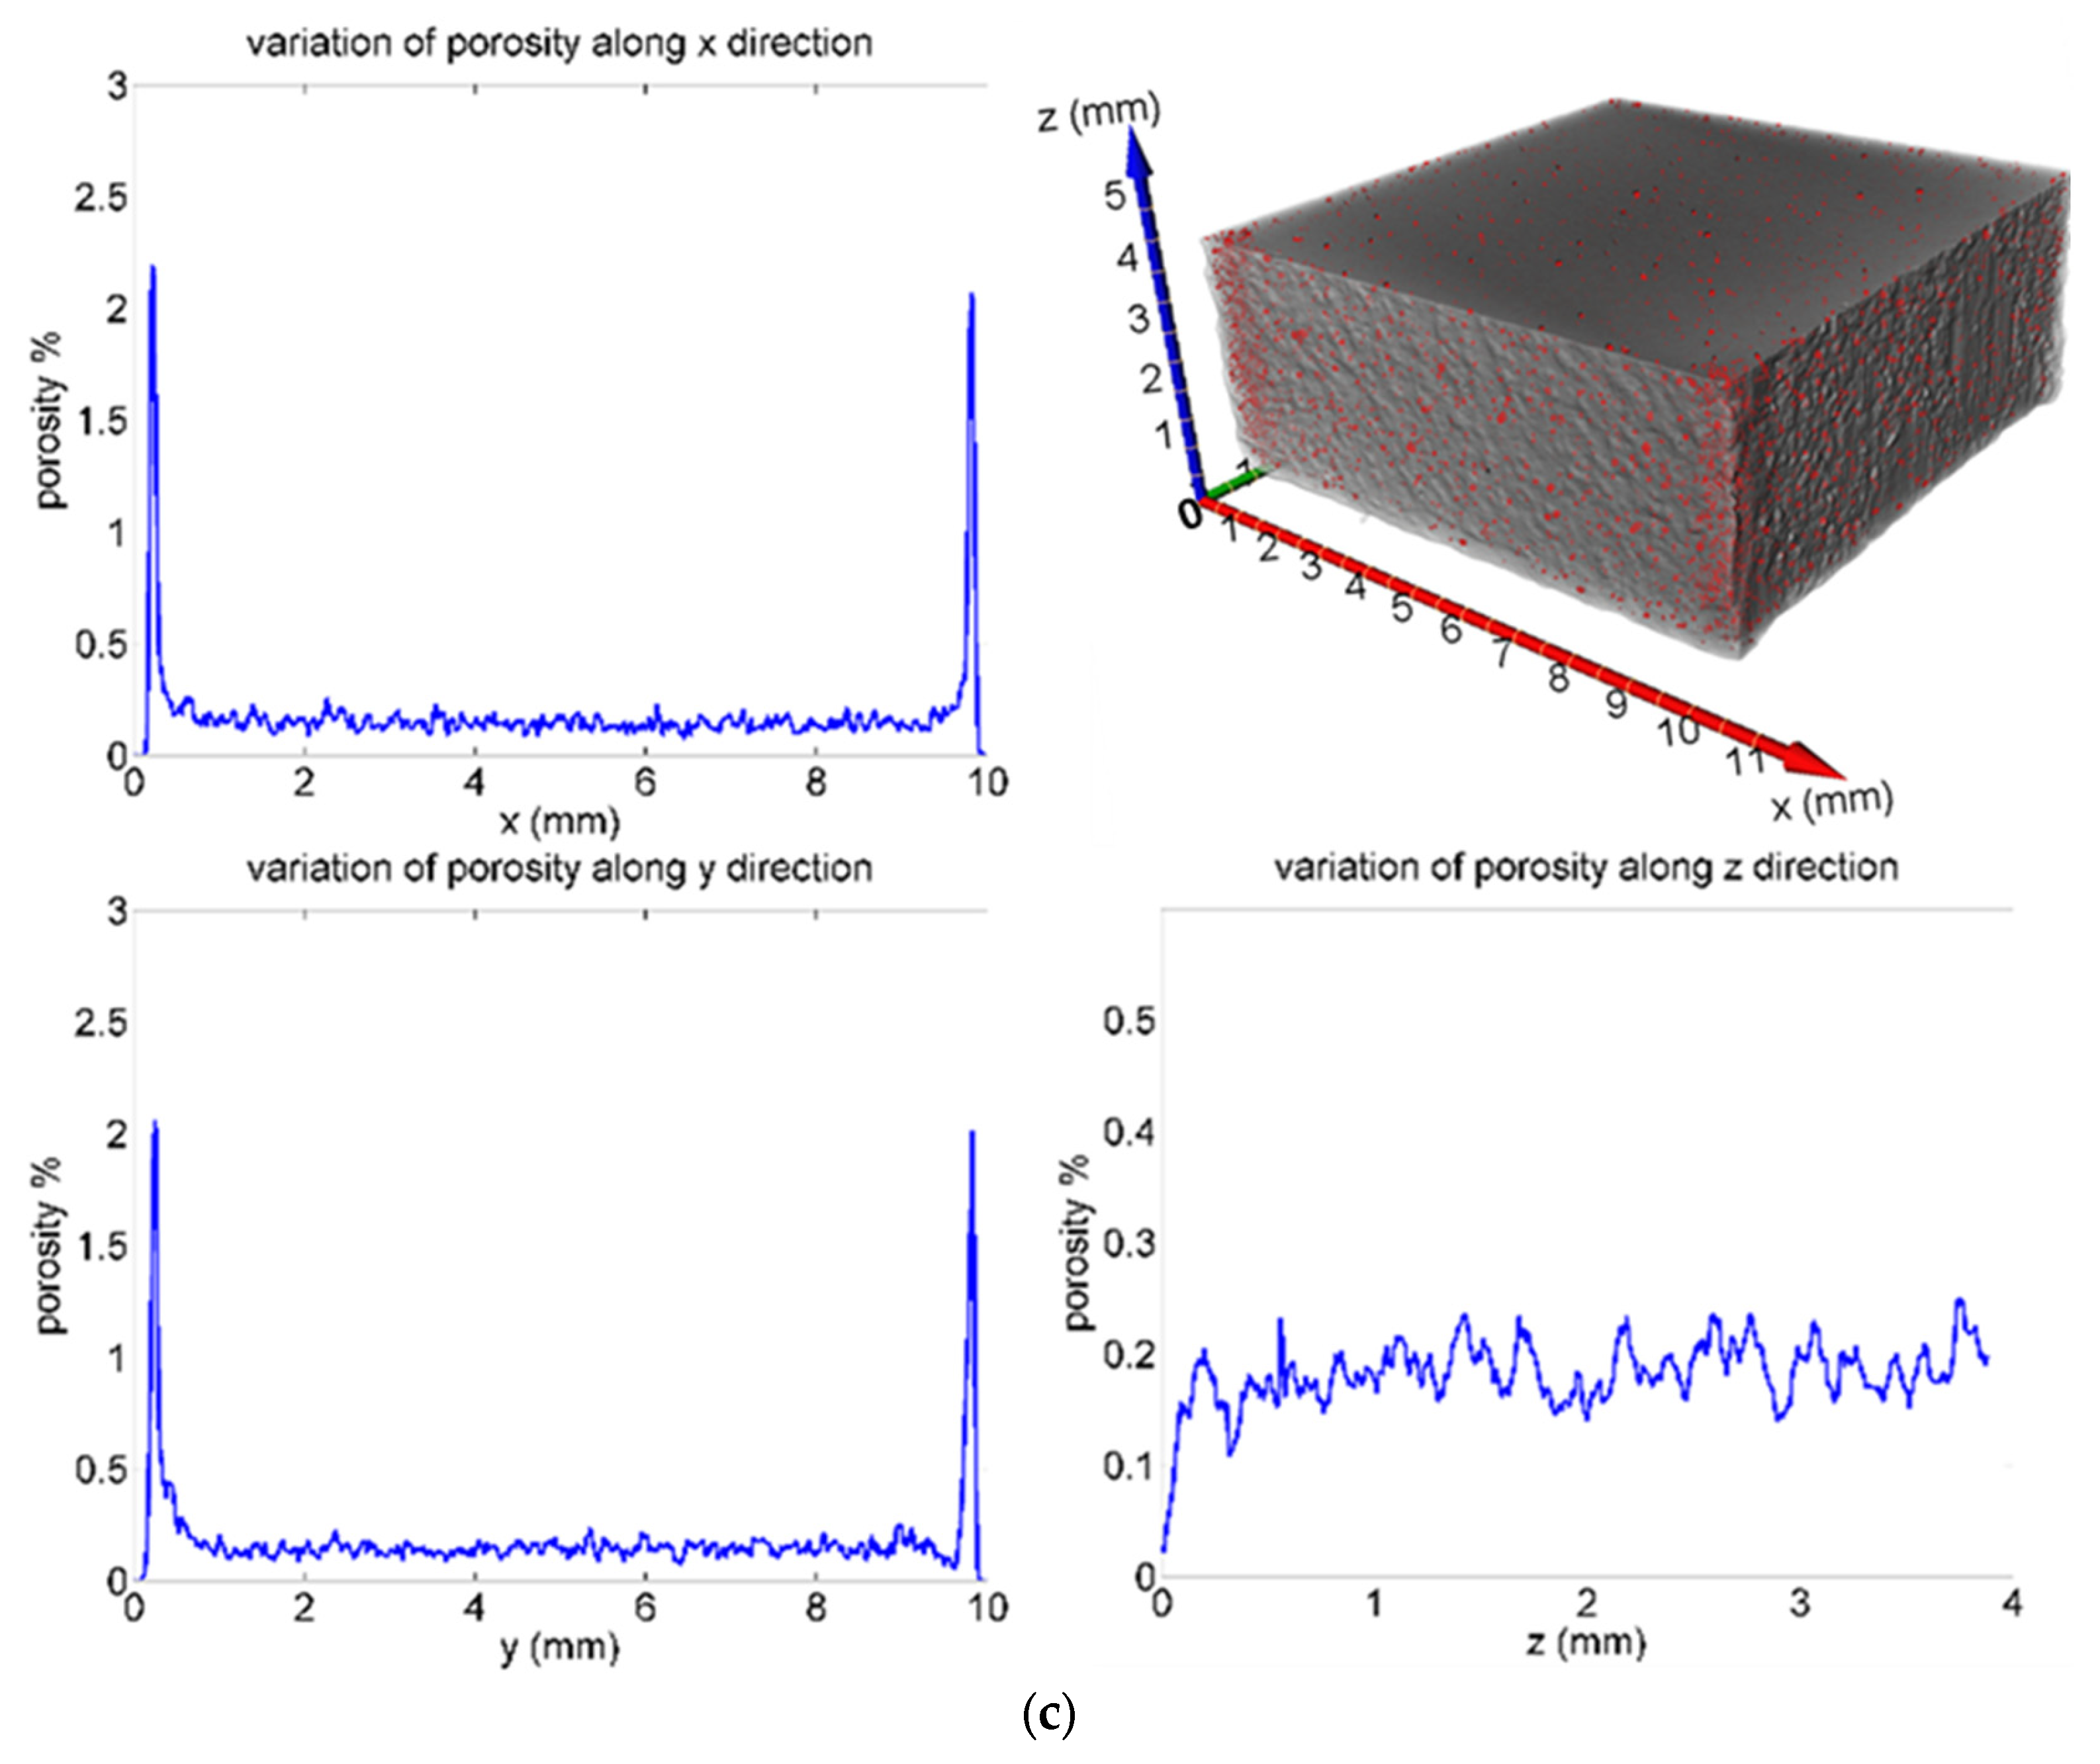
Figure 11.
Distribution of porosity along the edges of the X-Y surface and at half of X edge and Y edge for St1 (a), St2 (b) and St3 (c) samples.
Figure 11.
Distribution of porosity along the edges of the X-Y surface and at half of X edge and Y edge for St1 (a), St2 (b) and St3 (c) samples.
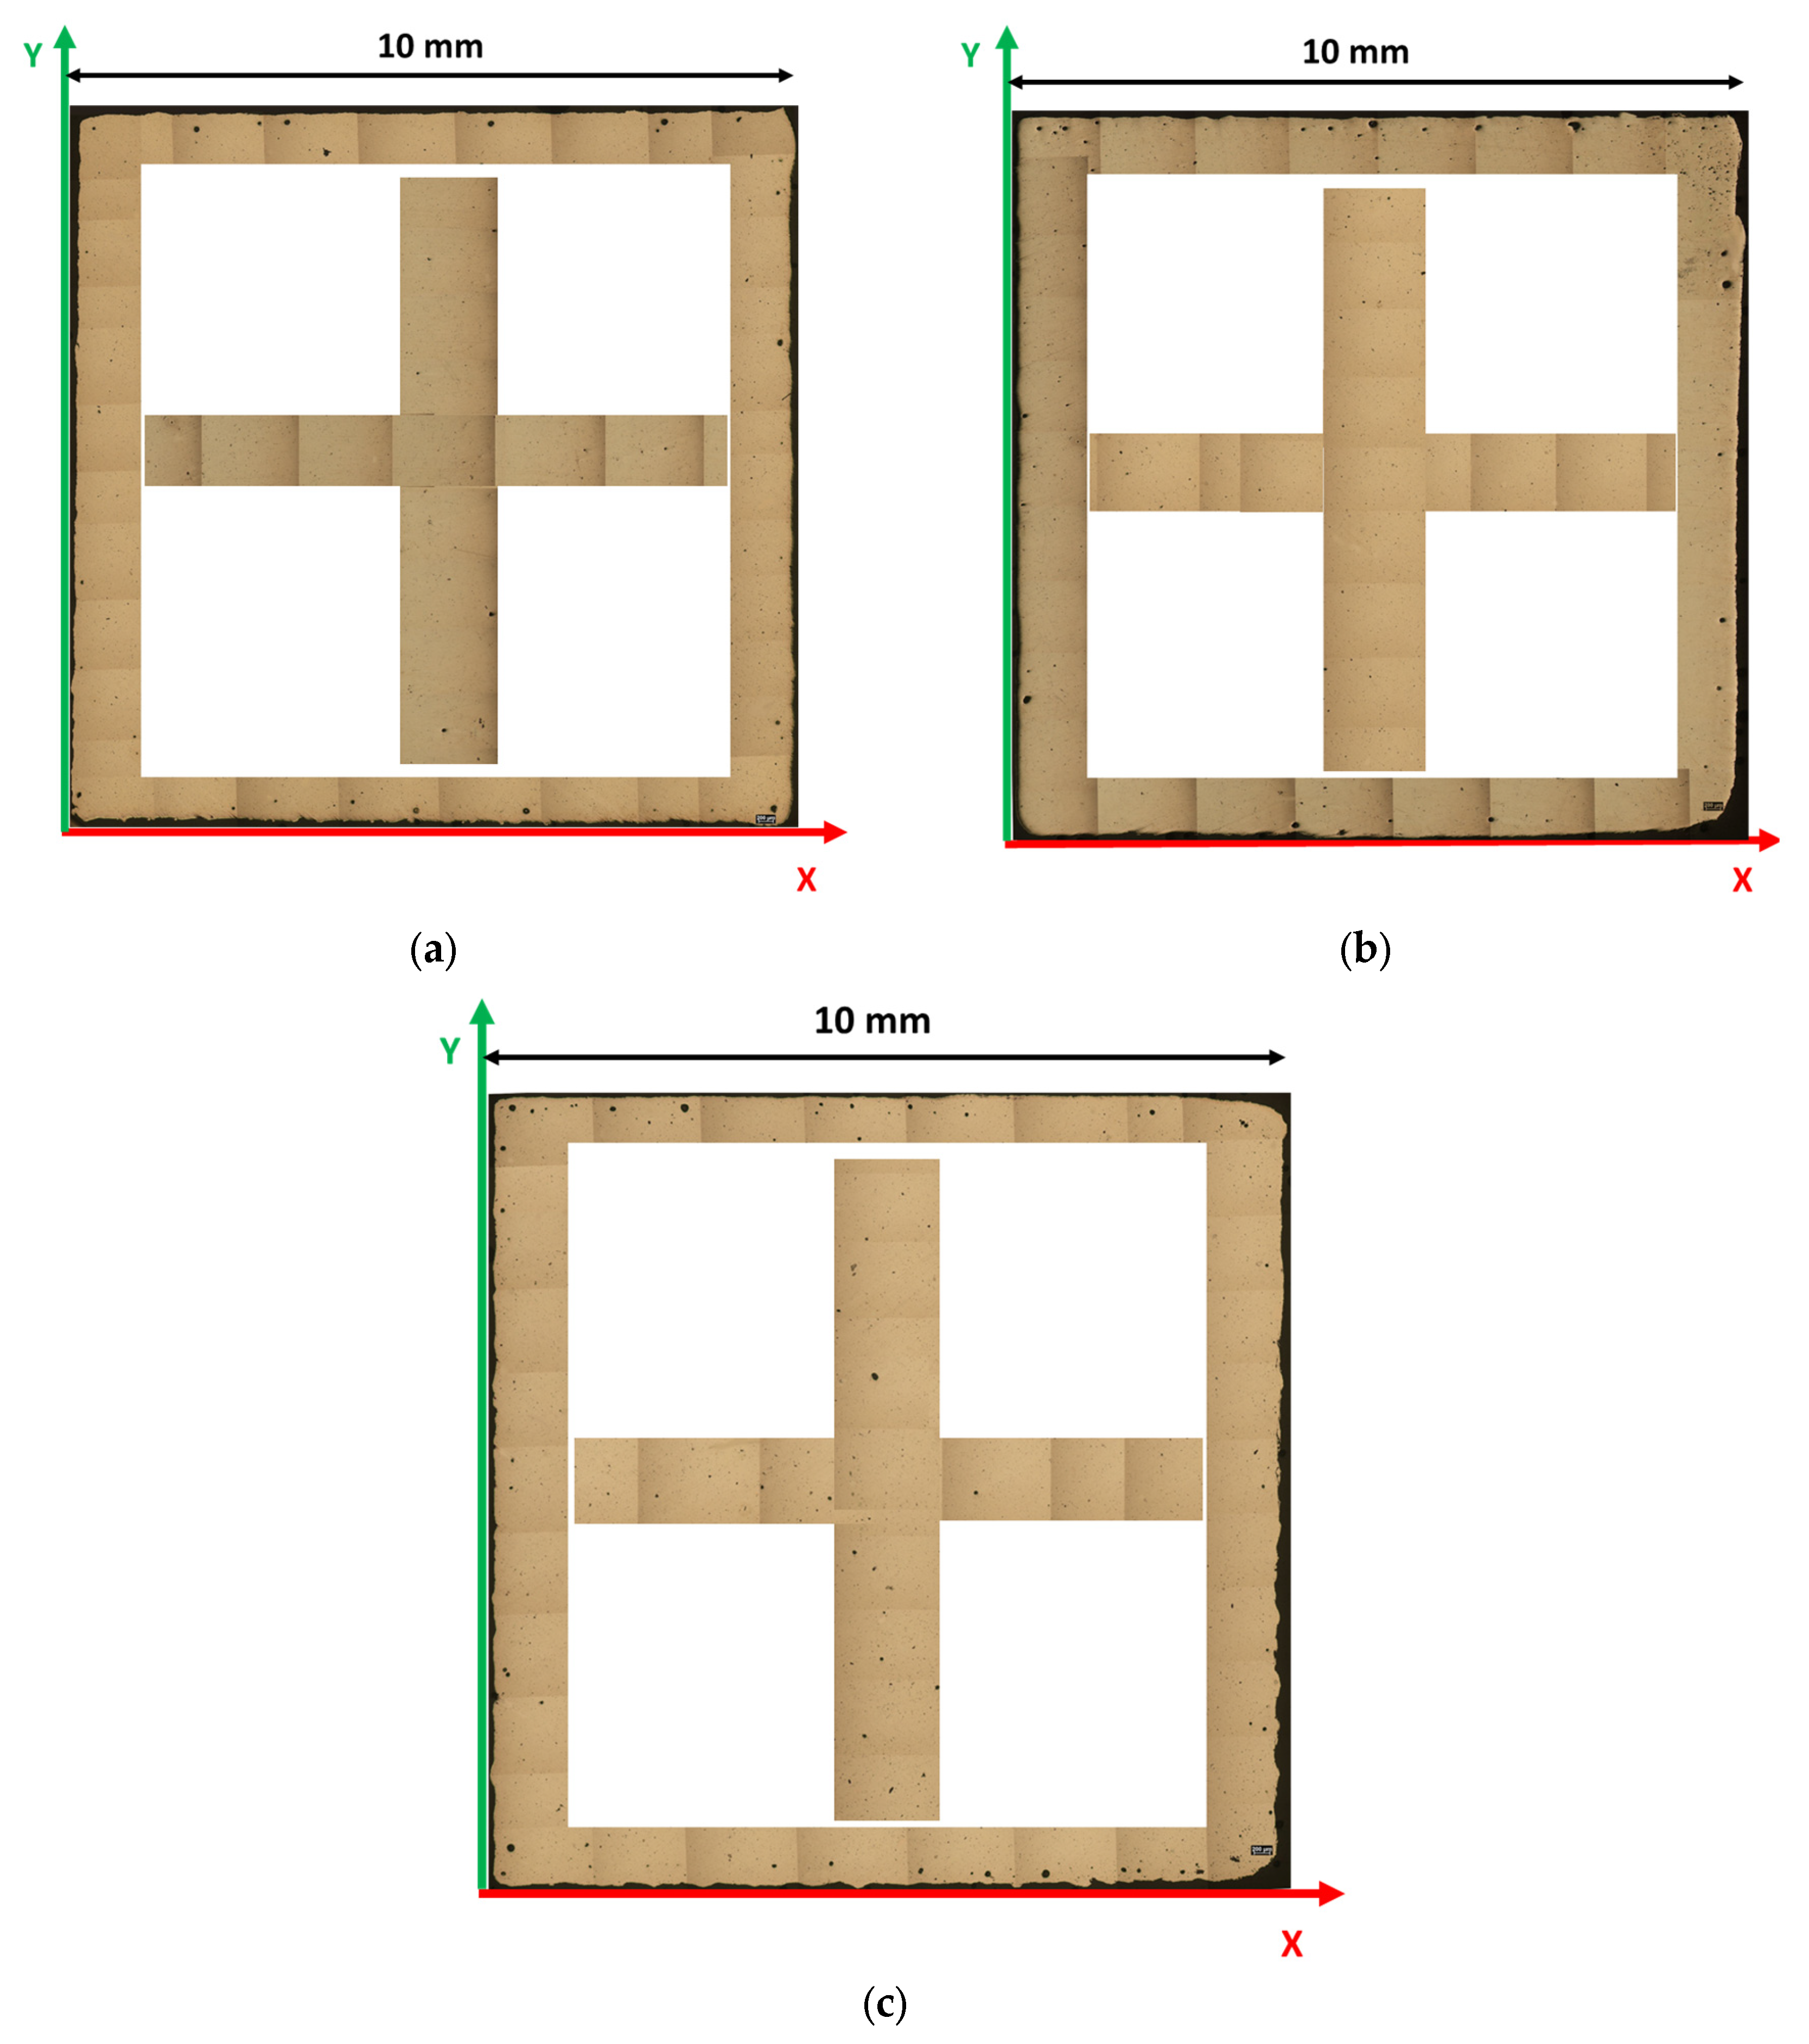
Figure 12.
Potentiodynamic curves for St1, St2 and St3 samples, showing a nobler corrosion behavior for St3 sample.
Figure 12.
Potentiodynamic curves for St1, St2 and St3 samples, showing a nobler corrosion behavior for St3 sample.
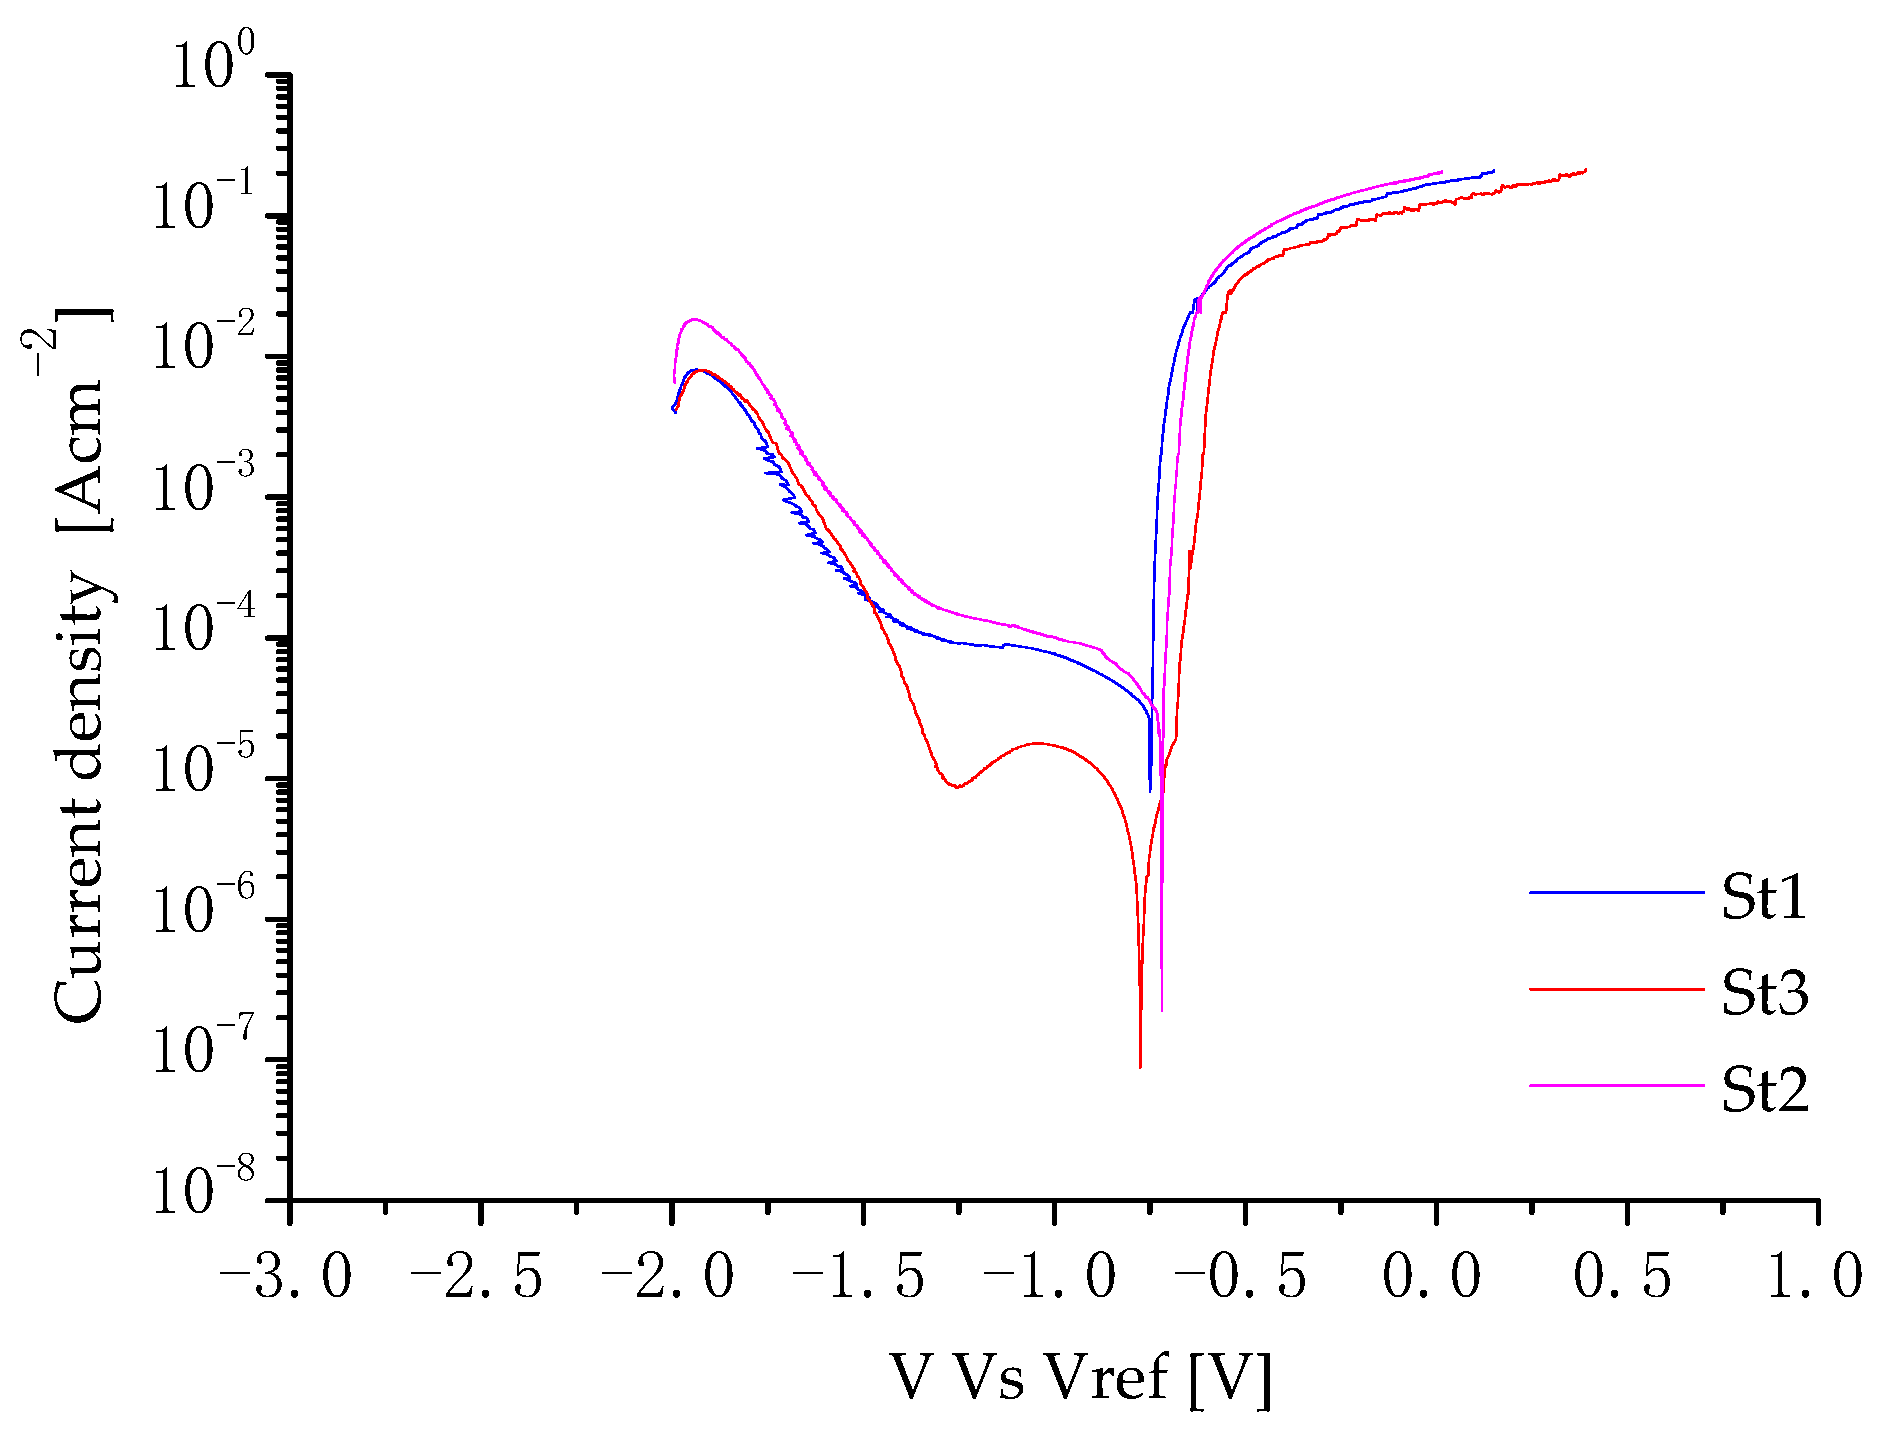
Figure 13.
Optical micrographs of the exposed surface after the corrosion test for St1 (a), St2 (b) and St3 (c) samples.
Figure 13.
Optical micrographs of the exposed surface after the corrosion test for St1 (a), St2 (b) and St3 (c) samples.


Table 1.
Powder composition (wt.%).
| Si | Mg | Fe | Mn | Ti | Cu | Zn | Pb | Sn | Ni | Al |
|---|---|---|---|---|---|---|---|---|---|---|
| 10.20 | 0.34 | 0.17 | 0.01 | 0.34 | 0.01 | 0.01 | <0.01 | <0.01 | <0.01 | bal. |
Table 2.
Samples designation and SLM process parameters.
| Samples | Power (W) | Exposure Time (µs) | TOFF (μs) | Point Distance (µm) | Hatch Distance (µm) | Layer Thickness (µm) | VED (J/mm3) | v (mm/s) | E Line (J/mm) |
|---|---|---|---|---|---|---|---|---|---|
| St1 | 375 | 40 | 20 | 120 | 90 | 30 | 69 | 2000 | 0.19 |
| St2 | 375 | 50 | 20 | 140 | 90 | 30 | 69 | 2000 | 0.19 |
| St3 | 375 | 60 | 20 | 160 | 90 | 30 | 69 | 2000 | 0.19 |
Table 3.
CT experimental conditions.
| Target | Voltage (KV) | Current (μA) | Integration Time (ms) | Voxel Size (μm) | Number of Radiographies |
|---|---|---|---|---|---|
| Tungsten | 100 | 100 | 500 | 8 | 2000 |
Table 4.
Geometry of the samples analyzed by CT.
| Sample | Edge Size | Volume (mm3) |
|---|---|---|
| St1 | ≈ 10 × 10 × 3.7 mm3 | 360.17 mm3 |
| St2 | ≈ 10 × 10 × 5.6 mm3 | 560.23 mm3 |
| St3 | ≈10 × 10 × 3.85 mm3 | 383.40 mm3 |
Table 5.
Size of the melting pool in L and T sections.
| Sample | Width of Melt Pool L Section (XZ) (No Edge) | Depth of Melt Pool L Section (XZ) (No Edge) | Track Width T Section (XY) (No Edge) |
|---|---|---|---|
| St1 | 132 ± 17 | 50 ± 6 | 87 ± 6 |
| St2 | 142 ± 20 | 76 ± 5 | 87 ± 3 |
| St3 | 157 ± 12 | 74 ± 8 | 92 ± 1 |
Table 6.
Particles density in St1 and St3 samples.
| Sample | Si Particles Density (Total Number/µm2) |
|---|---|
| St1 | 11.1 |
| St3 | 8.6 |
Table 7.
Porosity characterization.
| Sample | Pores Number | Porosity % | Equivalent Diameter (µm) | Volume (mm3) | Sphericity |
|---|---|---|---|---|---|
| St1 | 28,627 | 0.372 | Average: 38.50 range: 19.85–181.25 | Average: 4.69 × 10⁻⁵ range: 4.10 × 10⁻⁶–3.12 × 10⁻³ | Average: 0.864 range: 0.351–1.0 |
| St2 | 38,490 | 0.327 | Average: 38.85 range: 19.85–176.05 | Average: 4.75 × 10⁻⁵ range: 4.10 × 10⁻⁶–2.86 × 10⁻³ | Average: 0.906 range: 0.297–1.0 |
| St3 | 19,605 | 0.181 | Average: 34.84 range: 19.85–152.22 | Average: 3.53 × 10⁻⁵ range: 4.10 × 10⁻⁶–1.85 × 10⁻³ | Average: 0.906 range: 0.331–1.0 |
Table 8.
Average microhardness in the longitudinal (XZ) and transversal (XY) sections.
| Sample | HV 0.1/15 L Section (XZ) (No Edge) | HV 0.1/15 T Section (XY) (No Edge) |
|---|---|---|
| St1 | 71 ± 1 | 71 ± 1 |
| St2 | 70 ± 1 | 71 ± 1 |
| St3 | 70 ± 0 | 70 ± 0 |
Table 9.
OCP values for St1, St2 and St3 samples.
| Sample | OCP [V] |
|---|---|
| St1-T | −0.772 ± 0.001 |
| St2-T | −0.772 ± 0.001 |
| St3-T | −0.761 ± 0.003 |
Disclaimer/Publisher’s Note: The statements, opinions and data contained in all publications are solely those of the individual author(s) and contributor(s) and not of MDPI and/or the editor(s). MDPI and/or the editor(s) disclaim responsibility for any injury to people or property resulting from any ideas, methods, instructions or products referred to in the content. |
© 2024 by the authors. Licensee MDPI, Basel, Switzerland. This article is an open access article distributed under the terms and conditions of the Creative Commons Attribution (CC BY) license (https://creativecommons.org/licenses/by/4.0/).
Share and Cite
MDPI and ACS Style
Leo, P.; Renna, G.; Soni, N.; De Pascalis, F.; Primo, T.; Del Prete, A. On the Effect of Exposure Time on Al-Si10-Mg Powder Processed by Selective Laser Melting. Metals 2024, 14, 76. https://doi.org/10.3390/met14010076
AMA Style
Leo P, Renna G, Soni N, De Pascalis F, Primo T, Del Prete A. On the Effect of Exposure Time on Al-Si10-Mg Powder Processed by Selective Laser Melting. Metals. 2024; 14(1):76. https://doi.org/10.3390/met14010076
Chicago/Turabian StyleLeo, Paola, Gilda Renna, Neetesh Soni, Fabio De Pascalis, Teresa Primo, and Antonio Del Prete. 2024. "On the Effect of Exposure Time on Al-Si10-Mg Powder Processed by Selective Laser Melting" Metals 14, no. 1: 76. https://doi.org/10.3390/met14010076
Note that from the first issue of 2016, this journal uses article numbers instead of page numbers. See further details here.