Abstract
The production reality of sheet steels from casting to the end product is such that in the cases of ultra- and advanced high-strength steels, we have to deal with the segregation of elements on macro- and microlevels. Both can have a significant impact on the microstructure formation and resulting properties. There are several production stages where it can influence the transformations, i.e., casting, hot rolling process and annealing after cold rolling. In the present work, we focus on the latter, and more specifically, the transformation from ferrite–cementite to austenite, especially the nucleation process, in cold-rolled material. We vary the levels of two substitutional elements, Mn and Si, and then look in detail at the microsegregation and nucleation processes. The classical nucleation theory is used, and both the chemical driving force and strain energy are calculated for various scenarios. In the case of a high Mn and high Si concentration, the nucleation can thus be explained. In the cases of high Mn and low Si concentrations as well as low Mn alloys, more research is needed on the nuclei shapes and strain energy.
1. Introduction
Advanced and ultrahigh-strength steels (AHSS and UHSS) are used in cars due to their combination of high ductility and strength. The good balance is attributed to a mixture of phases [1,2,3]. Since the constituent phases have different mechanical properties, they behave differently during deformation [4,5,6]. Many researchers concluded that the key to the easier, predictable and isotropic performance of steel is a homogeneous dispersion of phases on the micro- and mesoscales [7,8,9]. In the case of steels that are produced in the form of a strip, microstructural heterogeneities can be observed as alternating bands of softer and harder phases. An often-cited cause of microstructural banding is microsegregation [10,11,12]. The segregation of substitutional elements takes place during solidification, where partitioning at the meso- and microscales occurs between the newly forming solid phases, be it austenite or δ-ferrite, and liquid. This is caused by the differences in the solubilities of alloying elements in the newly formed solid phases and liquid. Hence, the concentrations of alloying elements in the liquid are higher than in solid phases [13,14,15,16,17]. Microsegregation persists throughout the hot- and cold-rolling downstream processes, since the time–temperature conditions do not allow substitutional elements to diffuse over significant distances [13,16,18,19]. Consequently, starting with hot-rolled materials, on a microscale, a banded segregation profile is observed in the plane of rolling direction (RD) and normal direction (ND) and, to a lesser degree, in the plane of transversal direction (TD) and normal direction. As a result, the strip can have a lamellar-like structure of microchemical bands with locally different transformation temperatures [20,21,22,23]. Depending on the degree of segregation and the added alloying elements, the differences in the thermodynamic transformation temperatures can be significant [22,24,25,26,27].
In recent years the interest in the influence of microsegregation on the transformation behavior and resulting properties increased for many types of materials, including AHSS and UHSS [20,24,25,28,29,30,31,32,33,34,35,36,37,38]. As concluded in the mentioned studies, microsegregation plays a significant role in not only phase transformations and the resulting phase contents [20,38,39,40], but also in the recrystallization process and austenite formation during downstream processing [31,37,41]. This in turn has an effect on the mechanical properties, e.g., tensile strength [21,36,42]. The above-mentioned studies therefore clearly identified that there is a correlation between microsegregation and material behaviors. In some cases, the segregation measurements are used to directly calculate the effect on transformation temperatures of individual phases, i.e., start of austenite to ferrite (), end of austenite to ferrite/pearlite () transformations and martensite start () or bainite start () temperatures. Based on the established relationships between alloying elements, i.e., manganese (Mn), silicon (Si) and carbon (C), these can be estimated [26,43,44]. As an example, Mn and C lower the temperature range of the transformation of ferrite/pearlite to austenite during heating, while Si drives this transformation to higher temperatures [12,26,44,45,46]. Equilibrium transformation temperatures along with driving forces can be calculated based on the available data for the local chemical composition as a function of position in the microstructure using Thermo-Calc [26]. However, the influence of the microsegregation patterns and levels of individual substitutional elements on the resulting microstructure has not yet been studied in a systematic way. Hence, in the present study, we investigate the roles of Si and Mn on the transformation of ferrite/pearlite to austenite and its dependence on the overall composition, heating rate and presence of microsegregation.
2. Materials and Methods
Materials for the present study were made using a vacuum furnace and were cast into 23 kg ingots. The compositions were designed to have different Si and Mn contents with constant C concentrations (Table 1). Other elements, e.g., phosphor (P), sulfur (S) and nitrogen (N), were kept as low as possible (P and S at levels below 0.01 wt%). Before further processing, the ingots were rough rolled to 40 mm thickness and then cut into 4 slices of 75 × 100 × 40 mm3. Two of those slices were homogenized at 1300 °C for 12 h in an argon gas atmosphere. The resulting decarburized surface was removed before hot rolling by milling 5 mm off the top and bottom of the sheets. Both homogenized and nonhomogenized slices were further hot rolled into sheets of 4 mm thickness and then reduced by cold rolling to a final gauge of 1 mm. The cold-rolled material was used for annealing and further testing. The effectiveness of the homogenization treatment was checked on the hot-rolled sample of 1.9Si2Mn, and the variation in the composition was found to be within 0.1 wt% for substitutional elements across the scanned area, showing the homogenization treatment to be effective, considering variations in nonhomogenized materials typically within 0.1 wt%.

Table 1.
Chemical compositions of the investigated materials measured using inductively coupled plasma–optical emission spectrometry (ICP-OES) (all values are in wt% shown with calculated measurement error). Also shown are top temperatures to which the samples were heated during transformation heat treatments for homogenized and nonhomogenized samples (Ttop).
Samples for bulk and local chemical analyses were taken from the hot-rolled strips. The bulk chemical compositions were determined using inductively coupled plasma–optical emission spectroscopy (ICP-OES). The measured compositions are shown in Table 1. The reason for using samples from the hot-rolled instead of cold-rolled and annealed conditions are the limitations of measurement conditions and their influence on the limited lateral resolution and accuracy that can be achieved for the local chemical composition in a highly deformed cold-rolled state. For the present study, a Jeol7001 field emission gun scanning electron microscope (FEG SEM) was used, equipped with two silicon drift detectors (SDD) energy dispersive X-ray spectrometers (EDS) and the software Pathfinder vs 1.3 by Thermo Scientific. Using the method mentioned in [47], the detection limits for both Si and Mn in our measurement conditions are estimated at a 0.1 wt%. The problems with quantification caused by an overlap of the Mn and Fe peaks and using proper ZAF (Z—effect of atomic number, A—absorption and F—fluorescence) corrections were solved by using a standardized analysis, in which each spectrum was compared to a calibration measurement. The methodology was validated through the comparison of SEM-EDS and EPMA-WDS line scans at the same location, which showed the same values within the experimental uncertainty of the two. As a way of comparison, we are using line scans and peak analysis to determine the degree of segregation as appearing in high-alloyed (HA) and low-alloyed (LA) concentrations of elements. In some cases, qualitative EDS maps are determined using the FEG SEM Zeiss Gemini DSM450 equipped with two SDD EDS detectors and the software Aztek 5.0. The fine features of pearlite cannot be resolved with the same measurement conditions as the overview maps. The calculations using the software CASINO vs2 showed the volume, where we obtain the EDS signal using a 5 kV acceleration voltage, not to exceed 100 nm in depth and 80 nm in width. Quantitative measurements are carried out with the same microscope but with a 10 kV acceleration voltage, which increases the penetration depth to ~300 nm. The resulting measurement accuracies are 0.07 wt% and 0.01 wt% for Mn and Si, respectively.
Annealing heat treatments were performed with a Bähr 805A dilatometer on cold-rolled samples with dimensions of 10 × 5 × 1 mm3. Three different heating rates are used: 0.1 °C/s, 1 °C/s and 5 °C/s. The top temperatures are chosen to be above the equilibrium Ae3 temperature and are shown in Table 1. With the exception of alloy 1.5Si2Mn, where we use a lower temperature for the 0.1 °C/s heating rate, in all other cases the same top temperatures are applied for all heating rates. For each condition the dilatometer measurements were performed three times, and the temperature range of the transformation was determined from the curves. The error is the standard deviation calculated from the three measurements. The method used for determination of transformation temperatures is based on the analysis of the 1st derivative of dilatometer curves as described in Refs. [48,49,50,51,52]. In this method, the beginning of transformation is where the derivative starts to deviate from the constant line. Experimental scatter is removed by employing the LOESS method, described in Refs. [53,54]. An additional problem for the determination of the start and finish of transformation is the detection limit of the austenite and ferrite phase fractions during the transformation. To evaluate the theoretical limits, we use two approaches for the change in length calculations, described in Refs. [55,56]. To be considered significant, the change in the length caused by the transformation must exceed the scatter of the dilatation signal, which was estimated to be ±1 μm. The detection limits for the austenite volume fraction against temperature derived from the two methods are shown in Figure 1. The values are similar, irrespective of the method applied. Depending on the temperature, the detection limit changes from approximately 2.5 to 3.3 vol%. During subsequent analysis, we assume the observed transformation start temperature to occur when 3 vol% of the austenite is present. Likewise, the finish temperature is determined at 97 vol%.
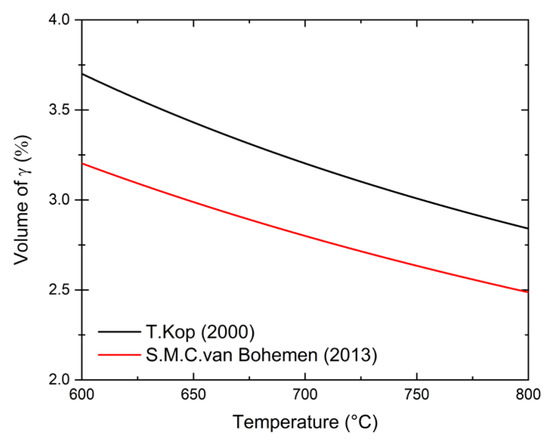
Figure 1.
Theoretical change in length detection limit for austenite formation during heating. The errors are calculated according to two methods described in Refs. [55,56].
For general light optical microscopy characterization, microstructures were revealed by etching in 10% SMB etchant [57]. More detailed images were obtained using nital-etched samples with SEM and secondary electrons (SE) and in-lens secondary electron (inLens) detectors. The ferrite grain structure analysis was performed using Leica software LAS v4.9 using a specific feature for dual-phase analysis. In both cases of pearlitic ferrite and proeutectoid ferrite, at least three images are measured to ensure the statistical significance (with grain count > 1000). Then, the datasets are combined, and arithmetical averages are calculated with standard deviations.
3. Results
3.1. Characterization of Initial Microstructure
In order to study the microstructure development and the influences of Mn and Si, we first characterize the starting condition of the materials. This was performed on hot-rolled (Figure 2) and partially on cold-rolled recrystallized materials. The phases present in the microstructures are ferrite and pearlite.
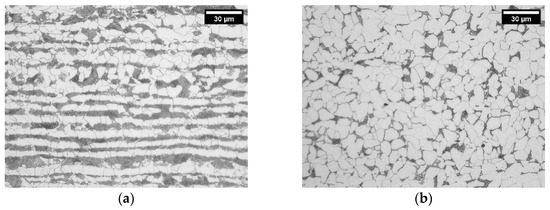
Figure 2.
Microstructures of nonhomogenized hot-rolled materials of alloys 1.0Si2.0Mn (a) and 1.0Si0.1Mn (b) showing pearlite–ferrite structure. The micrographs show RD–ND sections.
The materials were characterized regarding the second phase content, ferrite structure and microchemical segregation. Despite having the same overall C content, hot-rolled materials exhibit a significant variation in their volume fraction of pearlite (see Figure 2 and Table 2). High-Mn alloys have more than twice the fraction of pearlite found in low-Mn alloys. This trend is observed for both homogenized and nonhomogenized materials. Based on the pearlite (VP) and ferrite (Vα) volume fractions, we calculate the carbon content in pearlite (CP wt%) using following dependency:
where Calloy (wt%) is the overall carbon content, and we neglect the carbon content in ferrite (Cα).
Table 2.
Quantification of pearlite fraction (VP) of the hot-rolled microstructures measured on parallel (RD–ND) sections to rolling directions. Nonhomogenized and homogenized materials are compared. The carbon content in pearlite (CP) is calculated based on the observed volume fraction of pearlite and the overall carbon content in the alloy, neglecting the carbon content in ferrite. SD is the standard deviation.
There are two possible explanations for this difference between the high- and low-Mn microstructures: (a) a higher cementite content in pearlite in low-Mn alloys and/or (b) the presence of grain boundary cementite in low-Mn alloys. In order to confirm either hypothesis, we analyzed pearlite in both sets of alloys. Examples of pearlite in the alloys 1.0Si2Mn and 1.0Si0.1Mn are shown in Figure 3a,b. Pearlite in the high-Mn alloy (Figure 3a) has a typical morphology for pearlite with some signs of degeneration, which is not uncommon in steels containing Mn [58,59]. The low-Mn alloy pearlite (Figure 3b) looks different, with changing pearlite lamellae thickness from the boundary towards the center of the colony. In some areas, the plates connect and form continuous boundary cementite. The qualitative evaluation also points toward a higher fraction of cementite in low-Mn pearlite than in high-Mn pearlite, therefore confirming both hypotheses as a cause of a lower fraction of pearlite in low-Mn alloys.
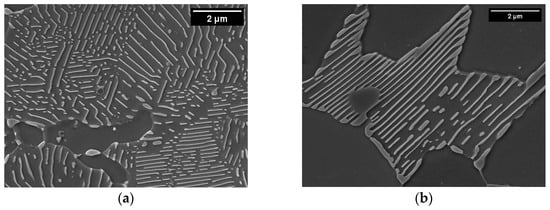
Figure 3.
SEM micrographs of pearlite in hot-rolled alloys 1.0Si2Mn (a) and 1.0Si0.1Mn (b). In both images, the width is 10 μm.
An example of the measured microsegregation is shown for the 0.4Si2Mn composition in Figure 4. The cosegregation of Mn and Si is seen within enriched bands. Figure 4 also shows the distributions of the equilibrium temperatures for phase transitions, calculated for ortho- and paraequilibrium. As with previously reported cases, we also observe that high-alloyed bands coincide with pearlite bands, while low-alloyed bands are mostly ferritic [60,61].
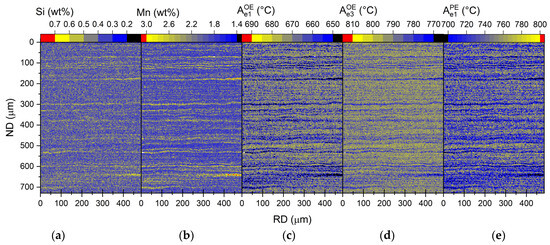
Figure 4.
Segregation of Si (a) and Mn (b) in 0.4Si2Mn hot-rolled sample as well as local (c), (d) and (e) temperature maps as calculated using Thermo-Calc with orthoequilibrium (OE) (c,d) and paraequilibrium (PE) (e) based on local chemistry [26]. The images show combined maps measured at ¼ and ½ thickness together from ND–RD sections. The combined area of the scans is 0.75 mm × 0.47 mm, with a step size of 1 μm.
The measured values for microsegregation are reported in the form of the mean value (Avg), standard deviation (SD), standard error (SE) and concentration of high- and low-alloyed (HA and LA) regions in Table 3. The average value is an indication of the homogeneity on a mesoscale, and since values for combined one-quarter and one-half thickness areas (Table 3) are close to or the same as the ICP-OES results (Table 1), we assume they are homogeneous in that respect. Usually, the standard deviation is used as an indication of the measurement accuracy. In our case, the spread within the dataset is a feature of the segregation. Therefore, as an indication of the statistical accuracy of the average value, we use the standard error. The reported values are far lower (range of 10−4 wt%) than the calculated standard deviations. The error of each point value is therefore set as a 0.1 wt% for Mn and a 0.02 wt% for Si. The reason we do not report the segregation values of Si for the 0.1Si2Mn alloy and of Mn for low-Mn alloys is that these are below the detection limit.
Table 3.
Summary of microsegregation data analysis (wt%). Due to the detection limit 0.1 wt% of each element, the measurements for 0.02 wt% of Si and 0.1 wt% of Mn are not available. Low-alloyed (LA) and high-alloyed (HA) region element concentrations are shown for ¼ and ½ thickness scans.
In the analysis, we distinguish between the one-quarter and one-half thickness data to account for centerline segregation [22]. The segregation of Mn at one-quarter thickness appears to be lightly influenced by the overall concentration of Si in each alloy. The difference in the concentration of Mn between the low- (about 1.5 wt% of Mn) and high- (about 2.6 wt% of Mn) alloyed bands within the same alloy is ΔMn = 1.1 wt% for all the studied alloys. At one-half thickness, we observe larger differences, as the ΔMn varies between a 1.2 and 1.5 wt%, of which the latter value is measured for the alloys 0.1Si2Mn and 1.9Si2Mn (Table 3). These differences can be attributed to the higher Mn concentration in HA regions, since the LA regions are comparable (1.4–1.6 wt% of Mn in Table 3). The Si segregation, on the other hand, shows some difference in relation to the presence of Mn. When comparing alloys with a low and high Mn content and the same overall Si level, the values are only similar in alloys with an overall 0.4 wt% Si content (ΔSi = 0.2 wt%). For the other alloys, the low-Mn alloys show an ΔSi = 0.3 wt%, while high-Mn alloys have an ΔSi = 0.5 wt% (Table 3). These trends are similar in the cases of one-quarter and one-half thickness measurements.
The experimental data on segregation are further compared with data obtained from Thermo-Calc and Sheil solidification simulation with the TCFE11 database [26]. As an indicator of the segregation behavior, the partition coefficients are calculated for experimental and simulated data (see Figure 5A–C). In the case of the experimental data, the LA regions are taken as solid (SS wt%) and the HA as liquid (SL wt%) compositions. The following equation is used from Ref. [16] to calculate the partition coefficients:
where x = (Mn, Si). The partition coefficients of the simulated data are shown as the average and standard deviation of the transformation range (i) when δ-ferrite and liquid are present () and (ii) when austenite and liquid are present (). A comparison between the calculated and experimental values of kSi (Figure 5A,B) shows that they are quite similar, but in the alloys with 0.1 wt% of Mn, a different trend is found: in the case of the experimental data, the degree of segregation lessens (so the partitioning coefficient increases) with the increase in the overall Si content, whereas the calculated values are almost constant throughout the examined composition range. The calculated parameters are the same regardless of whether the solid phase formed is δ-ferrite or austenite. The addition of Mn lowers the Si partition coefficients (Figure 5A,B). Also, the trends in the Si partition coefficients are changing with increased Mn concentrations: while the Si partition coefficient between δ-ferrite and liquid is almost constant in alloys with an overall Si content lower than 1.9 wt%, in the same Si range, it is consistently increasing between austenite and liquid. Within alloys with an overall Si content higher than 1.9 wt% of Si, in both cases, there is a higher variation in the partition coefficients dependent on the temperature (indicated by the higher standard deviation). The experimental partition coefficients coincide with the calculated ones in most cases. When considering the trends for the alloys with 2 wt% of Mn, the Si partition coefficient at one-quarter thickness () follows the trend of closely, while follows the trend of , although there are some deviations. This indicates that in the case of the studied alloys, the center band segregation, typically at one-half thickness, takes place after the peritectic reaction is finished. An exception is found for the alloy 1.9Si2Mn, where the partition coefficient at the center is lower than at one-quarter thickness. The same crossover is seen for the calculated partition coefficients but at a higher overall Si content (Figure 5B).
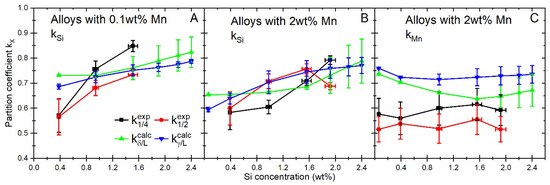
Figure 5.
Average partition coefficients kSi (A,B) and kMn (C) during the solidification of 0.1 and 2.0 wt% Mn alloys estimated with Sheil solidification simulation in Thermo-Calc 2020, calculated for δ-ferrite/liquid () and austenite/liquid () during solidification [26], and measured values at ¼ () and ½ thickness () areas.
The calculated Mn partition coefficient between austenite and liquid () does not seem to be affected significantly by the presence of Si (see Figure 5C). In this case, the only significant change in the Mn partition coefficient can be observed when the overall Si concentration changes from 0.06 to 0.4 wt% of Si in the alloy (ΔkMn = 0.05). Otherwise, the Mn partition coefficient does not change with the silicon concentration. The partition coefficient decreases with an increasing Si content. As with the calculated kSi, for the alloys with an overall content of 1.9 wt% of Si and higher, the depends on the temperature, as indicated by the quite large standard deviation. A comparison between the simulated and experimental partition coefficients shows that the experimental segregation is higher than the calculated, although the trends seem to be consistent. The error bars of the experimental coefficients are too large to indicate if the experimentally obtained partition coefficients at one-quarter and one-half thicknesses correspond more to δ-ferrite/liquid or austenite/liquid partitioning.
Since the transformation is studied in the materials that were cold rolled and afterwards underwent heat treatment, we cannot assume the hot-rolled ferrite grain structure as the initial grain structure. Instead, the recrystallized microstructure is considered. Figure 6 shows the microstructure of ferrite and pearlite in the partially recrystallized alloy 1.5Si2Mn after interrupted heating at 630 °C with a rate of 1 °C/s. It is a typical pearlite structure obtained through the recrystallization process, as shown in our previous study on the same alloys in Ref. [62]. The ferrite grain size within pearlite colonies is found to be between 0.5 and 1.0 μm in diameter (Figure 6a). The cementite morphology was modified during the heating process and appears to be spheroidized at the end of recrystallization as shown in Figure 6b.
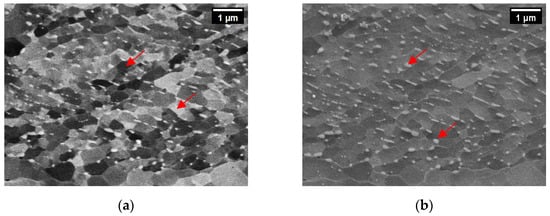
Figure 6.
Ferrite grain structure within cold-rolled and partially recrystallized 1.5Si2Mn steel after interrupted heat treatment of heating at a 1 °C/s rate with 10% ferrite recrystallized fraction. Within the field of view is a pearlite colony. Micrographs show (a) crystal orientation contrast and (b) morphology. The image width is 6.7 μm. Arrows are showing ferrite grains in cold-rolled and partially recrystallized pearlite regions (a) and cementite (b).
The proeutectoid ferrite structure was investigated as well after the recrystallization finished in the case of a heating rate of 1 °C/s. The ferrite grains appear to have a similar shape and have an average size of ~5 μm (see Table 4). We assume that the ferrite structure just before transformation is comparable for all alloys and therefore, we will assume that it is not influencing the transformation temperatures.
Table 4.
Grain size analysis of the fully recrystallized proeutectoid ferrite before transformation to austenite at a heating rate of 1 °C/s. Data from previously published experiments in Ref. [62].
3.2. Ferrite/Pearlite-to-Austenite Transformation
The bulk of the research regarding the transformation upon heating was performed using dilatometry. The results of the measurements are presented in Figure 7 for both homogenized and nonhomogenized alloys. Thermodynamic calculations are used to aid the understanding of the roles of Mn, Si and microsegregation on the measured transformations during heat treatments [24]. In this analysis, orthoequilibrium (OE) as well as paraequilibrium (PE) are considered. We include measurement errors of the ICP-OES in the OE and PE error values, although they appear smaller than the symbol sizes in Figure 7. The results are shown as the transformation temperatures, and , where is defined as the start of the transformation from ferrite/pearlite to austenite, and is the finish of the transformation of cementite to austenite [20]. In the case of 2 wt% of Mn steels, there is a marked difference between the experimentally observed and the calculated orthoequilibrium value, with the OE transformation start temperatures being about 60 °C lower than the measured ones. The gap becomes bigger with an increasing Si content. The difference between the calculated and experimentally measured becomes larger with an increasing Si content as well, which is the case for both the ortho- and paraequilibrium conditions. On the other hand, when the experimental temperatures are compared to the calculated based on paraequilibrium, there is quite good agreement for both the homogenized and nonhomogenized materials (see Figure 7a–c). The low-Mn steels, on the other hand, show quite good agreement between the calculated based on orthoequilibrium and the , irrespective of the heating rate, with small exceptions. The PE-based temperatures are, on the contrary, lower than the measured ones, depending on the Si concentration, by about 60–100 °C (see Figure 7d–f). For low-Mn alloys, the differences between calculated and measured A3 temperatures are more pronounced and increasing with an increasing Si content. An exception is the series of low-Mn alloys that are heated at a rate of 5 °C/s. In that case, the delay in the completion of the transformation compared to calculated temperatures is rather constant across the Si concentrations (see Figure 7f).
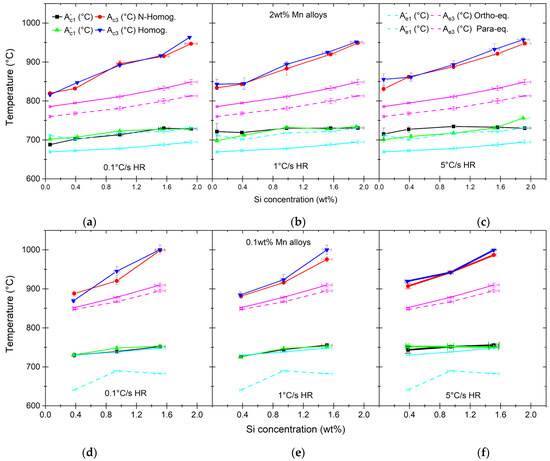
Figure 7.
Transformation temperatures measured using dilatometer with 0.1 °C/s (a,d), 1 °C/s (b,e) and 5 °C/s (c,f) heating rates. Graphs are showing alloys with 2.0 wt% of Mn (a–c) and 0.1 wt% of Mn (d–f) and various Si concentrations. Both homogenized and nonhomogenized materials are measured. Presented as well are equilibrium transformation temperatures calculated under OE and PE assumptions with Thermo-Calc [26].
It is surprising that the measured temperature corresponds closely to the orthoequilibrium transition temperature in the case of the 0.1 wt% Mn alloys, whereas the measured temperature corresponds closely to the paraequilibrium transition temperature in the case of the 2 wt% Mn alloys. Therefore, we decide to perform additional examinations of our alloys with respect to the composition of pearlite and partitioning of elements between ferrite and cementite. The EDS maps of a pearlite colony in the 1.5Si0.1Mn nonhomogenized hot-rolled material are shown in Figure 8a–c. There is a clear redistribution of Si between the cementite and ferrite. The cementite has a very low or zero concentration of Si, with the signal being in most cases below the detection limit. The ferrite within pearlite colonies seems to have a slight enrichment of Si when compared with polygonal ferrite. The same is the case for α/α grain boundaries.
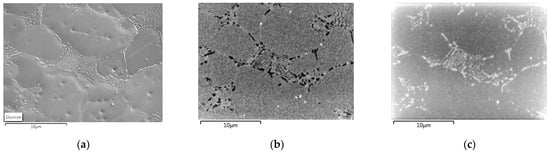
Figure 8.
High-resolution EDS maps of pearlite in 1.5Si0.1Mn alloy showing SE image (a), Si (b) and C (c) maps. Map width is 25.6 μm and the step size of Si and C maps is 100 nm.
To further investigate the redistribution of elements in the different materials, we performed a quantitative analysis of the 1.9Si2Mn and 1.5Si0.1Mn alloys, both homogenized and nonhomogenized. The results are shown as the average of point measurements in different phases in Table 5. In all cases, the redistribution of alloying elements between cementite and ferrite within the pearlite was observed. In the case of the nonhomogenized samples, it needs to be understood that most pearlite is located in high-alloyed bands, and therefore, the composition might differ from the average composition. Similarly, in the case of low-Mn alloys, pearlite is located in low-alloyed bands and therefore will contain lower concentrations of Si than average. The redistribution of Si and Mn in low-Mn alloys between the ferrite and cementite is obvious, where cementite contains very little to no Si. The change in the composition of cementite in the high-Mn alloy, 1.9Si2Mn, is less severe. In that alloy, cementite contains 1.6 wt% of Si, which is only 0.4 wt% less than the average concentration. The content of Mn is changing more. It increases to levels above 6 wt% in cementite. Similar distributions are observed in nonhomogenized alloys. When looking at these results, the reason becomes clear for the better correspondence between the experimentally observed and the temperature for OE than for PE in the case of the low-Mn alloys. The pre-existing redistribution of Si between the cementite and ferrite makes the cementite thermodynamically stable at higher temperatures, setting the beginning of transformation at a higher temperature than predicted by PE calculations [63].
Table 5.
Quantitative results of composition measurement of cementite (θ), pearlitic ferrite (αP) and ferrite (α). The partitioning coefficients kα/θ are shown for partitioning of Mn and Si between αP and θ. The measurement error for Mn is 0.07 wt% and Si is 0.01 wt%.
In order to evaluate the influence of Si and Mn on the start and progress of the transformation, we compare the measured and from dilatometer measurements and the temperatures based on the overall chemical compositions. Previously, we concluded that in case of low-Mn alloys, the transformation temperatures match better with the OE-calculated temperatures, and high-Mn alloys follow the trend of PE-calculated temperatures (Figure 7). Hence, we use OE- and PE-calculated temperatures in the subsequent comparison with low- and high-Mn alloys, respectively. The following quantities are defined as a quantification of the temperature range for the transformation:
The results of the calculations are shown in Figure 9a–f. The start of the transformation seems to be matching with the theoretical temperatures quite well, especially when samples are heated at 0.1 °C/s. The only exception is the alloy 0.1Si2Mn, where the transformation seems to start earlier than indicated by PE calculations. Other alloys are within a ±10 °C range. An increase in the heating rate to 1 °C/s delays the start of the transformation, which is more pronounced in the case of high-Mn alloys. The overall trend remains similar to the one with heating rate of 0.1 °C/s though. The most noticeable difference is with the increase in the heating rate to 5 °C/s. In both low- and high-Mn alloys, in most cases, the transformation starts later than indicated by thermodynamic calculations. The overall trends are changing though. This can be an indication of the more important role of segregation and the kinetics at the start of transformation.
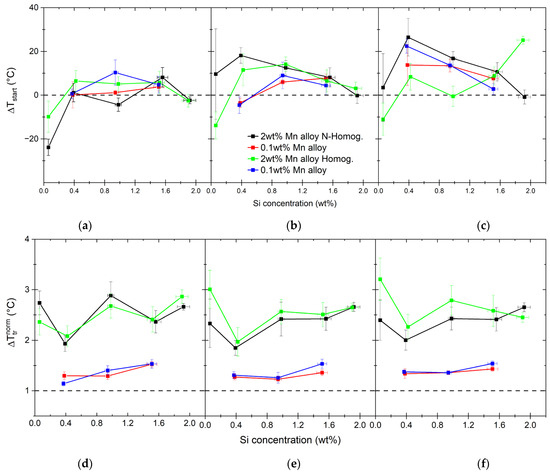
Figure 9.
Differences between measured () and calculated () at the beginning of the transformation upon heating, with difference rates shown as (a–c). The range of the measured transformation is shown as normalized values by the calculated transformation range (d–f).
The transformation range normalized by the calculated transformation range is shown in Figure 9d–f. This representation is more indicative of the growth of austenite. A distinct influence of Mn is seen. Irrespective of the heating rate, the temperature range over which the transformation takes place is 2–3× longer for high-Mn alloys than predicted and 1.0–1.5× longer for low-Mn alloys. The content of 2.0 wt% of Mn delays either the austenite nuclei density or the austenite grain growth. As indicated by the measured recrystallized ferrite grain size (see Table 4), in the case of low-Mn alloys, we should have a slightly smaller density of potential nucleation sites. The fraction of pearlite is also smaller (see Table 2) for low-Mn alloys, so the density of potential nucleation sites at the start of transformation should be lower than for high-Mn alloys. This seems to be indicative of the strong influence of Mn on the solute drag during the ferrite/pearlite-to-austenite transformation. Similar conclusions on the solute drag effect of Mn were drawn in Refs. [33,41,64,65]. To learn more about the roles of Si, Mn and their interaction on the reverse transformation, we study the nucleation in more detail in the following sections.
3.3. Nucleation
The classical nucleation theory describes the steady state nucleation rate for each nucleation type and can be expressed as [66,67]:
where j denominates the type of nucleation site; Nn is the number density of potential nucleation sites ; Z is the Zeldovich factor representing the thermally activated growth of subcritical nuclei, which is assumed to be constant; T is the temperature ; k is the Boltzmann constant ; h is the Planck constant ; and QD is the activation energy for the iron self-diffusion in ferrite ( [18]). The last parameter is the activation energy for nucleation , which can be calculated by [67,68,69]:
where the parameter ψ contains information about interface energies and the shape of the nucleus and is estimated to be for austenite nucleation, with the estimated number of special orientation relationships as between austenite and ferrite [68]; is the Gibbs free energy for the newly formed phase ; and is misfit strain energy between the nuclei and matrix . The influence of the chemical composition on the nucleation can be assessed by and . The nucleation is dependent on the nucleation activation energy and temperature as follows:
where the total number of activated nuclei is proportional to the driving force and misfit strain energy.
3.3.1. Nucleation Start Composition
As a first step in determining the influence of segregation on the nucleation, we determine the Mn–Si compositions for which the nucleation starts, on the basis of the compositional maps and thermodynamic calculations using the Thermo-Calc TCFE11 database [26]. As with the previous calculations, we assume PE conditions for high-Mn and OE conditions for low-Mn alloys. We also differentiate between homogenized and nonhomogenized materials, where we assume that the homogenized materials are indeed homogeneous in composition. In the case of nonhomogenized materials, we use the EDS composition maps and calculate the local transformation temperatures (for example, see Figure 4). Included in the transformation temperature assessment process is the changing C content in the austenite during transformation. As a maximum level of C in the austenite, we assume the carbon concentrations calculated based on the pearlite content (see Table 2). In the evaluation, this level is used for the estimation until the overall austenite C concentration is lower. This assumption is based on the fact that the start of the transformation to austenite will initiate in pearlite, as suggested by previous research, due to the readily available C from dissolving cementite [70,71,72,73]. The resulting temperature maps are used to determine the Mn and Si concentrations at the start of the transformation. The detection limit of the dilatometer is estimated to be 3 vol% of newly formed austenite (see Figure 1). Hence, in the case of the calculated , we use the same level of 3 vol% to identify the start temperature detected using dilatometer experiments. The measured transformation temperatures and the estimated Mn and Si concentrations are used for nucleation modeling. Since we use OE conditions for low-Mn alloys, we assume the Si to be partitioned between cementite and ferrite in the pearlite, as confirmed by EDS measurements (see Table 5). The measured Si and Mn concentrations are compared with calculated OE concentrations and are found to be within a 0.1 wt% deviation. The Si content in θ is 0 wt% in orthoequilibrium, while the Mn concentration is 0.40–0.47 wt%. The high-Mn alloys show partitioning of both Mn and Si. Using the calculated partition coefficients for Mn and Si between α and θ (Table 5), we estimate the redistribution of elements between the phases in pearlite. The summary of the parameters for the driving force for nucleation is shown in Table 6.
Table 6.
Summary of the input parameters for calculating the driving force () for the transformation based on the overall chemical compositions for homogenized materials, compositions deduced from individual composition maps for nonhomogenized materials and individual transformation temperatures as measured by dilatometry. The values in grey cells are averages since the concentrations are too low to measure with EDS.
3.3.2. Driving Force for Austenite Nucleation
The Gibbs free energy for all low-Mn alloys is estimated by calculating the chemical potentials of systems with the same overall chemical compositions by including ferrite, cementite, austenite or only ferrite and cementite at the temperatures indicated in Table 6. The chemical potentials for all alloying elements in the system are calculated using Thermo-Calc with the TCFE11 database [26], and are then used to calculate the Gibbs free energy with a given composition of austenite by [74]:
where is the driving force for the formation of the new phase ; are chemical potentials for parent phases (pearlite), while and are chemical potentials and molar fractions of i = (Fe,Mn,Si,C) in the new phase (austenite). The result is the driving force for nucleation of austenite formation from pearlite under OE conditions.
The method for calculating Gibbs free energy for austenite nucleation under PE conditions for high-Mn alloys at the temperatures indicated in Table 6 [63] is the parallel tangent method [75]. An example of such a construct is shown in Figure 10, with the maximum driving force () and driving force calculated for the pearlite composition () indicated in the graph. For Mn–Si combinations at which the nucleation starts, we assume the carbon content in austenite to be equal to the average carbon concentration in pearlite. While calculating the driving force, in the case of high-Mn alloys, the maximum appears at a different C content. The results of this analysis are shown in Figure 11a–c. In the case of high-Mn alloys, the C content increases significantly above the C content of pearlite. With the 1.9 wt% Si alloy content, the carbon content of nuclei reaches a value of ~2.6 wt% of C. For low-Mn alloys, the C content of austenite nuclei is lower than the pearlite content and oscillates around 0.75 wt% of C, which is closer to the equilibrium C content of pearlite [76].
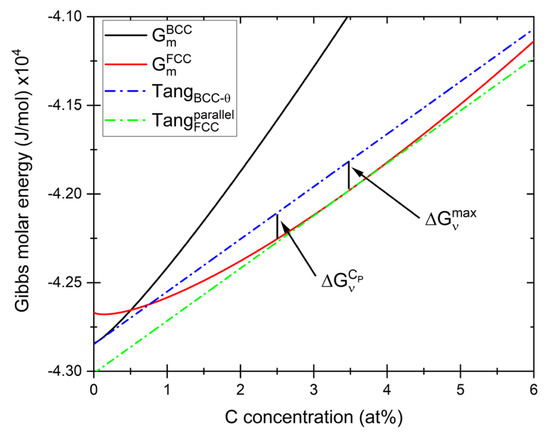
Figure 10.
Construction for obtaining the maximum driving force () and driving force for carbon content of pearlite () for the nucleation of austenite as calculated under paraequilibrium conditions using molar Gibbs energy obtained from Thermo-Calc [26]. Presented graph shows calculations for 0.4Si2Mn alloy homogenized and heated at 0.1 °C/s and therefore calculated at 702 °C.
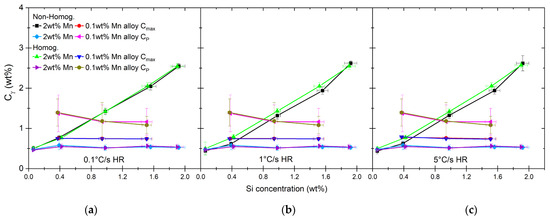
Figure 11.
Concentrations of carbon in austenite during nucleation as calculated for maximum driving force for nucleation, shown with carbon concentrations of pearlite as shown in Table 2 (a–c).
The results of the calculations for the maximum driving force () are shown in Figure 12a–f, including, in the case of high-Mn alloys, the driving force calculated for the pearlite composition. In the case of alloys with a low overall Si content (0.1 and 0.4 wt% of Si), there is little difference between the calculated driving forces for homogenized and nonhomogenized materials (see Figure 12a–c). In the case of low-Mn alloys, the situation is quite different. The driving force is calculated under OE assumption (see Figure 12d–f). The calculated values are very low, and in many cases, seem to be negative, which would prevent nucleation. Considering the calculation uncertainty, it is likely that negative values are due to the inaccuracies in both dilatometry and chemical composition measurements. Higher accuracy, especially of the former, is needed for better determination of the transformation start temperature.
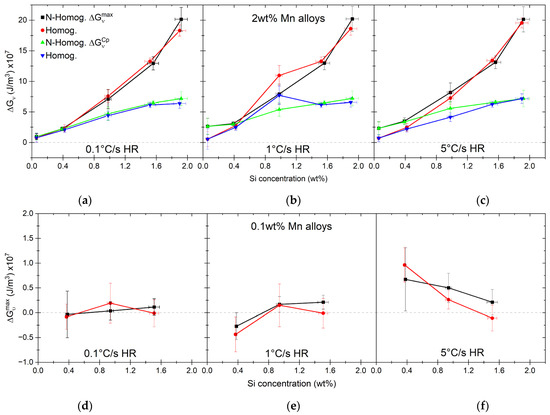
Figure 12.
Driving force for austenite nucleation calculated for high-Mn alloys under PE conditions (a–c) and for low-Mn alloys under OE conditions (d–f).
3.3.3. Strain Energy of Austenite Nucleation
The next step in evaluating the influence of Si and Mn on the nucleation is the strain energy (). The elastic strain energy can be calculated depending on the shape of the nuclei based on equations from Refs. [75,77,78]. The equation describing the case of ellipsoidal precipitates is as follows:
where μmx is the shear modulus of the matrix ; δ is the misfit due to the volumetric difference between precipitate and matrix; and E(c/a) is a function for elastic energy of the precipitate dependent on its shape, with c being polar and an equatorial diameter. The volumetric misfit can be calculated from the atomic volumes of the precipitate and matrix:
where Vppt and Vmx are the atomic volumes of the precipitate and matrix, respectively. In the present study, the precipitate phase is austenite (γ) and there are two matrix phases: ferrite (α) and cementite (θ). Hence, we calculate misfits γ/α and γ/θ separately. The atomic volumes for all three phases are calculated, taking into account both the individual compositions and thermal expansion as well. The parameters for calculating ferrite and austenite atomic volumes are taken from Refs. [79,80,81]:
where is atomic fraction of element i with i = (C,Mn,Si); and T is the temperature in K. The data for the influence of substitutional elements on the lattice parameters of cementite are limited. Some experimental data are available showing the changes due to Mn [82,83,84,85], but there are no experimental data for the Si substitution of Fe. Since, in the case of high-Mn alloys, the concentration of Si in cementite is significant, we estimate the effect of Si from the first-principle calculations [86,87,88,89,90]. Si and Mn affect all three lattice parameters differently, leading to a combined equation for the atomic volume:
The C concentrations of both cementite and ferrite are known. We consider two border cases for the C concentration in the austenite nuclei, the first indicated by the maximum driving force and the second by the average carbon content of pearlite. As a first step in calculating the volumes of individual phases, we calculate the atomic fractions of each phase needed for the formation of an austenite nucleus, with a given chemical composition. We use, in this case, mass conservation:
where A and B are the atomic volume fractions of cementite and ferrite to be transformed for the austenite nucleus to form with a given C content; and are carbon concentrations of the phases j = (α,θ,γ) . With the given atomic fractions and using the atomic volumes, we can calculate the actual proportions of the volumes of each phase transformed by:
where the transformation factor (α/θtrans) is calculated as the ratio between the atomic volume fractions of ferrite (A) and cementite (B) defined in Equation (14). The results are shown in Figure 13.
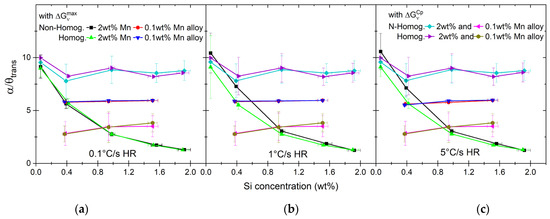
Figure 13.
Transformation factor α/θtrans calculated based on the C content of γ nuclei, atomic volumes for high- and low-Mn alloys and different heating rates (a–c).
The average Si concentration in the alloy affects the transformation factor between ferrite and cementite (see Figure 13). With the exception of the alloys 0.1Si2Mn and 0.4Si2Mn, the cementite fraction forming the austenite nuclei is higher than expected from the ferrite/cementite ratio of pearlite (α/θ = 7). The alloys 1.5Si2Mn and 1.9Si2Mn show values below 1, meaning that more cementite than ferrite transforms to austenite nuclei. This can be partly explained by the concentration of Si in cementite, which makes it less thermodynamically stable [89,91,92,93]. As shown by the composition analysis, the concentration of Si in cementite in the high-Mn alloys, although lower than in the matrix, can still be significant (see Table 5). A slight increase in the Si concentration in ferrite, at the same time, makes ferrite more stable [77,79,80,81,82,94,95,96].
As the consequence of the increase in the carbon concentration in austenite nuclei as well as of the ratios of dissolved matrix phases, volumetric changes depend on the alloy. The results of the misfit calculations with Equation (10) are shown in Figure 14. In the case of high-Mn alloys, with the increase in the overall Si content, the misfit between ferrite and austenite nuclei becomes positive, meaning that the atomic volume of austenite becomes larger than that of ferrite. At the same time, the atomic volume of cementite is much larger than that of austenite. The misfit for the low-Mn alloys, on the other hand, does not depend strongly on the Si concentration due to an almost constant C content in austenite nuclei. What is different from the case of high-Mn alloys is that δγ/α is much smaller and has values close to 0, meaning that there is only a small difference in the atomic volume between ferrite and austenite, especially for the 1.5Si0.1Mn alloy.
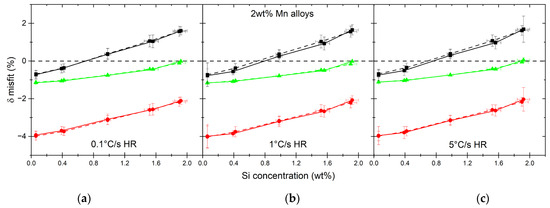
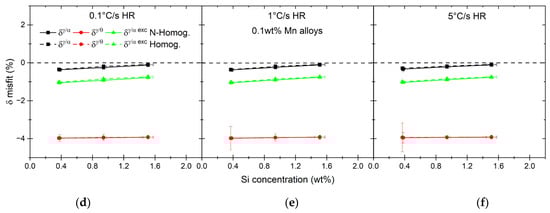
Figure 14.
Atomic volume misfits calculated between austenite and both matrix phases, ferrite and cementite as well as the excess and summary misfit in ferrite for 2.0 wt% (a–c) and 0.1 wt% Mn alloys (d–f).
The models for calculating the elastic properties of ferrite and austenite at elevated temperatures in the current work are taken from Ref. [80]. The model parameters are adjusted by fitting the model using orthogonal distance regression (Ref. [97]) to the experimental results published in Refs. [98,99,100,101,102,103]. The influence of the temperature and Mn on the lattice parameters of cementite are taken from Ref. [104]. There are no experimental data on the influence of Si on the elastic properties of cementite nor on their temperature dependence. The effect of Si on the elastic properties are therefore based on the first principle calculation results given in Refs. [87,90]. As for the effect of temperature, we consider the results presented in Ref. [104]. The authors show that, such as for properties of ferrite, there is a shift due to change in magnetic properties of cementite [80,101] occurring at the Curie temperature (TC). In the case of cementite, Mn decreases the TC by ~13 °C/at% [83,104]. The results shown in Ref. [105] indicate that Si has a similar influence on TC, both in terms of direction and magnitude. Therefore, we assume that the Si effect on the elastic properties of cementite will be the same as for Mn in terms of the temperature dependence.
Using the presented parameters, we calculate the γ/α and γ/θ strain energies with the assumption that E(c/a) = 1, which is valid for spherical precipitates (Figure 15). There are some variations in the γ/α strain energies ranging between 106 and 108 J/m3, which are in the correct order of magnitude when compared to reported values in the literature [68,106]. The influence of the chemical composition on the strain energies seems to be clear. High-Mn alloys show a minimum in the case of alloys containing between 0.4 to 1.0 wt% of Si (see Figure 15a–c). The alloys with 0.1 wt% of Mn show a constant decrease in the strain energy with the increase of Si (see Figure 15d–f). The overall values are an order of magnitude lower when compared to high-Mn alloys. As with the driving force, there are small differences between the homogenized and nonhomogenized materials. In low-Mn alloys, the γ/θ strain energy is rather constant and much higher than the strain energy between ferrite and austenite. The values for γ/θ can be 100–300× higher than those for γ/α. The strain energy between the cementite and austenite nuclei in the case of high-Mn alloys is decreasing with increasing overall Si content, which can be directly correlated with the increase in the C concentration of austenite nuclei. In the case of alloys with Si concentrations of 0.1–1.0 wt%, the strain energy of γ/θ is still much higher than the strain energy of γ/α, which can be between 30–100× higher. In the case of alloys with 1.5 and 1.9 wt% of Si, the differences between the strain energy of austenite with the two matrix phases decreases to 1.5–5×. With the exceptions of these two alloys, the strain energy causes a very high barrier for the cementite-to-austenite transformation considering the driving force magnitude (see Figure 12 and Figure 15). The main reason for these high strain energies are the calculated misfits (see Figure 14). The volumetric misfits of austenite and ferrite are rather small compared with misfits of austenite and cementite. All considered, it is plausible that the change in the austenite volume would rather be accommodated by ferrite than by cementite due to lower energetic barriers. Therefore, to evaluate the extreme values, we consider two scenarios: (1) due to δγ/α=0 and the volume change from θ→γ transformation which is accommodated by ferrite; (2) the strain is dependent on the fraction of each phase dissolved as calculated by Equation (15) and individual misfits between the γ and matrix phases. The misfits in α under conditions of case 1 are shown in Figure 14 as δγ/α exc. The change in the volume due to transformation is always negative in ferrite, although it becomes quite small with an increasing Si concentration. It influences the resulting strain energy, which in case 1 is and in case 2 is . The comparison of the two extremes of strain energy and driving force for nucleation is shown in Figure 16.
Figure 15.
Strain energy calculated for high-Mn alloys (a–c,g–i) and low-Mn alloys (d–i) showing strain energy between the newly formed austenite nuclei and dissolving phases, ferrite ( (a–f)) and cementite ( (g–i)).
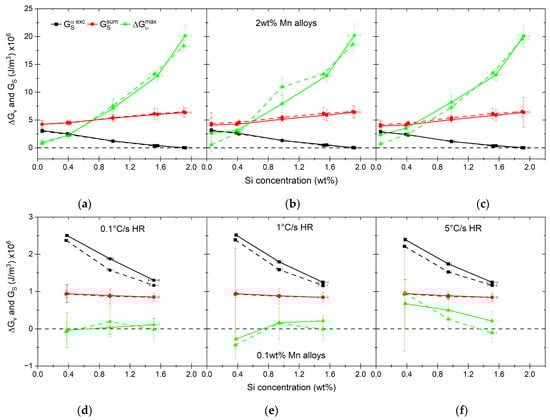
Figure 16.
Comparison of driving force for austenite nucleation () and strain energy (GS). Alloys with 2.0 wt% of Mn are shown in graphs (a–c) and alloys with 0.1 wt% of Mn are shown in graphs (d–f).
The condition that needs to be met for nucleation to take place is . The values shown in Figure 16 indicate that this is the case for high-Mn alloys with an Si content higher than 1.0 wt% for all heating rates. In the case of alloy 0.4Si2Mn, the nucleation can take place if we assume the volume change is accommodated by ferrite, minimizing the strain energy. The same condition makes the nucleation possible for low-Mn alloys, where the values are similar to the values considering their uncertainty. For the alloys with a strain energy higher than the driving force for nucleation, we reconsider our assumptions for the parameters used here: (1) the shape of the nuclei, and therefore, the value of ; (2) possible difference in the carbon content of austenite nuclei.
Previously, we assumed the nuclei shape to be spherical, for which = 1. As shown in previous studies, the value of strongly depends on the properties of the nuclei versus the matrix [75,78,107,108,109]. In order to evaluate which alloys in our case are more sensitive to the nuclei shape and its influence on strain energy, we first calculate the minimum value of for the following condition to be met:
The results are shown in Figure 17. For all heating rates, the low-Mn alloys have values in the range of 0.02–0.15, but considering large uncertainties, it is difficult to estimate the nuclei shape. The values of for the high-Mn alloys with 0.1, 0.4 and 1.0 wt% of Si are below or close to 1, indicating that a disk shape is preferable in those cases. The nucleus shape in the alloy 1.0Si2Mn should be more disk-like if we consider the mix of the strain energy. In the case of volume change being accommodated by ferrite, the GS is small enough to allow for any shape of the nuclei.
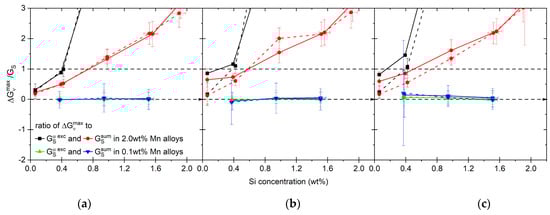
Figure 17.
Ratio between driving force () and strain energy (GS), indicative of the maximum value of function needed for the nucleation of austenite from pearlite under studied conditions. The different heating rates are shown, namely 0.1 °C/s (a), 1 °C/s (b) and 5 °C/s (c).
Recent work by Böhm et al. [108,109] defines a shape factor H(c/a) based on the work of Eshelby [110], which in essence is the function in our work. Using the methodology presented in Ref. [108], we calculate the values of this function for γ/α and γ/θ using the elastic properties of all phases at elevated temperature. The resulting values are shown in Figure 18. In all cases, the E(c/a) function for γ/α indicates a slight preference for disk-shaped nuclei, unlike γ/θ (Figure 18d,e). The shape of the nuclei formed from cementite shows a shift from spherical to disk shaped (Figure 18e). This shift occurs at an overall 1.0 wt% of Si content, where the value of the function for any shape is close to 1. The increase in the overall Si content seems to be decreasing the minima of the E(c/a) when ferrite is the matrix phase (Figure 18d). The minimum decrease from 0.97 for the 0.1Si2Mn alloy to 0.87 for the 1.9Si2Mn alloy. When compared with the values that are needed for the nucleation to start as shown in Figure 17, the E(c/a) calculated for our alloys are not enough to explain the occurrence of the nucleation, especially in the alloy 0.1Si2Mn.
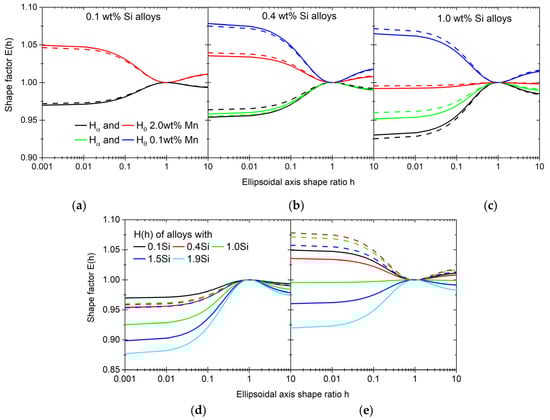
Figure 18.
Shape factors calculated for γ/α and γ/θ pairs. Comparison between high- and low-Mn alloys for alloys with 0.1 (a), 0.4 (b) and 1.0 wt% of Si (c) as well as 0.1 (continuous lines) and 5 °C/s (dashed lines) heating rates. Shape factors for different levels of Si with ferrite (d) and cementite matrixes (e) for a 0.1 °C/s heating rate and high- (straight lines) and low-Mn alloys (dashed lines).
The second scenario we are testing to explain the occurrence of the nucleation is the variation of the C concentration in the newly formed austenite nuclei. The C content of austenite nuclei is initially derived from the maximum of the chemical driving force (). It influences the lattice parameter of austenite and its elastic properties. Therefore, in the case of high-Mn alloys with 0.1–1.0 wt% of Si heated at 0.1 °C/s, by varying the C content in austenite, we determine if the nucleation is possible with given conditions. The results are shown in Figure 19.
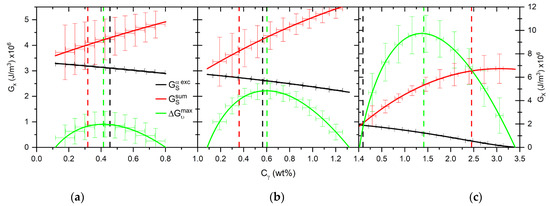
Figure 19.
Chemical driving force and strain energies calculated for alloys 0.1Si2Mn (a), 0.4Si2Mn (b) and 1.0Si2Mn (c) dependent on the C content in austenite nuclei at 0.1 °C/s heating rate.
The changes in the chemical driving force and strain energy due to change in the nuclei C content in the alloys 0.1Si2Mn and 0.4Si2Mn at a 0.1 °C/s heating rate are still insufficient to explain the start of transformation. In contrast, the energies calculated for the alloy 1.0Si2Mn shows the nucleation is possible to start with a relatively large range of C concentrations (0.02–2.45 wt% of C). Since the C concentration influences elastic properties, the only change in this case is the change in the shape of the γ nuclei forming from θ from disk to spherical, which occurs at a C concentration of 0.90 wt% of C in austenite nuclei.
4. Conclusions
The alloying of the steel with Si or a combination of Si and Mn has a clear impact on the nucleation and transformation process in presented alloys. Starting with the segregation, there is a clear dependence of the partition coefficient on the overall concentrations of Mn and Si in the alloys (Table 3). The addition of 2.0 wt% of Mn seems to slightly change the microsegregation levels of Si, while Mn is not significantly affected by the addition of Si (Figure 5). The presence of Mn changes the way the austenite forms. This is evident by the value of , which in the case of low-Mn alloys, match orthoequilibrium temperatures, while high-Mn alloys match better with paraequilibrium temperatures (see Figure 7). Also evidenced by the dilatometer results, the austenite growth is much slower with the addition of 2.0 wt% of Mn (see Figure 9).
When considered in detail, the roles of Si and Mn in the nucleation of austenite from pearlite are complex. The addition of Mn allows for the presence of Si in cementite (see Table 5). This in turn affects the way the pearlite transforms and the austenite nuclei form. As a consequence, with the addition of Si in high-Mn alloys, the austenite nuclei carbon concentration increases significantly (see Figure 11). The calculated volumetric misfit is affected by this as well (see Figure 14). With the increase in the C content in austenite nuclei, the transformation seemingly results in an expansion instead of a decrease in volume.
The classical nucleation theory that is used in the present work accounts for the chemical driving force and strain energy between the austenite nucleus and both matrix phases. The present work shows that some results can be explained with the classical nucleation theory. The results in the case of low-Mn alloys and high-Mn alloys with 0.1 and 0.4 wt% of Si are ambiguous and need further consideration. The high-Mn alloys with Si concentrations higher than 1.0 wt% show , even with the assumption of a spherical shape of the nuclei (see Figure 17). The alloys with lower Si concentrations and the low-Mn alloys both need nuclei shapes to be more disk-like for the nucleation to happen (see Figure 18). An independent calculation of the shape factor does not support this conclusion though (see Figure 18). A more detailed study of the strain energy and nuclei shape should be conducted in those cases.
Author Contributions
M.K.: conceptualization, methodology, validation, formal analysis, writing—original draft preparation and visualization. S.E.O.: conceptualization, methodology, validation, writing—review and editing, supervision, project administration and funding acquisition. J.S.: conceptualization, validation, writing—review and editing, supervision, project administration and funding acquisition. D.N.H.: conceptualization, validation, writing—review and editing, supervision, project administration and funding acquisition. All authors have read and agreed to the published version of the manuscript.
Funding
This research was funded by Tata Steel Europe BV and Delft University of Technology.
Data Availability Statement
All data are contained within the article and in the Ref. [62].
Acknowledgments
We would like to give our thanks to Tata Steel BV and Delft University of Technology for funding the presented research. The authors would like to acknowledge the helpful discussions and help with experimental work from the following people: R. Huizenga, J. Galan Lopez, R. Brandon and T. Phan Tran.
Conflicts of Interest
Authors Monika Krugla and Dave N. Hanlon were employed by the company Tata Steel Europe BV. The authors declare that this study received funding from Tata Steel Europe BV. The funder had the following involvement with the study: internal screening process for industrially sensitive information.
References
- Matlock, D.; Speer, J.; De Moor, E.; Gibbs, P. Recent Developments in Advanced High Strength Sheet Steels for Automotive Applications: An Overview. Jestech 2012, 15, 1–12. [Google Scholar]
- Gibbs, P.J.; De Moor, E.; Merwin, M.J.; Clausen, B.; Speer, J.G.; Matlock, D.K. Austenite Stability Effects on Tensile Behavior of Manganese-Enriched-Austenite Transformation-Induced Plasticity Steel. Metall. Mater. Trans. A Phys. Metall. Mater. Sci. 2011, 42, 3691–3702. [Google Scholar] [CrossRef]
- Allain, S.Y.P.; Pushkareva, I.; Gouné, M.; Scott, C.; Teixeira, J. Dual-Phase Steels: The First Family of Advanced High Strength Steels. Encycl. Mater. Met. Alloys 2022, 2, 37–62. [Google Scholar] [CrossRef]
- Maresca, F.; Kouznetsova, V.G.; Geers, M.G.D. Deformation Behaviour of Lath Martensite in Multi-Phase Steels. Scr. Mater. 2016, 110, 74–77. [Google Scholar] [CrossRef]
- Hasegawa, K.; Kawamura, K.; Urabe, T.; Hosoya, Y. Effects of Microstructure on Stretch-Flange-Formability of 980 MPa Grade Cold-Rolled Ultra High Strength Steel Sheets. ISIJ Int. 2004, 44, 603–609. [Google Scholar] [CrossRef]
- Hisker, F.; Thiessen, R.; Heller, T. Influence of Microstructure on Damage in Advanced High Strength Steels. Mater. Sci. Forum 2012, 706–709, 925–930. [Google Scholar] [CrossRef]
- Sun, X.; Choi, K.S.; Soulami, A.; Liu, W.N.; Khaleel, M.A. On Key Factors Influencing Ductile Fractures of Dual Phase (DP) Steels. Mater. Sci. Eng. A 2009, 526, 140–149. [Google Scholar] [CrossRef]
- Soyarslan, C.; Malekipour Gharbi, M.; Tekkaya, A.E. A Combined Experimental-Numerical Investigation of Ductile Fracture in Bending of a Class of Ferritic-Martensitic Steel. Int. J. Solids Struct. 2012, 49, 1608–1626. [Google Scholar] [CrossRef]
- Kim, J.H.; Lee, M.G.; Kim, D.; Matlock, D.K.; Wagoner, R.H. Hole-Expansion Formability of Dual-Phase Steels Using Representative Volume Element Approach with Boundary-Smoothing Technique. Mater. Sci. Eng. A 2010, 527, 7353–7363. [Google Scholar] [CrossRef]
- Battle, T.P. The Effects of Solid and Liquid-Phase Diffucion on Micro-Segregation in Castings. In Proceedings of the F. Weinberg International Symposium on Solidification Processing, Hamilton, ON, Canada, 27–29 August 1990; Lait, J.E., Samarasekera, I.V., Eds.; Pergamon: Oxford, UK, 1990; pp. 157–170. [Google Scholar]
- Emtage, P.A.; Wunnenberg, K.; Hatonen, T.; Bobadilla, M.; Llanos, J.M.; De Santis, M. Improved Control of Segregation in Contunous Casting and Hot Rolling Processes; European Commission: Brussels, Belgium, 2002.
- Bos, C.; Mecozzi, M.G.; Hanlon, D.N.; Aarnts, M.P.; Sietsma, J. Application of a Three-Dimensional Microstructure Evolution Model to Identify Key Process Settings for the Production of Dual-Phase Steels. Met. Mater. Trans. A Phys. Met. Mater. Sci. 2011, 42, 3602–3610. [Google Scholar] [CrossRef]
- Lippard, H.E.; Campbell, C.E.; Björklind, T.; Borggren, U.; Kellgren, P.; Dravid, V.P.; Olson, G.B. Microsegregation Behavior during Solidification and Homogenization of AerMet100 Steel. Metall. Mater. Trans. B Process Metall. Mater. Process. Sci. 1998, 29, 205–210. [Google Scholar] [CrossRef]
- Caballero, F.G.; García-Junceda, A.; Capdevila, C.; De Andrés, C.G. Evolution of Microstructural Banding during the Manufacturing Process of Dual Phase Steels. Mater. Trans. 2006, 47, 2269–2276. [Google Scholar] [CrossRef]
- Choudhary, S.K.; Ganguly, S.; Sengupta, A.; Sharma, V. Solidification Morphology and Segregation in Continuously Cast Steel Slab. J. Mater. Process. Technol. 2017, 243, 312–321. [Google Scholar] [CrossRef]
- Fisher, R.M.; Speich, G.R.; Cuddy, L.J.; Hu, H. Phase Transformations during Steel Production. In Physical Chemistry in Metallurgy: Proceedings of the Darken Conference; Research Lab.: Monroeville, PA, USA, 1976; pp. 463–488. [Google Scholar]
- Han, L.; Santillana, B.; Zhuang, L. Investigating the Effects of Solidus Temperature on the Analytical Microsegregation Model. J. Mater. Res. Technol. 2022, 18, 138–146. [Google Scholar] [CrossRef]
- Kučera, J.; Stránský, K. Diffusion in Iron, Iron Solid Solutions and Steels. Mater. Sci. Eng. 1982, 52, 1–38. [Google Scholar] [CrossRef]
- Al-Gahtani, M.; Dippenaar, R. Mechanical Properties of Dendritic and Inter-Dendritic Regions in as- Cast Medium-Carbon Steel. Adv. Mat. Res. 2014, 894, 104–109. [Google Scholar] [CrossRef]
- Offerman, S.E.; Van Dijk, N.H.; Rekveldt, M.T.; Sietsma, J.; Van der Zwaag, S. Ferrite/Pearlite Band Formation in Hot Rolled Medium Carbon Steel. Mater. Sci. Technol. 2002, 18, 297–303. [Google Scholar] [CrossRef]
- Ennis, B.L.; Bos, C.; Aarnts, M.P.; Lee, P.D.; Jimenez-Melero, E. Work Hardening Behaviour in Banded Dual Phase Steel Structures with Improved Formability. Mater. Sci. Eng. A 2018, 713, 278–286. [Google Scholar] [CrossRef]
- Ennis, B.L.; Jimenez-Melero, E.; Mostert, R.; Santillana, B.; Lee, P.D. The Role of Aluminium in Chemical and Phase Segregation in a TRIP-Assisted Dual Phase Steel. Acta Mater. 2016, 115, 132–142. [Google Scholar] [CrossRef]
- Wang, H.; Su, F.; Wen, Z.; Li, C. Effects of Mn and Si on the Ferrite Decarburization of Spring Steel. J. Mater. Res. Technol. 2023, 27, 363–371. [Google Scholar] [CrossRef]
- Bandi, B.; Van Krevel, J.; Nandi, S.; Husain, Z.; Srirangam, P. Effect of Manganese Bands on Austenite Formation of Low Carbon Steels in Dual Phase Steel Manufacture. Mater. Today Proc. 2021, 41, 1030–1034. [Google Scholar] [CrossRef]
- Krugla, M.; Offerman, S.E.; Sietsma, J.; Seda, P.; Hanlon, D.N. Microchemical Banding of Silicon and Manganese in Steel and Its Effect on the Microstructural Banding and Properties. Int. Symp. New Dev. Adv. High-Strength Sheet Steels 2017, 199–208. [Google Scholar]
- Andersson, J.O.H.; Hoglund, T.; Shi, L.; Sundman, B. Thermo-Calc and DICTRA. Computational Tools for Materials Science. Calphad 2002, 26, 273–312. [Google Scholar] [CrossRef]
- Gao, P.; Li, F.; An, K.; Zhao, Z.; Chu, X.; Cui, H. Microstructure and Deformation Mechanism of Si-Strengthened Intercritically Annealed Quenching and Partitioning Steels. Mater. Charact. 2022, 191, 112145. [Google Scholar] [CrossRef]
- Celada, C.; Toda-Caraballo, I.; Kim, B.; San Martín, D. Chemical Banding Revealed by Chemical Etching in a Cold-Rolled Metastable Stainless Steel. Mater. Charact. 2013, 84, 142–152. [Google Scholar] [CrossRef]
- Feng, R.; Li, S.; Zhu, X.; Ao, Q. Microstructural Characterization and Formation Mechanism of Abnormal Segregation Band of Hot Rolled Ferrite/Pearlite Steel. J. Alloys Compd. 2015, 646, 787–793. [Google Scholar] [CrossRef]
- HajyAkbary, F.; Sietsma, J.; Petrov, R.H.; Miyamoto, G.; Furuhara, T.; Santofimia, M.J. A Quantitative Investigation of the Effect of Mn Segregation on Microstructural Properties of Quenching and Partitioning Steels. Scr. Mater. 2017, 137, 27–30. [Google Scholar] [CrossRef]
- Karimi, Y.; Hossein Nedjad, S.; Miyamoto, G.; Shirazi, H.; Furuhara, T. Banding Effects on the Process of Grain Refinement by Cold Deformation and Recrystallization of Acicular C-Mn Steel. Mater. Sci. Eng. A 2017, 697, 1–7. [Google Scholar] [CrossRef]
- Verhoeven, J. Banding: Microsegregation-Induced. In Encyclopedia of Iron, Steel, and Their Alloys; Taylor and Francis: New York, NY, USA, 2016; pp. 320–330. [Google Scholar]
- Wang, J.; Guo, F.; Wang, Z.; Xie, Z.; Shang, C.; Wang, X.; Bandi, B.; Van Krevel, J.; Nandi, S.; Husain, Z.; et al. Influence of centerline segregation on the crystallographic features and mechanical properties of a high-strength low-alloy steel. Scr. Mater. 2019, 697, 89–103. [Google Scholar] [CrossRef]
- Wang, J.; Guo, F.; Wang, Z.; Xie, Z.; Shang, C.; Wang, X. Influence of Centerline Segregation on the Crystallographic Features and Mechanical Properties of a High-Strength Low-Alloy Steel. Mater. Lett. 2020, 267, 127512. [Google Scholar] [CrossRef]
- Teixeira, J.; Moreno, M.; Allain, S.Y.P.; Oberbillig, C.; Geandier, G.; Bonnet, F. Intercritical Annealing of Cold-Rolled Ferrite-Pearlite Steel: Microstructure Evolutions and Phase Transformation Kinetics. Acta Mater. 2021, 212, 116920. [Google Scholar] [CrossRef]
- Pütz, F.; Fehlemann, N.; Göksu, V.; Henrich, M.; Könemann, M.; Münstermann, S. A Data Driven Computational Microstructure Analysis on the Influence of Martensite Banding on Damage in DP-Steels. Comput. Mater. Sci. 2023, 218, 111903. [Google Scholar] [CrossRef]
- Philippot, C.; Bellavoine, M.; Dumont, M.; Hoummada, K.; Drillet, J.; Hebert, V.; Maugis, P. Influence of Heating Rate on Ferrite Recrystallization and Austenite Formation in Cold-Rolled Microalloyed Dual-Phase Steels. Met. Mater. Trans. A Phys. Met. Mater. Sci. 2018, 49, 66–77. [Google Scholar] [CrossRef]
- Chang, Y.; Haase, C.; Szeliga, D.; Madej, L.; Hangen, U.; Pietrzyk, M.; Bleck, W. Compositional Heterogeneity in Multiphase Steels: Characterization and Influence on Local Properties. Mater. Sci. Eng. A 2021, 827, 142078. [Google Scholar] [CrossRef]
- Ennis, B.L. The Effect of Chemical Segregation on Phase Transformations and Mechanical Behaviour in a TRIP-Assisted Dual Phase Steel; The University of Manchester: Manchester, UK, 2017. [Google Scholar]
- Gao, B.; Hu, R.; Pan, Z.; Chen, X.; Liu, Y.; Xiao, L.; Cao, Y.; Li, Y.; Lai, Q.; Zhou, H. Strengthening and Ductilization of Laminate Dual-Phase Steels with High Martensite Content. J. Mater. Sci. Technol. 2021, 65, 29–37. [Google Scholar] [CrossRef]
- Bellavoine, M.; Dumont, M.; Drillet, J.; Hébert, V.; Maugis, P. Combined Effect of Heating Rate and Microalloying Elements on Recrystallization during Annealing of Dual-Phase Steels. Met. Mater. Trans. A Phys. Met. Mater. Sci. 2018, 49, 2865–2875. [Google Scholar] [CrossRef]
- Basu, S.; Patra, A.; Jaya, B.N.; Ganguly, S.; Dutta, M.; Samajdar, I. Study of Microstructure-Property Correlations in Dual Phase Steels for Achieving Enhanced Strength and Reduced Strain Partitioning. Materials 2022, 25, 101522. [Google Scholar] [CrossRef]
- Van Bohemen, S.M.C. Bainite and Martensite Start Temperature Calculated with Exponential Carbon Dependence. Mater. Sci. Technol. 2012, 28, 487–495. [Google Scholar] [CrossRef]
- Boratto, F.; Barbosa, R.; Yue, S.; Jonas, J.J. Effect of Chemical Composition on the Critical Temperatures of Microalloyed Steels. In Proceedings of the International Conference on Physical Metallurgy of Thermomechanical Processing of Steels and Other Metals, Tokyo, Japan, 6–10 June 1988; pp. 383–390. [Google Scholar]
- Bhadeshia, H.K.D.H.; Honeycombe, W.K. Steels: Microstructure and Properties; Elsevier Ltd.: Amsterdam, The Netherlands, 2006. [Google Scholar]
- Lin, S.; Borgenstam, A.; Stark, A.; Hedström, P. Effect of Si on Bainitic Transformation Kinetics in Steels Explained by Carbon Partitioning, Carbide Formation, Dislocation Densities, and Thermodynamic Conditions. Mater. Charact. 2022, 185, 111774. [Google Scholar] [CrossRef]
- Goldstein, J.; Newbury, D.; Michael, J.R.; Ritchie, N.W.M.; Scott, J.H.J.; Joy, D.C. Scanning Electron Microscopy and X-ray Microanalysis, 4th ed.; Springer: Berlin/Heidelberg, Germany, 2017. [Google Scholar]
- San Martín, D.; De Cock, T.; García-Junceda, A.; Caballero, F.G.; Capdevila, C.; García De Andrés, C. Effect of Heating Rate on Reaustenitisation of Low Carbon Niobium Microalloyed Steel. Mater. Sci. Technol. 2008, 24, 266–272. [Google Scholar] [CrossRef]
- Azizi-Alizamini, H.; Militzer, M.; Poole, W.J. Austenite Formation in Plain Low-Carbon Steels. Metall. Mater. Trans. A Phys. Metall. Mater. Sci. 2011, 42, 1544–1557. [Google Scholar] [CrossRef]
- De Cock, T.; Capdevila, C.; Caballero, F.G.; De Andrés, C.G. Interpretation of a Dilatometric Anomaly Previous to the Ferrite-to-Austenite Transformation in a Low Carbon Steel. Scr. Mater. 2006, 54, 949–954. [Google Scholar] [CrossRef]
- De Cock, T.; Capdevila, C.; Ferrer, J.P.; Caballero, F.G.; Jimènez, J.A.; García De Andrés, C. Recrystallisation and Dilatometric Behaviour of Low Carbon and Ultralow Carbon Steels. Mater. Sci. Technol. 2008, 24, 832–837. [Google Scholar] [CrossRef]
- Pawłowski, B. Critical Points of Hypoeutectoid Steel—Prediction of Pearlite Dissolution Finich Temperature Ac1f. J. Achiev. Mater. Manuf. Eng. 2011, 49, 331–337. [Google Scholar]
- Cleveland, W.S.; Devlin, S.J. Locally Weighted Regression: An Approach to Regression Analysis by Local Fitting. J. Am. Stat. Assoc. 1988, 83, 596–610. [Google Scholar] [CrossRef]
- Evans, M. An Estimation Method (LOESS) for Dealing with the Imperfections of Existing Parametric Creep Models for Time to Failure: Illustrated Using 2.25Cr–1Mo Steel. Int. J. Press. Vessel. Pip. 2023, 206, 105047. [Google Scholar] [CrossRef]
- Kop, T. A Dilatometric Study of the Austenite/Ferrite Interface Mobility; Delft University of Technology: Delft, The Netherlands, 2000. [Google Scholar]
- Van Bohemen, S.M.C. The Nonlinear Lattice Expansion of Iron Alloys in the Range 100-1600 K. Scr. Mater. 2013, 69, 315–318. [Google Scholar] [CrossRef]
- Mendonça, R.; Nogueira, I.; Lovo, J.; Canale, L. Multiple Etchings Methodology: A New Approach in Multiphase Steel Characterization. J. Microsc. 2020, 277, 93–99. [Google Scholar] [CrossRef]
- Dossett, J.L.; Totten, G.E. (Eds.) ASM Handbook; ASM International: Materials Park, OH, USA, 1986; Volume 4, ISBN 0-87170-007-7 (v. 1). [Google Scholar]
- Xu, Z.; Ding, Z.; Liang, B.; Li, H. The Analysis for Morphological Evolution and Crystallography of Degenerate Pearlite in 100Mn13 Steel. Materwiss Werksttech 2020, 51, 1251–1257. [Google Scholar] [CrossRef]
- Al Gahtani, M. Formation of Micro-Structural Banding in Hot-Rolled Medium-Carbon Steel. Ph.D. Thesis, University of Wollongong, Wollongong, Australia, 2015; p. 214. [Google Scholar]
- Li, Z.; Miyamoto, G.; Yang, Z.; Zhang, Y.; Zhang, C.; Furuhara, T. Effects of Mn and Si Additions on Pearlite-Austenite Phase Transformation in Fe-0.6C Steel. Acta Metall. Sin. 2010, 46, 1066–1074. [Google Scholar] [CrossRef]
- Shah, V.; Krugla, M.; Offerman, S.E.; Sietsma, J.; Hanlon, D.N. Effect of Silicon, Manganese and Heating Rate on the Ferrite Recrystallization Kinetics. ISIJ Int. 2020, 60, 1312–1323. [Google Scholar] [CrossRef]
- Fridberg, J.; Torndahl, L.E.; Hillert, M. Diffusion in Iron. Jernkontorets Ann. 1969, 153, 263–276. [Google Scholar]
- Guo, H.; Enomoto, M. Effects of Substitutional Solute Accumulation at α/γ Boundaries on the Growth of Ferrite in Low Carbon Steels. Met. Mater. Trans. A Phys. Met. Mater. Sci. 2007, 38, 1152–1161. [Google Scholar] [CrossRef]
- Purdy, G.R.; Brechet, Y.J.M. A Solute Drag Treatment of the Effects of Alloying Elements on the Rate of the Proeutectoid Ferrite Transformation in Steels. Acta Metall. Et Mater. 1995, 43, 3763–3774. [Google Scholar] [CrossRef]
- Landheer, H. Nucleation of Ferrite in Austenite The Role of Crystallography. Ph.D. Thesis, Delft University of Technology, Delft, The Netherlands, 2010. ISBN 9789088912078. [Google Scholar]
- Offerman, S.E.; Van Dijk, N.H.; Sietsma, J.; Grigull, S.; Lauridsen, E.M.; Margulies, L.; Poulsen, H.F.; Rekveldt, M.T.; Van der Zwaag, S. Grain Nucleation and Growth during Phase Transformations. Science 2002, 298, 1003–1005. [Google Scholar] [CrossRef] [PubMed]
- Sharma, H.; Sietsma, J.; Offerman, S.E. Preferential Nucleation during Polymorphic Transformations. Sci. Rep. 2016, 6, 30860. [Google Scholar] [CrossRef]
- Offerman, S.E.; Van Dijk, N.H.; Sietsma, J.; Van Der Zwaag, S.; Lauridsen, E.M.; Margulies, L.; Grigull, S.; Poulsen, H.F. Reply to the Discussion by Aaronson et al. to “Grain Nucleation and Growth during Phase Transformations” by S.E. Offerman et al., Science, 298, 1003 (November 1, 2002). Scr. Mater. 2004, 51, 937–941. [Google Scholar] [CrossRef]
- Palmer, T.A.; Elmer, J.W. Direct Observations of the Formation and Growth of Austenite from Pearlite and Allotriomorphic Ferrite in a C–Mn Steel Arc Weld. Scr. Mater. 2005, 53, 535–540. [Google Scholar] [CrossRef]
- Li, P.; Li, J.; Meng, Q.; Hu, W.; Xu, D. Effect of Heating Rate on Ferrite Recrystallization and Austenite Formation of Cold-Roll Dual Phase Steel. J. Alloys Compd. 2013, 578, 320–327. [Google Scholar] [CrossRef]
- Huang, J.; Poole, W.J.; Militzer, M. Austenite Formation during Intercritical Annealing. Met. Mater. Trans. A Phys. Met. Mater. Sci. 2004, 35 A, 3363–3375. [Google Scholar] [CrossRef]
- Enomoto, M.; NojirF, N.; Sato1, Y. Effects of Vanadium and Niobium on the Nucleation Kinetics of Proeutectoid Ferrite at Austenite Grain Boundaries in Fe-C and Fe-C-Mn Alloys. Mater. Trans. JIM 1994, 35, 859–867. [Google Scholar] [CrossRef]
- Pereloma, E.; Edmonds, D. Phase Transformations in Steels; Elsevier Ltd.: Amsterdam, The Netherlands, 2012; Volume 2, ISBN 9781845699710. [Google Scholar]
- Aaronson, H.I.; Enomoto, M.; Lee, J.K. Diffusional Nucleation in Solid–Solid Transformations. In Mechanisms of Diffusional Phase Transformations in Metals and Alloys; CRC Press: Boca Raton, FL, USA, 2010; p. 200. [Google Scholar]
- Embury, D. The Formation of Pearlite in Steels. In Phase Transformations in Steels; Pereloma, E., Edmonds, D.V., Eds.; Woodhead Publishing: Sawston, UK, 2012; pp. 276–310. ISBN 978-1-84569-970-3. [Google Scholar]
- Lâszl, F. Tessellated Stresses—Part V. J. Iron Steel Inst. 1943, 1, 173. [Google Scholar]
- Barnett, D.M.; Lee, J.K.; Aaronson, H.I.; Russell, K.C. The strain energy of a coherent ellipsoidal precipitate. Scr. Metall. 1974, 8, 1447–1450. [Google Scholar] [CrossRef]
- Ghosh, G.; Olson, G.B. The Isotropic Shear Modulus of Multicomponent Fe-Base Solid Solutions. Acta Mater. 2002, 50, 2655–2675. [Google Scholar] [CrossRef]
- Lindgren, L.E.; Gyhlesten Back, J. Elastic Properties of Ferrite and Austenite in Low Alloy Steels versus Temperature and Alloying. Materials 2019, 5, 100193. [Google Scholar] [CrossRef]
- Onink, M.; Brakman, C.M.; Tichelaar, F.D.; Mittemeijer, E.J.; van der Zwaag, S.; Root, J.H.; Konyer, N.B. The Lattice Parameters of Austenite and Ferrite in FeC Alloys as Functions of Carbon Concentration and Temperature. Scr. Metall. Mater. 1993, 29, 1011–1016. [Google Scholar] [CrossRef]
- Fruchart, D.; Chaudouet, P.; Fruchart, R.; Rouault, A.; Senateur, J.P. Etudes Structurales de Composés de Type Cémentite: Effet de l’hydrogéne Sur Fe3C Suivi Par Diffraction Neutronique. Spectrométrie Mössbauer Sur FeCo2B et Co3B Dopés Au 57Fe. J. Solid State Chem. 1984, 51, 246–252. [Google Scholar] [CrossRef]
- Umemoto, M.; Liu, Z.G.; Masuyama, K.; Tsuchiya, K. Influence of Alloy Additions on Production and Properties of Bulk Cementite. Scr. Mater. 2001, 45, 391–397. [Google Scholar] [CrossRef]
- Tanino, M. Precipitation of carbides in steel. Tetsu-to-Hagane/J. Iron Steel Inst. Jpn. 1967, 6, 23–37. [Google Scholar]
- Tanino, M. Crystal structure and precipitation characteristics of carbides in steel. Tetsu-to-Hagane/J. Iron Steel Inst. Jpn. 1972, 11, 203–220. [Google Scholar]
- Razumovskiy, V.I.; Ghosh, G. A First-Principles Study of Cementite (Fe3C) and Its Alloyed Counterparts: Structural Properties, Stability, and Electronic Structure. Comput. Mater. Sci. 2015, 110, 169–181. [Google Scholar] [CrossRef]
- Liang, X.; Hou, T.P.; Zhang, D.; Zheng, P.; Lin, H.F.; Li, Y.; Wu, K.M. Structural, Electronic, Magnetic and Mechanical Properties of Fe2SiC. Phys. B Condens Matter 2021, 618, 413136. [Google Scholar] [CrossRef]
- Garvik, N.; Carrez, P.; Cordier, P. First-Principles Study of the Ideal Strength of Fe3C Cementite. Mater. Sci. Eng. A 2013, 572, 25–29. [Google Scholar] [CrossRef]
- Jang, J.H.; Kim, I.G.; Bhadeshia, H.K.D.H. Substitutional Solution of Silicon in Cementite: A First-Principles Study. Comput. Mater. Sci. 2009, 44, 1319–1326. [Google Scholar] [CrossRef]
- Ghosh, G. A First-Principles Study of Cementite (Fe3C) and Its Alloyed Counterparts: Elastic Constants, Elastic Anisotropies, and Isotropic Elastic Moduli. AIP Adv. 2015, 5, 087102. [Google Scholar] [CrossRef]
- Kim, B.; Celada, C.; San Martín, D.; Sourmail, T.; Rivera-Díaz-Del-Castillo, P.E.J. The Effect of Silicon on the Nanoprecipitation of Cementite. Acta Mater. 2013, 61, 6983–6992. [Google Scholar] [CrossRef]
- Chang, L.; Smith, G.D.W. The Silicon Effect in the Tempering of Martensite in Steels. Le J. De Phys. Colloq. 1984, 45, C9-397–C9-401. [Google Scholar] [CrossRef]
- Ande, C.K. First-Principles Calculations on the Stabilization of Iron Carbides (Fe3C, Fe5C2 and η-Fe2C) in Steels; Technical University Delft: Delft, The Netherlands, 2013. [Google Scholar]
- Drumond, J.; Girina, O.; da Silva Filho, J.F.; Fonstein, N.; de Oliveira, C.A.S. Effect of Silicon Content on the Microstructure and Mechanical Properties of Dual-Phase Steels. Metallogr. Microstruct. Anal. 2012, 1, 217–223. [Google Scholar] [CrossRef]
- Davies, R.G. Influence of Silicon and Phosphorous on the Mechanical Properties of Both Ferrite and Dual-Phase Steels. Metall. Trans. A 1979, 10, 113–118. [Google Scholar] [CrossRef]
- Krauss, G. Solidification, Segregation, and Banding in Carbon and Alloy Steels. Metall. Mater. Trans. B Process Metall. Mater. Process. Sci. 2003, 34, 781–792. [Google Scholar] [CrossRef]
- Deming, W.E. Statistical Adjustment of Data (Dover Books on Mathematics); Dover Publications: Mineola, NY, USA, 2011; ISBN 978-0486646855. [Google Scholar]
- Kiefer, D.; Gibmeier, J.; Stark, A. Determination of Temperature-Dependent Elastic Constants of Steel AISI 4140 by Use of in Situ x-Ray Dilatometry Experiments. Materials 2020, 13, 2378. [Google Scholar] [CrossRef] [PubMed]
- Hutchinson, C.R.; Malmstrom, M.; Lonnqvist, J.; Bate, P.; Ehteshami, H.; Korzhavyi, P.A. Elasticity and Wave Velocity in FCC Iron (Austenite) at Elevated Temperatures—Experimental Verification of Ab-Initio Calculations. Ultrasonics 2018, 87, 44–47. [Google Scholar] [CrossRef] [PubMed]
- Adams, J.J.; Agosta, D.S.; Leisure, R.G.; Ledbetter, H. Elastic Constants of Monocrystal Iron from 3 to 500 K. J. Appl. Phys. 2006, 100, 113530. [Google Scholar] [CrossRef]
- Dever, D.J. Temperature Dependence of the Elastic Constants in α-Iron Single Crystals: Relationship to Spin Order and Diffusion Anomalies. J. Appl. Phys. 1972, 43, 3293–3301. [Google Scholar] [CrossRef]
- Drouin, D.; Couture, A.R.; Joly, D.; Tastet, X.; Aimez, V.; Gauvin, R. CASINO V2.42—A Fast and Easy-to-Use Modeling Tool for Scanning Electron Microscopy and Microanalysis Users. Scanning 2007, 29, 92–101. [Google Scholar] [CrossRef]
- Lin, S.; Ledbetter, H. Nitrogen Effect on Elastic Constants of f.c.c. Fe-18Cr-19Mn Alloys. Mater. Sci. Eng. A 1993, 167, 81–85. [Google Scholar] [CrossRef]
- Umemoto, M.; Kruger, S.E.; Ohtsuka, H. Ultrasonic Study on the Change in Elastic Properties of Cementite with Temperature and Mn Content Using Nearly Full Density Polycrystalline Bulk Samples. Mater. Sci. Eng. A 2019, 742, 162–168. [Google Scholar] [CrossRef]
- Hartmann, S.; Ruppersberg, H. Thermal Expansion of Cementite and Thermoelastic Stresses in White Cast Iron. Mater. Sci. Eng. A 1995, 190, 231–239. [Google Scholar] [CrossRef]
- Lee, K.M.; Lee, H.C.; Lee, J.K. Influence of Coherency Strain and Applied Stress upon Diffusional Ferrite Nucleation in Austenite: Micromechanics Approach. Philos. Mag. 2010, 90, 437–459. [Google Scholar] [CrossRef]
- Nabarro, F.R.N. The Influence of Elastic Strain on the Shape of Particles Segregating in Alloy. Proc. Phys. Soc. 1940, 175, 519–538. [Google Scholar] [CrossRef]
- Böhm, H.J.; Zickler, G.A.; Fischer, F.D.; Svoboda, J. Role of Elastic Strain Energy in Spheroidal Precipitates Revisited. Mech. Mater. 2021, 155, 103781. [Google Scholar] [CrossRef]
- Böhm, H.J.; Zickler, G.A.; Fischer, F.D.; Svoboda, J. Strain and Interface Energy of Ellipsoidal Inclusions Subjected to Volumetric Eigenstrains: Shape Factors. Arch. Appl. Mech. 2022, 92, 405–411. [Google Scholar] [CrossRef]
- Eshelby, J.D. The Determination of the Elastic Field of an Ellipsoidal Inclusion, and Related Problems. Proc. R. Soc. Lond. A Math. Phys. Sci. 1957, 241, 376–396. [Google Scholar]
Disclaimer/Publisher’s Note: The statements, opinions and data contained in all publications are solely those of the individual author(s) and contributor(s) and not of MDPI and/or the editor(s). MDPI and/or the editor(s) disclaim responsibility for any injury to people or property resulting from any ideas, methods, instructions or products referred to in the content. |
© 2024 by the authors. Licensee MDPI, Basel, Switzerland. This article is an open access article distributed under the terms and conditions of the Creative Commons Attribution (CC BY) license (https://creativecommons.org/licenses/by/4.0/).