Article

Experimental and Numerical Investigation of Forming Limit Diagrams during Single Point Incremental Forming for Al/Cu Bimetallic Sheets

School of Mechanical Engineering, Iran University of Science and Technology, Tehran 1684613114, Iran
*
Author to whom correspondence should be addressed.
Metals 2024, 14(2), 214; https://doi.org/10.3390/met14020214
Submission received: 20 December 2023 / Revised: 3 February 2024 / Accepted: 5 February 2024 / Published: 9 February 2024
(This article belongs to the Special Issue Numerical Simulation of Metal Forming Process)

Abstract

:
This article investigated the formability of aluminum/copper bimetal sheets during single-point incremental forming. First, the two-layer sheets were produced by the explosive welding process; then, the rolling process was performed with 50% strain on two-layer samples. Considering the importance of examining the mechanical and metallurgical properties on the formability of the two-layer samples, the mechanical properties were first examined, including the uniaxial tensile and micro-hardness tests. Then, metallurgical tests were performed, including scanning electron microscopy equipped with energy-dispersive X-ray spectroscopy (SEM-EDX) to investigate the fracture surface and penetration depth and an X-ray diffraction (XRD) test to check the secondary phase particles in the penetration zone of Al and Cu in five different annealing temperature conditions. Considering that the forming limit diagram (FLD) is dependent on the strain path, to study the effect of the strain path, the two-layer samples were formed by three geometries: pyramid, cone, and straight groove. Simulations of FLD by Abaqus software 6.14-4 with four different methods were studied: FLDCRT, effective strain rate (ESR), second derivation of thinning (SDT), and maximum strain rate (MSR). The results showed that the FLDCRT criterion provided a more accurate estimate of the necking time. In the following, the values of the thickness distribution were carried out by experimental and numerical methods, and the results between the methods were in good agreement.

1. Introduction

The formability limit diagram (FLD) is used to determine the formability of metal sheets. The methods used to obtain the FLD include experimental, numerical–experimental, and numerical methods [1]. Nakajima and Erickson’s test can be mentioned among the methods commonly used to obtain an experimental FLD. One of the disadvantages of the experimental method is the cost of conducting examinations. For the numerical–experimental techniques, we can mention the FLDCRT method. In this method, the failure strains are first obtained by experimental tests, and then the experimental results are verified with the help of simulation software such as Abaqus. The numerical method predicts critical points without experimental tests and only uses failure criteria or strain/stress analyses. Today, the SPIF process is considered a useful forming process due to its low cost, flexibility, and greater formability than the common forming processes [2]. The parameters that affect the FLD can be mentioned as strain rate [3], strain path [4], and sheet thickness [5,6]. Honarpisheh et al. [7] investigated the effect of the SPIF process parameters on the two-layer Al/Cu sheet produced by explosive welding. Their results showed that increasing the tool diameter will increase the forming force. Gheysarian et al. [8] experimentally studied the influence of SPIF parameters on the two-layer Al/Cu sheet produced by the explosive welding process. Alaie et al. [9] studied the influence of temperature on FLD for a two-layer Al/Cu sheet using the Nakajima test and found that the FLD increases with increasing temperature. Chang et al. [10] studied the effects of annealing temperature on the mechanical and microstructural properties of the Al/Cu two-layer sheet. They showed that hardness decreases with increasing annealing temperature. Rezaei et al. [11] examined the effects of step-down, feed rate, and spindle speed on the FLD diagram and thickness distribution for the two-layer Cp–Ti/St12 sample. They showed that increasing the tool diameter and the step-down reduces the formability. Liu et al. [12] studied the influence of SPIF parameters on surface quality, formability, and thickness distribution. They found that the forming force increases with an increase in the step-down and the forming limit angle. Dizajyekan et al. [13] used the Xue–Wierzbicki damage criterion to predict failure for two-layer samples experimentally and numerically. They reported that the Xue–Wierzbicki criterion can predict failure in a numerical method. Puchlerska et al. [14] studied the influence of step-down on the formability of a two-layer Al/Cu sheet in the SPIF process. They showed that the step-down significantly affects the formability and spring-back. Jalali et al. [15] examined the layer arrangement influence for a two-layer Brass/Al sample. They reported that if the metal with more formability is placed in the outer layer, the formability of the two-layer sample will increase. Pambhar et al. [16] examined the influence of the SPIF parameters on the formability of the Al/Cu sheet. They found an optimal state for the maximum forming limit angle for the effective parameters.
This work used the Al/Cu two-layer sheets fabricated by the explosive welding process. Then, the rolling process was performed. Next, the mechanical and metallurgical properties of the two-layer sheets were investigated. Also, the FLDs were obtained experimentally and numerically through SPIF, and for the first time, numerical studies were performed using four numerical methods to obtain the FLDs.

2. Materials and Methods

2.1. Materials

This research used AA 1050 and Cu 10,100 with 1 mm thickness to produce bimetal samples. Samples with dimensions of 130 × 70 were prepared for the explosive welding process. After the explosive welding process, the rolling process was performed to homogenize the structure of the samples, and the final thickness was obtained at 1 mm for the two-layer sample. In the explosive welding process, an aluminum sheet is considered the cover metal (flying plate), and a Cu sheet is the base plate. The explosive welding process was controlled and mixed with ANFO (nitrate of ammonium and diesel fuel oil) materials at a speed of 2200 to 2500 m/s. The rolling process was performed by a rolling machine with a diameter of 40 cm and a speed of 6 rpm.

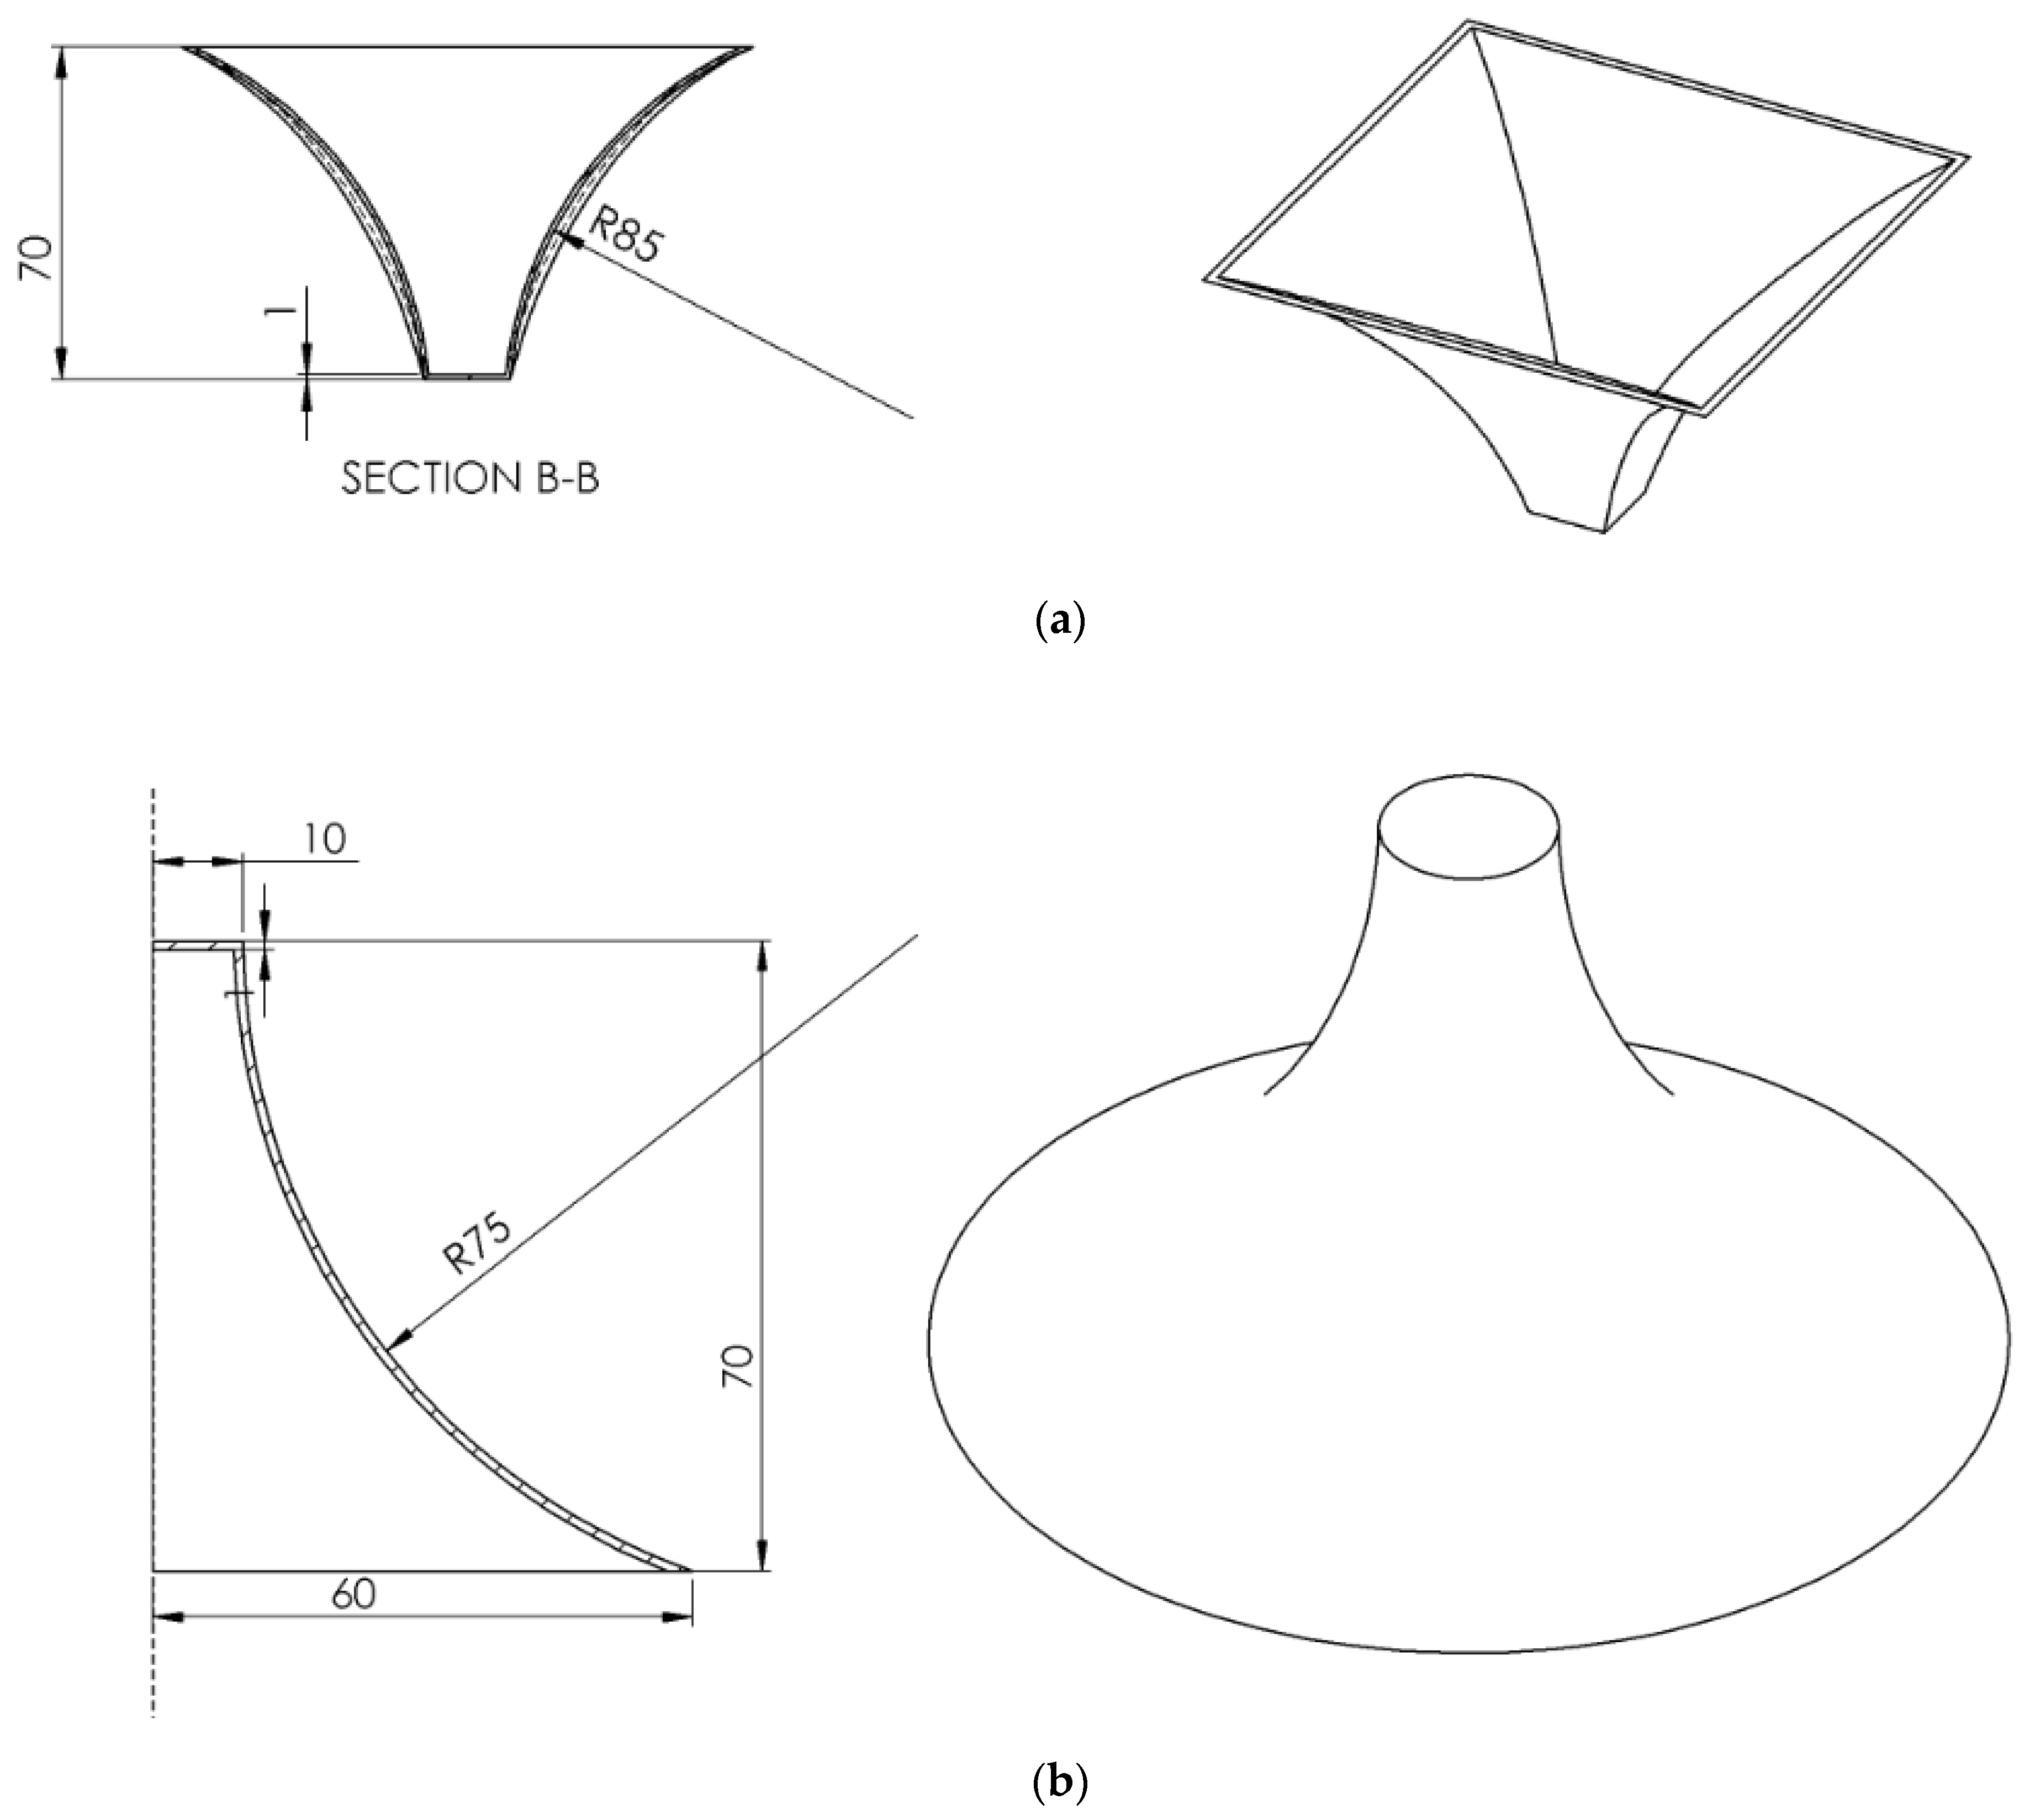
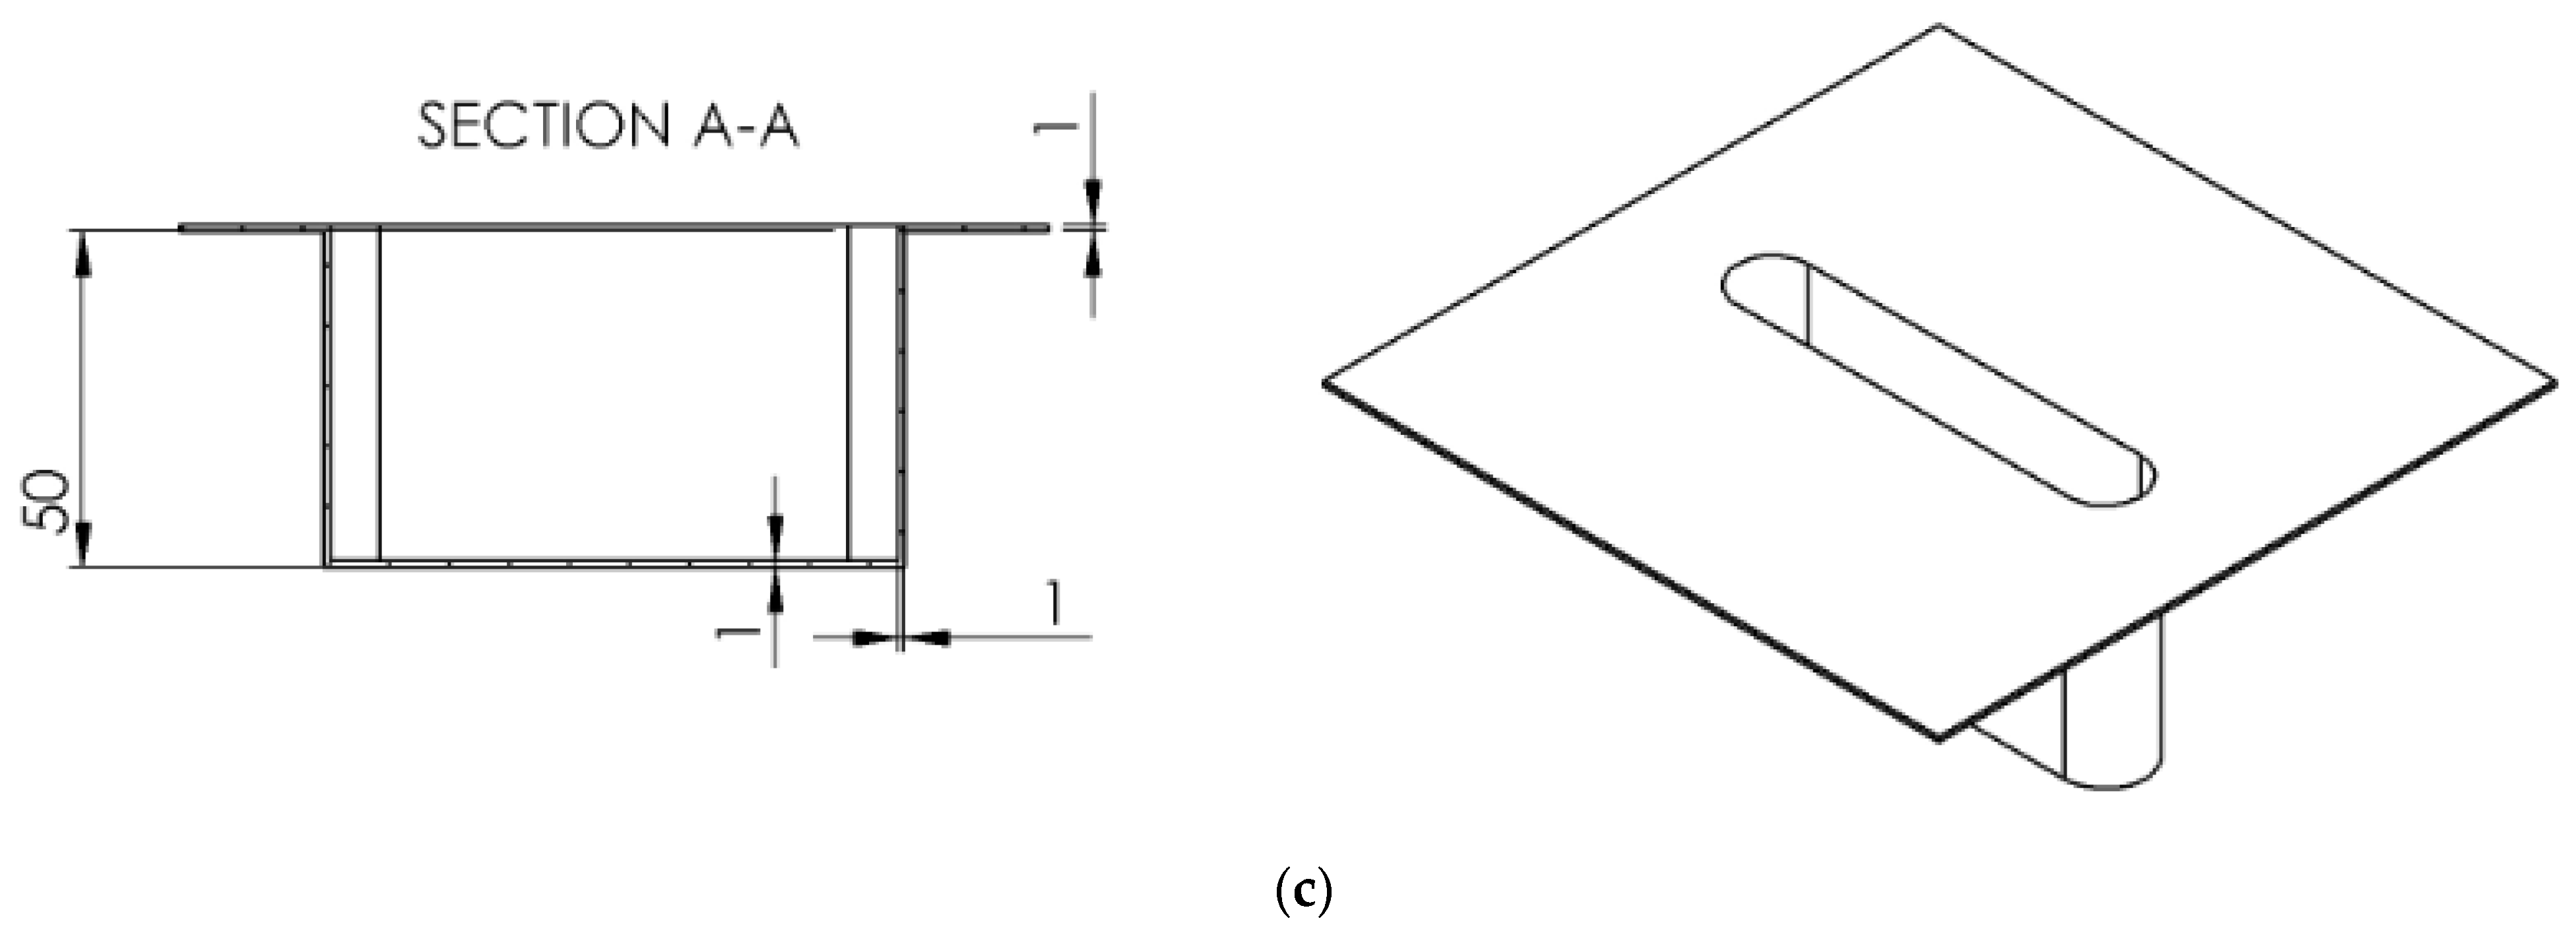
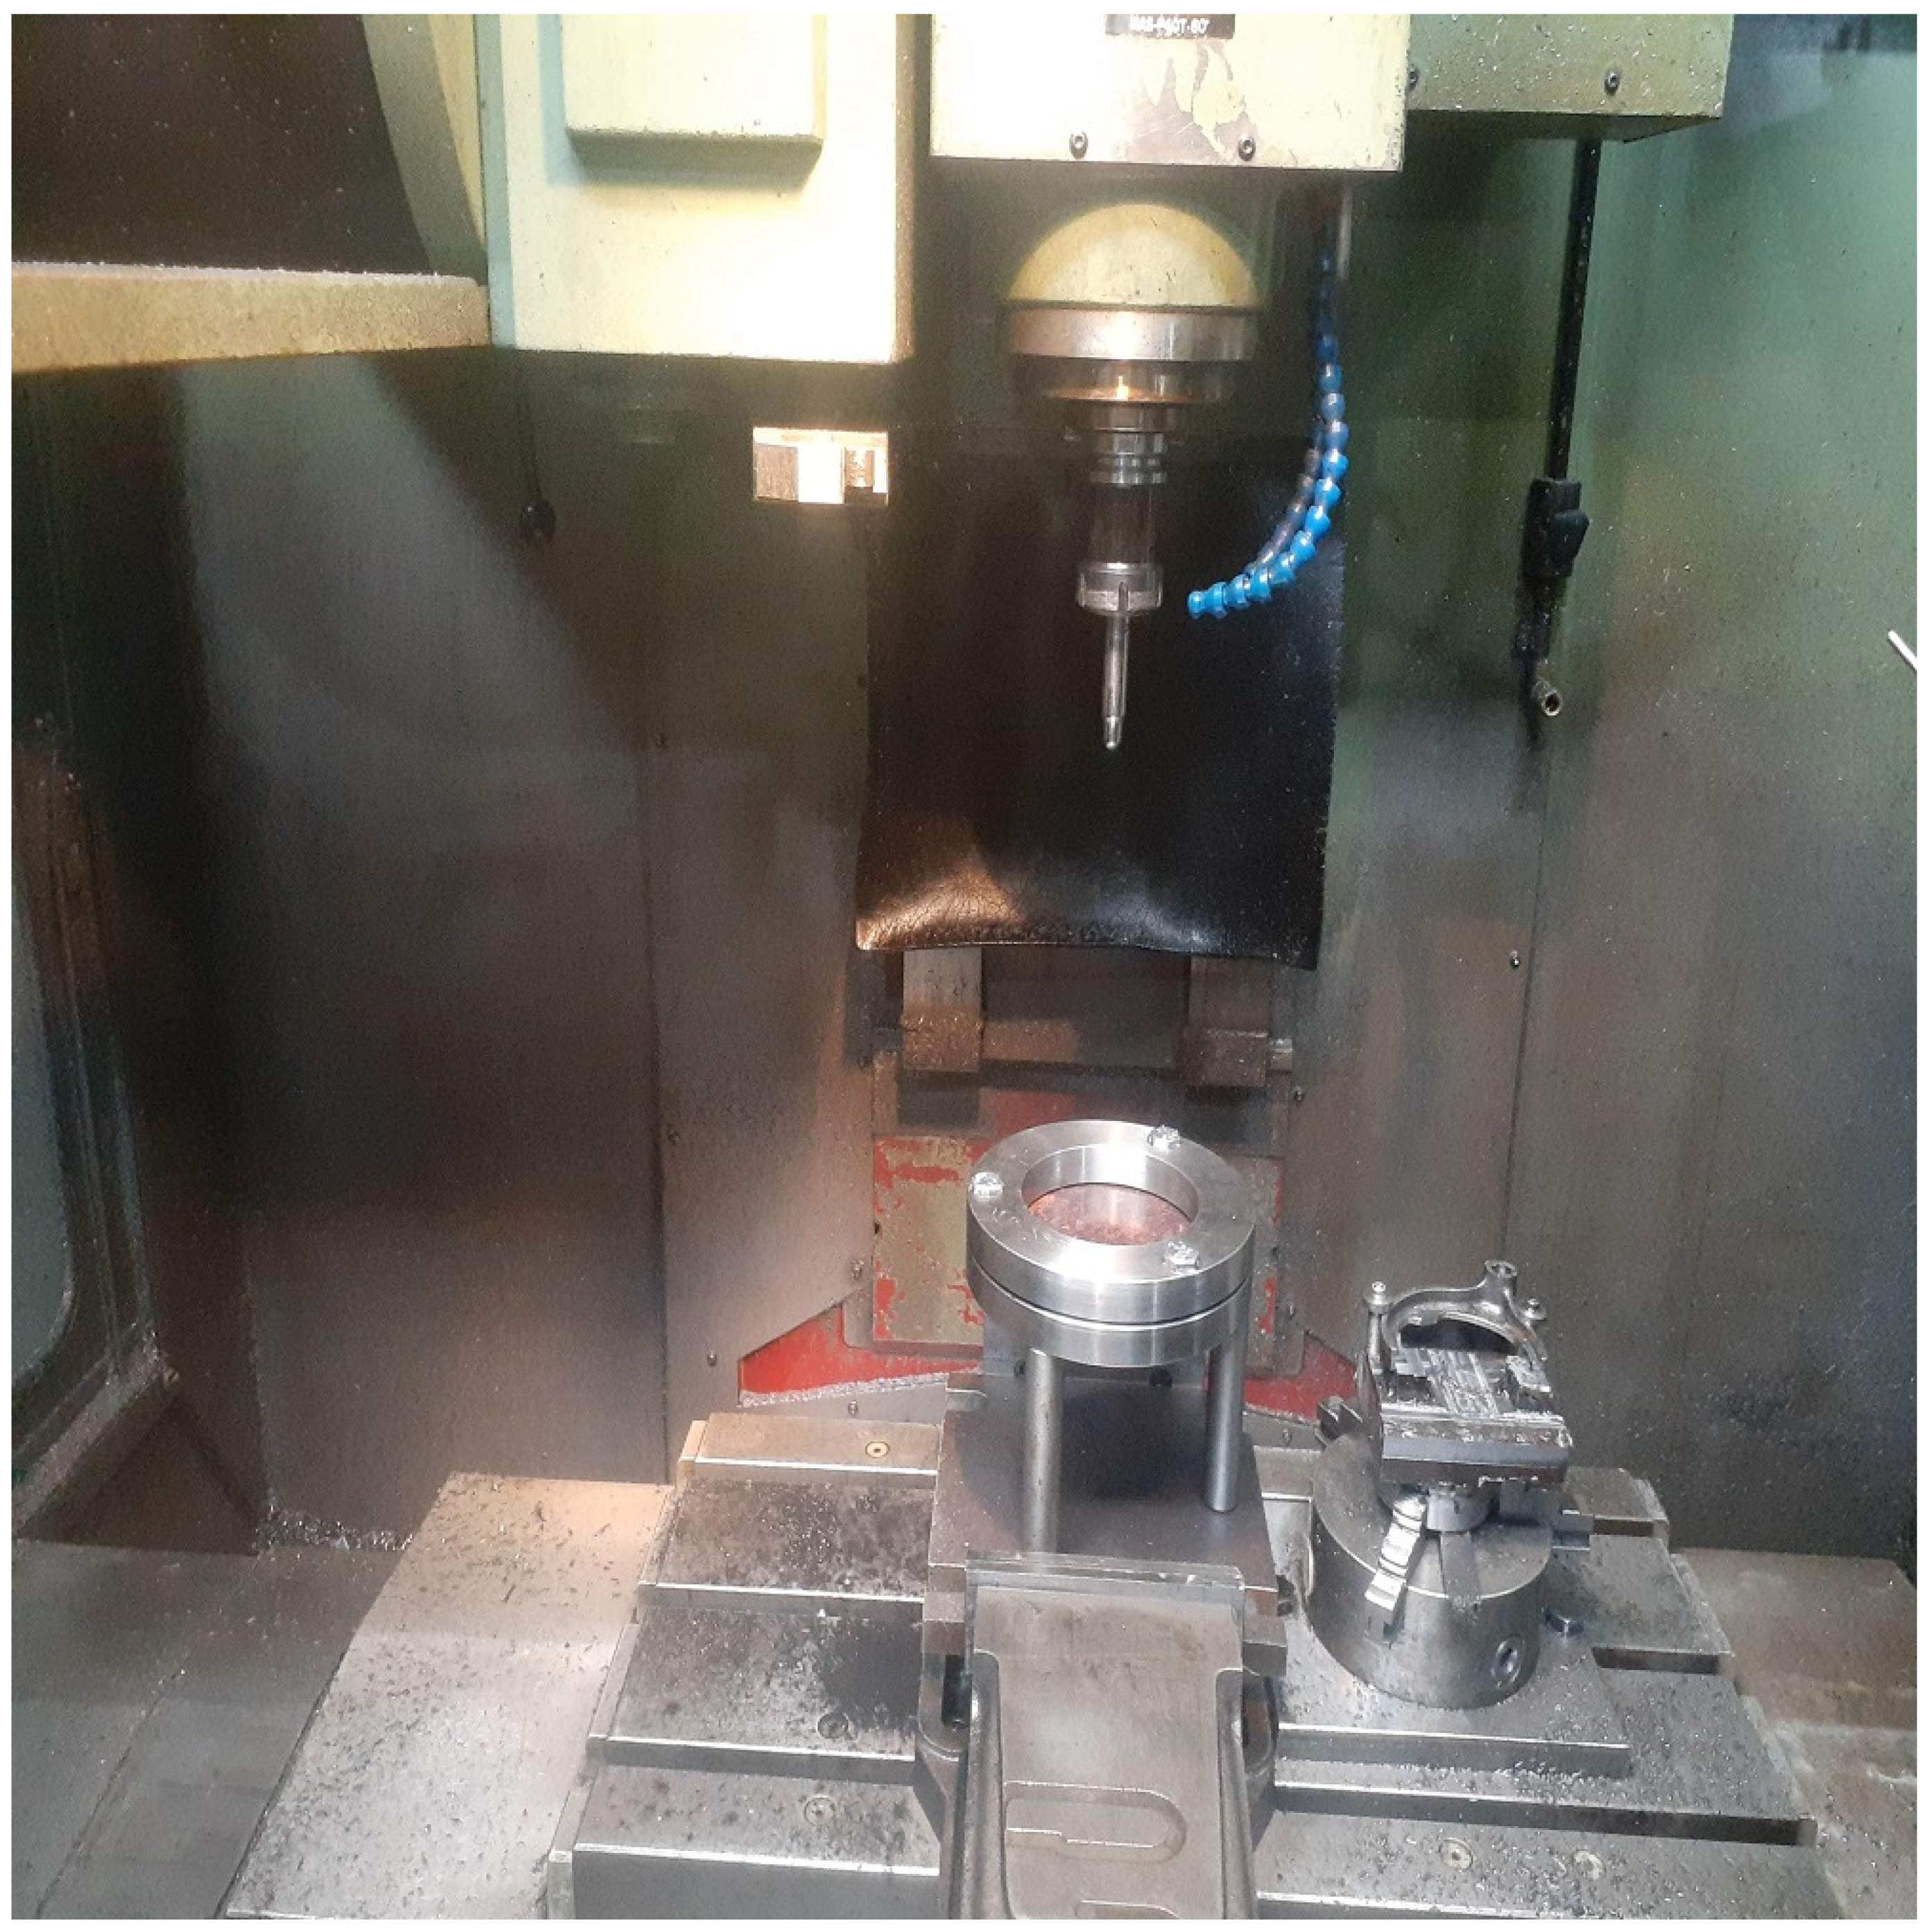
2.2. Incremental Forming

The SPIF process was carried out to check the FLD for the two-layer sheet. The SPIF process was carried out in 3 geometries: square pyramidal, cone, and straight groove, according to Figure 1. SPIF was performed with a tool with a 14 mm diameter and a spiral tool path with a 0.5 mm step-down. SPIF was performed with a 500 rpm rotational speed and 1200 mm/min feed rate. The equipment prepared to perform the SPIF process is shown in Figure 2. To evaluate the strain of the formed samples and obtain the FLD, circles with 2.5 mm diameter were printed on the samples. After the forming process, these circles were turned into an ellipse, from which FLD was obtained by measuring the large and small diameters according to the below equations:
ε 1 = L n ( D 1 D 0 )
ε 2 = L n ( D 2 D 0 )

2.3. Mechanical Study

To evaluate the mechanical properties of the two-layer sheet and compare the results with the base sheets, uniaxial tensile and micro-hardness tests were performed for the two-layer and base samples. According to the ASTM-E8M standard [17], the tensile samples were prepared for the uniaxial tensile test (Figure 3a–c). Then, the tensile test was performed for the prepared samples with a 2 mm/min speed. Considering that the stress–strain diagram obtained from the tensile test was used to carry out the simulation process, it was necessary to characterize the true stress–strain diagram up to a strain of 1. The Vickers micro-hardness test was performed for two-layer samples and base sheets with a 100 g weight and 15 s holding time. Hardness measurement was performed from the cross-sectional area of the two layers and the base sheet samples with three measurement repetitions in each area, according to Figure 3d.

2.4. Microstructure Investigation

Since the strength of two-layer samples was dependent on the penetration of Al/Cu layers into each other, it was necessary to check the penetration depth in two-layer samples. Scanning electron microscopy equipped with energy-dispersive X-ray spectroscopy (SEM-EDX) TESCAN VEGA//XMU model was employed to characterize the microstructure in the penetration zone. Next, to study the intermetallic phases in the penetration zone of the two-layer Al/Cu sheet, an X-ray diffraction (XRD) test was performed. Considering that one of the effective parameters in the formation of the intermetallic phase is the effect of temperature, the samples were examined in 5 different temperature conditions: 1–ambient temperature, 2–200°, 3–300°, 4–400°, 5–500°. The fractography of the fracture surface for the tensile test samples was performed by field emission scanning electron microscopy (FESEM) to investigate the effect of the rolling process and explosive welding on the change of the fracture mechanism.

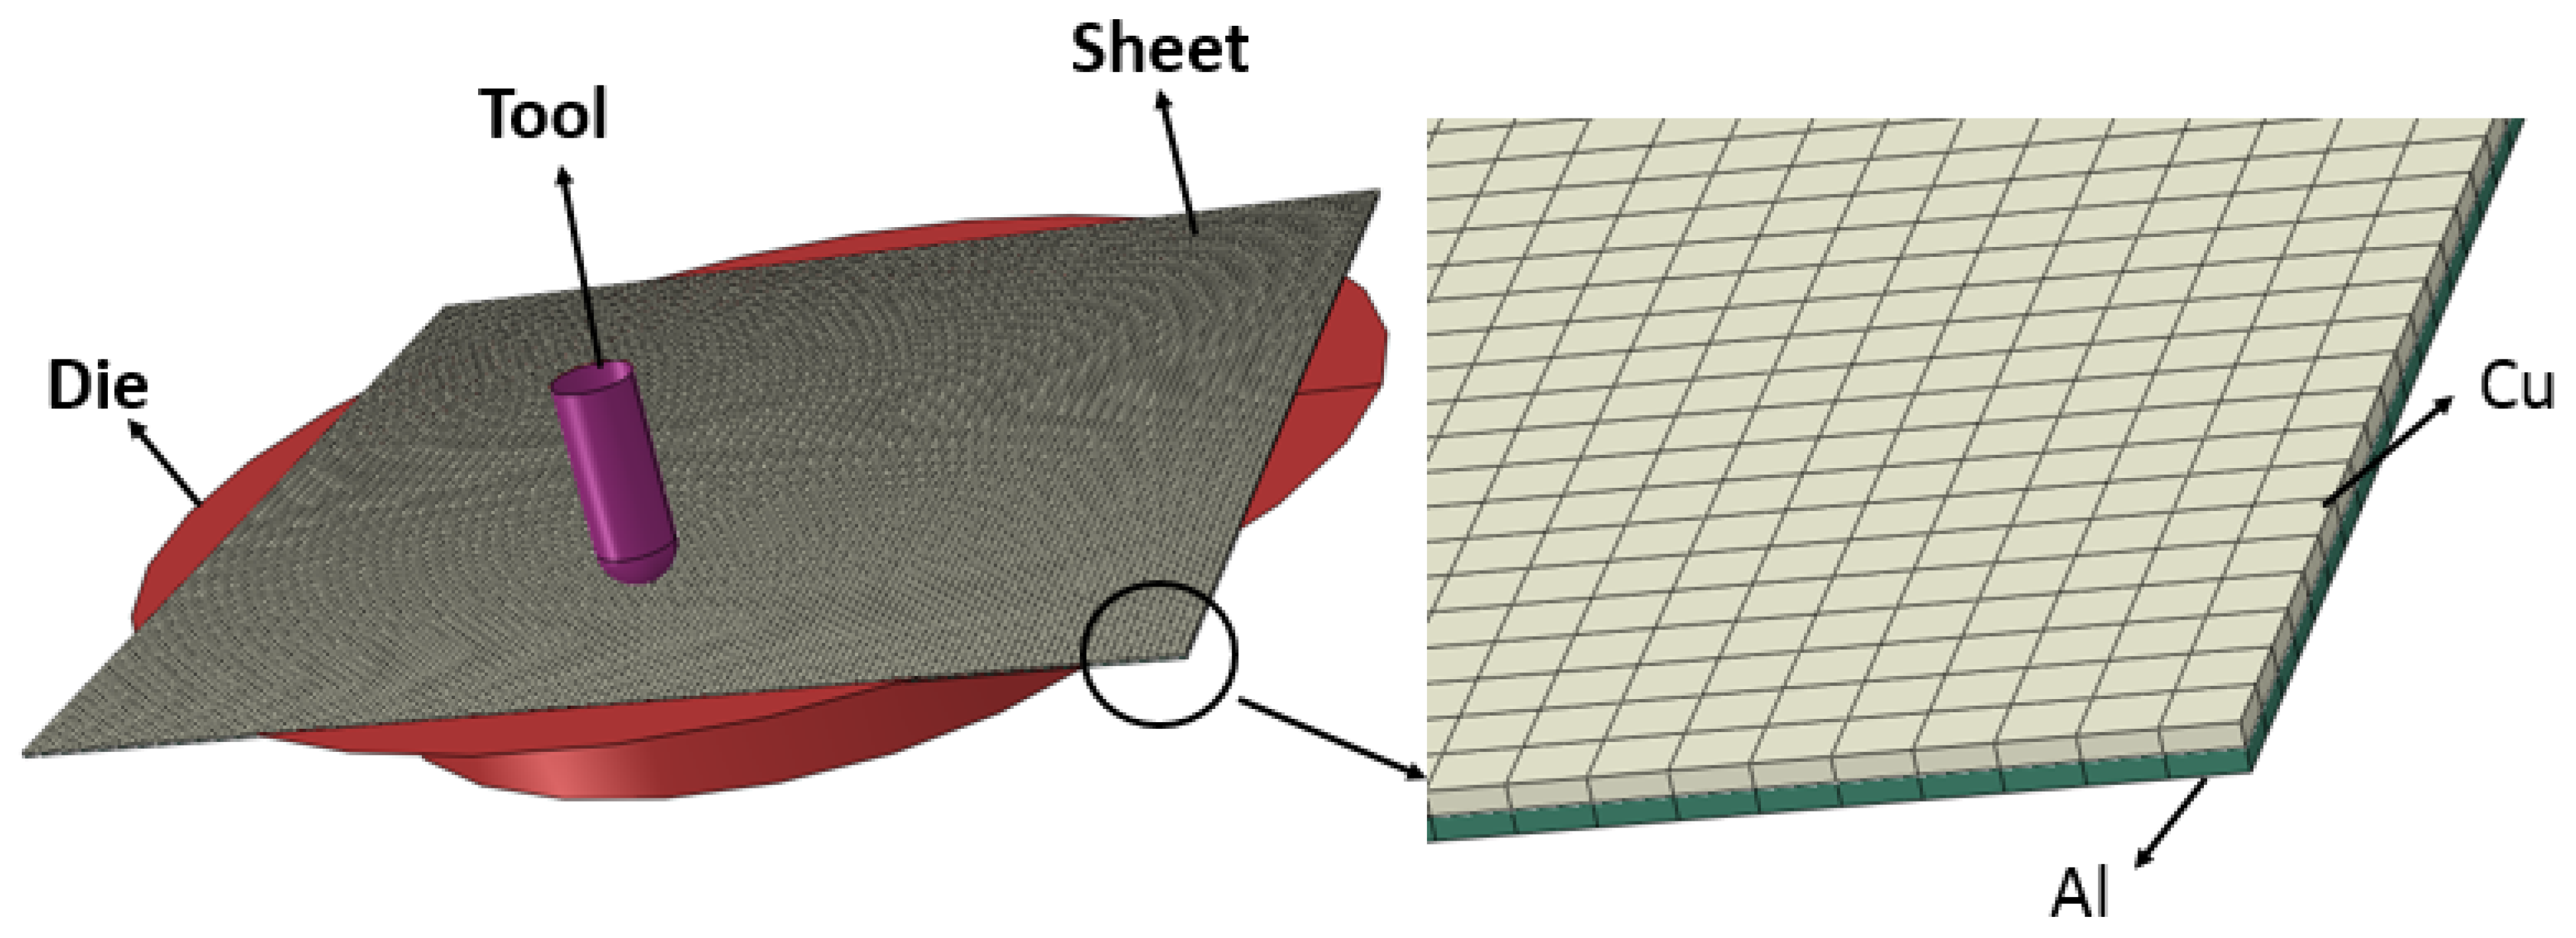
2.5. Finite Element Model

The ABAQUS finite element modeling (FEM) software was used for the numerical simulation of the SPIF process. The plastic properties were considered by following the von Mises yield function, considering the hardness properties for the two-layer specimens and the base sheet. The two-layer Al–Cu sheet was modeled as two layers in a shell in deformable mode, considering each layer’s thickness after the rolling process. Since the holder and tool were not analyzed, they were considered analytically rigid. The connection between Al and Cu sheets was performed by considering the tie conditions. The contact between the tool and the two layers was defined by the Coulomb model with a 0.1 friction coefficient [18]. The two layers were meshed by S4R square shell elements with a size of 1.5 mm, and five Gauss integration points were considered through the thickness of the shell elements. The model considered for the simulation process is shown in Figure 4.

3. Results and Discussion

This article investigated the effect of explosive welding and rolling processes on a two-layer sheet’s mechanical and metallurgical properties. Since intermetallic phases are the most influential factor affecting mechanical and metallurgical properties in two-layer samples, the formation of intermetallic phases in different annealing temperature conditions was investigated. Further, studies on the formability of the two-layer sheets were performed experimentally and numerically to obtain the FLD. In the numerical method, the FLD was determined using four methods, namely STD, MSR, ESR, and FLDCRT, and then the results were compared with the experimental test.

3.1. Mechanical Results

Tensile test results for the base and two-layer sheets are shown in Figure 5. Based on the results of the true stress–strain diagrams, the strength of the two-layer sheet was higher than that of Al and lower than that of Cu. The strength and formability of the two-layer sheet produced by the explosive welding and the rolling processes were higher compared to the Al base sheet [19]. This improvement in the properties of two-layer sheets compared to Al sheets was one of the aims of producing two-layer or multilayer sheets with different materials.
The micro-hardness test results for the base and two-layer sheets are shown in Figure 6 to evaluate the hardening effect on the two-layer samples. The results showed an increase in the hardness of the two-layer sheets compared to the base sheets. This increase in the hardness of two-layer sheets was due to the application of strain and hardness in explosive welding and rolling processes [20].

3.2. Microstructure Analysis

This section evaluated the results of fracture studies, analysis of intermetallic phases, and layer penetration depth. Figure 7 shows the penetration depth for the two-layer sample and the composition percentage of the Al/Cu for the penetration area. The results in Figure 7a showed that Al/Cu bimetal sheets were 4.1 μm interpenetrated at the maximum value. By examining Figure 7b, it can be seen that in the two-phase region, the composition of Al and Cu was equal to 50%, indicating the penetration region’s homogeneity.
Different types of failure occur in metals, depending on the material, temperature, stress state, and strain rate [21]. Fracture surface studies were conducted for two-layer samples and base sheets (Figure 8) to study the effect of applied strains (rolling process and explosive welding) in two-layer samples on their fracture mechanism. By examining Figure 8a,b, it can be seen that the fracture mode for the Al and Cu base sheets was ductile fracture with deep and equiaxed dimples [22]. According to Al and Cu’s face-center cubic (FCC) crystal structure, their fracture mode could be considered ductile. Two-layer samples analysis (Figure 8c) showed that the fracture mode changed from ductile to brittle after explosive welding and rolling processes. The reason for changing the failure mechanism could include cold work, thus increasing the applied strain, and, as a result, increasing the dislocation density [23].

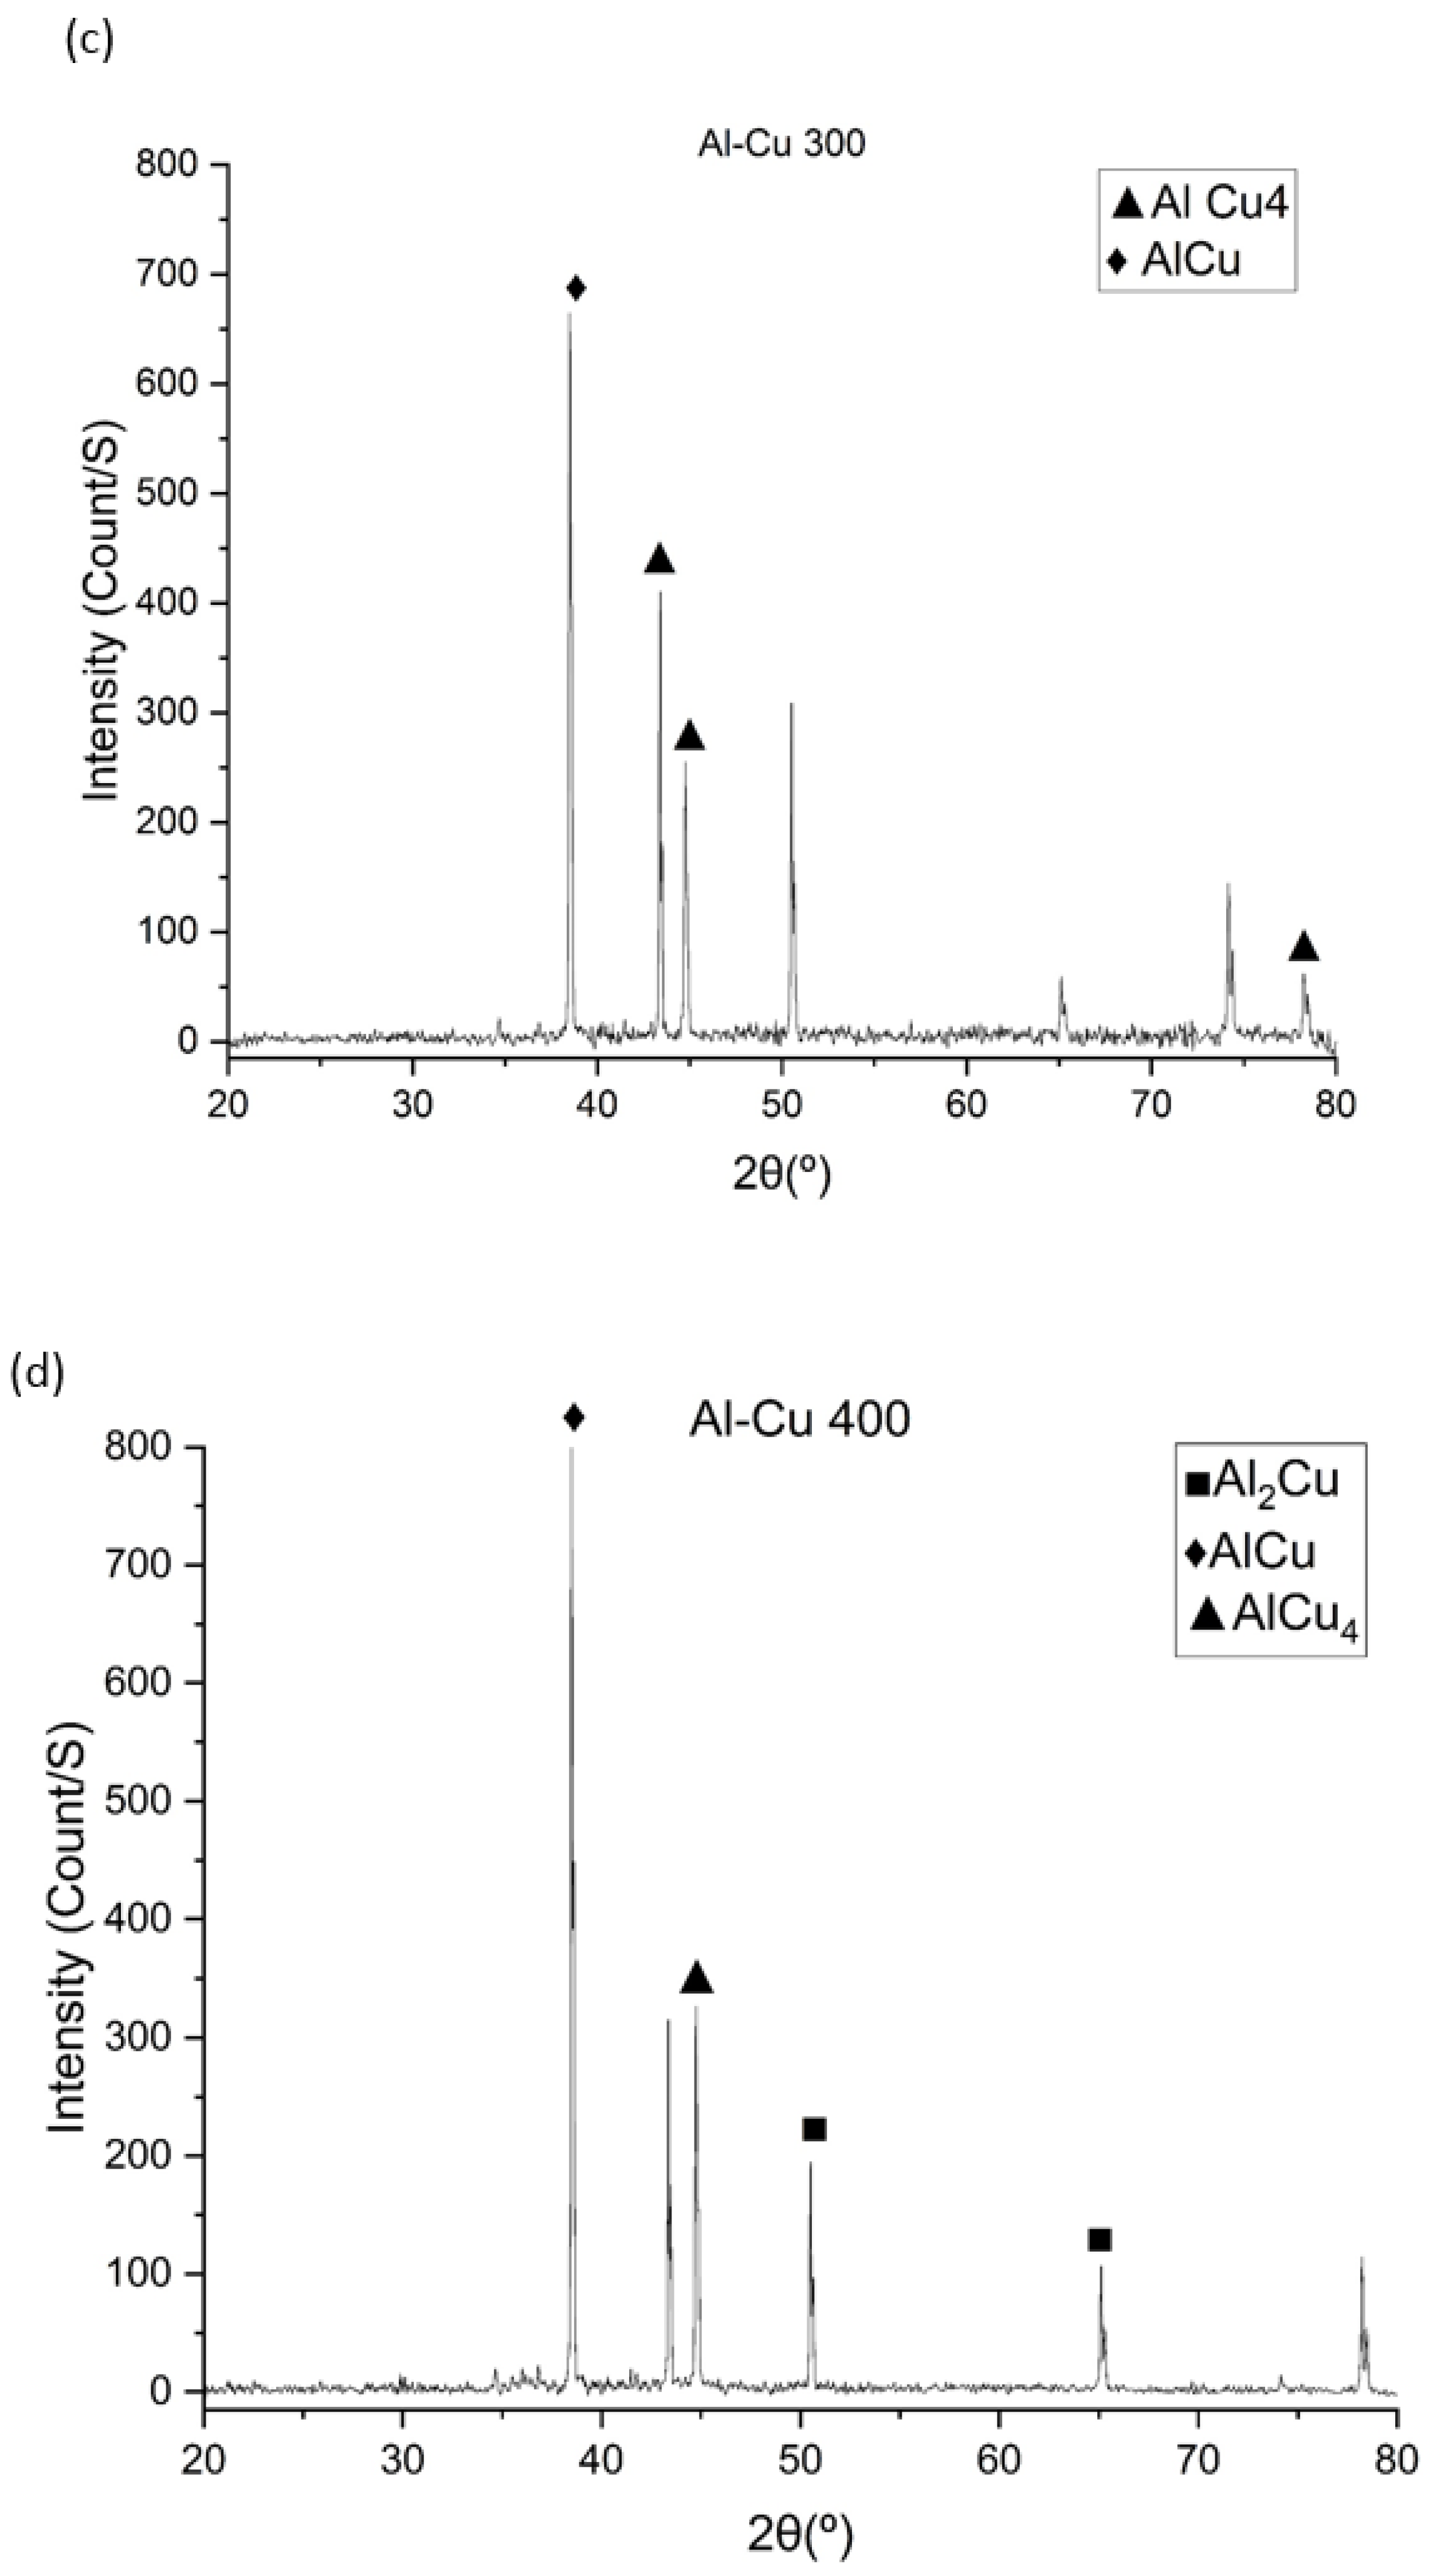
3.3. Intermetallic Study

In multilayer sheets, intermetallic phases will usually form in the penetration layer region. The intermetallic presence phases are generally harmful in bimetal metals [24]. The probability of new phase deposition will depend on factors such as the penetration state of atoms, thermodynamic driving force, and connection areas. New phases nucleate at defects, where the concentration of the infiltrated element is high, and are created along the interface [25]. In this case, studying the intermetallic phases at different temperatures is essential. The results obtained from XRD were analyzed using EXPERT High Score Plus software -5.2 version. Figure 9 shows the analysis of intermetallic phases observed in different temperature conditions. The XRD results indicated that Al and Cu, AlCu4, Al2Cu [26], and Al4Cu9 [27] peaks can be observed in the patterns. By examining the XRD pattern, it can be seen that increasing the annealing temperature will cause the production of more intermetallic phases for the two-layer sample (Figure 9d,e). An increase in temperature can provide the activation energy necessary for the emergence of intermetallic phases, which is one of the reasons for the existence of intermetallic phases with an increase in annealing temperature [28,29].

3.4. Incremental Forming Results

The SPIF process with three strain paths, name straight groove, pyramid, and cone geometric, was carried out until failure occurred in the sample. The limit forming angle, fracture depth, and FLD were studied for each sample. Figure 10 and Figure 11 show the formed samples for the base sheet and two-layer samples, respectively. Due to Cu’s higher formability in two-layer samples than Al (Figure 5), the Cu layer is located on the outside (the Al layer is in contact with the tool and is called Al/Cu). Investigations were carried out for the pyramid sample with the Al outer layer to check the effect of layer arrangement. The forming sample can be seen in Figure 12. The results of the depth and forming limit angle for the base sheet and two-layer samples are shown in Table 1. By investigating Table 1, it can be seen that the 2-layer sheet with the Al/Cu arrangement has higher formability than the Cu/Al arrangement. This is related to the higher formability of Cu compared to Al. FLDs for base sheets and two-layer sheets are shown in Figure 13. By examining the FLD for the base samples (Figure 13a), it can be seen that the obtained strains are close to the plane strain conditions reported. However, the FLD is obtained for two-layer samples under biaxial strain conditions (Figure 13b). The reasons for this change in the strain conditions for the two-layer samples compared to the base sheet can be attributed to the work of hardening and the high strain rate on the two-layer samples in the explosive welding and the rolling process, which causes a higher thinning rate of the two-layer samples under SPIF process [30]. Figure 13c is the FLD obtained to study the influence of the arrangement of the two-layer sample with a pyramid geometry. It can be seen that with the arrangement of the Cu outer layer, the FLD has higher strains at the moment of failure [31].

3.5. FEM Results

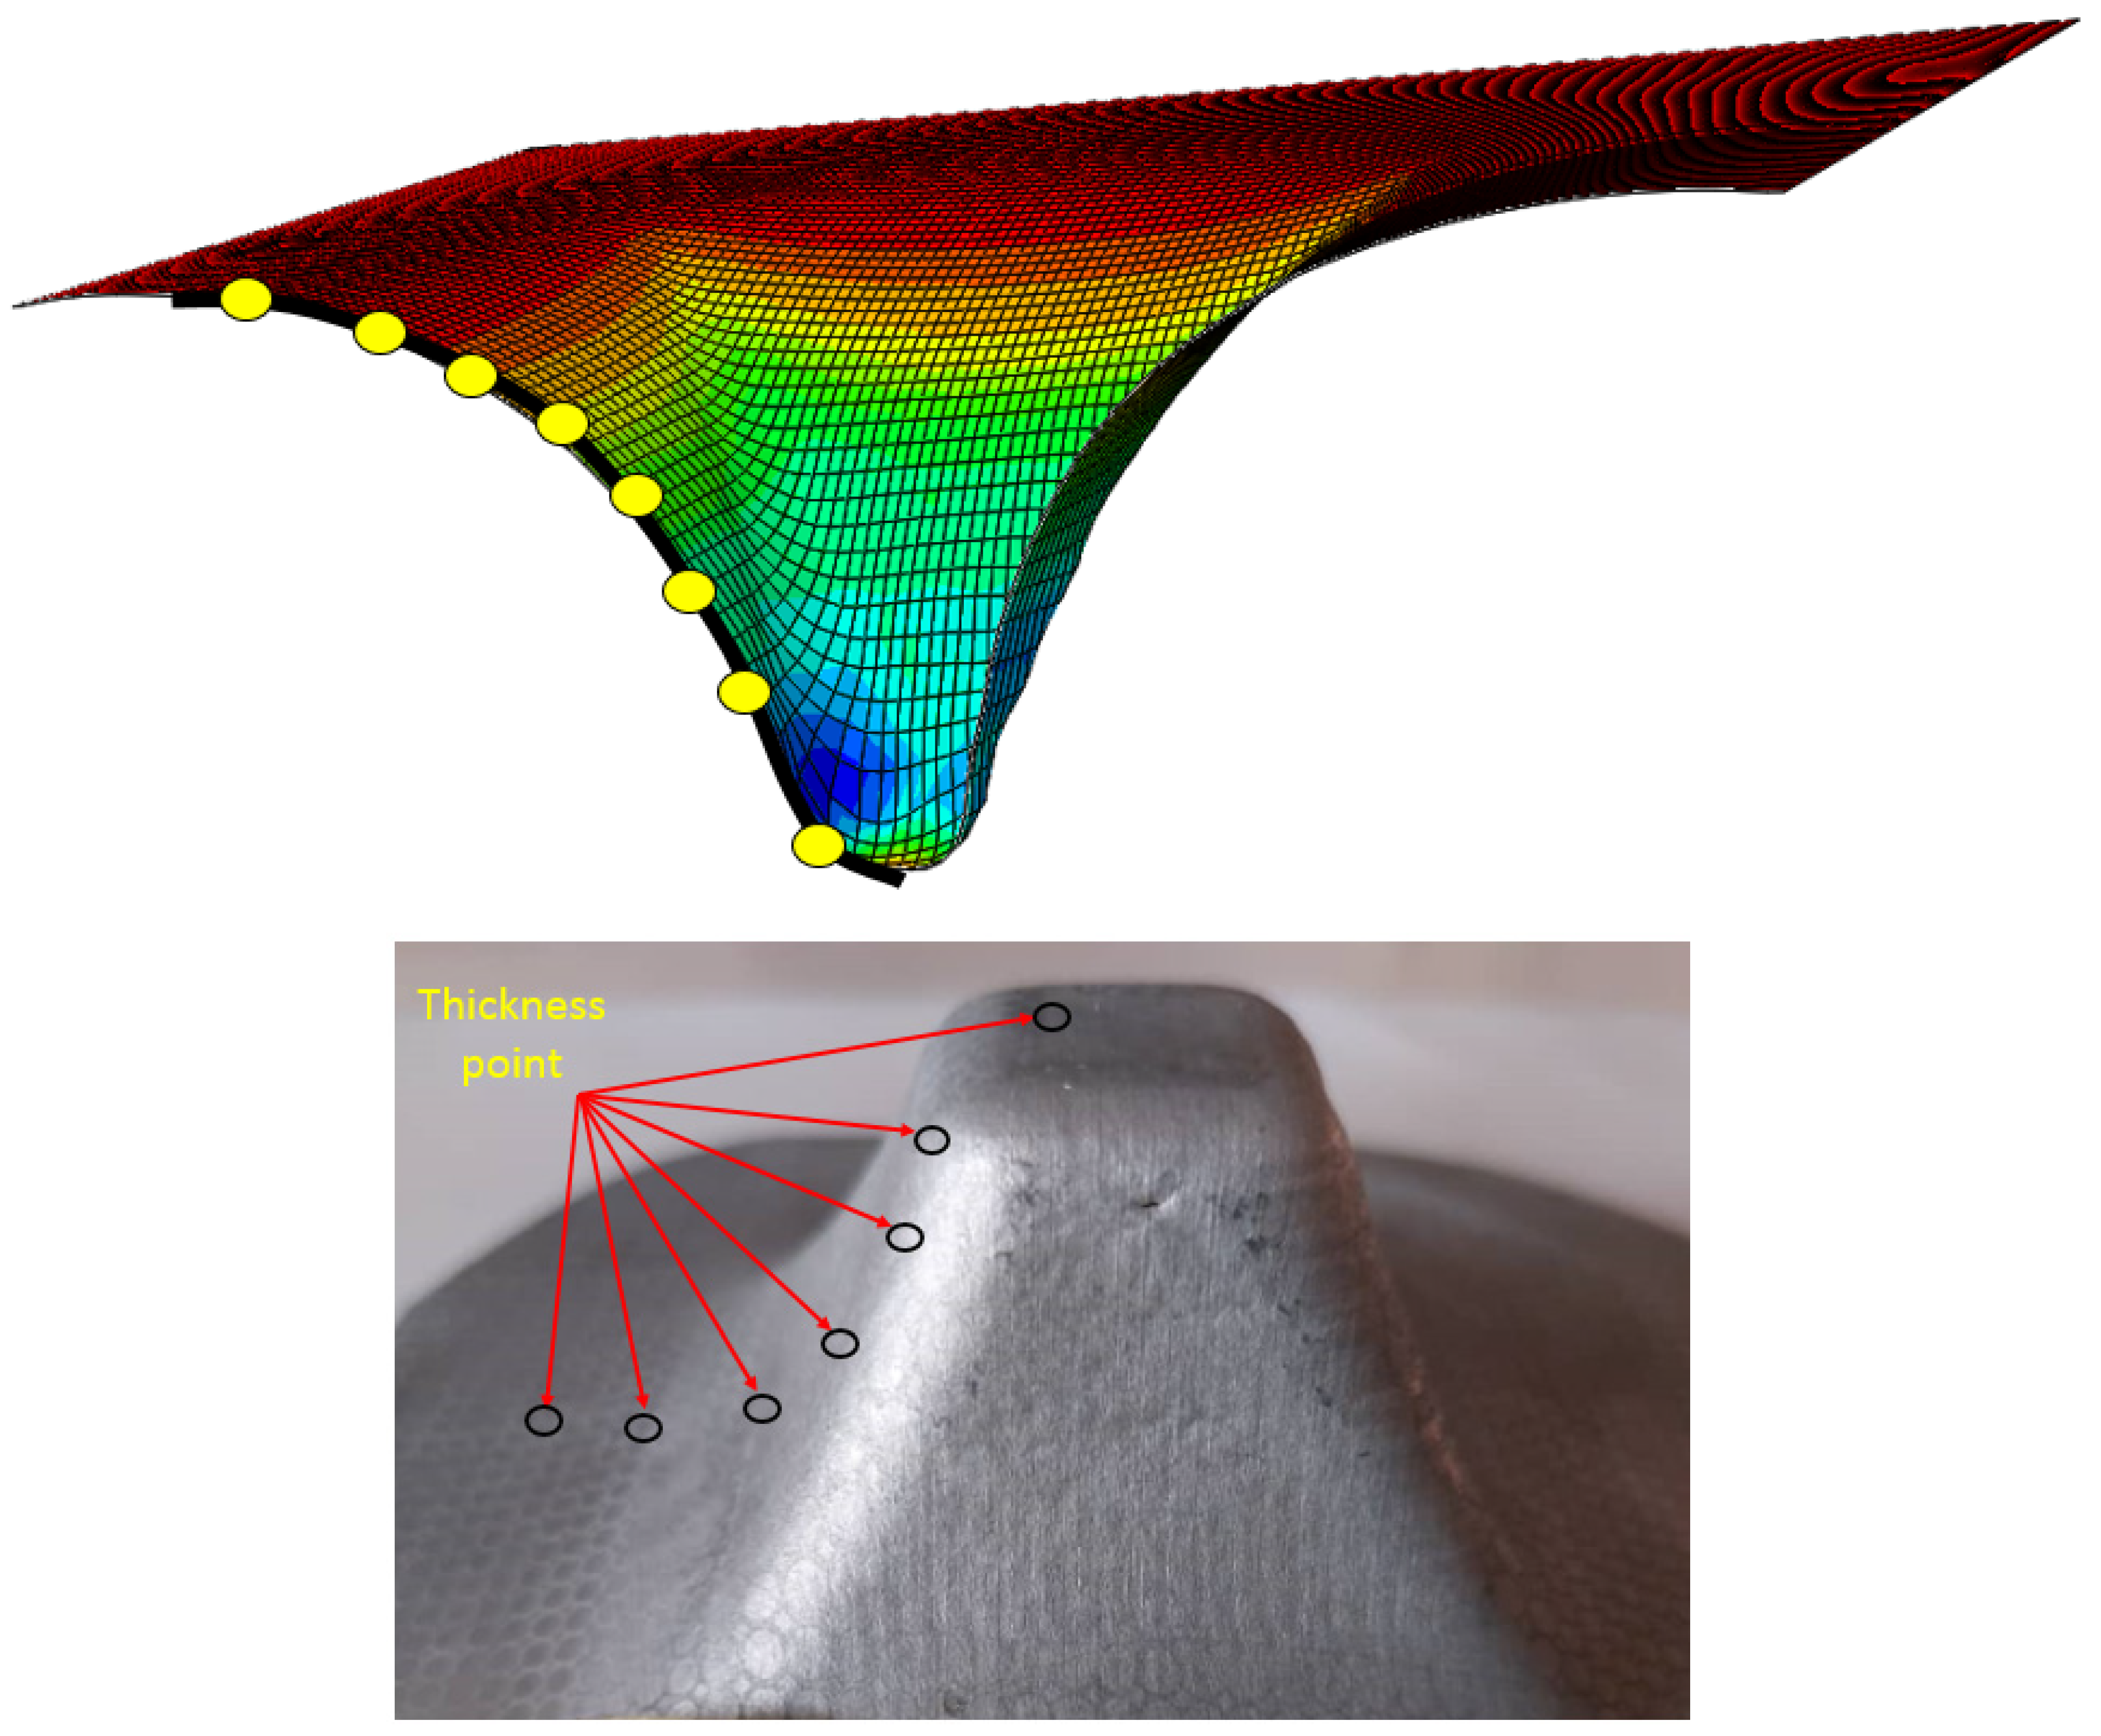
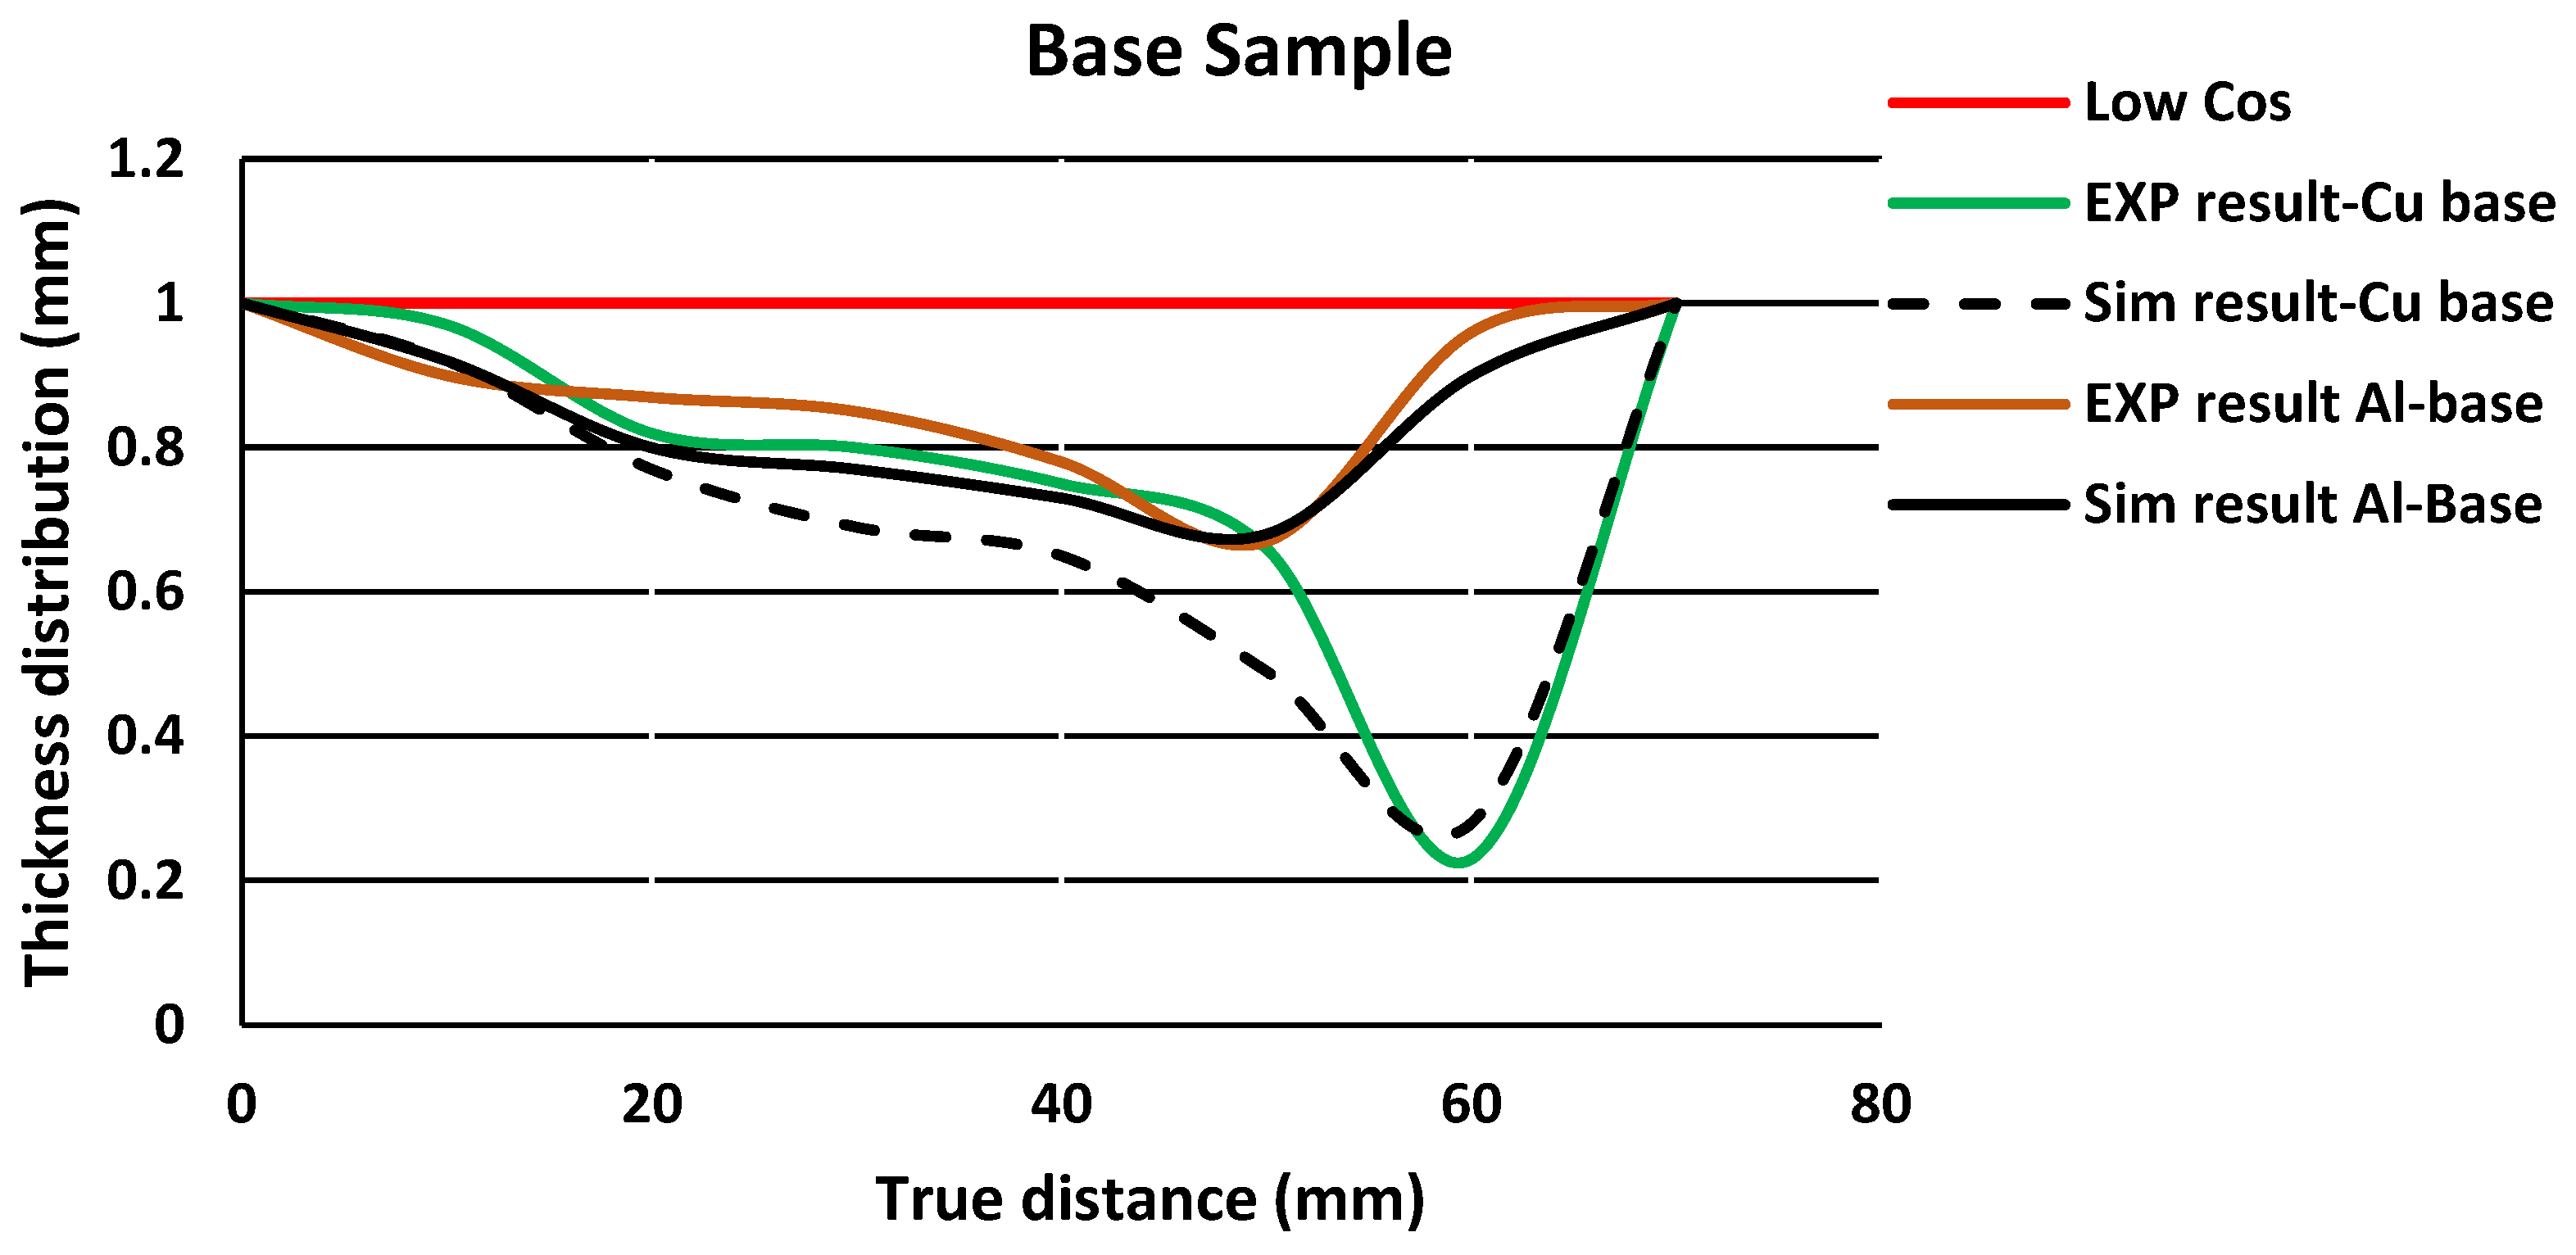
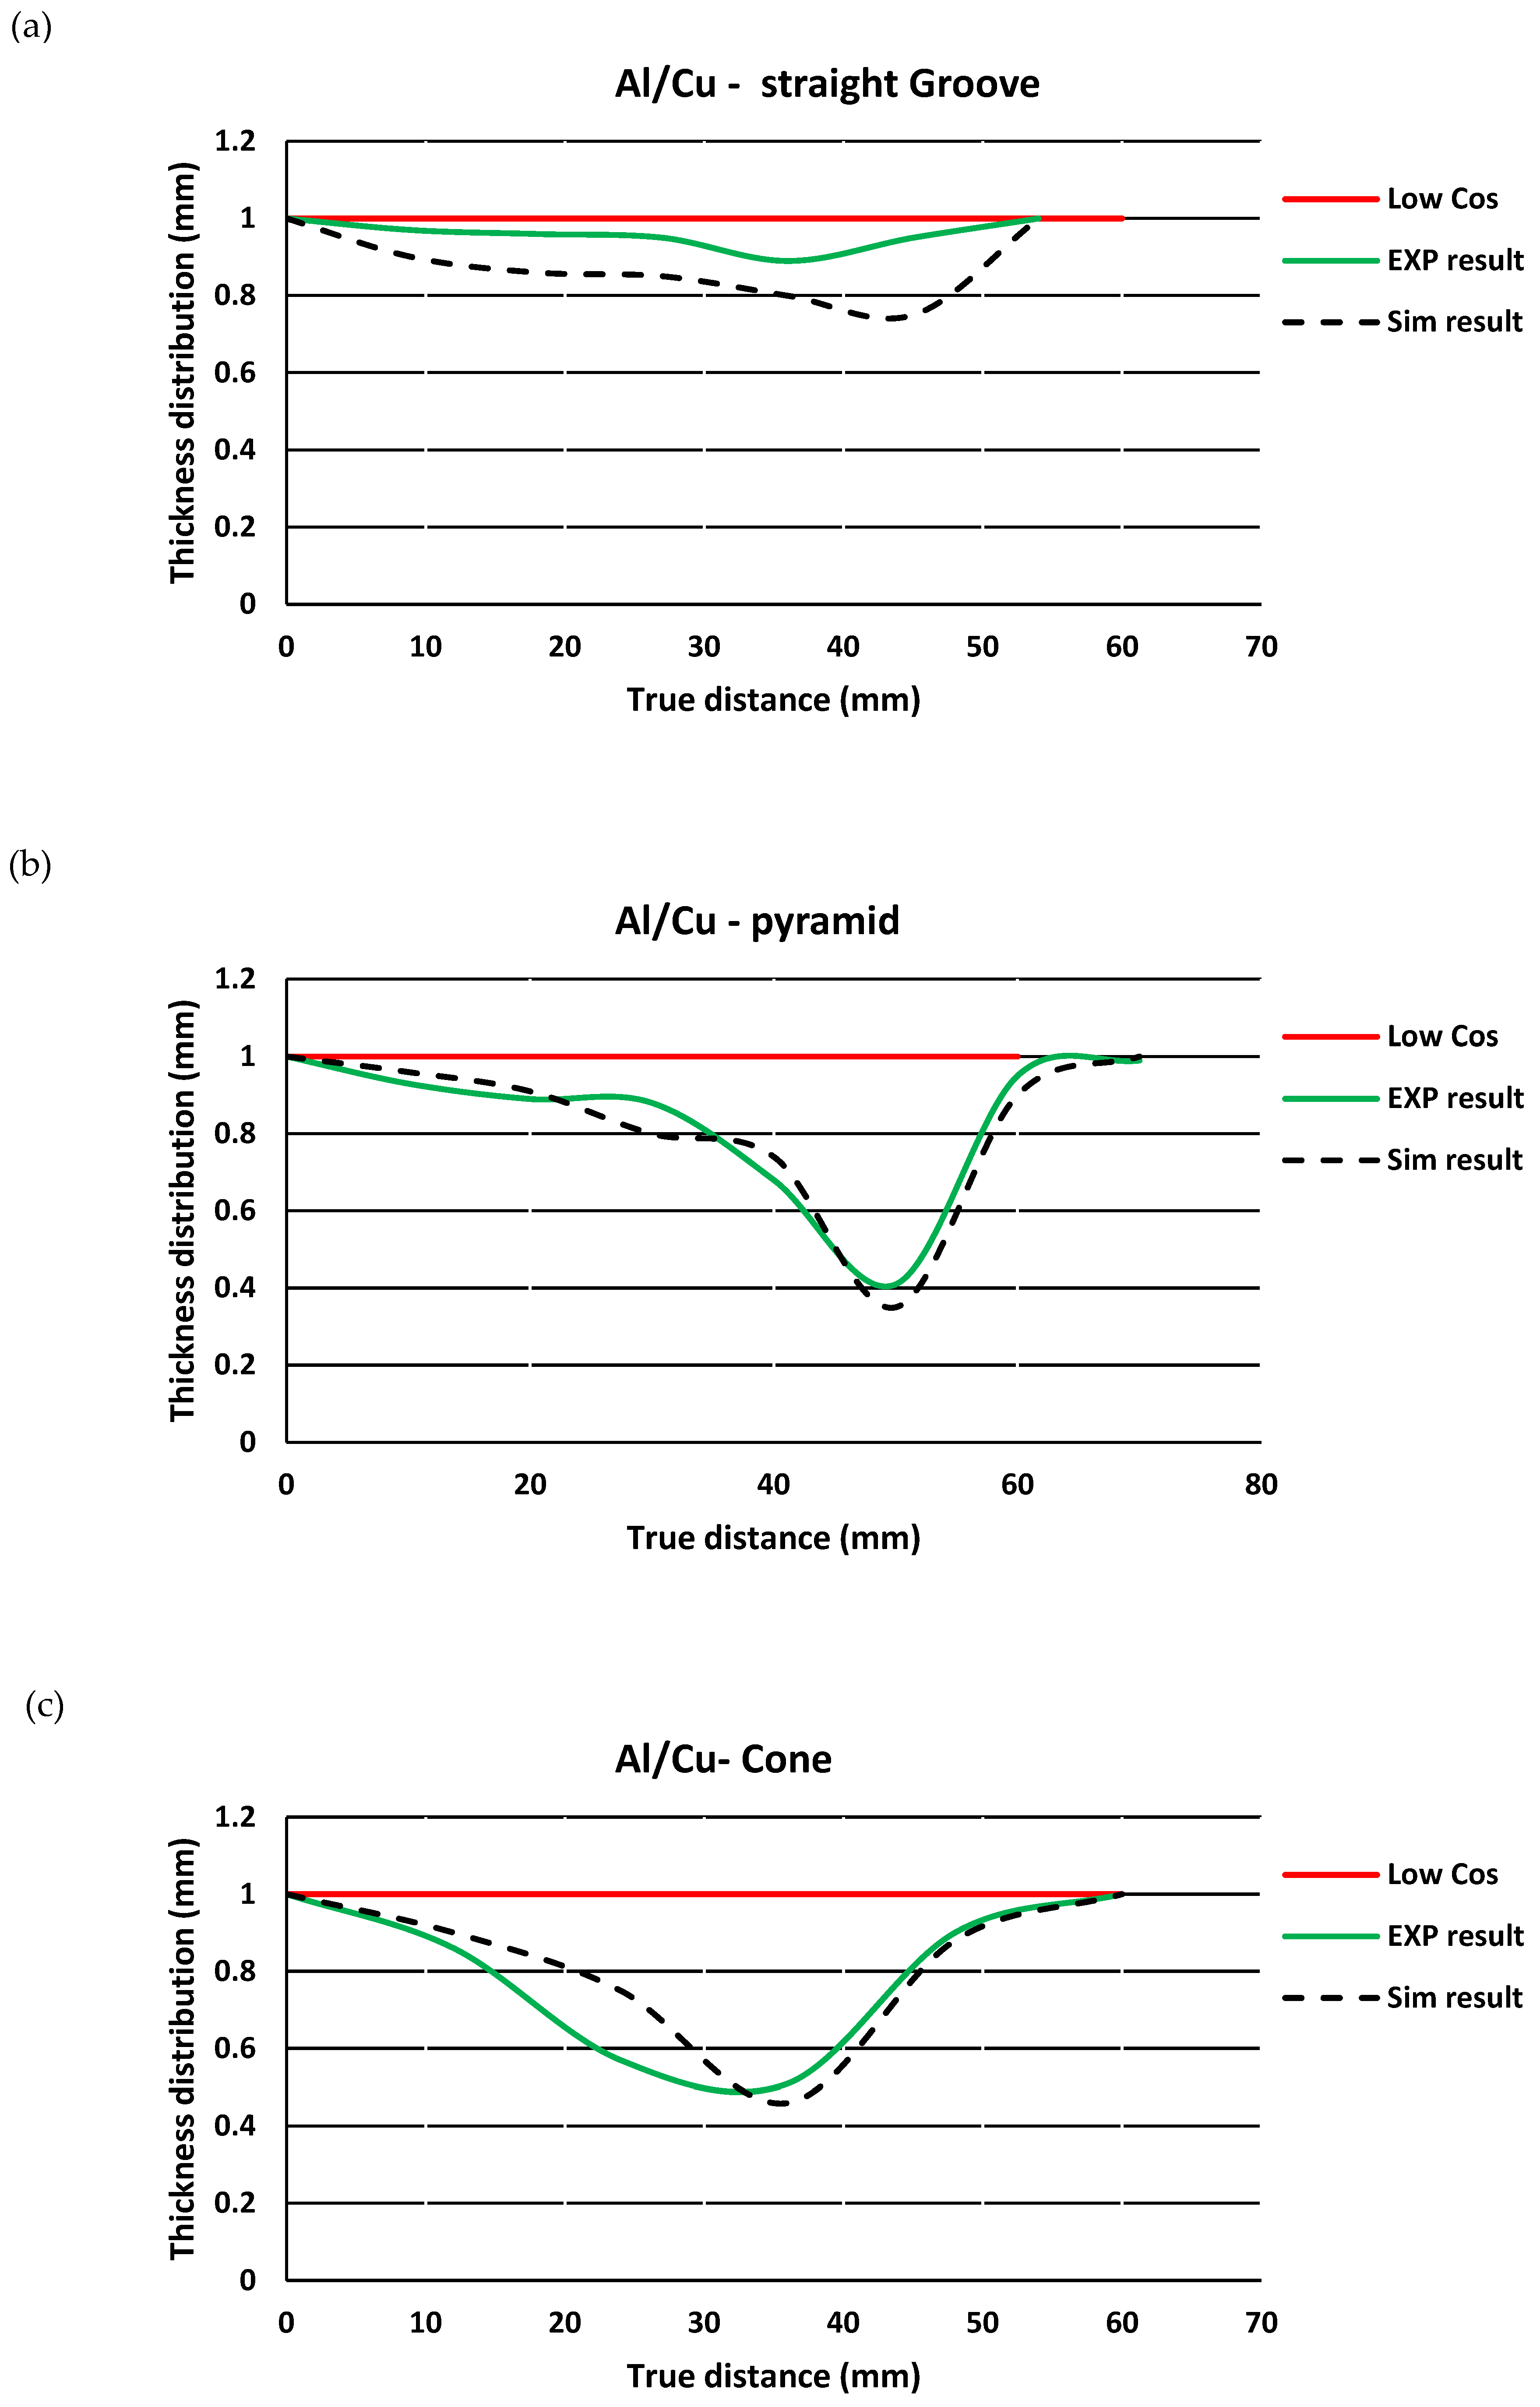
3.5.1. Thickness Distribution

In forming processes, one of the essential parameters that can be evaluated is the thickness distribution parameter. The thickness distribution is usually caused by the stress created along the thickness. In the SPIF process, the thickness distribution can be predicted from the cosine law [18]. Increasing the forming limit angle in the SPIF process will increase the thickness distribution in the formed sample [32]. In this article, to measure the thickness distribution experimentally, the thickness distribution was measured at seven points along the wall by a micro-meter (Figure 14). Next, to validate the simulation results with the experimental test, the thickness distribution was measured using the simulation method. The results related to the thickness distribution for the base sheet and two layers of samples are shown in Figure 15 and Figure 16, respectively. By examining the results obtained from the experimental test and simulation method, it can be seen that the maximum error for predicting the thickness distribution in the simulation method compared to the experimental test is 9%, which is for the two-layer sample with a straight groove. According to the insignificant error percentage obtained from the numerical method, the validation of the simulation method compared to the experimental method was performed for the two-layer sample.

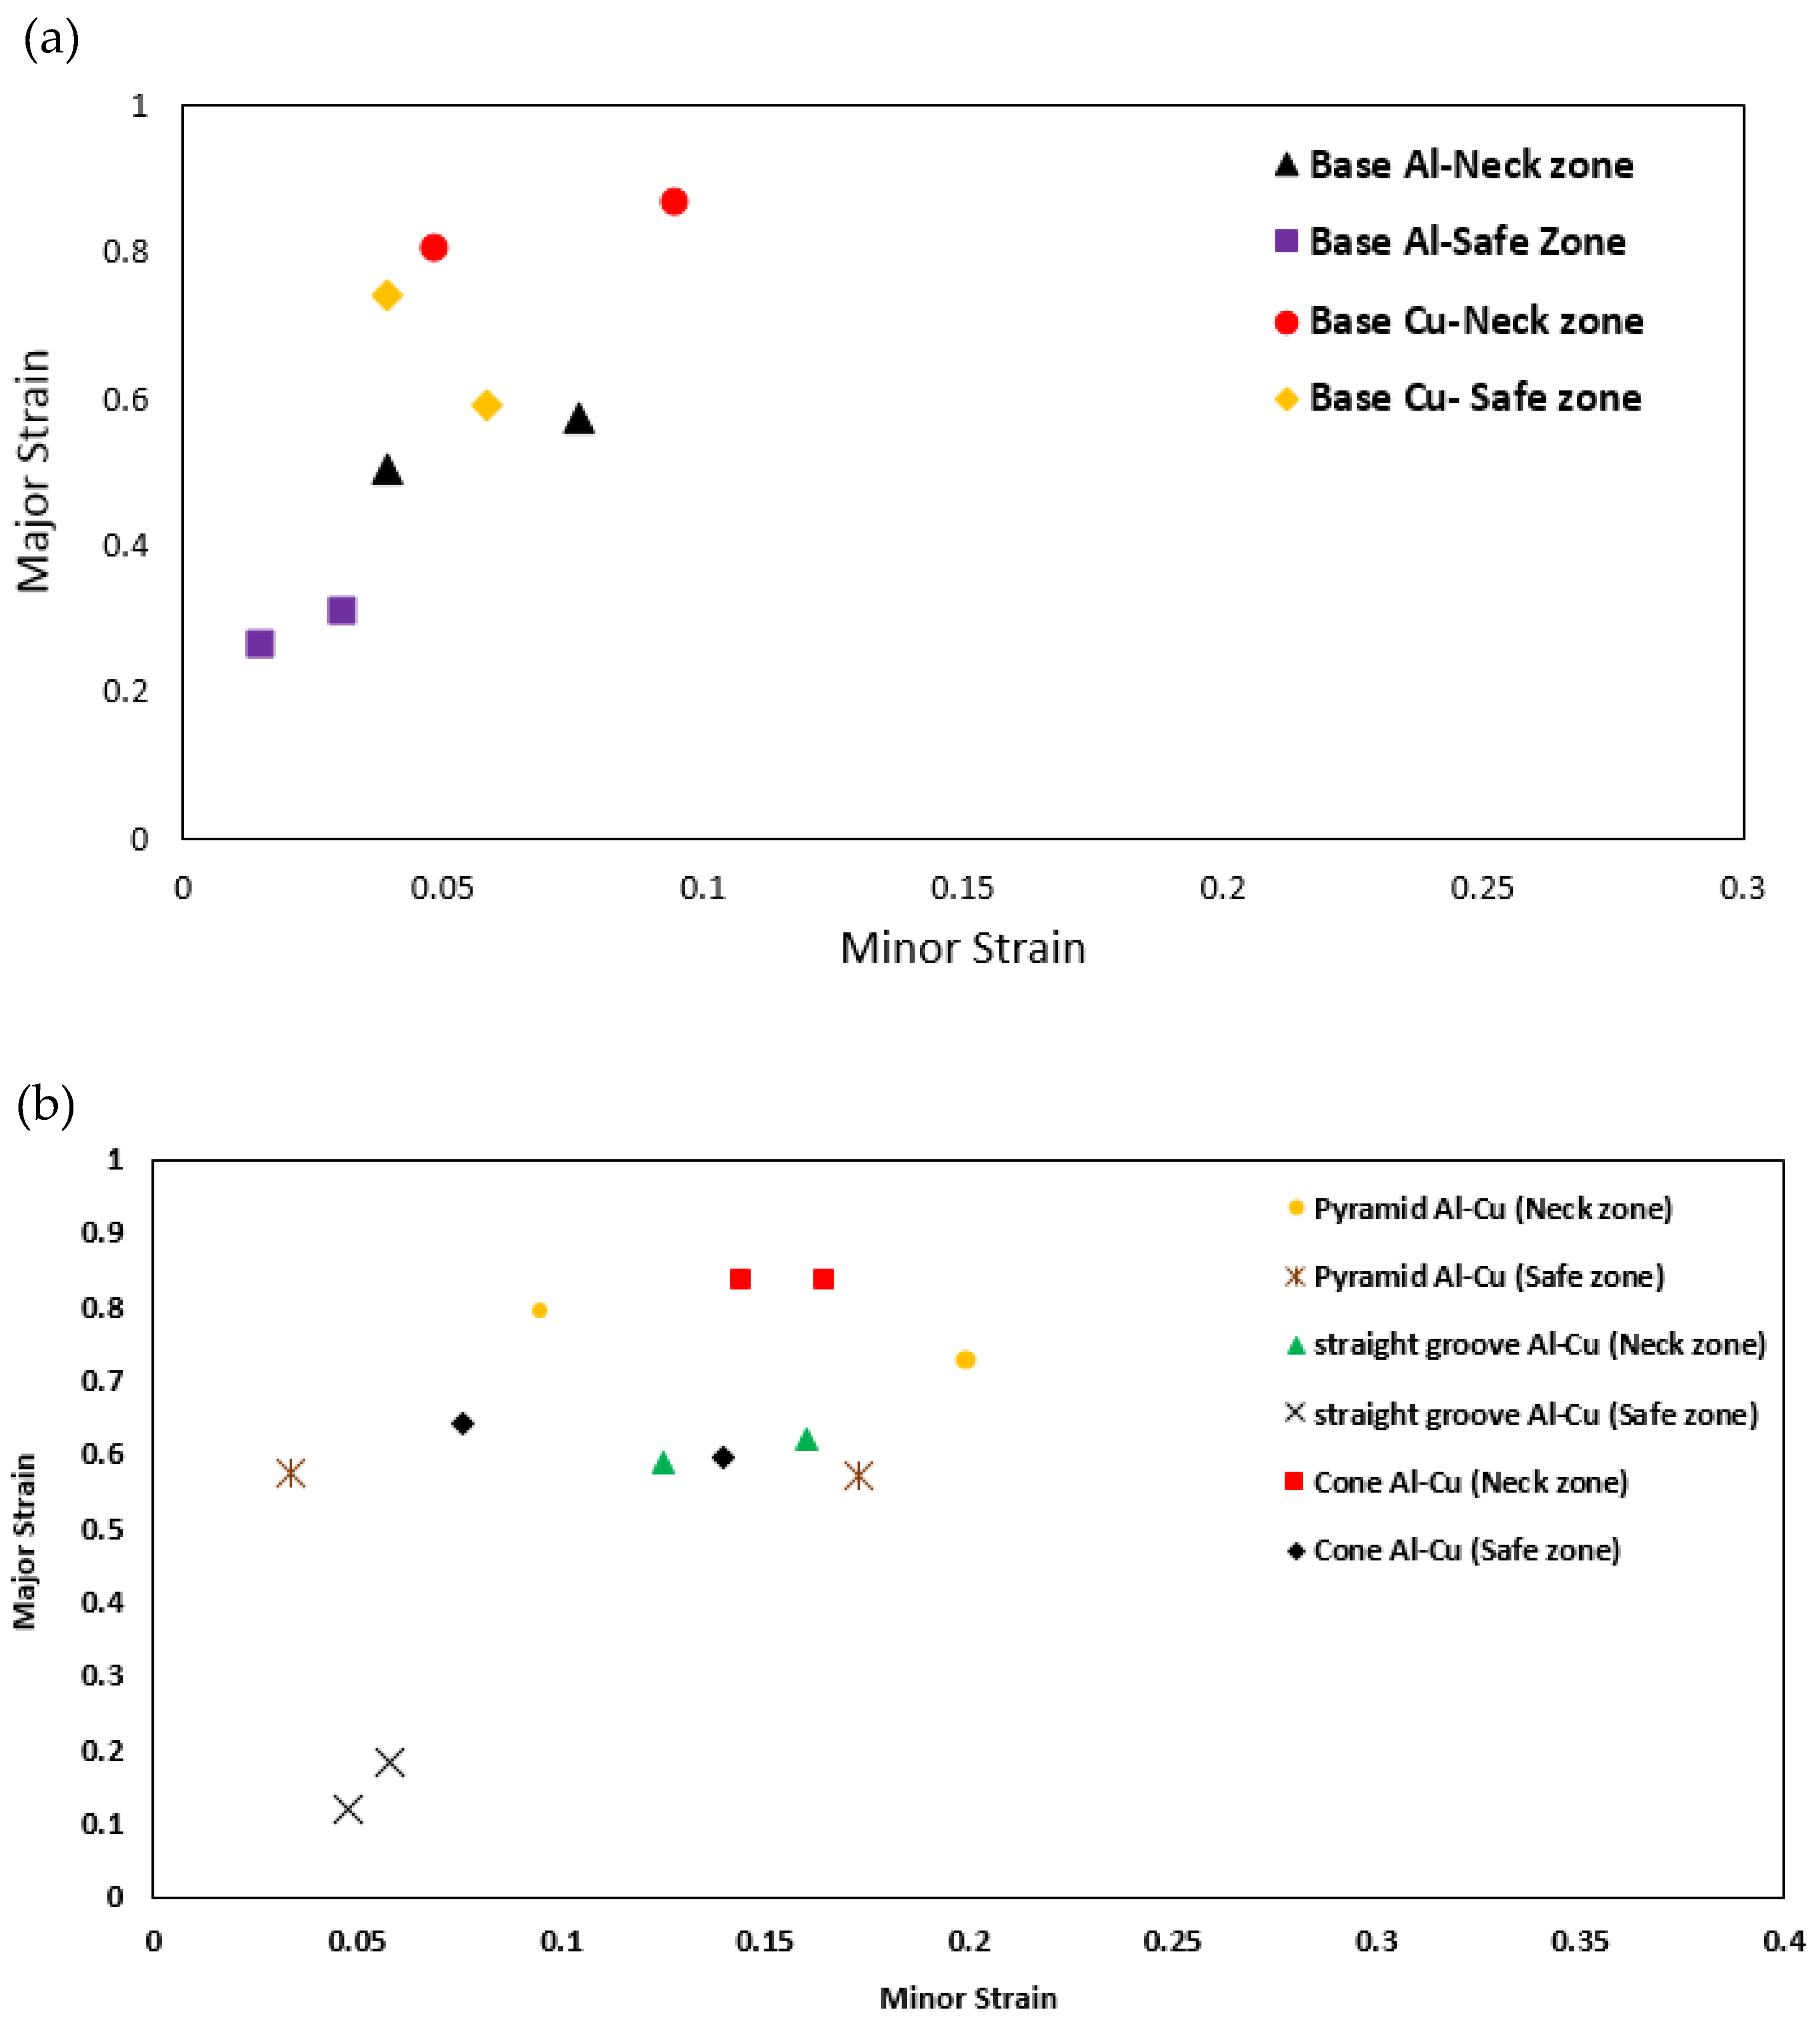
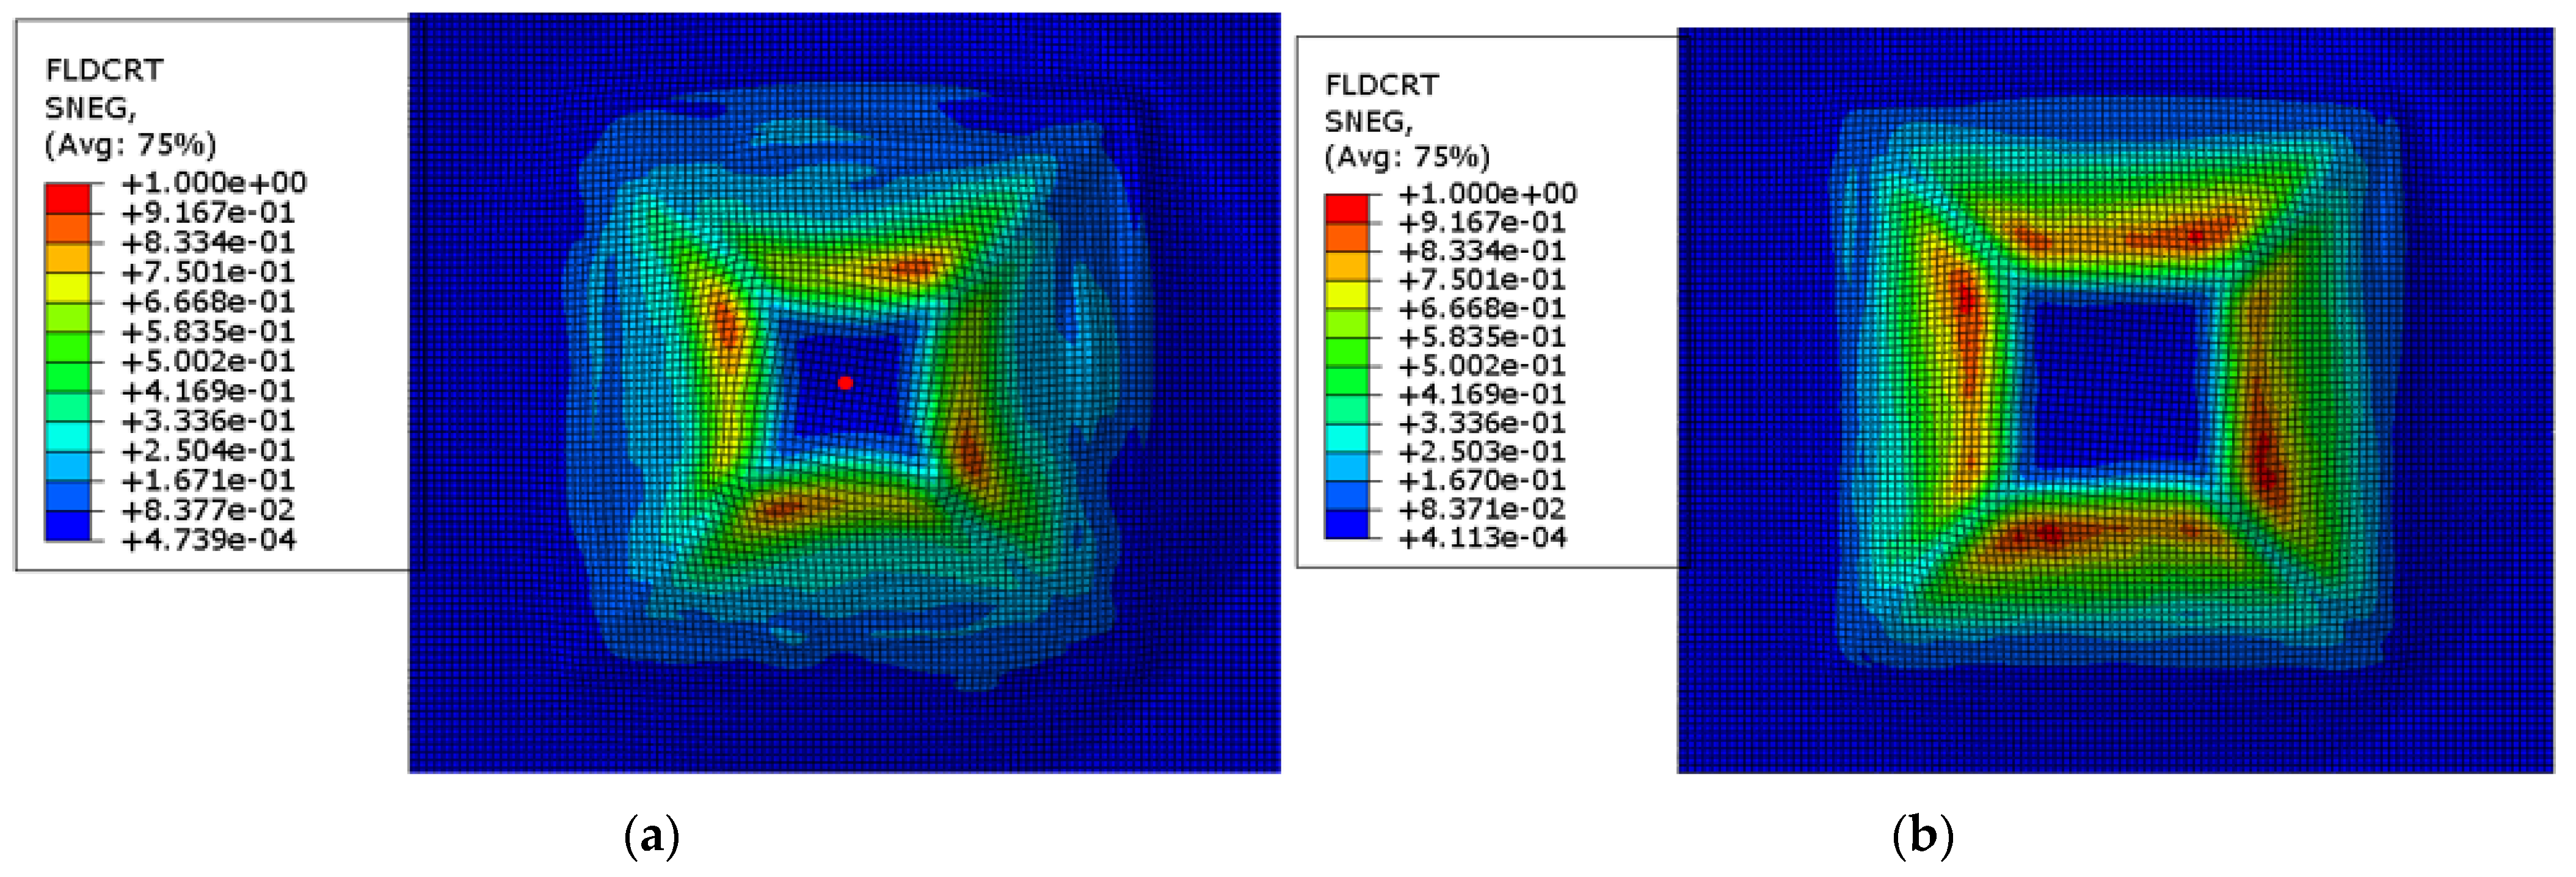
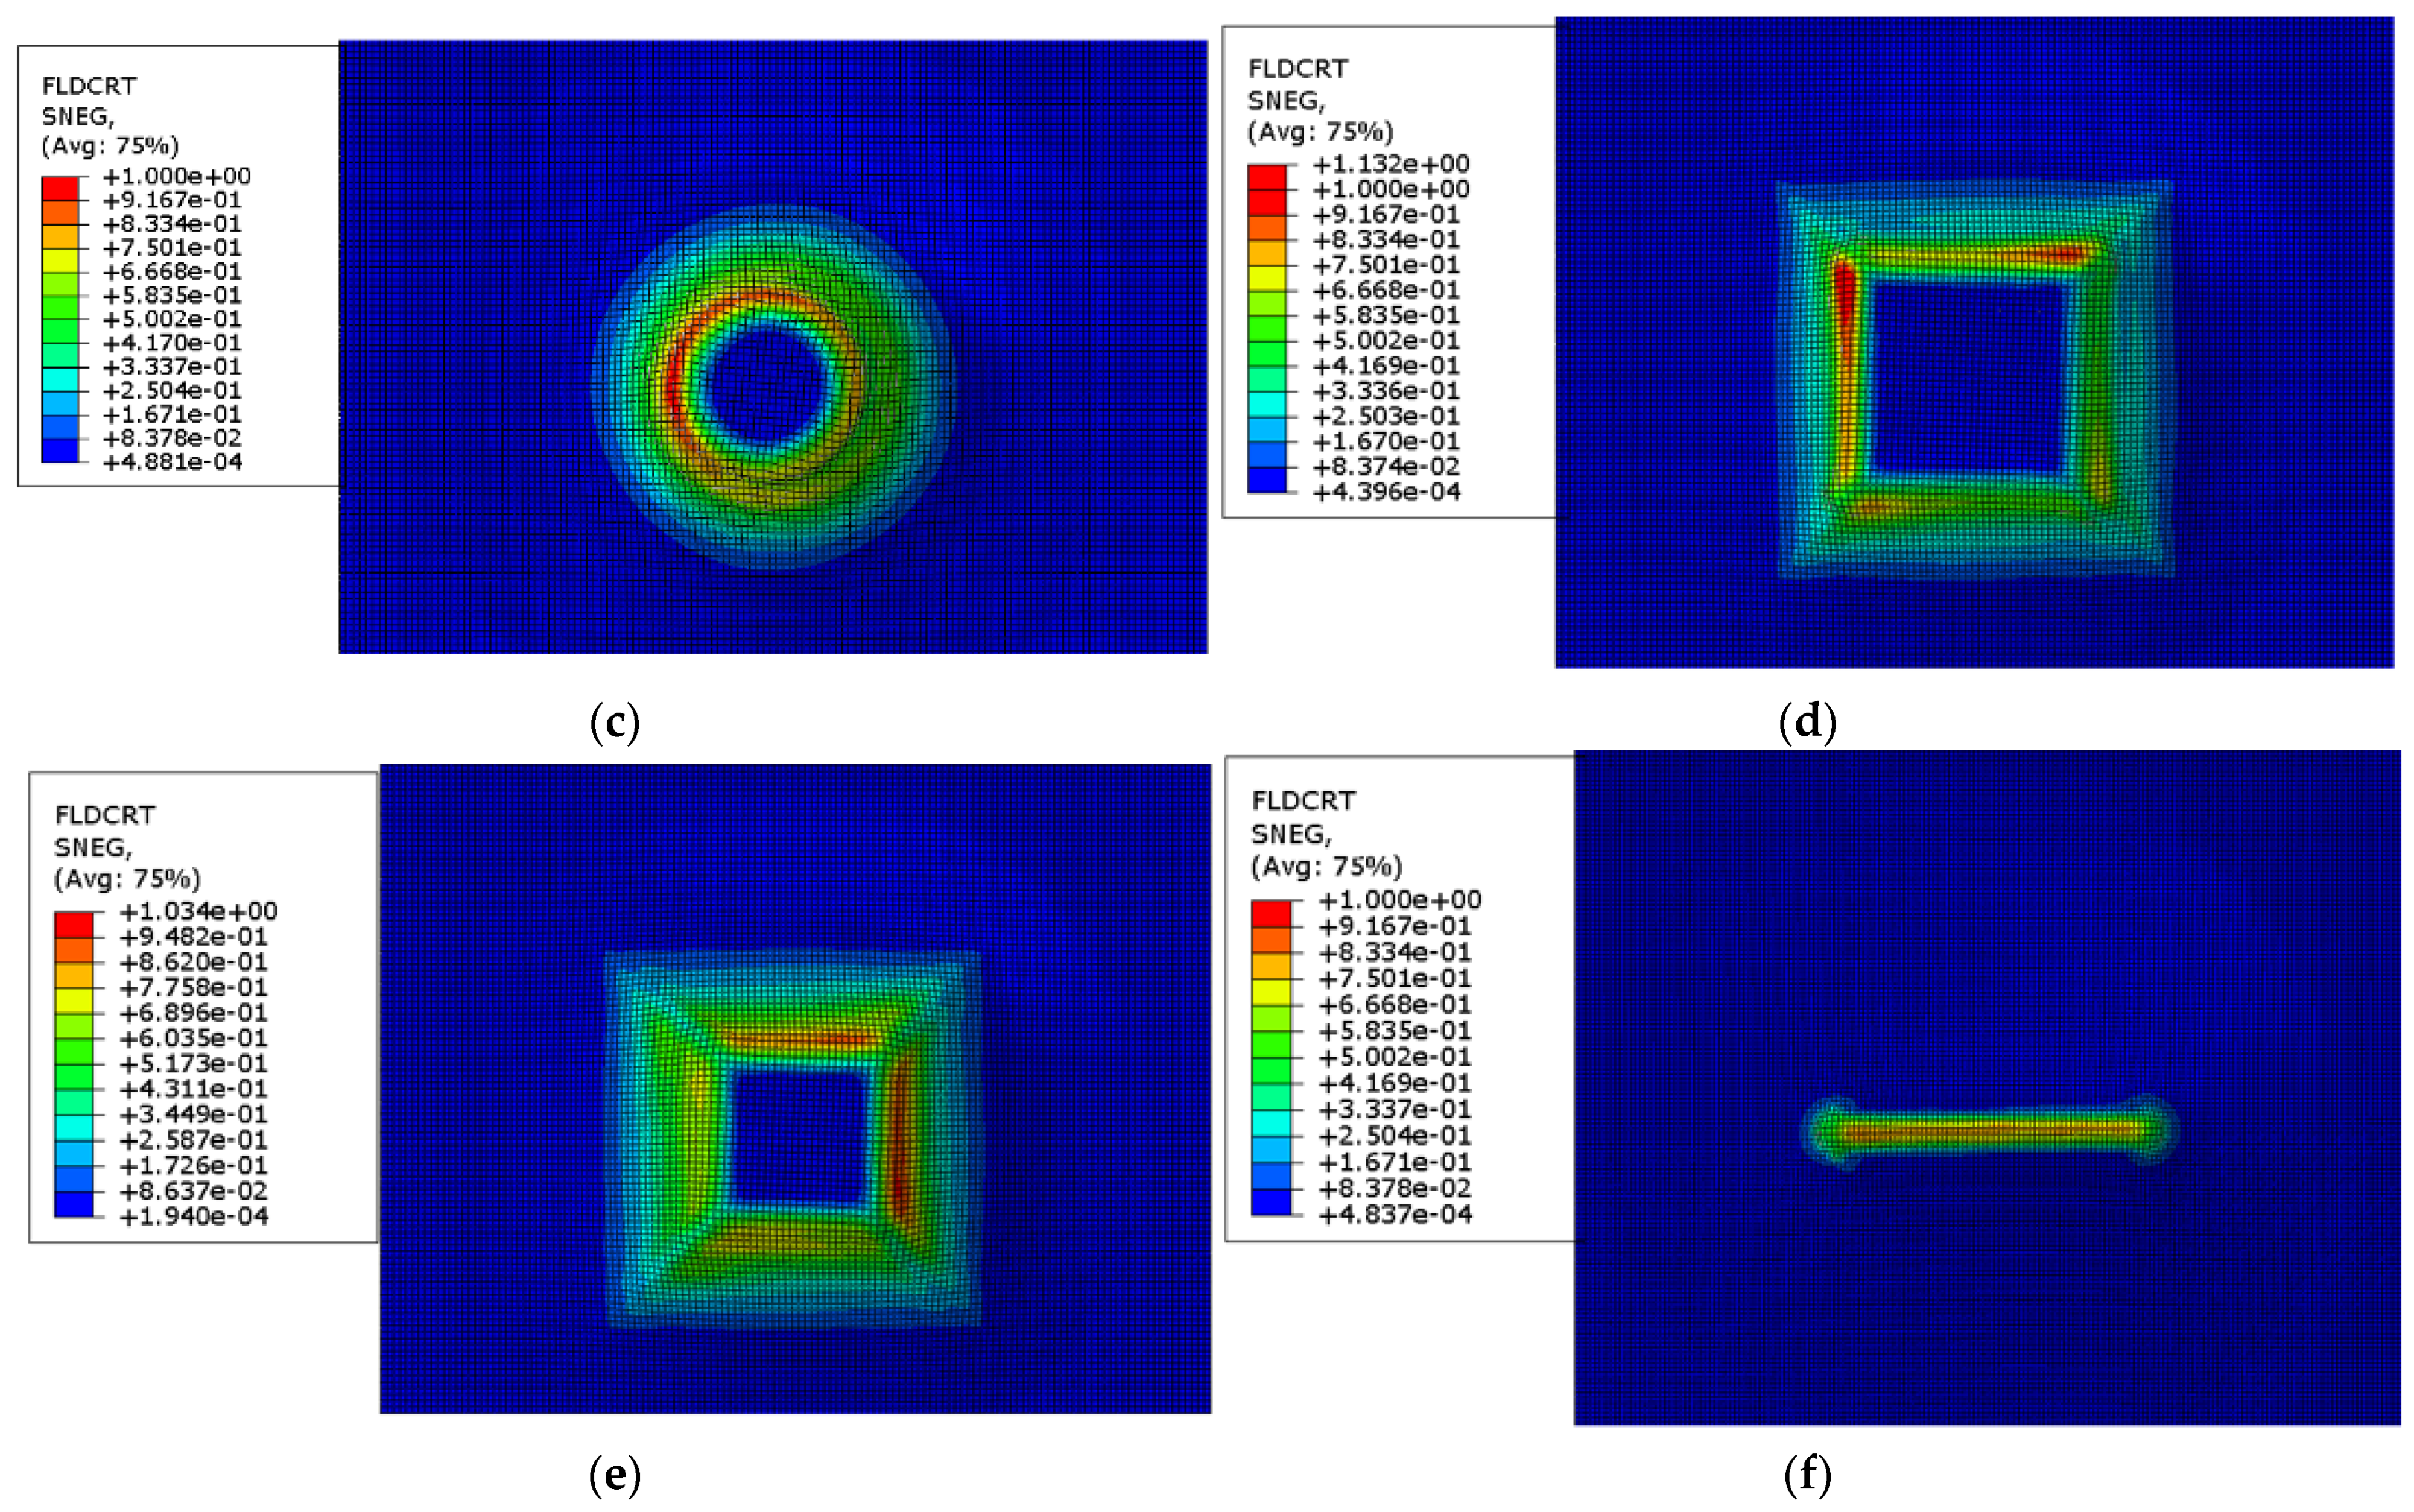
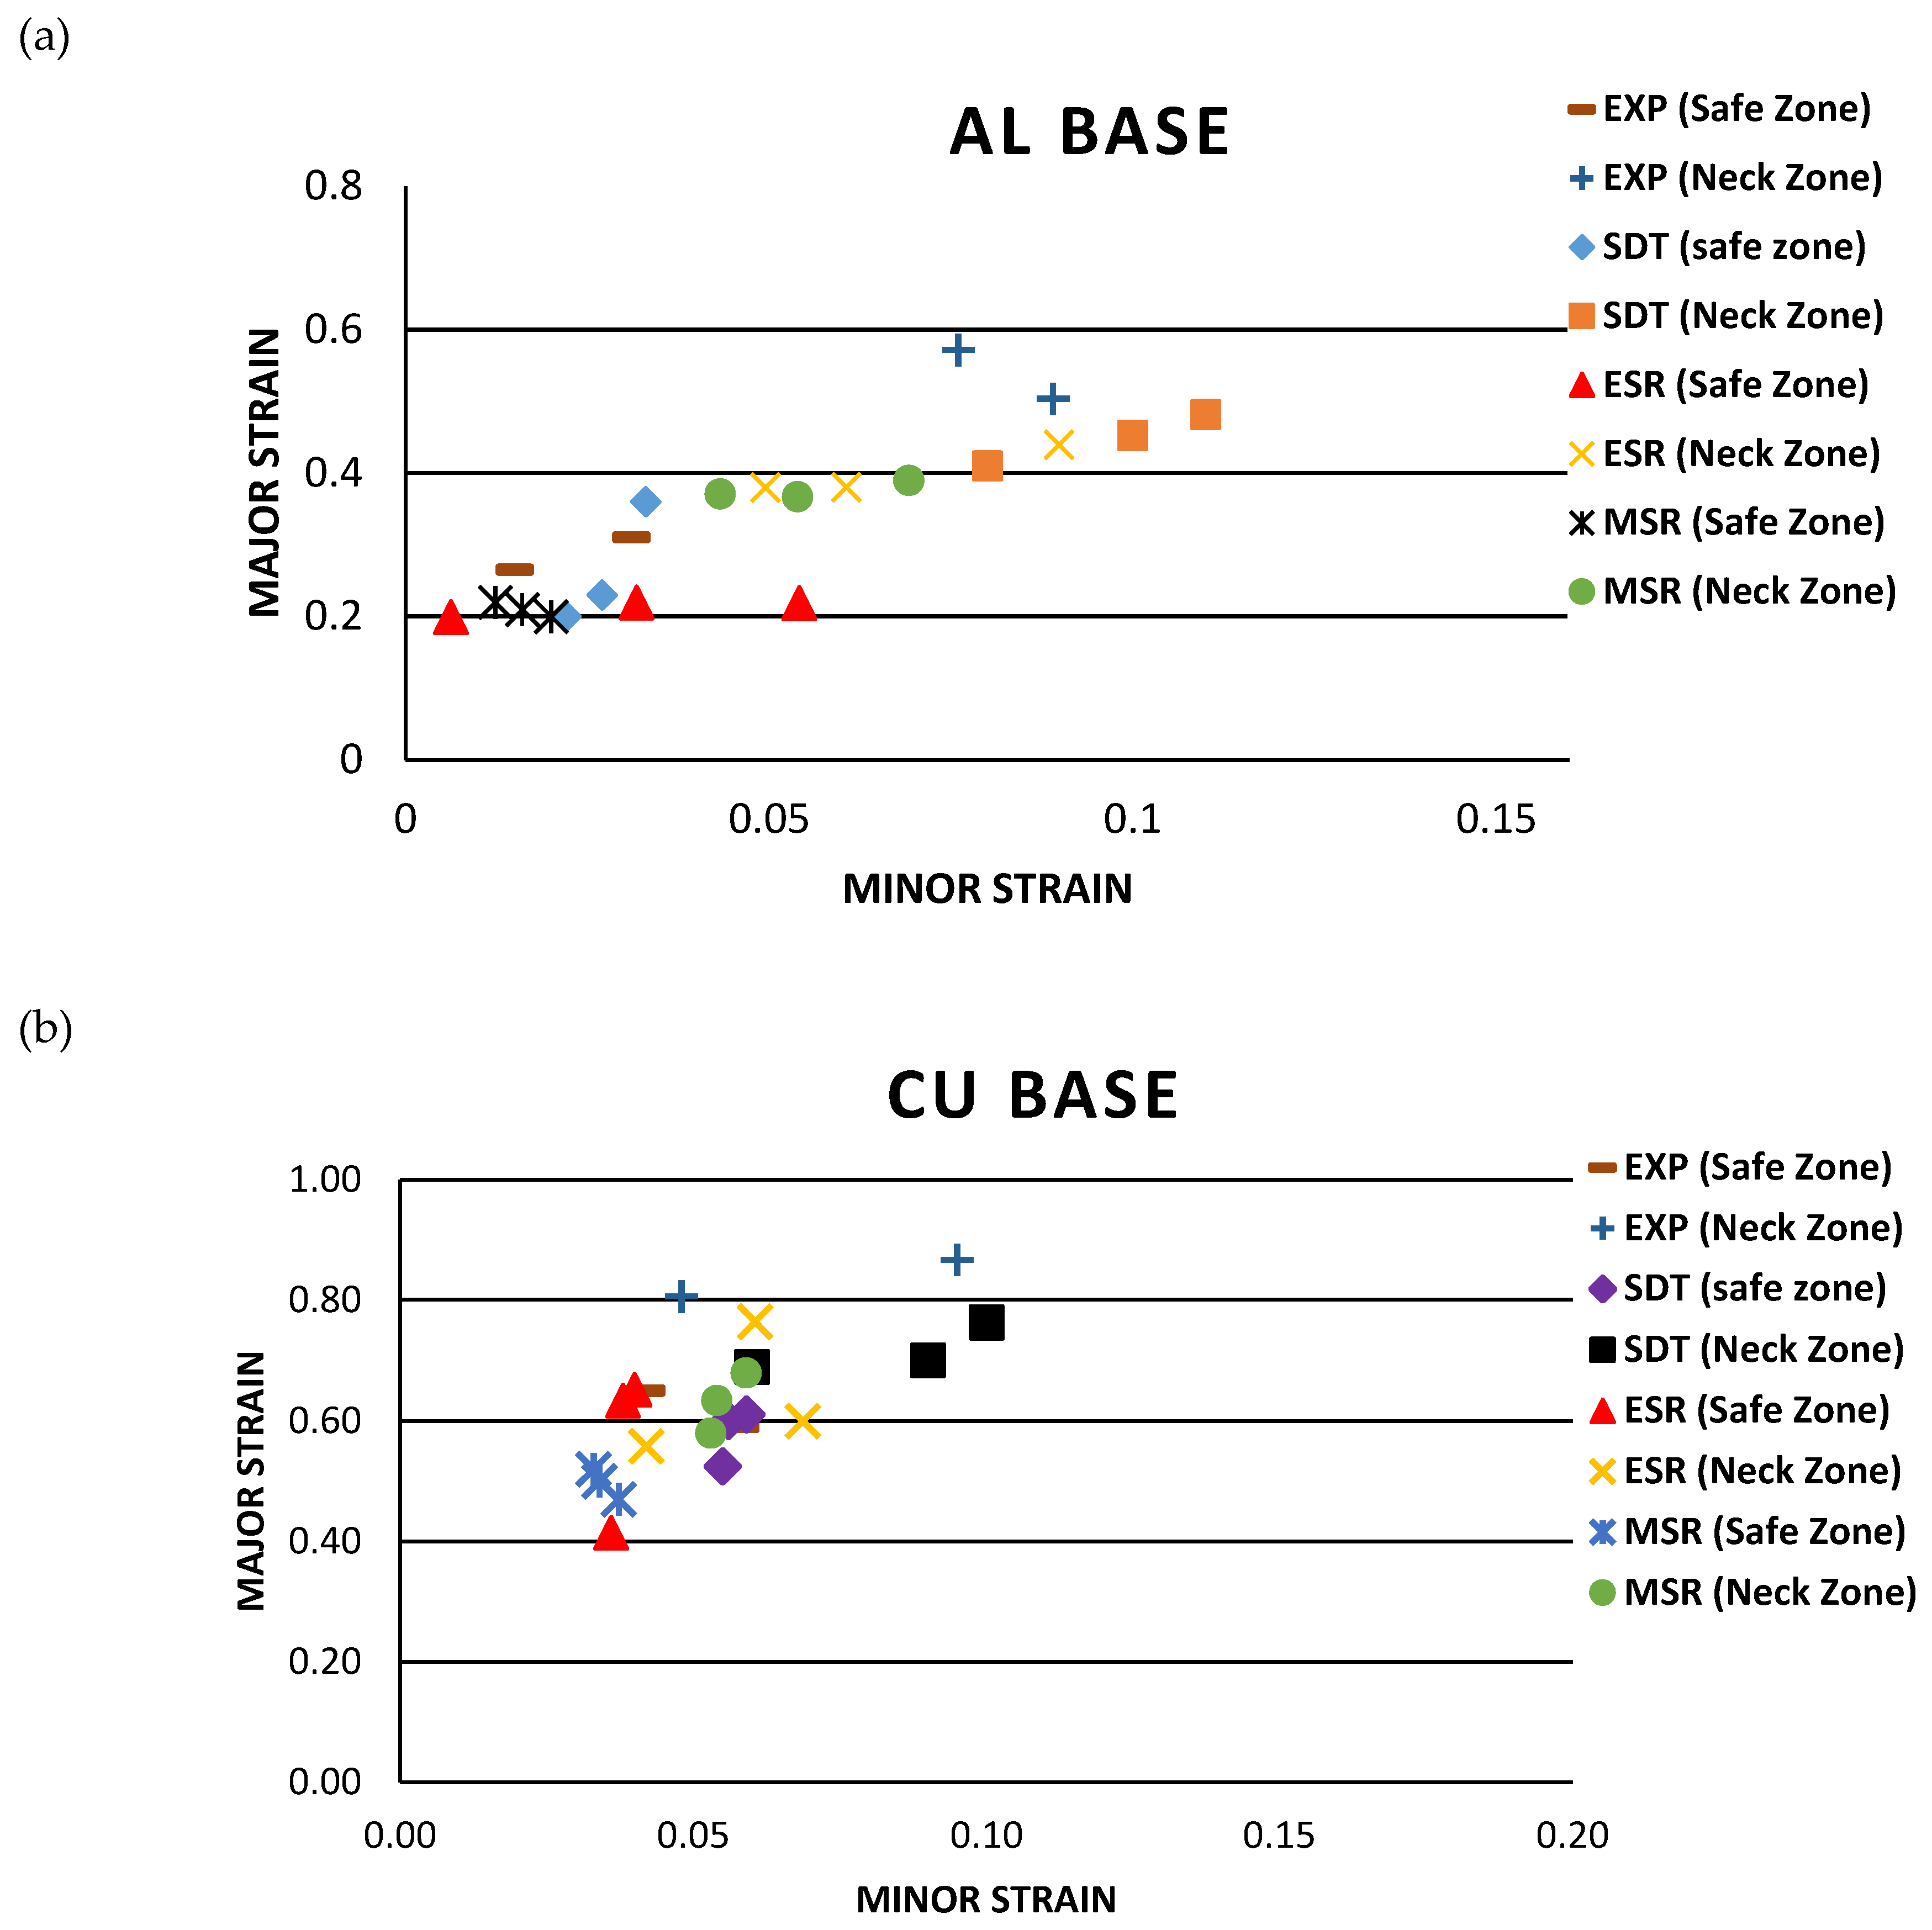
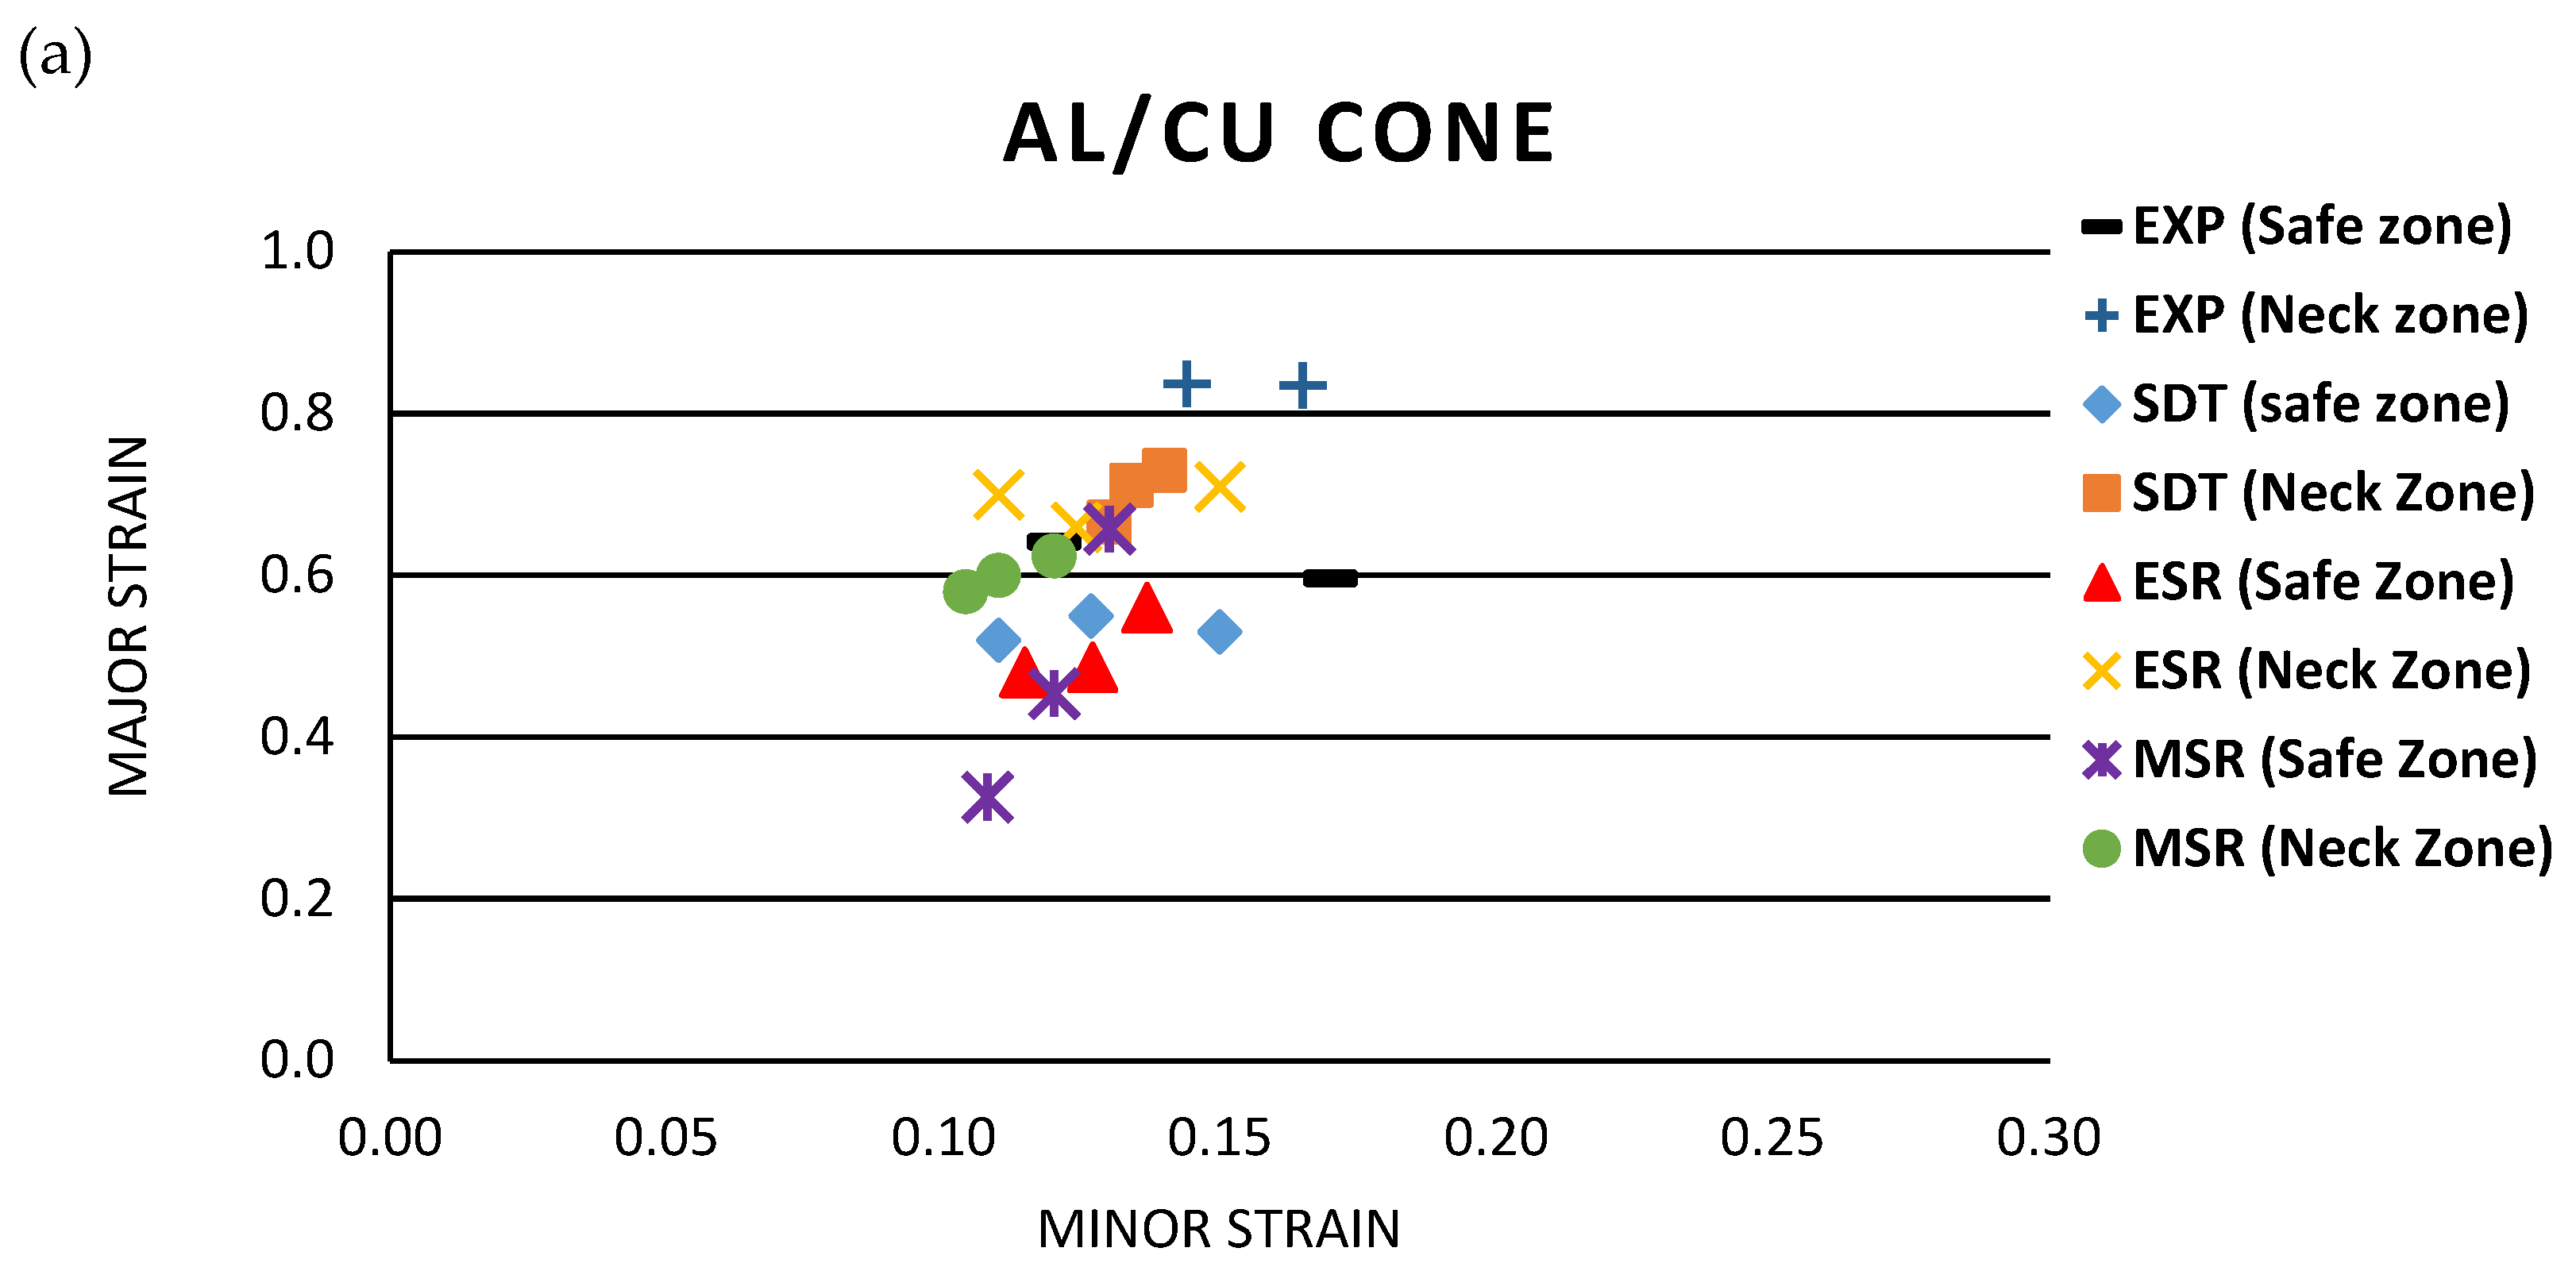
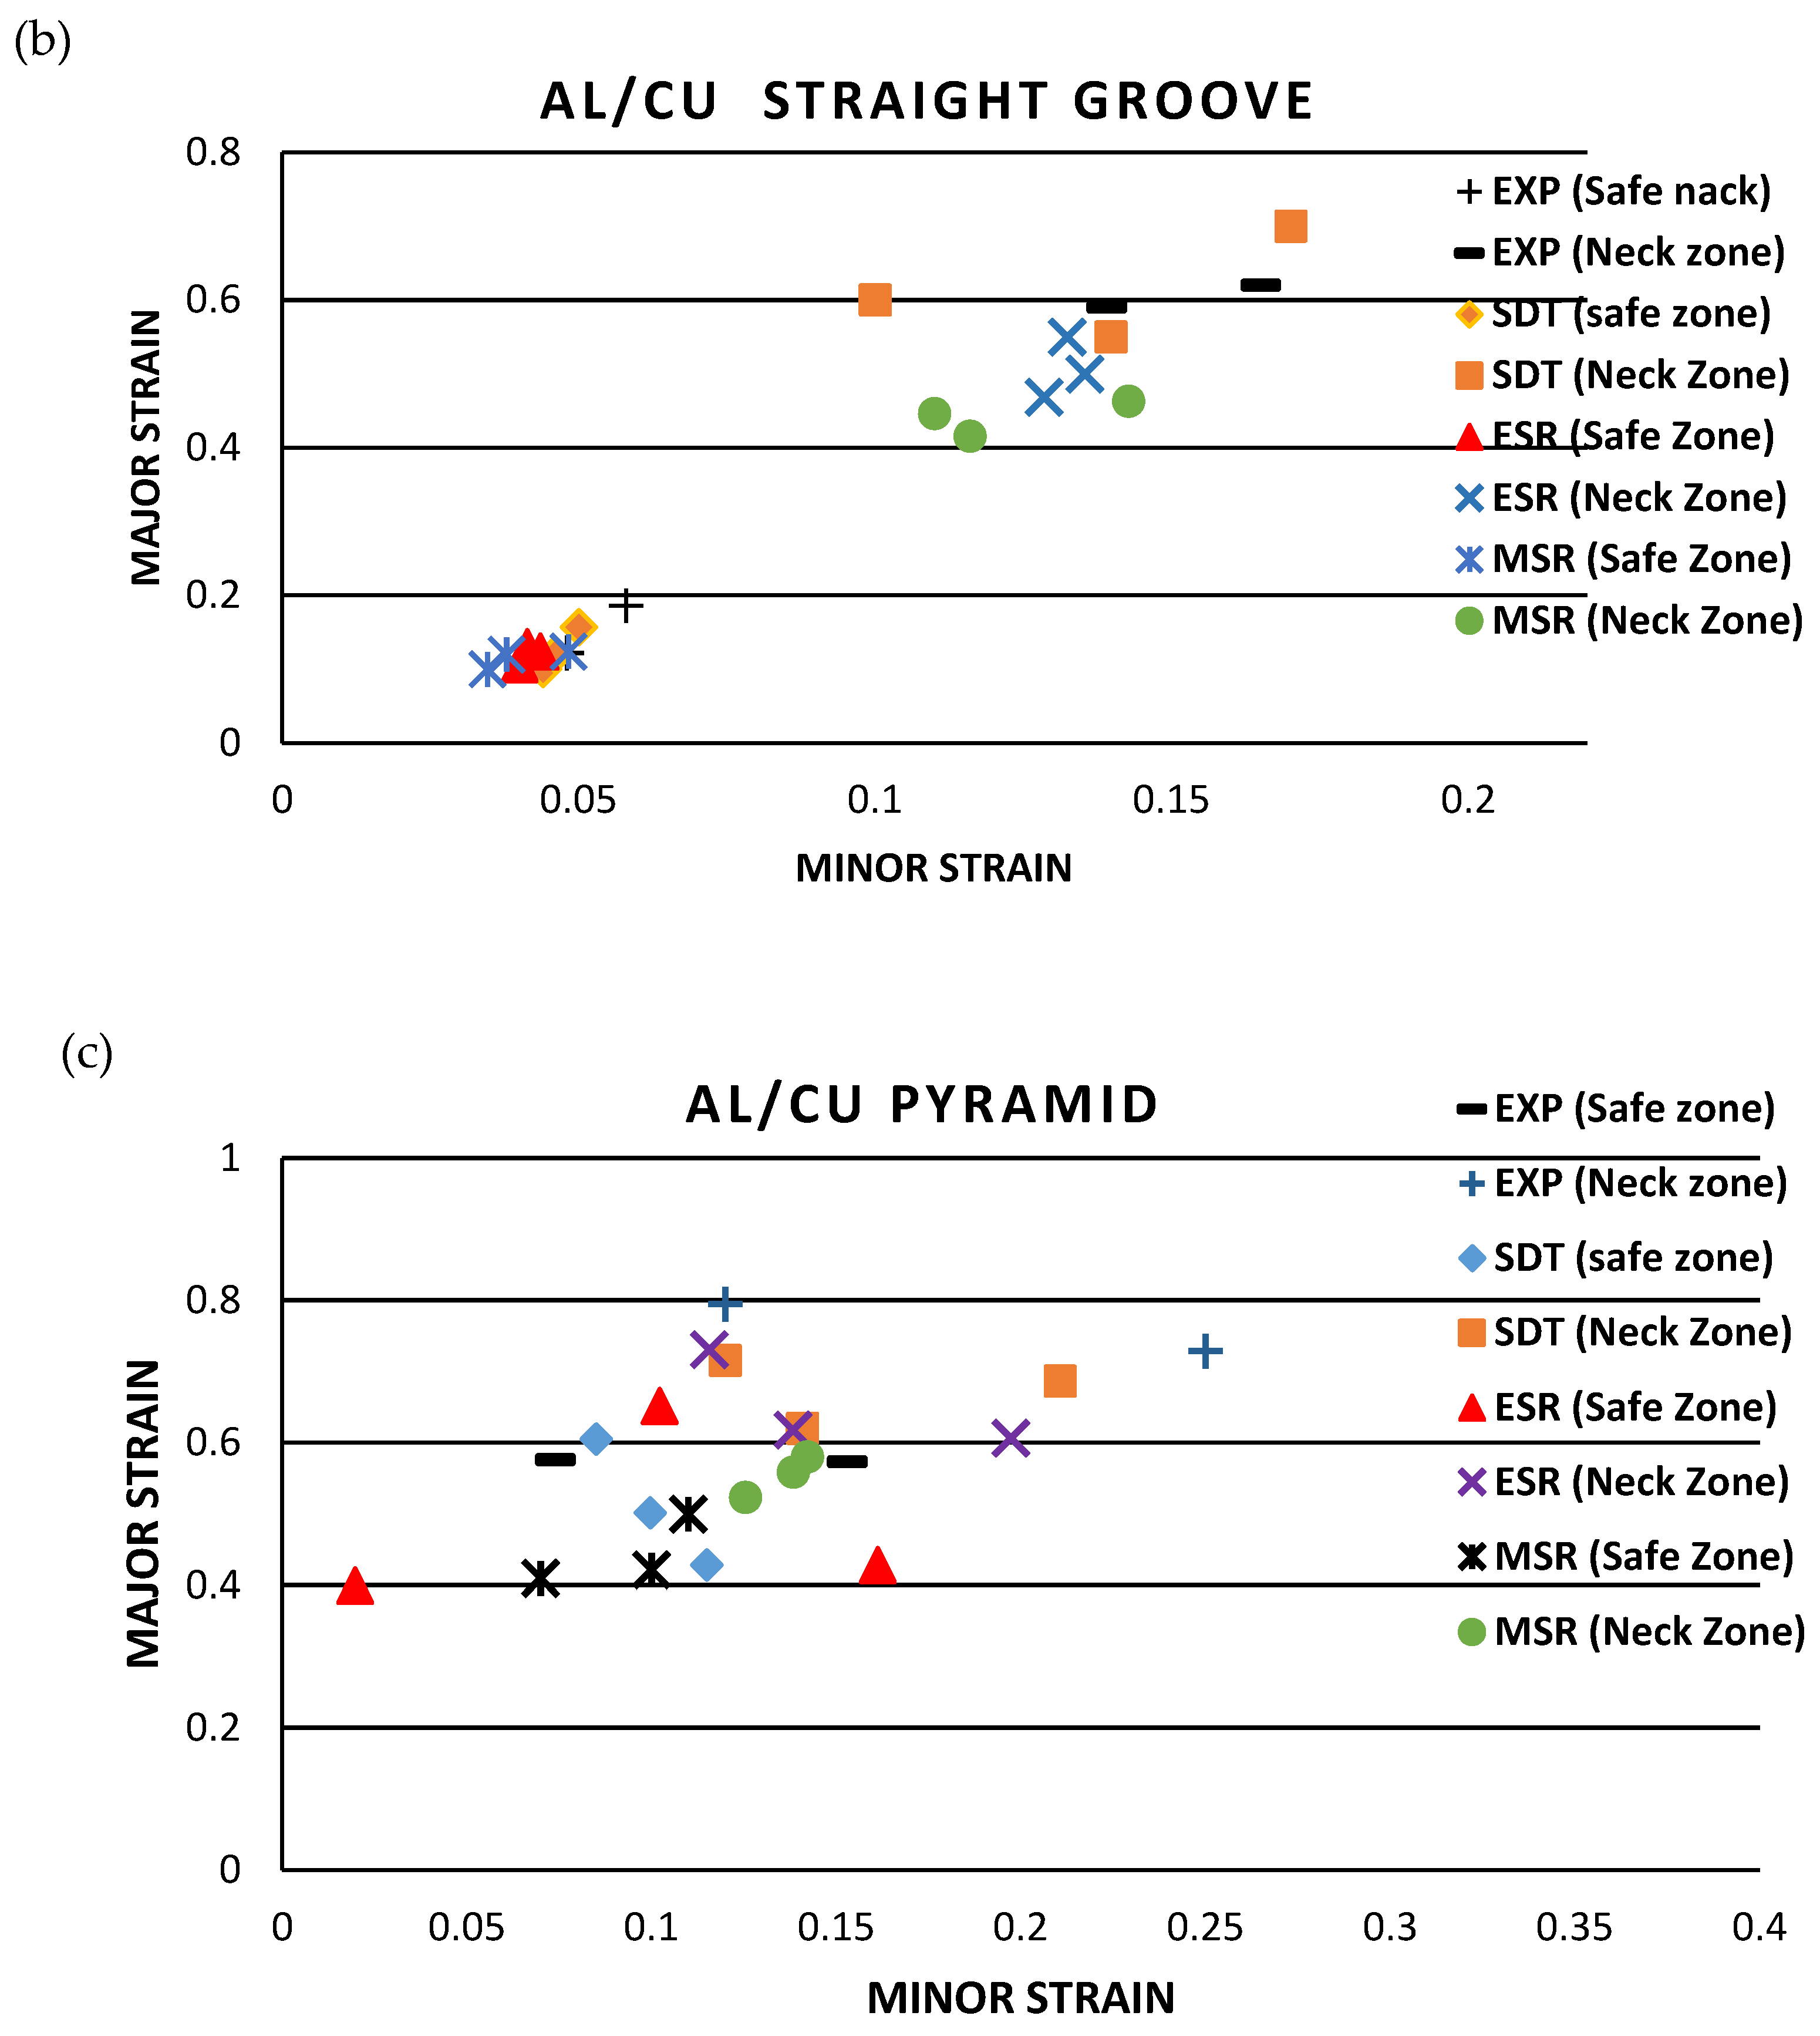
3.5.2. Study of FLD Prediction in FEM

This study used three numerical and one experimental–numerical method to predict the necking zone and obtain the FLD. The ESR, SDT, and MSR methods were numerically investigated, and the FLDcrt method was numerically and experimentally investigated. In the FLDcrt method, the failure prediction was performed as follows: first, the major and minor strains obtained from the experimental test for the neck area were defined in the simulation software; after conducting the simulation, when ω F L D = 1 , necking occurred. In Figure 17, the results related to the FLDcrt method are shown for the base and two-layer samples. By examining Table 2 and comparing the experimental and numerical results, it was observed that the highest error for predicting the failure depth in the numerical method is 10.6%. The element with the minimum thickness was identified to obtain the critical element in numerical methods. Then, the critical element’s strain history was obtained according to each numerical method. The necking time in the SDT method was obtained by obtaining the second derivative of the thickness strain (Equation (3)) [33]. To obtain the necking time by the ESR method, the following steps were followed. First, in addition to the necking element, an element must be considered as a safe zone element near the necking element. By obtaining the effective strain history in the safe and critical area and then calculating the effective strain history rate for the safe and critical areas according to Equation (4), necking time was obtained. For the numerical MSR method, necking time was obtained by considering the critical and safe point element, as calculated by the ESR method, then obtaining the strain history for both areas, and then calculating MSR according to Equation (5) [34]. To calculate the necking time for all three methods, it was necessary to obtain safe and critical points for the FLD for each numerical method. For the selection of essential elements, a few elements adjacent to the primary element in the neck area were regarded as elements of the critical area. Several elements far from the critical area were selected to be the safe element area [35].
ε ¨ 33 = d 2 ε 33 d t 2
E S R = E f f e c t i v e   s t r a i n   r a t e   i n   t h e   c r i t i c a l   e l e m e n t E f f e c t i v e   s t r a i n   r a t e   i n   t h e   s a f e   e l e m e n t
M S R = M a j o r   s t r a i n   r a t e   i n   t h e   c r i t i c a l   e l e m e n t M a j o r   s t r a i n   r a t e   i n   t h e   s a f e   e l e m e n t
Strains obtained from numerical methods for base sheets and two-layer sheets are shown in Figure 18 and Figure 19. By comparing the three numerical methods for base and two-layer samples, it was observed that the SDT criterion has a more accurate estimate of necking time than the other methods. The results are shown in Table 3 and Table 4. Figure 20 shows the highest error percentage for three numerical methods (SDT, ESR, and MSR). The stress and strain created in the SPIF process was created due to the presence of force along the thickness and the bending force created at the contact point of the tool [36]. In the SPIF process, necking occurred when all stresses through the sheet thickness exceeded the limit. Because the thickness distribution was high in the SPIF process, the strains created along the thickness were significant. For this reason, fracture prediction in the thickness direction and thinning can provide the most accurate prediction compared to other numerical methods.

4. Conclusions

This article investigated the mechanical and metallurgical properties of the Al/Cu sheet. The formability of the two-layer samples was studied experimentally and numerically with the SPIF method, and the results are summarized below:
-
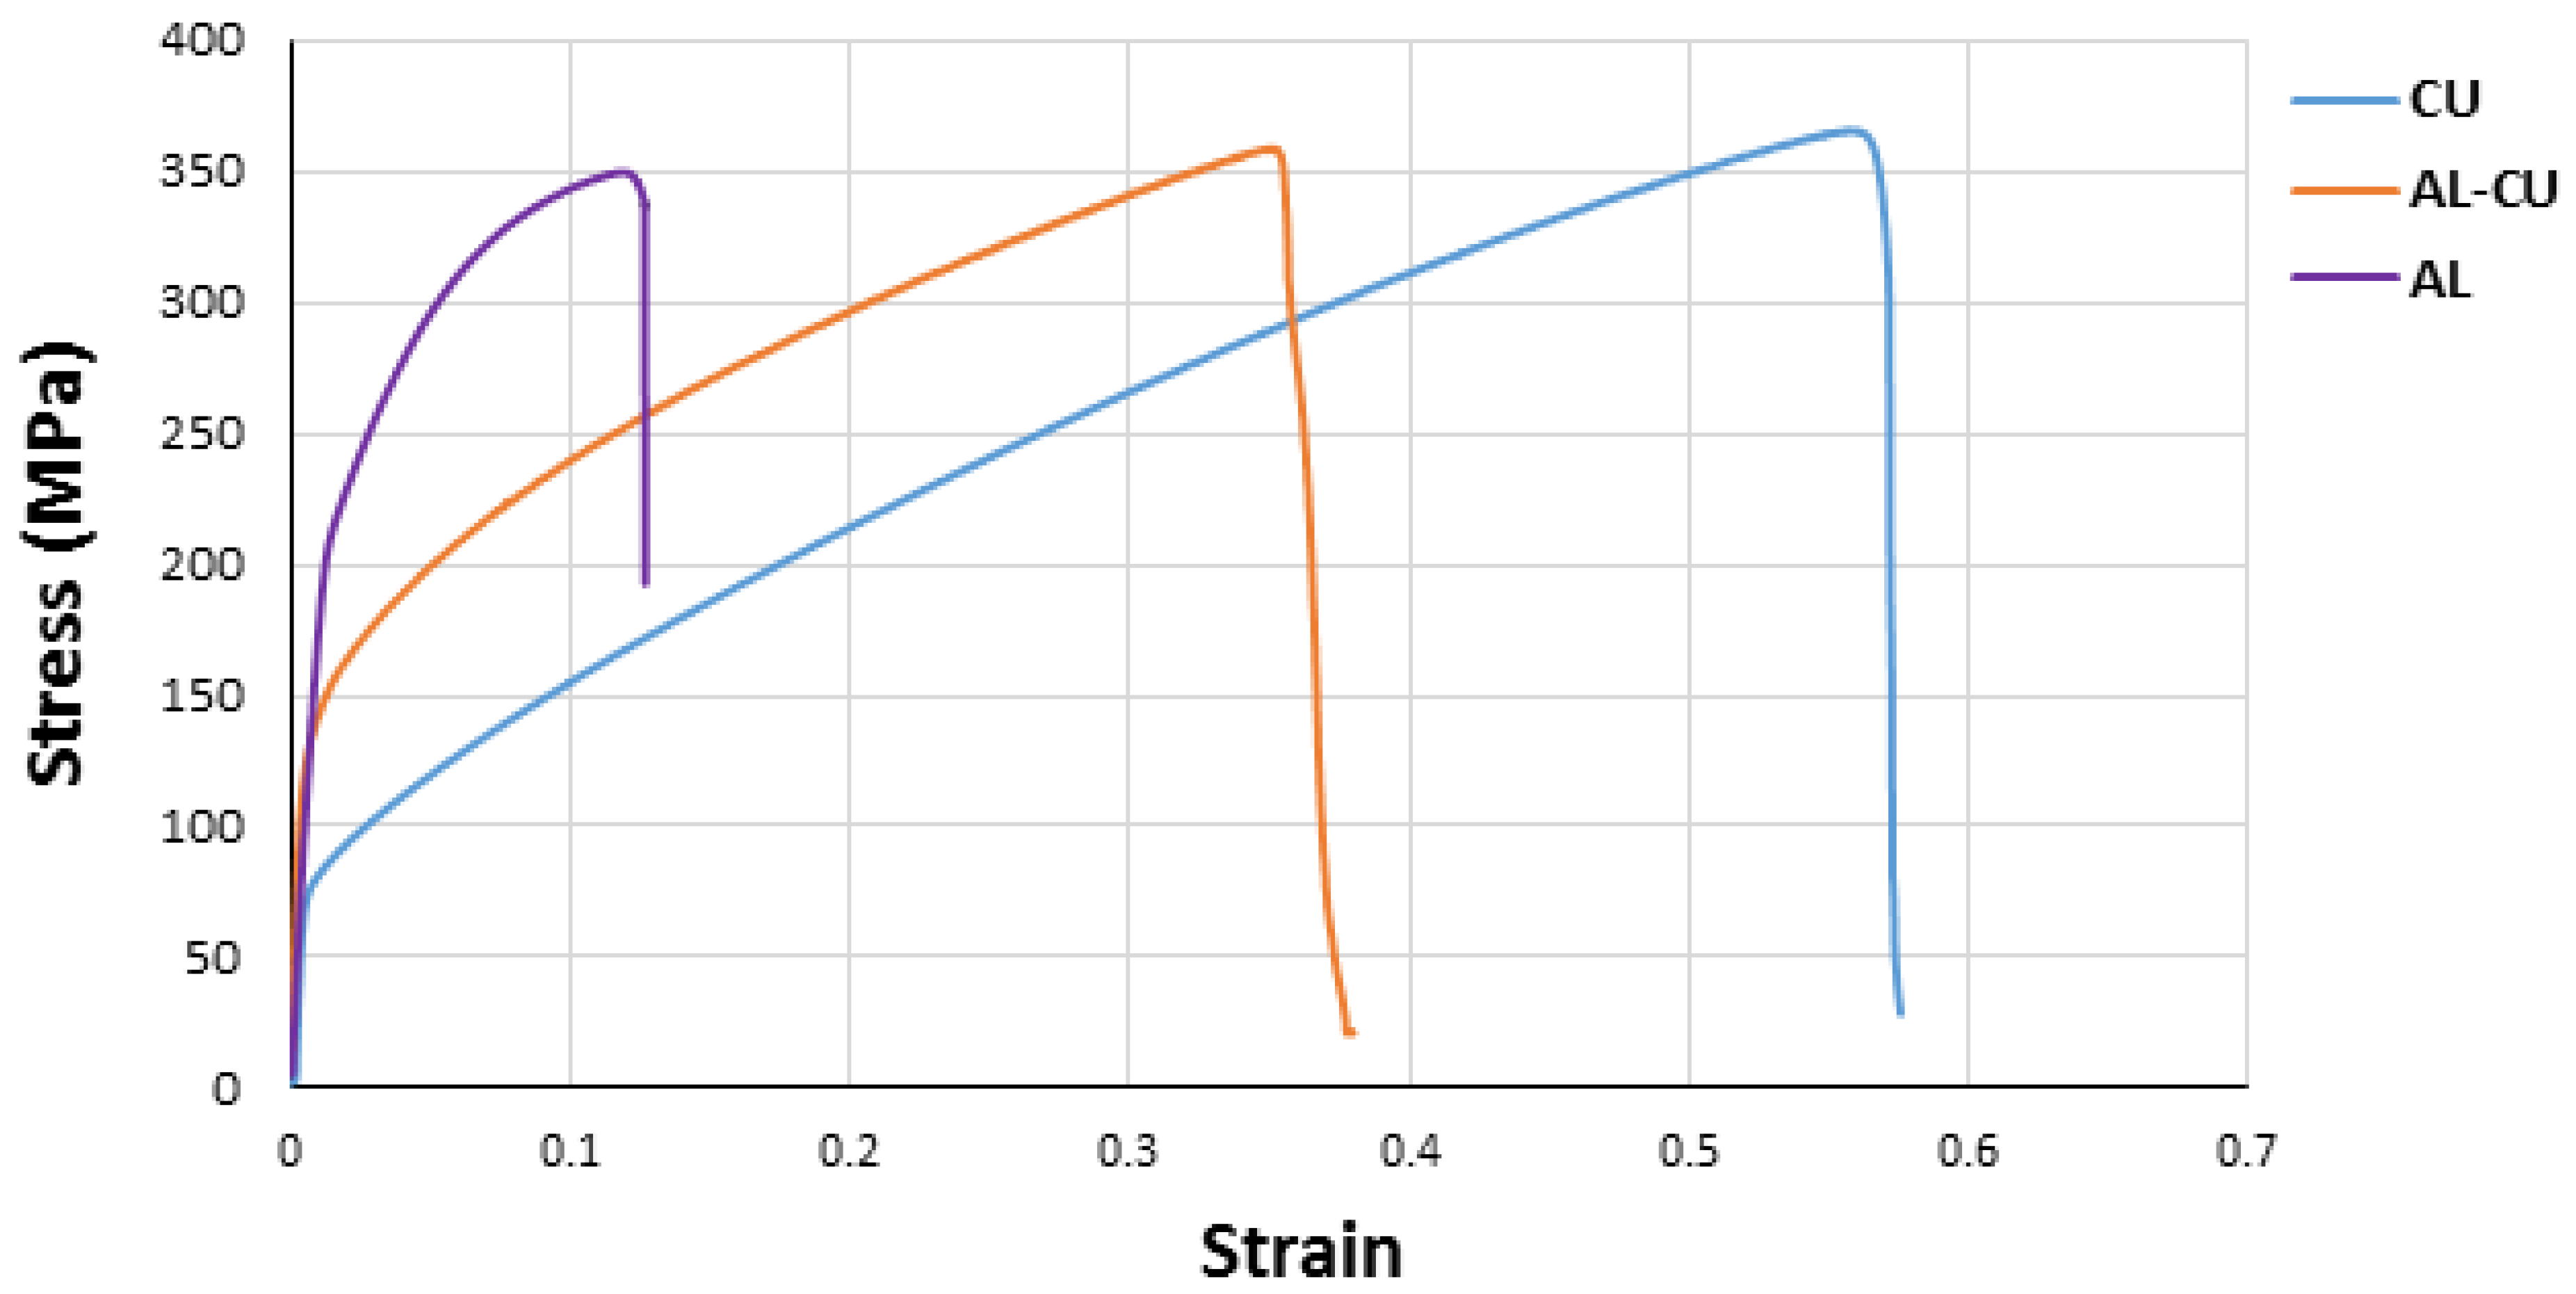
The uniaxial tension results show that the strength of the two-layer sheet after explosive welding and rolling has increased compared to the aluminum base sheet, but it has not increased compared to the copper base sheet.
-
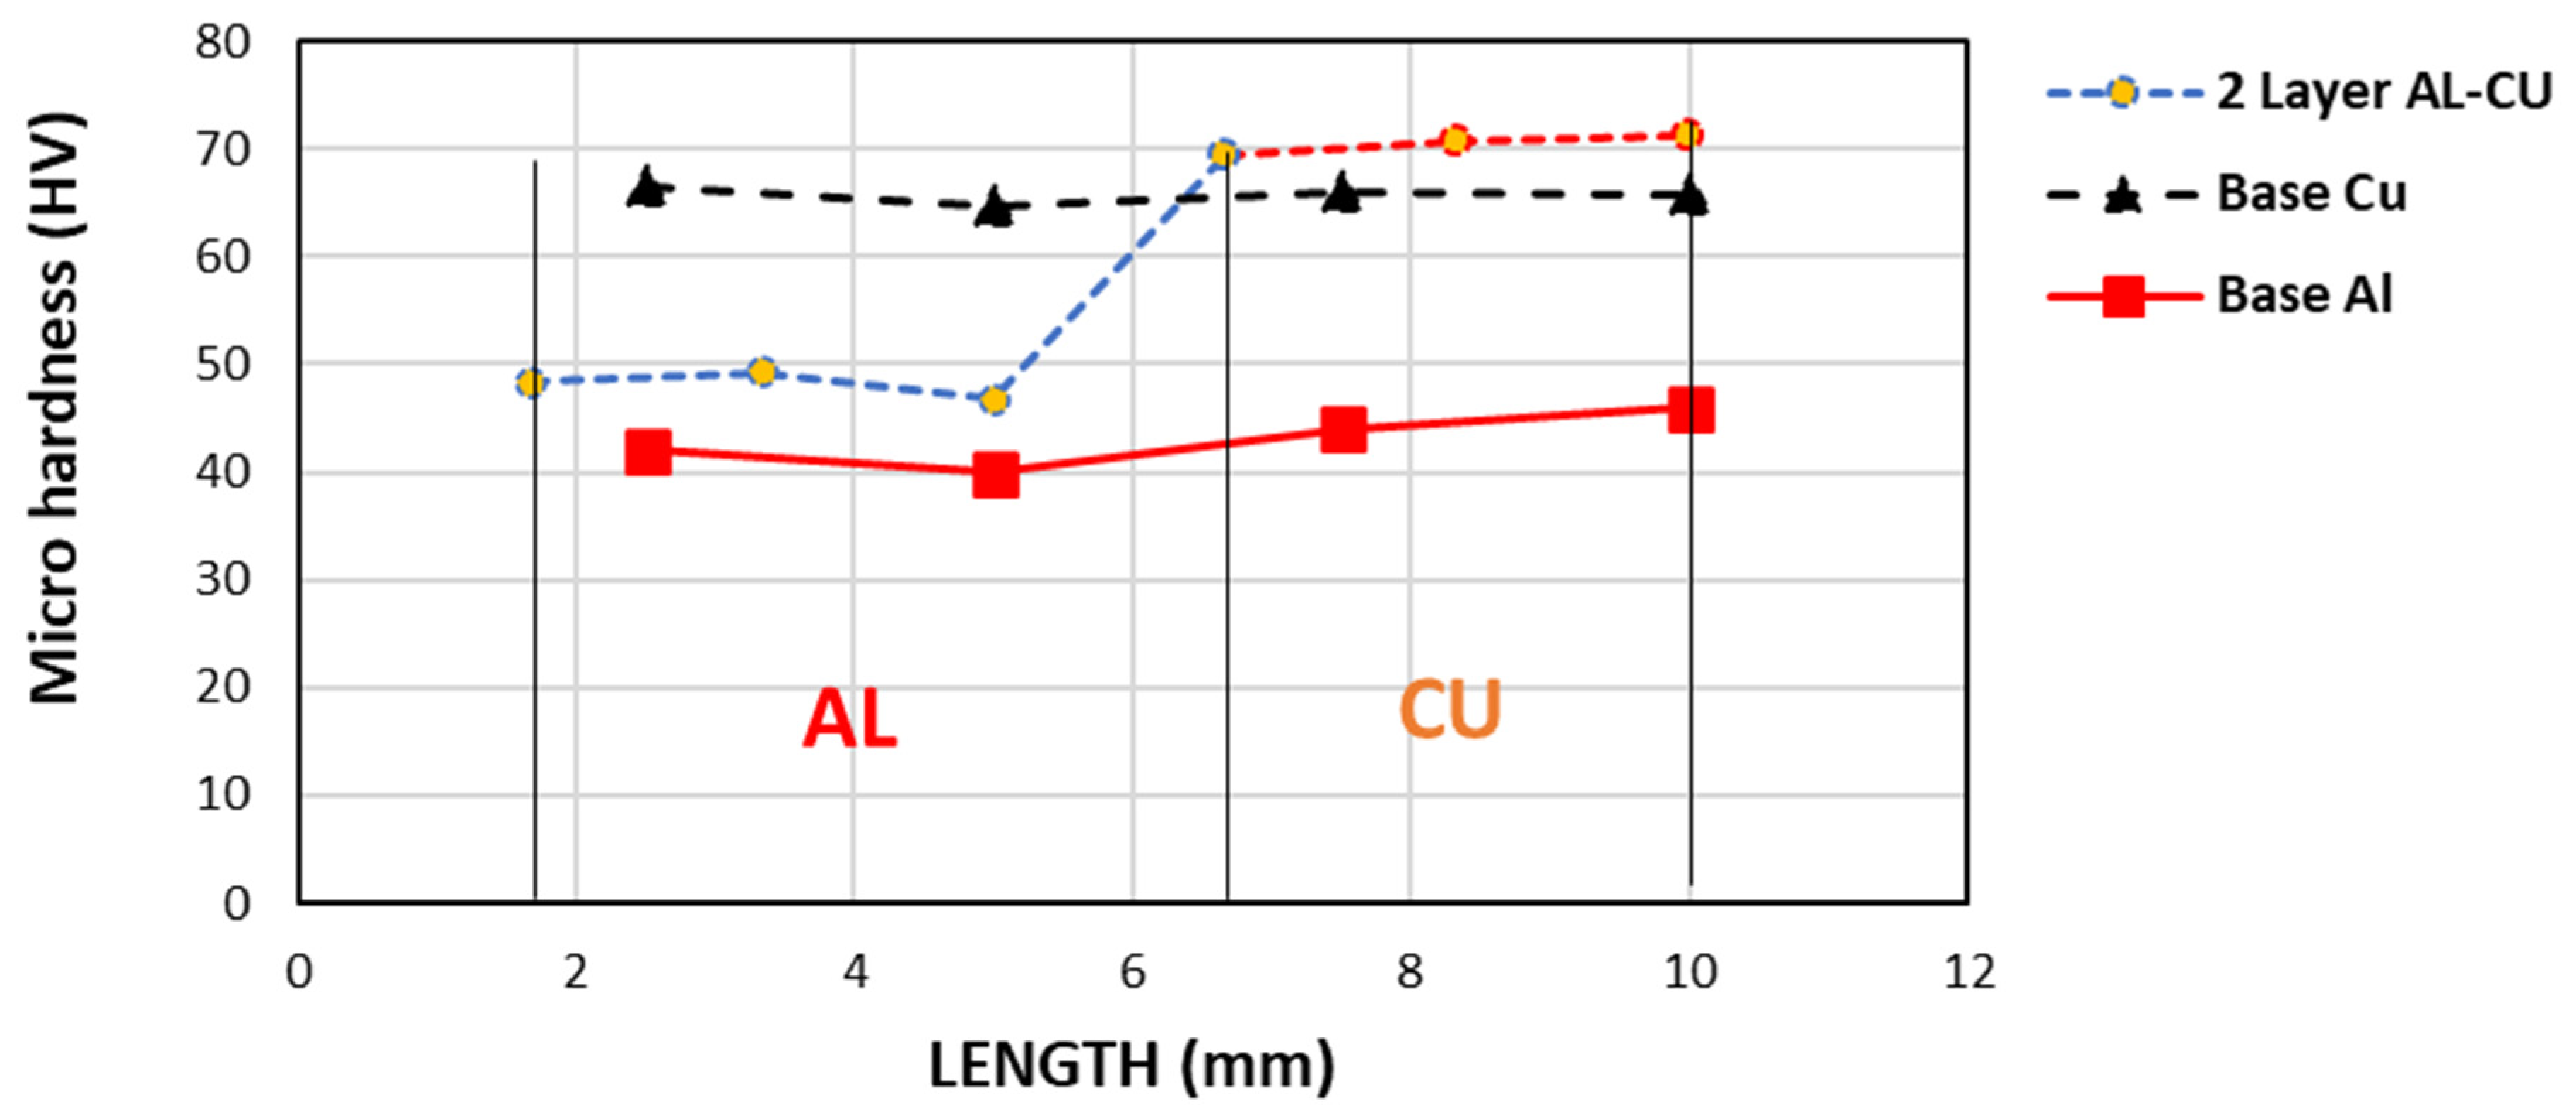
The results of the hardness test show that the hardness of the two-layer samples has increased compared to the base sheets.
-
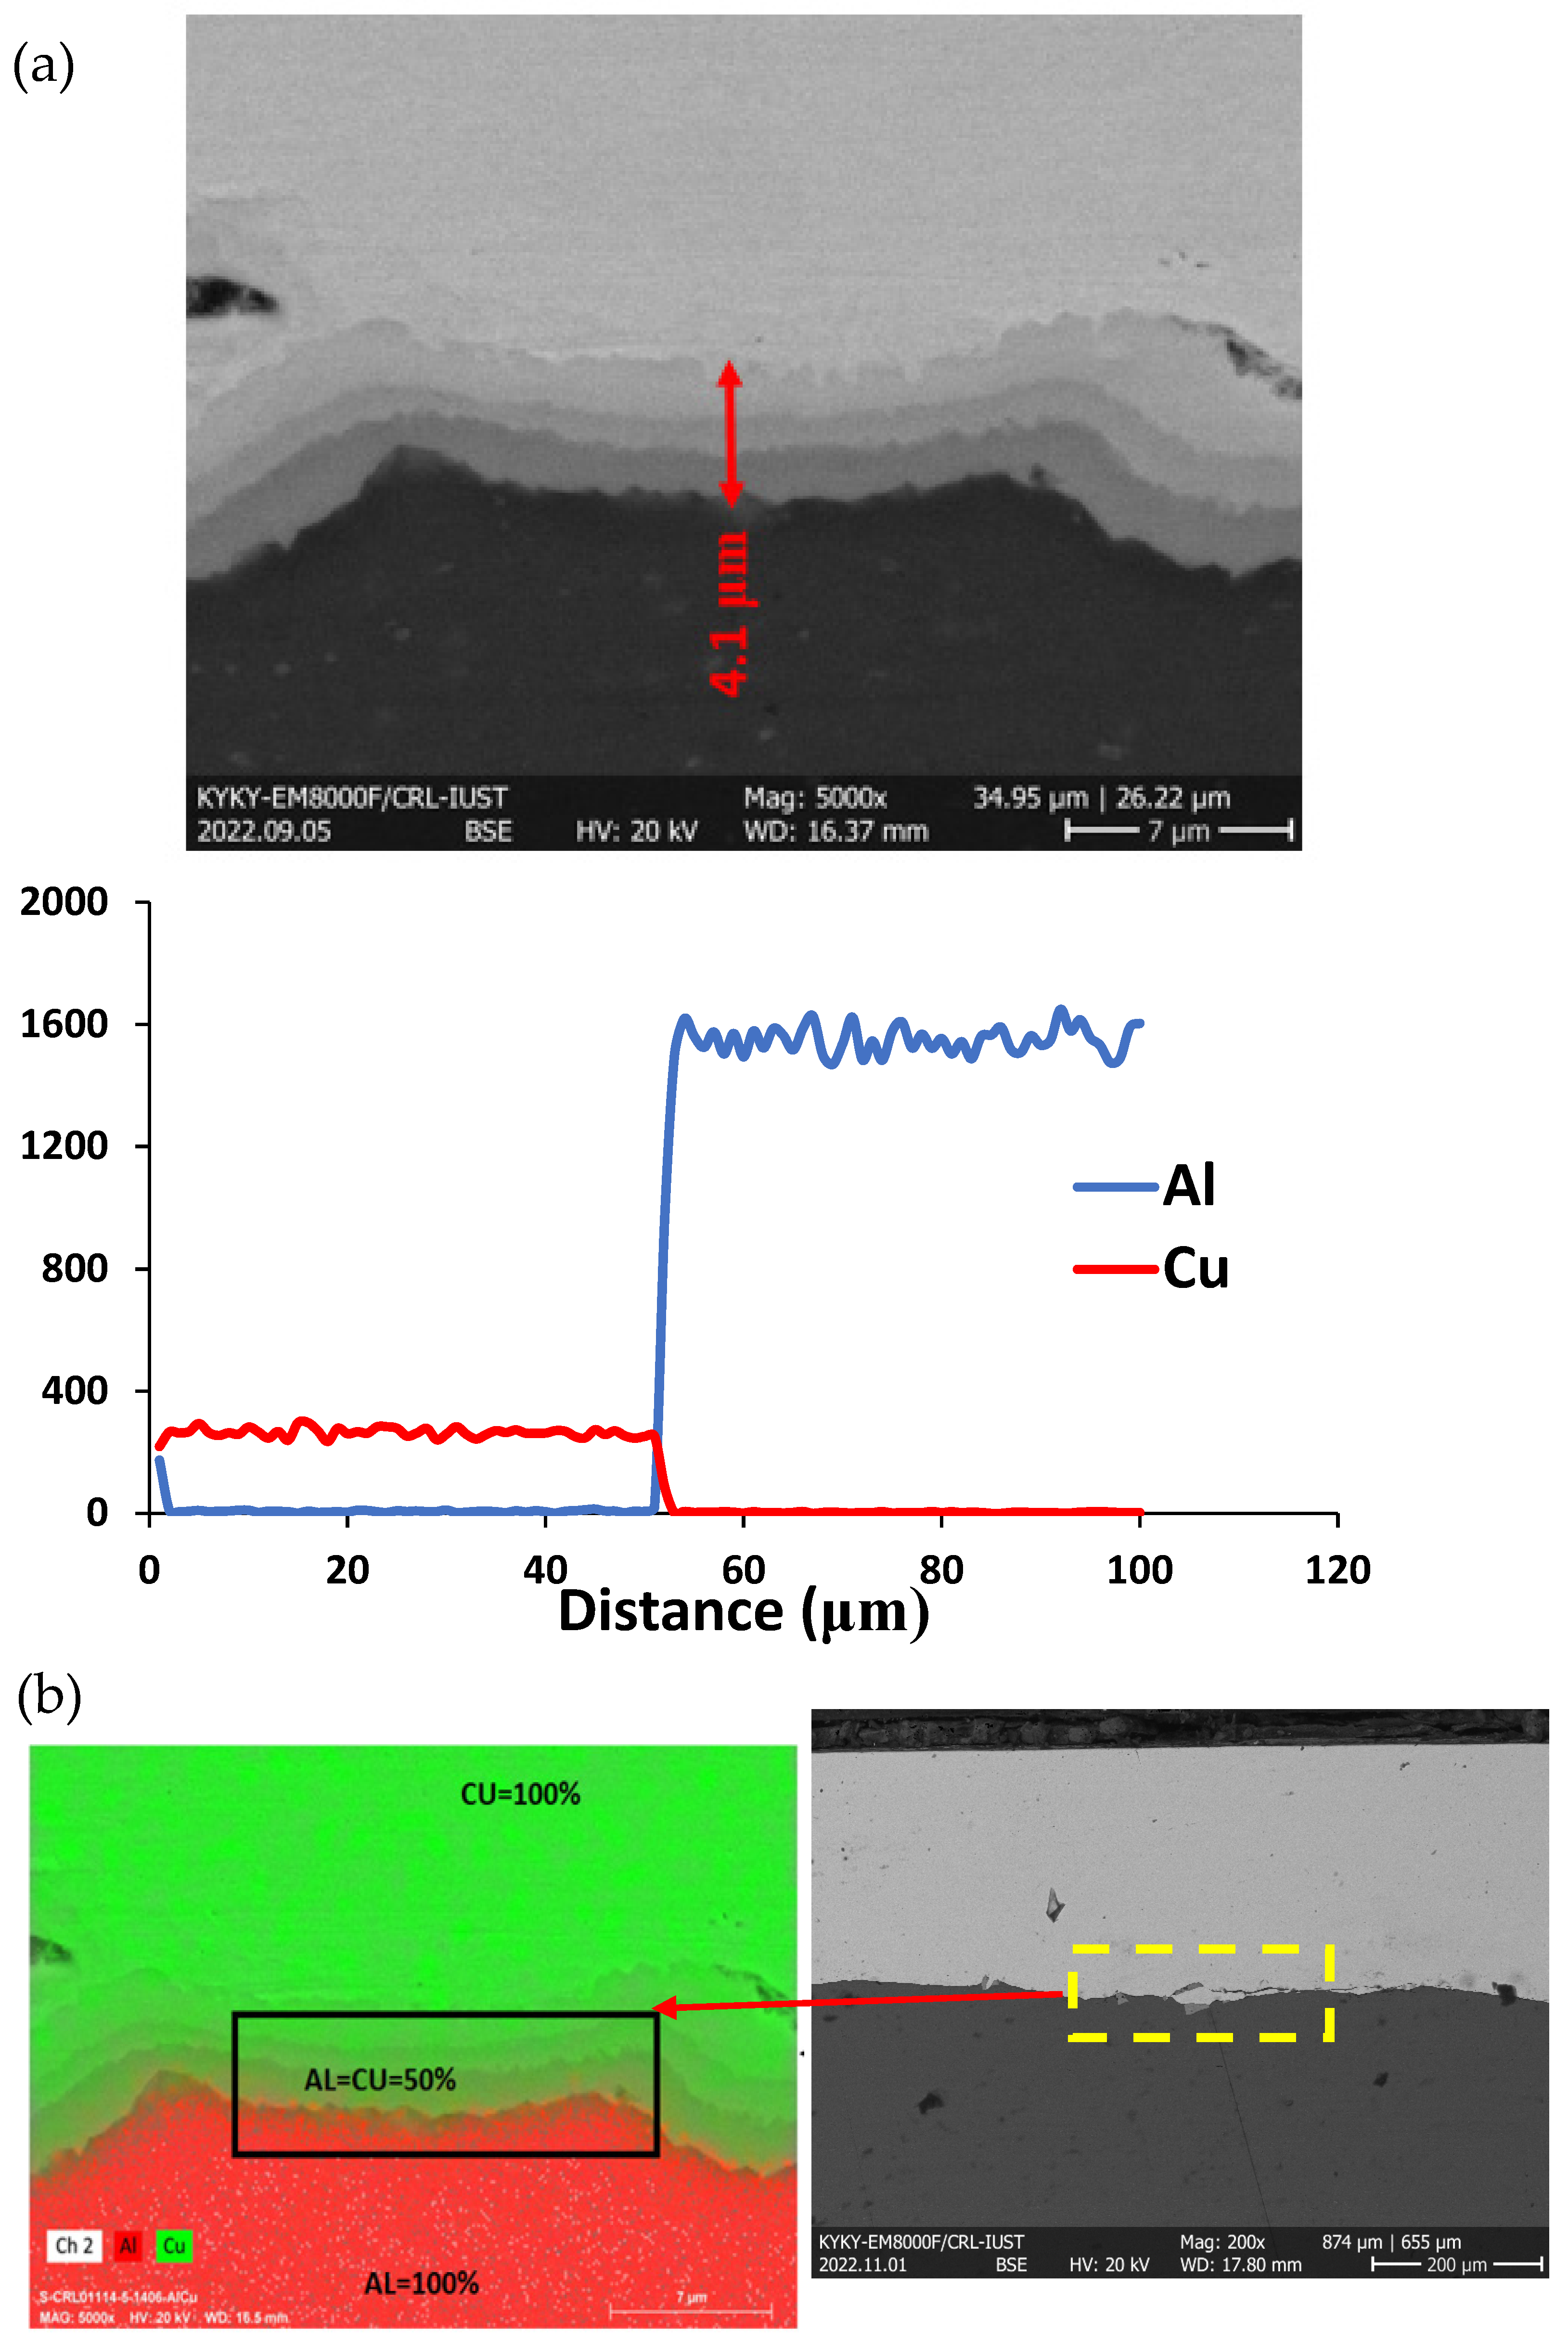
By examining the SEM ESD-line results in the infiltration area of the two-layer sheet, it can be seen that the infiltration has been performed well, and the combination of Al and Cu in the infiltration area is homogeneous.
-
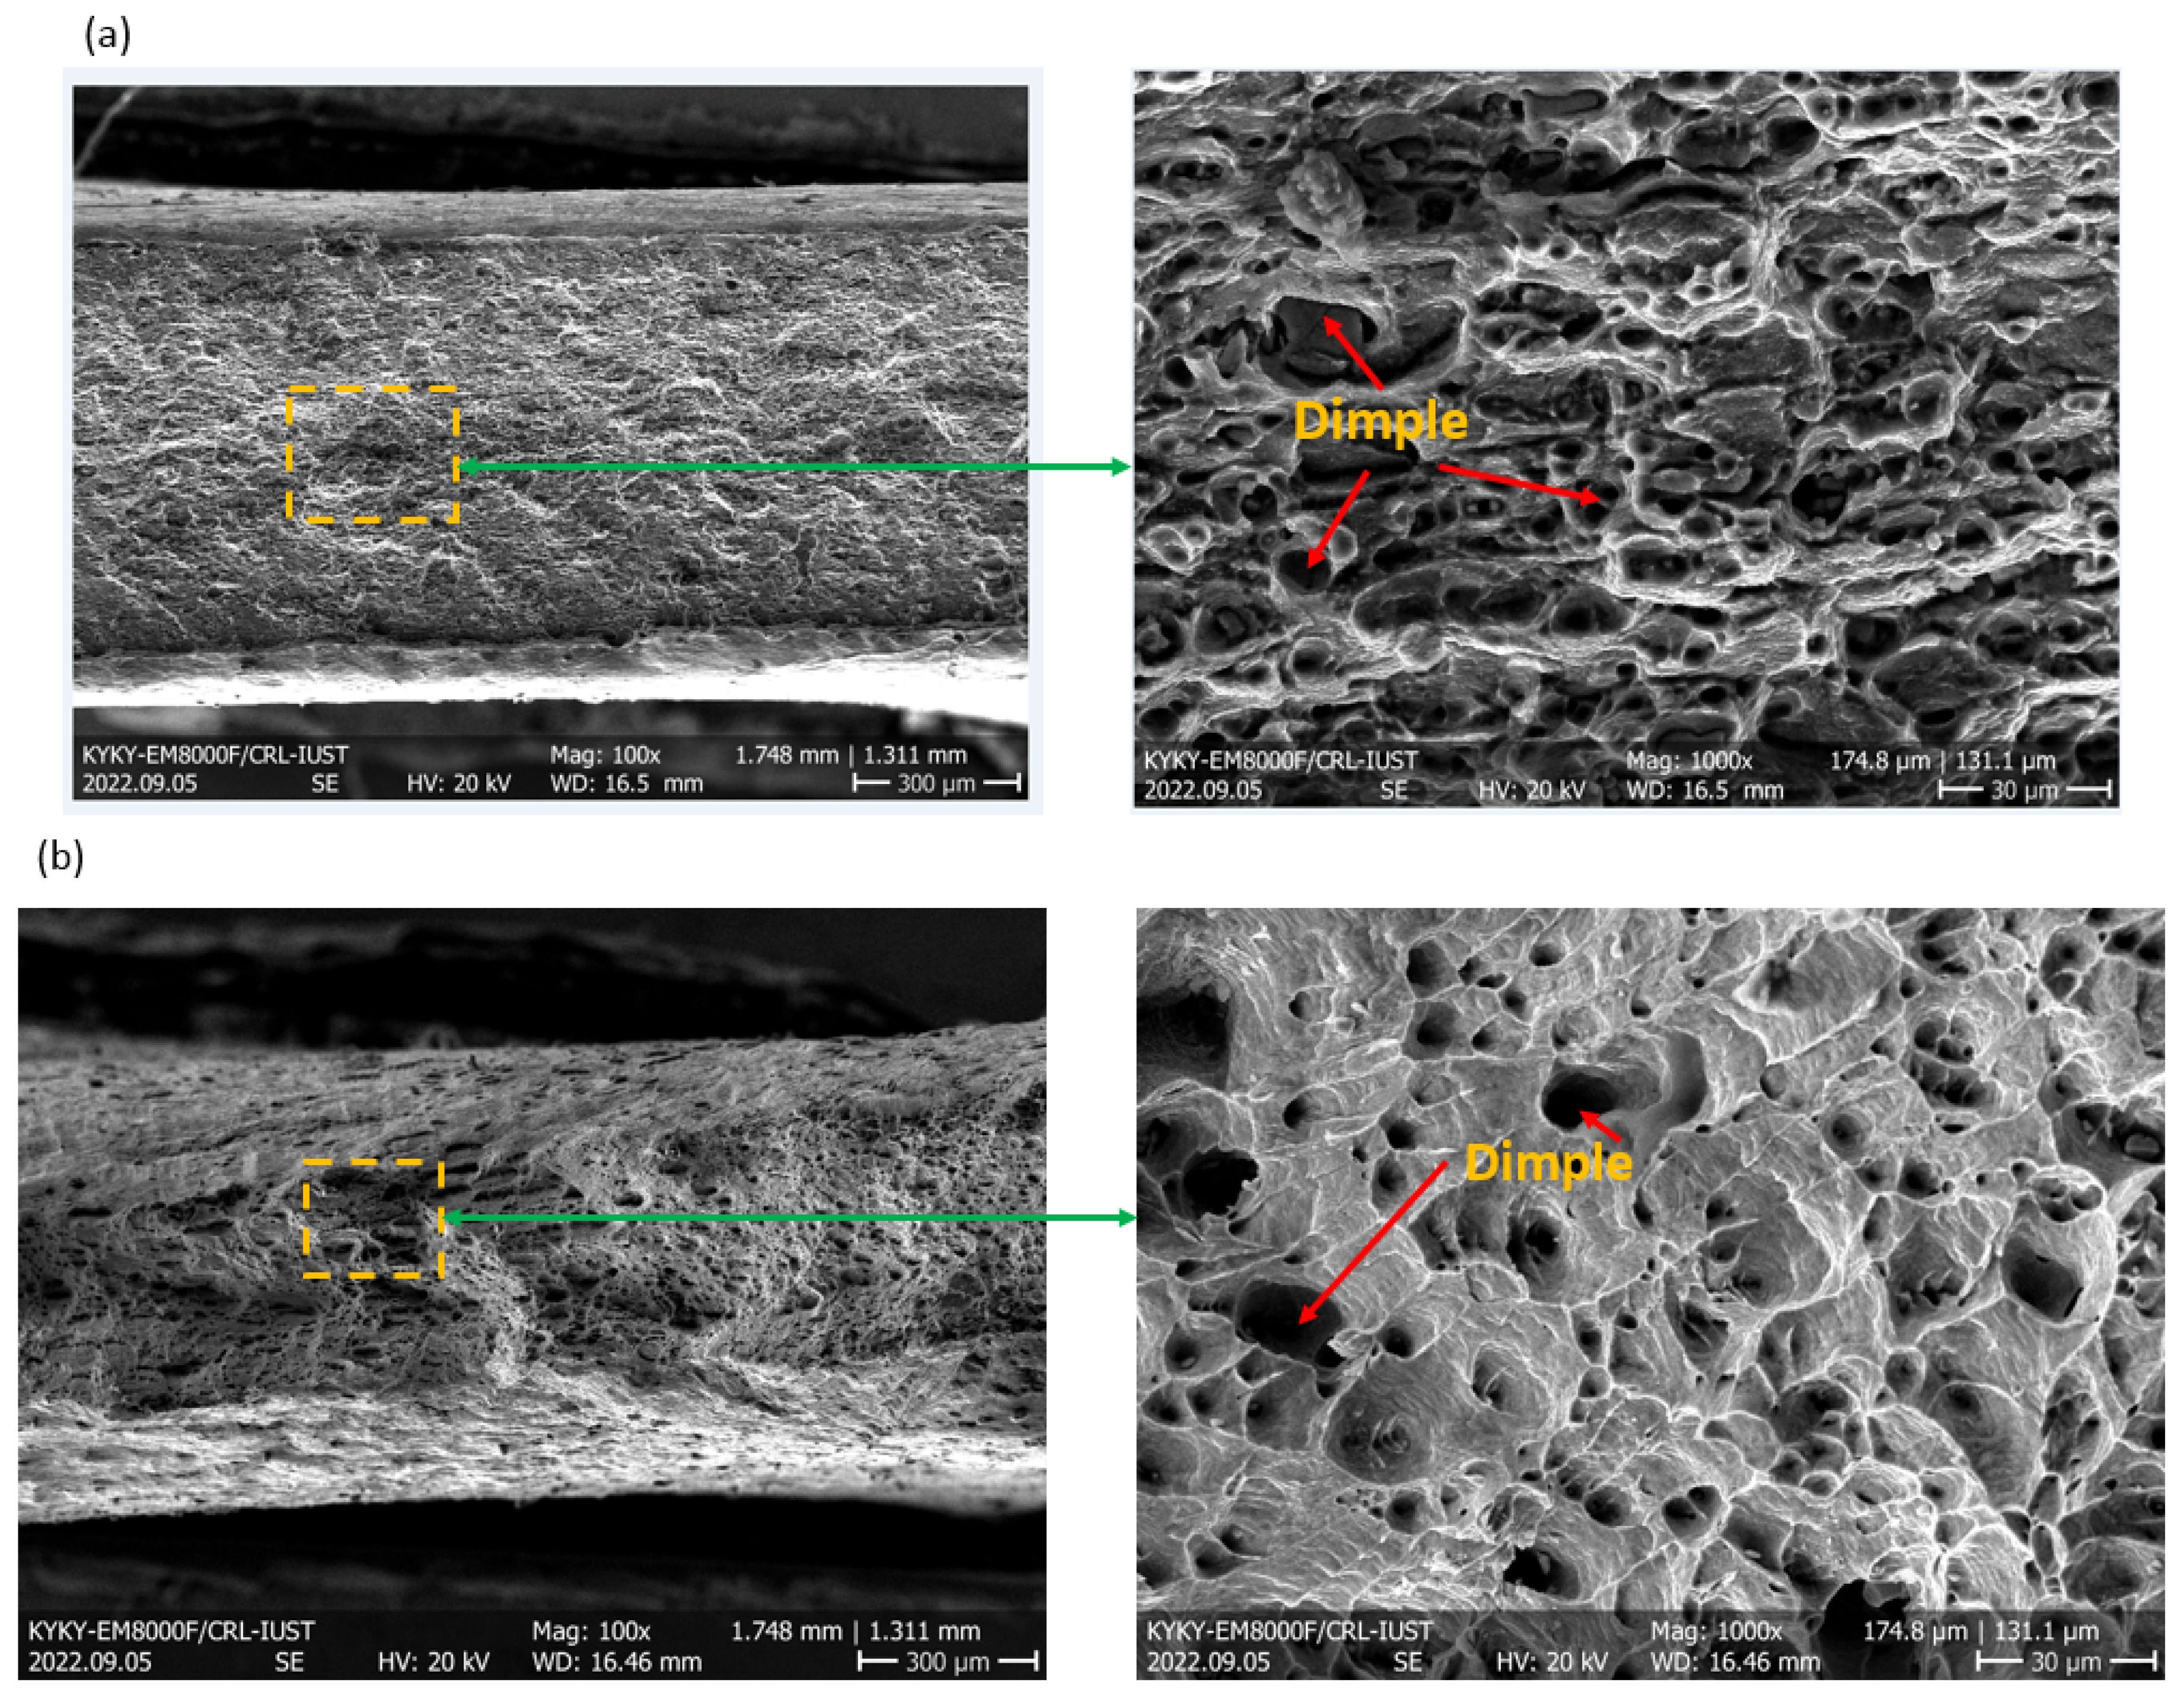
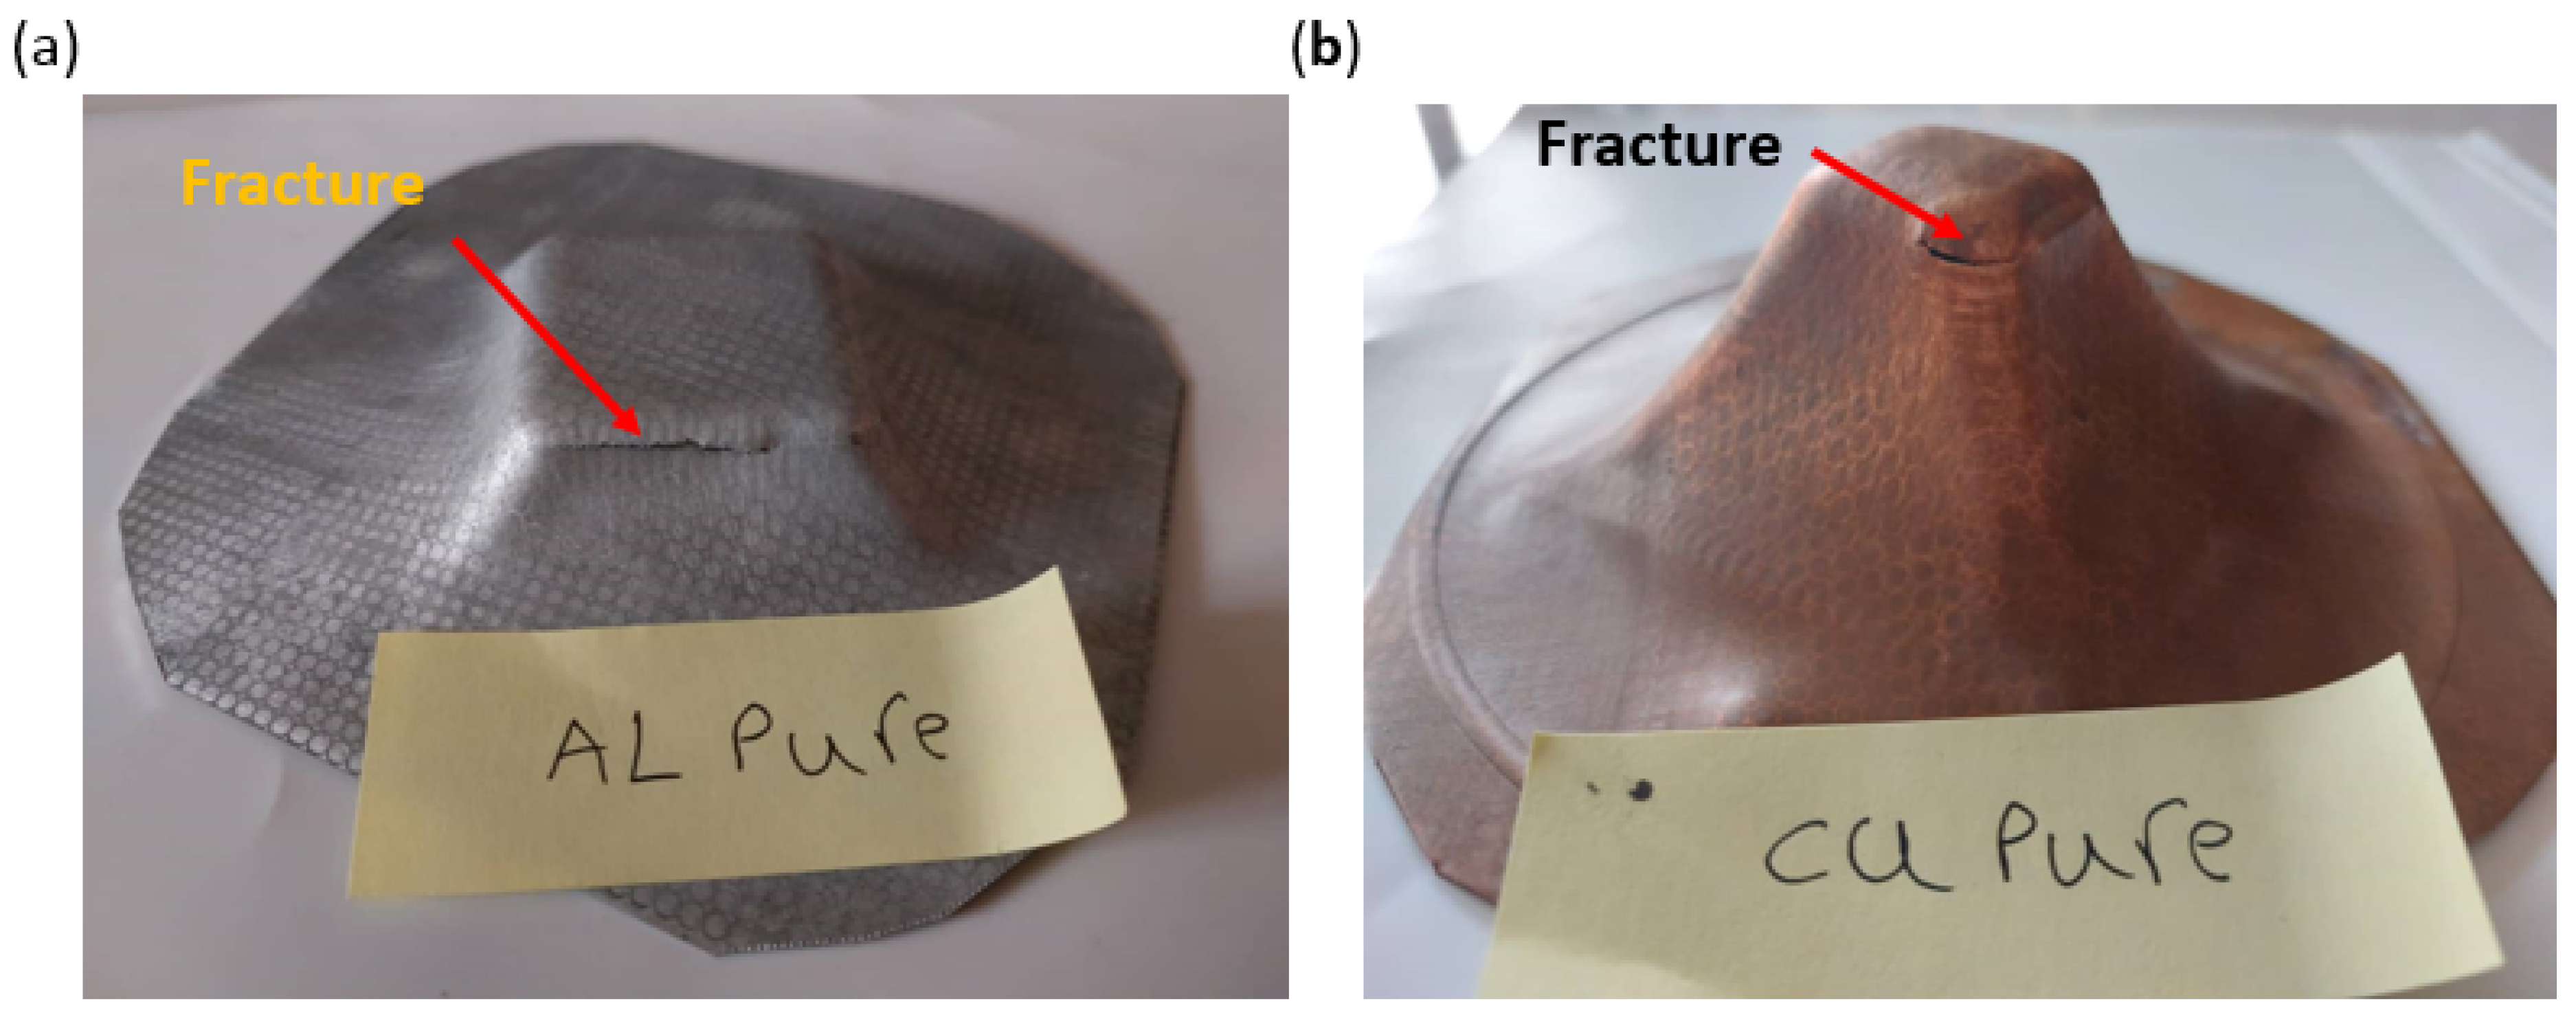
The tension fracture surface analysis showed that the base samples’ fracture mechanism has changed from the ductile fracture mode to the brittle fracture mode compared to the two-layer sample.
-
The intermetallic phases for the two-layer sample are produced with higher density by increasing the annealing temperature. In the penetration zone, it is clear that increasing the temperature causes more intermetallic phases to be produced.
-
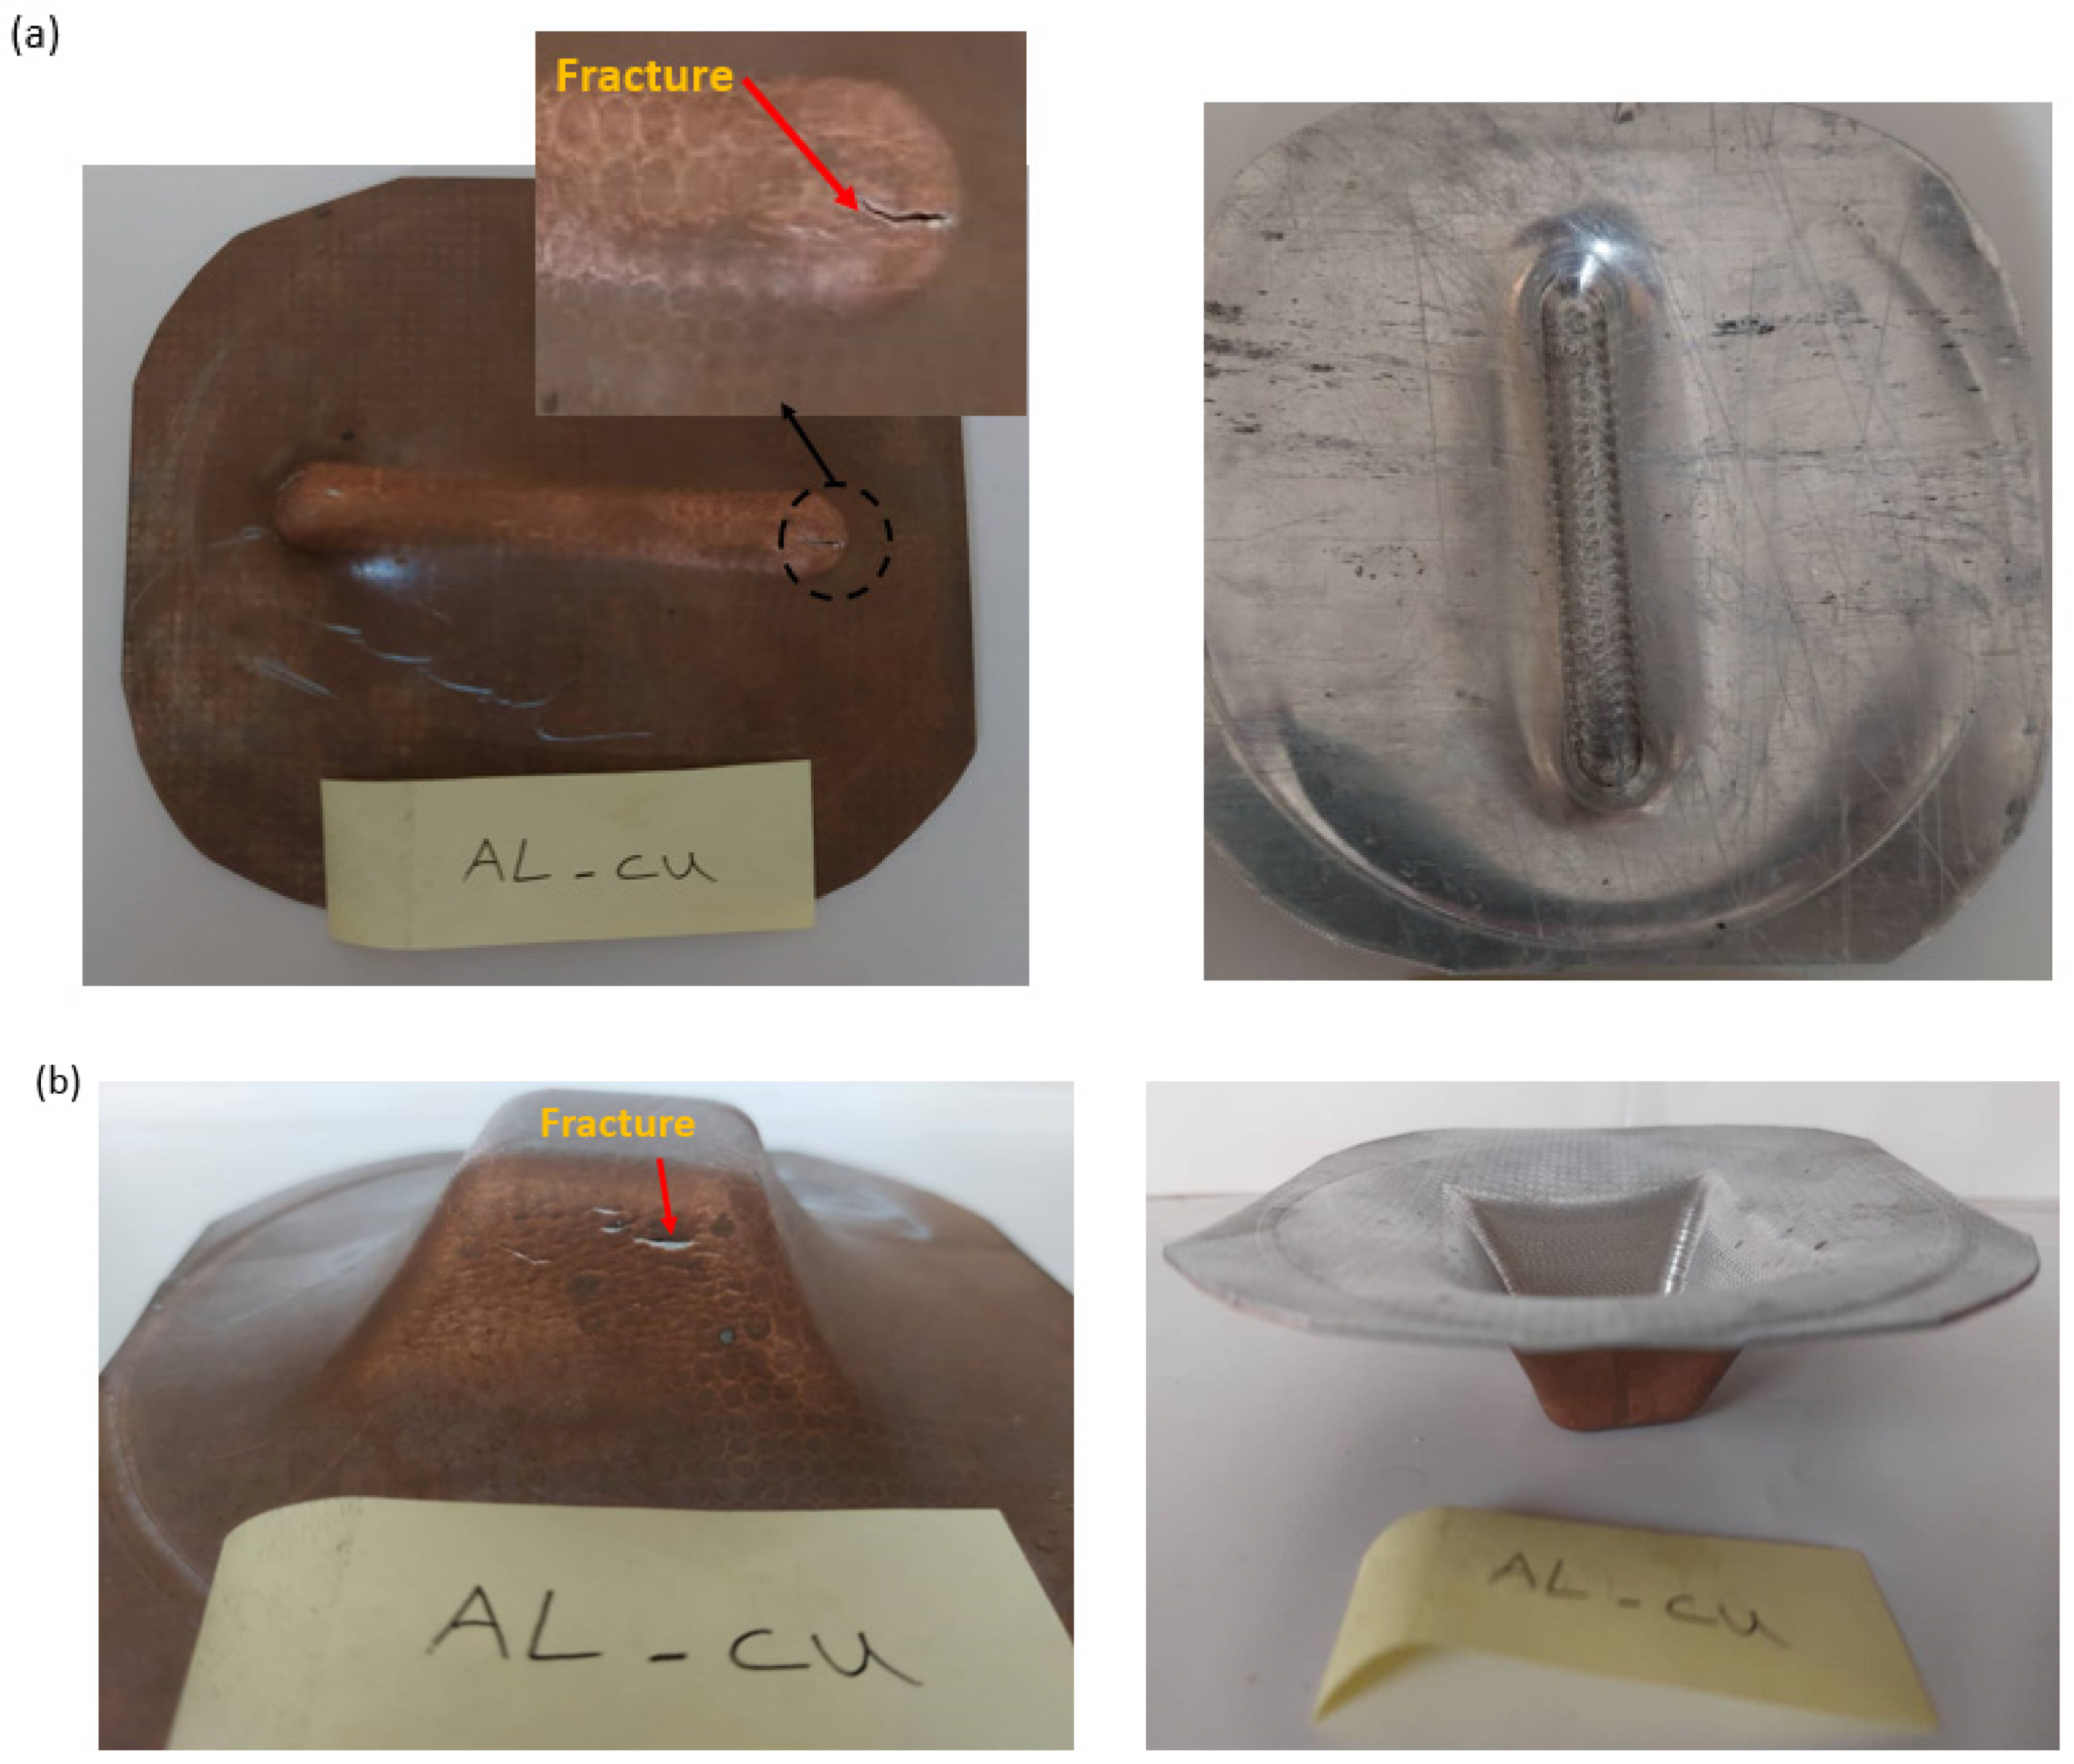
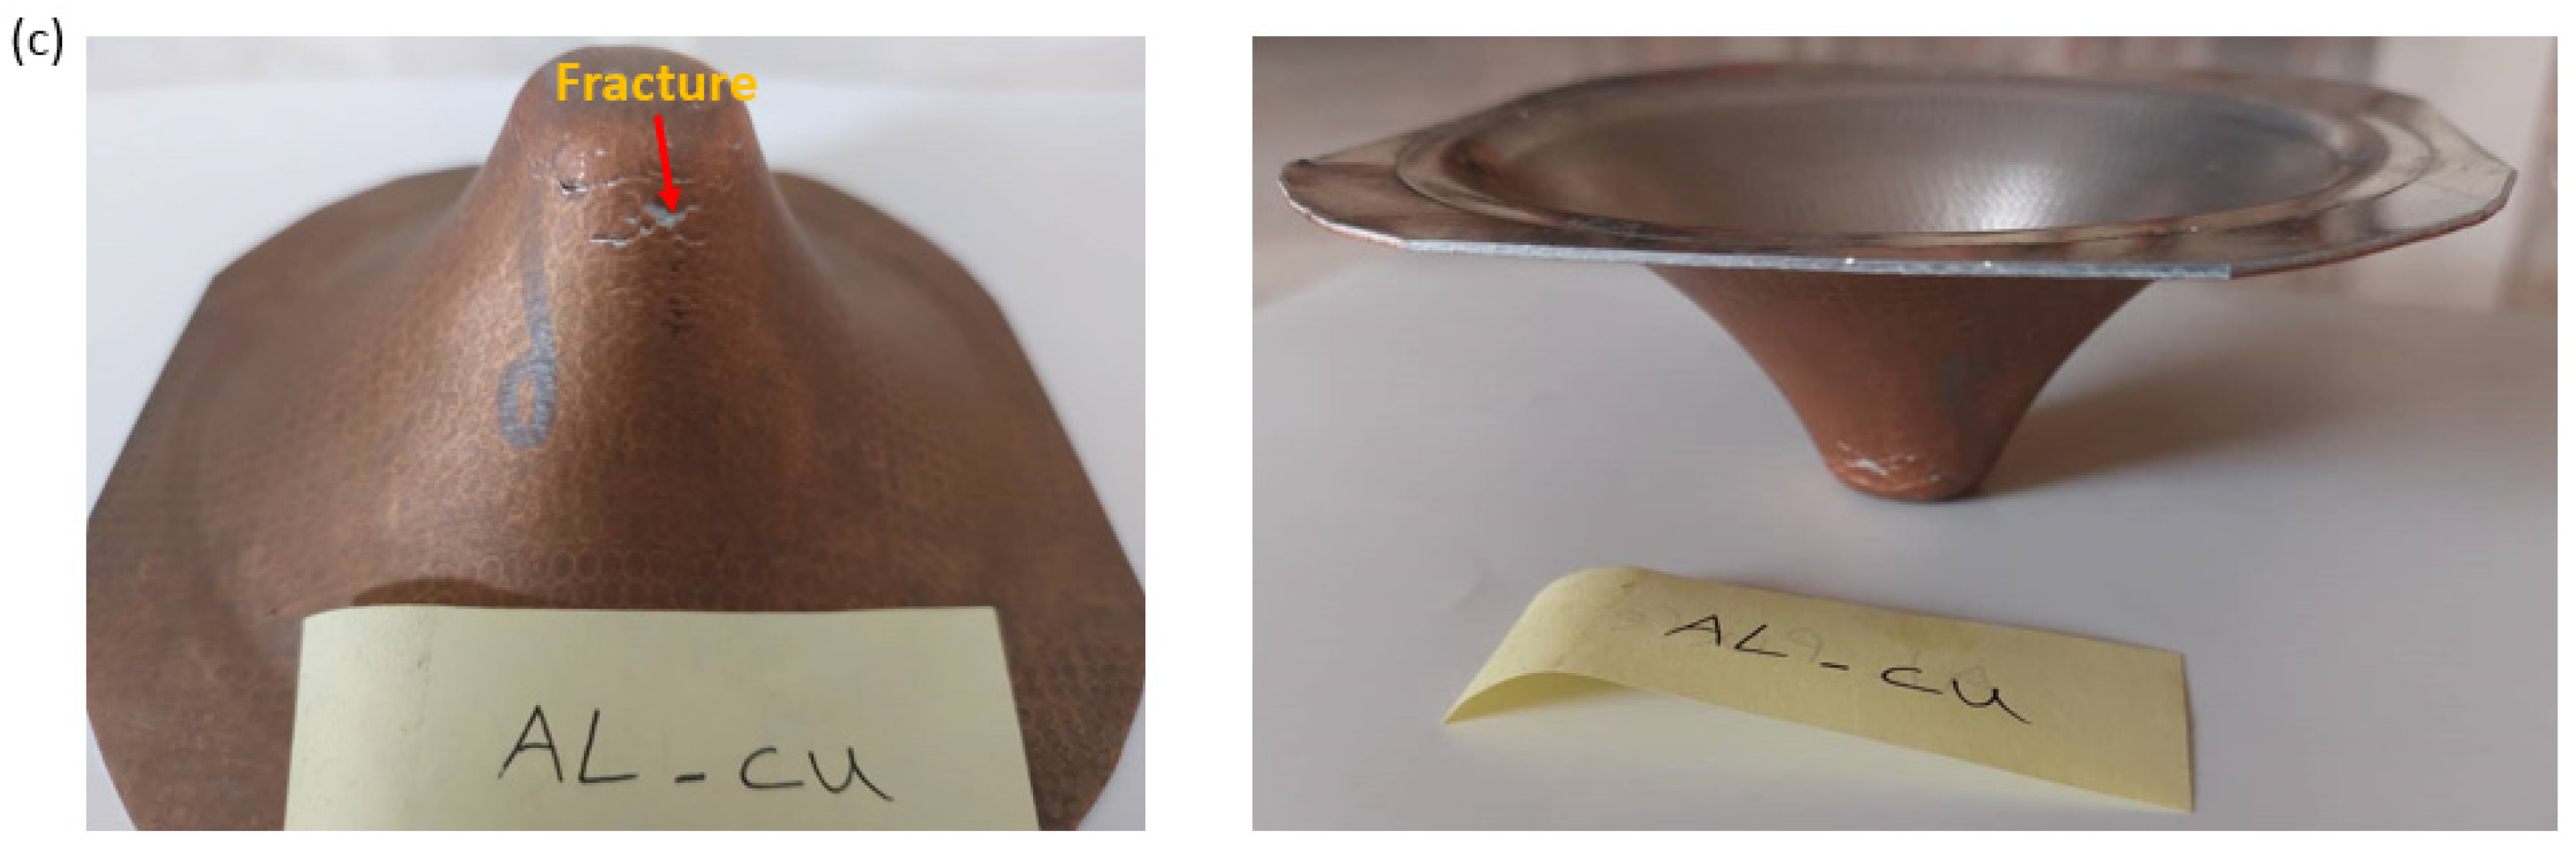
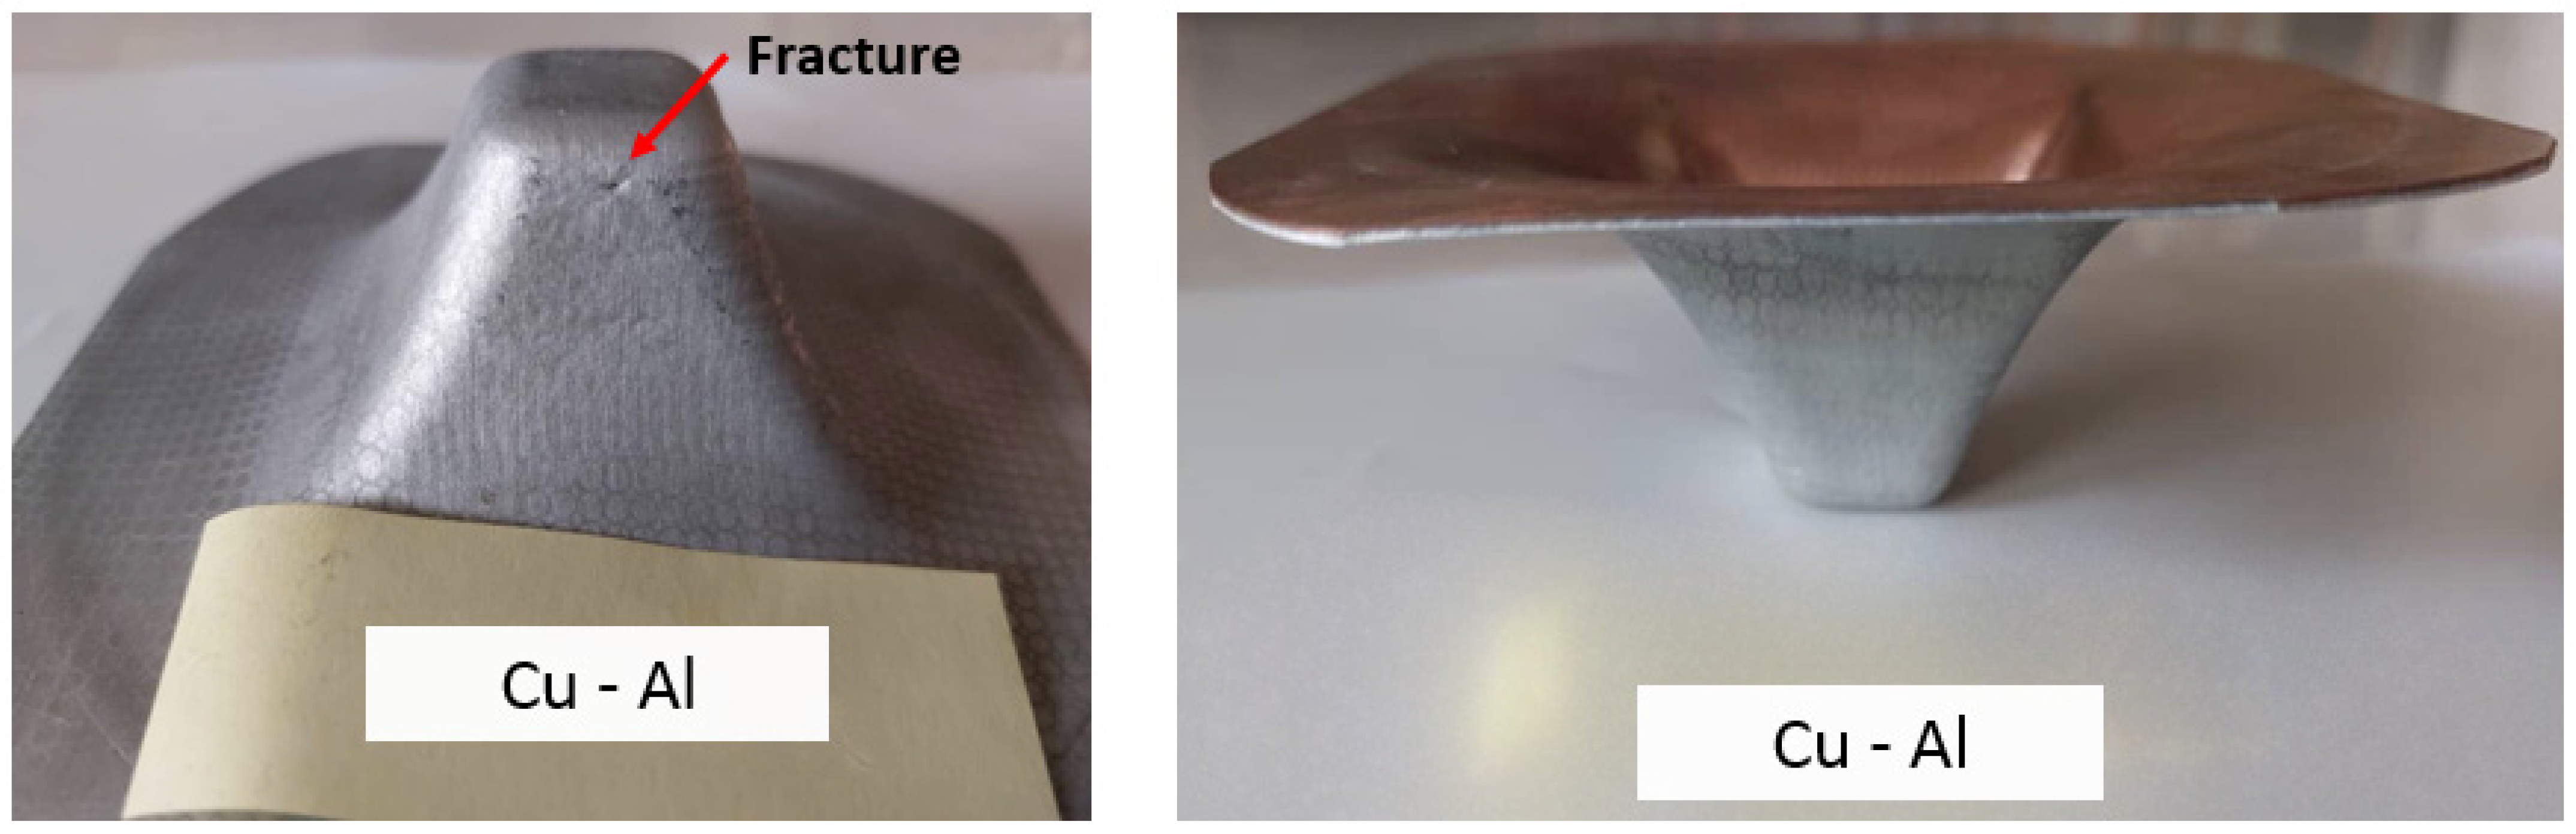
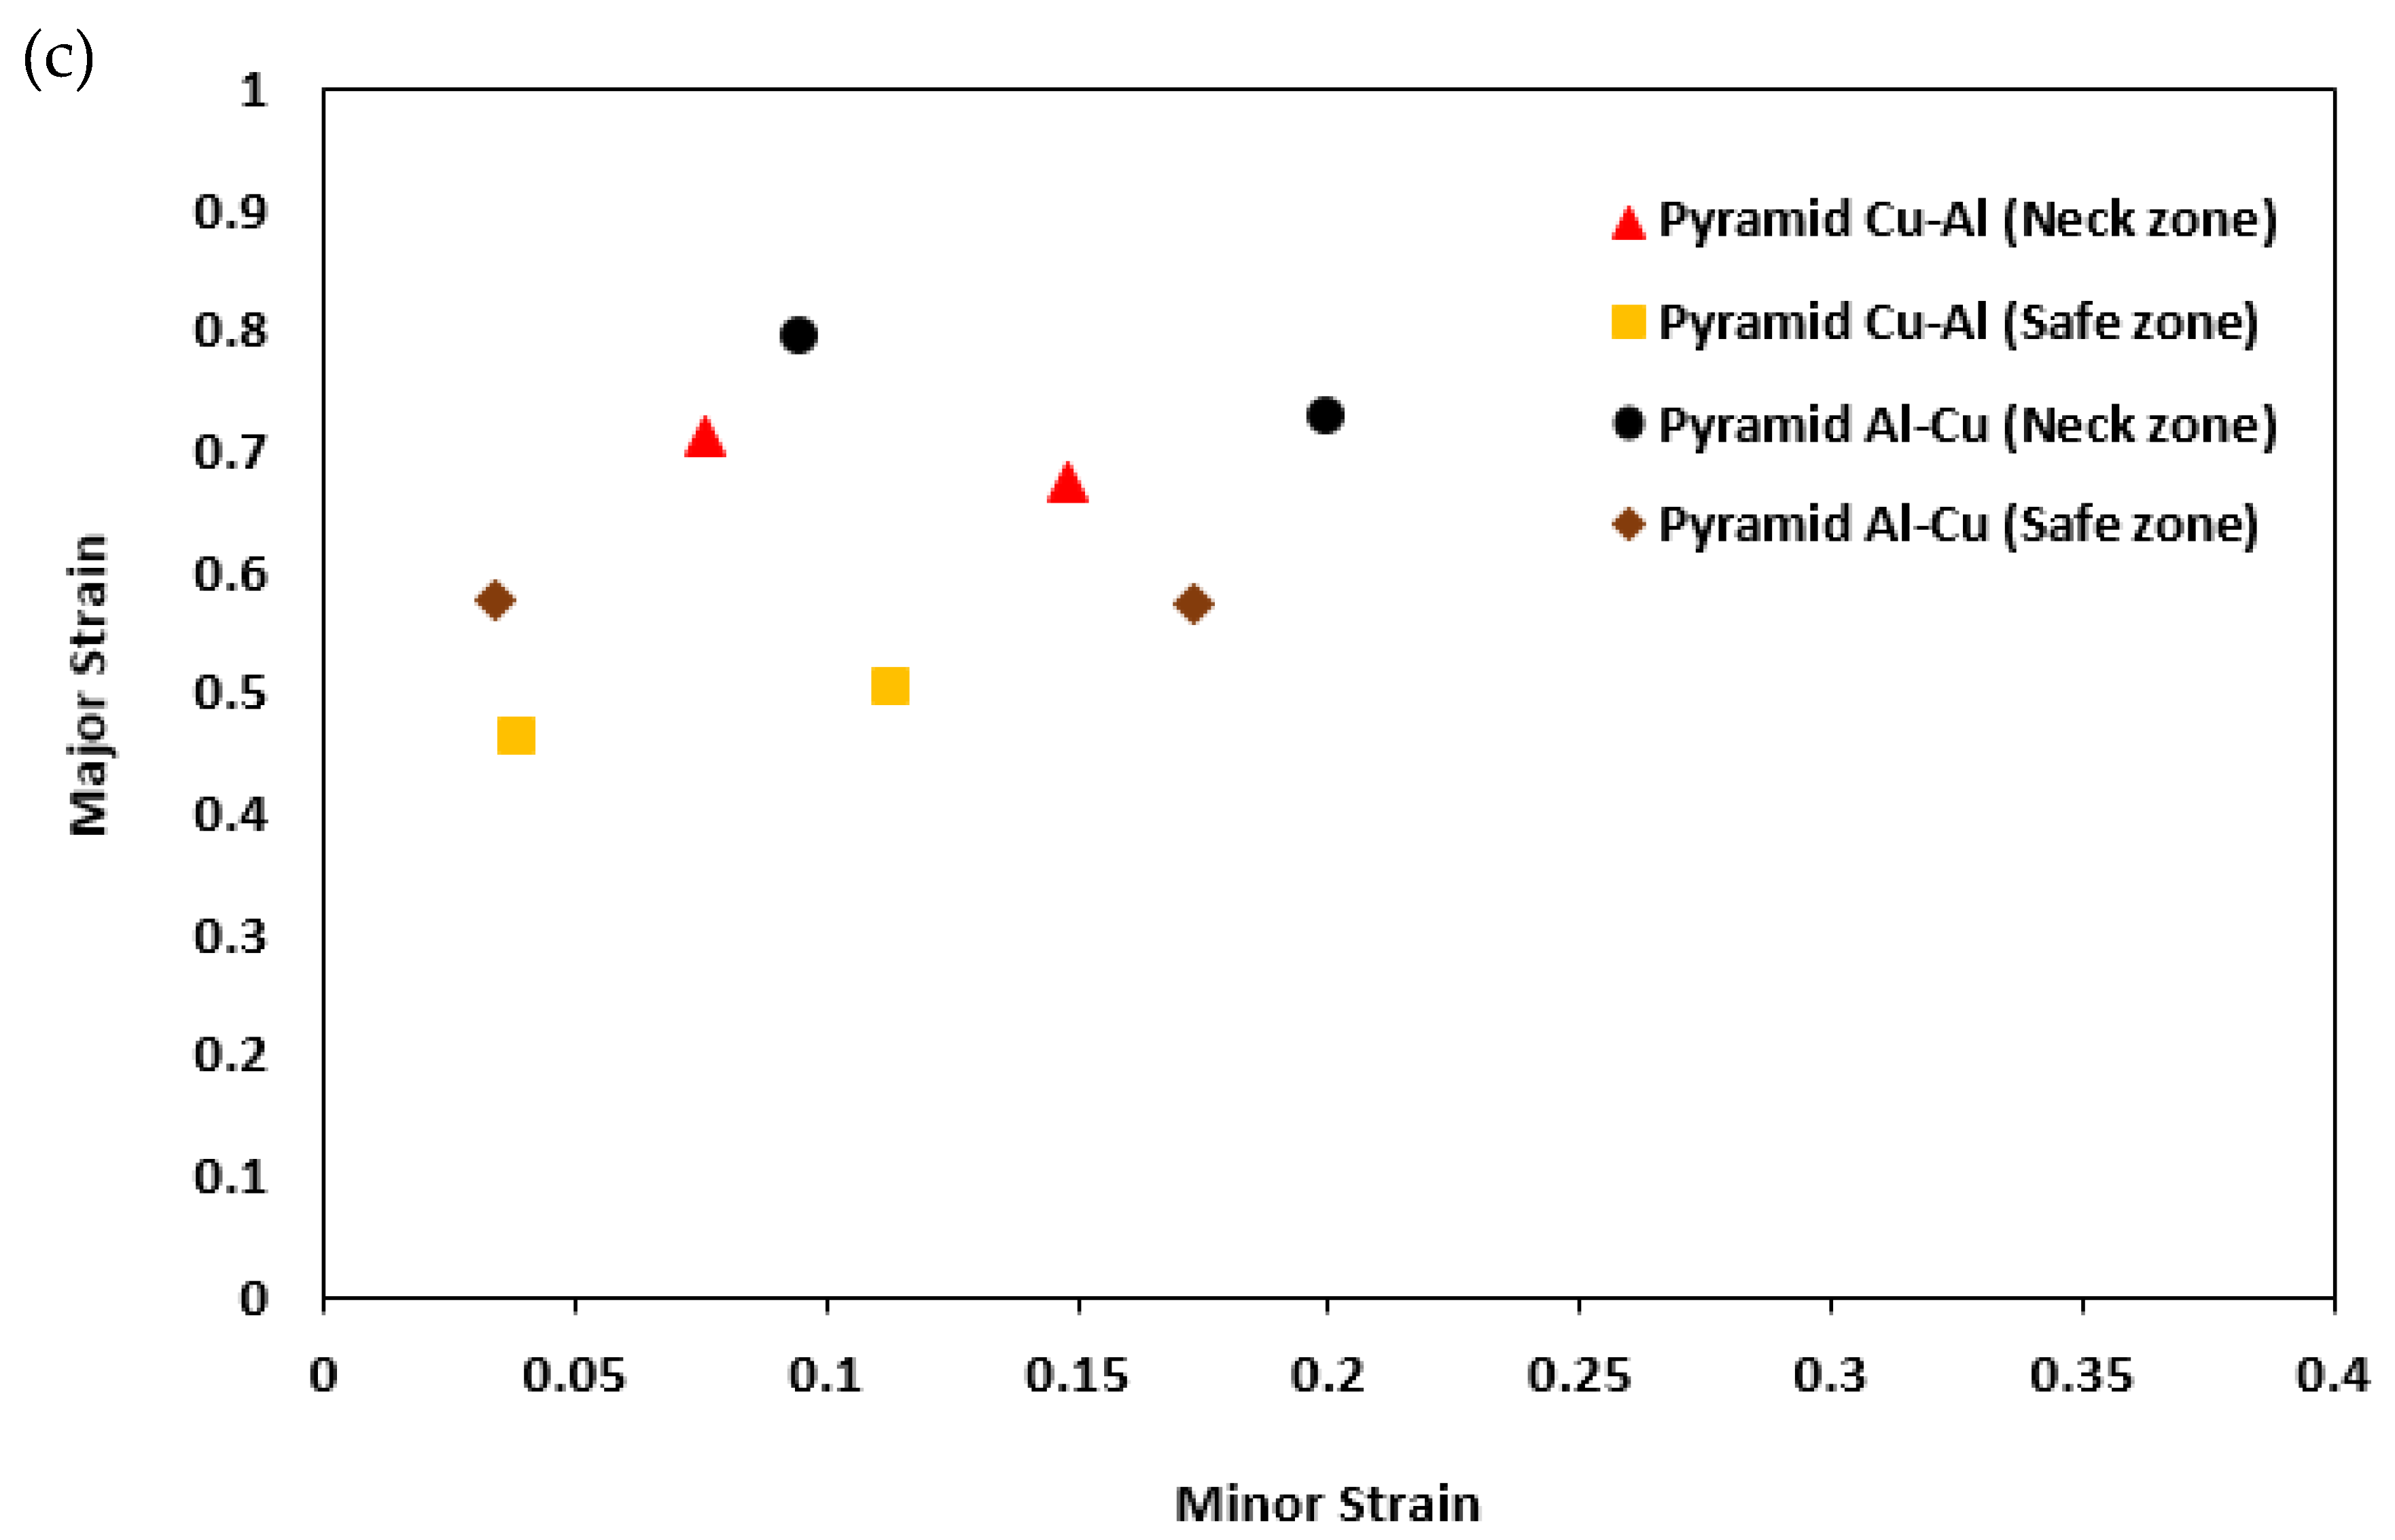
The experimental results of SPIF showed that the formability of the two-layer samples has increased compared to the base sheet samples. Also, by examining the layer arrangement effect, it was observed that the formability increases when the Cu sample is placed in the outer layer.
-
The experimental and numerical results of the thickness distribution for the base and two-layer sheet samples were checked and showed good agreement. The highest error value was reported as 9%.
-
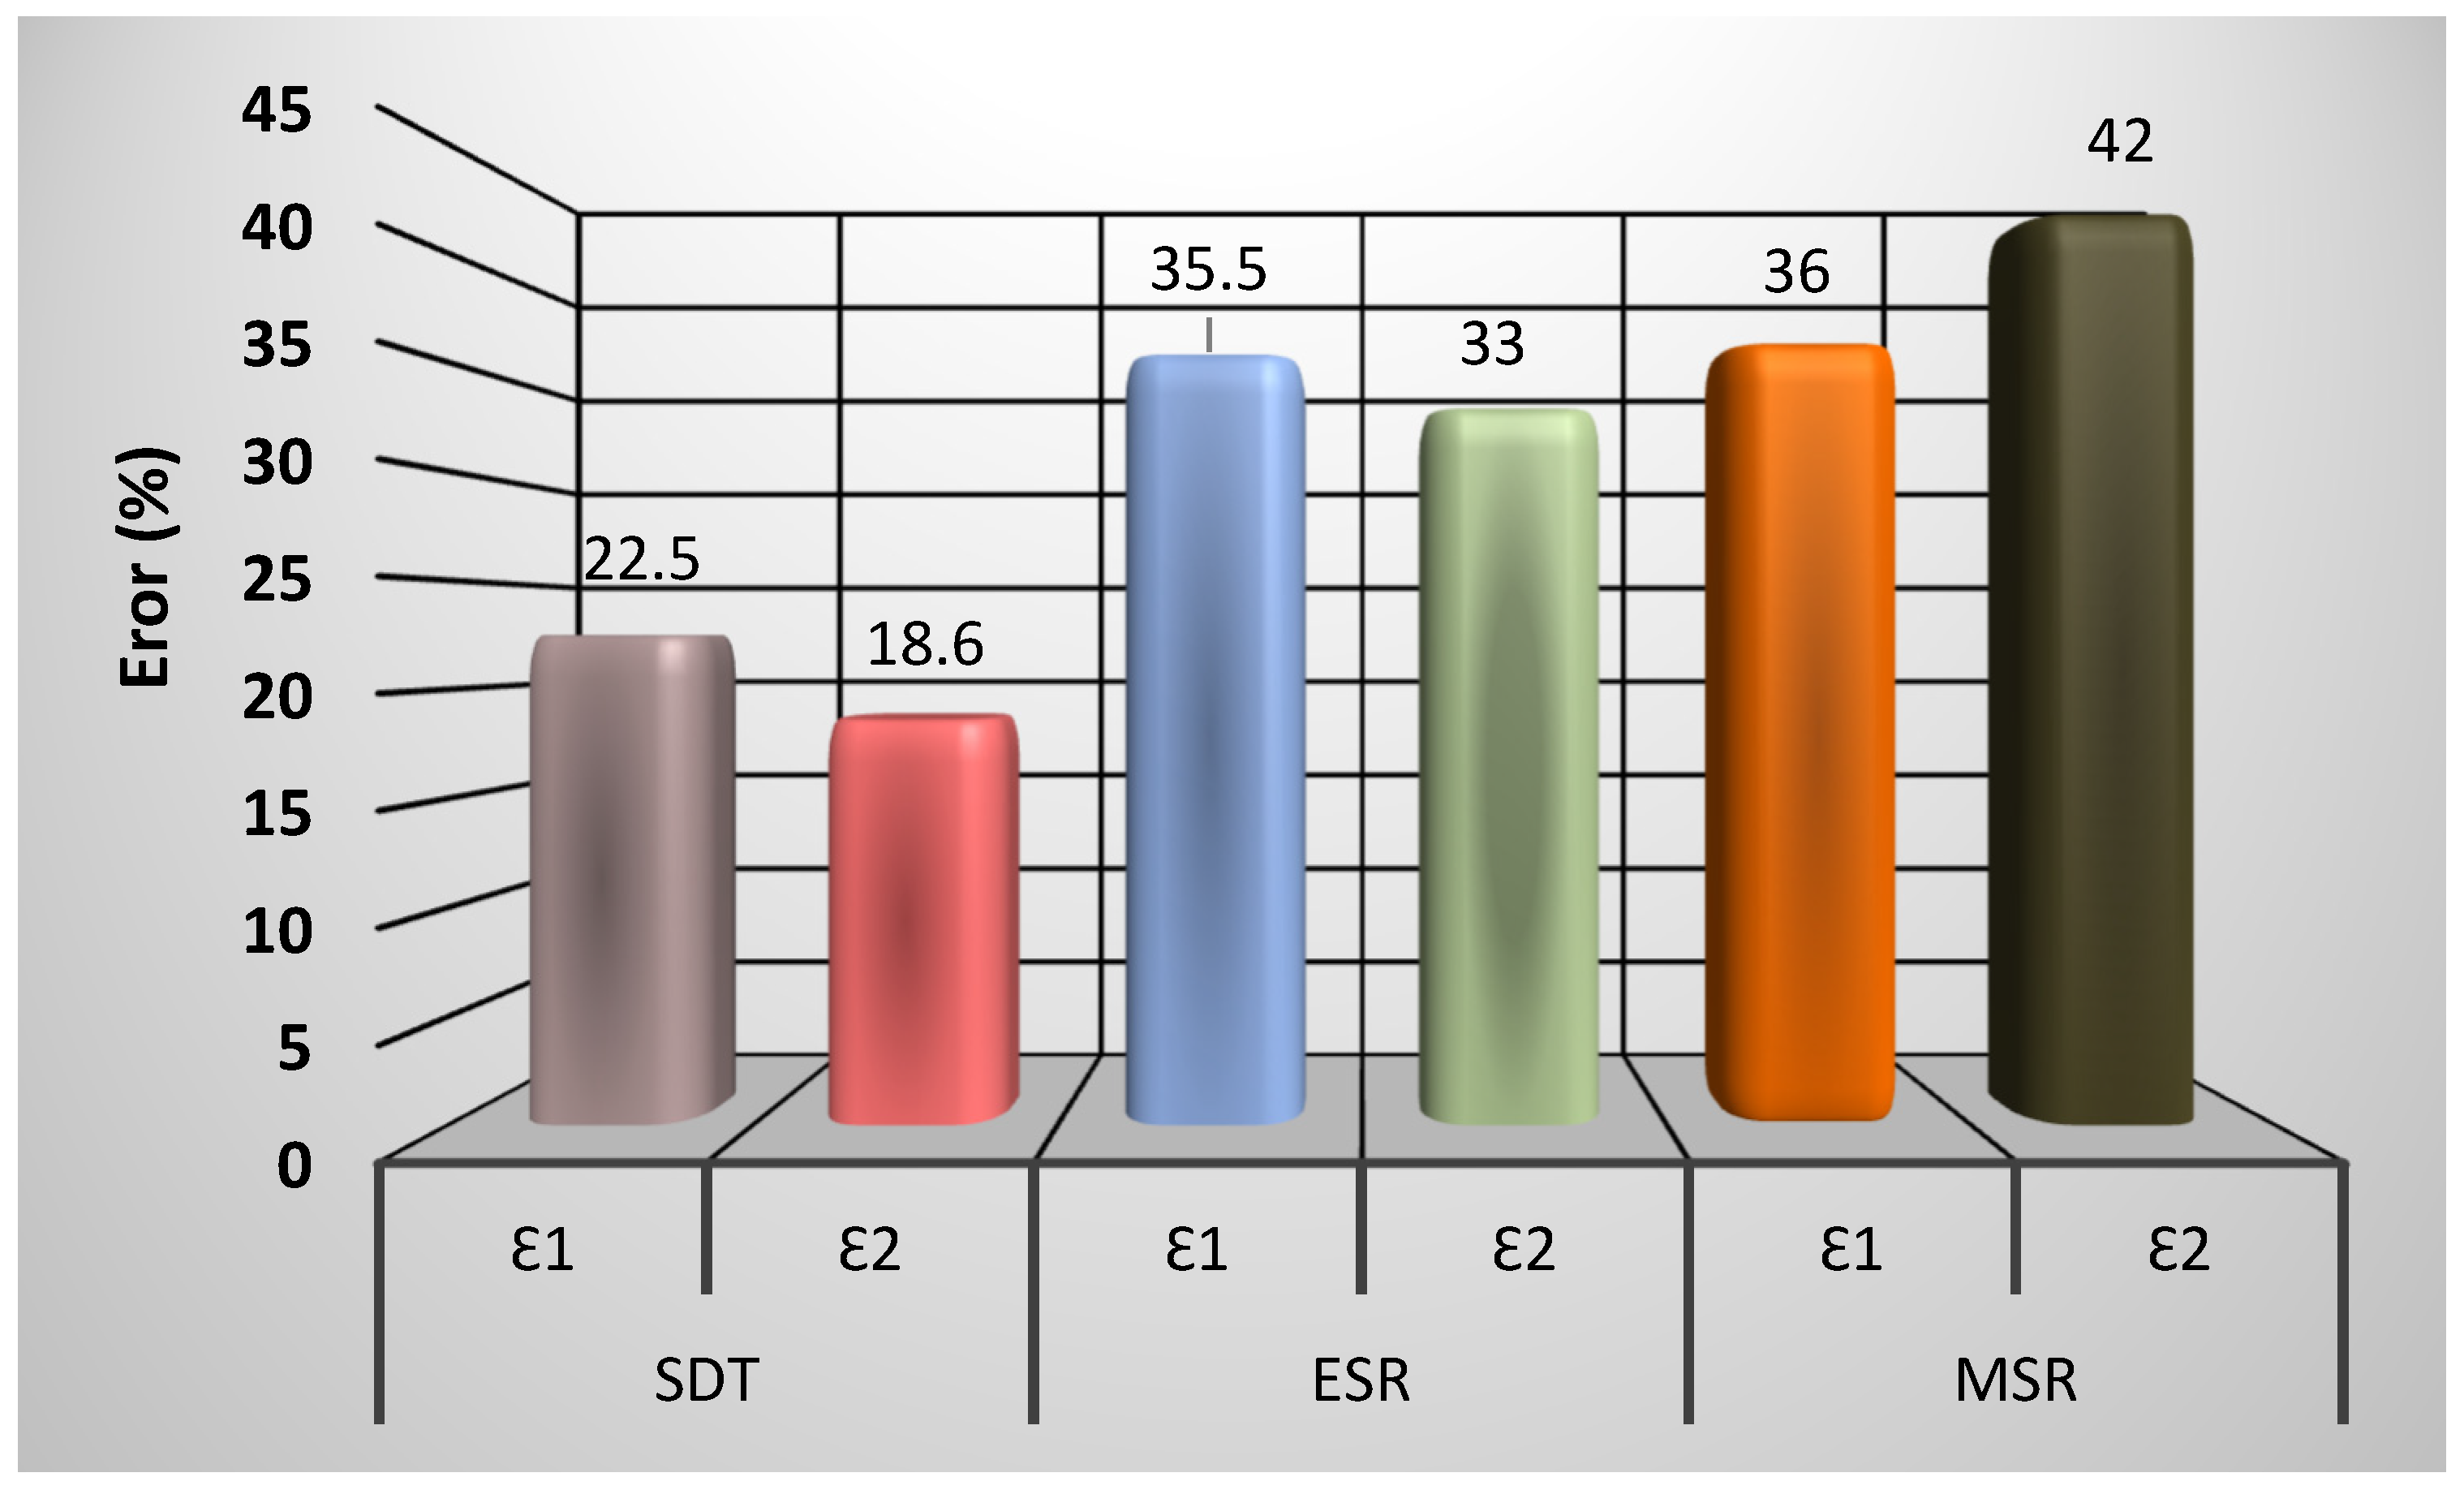
The FLDcrt method, a numerical–experimental method, provided the most accurate time and necking area prediction compared to the three numerical methods (SDT, ESR, and MSR). However, in the numerical methods, the SDT method reported the most precise prediction of the necking test.

Author Contributions

Conceptualization, P.T., A.R.N., H.A. and R.H.; methodology, P.T., A.R.N. and R.H.; formal analysis, A.R.N.; investigation, P.T. and A.R.N.; data Curation, P.T. and A.R.N.; writing—original draft preparation, P.T. and A.R.N.; writing—review and editing, H.A. and R.H. All authors have read and agreed to the published version of the manuscript.

Funding

This work is based upon research funded by the Iran National Science Foundation (INSF) under project No. 4005147.

Data Availability Statement

The original contributions presented in the study are included in the article, further inquiries can be directed to the corresponding author.

Conflicts of Interest

The authors declare no conflict of interest.

References

  1. Korouyeh, R.S.; Naeini, H.M.; Liaghat, G. Forming limit diagram prediction of tailor-welded blank using experimental and numerical methods. J. Mater. Eng. Perform. 2012, 21, 2053–2061. [Google Scholar] [CrossRef]
  2. Filice, L.; Fratini, L.; Micari, F. Analysis of material formability in incremental forming. CIRP Ann.-Manuf. Technol. 2002, 51, 199–202. [Google Scholar] [CrossRef]
  3. Ramkumar, K.; Baskar, N.; Elangovan, K.; Narayanan, C.S.; Selvarajan, K.A.; Jesuthanam, C.P. Comparison of multi point incremental forming tool with single point incremental forming tool using FLD, Fractography and 3D-surface roughness analysis on Cr/Mn/Ni/Si based stainless steel. Silicon 2021, 13, 487–494. [Google Scholar] [CrossRef]
  4. Chu, X.; Leotoing, L.; Guines, D.; Ragneau, E. Temperature and strain rate influence on AA5086 Forming Limit Curves: Experimental results and disCussion on the validity of the M-K model. Int. J. Mech. Sci. 2014, 78, 27–34. [Google Scholar] [CrossRef]
  5. Uppaluri, R.; Venkata Reddy, N.; Dixit, P.M. An analytical approach for the prediction of forming limit Curves subjected to combined strain paths. Int. J. Mech. Sci. 2011, 53, 365–373. [Google Scholar] [CrossRef]
  6. Dilmec, M.; Halkaci, H.S.; Ozturk, F.; Livatyali, H.; Yigit, O. Effects of sheet thickness and anisotropy on forming limit Curves of AA2024-T4. Int. J. Adv. Manuf. Technol. 2013, 67, 2689–2700. [Google Scholar] [CrossRef]
  7. Honarpisheh, M.; Keimasi, M.; Alinaghian, I. Numerical and experimental study on incremental forming process of Al/Cu bimetals: Influence of process parameters on the forming force, dimensional accuracy and thickness variations. J. Mech. Mater. Struct. 2018, 13, 35–51. [Google Scholar] [CrossRef]
  8. Gheysarian, A.; Honarpisheh, M. An experimental study on the process parameters of incremental forming of Al-Cu Bimetal. J. Comput. Appl. Res. Mech. Eng. 2017, 7, 73–83. [Google Scholar] [CrossRef]
  9. Alaie, A.; Hashemi, R.; Kazemi, F. Investigation of forming limit diagram and mechanical properties of the bimetallic Al/Cu composite sheet at different temperatures which fabricated by explosive welding. Proc. Inst. Mech. Eng. Part. B J. Eng. Manuf. 2021, 235, 73–84. [Google Scholar] [CrossRef]
  10. Chang, D.; Wang, P.; Zhao, Y. Effects of asymmetry and annealing on interfacial microstructure and mechanical properties of Cu/Al laminated composite fabricated by asymmetrical roll bonding. J. Alloys Compd. 2020, 815, 152453. [Google Scholar] [CrossRef]
  11. Rezaei, H.; Honarpisheh, M. Experimental and Numerical Investigation of Forming Limit Diagram of CP-Ti/St12 Bimetal in the Incremental Forming Process. Strength Mater. 2022, 54, 681–694. [Google Scholar] [CrossRef]
  12. Liu, Z.; Li, G. Single point incremental forming of Cu-Al composite sheets: A comprehensive study on deformation behaviors. Arch. Civ. Mech. Eng. 2019, 19, 484–502. [Google Scholar] [CrossRef]
  13. Dizajyekan, A.Z.; Mirnia, M.J.; Dariani, B. Fracture investigation in single point incremental forming of the Al/Cu laminated sheets using coupled damage plasticity model. CIRP J. Manuf. Sci. Technol. 2023, 43, 242–259. [Google Scholar] [CrossRef]
  14. Puchlerska, S.; Kuczek, Ł.; Trzepieci, T. Effect of Step Size on the Formability of Al/Cu Bimetallic Sheets in Single Point Incremental Sheet Forming. Materials 2023, 16, 367. [Google Scholar] [CrossRef]
  15. Jalali, A.; Hashemi, R.; Rajabi, M.; Tayebi, P. Finite element simulations and experimental verifications for forming limit curve determination of two-layer aluminum/brass sheets considering the incremental forming process. Proc. Inst. Mech. Eng. Part L J. Mater. Des. Appl. 2022, 236, 361–373. [Google Scholar] [CrossRef]
  16. Pambhar, A.C.; Valaki, J.B. Experimental studies of formability in single point incremental forming of Cu-Al bimetallic sheets. Mater. Today 2023, in press. [CrossRef]
  17. Standard Test Methods for Tension Testing of Metallic Materials, ASTM Standards, E8/E8M—13a. Published August 2013. Available online: https://www.astm.org/e0008_e0008m-13a.html (accessed on 1 February 2024).
  18. Tayebi, P.; Fazli, A.; Asadi, P.; Soltanpour, M. Formability analysis of dissimilar friction stir welded AA 6061 and AA 5083 blanks by SPIF process. CIRP J. Manuf. Sci. Technol. 2019, 25, 50–68. [Google Scholar] [CrossRef]
  19. Darvishi, M.; Morovvati, M.; Aghchai, A.J. Effects of equal channel angular rolling process on the mechanical properties of Al-Cu two-layer sheets: Experimental and numerical approaches. Eng. Res. Express 2023, 5, 035023. [Google Scholar] [CrossRef]
  20. Zahedi, A.; Dariani, B.M.; Mirnia, M.J. Using a damage plasticity model, experimental determination and numerical prediction of necking and fracture forming limit Curves of laminated Al/Cu sheets. Int. J. Mech. Sci. 2019, 153–154, 341–358. [Google Scholar] [CrossRef]
  21. Dietrich, D.; Nickel, D.; Krause, M.; Lampke, T.; Coleman, M.P.; Randle, V. Formation of intermetallic phases in diffusion-welded joints of aluminium and magnesium alloys. J. Mater. Sci. 2011, 46, 357–364. [Google Scholar] [CrossRef]
  22. Dieter, G.E. Mechanical Metallurgy; McGraw-Hill: New York, NY, USA, 1961. [Google Scholar]
  23. Jafarian, M.; Rizi, M.S.; Javadinejad, R.; Ghaheri, A.; Taghi, M. Effect of thermal tempering on microstructure and mechanical properties of Mg-AZ31/Al-6061 diffusion bonding. Mater. Sci. Eng. A 2016, 666, 372–379. [Google Scholar] [CrossRef]
  24. Cuzacq, L.; Polido, C.; Silvain, J.; Bobet, J. Hydrogen production properties of aluminum–magnesium alloy presenting β-phase Al3Mg2. Metals 2023, 13, 1868. [Google Scholar] [CrossRef]
  25. Mahendran, G.; Balasubramanian, V.; Senthilvelan, T. Developing diffusion bonding windows for joining AZ31B magnesium-AA2024 aluminium alloys. Mater. Des. 2009, 30, 1240–1244. [Google Scholar] [CrossRef]
  26. Razin, L.V.; Rudashevskij, N.S.; Vyalsov, L.N. New natural intermetallic compounds of aluminum, copper and zinc—Khatyrkite CuAl2, Cupalite CuAl and zinc aluminides from hyperbasites of dunite-harzburgite formation. Zap. Vsesoyuznogo Mineral. Obs. 1985, 114, 90–100. [Google Scholar]
  27. Jandaghi, M.R.; Saboori, A.; Khalaj, G.; Shiran, M.K.G. Microstructural evolutions and its impact on the corrosion behaviour of explosively welded Al/Cu bimetal. Metals 2020, 10, 634. [Google Scholar] [CrossRef]
  28. Denmeade, J. Investigation of Novel Precursor Routes for Incorporation of Oxynitride Spinel Phases into Ceramic-Metallic Composites Formed via the TCON Process. Ph.D. Thesis. 2013. Available online: https://digital.maag.ysu.edu/xmlui/handle/1989/11363 (accessed on 1 February 2024).
  29. Pineau, A.; Benzerga, A.A.; Pardoen, T. Failure of metals III: Fracture and fatigue of nanostructured metallic materials. Acta Mater. 2016, 107, 508. [Google Scholar] [CrossRef]
  30. Pandivelan, C.; Jeevanantham, A.K. Formability evaluation of AA 6061 alloy sheets on single point incremental forming using CNC vertical milling machine. J. Mater. Environ. Sci. 2015, 6, 1343–1353. [Google Scholar]
  31. Darabi, R.; Azodi, H.D.; Bagherzadeh, S. Investigation into the effect of material properties and arrangement of each layer on the formability of bimetallic sheets. J. Manuf. Process 2017, 29, 133–148. [Google Scholar] [CrossRef]
  32. Darban, H.; Mohammadi, B.; Djavanroodi, F. Effect of equal channel angular pressing on fracture toughness of Al-7075. Eng. Fail. Anal. 2016, 65, 1–10. [Google Scholar] [CrossRef]
  33. Pepelnjak, T.; Petek, A.; Kuzman, K. Analyses of the Forming Limit Diagram in Digital Environment. Adv. Mater. Res. 2005, 6–8, 697–704. [Google Scholar] [CrossRef]
  34. Narasimhan, K.; Wagoner, R.H. Finite Element Modeling Simulation of In-Plane Forming Limit Diagrams of Sheets Containing Finite Defects. Metall. Trans. A 1991, 22, 2655–2665. [Google Scholar] [CrossRef]
  35. Tayebi, P.; Hashemi, R. Study of single point incremental forming limits of Al 1050/Mg-AZ31B two-layer sheets fabricated by roll bonding technique: Finite element simulation and experiment. J. Mater. Res. Technol. 2024, 24, 149–169. [Google Scholar] [CrossRef]
  36. Seong, D.Y.; Haque, M.; Kim, J.; Stoughton, T.; Yoon, J. Suppression of necking in incremental sheet forming. Int. J. Solids Struct. 2014, 51, 2840–2849. [Google Scholar] [CrossRef]
Figure 1. Samples of SPIF geometries: (a) pyramid geometric, (b) cone geometric, (c) straight groove.
Metals 14 00214 g001aMetals 14 00214 g001b
Figure 2. SPIF experimental setup.
Metals 14 00214 g002
Figure 3. Prepared samples for tensile test: (a) base Cu, (b) base Al, (c) two-layer sheet, (d) hardness measurement path.
Metals 14 00214 g003
Figure 4. Model designed for the SPIF simulation process.
Metals 14 00214 g004
Figure 5. True stress–strain results for the base and two-layer sheets.
Metals 14 00214 g005
Figure 6. Vickers micro-hardness results for base and two-layer sheets.
Metals 14 00214 g006
Figure 7. (a) Back-scattered electron images and penetration depth for a two-layer sample. (b) Composition percentage for Al and Cu in the infiltration zone.
Metals 14 00214 g007
Figure 8. Tensile fracture surfaces: (a) Al base, (b) Cu base, (c) Al/Cu two-layer sheet.
Metals 14 00214 g008aMetals 14 00214 g008b
Figure 9. XRD patterns of Al–Cu bimetal at (a) ambient temperature, (b) 200°, (c) 300°, (d) 400°, and (e) 500°.
Metals 14 00214 g009aMetals 14 00214 g009bMetals 14 00214 g009c
Figure 10. SPIF process, (a) Al base sheet, (b) Cu base sheet.
Metals 14 00214 g010
Figure 11. SPIF process for bimetal sample, (a) Al–Cu by straight groove geometry, (b) Al–Cu by pyramid geometry, (c) Al–Cu by cone geometry.
Metals 14 00214 g011aMetals 14 00214 g011b
Figure 12. SPIF process for Cu–Al bimetal sample.
Metals 14 00214 g012
Figure 13. SPIF results of FLD, (a) base sample, (b) bimetal sample, (c) studying the effect of arrangement layer on the FLD.
Metals 14 00214 g013aMetals 14 00214 g013b
Figure 14. Measured points for thickness distribution test.
Metals 14 00214 g014
Figure 15. Comparison of experimental and numerical thickness distribution for base sheet.
Metals 14 00214 g015
Figure 16. Comparison of experimental and numerical thickness distributions for bimetal, (a) Al–Cu straight groove sample, (b) Al–Cu pyramid sample, (c) Al–Cu cone sample.
Metals 14 00214 g016
Figure 17. FLDcrt results for (a) base Cu, (b) base Al, (c) Al/Cu cone, (d) Al/Cu pyramid, (e) Cu/Al pyramid, (f) straight groove.
Metals 14 00214 g017aMetals 14 00214 g017b
Figure 18. Numerical and experimental results for FLD with (a) Al base sheet and (b) Cu base sheet.
Metals 14 00214 g018
Figure 19. Numerical and experimental results for FLD, (a) Al/Cu cone, (b) Al/Cu straight groove, (c) Al/Cu pyramid.
Metals 14 00214 g019aMetals 14 00214 g019b
Figure 20. The highest percentage error for predicting major and minor strains by numerical methods.
Metals 14 00214 g020
Table 1. The bimetal and base sheet samples’ depth and forming limit angle results.
SampleForming Depth (mm)Forming Limit Angle (Degree)
Base Al17.3844.5
Base Cu3559.6
Pyramid Al/Cu37.461.5
Cone Al/Cu47.568.8
Straight groove13.7790
Pyramid Cu/Al2853.9
Table 2. The results of predicting fracture depth by FLDcrt method and comparison with experimental results.
SampleForming Depth (mm)Forming Limit Angle (Degree)
Base Al17.3844.5
Base Cu3559.6
Pyramid Al/Cu37.461.5
Cone Al/Cu47.568.8
Straight groove13.7790
Pyramid Cu/Al2853.9
Table 3. Summary of the comparison of numerical and experimental results for base sheets.
SampleMajor Strain (EXP)Major Strain (SIM)Error %
(Major Strain)
Minor Strain (EXP)Minor Strain (SIM)Error %
(Minor Strain)
Al base-ESR0.28750.21235.5%0.0230.03033%
Al base-MSR0.2136%0.01642%
Al base-SDT0.2639.5%0.02718.6%
Cu base-ESR0.6200.5679.5%0.0500.03831.5%
Cu base-MSR0.49724%0.03527%
Cu base-SDT0.5797.2%0.05713.5%
Table 4. Summary of the comparison of numerical and experimental results for two-layer sheets.
SampleMajor Strain (EXP)Major Strain (SIM)Error % (Major Strain)Minor Strain (EXP)Minor Strain (SIM)Error % (Minor Strain)
Al/Cu-ESR (Cone)0.6190.50921.5%0.1450.12614.9%
Al/Cu-MSR (Cone)0.47929%0.11921.5%
Al/Cu-SDT (Cone)0.53316%0.12912.5%
Al/Cu-ESR (pyramid)0.5750.49316.5%0.1150.09420%
Al/Cu-MSR (pyramid)0.44429.7%0.09321.8%
Al/Cu-SDT (pyramid)0.51212.7%0.10013.6%
Al/Cu-ESR (straight groove)0.1540.1227.5%0.0530.041627%
Al/Cu-MSR (straight groove)0.11534.5%0.04031.7%
Al/Cu-SDT (straight groove)0.12522.5%0.046613.5%
Disclaimer/Publisher’s Note: The statements, opinions and data contained in all publications are solely those of the individual author(s) and contributor(s) and not of MDPI and/or the editor(s). MDPI and/or the editor(s) disclaim responsibility for any injury to people or property resulting from any ideas, methods, instructions or products referred to in the content.

