
The Effect of Microstructure on the Very High Cycle Fatigue Behavior of Ti-6Al-4V Alloy

1
Institute of Superalloys Science and Technology, School of Materials Science and Engineering, Zhejiang University, Hangzhou 310027, China
2
Polytechnic Institute, Zhejiang University, Hangzhou 310027, China
3
State Key Laboratory of Silicon and Advanced Semiconductor Materials, School of Material Science and Engineering, Zhejiang University, Hangzhou 310027, China
*
Authors to whom correspondence should be addressed.
Metals 2024, 14(3), 254; https://doi.org/10.3390/met14030254
Submission received: 24 January 2024
/
Revised: 17 February 2024
/
Accepted: 19 February 2024
/
Published: 20 February 2024
(This article belongs to the Special Issue Advances in Lightweight Alloys)
Abstract
:Crack initiation plays a major role in very high cycle fatigue (VHCF) life, and the initiation of cracks is related to slip behavior. There is a need for improvement in the understanding of the influence of Ti-6Al-4V microstructures on VHCF performance and crack initiation modes. In this study, through an investigation of Ti-6Al-4V VHCF in equiaxed and bimodal microstructures, two different crack initiation modes were identified. The change in crack initiation mode is related to the variation in microtexture, for which a corresponding model is proposed. The VHCF performance of the bimodal microstructure is significantly improved compared to that of the equiaxed microstructure.
1. Introduction
The fatigue behavior of metallic materials has been extensively studied for decades due to its crucial role in determining the lifespan and reliability of structural components. Traditionally, fatigue investigations focused on the low cycle fatigue (LCF) [1,2,3] and high cycle fatigue (HCF) [4,5] regimes, with most studies limited to fatigue lives up to 107 cycles. However, recent advancements in materials science and engineering have led to the exploration of very high cycle fatigue (VHCF) [6], involving fatigue lives beyond the 107-cycle threshold. VHCF is of particular interest in industries such as aerospace, automotive, and biomedical engineering, where components experience prolonged service lives and must withstand a vast number of loading cycles.
Titanium and its alloys have gained significant attention in various industrial sectors due to their exceptional combination of high strength, low density, and excellent corrosion resistance. Among the titanium alloys, Ti-6Al-4V alloy is one of the most widely used due to its favorable mechanical properties, good weldability, and adequate cost-effectiveness. As a result, Ti-6Al-4V alloy finds applications in critical components such as aircraft structural parts, gas turbines, and orthopedic implants. Despite the widespread use of Ti-6Al-4V alloy, there is still a limited understanding of its VHCF behavior and associated failure mechanisms. Due to the fact that crack initiation plays a major role in the very high cycle fatigue life [7], the initiation mechanism of very high cycle fatigue cracks is more meaningful [8]. According to previous research [9], titanium alloys with a bimodal structure are considered to have excellent very high cycle fatigue performance. There are many factors that affect the very high cycle fatigue performance of Ti-6Al-4V, such as equiaxed α-phase content [10], grain size [11,12], and microtexture [13,14,15]. Everaerts [12] found that the fatigue life of specimens with larger grains is lower than that of specimens with smaller grains. Bantounas [16,17] suggested that in bimodal structures, equiaxed structures with unfavorable orientation in α-phase grains are identified as the preferred locations for crack initiation. The crack initiation site occurs within equiaxed α-phase grains. The composition of the near basal planes of these grains results in facets forming within the grains under persistent fatigue loading conditions, where their basal planes are nearly perpendicular to the load direction. Brider [18] found that fatigue crack formation in Ti-6Al-4V occurred in the primary α nodules. Cracks formed from prismatic and basal slip planes. Fabien [19] found that fatigue crack initiation was observed in both primary α grains and lamellar colonies, on prismatic slip planes with high Schmid factors. However, not all crack initiation conforms to the theory elaborated in the above research, and the understanding of the behavior and mechanism of crack initiation during very high cycle fatigue still needs to be improved.
By identifying the critical factors affecting the VHCF performance, it becomes possible to enhance the fatigue life and reliability of Ti-6Al-4V alloy-based structures. Therefore, the primary objective of this study is to comprehensively investigate the influence of microstructure and microtexture on the VHCF behavior of Ti-6Al-4V alloy, including its fatigue strength, fatigue life, and fatigue crack initiation. Through this research, we aim to contribute to the existing knowledge of VHCF in titanium alloys, and provide insights into the design and optimization of Ti-6Al-4V alloy components.
2. Experimental Details
2.1. Material
The raw material used in this study is a 6 mm thick material, α/β annealed Ti-6Al-4V titanium alloy bars, with the chemical composition (wt.%) of 6.11 Al, 4.08 V, 0.13 Fe, 0.014 C, 0.004 N, 0.001 H, 0.11 O, and the balance Ti. The original-state sample was recorded as H0. Its tensile strength was 1027 ± 5 MPa, yield strength was 932 ± 4 MPa, its elongation was 12.8%, and its reduction of area was 30.1%. In addition, two heat treatments were used: heat-treatment 1 (H1) was heat treating at 970 °C for 60 min, forced air cooling, and aging at 730 °C for 75 min, followed by air cooling; heat-treatment 2 (H2) was heat treating at 970 °C for 60 min, forced air cooling, and overaging at 920 °C for 60 min, followed by air cooling.
2.2. Fatigue Testing Procedure
The fatigue test was conducted on an ultrasonic fatigue testing machine (HC SONIC) using an axial symmetric tension compression fatigue test with a frequency of f = 20 ± 1.5 kHz and a load ratio of R = −1. The sample was a dumbbell-shaped sample with a thread at one end and a diameter of 2.4 mm at the thinnest point in the center (Figure 1). The length of the sample was based on the testing frequency and the sound velocity inside the material, allowing the antinode of the standing wave to be located at the thinnest point in the center. The design of the circular arc avoided surface stress concentration of the sample and controlled the generation of fractures at the thinnest point. The surface of the sample needed to be polished to avoid surface processing defects affecting the test. The test was conducted at room temperature (25 °C), and in order to avoid overheating of the specimen during the test, jet cooling was required to keep the temperature below 30 °C.
2.3. Characterization Methods
The cross-sectional bar samples were intercepted, ground, and polished. A corrosive agent with HF:HNO3:H2O = 5:15:80 was utilized for microstructure observation. The heat-treated and fatigue-tested samples underwent cutting, grinding, rough-polishing, and fine-polishing for backscattered electron diffraction (EBSD) characterization. The fatigue-tested sample, after interruption, was cut and ground to 40–60 μm, followed by a double-spray thinning process using a solution consisting of 60% methanol, 34% n-butanol, and 6% perchloric acid at a temperature of −30 °C and a voltage of 17 V to prepare samples for transmission observation.
Microstructure observations were conducted using a FEI Quanta 650 FEG (Thermo Fisher Scientific, Waltham, MA, USA) scanning electron microscope (SEM) with an acceleration voltage of 20 kV. EBSD analysis was performed with a probe attached to the FEI Quanta 650 FEG, using an acceleration voltage of 20 kV and a step size of 0.2–0.5 μm, depending on the experimental requirements. For transmission electron microscopy (TEM) analysis, a Tecnai G2 F20 S-TWIN (Thermo Fisher Scientific, Waltham, MA, USA) transmission electron microscope produced by FEI was employed. In STEM mode, microstructural analysis and dislocation observations were conducted, and selected area electron diffraction was performed.
3. Results
3.1. Microstructure Transformation
The initial structure is shown in Figure 2a; it is an equiaxed structure composed of 90% of the primary α phase (Hexagonal Close Packed, HCP) with 10% residual β phase (Body-centered Cubic, BCC) composition. The obtained microstructure is shown in Figure 2b,c. The sample treated with H1 is a bimodal structure composed of equiaxed α and α + β colony; the proportion of equiaxed α phases is approximately 40%. The sample treated with H2 is also a bimodal structure, composed of equiaxed α and α + β colony, the proportion of equiaxed α phases is approximately 30%. In contrast, after H2 treatment, the thickness of the secondary α layers is larger, and the proportion is also higher.
3.2. Fatigue Test Results
The fatigue testing results are depicted in Figure 3, illustrating the relationship between stress amplitude and failure cycle. By analyzing and fitting three distinct sets of data points, three S-N curves have been derived. It is evident that the fatigue performance of the samples subjected to H1 and H2 heat treatment demonstrates noticeable enhancements across all stages. Remarkably, the very high cycle fatigue performance after H1 heat treatment exhibits the most significant improvement, as it only experiences failure after 1010 cycles under a stress amplitude of 610 MPa. In previous studies [20,21], the fatigue strength range σ of Ti-6Al-4V alloy was 410 to 503 MPa at 109 cycles. In this study, the stable fatigue strength value σ (109) was 620 MPa, which was 22% higher than that. The fatigue strength σ (109) before heat treatment was 540 MPa, so the improvement through heat treatment resulted in an 18.5% increase in fatigue strength.
Since the stress amplitude in this fatigue experiment is constant and R = −1, one can simply refer to Basquin’s formula:
where A and B are material constants, and the fatigue life is related to the power function of the stress amplitude as a one-time decreasing function. From the experimental results, the relationship roughly satisfies the above equation, but the coefficients change in different life intervals.
The H0 and H1 heat-treated samples exhibit multi-slope S-N curves and display an obvious plateau, indicating significant fluctuations in the fatigue life cycle under the same load. Heinz [22] and Tao Gao et al. [23] also found the same phenomenon and attributed its formation to the competitive behavior between surface cracking and internal cracking within the specimen. There is no plateau in the S-N curve of the sample after H2 heat treatment, indicating a different fatigue behavior compared to the H0 and H1 heat-treated samples. However, the instability in the distribution of data points near cycle 109 indicates that there are still fluctuations in fatigue life within this specific cycle range. The instability in data point distribution before and after 109 cycles may indicate the presence of transitional fatigue behavior in H2 heat-treated samples. Within this specific fatigue life range, certain fatigue mechanisms may act or interact in different ways, leading to fluctuations in material fatigue response.
3.3. Fracture Morphology
After observing the fatigue fracture surfaces following the experiment, all fracture surfaces had only one fracture initiation point, and three distinct crack initiation mechanisms were identified: surface initiation, subsurface initiation, and internal initiation [24]. The fracture morphologies of the H0, H2, and H1 heat-treated samples after 108 cycle failures are presented in Figure 4 from left to right. From the graph, it is evident that although the failure cycles for the three samples are similar, their fracture surfaces exhibit differences.
Figure 4a illustrates the macroscopic morphology of the fracture surface arising within the H0-treated sample. Upon observation, we discern three distinct regions from outer to inner: the quasi-cleavage fracture area (QCF), the fish-eye area (FiE), and the fine granular area (FGA). The presence of these regions implies the involvement of different fracture mechanisms within the material’s interior. The QCF manifests a relatively smooth appearance, displaying a microtexture akin to cleavage. This may suggest partial crystal cleavage occurring in this region, leading to the propagation of fracture along the cleavage planes of the crystal lattice. In the observation of the FiE (Figure 4d), it is noteworthy that this is the point of fracture initiation. On the fracture surface, a circular or approximately circular region is evident, oriented perpendicular to the direction of crack propagation. The presence of the fish-eye area indicates a distinct concentration of stress during the fracture process, designating this area as the origin point of the fracture. The innermost layer within the image, the FGA (Figure 4g), holds our special attention. The crack initiation point resides within the fine granular area, setting it apart from situations involving surface and subsurface initiations. In contrast to surface and subsurface initiations, the crack initiation point within the fine granular area lacks typical cleavage facets; instead, it presents minute ductile dimples. This implies that the formation of the crack is possibly related to the microstructure and crystallographic orientation within the material’s interior. The presence of the fine granular area suggests that local crystallographic orientation within the material plays a pivotal role in the fracture process, influencing the initiation and propagation of cracks.
As shown in Figure 4b, for the H2 sample, its fracture initiation mode is indicative of subsurface initiation. Upon inspecting the fracture surface, the path of crack propagation becomes distinctly evident, revealing the route along which the crack has spread. Extending backward along this path leads to the identification of the crack’s initiation point near a ridge-like area (Figure 4e) close to the sample surface. Some facets can be observed near the crack initiation point (Figure 4h). As shown in the Figure 4c, the fracture mode of the H1 sample exhibits typical features of surface initiation. Upon careful examination of the fracture surface, a well-defined crack propagation path becomes apparent, clearly marking the trajectory of crack propagation. In the reverse direction along this crack propagation path, the origin of the crack can be located on the sample surface. At this origin point (Figure 4i), the presence of minor facets can be observed. The presence of these facets implies the occurrence of certain fracture mechanisms within the material during crack propagation, leading to the formation of cleavage surfaces. In the observation of these facets, noteworthy is the angle between the facets and the cross-sectional plane. It can be observed that the angle between the facets and the fracture surface is relatively small. This observation suggests that significant deviation did not occur during crack propagation; the angle between the facets and the direction of crack propagation is small. This angle may be related to the material’s crystalline structure and fracture mechanisms. The presence of these facets is a characteristic feature of subsurface-initiated fractures. Various scholarly perspectives have been proposed regarding the origins of these facets. According to Dunne’s research [25], the unfavorable combination of hard grains with a smaller angle between the loading direction and the c-axis, along with soft grains featuring a larger angle between the loading direction and the c-axis, results in stress concentration at the hard grains. This stress concentration, combined with sliding effects, accumulates stress until the hard grains undergo cleavage, leading to facet formation. Bantounas [17] and Lavogiez [15,26], however, suggest that the formation of certain facets is not solely due to cleavage. For facets parallel to the substrate, grain damage is attributed to substrate sliding along the [1 1 −2 0] (0 0 0 1) direction.
3.4. Microtexture Evolution
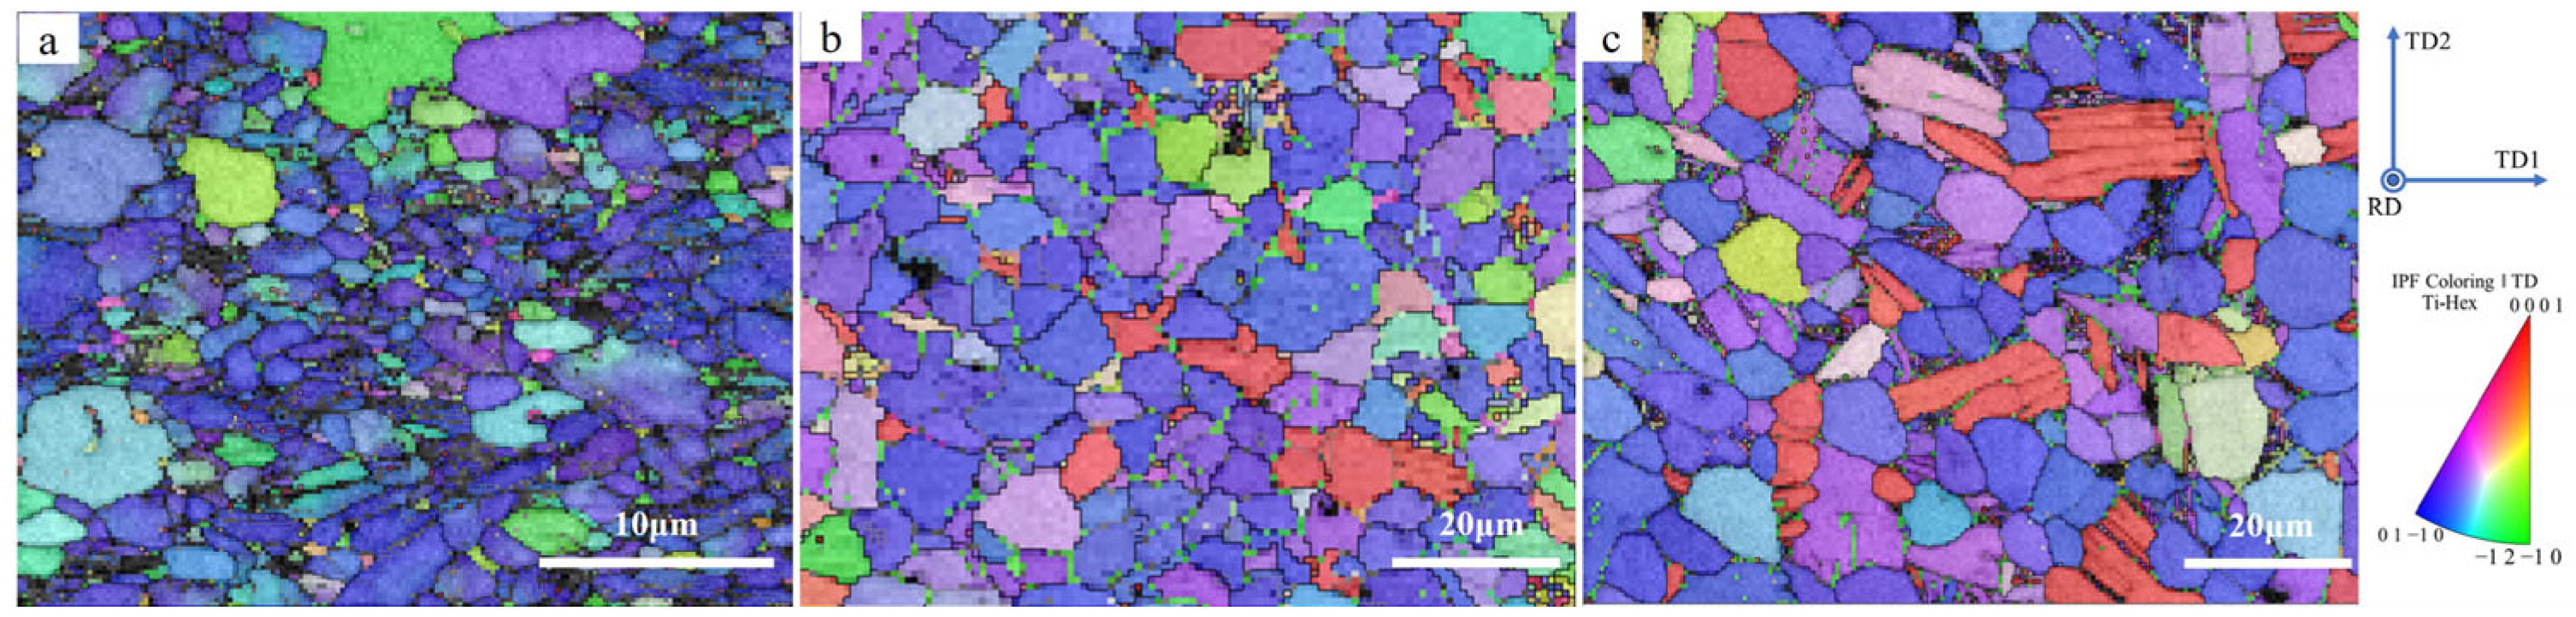
EBSD observations were conducted on cross-sections of the three bar samples, perpendicular to the thermal deformation direction, which was denoted as the rolling direction (RD) during the rolling press, with the remaining two directions labeled as TD1 and TD2. The direction of stress loading is parallel to the RD. The EBSD distribution obtained is presented in Figure 5. It can be observed that the average grain size of the H0 sample is small, but a small number of large grains are also visible in the figure, resulting in an overall mixture of large and small grains. This phenomenon arises from the last heat deformation process of the bar, during which some of the original large grains were extruded and deformed by external forces, leading to the formation of new fine grains. However, in the annealing process, after the hot deformation process did not reach the solid solution temperature, only part of the grains grew, resulting in a material containing a mixture of large and small grains.
After heat treatment, the average grain size increased and exhibited a more uniform distribution, accompanied by a decrease in the number of fine crystals within the samples. In Figure 5b,c, numerous grains consisting of secondary α lamella and β, representative of transformed β, are surrounded by equiaxed α. The grain sizes were quantified and categorized based on the equivalent circular diameter (as shown in Figure 6). The distribution of grain sizes roughly follows a Gaussian distribution. Following H1 heat treatment, the average grain size of the sample increased from 1.7 ± 0.6μm to 6.3 ± 1.8 μm, which is three times larger than that of the untreated sample. Subsequently, it further increased to 7.7 ± 1.9 μm after H2 heat treatment.
A significant number of fine crystals formed uniformly sized equiaxed grains during recrystallization in the first heat treatment and continued to grow during the holding process. This growth persisted during the second heat treatment. As the heat treatment temperature increased, the driving force for recrystallization also increased, resulting in a higher rate of grain growth and larger grain sizes in the final material. As the grain coarsens, the tough-brittle transfer temperature of the material increases, leading to a decrease in toughness. Also in coarse-grained materials, the size of defects is larger, so the stress required for fracture is lower, and grain coarsening is not conducive to very high cycle fatigue performance. However, it can be observed from the fatigue test results that, even as the microstructure transitions from equiaxed to bimodal, and despite an increase in grain size, the very high cycle fatigue performance is still enhanced. This indicates that the very high cycle fatigue performance of the bimodal microstructure is superior to that of the equiaxed microstructure.
EBSD analysis was employed to characterize the crystallographic orientation evolution during the accompanying spheroidization process. As can be seen in Figure 7a, the microtexture of the H0-treated sample exhibited α-phase {1 0 −1 0}||RD fiber microtexture with relatively low intensity. The formation of this microtexture is closely associated with the extent of thermal deformation and the deformation temperature [27,28]. Following H1 heat treatment, the {1 0 −1 0}||RD microtexture became more pronounced, concurrently presenting a certain intensity of {0 0 0 1}||RD microtexture. It can also be seen in the orientation distribution plot in Figure 5 that the proportion of {0 0 0 1}||RD-oriented grains (red) increased after heat treatment. With an increase in the heat treatment temperature, the microtexture transformation became more apparent. In the sample after H2 heat treatment, the dominant microtexture was {0 0 0 1}||RD fiber microtexture with an intensity of 19.30, while retaining a certain intensity of {1 0 −1 0}||RD microtexture. Microtexture transformation is associated with factors such as grain boundary migration, recrystallization, and elimination of residual stresses. As the temperature increases, the effects of these factors become more pronounced, leading to a higher proportion of grains undergoing orientation changes, thus resulting in the transformation of {1 0 −1 0}||RD microtexture to {0 0 0 1}||RD microtexture.
The grain orientation has an important influence on the slip mechanism during fatigue loading, and the angle between the grain orientation and the loading direction (in the same direction as RD) can affect the slip coefficient opened by grain slip. In this study of the Ti-6Al-4V alloy, in which the α phase accounts for a relatively high percentage, its mechanical behavior and ultrahigh circumference fatigue properties are mainly controlled by the α phase [29]; therefore, in this study, the slip coefficient of the HCP structure is mainly considered. The Schmid factor (SF) is a good index to measure the slip opening, and the size of its index signifies the possibility of slip system opening. The Schmid factor is calculated as:
where θ represents the angle between the direction of external stress and the normal of the lattice plane, while Φ denotes the angle between the sliding direction and the lattice plane. The onset of slip is also closely related to the critical resolved shear stress (CRSS) [25,30]. Bantounas [17], in his study of Ti-6Al-4V high cycle fatigue fracture surfaces, proposed a normalized Schmid factor (SF), combining SF and CRSS, to assess the ease of <a> basal slip, <a> prismatic slip, and <c + a> pyramidal slip for grains with different orientations in a given loading direction (LD). His work suggested that the angle between the loading direction and the c-axis direction of the grains plays a dominant role in determining the variation of slip systems within the range of 0–90°. Furthermore, he pointed out that grains with angles between 15° to 45° are more prone to slip.
Statistical analysis was conducted on the angles (γ) between the crystal grain c-axis and the loading direction for the three sample types, and their distribution density is depicted in Figure 8. It can be observed that in the H0-treated sample, γ is primarily distributed between 60° and 90°, indicating that a significant portion of grains predominantly undergo basal slip. Thus, slip activity within H0-treated samples under stress cyclic loading can be substantial. After H1 and H2 heat treatment, γ exhibits a bimodal distribution with the addition of a peak within 10°. These grains have lower SF in all three slip systems, which suggests that certain grains are less prone to slip compared to those of the H0-treated sample. In many studies, grains with γ angles within 10° are often referred to as hard grains, while those with γ around 90° are termed soft grains. Figure 5b,c also illustrate combinations of soft and hard grains, a structural feature frequently mentioned in previous research. This combination of soft and hard grains is considered a significant factor influencing the initiation of fatigue cracks, a topic that will be explored in the next section.
3.5. Fracture and Microcracks
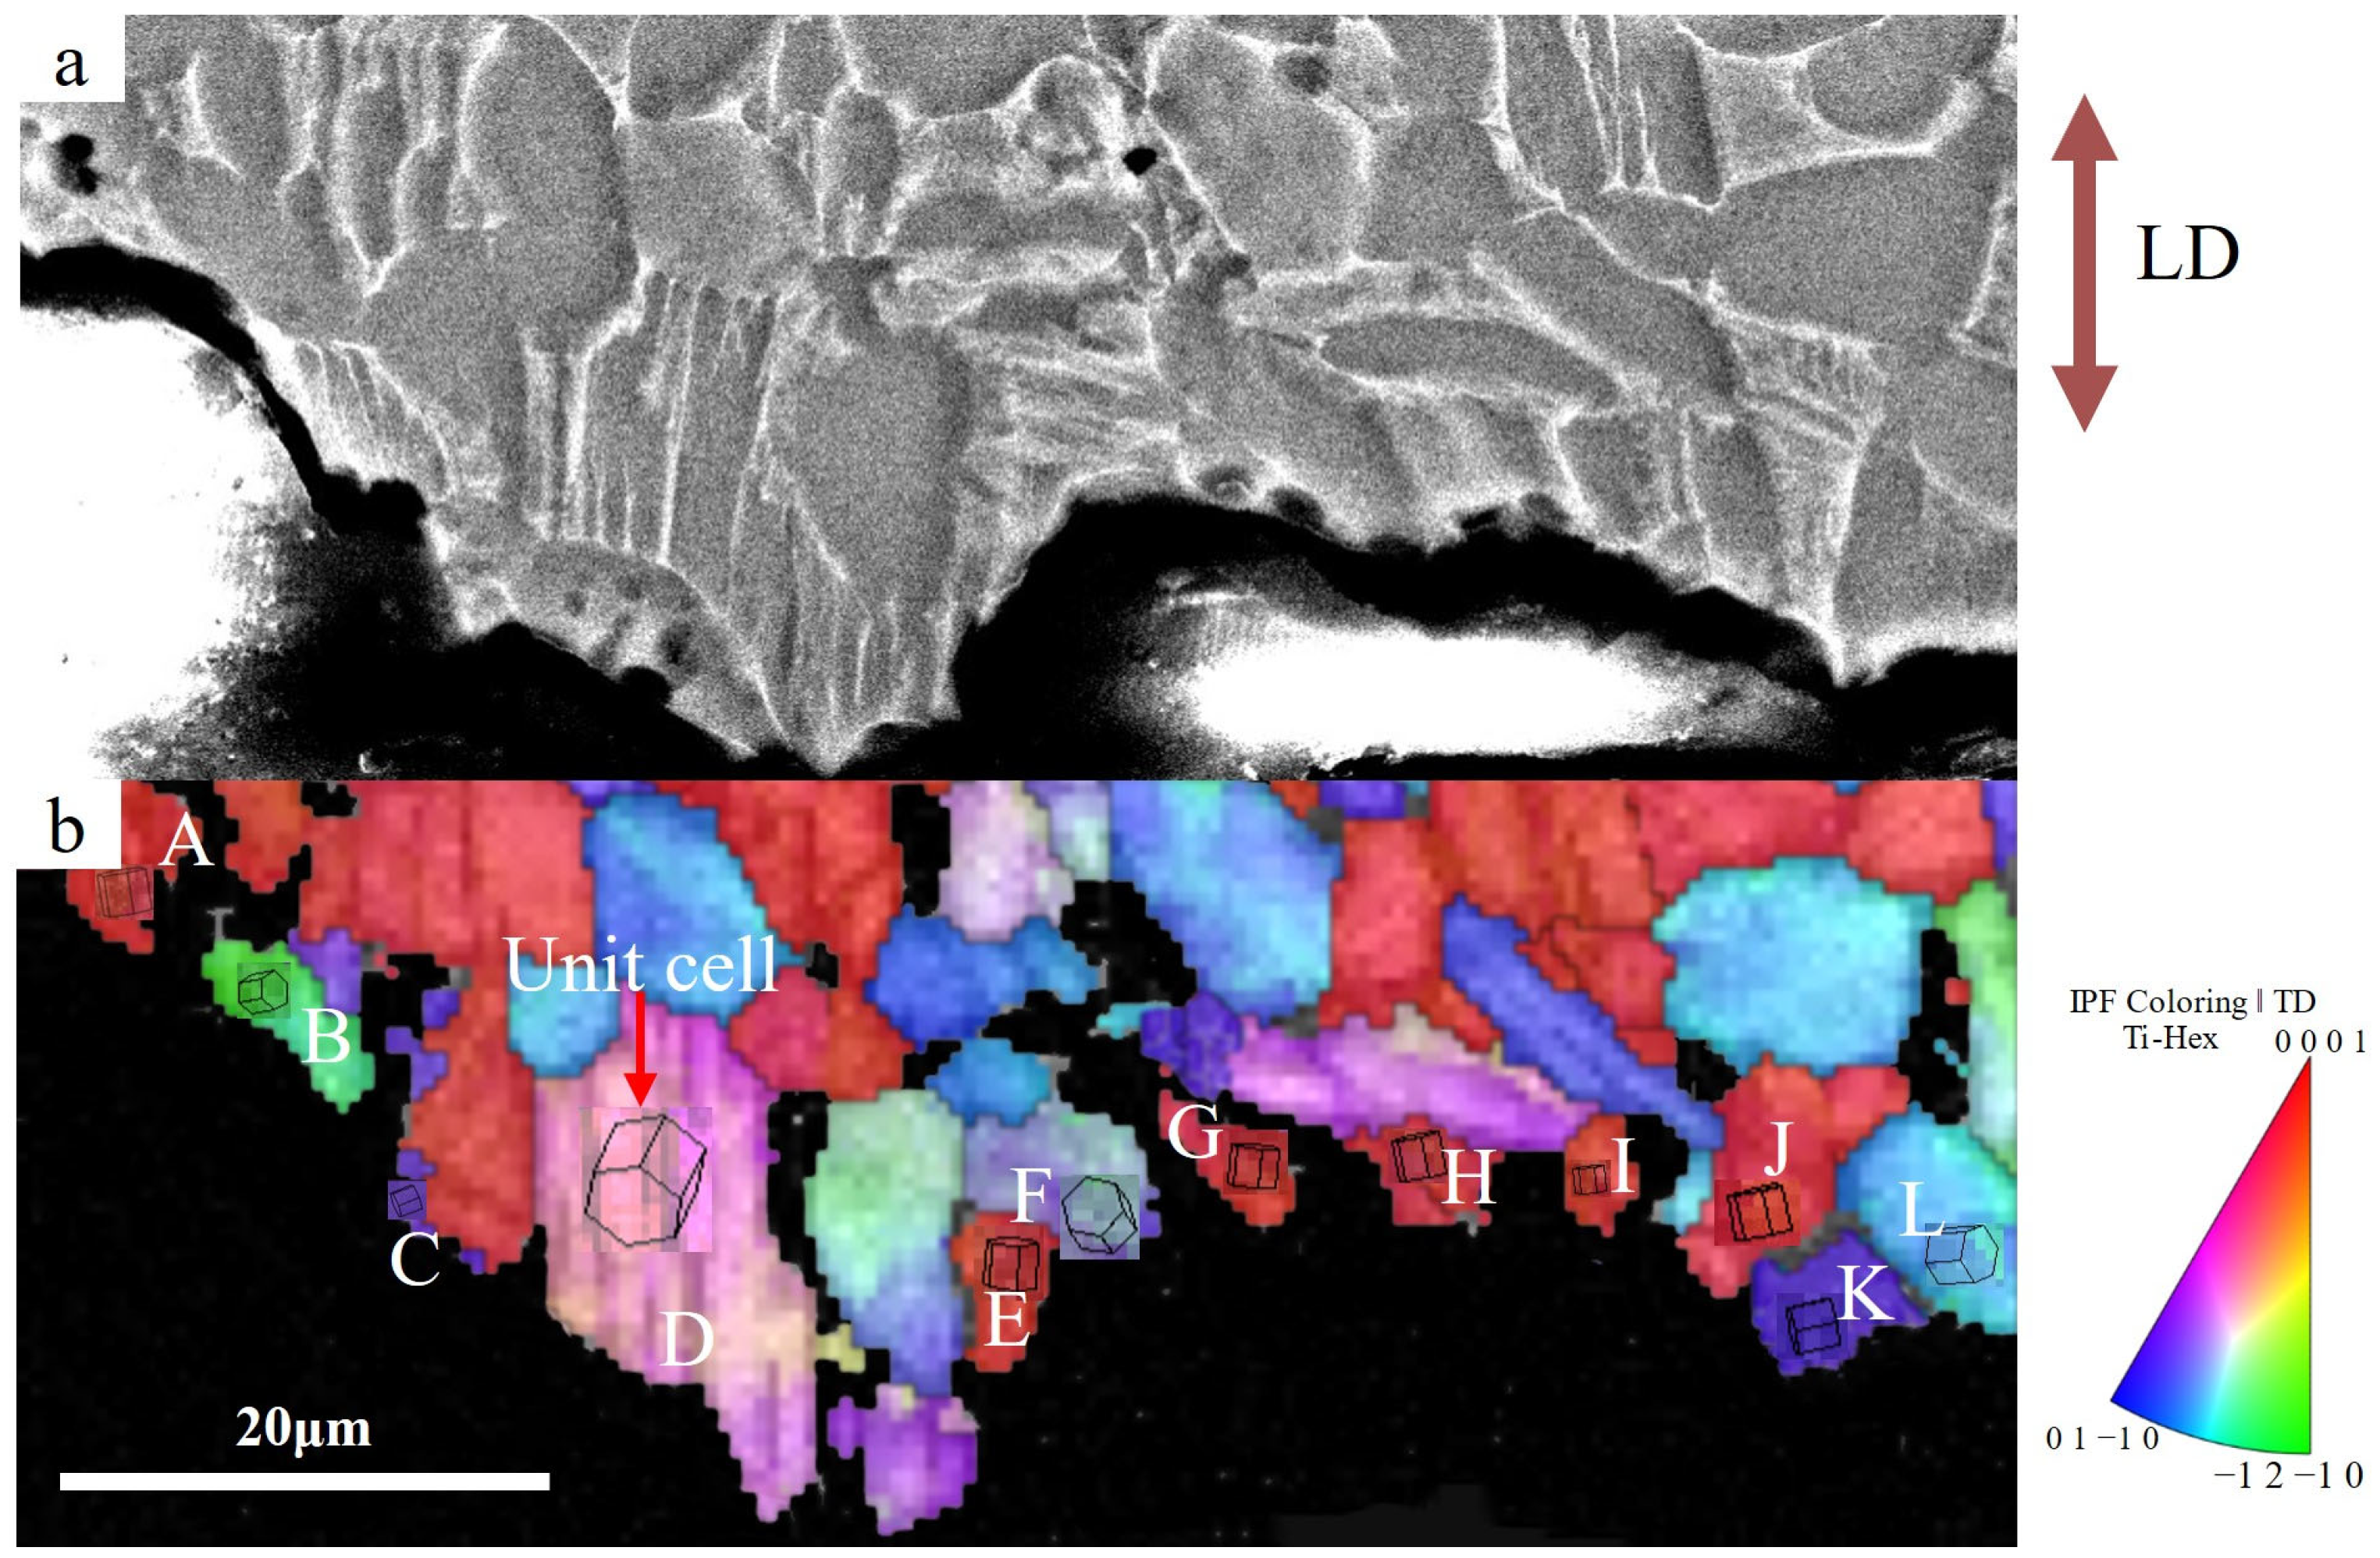
In order to thoroughly investigate the potential reasons for the formation of facets observed in the specimen fracture, we intercepted the longitudinal section near the fracture through the crack source and characterized the grains near the fracture facets using EBSD. Considering the similarity in the microtexture of the samples after both H1 and H2 treatments, we selected only the longitudinal section of the fracture of the H2-treated specimen for observation here. Figure 9b shows the EBSD image of the longitudinal section of the fracture, and Figure 9a displays the SEM image of the same location after etching with a corrosive agent.
We labeled the grains at the fracture from left to right as A to L, based on their proximity to the crack source. From the fractured grains on the section, approximately half are identified as hard grains. Most of these grains exhibited cracks along the basal plane, indicating that the primary fracture mode during crack propagation is grain disintegration along this plane. Grain D, whose c-axis is at an angle of about 30° to the loading direction, is not a hard grain, and its fracture surface is close to the basal surface, so it can also be judged as a facet formed by disintegration. Unlike the other hard grains, the orientation of grain D was slightly different, and the whole grain experienced slight deformation under fatigue loading. This indirectly confirms slip within the grain, underscoring the role of slip in grain fracture during crack propagation.
Given that the crack initiation plays a major role in the total fatigue life in the study of very high fatigue performance, our primary focus is on the causes of crack initiation rather than the crack extension stage. The two grains K and L are about 200 μm away from the section edge, and they can be judged to be in the crack source region according to Figure 4e. When we shift our focus to grains K and L, we observe that the c-axis of these two grains forms an angle close to 90° with the loading direction—indicative of soft grains. Evidently, the formation of the crack source is not attributed to the slip behavior of hard grains.
A mere analysis of the grain condition at the fracture cannot definitively determine the origin of the crack, nor can it ascertain whether the fracture occurs within the grain or at a grain boundary. Therefore, to thoroughly investigate the formation of crack sources, we longitudinally cut the center of some experimentally unbroken specimens, specifically searching for evidence of crack initiation near the surface.
The microcracks observed in our study appeared inside the secondary α lamella, within the equiaxed α, and at the α/β phase boundary. As mentioned earlier, the α phase, being the weaker of the two phases, is the primary influencing factor for fatigue crack initiation. In the case of the heat-treated bimodal organization, microcrack initiation tends to occur inside the secondary α lamella. Thus, we sought a representative microcrack for observation and characterization. The EBSD image of the microcrack and its neighboring grains is presented in Figure 10b, while Figure 10a displays the image observed under SEM after corroding the same location. In the figure, a notable presence is a rogue grain combination consisting of adjacent soft and hard grains, a phenomenon first proposed by Dunne [25] and has remained a point of interest in subsequent VHCF studies. Most of the microcracks are found within the secondary α lamella, and some have crossed the grain boundary with the adjacent grain. The microcracks are primarily located in the soft grains and the adjacent hard grains below them. It can be hypothesized that the microcracks originated on the side of the soft grain near the grain boundary between the soft and hard grains.
While it has been previously suggested that the failure of an unfavorable combination of soft and hard grains during fatigue loading is mainly due to slip within the soft grains and the generation of persistent slip bands, terminating at the grain boundaries of the soft and hard grains, our observations present a phenomenon inconsistent with this. To further investigate the effect of dislocation slip in undesirable grain assemblies on microcrack formation, we utilized TEM to observe the cross-section of unbroken samples.
In Figure 11a, it is evident that a group of dislocations form first within the α grain. Dislocations initiate within the grains and show increased density near the grain boundaries, suggesting that dislocations accumulate toward the grain boundaries during motion. Although the γ angles of grains in the pristine state samples are generally large, not all grains produce dislocations under fatigue loading. As seen in Figure 11b, dislocations are more likely to manifest within the larger grains, exhibiting diverse slip directions. During intragranular movement, dislocations tend to approach grain boundaries. Upon reaching α and β grain boundaries, slip discontinues, leading to their accumulation at the α/β grain boundaries. This accumulation gradually forms larger defects, as illustrated in Figure 11c, ultimately resulting in microcrack formation at the α/β grain boundaries. A significant portion of the internal dislocations within the grains aggregate to form numerous intragranular plugs, depicted in Figure 11d, consequently generating intragranular microcracks.
The H1-treated samples were examined under the TEM electron microscope after the fatigue interruption test, as depicted in Figure 12. Similarly to the pristine state samples, dislocations were more likely to manifest within the larger grains, displaying diverse slip directions. In Figure 12a, a significant number of dislocations with an orderly arrangement were observed at the grain boundaries, their motion direction being parallel to the interface. Such dislocations may contribute to grain disintegration on the right side due to stress concentration. Additionally, it was observed that some dislocations were able to traverse the grain boundary, likely influenced by the grain boundary angle. This cross-grain boundary slip transfer can enhance material properties. Moreover, in contrast to the pristine samples, dislocations were also generated within the secondary α lamellae within the transformed β. These dislocations eventually reached the grain boundaries.
4. Discussion
4.1. Microstructure Changes after Heat Treatment
The microstructure of the heat-treated samples shifted from {1 0 −1 0}||RD fiber microtexture of the α-phase to {0 0 0 1}||RD, and this transformation resulted from certain grains altering their orientations during the heat treatment process. Previous studies [27,28,31,32] have shown that in titanium alloys, the microstructure changes and creates macroscopic zones after thermal deformation. In this study, no external force was introduced. One reason for the shift in grain orientation is the phase transformation during heat treatment. Some equiaxed α transforms into β phase during heat preservation, and during cooling, the β phase partially transforms into secondary α lamella. This can explain the orientation of the secondary α in some of the β-transformed grains as {0 0 0 1}||RD. During this transformation, the orientation of secondary α lamella is influenced by the orientation of the β phase. It’s noteworthy that some of the equiaxed α also transforms in directions with larger angles. This occurrence is due to the adequate forces present in the heat treatment process that may not be adequate for complete α orientation transformation.
The heat treatment process provides enough energy, making atoms in the lattice highly active, allowing them to rearrange to optimize energy. Moreover, the heat treatment process entails the release of residual stress, causing a certain degree of grain deflection. The migration of grain boundaries during the growth of equiaxed α leads to grain boundary rearrangement and grain orientation adjustment. As the second heat treatment temperature increases, the alterations in weaving become more pronounced, emphasizing the significant role of thermal influence and phase transformation in these changes. However, the movement and rearrangement of atoms during the heat treatment process constitute a complex phenomenon, demanding further theoretical and experimental support for comprehensive understanding.
4.2. Factors Affecting the Fatigue Performance of VHCF
4.2.1. Sphericity and Grain Size Uniformity
After heat treatment, the H0-treated samples exhibited significant equiaxed α-spheroidization. Spherical grains aid in stress dispersion, reducing stress concentration and lowering the likelihood of crack initiation. In studies by Everaerts et al. [12], it was observed that samples with larger grains had a lower HCF and VHCF life compared to those with smaller grains. Although the H0-treated samples had a smaller average grain size, there were substantial differences in grain size. Larger grains were more prone to generating a significant number of dislocations due to stress concentration, making microcrack initiation easier. Conversely, post-heat-treated samples had larger grain sizes but better grain size uniformity, reducing stress concentration in individual grains and mitigating dislocation occurrence. However, larger grain sizes imply a lower grain boundary density, which can impede crack propagation. Therefore, the increase in grain size significantly impacts low and high cycle fatigue performance adversely.
4.2.2. Impact of Microstructure and Microtexture on VHCF Performance
The microstructure of the alloy has a significant influence on its mechanical properties. In the H0-treated sample, the microstructure is equiaxed, primarily composed of equiaxed α with a small amount of β phase. After heat treatment, the microstructure transforms into a bimodal structure with approximately equal proportions of equiaxed α and β transformed structures. The change in microstructure is a key factor in enhancing the fatigue performance of the samples after heat treatment [33]. The emergence of the β transformed structure leads to more α/β grain boundaries. The strength of α/β grain boundaries is greater than that of α grain boundaries. However, the ‘β brittleness’ results in poor plastic deformation ability in pure lamellar structures. The retention of equiaxed α plays a role in enhancing toughness. The combined effect of these factors enhances the VHCF performance.
Moreover, the microtexture of the H0-treated sample is {1 0 −1 0}||RD, and the Schmid factor of the <a> prismatic slip system is larger, making slip more likely to occur. Dislocations first occur on larger equiaxed α. The internal generation and gradual proliferation of grains result in the interweaving of dislocations belonging to two slip systems, forming a dense dislocation tangle. The process of fatigue cracking in the H0-treated sample can be explained by several stages, as shown in Figure 13: the first stage is the generation of dislocations from different slip systems within larger grains; the second stage is the slip and proliferation of dislocations under continuous stress cyclic loading; the third stage is the formation of dislocation tangle; the fourth stage is the formation of microcracks within the grains.
Considering the influence of microstructure alone cannot explain why the very high cycle fatigue performance of the H1-treated samples is superior to that of the H2-treated samples. This requires an explanation from the perspective of microtexture. As mentioned earlier, the second step of heat treatment in H2 is at a relatively higher temperature compared to H1, resulting in a stronger {0 0 0 1}||RD microtexture. This implies a higher density of rogue grain combinations. The influence of rogue grain combinations can be explained by the fatigue crack initiation process demonstrated in Figure 14: the first stage involves dislocation generation within soft grains; the second stage involves dislocation slip under sustained cyclic stress; the third stage involves hindrance to dislocation movement when encountering the interface between hard and soft grains, preventing dislocations from moving into the hard grains; the fourth stage involves the accumulation of numerous dislocations at grain boundaries, eventually forming microcracks. The formation of microcracks is a critical indicator marking the end of very high cycle fatigue life. While fatigue microcracks can also initiate within improperly oriented equiaxed α grains, where dislocations moving in different directions meet and accumulate, forming microcracks within the grains during movement towards the grain boundaries, this initiation is less common than rogue grain combinations, particularly observed in the H0-treated samples devoid of rogue grain combinations.
5. Conclusions
Through the very high cycle fatigue performance testing and characterization of samples with equiaxed microstructure in the as-received condition (H0) and bimodal microstructures obtained through two different heat treatments (H1, H2), this study draws the following conclusions:
- The crack initiation modes in equiaxed and bimodal microstructures of Ti-6Al-4V are different, and are related to the distinct microtextures of the two. In the equiaxed microstructure, slip and multiplication of dislocations within large grains are more prone to occur, leading to the initiation of microcracks under stress loading. In the bimodal microstructure, grains oriented {0 0 0 1}||RD form rogue grain combinations with grains oriented {1 0 −1 0}||RD, causing the accumulation of dislocations and the formation of microcracks on the soft grain side.
- The VHCF performance of the bimodal microstructure is superior to that of the equiaxed microstructure. Bimodal microstructure samples obtained through heat treatments at 970 °C × 60 min, FAC + 730 °C × 75 min, AC exhibit an 18% improvement in fatigue strength at 109 cycles compared to the original equiaxed microstructure samples.
- According to the test results, in the bimodal microstructure, an increase in grain size and the presence of rogue grain combinations lead to a deterioration in VHCF performance. Therefore, obtaining a bimodal microstructure while simultaneously controlling grain size and microtexture is a viable approach to enhance VHCF performance.
Author Contributions
Conceptualization, M.Y. and X.Z.; Formal analysis, M.Y.; Investigation, M.Y. and Q.Y.; Resources, X.Z., Q.Y., Y.G. and Z.Z.; Data curation, M.Y.; Writing—original draft, M.Y.; Writing—review & editing, X.Z. and Y.G.; Supervision, X.Z., Y.G. and Z.Z.; Project administration, Q.Y. and Z.Z.; Funding acquisition, X.Z. All authors have read and agreed to the published version of the manuscript.
Funding
This research received no external funding.
Data Availability Statement
The raw data supporting the conclusions of this article will be made available by the authors on request.
Acknowledgments
Thanks to the support of equipment and guidance of experiments of researchers in Center of Electron of Microscopy of Zhejiang University.
Conflicts of Interest
The authors declare that they have no known competing financial interests or personal relationships that could have appeared to influence the work reported in this paper.
References
- Demulsant, X.; Mendez, J. Influence of Environment on Low Cycle Fatigue Damage in Ti6Al4V and Ti 6246 Titanium Alloys. Mater. Sci. Eng. A 1996, 219, 202–211. [Google Scholar] [CrossRef]
- Chang, L.; Lv, C.; Kitamura, T.; Zhang, W.; Zhou, C.-Y. Slip Dominated Planar Anisotropy of Low Cycle Fatigue Behavior of Commercially Pure Titanium. Mater. Sci. Eng. A 2022, 854, 143807. [Google Scholar] [CrossRef]
- Sinha, S.; Gurao, N.P. The Role of Crystallographic Texture on Load Reversal and Low Cycle Fatigue Performance of Commercially Pure Titanium. Mater. Sci. Eng. A 2017, 691, 100–109. [Google Scholar] [CrossRef]
- Li, G.; Ke, L.; Ren, X.; Sun, C. High Cycle and Very High Cycle Fatigue of TC17 Titanium Alloy: Stress Ratio Effect and Fatigue Strength Modeling. Int. J. Fatigue 2023, 166, 107299. [Google Scholar] [CrossRef]
- Wu, H.; Sun, C.; Xu, W.; Chen, X.; Wu, X. A Novel Evaluation Method for High Cycle and Very High Cycle Fatigue Strength. Eng. Fract. Mech. 2023, 290, 109482. [Google Scholar] [CrossRef]
- Kazymyrovych, V. Very High Cycle Fatigue of Engineering Materials: A Literature Review; Karlstad University: Karlstad, Sweden, 2009. [Google Scholar]
- Hong, Y.; Lei, Z.; Sun, C.; Zhao, A. Propensities of Crack Interior Initiation and Early Growth for Very-High-Cycle Fatigue of High Strength Steels. Int. J. Fatigue 2014, 58, 144–151. [Google Scholar] [CrossRef]
- Sharma, A.; Oh, M.C.; Ahn, B. Recent Advances in Very High Cycle Fatigue Behavior of Metals and Alloys—A Review. Metals 2020, 10, 1200. [Google Scholar] [CrossRef]
- Cui, W.; Chen, X.; Cheng, L.; Ding, J.; Wang, C.; Wang, B. Fatigue Property and Failure Mechanism of TC4 Titanium Alloy in the HCF and VHCF Region Considering Different Forging Processes. Mater. Res. Express 2021, 8, 046524. [Google Scholar] [CrossRef]
- Meier, M.L.; Lesuer, D.R.; Mukherjee, A.K. α Grain Size and β Volume Fraction Aspects of the Superplasticity of Ti-6Al-4V. Mater. Sci. Eng. A 1991, 136, 71–78. [Google Scholar] [CrossRef]
- Sajadifar, S.V.; Wegener, T.; Yapici, G.G.; Niendorf, T. Effect of Grain Size on the Very High Cycle Fatigue Behavior and Notch Sensitivity of Titanium. Theor. Appl. Fract. Mech. 2019, 104, 102362. [Google Scholar] [CrossRef]
- Everaerts, J.; Verlinden, B.; Wevers, M. The Influence of the Alpha Grain Size on Internal Fatigue Crack Initiation in Drawn Ti-6Al-4V Wires. Procedia Struct. Integr. 2016, 2, 1055–1062. [Google Scholar] [CrossRef]
- Ueki, S.; Mine, Y.; Chiu, Y.-L.; Bowen, P.; Takashima, K. Effects of Crystallographic Orientation and Lamellar Configuration on Fatigue Crack Propagation in Single-Colony Structures of Ti-6Al-4V Alloy: Alternating Shear Crack Growth vs. Damage Accumulation Crack Propagation. Mater. Sci. Eng. A 2024, 890, 145885. [Google Scholar] [CrossRef]
- Xu, S.; Zhang, H.; Xiao, N.; Qiu, R.; Cui, Z.; Fu, M. Mechanisms of Macrozone Elimination and Grain Refinement of near α Ti Alloy via the Spheroidization of the Widmannstätten Structure. Acta Mater. 2023, 260, 119339. [Google Scholar] [CrossRef]
- Lavogiez, C.; Hémery, S.; Villechaise, P. On the Mechanism of Fatigue and Dwell-Fatigue Crack Initiation in Ti-6Al-4V. Scr. Mater. 2020, 183, 117–121. [Google Scholar] [CrossRef]
- Bantounas, I.; Dye, D.; Lindley, T.C. The Role of Microtexture on the Faceted Fracture Morphology in Ti-6Al-4V Subjected to High-Cycle Fatigue. Acta Mater. 2010, 58, 3908–3918. [Google Scholar] [CrossRef]
- Bantounas, I.; Dye, D.; Lindley, T.C. The Effect of Grain Orientation on Fracture Morphology during High-Cycle Fatigue of Ti–6Al–4V. Acta Mater. 2009, 57, 3584–3595. [Google Scholar] [CrossRef]
- Bridier, F.; Villechaise, P.; Mendez, J. Slip and Fatigue Crack Formation Processes in an α/β Titanium Alloy in Relation to Crystallographic Texture on Different Scales. Acta Mater. 2008, 56, 3951–3962. [Google Scholar] [CrossRef]
- Briffod, F.; Bleuset, A.; Shiraiwa, T.; Enoki, M. Effect of Crystallographic Orientation and Geometrical Compatibility on Fatigue Crack Initiation and Propagation in Rolled Ti-6Al-4V Alloy. Acta Mater. 2019, 177, 56–67. [Google Scholar] [CrossRef]
- Pan, X.; Su, H.; Sun, C.; Hong, Y. The Behavior of Crack Initiation and Early Growth in High-Cycle and Very-High-Cycle Fatigue Regimes for a Titanium Alloy. Int. J. Fatigue 2018, 115, 67–78. [Google Scholar] [CrossRef]
- Morrissey, R.J.; Nicholas, T. Fatigue Strength of Ti-6Al-4V at Very Long Lives. Int. J. Fatigue 2005, 27, 1608–1612. [Google Scholar] [CrossRef]
- Heinz, S.; Eifler, D. Crack Initiation Mechanisms of Ti6Al4V in the Very High Cycle Fatigue Regime. Int. J. Fatigue 2016, 93, 301–308. [Google Scholar] [CrossRef]
- Gao, T.; Xue, H.; Sun, Z.; Retraint, D. Investigation of Crack Initiation Mechanism of a Precipitation Hardened TC11 Titanium Alloy under Very High Cycle Fatigue Loading. Mater. Sci. Eng. A 2020, 776, 138989. [Google Scholar] [CrossRef]
- Smaga, M.; Boemke, A.; Eifler, D.; Beck, T. Very High Cycle Fatigue Behavior of Austenitic Stainless Steels with Different Surface Morphologies. Metals 2022, 12, 1877. [Google Scholar] [CrossRef]
- Dunne, F.P.E.; Rugg, D.; Walker, A. Lengthscale-Dependent, Elastically Anisotropic, Physically-Based Hcp Crystal Plasticity: Application to Cold-Dwell Fatigue in Ti Alloys. Int. J. Plast. 2007, 23, 1061–1083. [Google Scholar] [CrossRef]
- Lavogiez, C.; Hémery, S.; Villechaise, P. Analysis of Deformation Mechanisms Operating under Fatigue and Dwell-Fatigue Loadings in an α/β Titanium Alloy. Int. J. Fatigue 2020, 131, 105341. [Google Scholar] [CrossRef]
- Zhao, Z.B.; Zhang, B.H.; Sun, H.; Wang, Q.J.; Liu, J.R.; Yang, R. Influence of Globularization Process on Local Texture Evolution of a Near-α Titanium Alloy with a Transformed Microstructure. Metall. Mater. Trans. A 2023, 54, 2849–2857. [Google Scholar] [CrossRef]
- Zhao, Z.B.; Zhang, B.H.; Wang, Q.J.; Sun, H.; Yang, J.X.; Liu, Y.J.; Liu, J.R.; Yang, R. Microtexture Evolution of Titanium Alloy During Hot Deformation: For Better Understanding the Role of Primary α Grains. Metall. Mater. Trans. A 2023, 54, 2890–2902. [Google Scholar] [CrossRef]
- Li, C.; Li, W.; Cai, L.; Zhang, Y.; Sun, R.; Li, X.; Imran Lashari, M.; Hamid, U.; Ding, X.; Wang, P. Microstructure Based Cracking Behavior and Life Assessment of Titanium Alloy under Very-High-Cycle Fatigue with Elevated Temperatures. Int. J. Fatigue 2022, 161, 106914. [Google Scholar] [CrossRef]
- Venkatramani, G.; Ghosh, S.; Mills, M. A Size-Dependent Crystal Plasticity Finite-Element Model for Creep and Load Shedding in Polycrystalline Titanium Alloys. Acta Mater. 2007, 55, 3971–3986. [Google Scholar] [CrossRef]
- Whittaker, M.T.; Evans, W.J.; Lancaster, R.; Harrison, W.; Webster, P.S. The Effect of Microstructure and Texture on Mechanical Properties of Ti6-4. Int. J. Fatigue 2009, 31, 2022–2030. [Google Scholar] [CrossRef]
- Echlin, M.P.; Stinville, J.C.; Miller, V.M.; Lenthe, W.C.; Pollock, T.M. Incipient Slip and Long Range Plastic Strain Localization in Microtextured Ti-6Al-4V Titanium. Acta Mater. 2016, 114, 164–175. [Google Scholar] [CrossRef]
- Gao, T.; Xue, H.; Sun, Z. Effect of Transformed β Phase on Fish-Eye Ductile Crack Initiation of a Ti-6Al-4V Alloy in Very High Cycle Fatigue Regime. Mater. Lett. 2021, 287, 129283. [Google Scholar] [CrossRef]
Figure 1.
(a): Physical image and (b): specimen drawing of fatigue test sample.

Figure 2.
Microstructure of the Ti-6Al-4V alloy. (a) H0 heat treatment, (b) H1 heat treatment, (c) H2 heat treatment.
Figure 2.
Microstructure of the Ti-6Al-4V alloy. (a) H0 heat treatment, (b) H1 heat treatment, (c) H2 heat treatment.

Figure 3.
S-N curves for studied Ti-6Al-4V alloy.

Figure 4.
Fracture morphology of, (a,d,g): initiation (H0), (b,e,h): subsurface initiation (H2), (c,f,i): internal surface initiation (H1).
Figure 4.
Fracture morphology of, (a,d,g): initiation (H0), (b,e,h): subsurface initiation (H2), (c,f,i): internal surface initiation (H1).

Figure 5.
Cross-sectional EBSD images of three samples. (a): H0 treatment, (b): H1 treatment, (c): H2 treatment.
Figure 5.
Cross-sectional EBSD images of three samples. (a): H0 treatment, (b): H1 treatment, (c): H2 treatment.

Figure 6.
Grain size frequency distribution diagram. (a): H0 treatment, (b): H1 treatment, (c): H2 treatment.
Figure 6.
Grain size frequency distribution diagram. (a): H0 treatment, (b): H1 treatment, (c): H2 treatment.

Figure 7.
Cross-sectional polar plots of three samples. (a) H0 treatment, (b) H1 treatment, (c) H2 treatment.
Figure 7.
Cross-sectional polar plots of three samples. (a) H0 treatment, (b) H1 treatment, (c) H2 treatment.

Figure 8.
Mean uniform density of the angle between loading direction and c-axis.

Figure 9.
H2-treated longitudinal section of specimen fracture. (a) SEM image; (b) EBSD image.

Figure 10.
Longitudinal section images of H2-treated interrupted specimens. (a) SEM images, (b) EBSD images.
Figure 10.
Longitudinal section images of H2-treated interrupted specimens. (a) SEM images, (b) EBSD images.

Figure 11.
TEM image of fatigue-disrupted longitudinal section of the H0-treated sample. (a) Dislocation slip, (b) dislocation tangle in larger grain, (c) microcrack at α/β boundary, (d) microcrack in α grain.
Figure 11.
TEM image of fatigue-disrupted longitudinal section of the H0-treated sample. (a) Dislocation slip, (b) dislocation tangle in larger grain, (c) microcrack at α/β boundary, (d) microcrack in α grain.

Figure 12.
TEM image of fatigue-disrupted longitudinal section of the H1-treated sample. (a) Dislocations in primaryα grain, (b) dislocations in secondary α lamellae.
Figure 12.
TEM image of fatigue-disrupted longitudinal section of the H1-treated sample. (a) Dislocations in primaryα grain, (b) dislocations in secondary α lamellae.

Figure 13.
Schematic diagram of microcrack generation in equiaxed structure. (I) dislocation generation; (II) dislocation slipping; (III) dislocation entanglement; (IV) microcrack occurrence.
Figure 13.
Schematic diagram of microcrack generation in equiaxed structure. (I) dislocation generation; (II) dislocation slipping; (III) dislocation entanglement; (IV) microcrack occurrence.

Figure 14.
Schematic diagram of microcrack generation due to rogue grain combinations. (I) dislocation generation; (II) dislocation slipping; (III) dislocation accumulation; (IV) microcrack occurrence.
Figure 14.
Schematic diagram of microcrack generation due to rogue grain combinations. (I) dislocation generation; (II) dislocation slipping; (III) dislocation accumulation; (IV) microcrack occurrence.

Disclaimer/Publisher’s Note: The statements, opinions and data contained in all publications are solely those of the individual author(s) and contributor(s) and not of MDPI and/or the editor(s). MDPI and/or the editor(s) disclaim responsibility for any injury to people or property resulting from any ideas, methods, instructions or products referred to in the content. |
© 2024 by the authors. Licensee MDPI, Basel, Switzerland. This article is an open access article distributed under the terms and conditions of the Creative Commons Attribution (CC BY) license (https://creativecommons.org/licenses/by/4.0/).
Share and Cite
MDPI and ACS Style
Yuan, M.; Zhao, X.; Yue, Q.; Gu, Y.; Zhang, Z. The Effect of Microstructure on the Very High Cycle Fatigue Behavior of Ti-6Al-4V Alloy. Metals 2024, 14, 254. https://doi.org/10.3390/met14030254
AMA Style
Yuan M, Zhao X, Yue Q, Gu Y, Zhang Z. The Effect of Microstructure on the Very High Cycle Fatigue Behavior of Ti-6Al-4V Alloy. Metals. 2024; 14(3):254. https://doi.org/10.3390/met14030254
Chicago/Turabian StyleYuan, Mingyang, Xinbao Zhao, Quanzhao Yue, Yuefeng Gu, and Ze Zhang. 2024. "The Effect of Microstructure on the Very High Cycle Fatigue Behavior of Ti-6Al-4V Alloy" Metals 14, no. 3: 254. https://doi.org/10.3390/met14030254
Note that from the first issue of 2016, this journal uses article numbers instead of page numbers. See further details here.