Article

Effects of Contaminations on Electric Arc Behavior and Occurrence of Defects in Wire Arc Additive Manufacturing of 316L-Si Stainless Steel

by
Joyce Ingrid Venceslau de Souto
1,
Jefferson Segundo de Lima
1,2,
Walman Benício de Castro
1,
Renato Alexandre Costa de Santana
1,
Antonio Almeida Silva
1,
Tiago Felipe de Abreu Santos
2 and
João Manuel R. S. Tavares
3,*
1
Department of Mechanical Engineering, Universidade Federal de Campina Grande, Campina Grande 58429-900, Brazil
2
Department of Mechanical Engineering, Universidade Federal de Pernambuco, Recife 50740-550, Brazil
3
Instituto de Ciência e Inovação em Engenharia Mecânica e Engenharia Industrial, Departamento de Engenharia Mecânica, Faculdade de Engenharia, Universidade do Porto, 4150-242 Porto, Portugal
*
Author to whom correspondence should be addressed.
Metals 2024, 14(3), 286; https://doi.org/10.3390/met14030286
Submission received: 24 January 2024 / Revised: 21 February 2024 / Accepted: 24 February 2024 / Published: 29 February 2024
(This article belongs to the Special Issue Laser Processing and Additive Manufacturing of Metallic Materials)

Abstract

:
Additive Manufacturing is a manufacturing process that consists of obtaining a three-dimensional object from the deposition of material layer by layer, unlike conventional subtractive manufacturing methods. Wire Arc Additive Manufacturing stands out for its high productivity among the Additive Manufacturing technologies for manufacturing metal parts. On the other hand, the excessive heat input promotes increased residual stress levels and the occurrence of defects, such as pores, voids, a lack of fusion, and delamination. These defects result in abnormalities during the process, such as disturbances in electrical responses. Therefore, process monitoring and the detection of defects and failures in manufactured items are of fundamental importance to ensure product quality and certify the high productivity characteristic of this process. Thus, this work aimed to characterize the effects of different contaminations on the electric arc behavior of the Wire Arc Additive Manufacturing process and the occurrence of microscopic defects in thin walls manufactured by this process. To investigate the presence of defects in the metal preforms, experimental conditions were used to promote the appearance of defects, such as the insertion of contaminants. To accomplish the electric arc behavior analysis, voltage and current temporal data were represented through histograms and cyclograms, and the arc stability was assessed based on the Vilarinho index for a short circuit. Effectively, the introduction of contaminants caused electric arc disturbances that led to the appearance of manufacturing defects, such as inclusions and porosities, observed through metallographic characterization. The results confirm that the introduction of contaminations could be identified early in the Wire Arc Additive Manufacturing process through electric arc data analysis.

1. Introduction

Additive Manufacturing (AM) refers to a layered deposition process where metallic parts are produced incrementally [1,2]. This technique facilitates the creation of intricate and bespoke components without necessitating tools like punches, dies, or foundry molds, thereby often streamlining post-processing requirements [3]. Wire Arc Additive Manufacturing (WAAM) presents numerous advantages over alternative metal AM methodologies, offering versatility in consumables, including titanium, aluminum, and nickel-based alloys, catering specifically to the automotive and aerospace sectors [4,5]. Beyond its capacity for geometric intricacy and diverse material selection, WAAM’s heightened productivity renders it particularly appealing for commercial utilization [6,7].
Nonetheless, defects associated with the deposition process, including voids, spattering, and arc instability, have constrained the widespread commercial adoption of WAAM to date, especially in critical applications within the marine and aerospace sectors. During the deposition process of products manufactured by WAAM, the weld quality can be compromised due to complex heat and mass transfers, leading to considerable fluctuations on the surface and, consequently, inferior quality. Even after mechanical finishing, microscopic defects may be present on the surface and subsurface of the products. Neglecting these defects can result in more severe problems, affecting the performance and lifespan of the products and, in extreme situations, causing grave safety accidents [8].
In this context, factors such as material heterogeneity, contamination (wire and substrate) [9,10], process configuration misalignment, inadequate programming strategies, unstable weld pool dynamics stemming from suboptimal parameter configurations, along with thermal deformation attributed to heat accumulation [11], environmental influences, e.g., gas contamination, and additional machine-related faults may contribute to the occurrence of discontinuities [11]. Process parameters potentially inducing defects encompass the interplay between the wire feed rate and torch speed, heat input, Contact Tip to Work Distance (CTWD), and gas flow rate [2]. These causative factors may lead to the occurrence of defects, including porosity, voids, fissures, deformations, a lack of fusion, oxidation, and delamination [12,13,14], which demand avoidance, particularly in components subjected to extreme environments, where such defects may precipitate failure mechanisms, such as elevated-temperature fatigue [15]. Given that in the GMAW-based WAAM process the electric current directly influences the material deposition [16], there exists a heightened susceptibility to issues such as spattering, porosity, and excessive heating, relative to WAAM processes employing GTAW and PAW techniques [17]. Thus, it becomes necessary to develop reliable and sustainable digital systems to monitor these processes and predict the existence of defects [14].
The reliable production of parts according to the required quality standards is paramount for accepting WAAM in modern manufacturing [18]. Traditionally, quality assurance for the WAAM process involves Non-Destructive Evaluation (NDE) conducted after the complete fabrication of the parts [19], which is utilized to identify defects through numerous sensor-based or other methodologies. NDE technologies can inspect the quality of the tested specimens without causing damage or alterations to their performance or internal structure [8]. Due to the large dimensions and complex shapes of real WAAM-produced parts, conducting post-processing NDE testing to detect flaws based on scanning becomes challenging and often impractical.
Recent investigations have established associations between the data obtained from the manufacturing process and the quality of the fabricated layers, employing methodologies for monitoring control parameters [20]. Additionally, the implementation of intelligent sensing systems has been central in monitoring various process responses [8,21,22,23,24,25,26,27,28,29]. Moreover, efforts have been made to assess the stability of the electric arc by analyzing metallic transfer modes during the Wire Arc Additive Manufacturing (WAAM) process [22,23]. Li et al. [25] introduced a novel defect detection system for WAAM, leveraging incremental learning techniques. This method entails the collection of electrical signal data and subsequent application of a defect detection algorithm. Furthermore, Zhang et al. [30] proposed a technique for monitoring the quality of weld beads in WAAM utilizing electrical signals, employing a Swin transformer model to construct a classification model capable of accurately distinguishing between regular weld beads and those exhibiting surface oxidation defects. Shin et al. [12] detailed a machine learning framework for identifying and categorizing welder porosity defects using welding voltage signals and X-ray imagery. The proposed approach involved training neural network models on X-ray images with and without porosity defects to facilitate detecting and classifying such defects.
Authors have studied the stability of the electric arc for arc deposition processes and, in this perspective, have applied numerical indicators to quantify it. In the context of short-circuit deposition processes, the Vilarinho index (IVsc) has been applied to study the mechanism of this transfer mode in GMAW [31,32,33,34], in stability analyses of the cold metal transfer (CMT) in brazing processes [35], and in the optimization of its parameters in the WAAM process [36]. However, the use of the IVsc to verify the stability of the arc as a function of introducing defects in the arc deposition processes has not yet been explored.
Based on the above, this work aimed to characterize the effects of different contaminations on the electric arc behavior of the WAAM process and the occurrence of microscopic defects in thin walls. In particular, the effect of contaminants was evaluated based on the visual aspects of the thin walls relative to a sample manufactured with no contaminant and keeping the process parameters constant. Subsequently, this effect was further evaluated to understand better how the voltage and electric current data are distributed along the deposits and, in general, how the electric arc behaves with the inclusion of contaminants. Then, the influence of contaminants on the WAAM stability was investigated based on the coefficient of variation of the electrical arc data. Finally, the metallographic characterization allowed for the identification of microscopic defects in the contamination zones of the manufactured preforms.

2. Materials and Methods

In this work, an AISI 1015 steel substrate was employed alongside an austenitic stainless steel wire (ABNT 316L-Si), with a diameter of 1.2 mm, serving as the deposition material. The nominal chemical composition of both materials is given in Table 1 for reference.
Preformed walls, each comprising a single cord per layer and consisting of 5 layers, were systematically deposited. Employing a zig-zag deposition strategy along the z-axis, as outlined in prior works by Zhang et al. [37,38] and Rodideal et al. [39], facilitated the attainment of uniform height at both ends of the preform. To ensure consistent heat transfer conditions across all samples, 316L-Si stainless steel preforms were fabricated atop low carbon steel substrates measuring 120 mm× 50 mm × 19.54 mm. The torch speed was set at 300 mm/min, the wire feed speed was maintained at 5 m/min, and a peak current of 250 A and a background current of 50 A were applied. The distance from the contact tip to the workpiece (CTTW) was fixed at 10 mm, and commercial argon (99.98%) served as the shielding gas for the molten pool, delivered at a flow rate of 18 L/min. Interlayer cooling was achieved via natural air-cooling, while the interpass temperature was held constant at 80 °C. The process parameters selected for the production of the stainless steel parts were meticulously determined to ensure the structural integrity of the preformed walls.
The electric arc data, specifically the welding current and voltage, generated from a Gas Metal Arc Welding (GMAW) process employing controlled short-circuit (CCC) transfer, constituted the primary datasets utilized for the detection of the presented defects. These datasets were acquired using the SAP V4 data acquisition system from IMC Soldagem (Brazil) at a sampling rate of 5 kHz for voltage and current signal processing. The system components encompassed the Digiplus A7 multiprocess welding power supply from IMC Soldagem (Palhoça, Brazil), a commercially available argon shielding apparatus, a CNC cartesian structure, the STA-20 wire feeder from IMC Soldagem, and the previously specified electrical signal acquisition system.
The fundamental parameters determining the CCC waveform shape included the peak current (1), peak current time (2), current drop rate (3), current rise rate (4), short-circuit wait current (5), and background current (6), as depicted in Figure 1.
An output parameter utilized for assessing the stability of the electric arc during metal deposition is the Vilarinho index for short-circuit transfer (IVsc). Specifically, IVsc serves as a criterion predicated on the notion that metal transfer correlates with arc burning and the consistency of short-circuit durations [33,34], calculated as:
I V s c = σ t s c t s c + σ t a r c i n g t a r c i n g ,
where σ t s c is the standard deviation of the average short-circuit time, σ t a r c i n g is the standard deviation of the average arc burning time, t s c is the average short-circuit time, and t a r c i n g is the average arc burning time [23,35]. Furthermore, the IVsc regularity index takes into account both average and standard deviation values so that a lower IVsc value indicates a more regular transition, that is, a more stable metal transfer [40,41,42].
In the present work, the IVsc values were calculated from the data obtained using the described acquisition system for an average acquisition time of 20 s, considering the length of the layers and the TS value. The acquired data were processed using a MATLAB (9.12 version) script developed to calculate the IVsc value for each layer deposited. Considering that the numerical format of the electric arc data acquisition files was originally not in accordance with the requirement of the script algorithm, some file manipulation operations were necessary, such as separating the data columns by tabulation, converting the data format to the standard numerical format, and increasing the number of significant decimal places so that the numerical values would not be prematurely rounded.
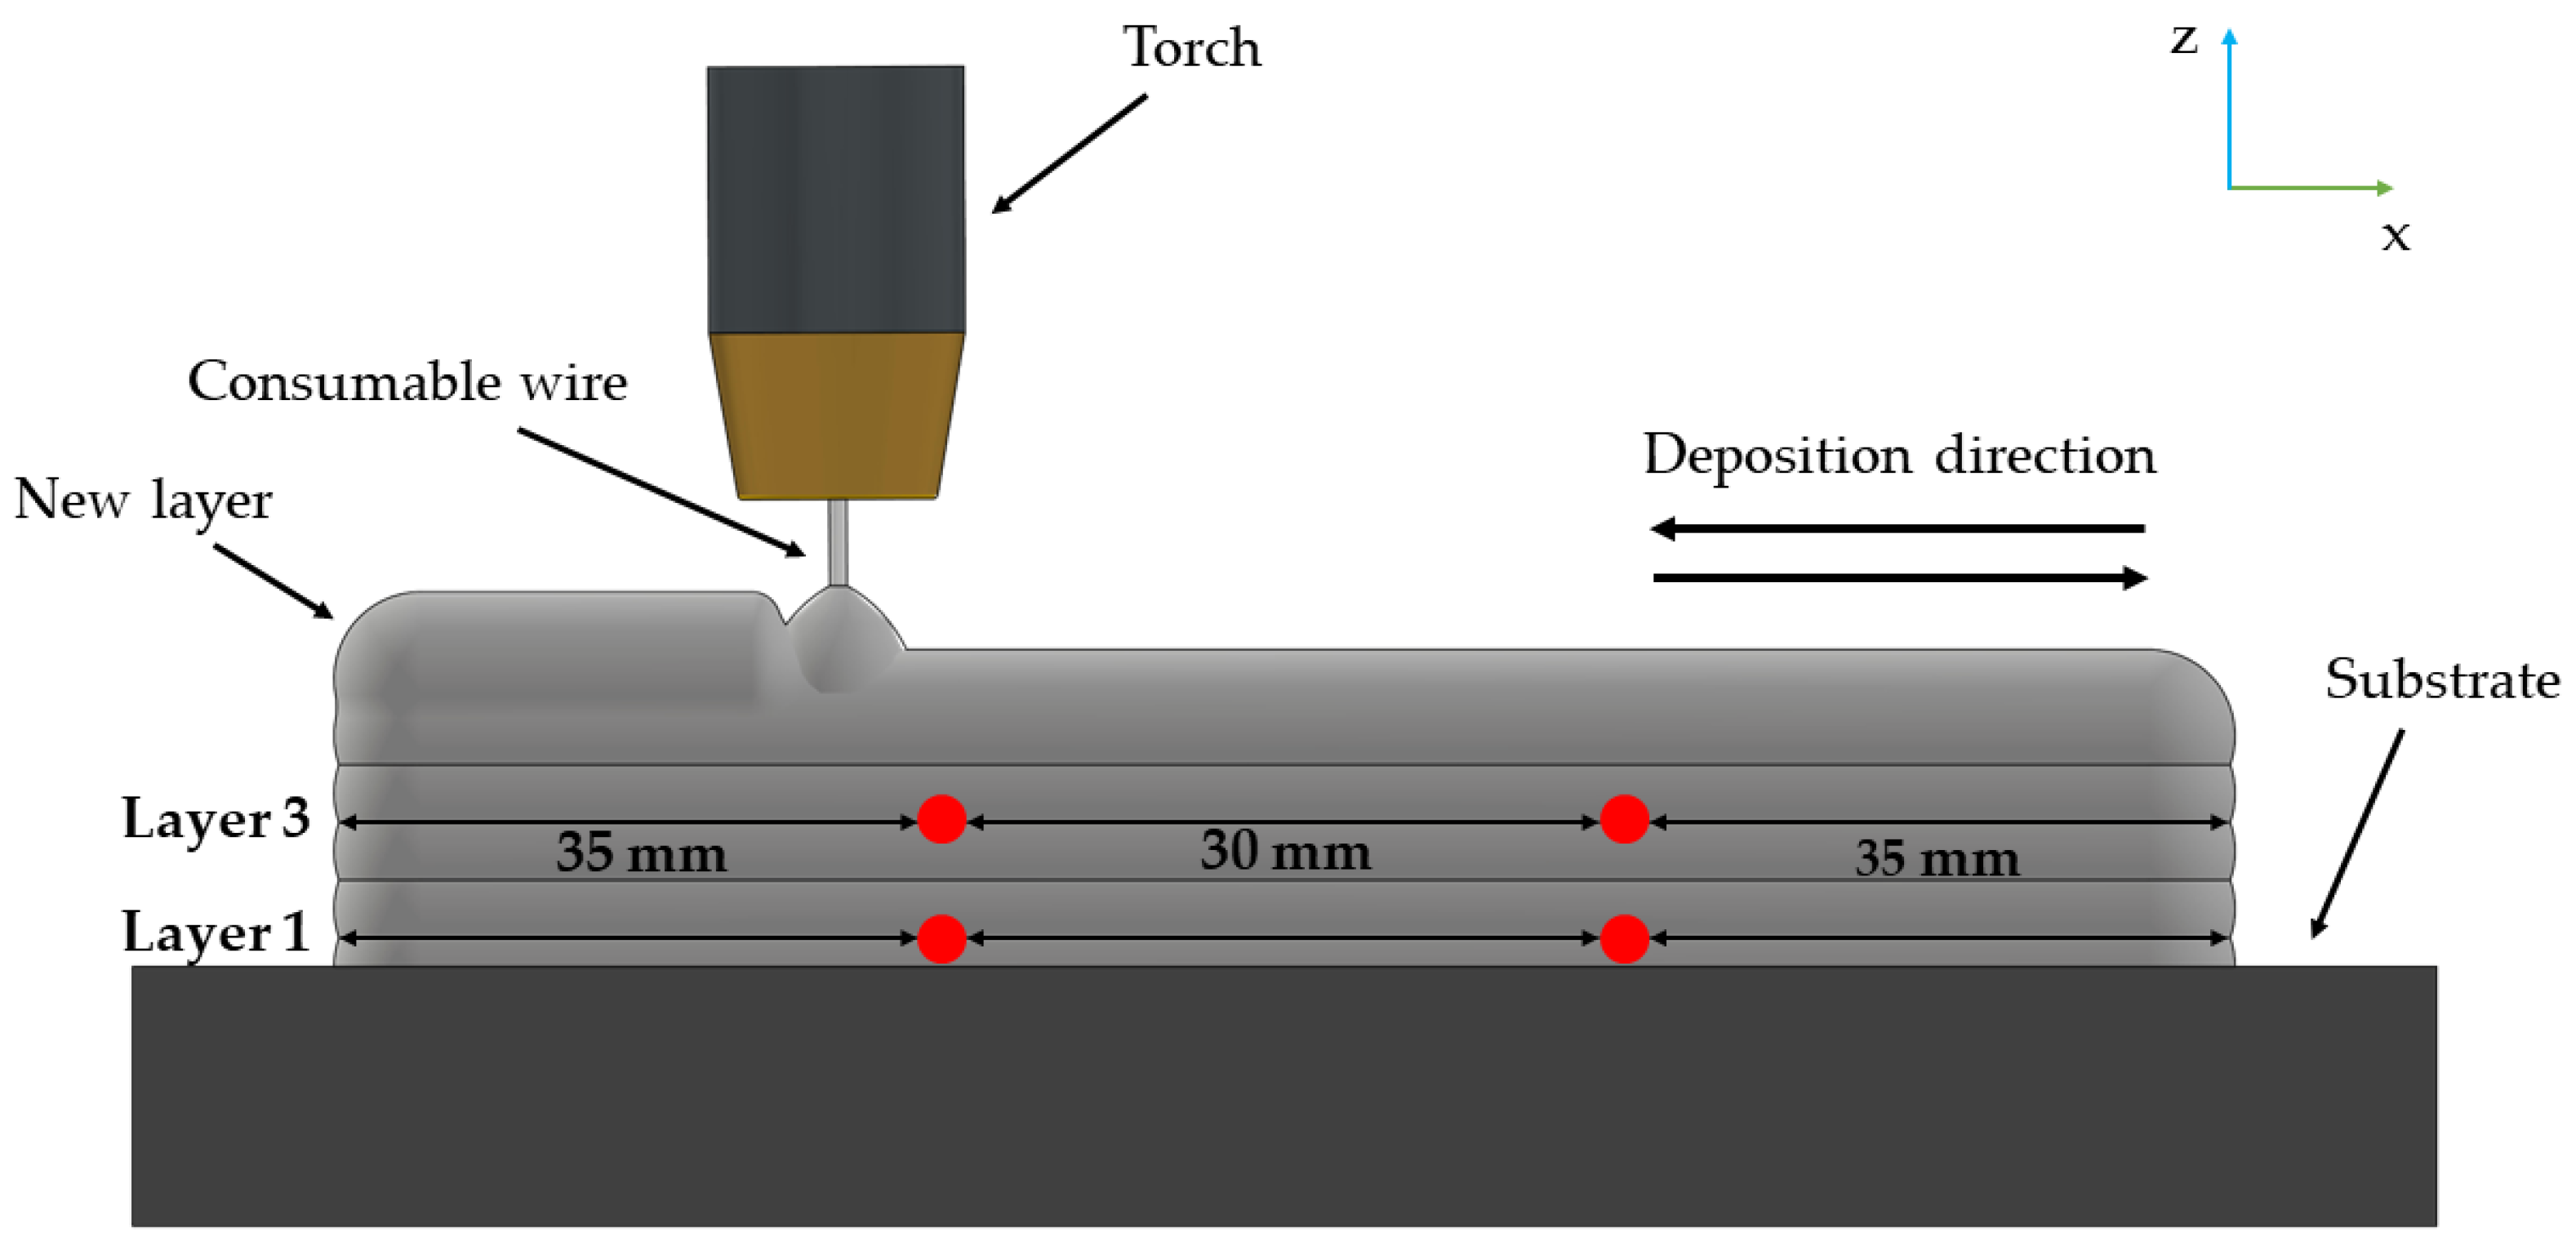
To evaluate the effect of defects on the electrical arc responses, the contaminants were inserted at predefined heights during the preform manufacturing process. Thus, two chamfers of 3 mm × 45°, 30 mm apart from each other, were machined in layers 1 and 3 to evaluate the interruption of the arc, as schematically illustrated in Figure 2.
Afterward, the chamfers were infused with extraneous substances, such as oil, sand, and chalk, to replicate contamination scenarios commonly encountered in the manufacturing process [10,26]. Considering the inherent nature of WAAM when occurring within an exposed environment or during service, oil represents a prevalent contaminant in electric arc melting processes, whereas other particulates, notably dust or sand, may inadvertently accumulate within the weld pool during production. Despite chalk contamination being unanticipated in WAAM operations, it is frequently employed to induce a marked perturbation in the electrical arc [10,26].
The preprocessing of data for analyzing the impact of contaminants on the electric arc behavior entailed data cleansing to eliminate rows containing null values. Furthermore, in tandem with this preprocessing step, all visual elements integral to this analysis were developed and plotted using the PyCharm Community Edition software (version 2023.2.3).
The specimens utilized throughout this manuscript have been meticulously labeled to distinguish each 316L-Si stainless steel WAAM component manufactured, considering the specific contaminant employed to induce arc perturbations. Consequently, the samples were denoted as follows: S1 denoting chalk as the contaminant material, S2 representing oil, S3 indicating no contaminant, and S4 designating sand. Subsequently, all the specimens were transversely sectioned at the contamination region of the preformed walls, subjected to cold embedding, sanded to 2400 granulometry, and polished using an alumina and silica solution. Additionally, electrolytic etching was performed with a 10% oxalic acid solution (1.5 V and 50 s). A metallographic analysis was conducted employing an optical microscope (Olympus, SC30, Tokyo, Japan).

3. Results

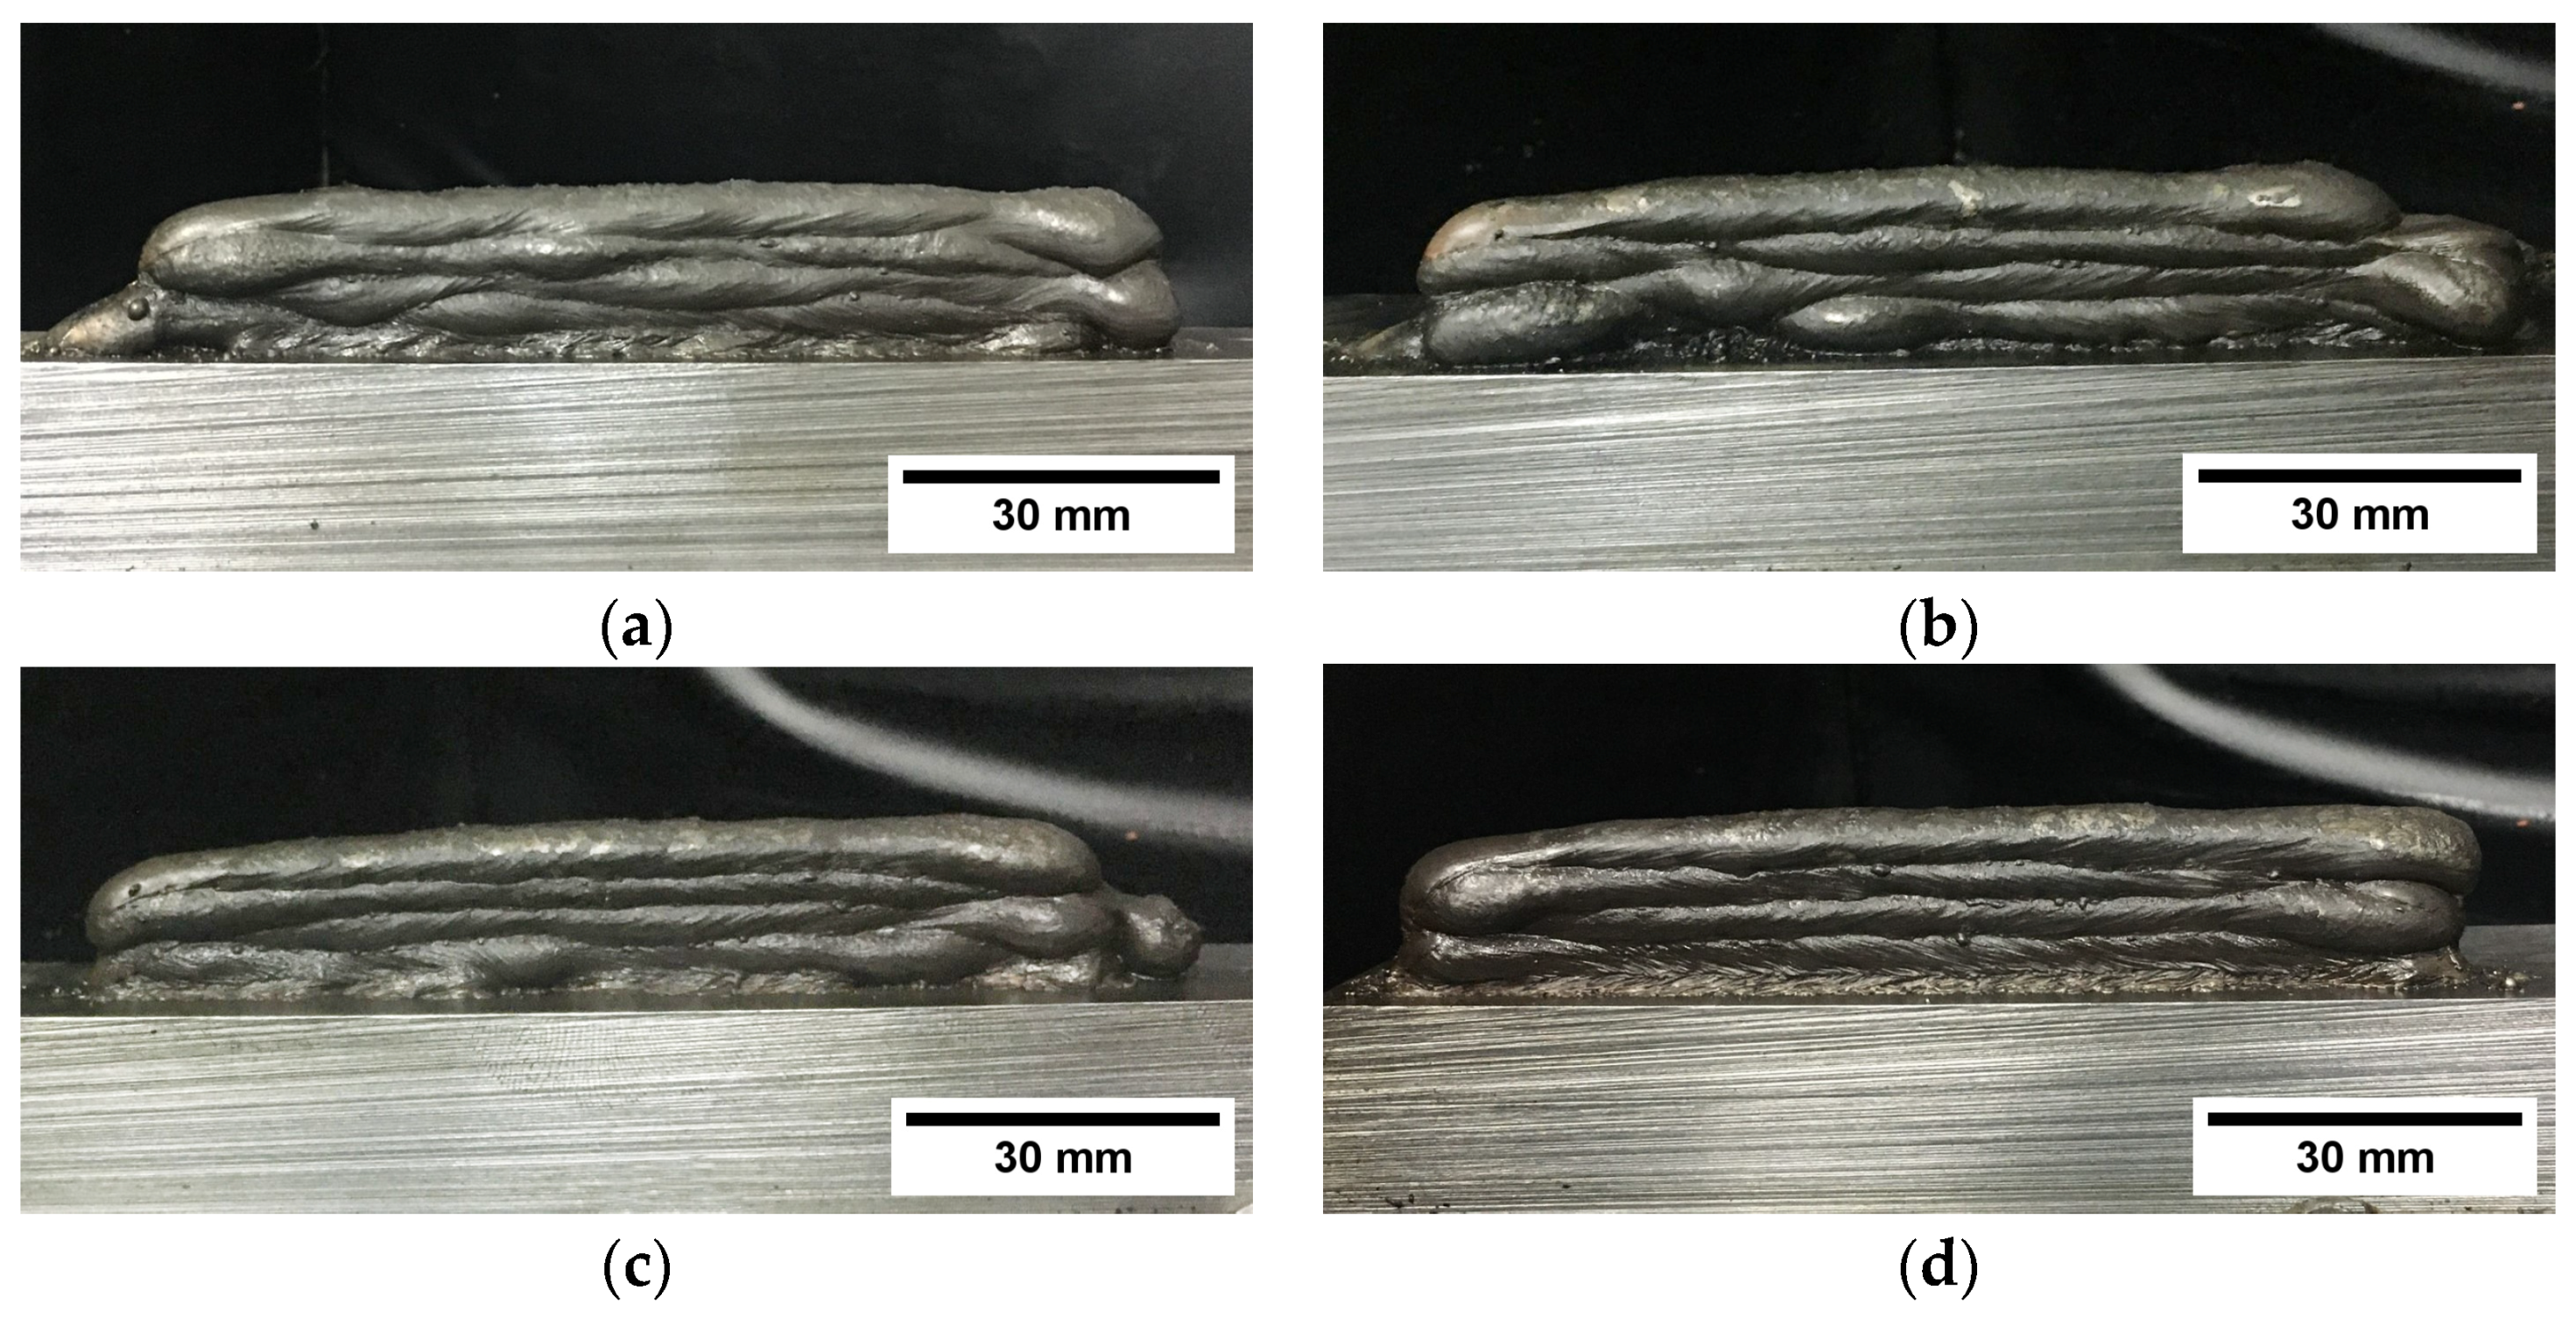
According to the manufacturing parameters of the WAAM process and the contaminants indicated above, the preforms were manufactured. The visual characteristics of the manufactured preforms are depicted in Figure 3.
After a preliminary visual inspection, distinct conditions were verified in the superficial aspects of the WAAM walls of the S3 sample, Figure 3c, relative to the ones of the samples with contaminants, Figure 3a,b,d. It was possible to observe notable differences in the walls’ arc stability and layer deposit precision from the side views presented in Figure 3. Visually, it can be inferred that the sample contaminated with oil (Figure 3b) was the most geometrically inconsistent, with a pattern of lateral deformity like that presented by the sample contaminated with chalk, but to a lesser extent (Figure 3a), as well as the presence of spatter laterally in the direction of deposition of the preform. This (S1) sample presents reductions in the width of the preform at the end of its length, as also observed in [42], while studying the detection of defect formation in Direct Energy Deposition (DED) processes through in situ sensing data. Unlike these, the sample contaminated by sand (Figure 3d) showed excessive spattering at the layer interfaces into which the contaminant was inserted, which significantly compromises the arch’s stability when evaluated layer by layer, as also described in [42,43,44].
The effect of the studied contaminants on the samples was further evaluated and is discussed in the following sections, which cover the steps of determining the arc stability index and its behavior through graphic and statistical methods and metallographic characterization, with the identification of microstructural defects.

3.1. Effects of Contaminants on Electric Arc

During the Gas Metal Arc Welding process, the introduction of contaminants precipitated disruptions or discontinuities in the arc, as evidenced by the temporal signal analysis of the layers and locations in contact with the contaminating agents. This phenomenon led to fluctuations in the electric arc voltage and current.
The stability of the welding arc is often analyzed using power graphs, commonly referred to as cyclograms, which depict the voltage against the electric current intensity [45]. These graphs offer straightforward insights into deposition stability, facilitating a rapid assessment of process outcomes [31]. A smaller area under the curve indicates a more stable metal transfer process [46]. Figure 4 illustrates the cyclograms for layers 2 and 4, immediately following the introduction of the contaminants in the samples.
It is observed that during metallic deposition under the absence of contaminants, the process exhibits a more consistent arc behavior. This phenomenon can be elucidated by the absence of impediments to electrical conductivity, resulting in a more consistent metallic transfer and fewer interruptions in the arc. Across all the samples, instances of arc instability were evident at both the initiation and termination of electrical contact during the metal transfer, attributed to the initial instability of the power source and the provision of shielding gas. Additionally, discernible fluctuations were observed in the region of stable arc behavior in Figure 4c,d, corresponding to contamination by oil, as revealed by the S2 sample in both cyclograms.
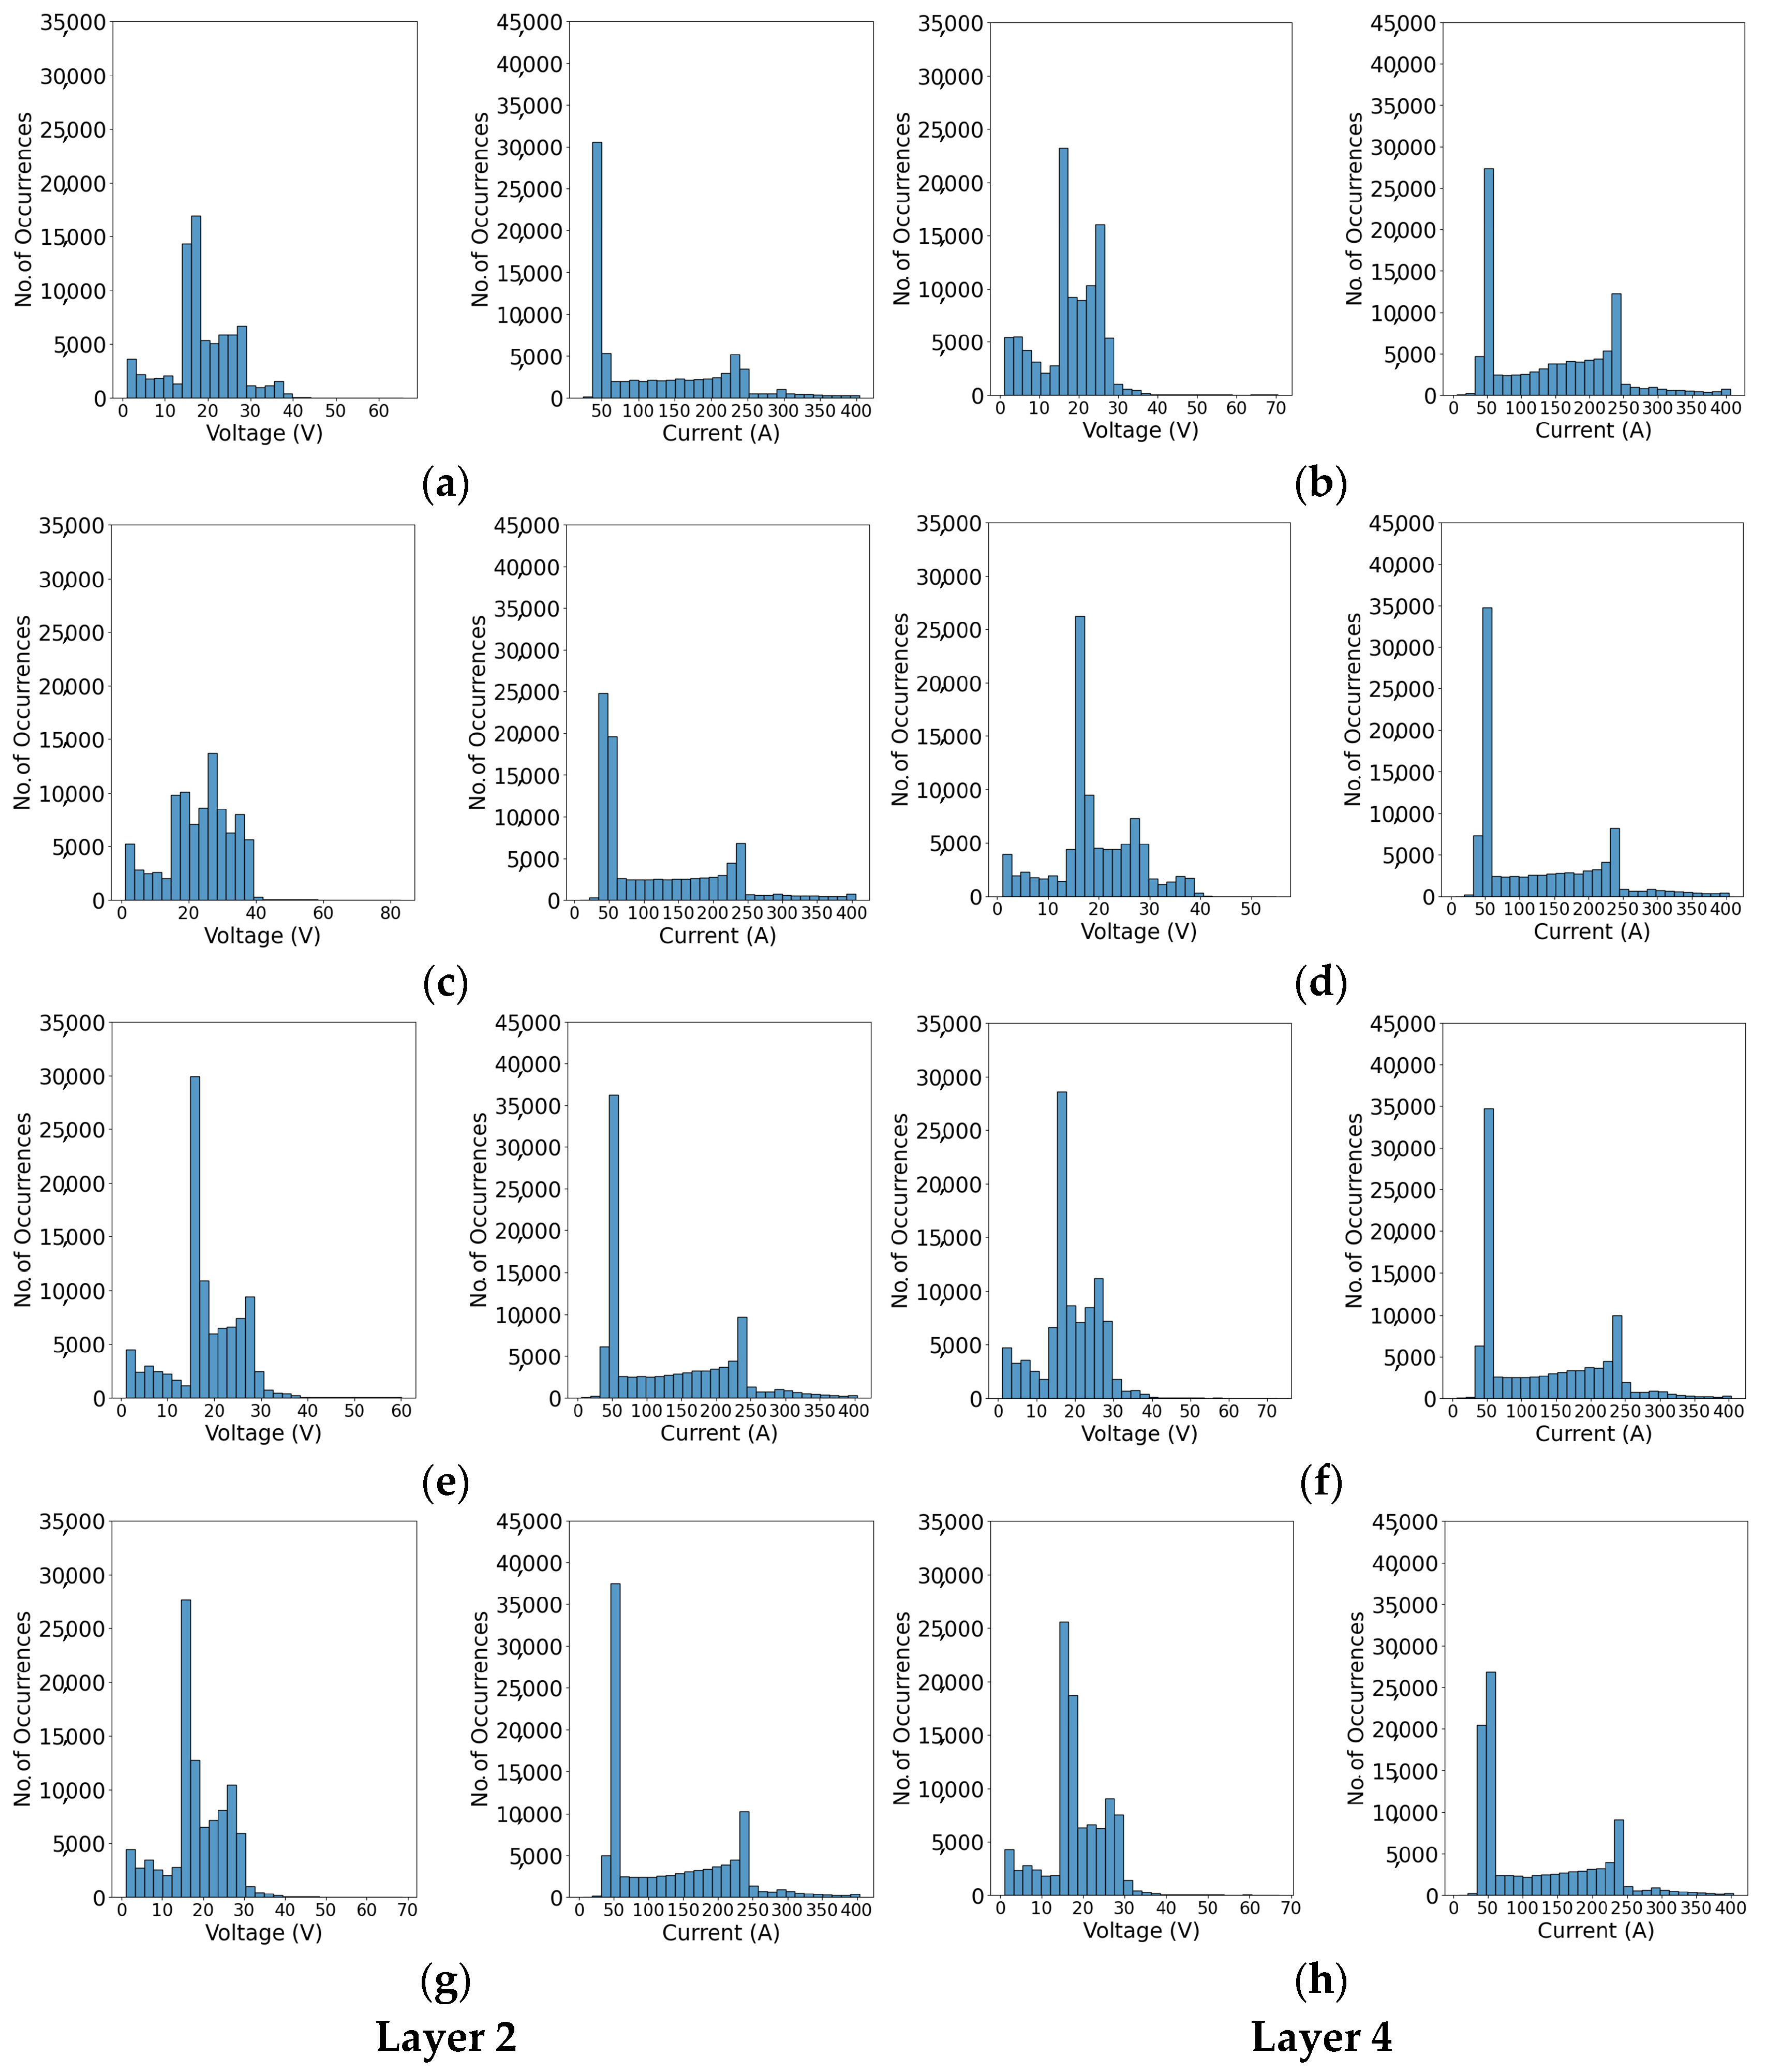
To describe and improve the accuracy of the arc stability analysis, the arc current deviation histograms were built, as they show the deviation of the signals during the entire acquisition period. The width and height of these diagrams are reliable indicators of arc stability [31,47]. An arc deposition process exhibiting a tall, narrow peak demonstrates a more stable arc [30]. Figure 5 illustrates the current and voltage histograms for layers 2 and 4, respectively, in all the studied samples, with respect to the electric current and voltage values and the maximum peak number of occurrences in each case.
Based on the results, few comparative inferences can be established, taking into account the low dispersion of the data when considering the general distribution of the histograms and their respective peak maxima for the number of occurrences. From the histograms of the electrical current in Figure 5, it is possible to perceive the deposition parameters for manufacturing preforms in WAAM. This occurs by observing the peak occurrences around 250 A, which corresponds to the established peak current for the process, and a lower plateau of occurrence numbers associated to 50 A that was established as the reference base current for the transfer mode. Specifically, the highest occurrences for the base and peak current values were obtained for sample S3, since it is understood that the inclusion of contaminants disperses the pre-configured values for these parameters and, consequently, reduces the level of occurrences for these, as similarly discussed in [48], when evaluating different experimental conditions on CMT-WAAM transfer and deposit geometrical characteristics. This observation implies a notable stability of the welding arc, contrasting with sections in other samples where the contaminants were introduced. Conversely, the layer depositions with the lowest peaks in the histograms presented in Figure 5a,b correspond to the presence of chalk contamination, as characterized by the S1 sample. This analysis aligns with previous findings by other researchers, indicating that the WAAM depositions maintain the weld pool free from contaminating particles, thereby promoting a more stable metal transfer process.
According to the combined results for the histograms of the electrical voltage in Figure 5, it is evident that the layers corresponding to the sample manufactured without a contaminant (Figure 5e) showed the highest number of occurrences within the range of values in the acquired data. For the histograms of layer 4, it is observed that sample S1 (Figure 5b) showed lower occurrence values across the entire range of electrical voltage values, as the chalk implies a reduction in the activity of the electric arc, as discussed in [42,43], when studying the effect of different contaminants on the acoustic spectrum of the WAAM process and developing an in situ sensing system to detect defect formation in DED processes. Although no comparable reports were found in the literature, it was also noted that, for the voltage histograms of sample S3, the data were distributed approximately like a staircase up to 10 V. Similarly, in the same perspective regarding the histograms of the electrical voltage, local voltage spikes were observed for null values, due to the waiting times between the initial data acquisition time and the start of arc initiation, as also similarly observed in [47], when evaluating the effect of the experimental conditions on the arc stability and deposit geometry in FCAW.

3.2. Effects of Contaminants on Arc Stability

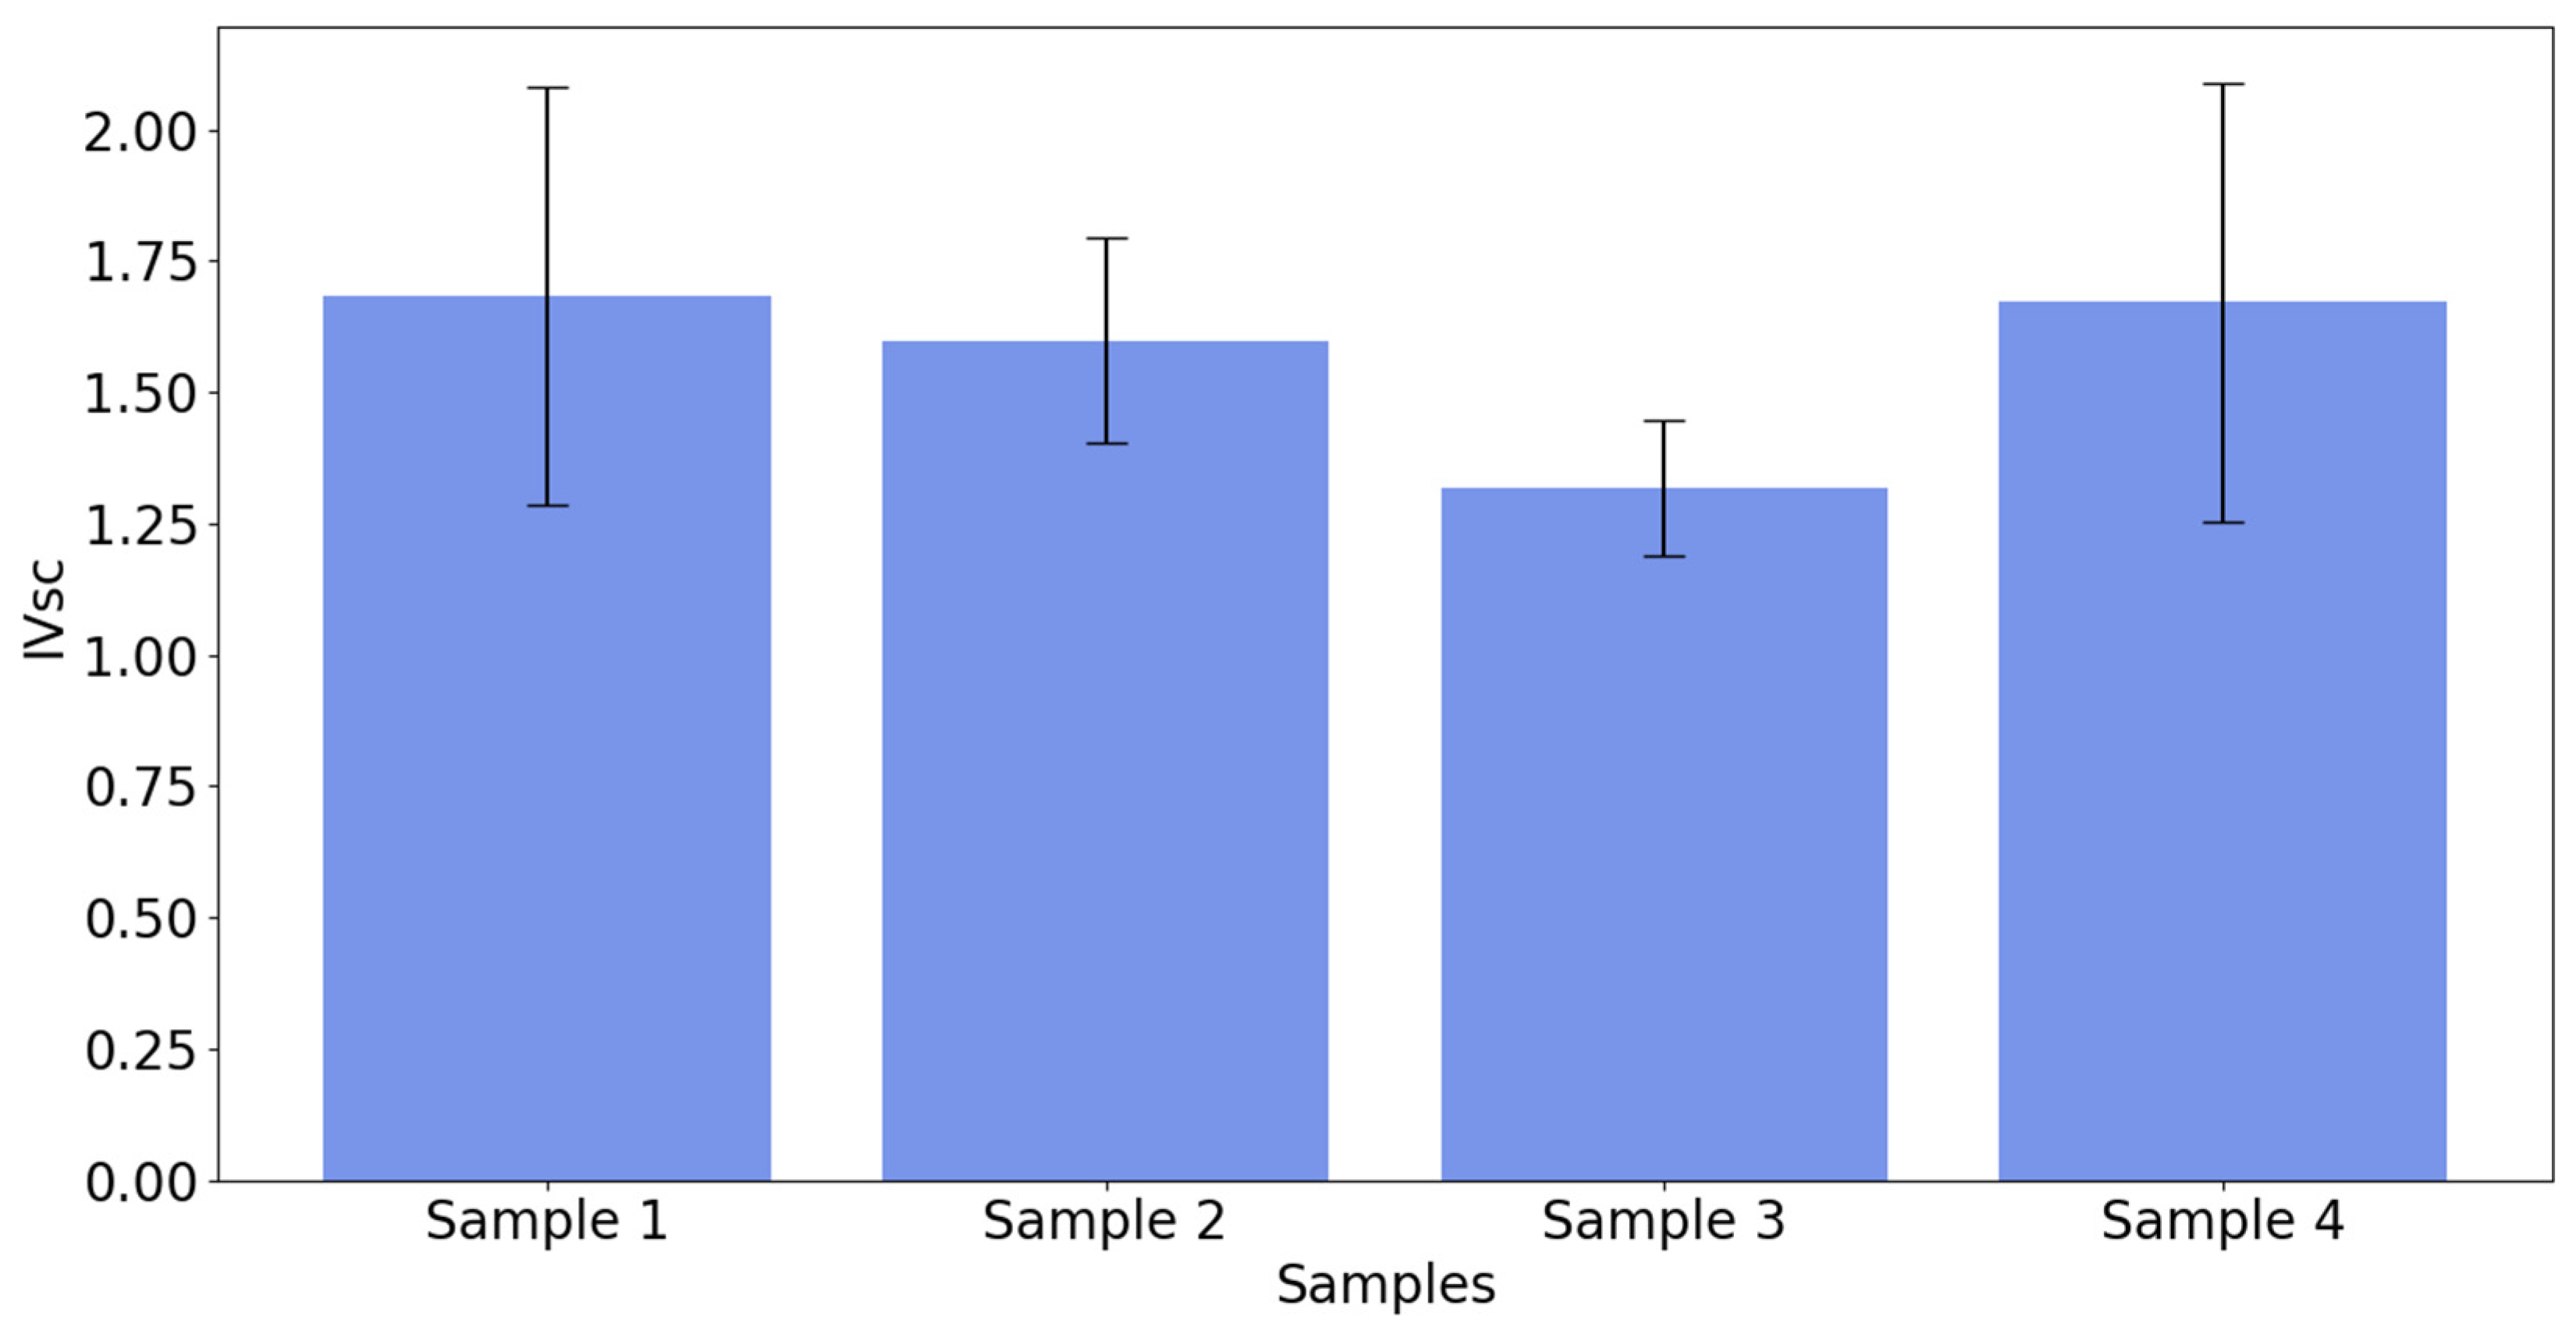
The impact of contaminants, namely, chalk (sample S1), oil (sample S2), and sand (sample S4), on the morphology of WAAM thin walls, as illustrated in Figure 3, is readily apparent. These contaminants significantly altered the surface characteristics of the deposited layers, thereby influencing the process stability and the electric arc signature in terms of the voltage and current. This effect is notably exacerbated when contrasting these contaminated walls with the reference wall (sample S3), produced without any contaminants. These results are depicted in Figure 6.
From Figure 6, it can be inferred that the reference sample (S3) presents the lowest IVsc value (1.31) and, therefore, the best result in terms of arch stability. Consecutively, one has the results obtained by samples contaminated by chalk (sample S1), whose IVsc was equal to 1.59. Therefore, the samples with the worst results in terms of arch stability were the ones contaminated by sand (S4), presenting an overall IVsc of 1.68, and by oil (S2), with an IVsc equal to 1.69. It should also be noted that the standard deviation was lower for the reference sample, as all the layers were deposited under the same experimental conditions. Therefore, the low value may be related to the inherent instability of the GMAW process, considering that there were no preheating steps for the substrate or consumable wire. This could allow for a more stable metal transfer by requiring less energy to melt the metal material [49], or by reducing the temperature gradient and cooling rate [10,14]. Additionally, it was evident that the higher levels of the standard deviation observed for the other samples are justified by the high IVsc values obtained for layers 2 and 4, which were deposited with the introduction of contaminants. Although the contamination and its effects on the electric arc were momentary, this event was sufficient not only to significantly modify the overall panorama, i.e., the mean value, of the arc stability for the contaminated samples, compared to the reference sample, but also to indicate that the IVsc values presented by these layers diverged notably compared to the deposition of layers 1, 3, and 5, which did not have the presence of contaminants.
The numerical outcomes corroborated the preliminary observations made during the visual inspection of the WAAM-based thin walls. As elucidated in the discussion concerning the visual attributes of the preforms, the presence of spattering adhered to the wall’s surface in the case of the S2 and S4 samples was noted to potentially compromise the stability of the arcs in these regions. This conjecture finds further support through the assessment of the IVsc values in this sample across the contaminated layers, specifically layers 2 and 4.

3.3. Metallographic Characterization of Thin Walls

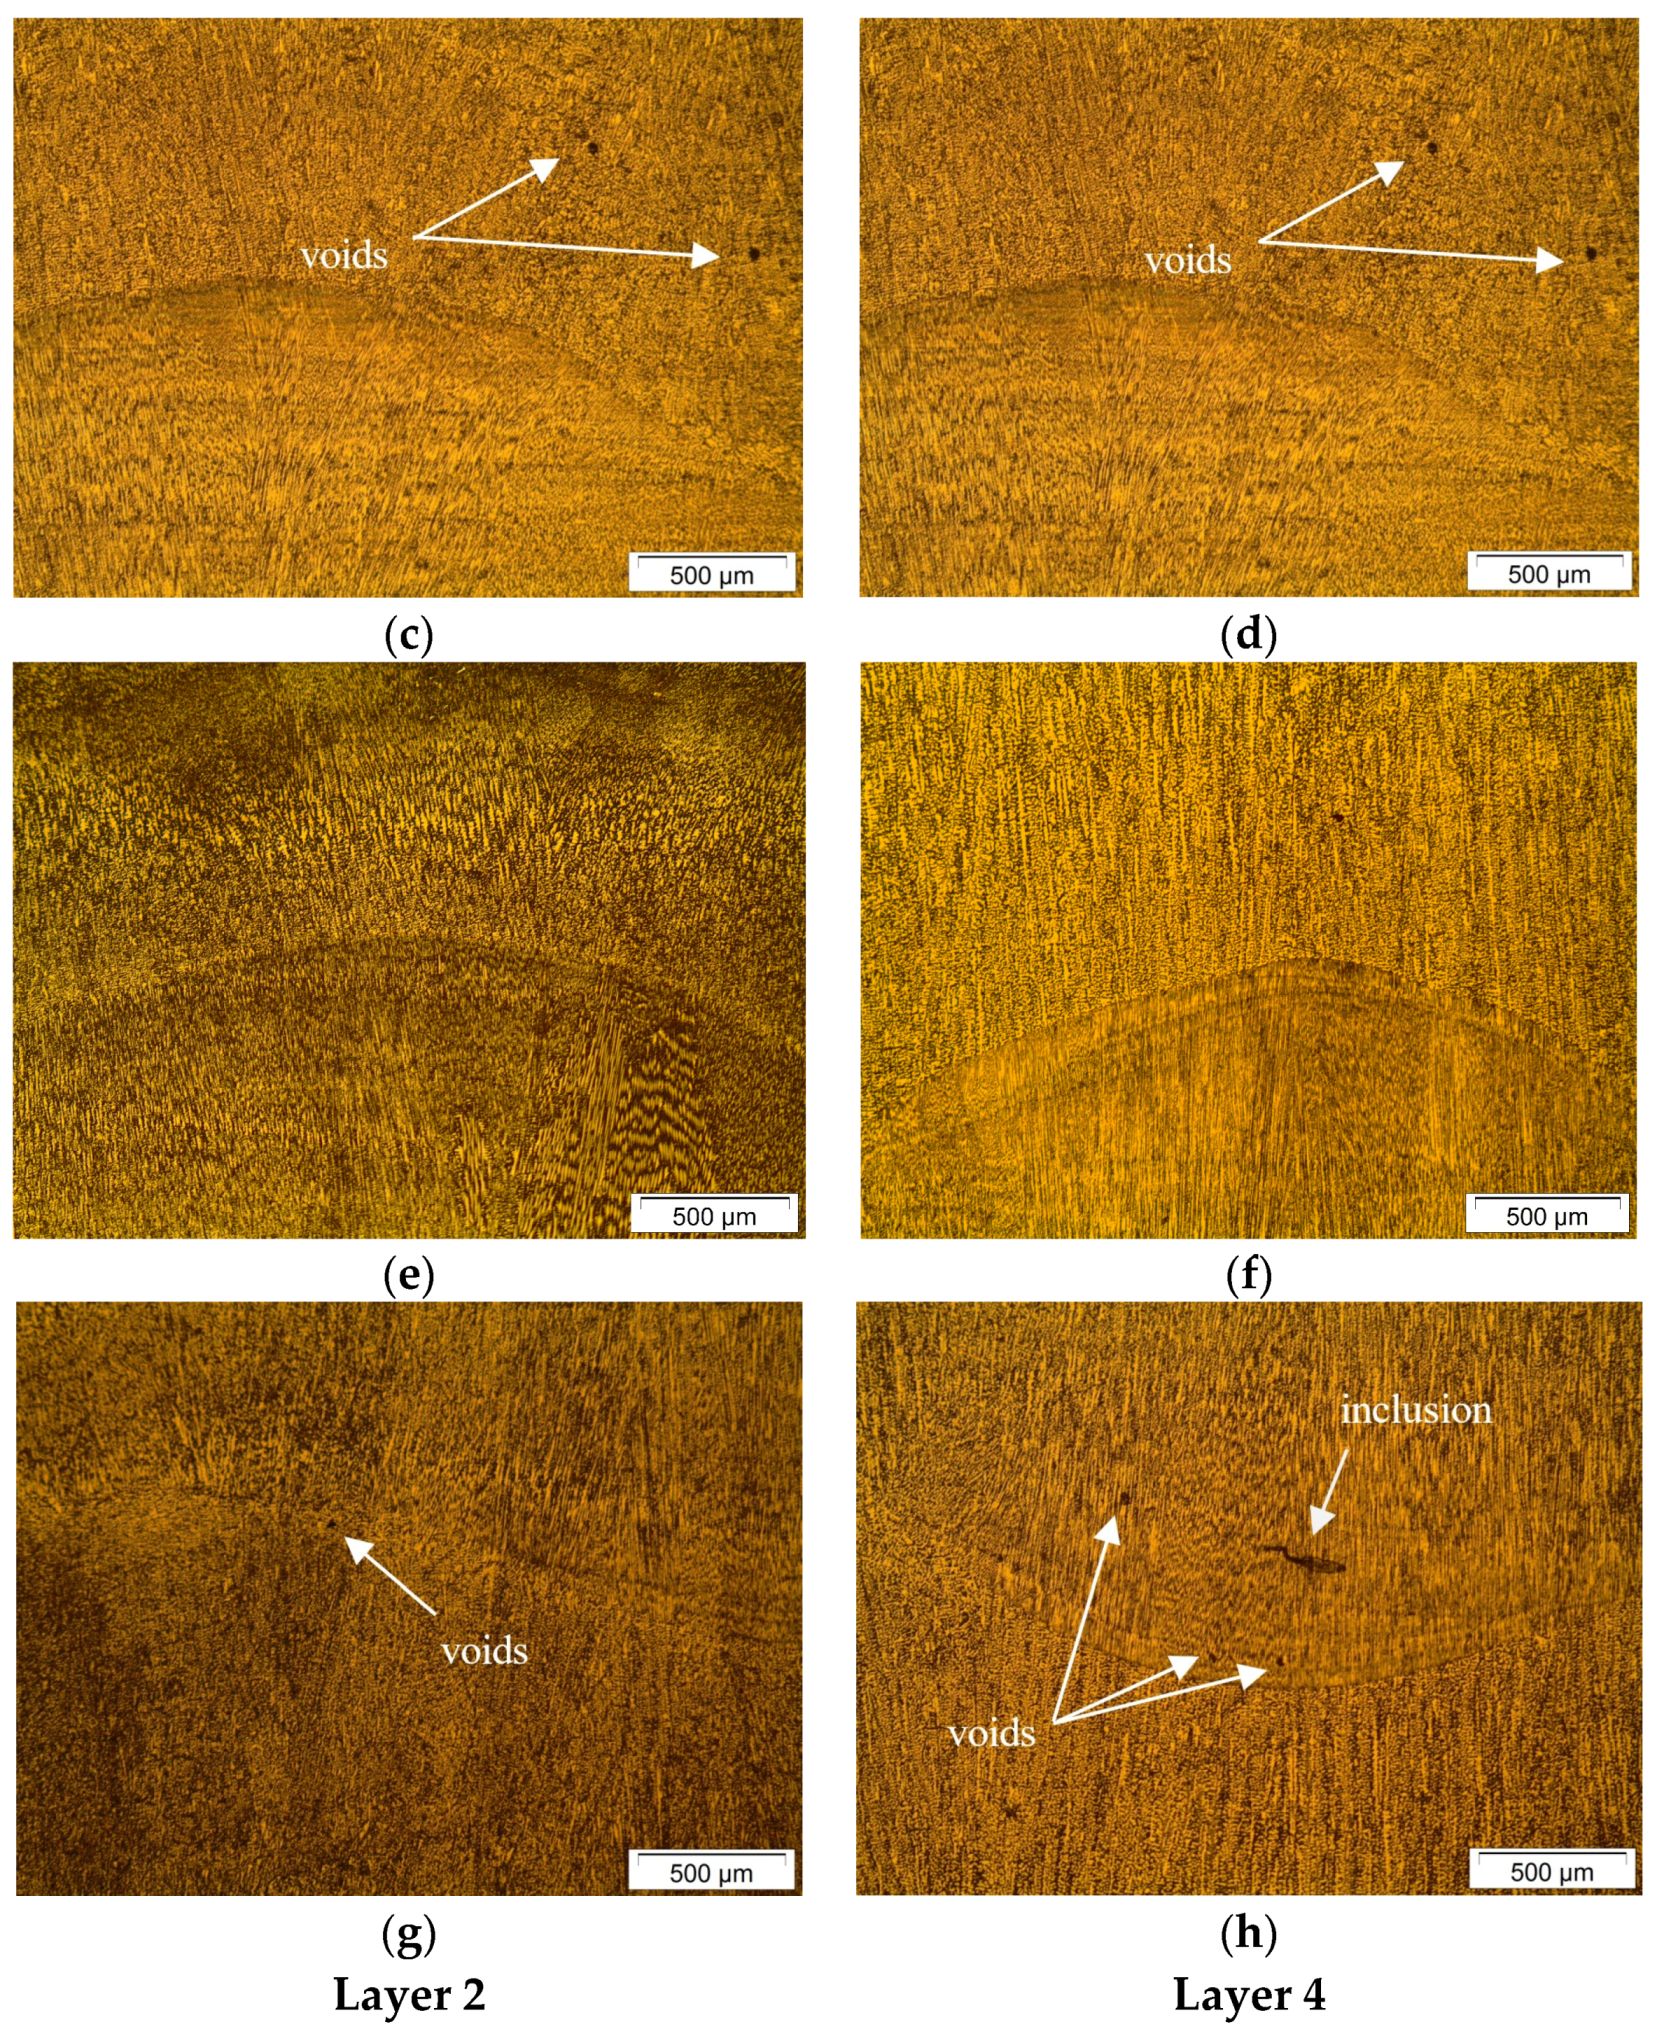
As previously explained, contaminants were deliberately applied to the surface of a deposition layer to instigate the generation of flaws and defects. The findings of the metallographic examination conducted on the specimens extracted from the interpass regions featuring contaminant insertion between layers 1 and 2, and layers 3 and 4, are depicted in Figure 7.
Based on the metallographic findings depicted in Figure 7, it is evident that pores, which are indicated with arrows in the figure, exhibit an irregular morphology within the interpass region of the samples that were manufactured with the introduction of contaminants, as also concluded in [50], when developing a porosity detection strategy in WAAM, and in [51], when justifying the development of an internal defect monitoring system for the CMT-WAAM process. Furthermore, inclusions, as depicted in Figure 7b,h, were found in locations corresponding to the presence of contaminating particles, like chalk and sand.
It is also noteworthy that the identification of pores in samples linked to oil contamination (Figure 7c,d) can be justified by the mechanism of evaporation of this contaminant, absorbed by the melt pool, and which originate the pores after solidification, as discussed in [43], when characterizing the effect of different contaminations on the acoustic spectrum of the WAAM process, and in [51], when summarizing the current research status and challenges of the WAAM process, and by showing the methods of quality enhancement for this process, all the details of the state of the art regarding its typical defects are presented.

4. Conclusions

This study aimed to comprehensively characterize the effects of various contaminations on the behavior of the electric arc within the Wire Arc Additive Manufacturing process and to evaluate their influence on the occurrence of microscopic defects in thin-walled structures. The following conclusions could be drawn based on the arc behavior, arc stability from the metal transfer, thin-wall macroscopical aspects, and metallographic cross-section of the thin walls:
(1)
The visual inspection of the WAAM-based thin walls preliminarily showed the negative effect of contaminants on the visual appearance of the preforms, showing discontinuities related to geometric variation and excessive spatter.
(2)
The electric voltage and current data analysis showed dissimilar electric arc behavior when comparing the contaminating preforms with the reference one (S3). For the analyses involving electrical current values, it was noticed that contaminants tended to present a reduced number of occurrences throughout the observed range of values, taking into account the peaks related to the predefined peak and base current values.
(3)
In all cases, the insertion of contaminants significantly harmed the stability of the electric arc, so the IVsc values for all the contaminants were higher compared to the reference sample (S3), and the sample with the insertion of sand (S4) presented the worst index for arc stability, followed by the samples contaminated with chalk (S1) and oil (S2).
(4)
Through the metallographic characterization, the anomalous behavior of the electric arc and its instability were confirmed, in addition to visual indications of discontinuities confirmed by visual inspection, by identifying microscopic defects in the interpass regions of the preforms, related to the contamination zones.
The electric voltage and current data acquired during the deposition indicated that the location and identification of process instabilities can be achieved via a temporal analysis of the electric arc signals. This indicates that it is essential to emphasize the need for the careful monitoring and control of the manufacturing process to ensure the production of high-quality MAM-based parts.
Despite identifying variations in the arc behavior and stability using the employed methods, numerous fluctuations were observed even under broadly consistent experimental conditions. This underscores the necessity of employing alternative digital signal analysis techniques to handle signals characterized by sharp peaks effectively. Therefore, future investigations can consider defect detection through a machine learning framework, particularly leveraging supervised learning approaches to facilitate the integration of electric arc monitoring within the CCC-WAAM process.

Author Contributions

Conceptualization, J.S.d.L. and W.B.d.C.; investigation, J.I.V.d.S.; formal analysis, J.I.V.d.S., J.S.d.L., A.A.S., R.A.C.d.S. and J.M.R.S.T.; validation, J.S.d.L., W.B.d.C., T.F.d.A.S. and J.M.R.S.T.; writing—original draft preparation, J.I.V.d.S. and J.S.d.L.; writing—review and editing, J.S.d.L., W.B.d.C., R.A.C.d.S., A.A.S. and J.M.R.S.T.; supervision, J.S.d.L. and W.B.d.C.; funding acquisition, J.S.d.L., W.B.d.C. and T.F.d.A.S. All authors have read and agreed to the published version of the manuscript.

Funding

This research was funded by the Brazilian National Council for Scientific and Technological Development (CNPq): grant numbers 409585/2022-0 and 408253/2022-3.

Data Availability Statement

The raw data supporting the conclusions of this article will be made available by the authors on request.

Acknowledgments

To the welding (LabSol), metallography (LabMet), microscopy (LabMet), and mechanical properties characterization (LabMet) laboratories of the Department of Mechanical Engineering (DEM) at the Federal University of Campina Grande (UFCG).

Conflicts of Interest

The authors declare no conflicts of interest.

References

  1. Kumar, N.; Bhavsar, H.; Mahesh, P.V.S.; Srivastava, A.K.; Bora, B.J.; Saxena, A.; Dixit, A.R. Wire Arc Additive Manufacturing—A Revolutionary Method in Additive Manufacturing. Mater. Chem. Phys. 2022, 285, 126144. [Google Scholar] [CrossRef]
  2. Elmer, J.W.; Gibbs, G. Mechanical Rolling and Annealing of Wire-Arc Additively Manufactured Stainless Steel Plates. Sci. Technol. Weld. Join. 2022, 27, 14–21. [Google Scholar] [CrossRef]
  3. DebRoy, T.; Wei, H.L.; Zuback, J.S.; Mukherjee, T.; Elmer, J.W.; Milewski, J.O.; Beese, A.M.; Wilson-Heid, A.; De, A.; Zhang, W. Additive Manufacturing of Metallic Components—Process, Structure and Properties. Prog. Mater. Sci. 2018, 92, 112–224. [Google Scholar] [CrossRef]
  4. Xiao, X.; Waddell, C.; Hamilton, C.; Xiao, H. Quality Prediction and Control in Wire Arc Additive Manufacturing via Novel Machine Learning Framework. Micromachines 2022, 13, 137. [Google Scholar] [CrossRef]
  5. de Souto, J.I.V.; Ferreira, S.D.; de Lima, J.S.; de Castro, W.B.; Grassi, E.N.D.; de Abreu Santos, T.F. Effect of GMAW Process Parameters and Heat Input on Weld Overlay of Austenitic Stainless Steel 316L-Si. Soldag. Inspeção 2023, 28, e2809. [Google Scholar] [CrossRef]
  6. Dinovitzer, M.; Chen, X.; Laliberte, J.; Huang, X.; Frei, H. Effect of Wire and Arc Additive Manufacturing (WAAM) Process Parameters on Bead Geometry and Microstructure. Addit. Manuf. 2019, 26, 138–146. [Google Scholar] [CrossRef]
  7. de Lima, J.S.; da Silva Neto, J.F.; Maciel, T.M.; López, E.A.T.; de Santana, R.A.C.; de Abreu Santos, T.F. Effect of Wire Arc Additive Manufacturing Parameters on Geometric, Hardness, and Microstructure of 316LSi Stainless Steel Preforms. Int. J. Adv. Manuf. Technol. 2024, accepted. [Google Scholar]
  8. He, X.; Wang, T.; Wu, K.; Liu, H. Automatic Defects Detection and Classification of Low Carbon Steel WAAM Products Using Improved Remanence/Magneto-Optical Imaging and Cost-Sensitive Convolutional Neural Network. Measurement 2021, 173, 108633. [Google Scholar] [CrossRef]
  9. Shaloo, M.; Schnall, M.; Klein, T.; Huber, N.; Reitinger, B. A Review of Non-Destructive Testing (NDT) Techniques for Defect Detection: Application to Fusion Welding and Future Wire Arc Additive Manufacturing Processes. Materials 2022, 15, 3697. [Google Scholar] [CrossRef] [PubMed]
  10. Li, Y.; Su, C.; Zhu, J. Comprehensive Review of Wire Arc Additive Manufacturing: Hardware System, Physical Process, Monitoring, Property Characterization, Application and Future Prospects. Results Eng. 2022, 13, 100330. [Google Scholar] [CrossRef]
  11. Wu, B.; Ding, D.; Pan, Z.; Cuiuri, D.; Li, H.; Han, J.; Fei, Z. Effects of Heat Accumulation on the Arc Characteristics and Metal Transfer Behavior in Wire Arc Additive Manufacturing of Ti6Al4V. J. Mater. Process. Technol. 2017, 250, 304–312. [Google Scholar] [CrossRef]
  12. Shin, S.J.; Hong, S.H.; Jadhav, S.; Kim, D.B. Detecting Balling Defects Using Multisource Transfer Learning in Wire Arc Additive Manufacturing. J. Comput. Des. Eng. 2023, 10, 1423–1442. [Google Scholar] [CrossRef]
  13. Brennan, M.C.; Keist, J.S.; Palmer, T.A. Defects in Metal Additive Manufacturing Processes. J. Mater. Eng. Perform. 2021, 30, 4808–4818. [Google Scholar] [CrossRef]
  14. Tomar, B.; Shiva, S.; Nath, T. A Review on Wire Arc Additive Manufacturing: Processing Parameters, Defects, Quality Improvement and Recent Advances. Mater. Today Commun. 2022, 31, 103739. [Google Scholar] [CrossRef]
  15. Wu, B.; Pan, Z.; Ding, D.; Cuiuri, D.; Li, H.; Xu, J.; Norrish, J. A Review of the Wire Arc Additive Manufacturing of Metals: Properties, Defects and Quality Improvement. J. Manuf. Process. 2018, 35, 127–139. [Google Scholar] [CrossRef]
  16. Rodriguez, N.; Vázquez, L.; Huarte, I.; Arruti, E.; Tabernero, I.; Alvarez, P. Wire and Arc Additive Manufacturing: A Comparison between CMT and TopTIG Processes Applied to Stainless Steel. Weld. World 2018, 62, 1083–1096. [Google Scholar] [CrossRef]
  17. Ding, D.; Pan, Z.; Cuiuri, D.; Li, H. Wire-Feed Additive Manufacturing of Metal Components: Technologies, Developments and Future Interests. Int. J. Adv. Manuf. Technol. 2015, 81, 465–481. [Google Scholar] [CrossRef]
  18. Xia, C.; Pan, Z.; Polden, J.; Li, H.; Xu, Y.; Chen, S.; Zhang, Y. A Review on Wire Arc Additive Manufacturing: Monitoring, Control and a Framework of Automated System. J. Manuf. Syst. 2020, 57, 31–45. [Google Scholar] [CrossRef]
  19. Zimermann, R.; Mohseni, E.; Vasilev, M.; Loukas, C.; Vithanage, R.K.W.; Macleod, C.N.; Lines, D.; Javadi, Y.; Espirindio E Silva, M.P.; Fitzpatrick, S.; et al. Collaborative Robotic Wire + Arc Additive Manufacture and Sensor-Enabled In-Process Ultrasonic Non-Destructive Evaluation. Sensors 2022, 22, 4203. [Google Scholar] [CrossRef]
  20. Ramalho, A.; Santos, T.G.; Bevans, B.; Smoqi, Z.; Rao, P.; Oliveira, J.P. Effect of Contaminations on the Acoustic Emissions during Wire and Arc Additive Manufacturing of 316L Stainless Steel. Addit. Manuf. 2022, 51, 102585. [Google Scholar] [CrossRef]
  21. Pringle, A.M.; Oberloier, S.; Petsiuk, A.L.; Sanders, P.G.; Pearce, J.M. Open Source Arc Analyzer: Multi-Sensor Monitoring of Wire Arc Additive Manufacturing. HardwareX 2020, 8, e00137. [Google Scholar] [CrossRef]
  22. Chen, X.; Sun, B.; Zhang, C.; Lou, X.; Zhao, Z.; Han, J. Wire Composition and Shielding Gas Flow Monitoring Based on Image and Spectrum Multimodal Network. Measurement 2020, 160, 107797. [Google Scholar] [CrossRef]
  23. Cho, H.W.; Shin, S.J.; Seo, G.J.; Kim, D.B.; Lee, D.H. Real-Time Anomaly Detection Using Convolutional Neural Network in Wire Arc Additive Manufacturing: Molybdenum Material. J. Mater. Process. Technol. 2022, 302, 117495. [Google Scholar] [CrossRef]
  24. Hauser, T.; Reisch, R.T.; Seebauer, S.; Parasar, A.; Kamps, T.; Casati, R.; Volpp, J.; Kaplan, A.F.H. Multi-Material Wire Arc Additive Manufacturing of Low and High Alloyed Aluminium Alloys with in-Situ Material Analysis. J. Manuf. Process. 2021, 69, 378–390. [Google Scholar] [CrossRef]
  25. Lee, C.; Seo, G.; Kim, D.B.; Kim, M.; Shin, J.-H. Development of Defect Detection AI Model for Wire + Arc Additive Manufacturing Using High Dynamic Range Images. Appl. Sci. 2021, 11, 7541. [Google Scholar] [CrossRef]
  26. Li, Y.; Polden, J.; Pan, Z.; Cui, J.; Xia, C.; He, F.; Mu, H.; Li, H.; Wang, L. A Defect Detection System for Wire Arc Additive Manufacturing Using Incremental Learning. J. Ind. Inf. Integr. 2022, 27, 100291. [Google Scholar] [CrossRef]
  27. Reisch, R.; Hauser, T.; Lutz, B.; Pantano, M.; Kamps, T.; Knoll, A. Distance-Based Multivariate Anomaly Detection in Wire Arc Additive Manufacturing. In Proceedings of the 2020 19th IEEE International Conference on Machine Learning and Applications (ICMLA), Miami, FL, USA, 14–17 December 2020; pp. 659–664. [Google Scholar] [CrossRef]
  28. So, M.S.; Seo, G.J.; Kim, D.B.; Shin, J.-H. Prediction of Metal Additively Manufactured Surface Roughness Using Deep Neural Network. Sensors 2022, 22, 7955. [Google Scholar] [CrossRef] [PubMed]
  29. Wang, Y.; Lu, J.; Zhao, Z.; Deng, W.; Han, J.; Bai, L.; Yang, X.; Yao, J. Active Disturbance Rejection Control of Layer Width in Wire Arc Additive Manufacturing Based on Deep Learning. J. Manuf. Process. 2021, 67, 364–375. [Google Scholar] [CrossRef]
  30. Zhang, R.; Li, W.; Jiao, Y.; Paniagua, C.; Ren, Y.; Lu, H. Porosity Evolution under Increasing Tension in Wire-Arc Additively Manufactured Aluminum Using in-Situ Micro-Computed Tomography and Convolutional Neural Network. Scr. Mater. 2023, 225, 115172. [Google Scholar] [CrossRef]
  31. Kah, P.; Edigbe, G.O.; Ndiwe, B.; Kubicek, R. Assessment of Arc Stability Features for Selected Gas Metal Arc Welding Conditions. SN Appl. Sci. 2022, 4, 268. [Google Scholar] [CrossRef]
  32. Puñales, E.M.M.; Alfaro, S.C.A. Stability on the GMAW Process. In Welding—Modern Topics; IntechOpen: London, UK, 2021; Volume 11, p. 13. ISBN 0000957720. [Google Scholar]
  33. Zhang, T.; Xu, C.; Cheng, J.; Chen, Z.; Wang, L.; Wang, K. Research of Surface Oxidation Defects in Copper Alloy Wire Arc Additive Manufacturing Based on Time-Frequency Analysis and Deep Learning Method. J. Mater. Res. Technol. 2023, 25, 511–521. [Google Scholar] [CrossRef]
  34. Shin, S.; Jin, C.; Yu, J.; Rhee, S. Real-Time Detection of Weld Defects for Automated Welding Process Base on Deep Neural Network. Metals 2020, 10, 389. [Google Scholar] [CrossRef]
  35. Ferreira, G.R.B.; Filho, R.M.M.; Scotti, A.; Lagares, M.L. Exploring a Locus of Maximum Metal Transfer Stability of the Short-Circuiting GMAW Process Based on the Reignition Voltage Peaks. J. Braz. Soc. Mech. Sci. Eng. 2021, 43, 503. [Google Scholar] [CrossRef]
  36. Truppel, G.H.; Angerhausen, M.; Pipinikas, A.; Reisgen, U.; dos Santos Paes, L.E. Stability Analysis of the Cold Metal Transfer (CMT) Brazing Process for Galvanized Steel Plates with ZnAl4 Filler Metal. Int. J. Adv. Manuf. Technol. 2019, 103, 2485–2494. [Google Scholar] [CrossRef]
  37. Zhang, Z.; Shen, J.; Hu, S.; Chen, Y.; Yin, C.; Bu, X. Optimization of CMT Characteristic Parameters for Swing Arc Additive Manufacturing of AZ91 Magnesium Alloy Based on Process Stability Analysis. Materials 2023, 16, 3236. [Google Scholar] [CrossRef]
  38. Zhang, T.; Li, H.; Gong, H.; Wu, Y.; Chen, X.; Zhang, X. Study on Location-Related Thermal Cycles and Microstructure Variation of Additively Manufactured Inconel 718. J. Mater. Res. Technol. 2022, 18, 3056–3072. [Google Scholar] [CrossRef]
  39. Rodideal, N.; Machado, C.M.; Infante, V.; Braga, D.F.O.; Santos, T.G.; Vidal, C. Mechanical Characterization and Fatigue Assessment of Wire and Arc Additively Manufactured HSLA Steel Parts. Int. J. Fatigue 2022, 164, 107146. [Google Scholar] [CrossRef]
  40. Liskevych, O.; Scotti, A. Influence of the CO2 Content on Operational Performance of Short-Circuit GMAW. Weld. World 2015, 59, 217–224. [Google Scholar] [CrossRef]
  41. de Meneses, V.A.; Gomes, J.F.P.; Scotti, A. The Effect of Metal Transfer Stability (Spattering) on Fume Generation, Morphology and Composition in Short-Circuit MAG Welding. J. Mater. Process. Technol. 2014, 214, 1388–1397. [Google Scholar] [CrossRef]
  42. Bevans, B.; Ramalho, A.; Smoqi, Z.; Gaikwad, A.; Santos, T.G.; Rao, P.; Oliveira, J.P. Monitoring and Flaw Detection during Wire-Based Directed Energy Deposition Using in-Situ Acoustic Sensing and Wavelet Graph Signal Analysis. Mater. Des. 2023, 225, 111480. [Google Scholar] [CrossRef]
  43. Huang, Y.; Yue, C.; Tan, X.; Zhou, Z.; Li, X.; Zhang, X.; Zhou, C.; Peng, Y.; Wang, K. Quality Prediction for Wire Arc Additive Manufacturing Based on Multi-Source Signals, Whale Optimization Algorithm–Variational Modal Decomposition, and One-Dimensional Convolutional Neural Network. J. Mater. Eng. Perform. 2023. [Google Scholar] [CrossRef]
  44. Liao, H.; Zhang, W.; Li, X.; Pei, K.; Lin, S.; Tian, J.; Wang, Z. Effect of Pulse Current on Droplet Transfer Behavior and Weld Formation of 304 Stainless Steel in Local Dry Underwater Pulse MIG Welding. Int. J. Adv. Manuf. Technol. 2022, 122, 869–879. [Google Scholar] [CrossRef]
  45. Bauné, E.; Bonnet, C.; Liu, S. Assessing Metal Transfer Stability and Spatter Severity in Flux Cored Arc Welding. Sci. Technol. Weld. Join. 2001, 6, 139–148. [Google Scholar] [CrossRef]
  46. Assunção, M.T.; Bracarense, A.Q. Evaluation of the Effect of the Water in the Contact Tip on Arc Stability and Weld Bead Geometry in Underwater Wet FCAW. Soldag. Inspeção 2017, 22, 401–412. [Google Scholar] [CrossRef]
  47. Lee, T.H.; Kim, C.; Kang, M. Effects of Electrode Negative Pulsing Ratio in Direct Energy Deposition via Variable-Polarity Cold Metal Transfer Process on the Deposition Behavior and Microstructural Characteristics. Metals 2022, 12, 475. [Google Scholar] [CrossRef]
  48. Hauser, T.; Reisch, R.T.; Kamps, T.; Kaplan, A.F.H.; Volpp, J. Acoustic Emissions in Directed Energy Deposition Processes. Int. J. Adv. Manuf. Technol. 2022, 119, 3517–3532. [Google Scholar] [CrossRef]
  49. Alcaraz, J.Y.; Foqué, W.; Sharma, A.; Tjahjowidodo, T. Indirect Porosity Detection and Root-Cause Identification in WAAM. J. Intell. Manuf. 2023. [Google Scholar] [CrossRef]
  50. Wang, Z.; Zimmer-Chevret, S.; Léonard, F.; Bourlet, C.; Abba, G. In Situ Monitoring of Internal Defects by a Laser Sensor for CMT Based Wire-Arc Additive Manufacturing Parts. Defect Diffus. Forum 2022, 417, 67–72. [Google Scholar] [CrossRef]
  51. Li, Y.P.; Wang, C.R.; Du, X.D.; Tian, W.; Zhang, T.; Hu, J.S.; Bo, L.; Li, P.C.; Liao, W.H. Research Status and Quality Improvement of Wire Arc Additive Manufacturing of Metals. Trans. Nonferrous Met. Soc. China 2023, 33, 969–996. [Google Scholar] [CrossRef]
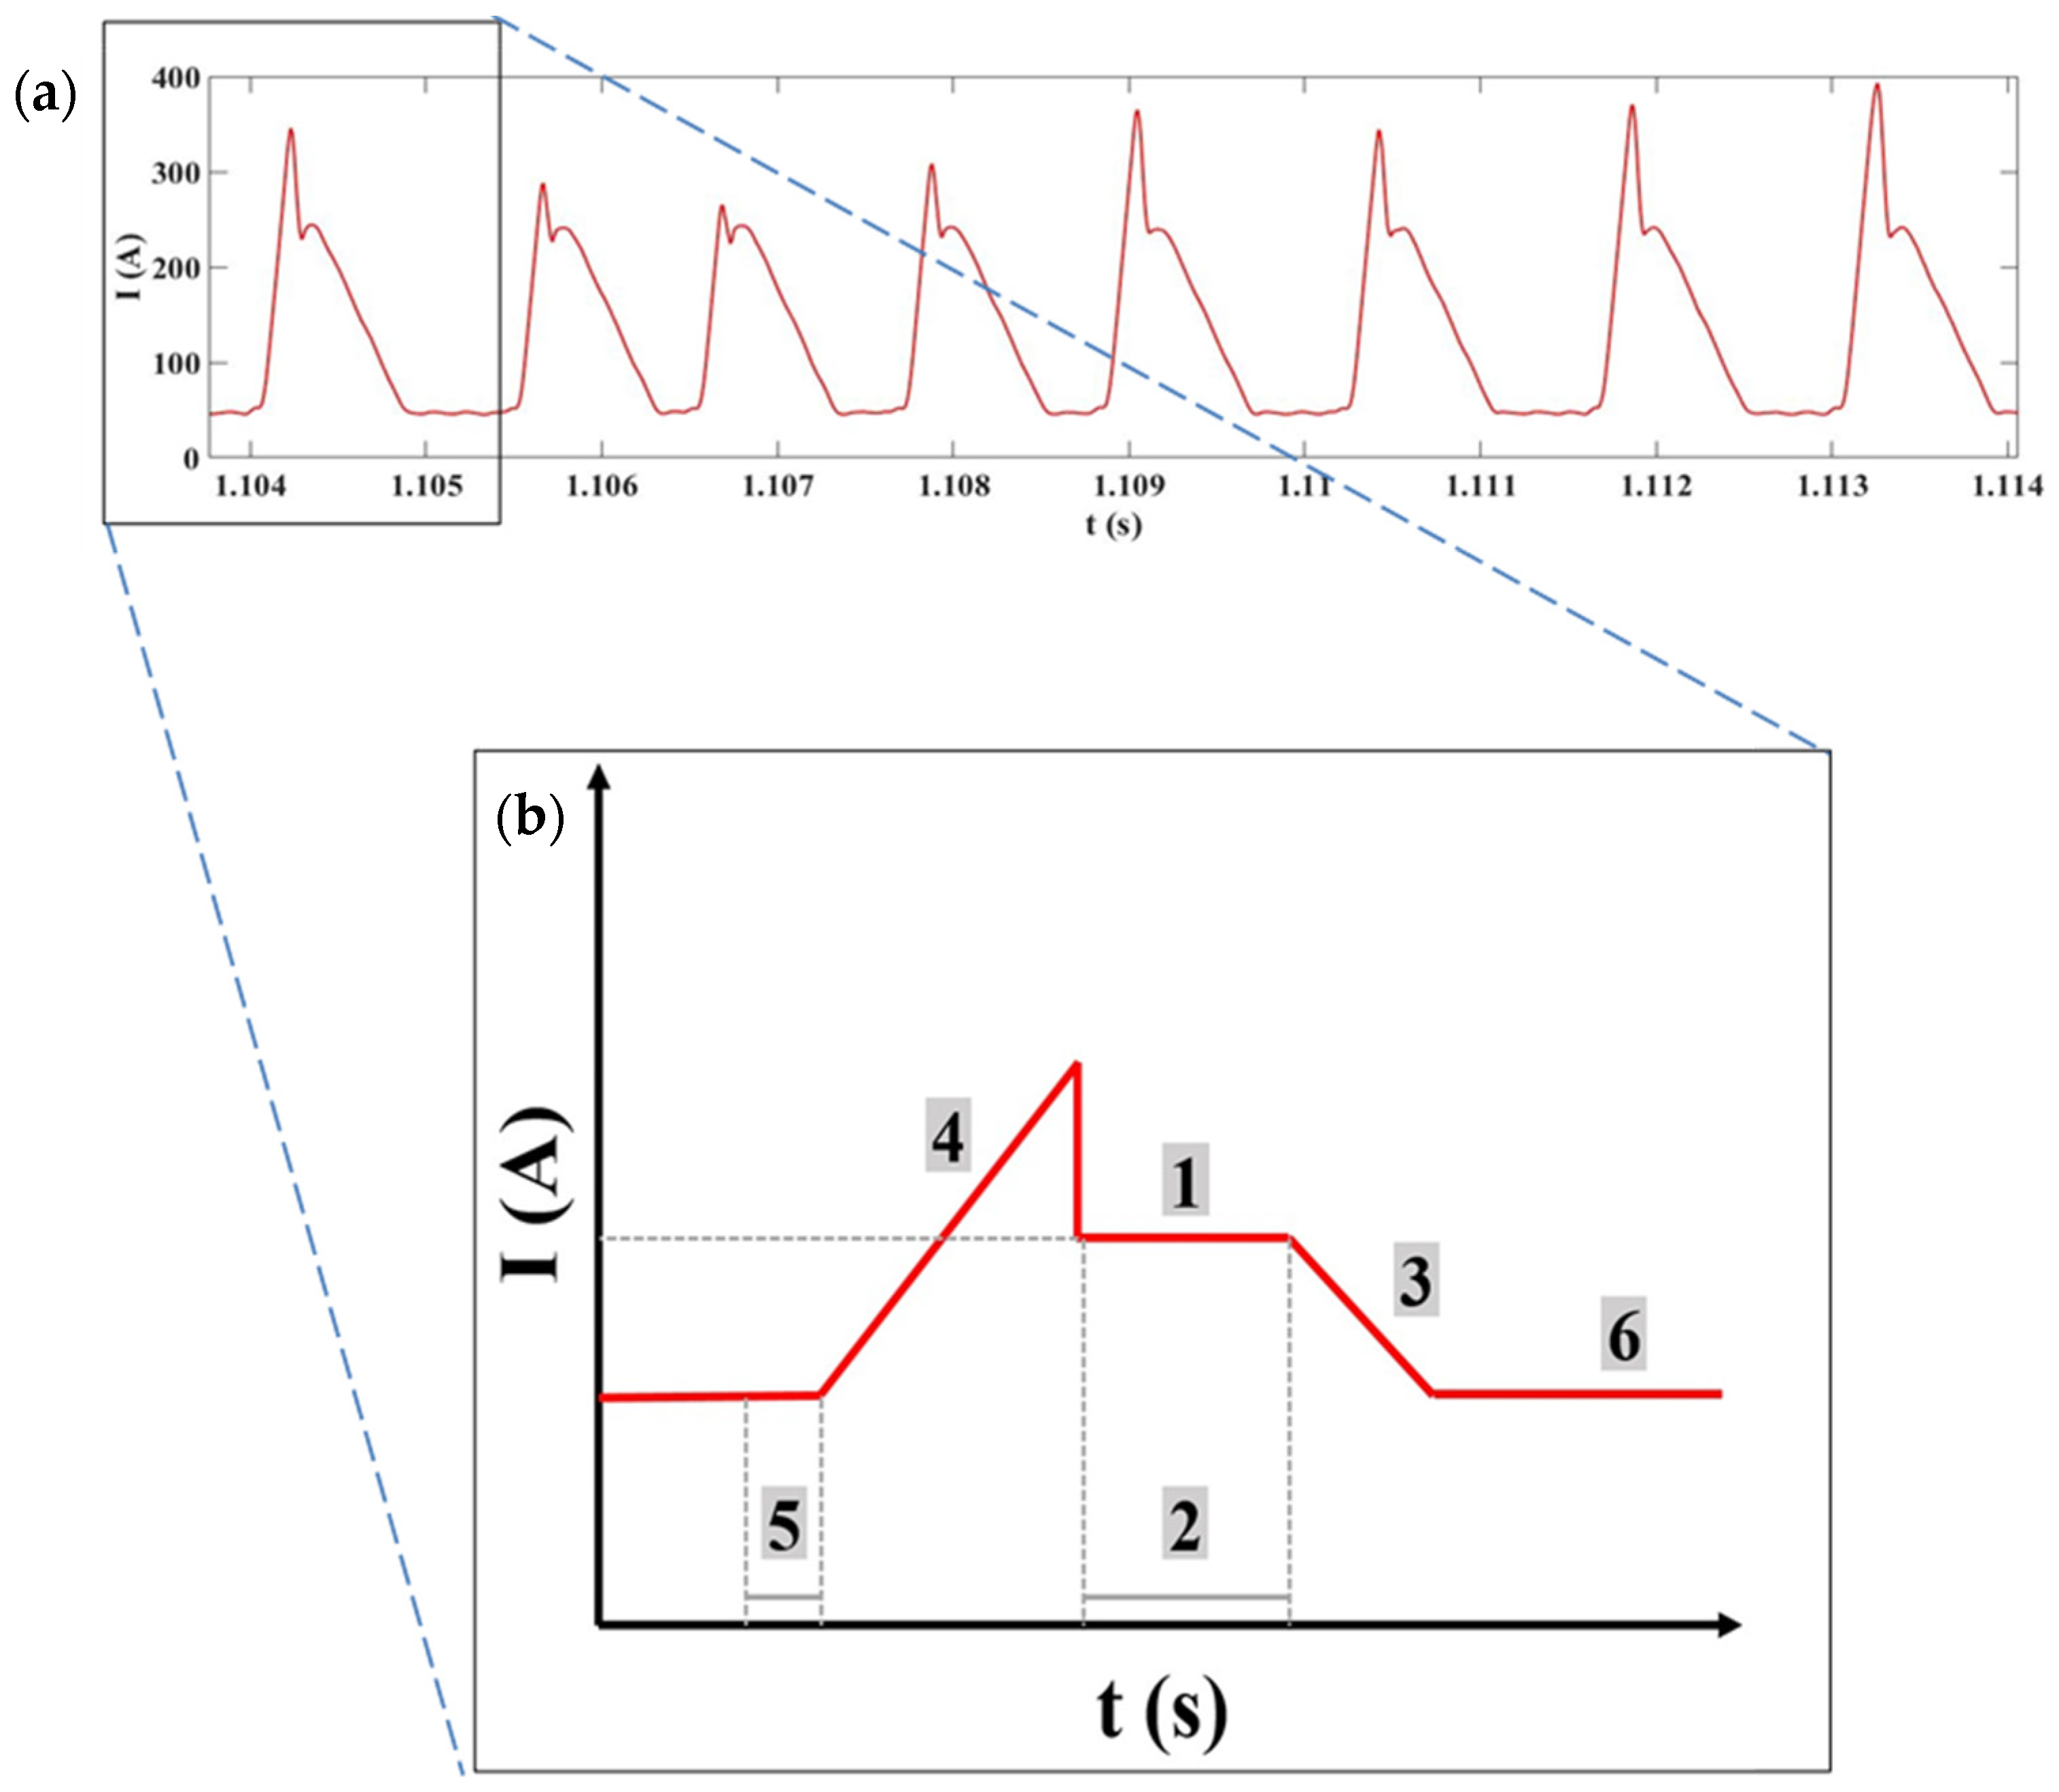
Figure 1. Fundamental parameters to determine the CCC waveform: (a) characteristic waveform, and (b) single CCC current waveform.
Metals 14 00286 g001
Figure 2. Schematic diagram of the insertion of contaminants during the layer deposition WAAM process.
Metals 14 00286 g002
Figure 3. WAAM walls with different contaminants according to the (a) S1, (b) S2, (c) S3, and (d) S4 samples.
Metals 14 00286 g003
Figure 4. Voltage and current cyclograms of the electric arc in layers 2 (on the (left)) and 4 (on the (right)) of the (a,b) S1, (c,d) S2, (e,f) S3, and (g,h) S4 samples.
Metals 14 00286 g004
Figure 5. Histograms of electric arc voltage and current in layers 2 (on the (left)) and 4 (on the (right)) of the (a,b) S1, (c,d) S2, (e,f) S3, and (g,h) S4 samples.
Metals 14 00286 g005
Figure 6. IVsc values for different contaminants and layer locations throughout the WAAM walls.
Metals 14 00286 g006
Figure 7. Micrograph of the central interface region of contaminants between layers 1 and 2 (on the (left)), and layers 3 and 4 (on the (right)), of the (a,b) S1, (c,d) S2, (e,f) S3, and (g,h) S4 samples.
Metals 14 00286 g007aMetals 14 00286 g007b
Table 1. Nominal chemical composition (% by weight) of the substrate and deposit metals.
SteelCNiCrMnSiMoCuPSFe
AISI 1015
(AISI, USA)
0.148-0.0430.419-----Bal.
ABNT 316L-Si
(ABNT, Brazil)
0.03012.519.01.750.832.50.750.030.03Bal.
Disclaimer/Publisher’s Note: The statements, opinions and data contained in all publications are solely those of the individual author(s) and contributor(s) and not of MDPI and/or the editor(s). MDPI and/or the editor(s) disclaim responsibility for any injury to people or property resulting from any ideas, methods, instructions or products referred to in the content.