
Suppression of Inhomogeneous Plastic Deformation in Medium-Carbon Tempered Martensite Steel

Research Center for Structural Materials, National Institute for Materials Science, 1-2-1 Sengen, Tsukuba 305-0047, Ibaraki, Japan
*
Author to whom correspondence should be addressed.
Metals 2024, 14(3), 306; https://doi.org/10.3390/met14030306
Submission received: 15 February 2024
/
Revised: 28 February 2024
/
Accepted: 1 March 2024
/
Published: 4 March 2024
(This article belongs to the Special Issue Editorial Board Members’ Collection Series: Improving Structural Integrity of Metals: From Bulk to Surface)
Abstract
:The Lüders phenomenon is one type of inhomogeneous plastic deformation occurring in the elastic-to-plastic transition region, and it is an undesirable plastic deformation behavior. Although conventional measures based on the chemical composition design, plasticity processing principle, or utilization of composited microstructures are used to suppress this phenomenon in engineering, demerits are present, such as high cost and low fracture behavior. The Lüders phenomenon begins with the formation of plastic bands (inhomogeneous yielding) at one or several local sites. If yielding simultaneously occurs everywhere rather than at several local sites, the formation of local plastic bands will be inhibited; as a result, the Lüders deformation will be suppressed. Based on this idea, a new approach was proposed in which the number of local yield sites was increased by heat treatments. A medium-carbon tempered martensite steel (Fe-0.3C-1.5Mn, in wt%) was used to verify the validity of the new approach, and the optimum heat-treatment conditions for the balance of mechanical property and deformation behavior were determined.
1. Introduction
Inhomogeneous plastic deformation occurs in some crystalline materials in the form of single or multiple plastic bands. Piobert [1] and Lüders [2] first reported this phenomenon that takes place in the elastic-to-plastic transition region in mild steel. This plastic instability that occurs in the elastic-to-plastic transition region is referred to as Lüders deformation (or Lüders phenomenon). It has a typical characteristic on the tensile curve, a yield plateau [3,4], as shown in Figure 1a. This yield plateau involves the whole Lüders deformation process, which is schematically illustrated in Figure 1b. The whole process is roughly divided into three stages: (Stage I) yielding occurs at one or several sites; (Stage II) one or several plastic bands form at those sites; (Stage III) these plastic bands propagate across the whole specimen. Lüders deformation in a material is dependent on its microstructural factors and working environments. The former involves the microstructure type, microstructural morphology and grain size [5,6,7,8], and the latter includes applied stress [9,10], strain rate [11,12,13], specimen size [13,14], and temperature [15].
The mechanism of the Lüders phenomenon has been widely studied. Cottrell [16,17] first proposed a dislocation model that assumes that the Lüders phenomenon is related to interactions between solute interstitials, such as C and N, and mobile dislocations. The dislocations are initially locked by solute interstitials, which tend to form Cottrell atmospheres around them. The pinning of dislocations is associated with an increase in yield strength (i.e., hardening). When the stress threshold for unlocking or multiplying these dislocations is exceeded, the dislocations are unpinned, and a rapid multiplication of mobile dislocations occurs; as a result, yield strength decreases (i.e., softening). The pinning and unpinning of dislocations result in strain aging [18]. It is generally believed that the Lüders phenomenon is caused by static strain aging (SSA) [19,20]. Onodera [21] and Hahn [22] modified dislocation models in which the dominant mechanism of Lüders band formation is attributed to rapid dislocation multiplication.
In the metal forming process, if the used plates have the Lüders phenomenon, stretcher–strain marks (i.e., plastic bands) will be formed on the surface of the cold-formed products. If the surface damage is severe, it will induce the failure of the forming product. Therefore, the Lüders phenomenon is an undesirable plastic deformation, and many measures have been applied to avoid it. Figure 2 illustrates the principles of two conventional methods widely used in engineering. Method 1 (chemical composition design) is based on Cottrell’s dislocation model for plastic band formation. As aforementioned, plastic band formation is related to the interaction between interstitial atoms and dislocations. If the number of interstitial atoms is decreased, the possibility of forming a plastic band will be lowered. Under this guideline, IF (interstitial-free) steels have been developed in which interstitial elements, such as C and N, were controlled to be as low as possible [23]. Although decreasing the amount of C and N can lower the possibility of forming plastic bands, the Lüders phenomenon is still present. Method 2 (plasticity processing principle) originates from the characteristics of Lüders deformation on the stress–strain curve. As shown in Figure 1a, when the material deforms from the elastic state (elastic tension region) to the fully plastic state (work-hardening region), there is a stage in which the Lüders phenomenon occurs with a length of . If a material is pre-loaded and the plastic pre-strain is large enough, the plastically processed material will directly cross the inhomogeneous plastic region (yield plateau) during the tension process. Plastic pre-strain was introduced over the whole bulk material by using a skin-pass mill, as shown in Figure 2. For a steel with a chemical composition of 0.023C-0.018Si-0.175Mn (in mass%), when the pre-strain exceeds 2.23%, the skin-pass-processed steel has a round stress–strain curve, and the Lüders phenomenon is completely suppressed [24]. However, this method has its own demerit; for example, large plastic pre-strain decreases the resistance to fracture. Moreover, this cold rolling increases the production cost. It is better to avoid this method as far as possible. In the most recent decade, studies were performed on suppressing the Lüders deformation by utilizing composited microstructures [24,25,26,27,28,29,30]. Different phases have different mechanical properties. Grain size and microstructural morphology also affect mechanical properties. It is possible to eliminate plastic instability by appropriately combing the mechanical property of each microstructural factor. Those studies are summarized as follows:
- (1)
- Inhomogeneous grain size distribution
A bimodal grain size distribution in an Fe-7Mn-0.05C (wt %) was produced to effectively inhibit the Lüders deformation [25].
- (2)
- Multiple phases
Dual-phase (ferrite/martensite) steel was developed [26].
- (3)
- Macroscopic inhomogeneous structure
A sandwich-like structure in which each layer has different mechanical properties was used [27].
- (4)
- TRIP effect
In a multiphase (metastable austenite/ferrite/martensite) steel, each phase and the transformation-induced plasticity (TRIP) play a specific role in the plastic deformation process [28,29]. The TRIP effect was used to suppress the Lüders deformation [30,31,32,33,34,35].
Medium-carbon tempered martensite steel is a common structural steel. Figure 3 shows the stress–strain curve of a medium-carbon tempered martensite steel [36]. It has a good balance of strength and ductility. However, the Lüders phenomenon is present in the steel, and this inhomogeneous plastic deformation limits its application in engineering. This steel is composed of only one phase (martensite) and it has medium carbon content; thus, Method 1 in Figure 2 and the aforementioned composited microstructure method are not suitable for this steel. Because the strength is high, it is difficult to introduce plastic pre-strain by cold skin-rolling (Method 2 in Figure 2). To suppress the Lüders phenomenon in this steel, a new approach is needed.
The steel in Figure 3 was selected as the target material. The objectives of this work are as follows: to suppress the Lüders deformation in the target steel by using a new approach, as shown in Figure 4, and to determine the optimum conditions of heat treatment to balance the mechanical property and deformation behavior.
2. Experimental Methods
2.1. Approach for Suppressing the Lüders Phenomenon
In the present study, we proposed a new approach for suppressing inhomogeneous plastic deformation. Figure 1b shows that Lüders deformation begins in one or several local yield sites. As illustrated in Figure 4, if sufficient yield sites are provided, local yielding will take place everywhere simultaneously instead of at several local sites; as a result, the formation of local plastic bands will be suppressed, and the material will plastically deform without the Lüders phenomenon. The multiplication of yield sites is suggested to occur by controlling the dislocation density through heat treatment. In this approach, heat treatment has two main roles: ① controlling the initial dislocation density to eliminate the Lüders phenomenon; ② adjusting the mechanical properties and fracture behavior.
2.2. Sample Preparation and Tensile Test
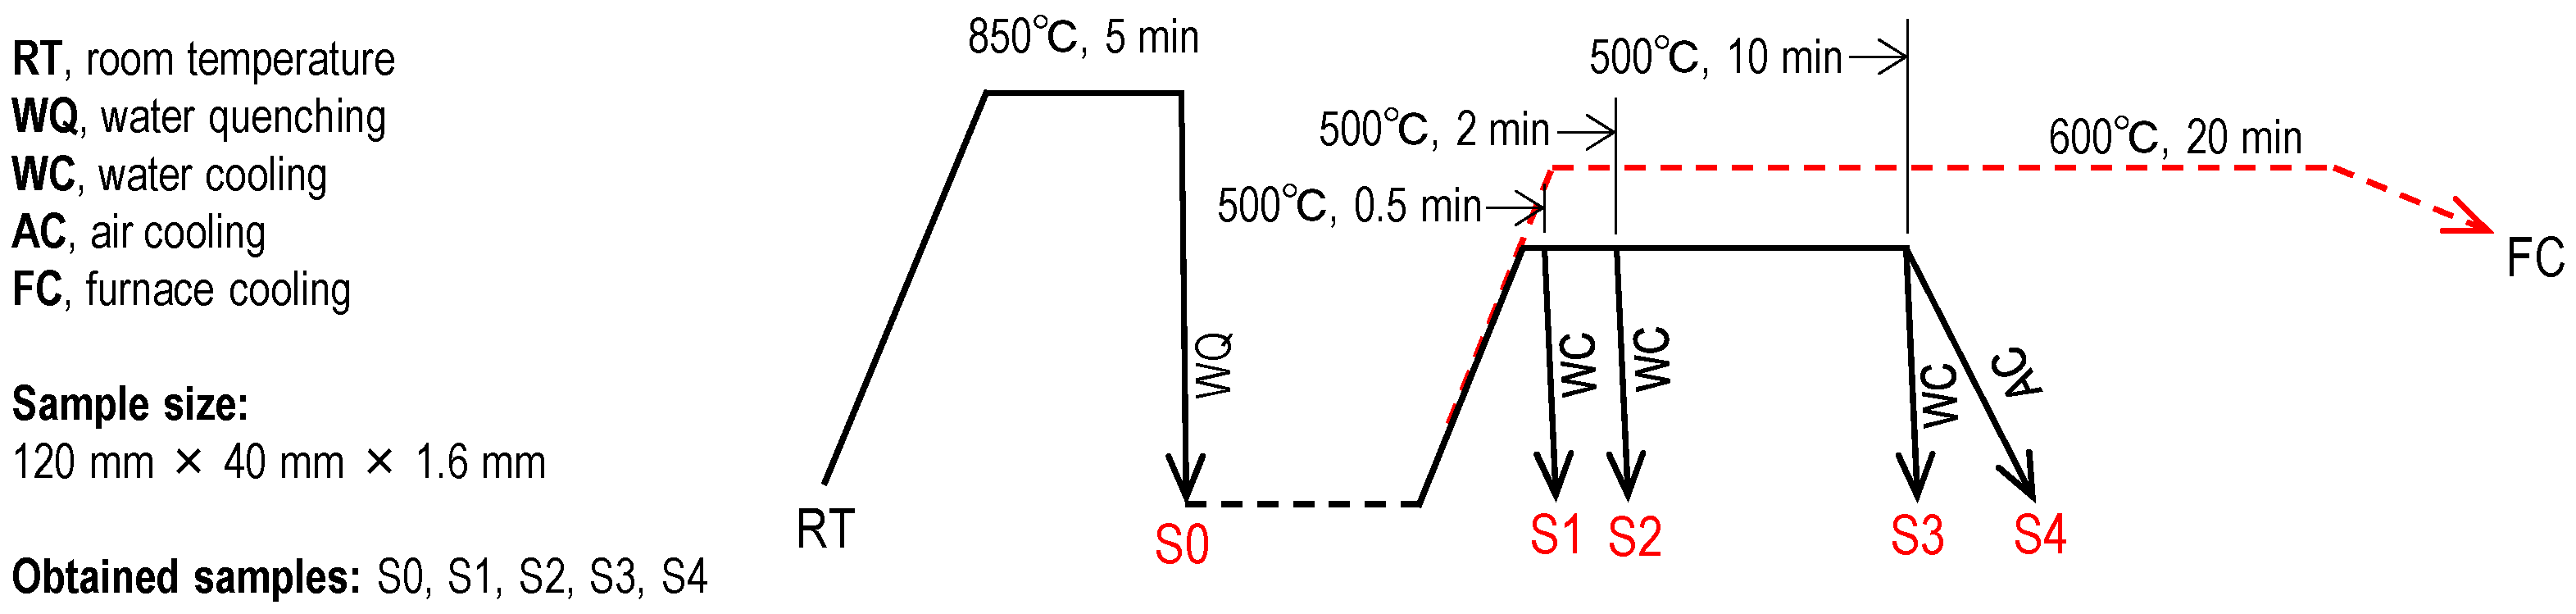
A hot-rolled medium-carbon steel (0.3C-1.5Mn-Fe balance, in mass%) was used as the as-received material. Heat treatments were applied to produce five types of samples (S0~S4), as shown in Figure 5. The as-received steel plates, which were 120 mm long × 40 mm wide × 1.6 mm thick, were heated at 850 °C for 5 min, followed by water quenching. The obtained samples (S0 sample) were used as the start steel for the heat treatments that followed. The S0 samples were reheated at 500 °C and kept for different times, and then water-cooled. The samples, corresponding to keeping times of 30 s, 2 min, and 10 min, were named S1, S2 and S3 samples, respectively. The difference in the heat treatment between the S3 and S4 samples was their cooling: water cooling for S3 and air cooling for S4 samples. A reference heat-treatment process used in Figure 4 is also given in Figure 5 [23]. The microstructures of S0~S4 were examined by electron back-scattered diffraction (EBSD) with a step of 0.1 µm.
Dog-bone-type tensile specimens shown in Figure 6 were machined from the steel plates of S0~S4. The front surfaces of the specimens were sprayed with white and black paint to make speckles for the digital image correlation (DIC) analysis before tensile testing. Tension tests were performed on those specimens at room temperature and at a crosshead speed of 0.01 mm/s. In the tension processes, the deformation processes on the front surfaces of the tensile specimens were recorded successively using a camera at time intervals of 0.5 s. The observed area (30 mm × 8 mm) is shown in Figure 6. Two methods were used to measure the strain during the tension process: (Method 1) An extensometer with a gauge length of 30 mm (equal to the length of the parallel part of the specimen) was attached to the back surface of the tensile specimen. The obtained strain by the extensometer was an average value over the gauge length of 30 mm. (Method 2) The strain and strain-rate field on the front surface of the tensile specimen were measured with the digital image correlation (DIC) technique. The digital images (area: 30 mm × 8 mm) obtained were processed using VIC-2D software (Correlated Solutions, Inc., USA) with a subset size of 9 pixels × 9 pixels (246 μm × 246 μm) and a step of 5 pixels (137 μm) to produce the displacement field, strain field, and strain-rate field. In the DIC operation, the displacement uncertainty is 0.02 pixels.
Two results are expected from tension tests: (1) stress–strain curves, and (2) the evolution of strain and strain-rate field. The former result indicates the global image of macroscopic deformation behavior, and the latter shows the local deformation from which inhomogeneous plastic deformation, for example, plastic bands, can be identified.
3. Results and Discussion
3.1. Microstructures
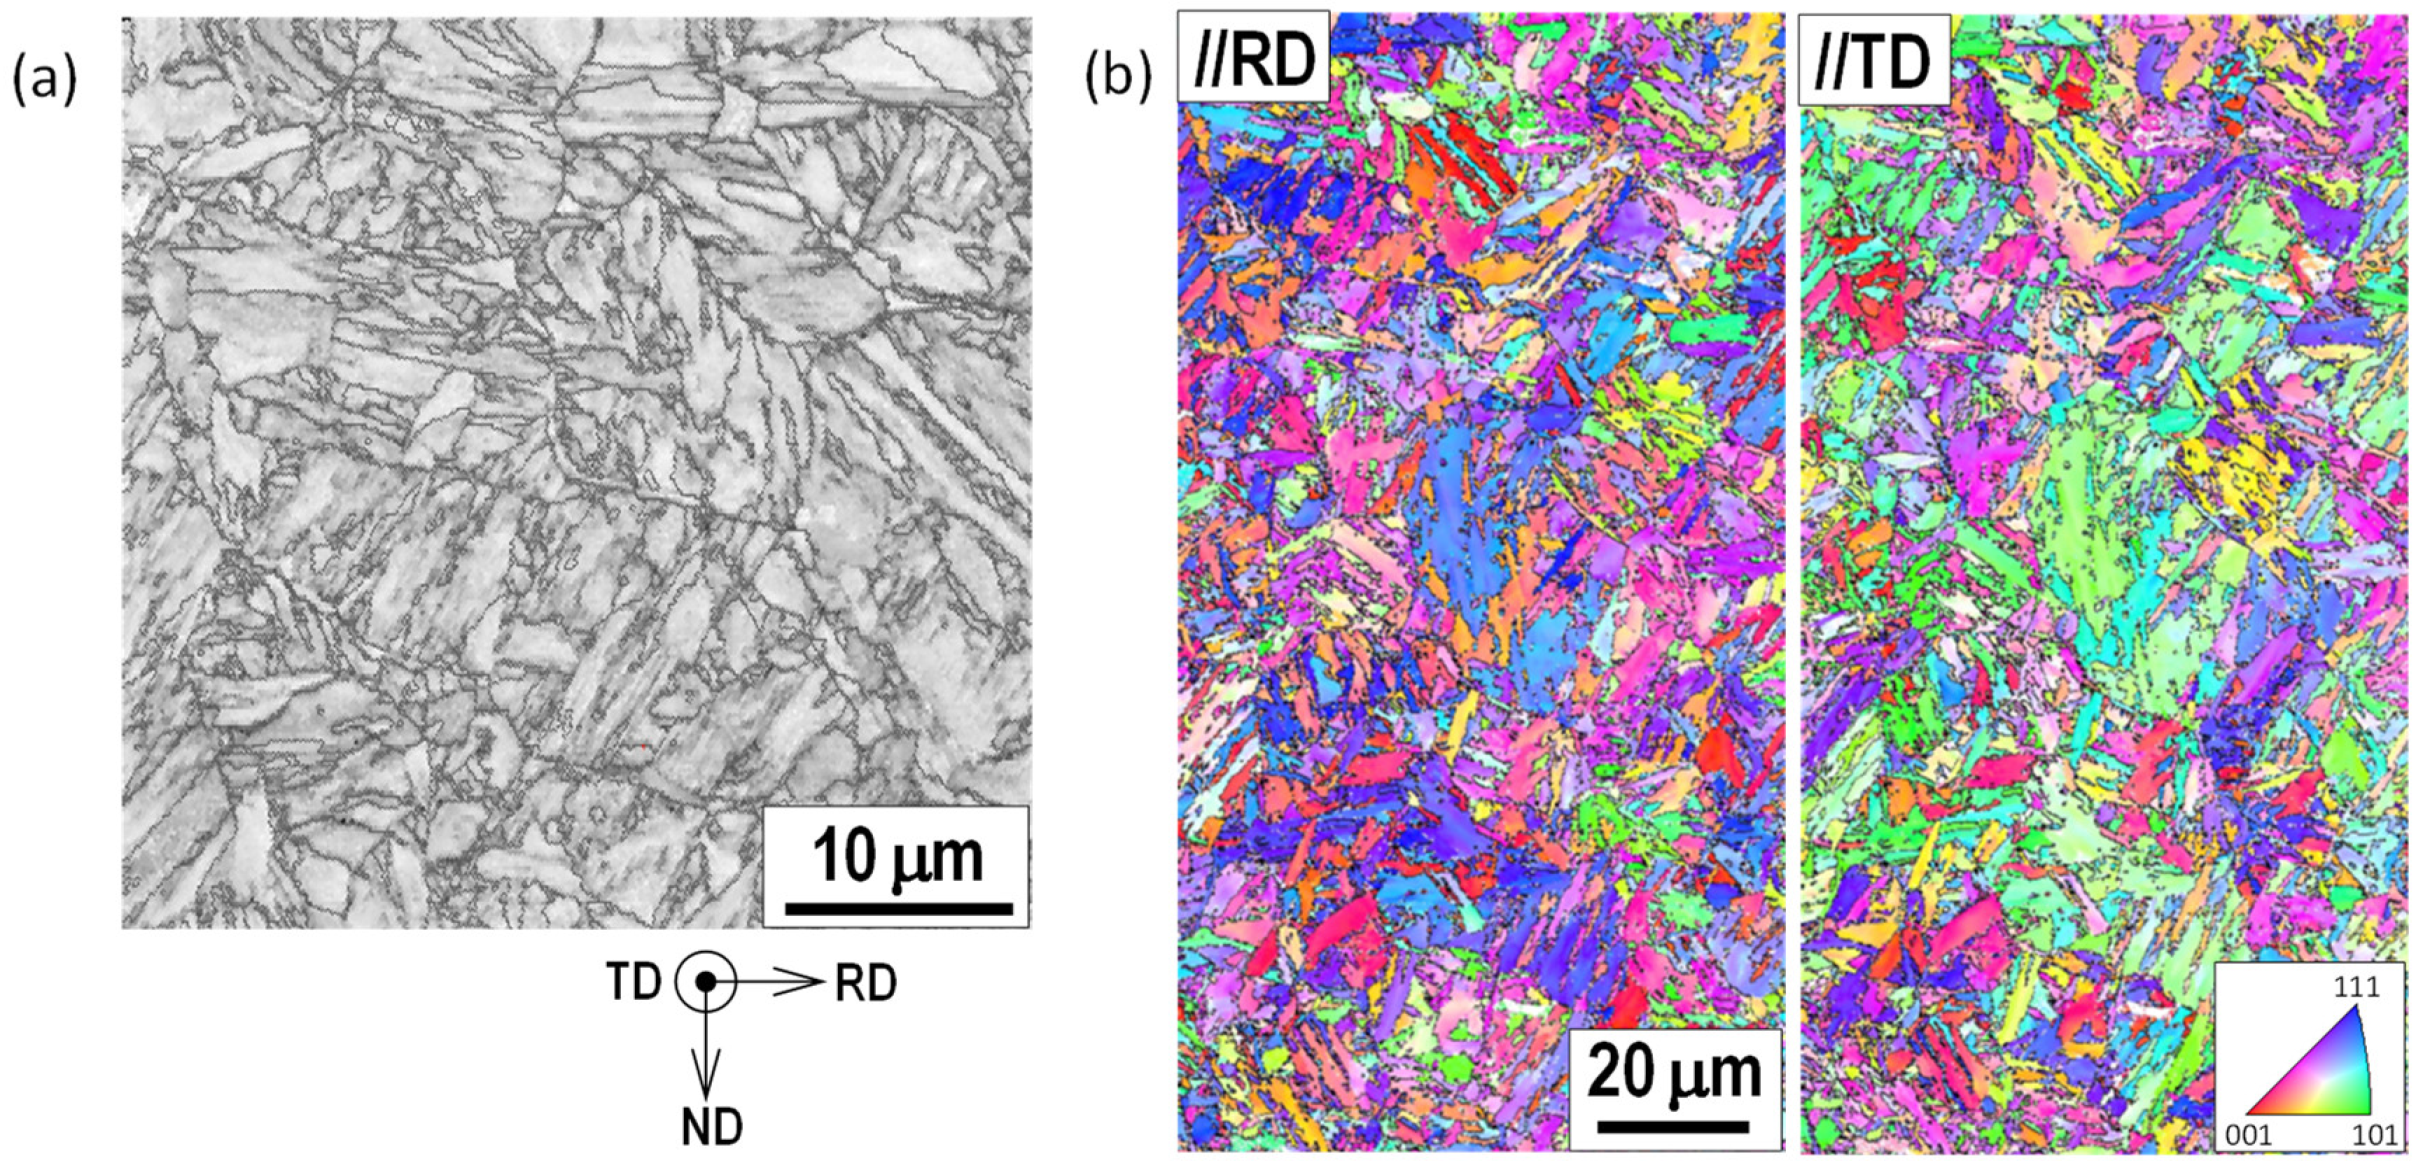
The microstructures of the S0~S4 samples were examined by EBSD. Figure 7 shows the image quality (IQ) map and the inverse pole figure (IPF) of the S0 sample. The phase type and preferential phase orientation can be identified from the IQ map and the IPF, respectively. It can be seen that the S0 sample is fully composed of martensite. Phase orientation was measured from the rolling direction (RD) and transverse direction (TD) in Figure 7b, respectively. The color distribution in Figure 7b represents the orientation distribution. Various colors indicate the presence of random orientations. It is clear that there is almost no preferential orientation.
S1~S4 samples were obtained by tempering S0 samples at 500 °C. The tempering temperature is much lower than the phase transformation temperature, and the tempering times were short. Therefore, the microstructures of the S0~S4 samples have the same morphology, and precipitates are hardly present.
The Kernel average misorientation (KAM) is often used to qualitatively evaluate the density of the geometrically necessary dislocations (GNDs) [37,38,39]. The greater the KAM value, the higher the GND density. The KAM map of martensite was measured and is shown in Figure 8. The color bar (0° to 2°) shows the distribution of the KAM values. The average KAM values in S0~S4 samples are plotted in Figure 9. Figure 9 shows that the KAM value (i.e., the dislocation density) decreases from S0 to S4.
3.2. Stress–Strain Curves
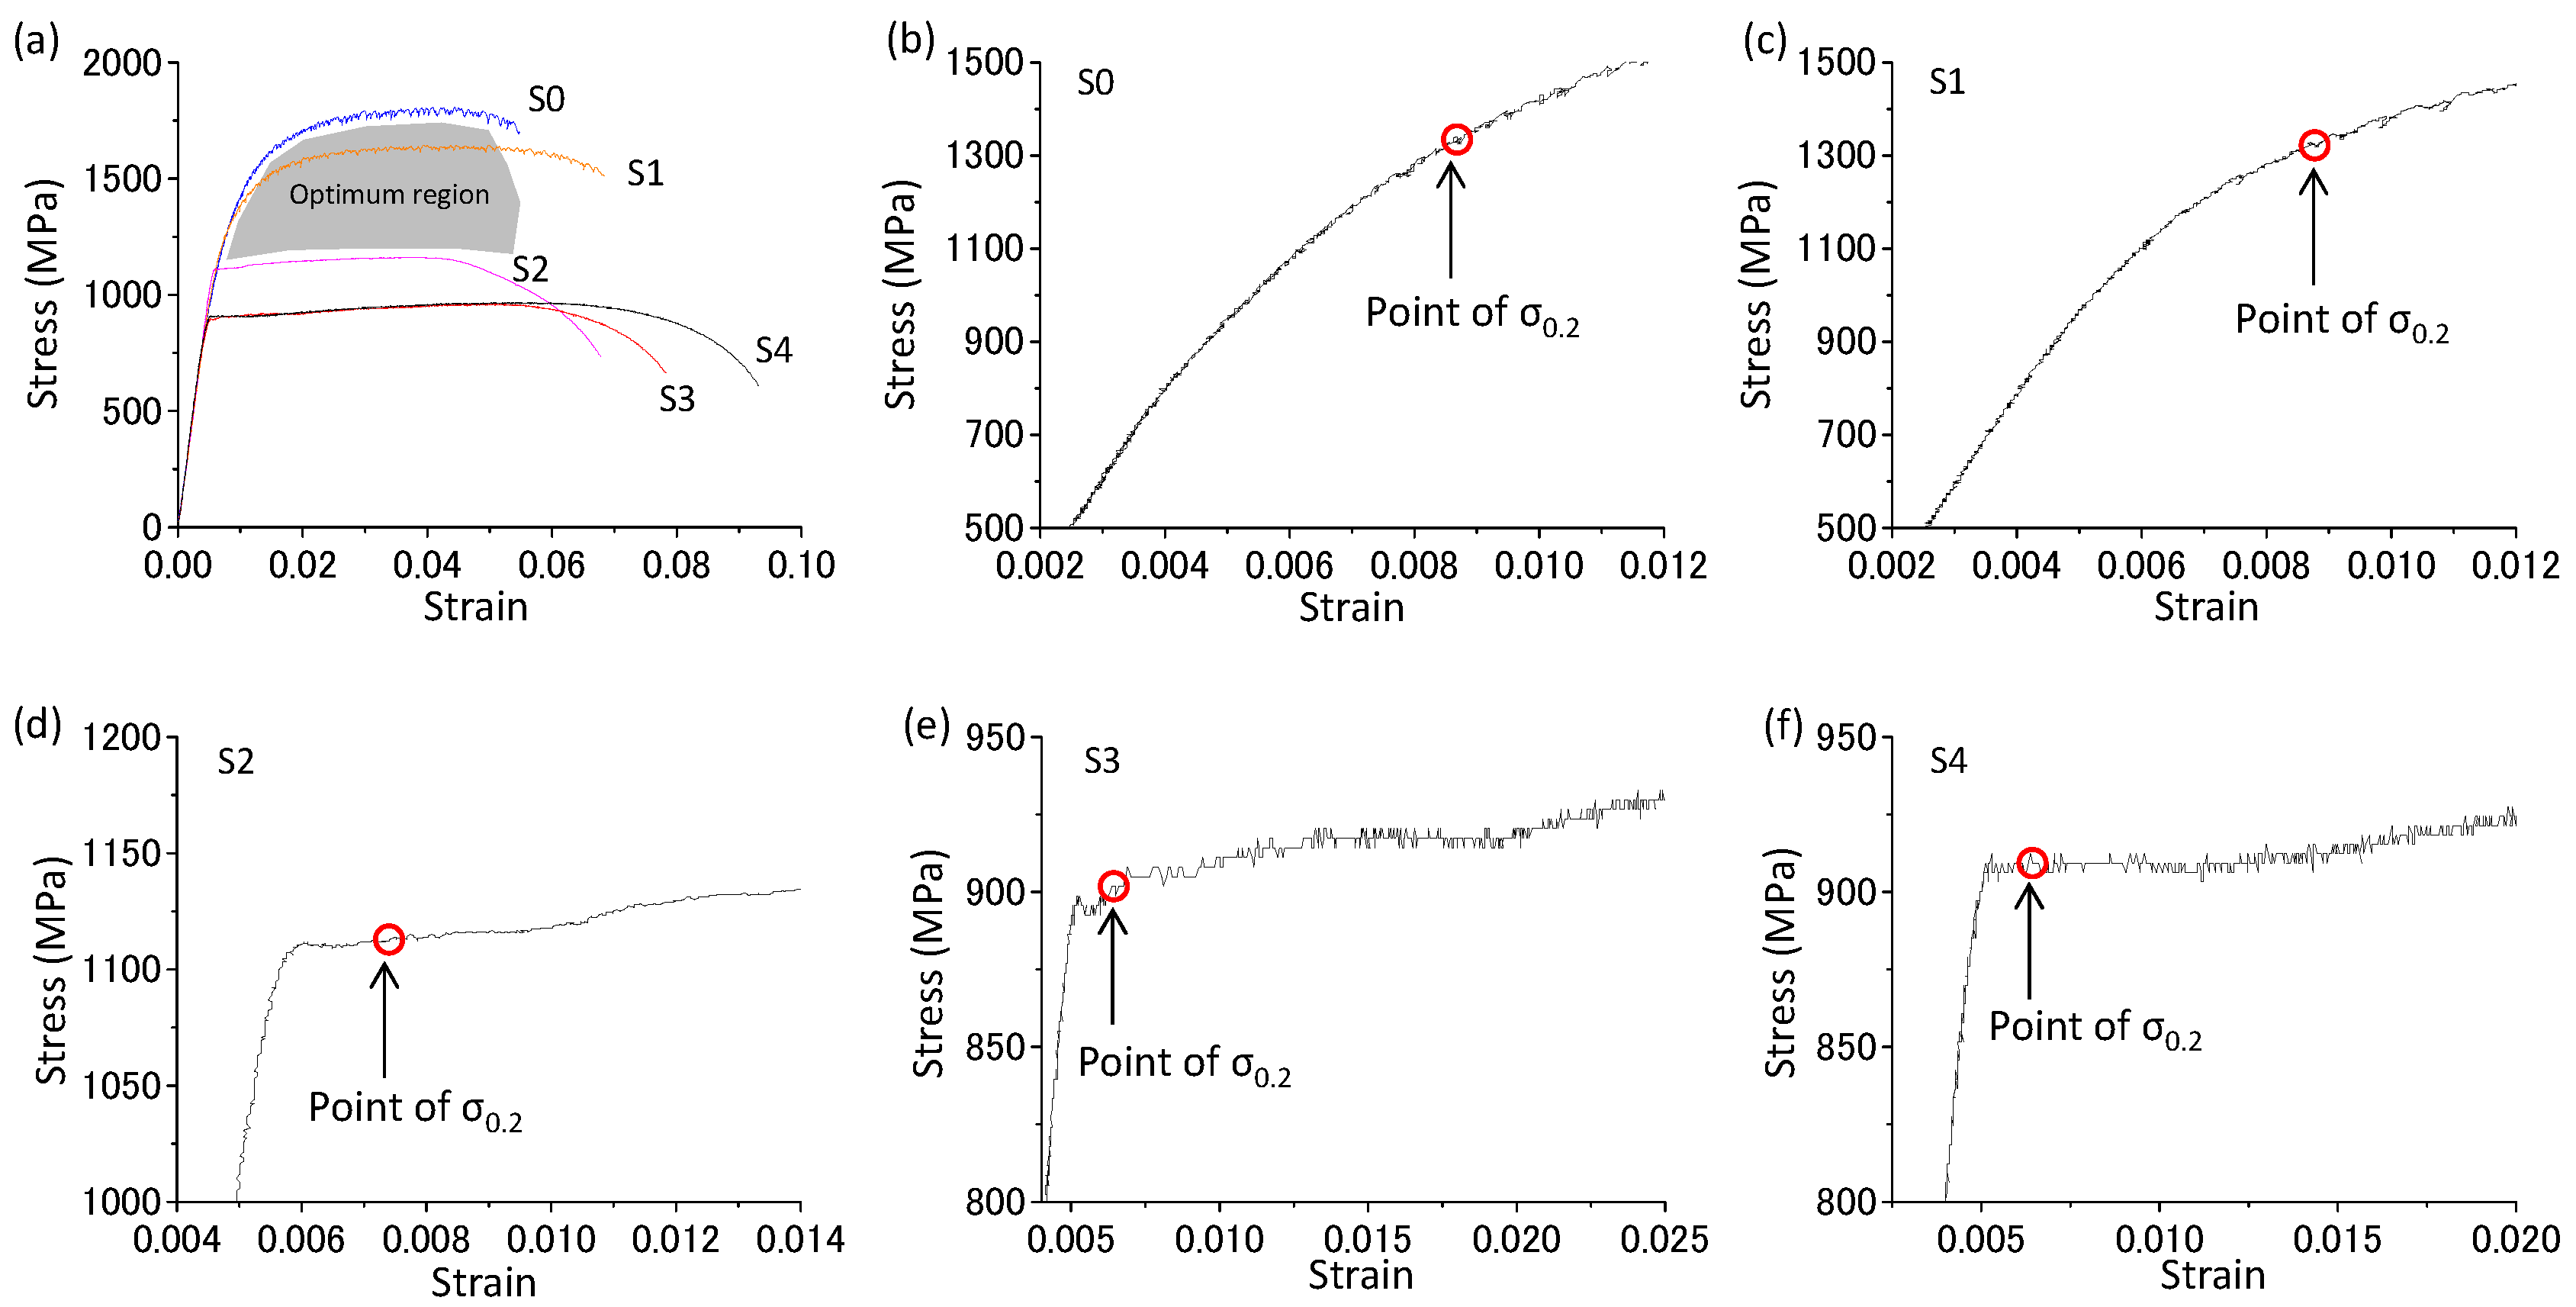
The response of global deformation to applied force is expressed in terms of the stress–strain curve. The stress–strain curves of the S0~S4 samples are shown in Figure 10a. The strain in Figure 10a was measured with the extensometer attached to the back surface of the tensile specimen, and it is an average value over the length of 30 mm. This average strain reflects the global deformation behavior. By comparing the stress–strain curves of the five samples, the strength was found to decrease, while the fracture strain increased from the S0 to S4 samples. According to the Bailey–Hirsch equation, the strength linearly varies with (, the dislocation density) [40]. An increase in the dislocation density increases the strength. The trend of strength among the S0~S4 samples agrees with the amount of the initial dislocation density in those samples. The shapes of the five stress–strain curves beyond the elastic deformation region also differ. This indicates that the five samples have different work-hardening abilities. S0 and S1 samples have higher work-hardening abilities while the work-hardening ability is low in the S2~S4 samples, which is attributed to the difference in the dislocation density. To clearly show the region of transition from the elastic state to the plastic state, the stress–strain curves are enlarged around the point of 0.2% proof stress in Figure 10b–f. A clear yield plateau is present in Figure 10f. This indicates that the Lüders deformation occurred in the S4 sample. However, in addition to that, detailed information on the deformation, for example, plastic band formation and propagation, is unavailable from the stress–strain curve. The local deformation behavior in the S0~S4 samples will be investigated by DIC analysis in the following section.
3.3. Local Plastic Deformation
Plastic strain localization is a feature of inhomogeneous plastic deformation. The plastic strain localization in the Lüders deformation is in the form of one plastic band or several plastic bands. The occurrence of the Lüders deformation phenomenon is judged by whether there is a plastic band. Previous studies [3,4,36] showed that the strain-rate field can effectively identify the moving plastic bands. In the present study, DIC analysis was performed to determine the strain-rate fields of the S0~S4 samples.
The inhomogeneous plastic deformation process can be expressed by the evolution of the strain-rate field. In Figure 11, the S4 sample is selected to show the whole process of the Lüders deformation. Nineteen points (①~⑲) that cross the yield plateau were selected. Point ① and point ⑲ are the starting point and end point of the yield plateau, respectively. The strain () along the x-direction (tension direction) and its strain rate () were determined. The strain-rate fields () over the parallel part of the tensile specimen (cf. Figure 6) at those points are shown in Figure 11. At point ①, the B1 band is formed. The B1 band continues to grow at point ②. At point ③, a branch band (B2) crossing the B1 band forms along a different direction. The B1 band gradually weakens from point ③, while the B2 band gradually grows from point ③ to point ⑤ and then weakens. At point ⑭, both B1 and B2 completely disappear. The positions of B1 and B2 hardly changed. This means that neither propagated.
B3 and B4 bands have formed at point ④. The B3 band grows from points ④~⑥, and then propagates to the left and right (⑦~⑪). The B4 band grows from points ④~⑦, and then degenerates from points ⑧~⑩. At point ⑫, the B5 band forms along another direction at the initial positions of the B3 and B4 bands. At point ⑬, a new band (B6 band) forms at the left side of the B5 band. The B7 band develops at point ⑮, and then propagates to the left side, and finally disappears at point ⑲.
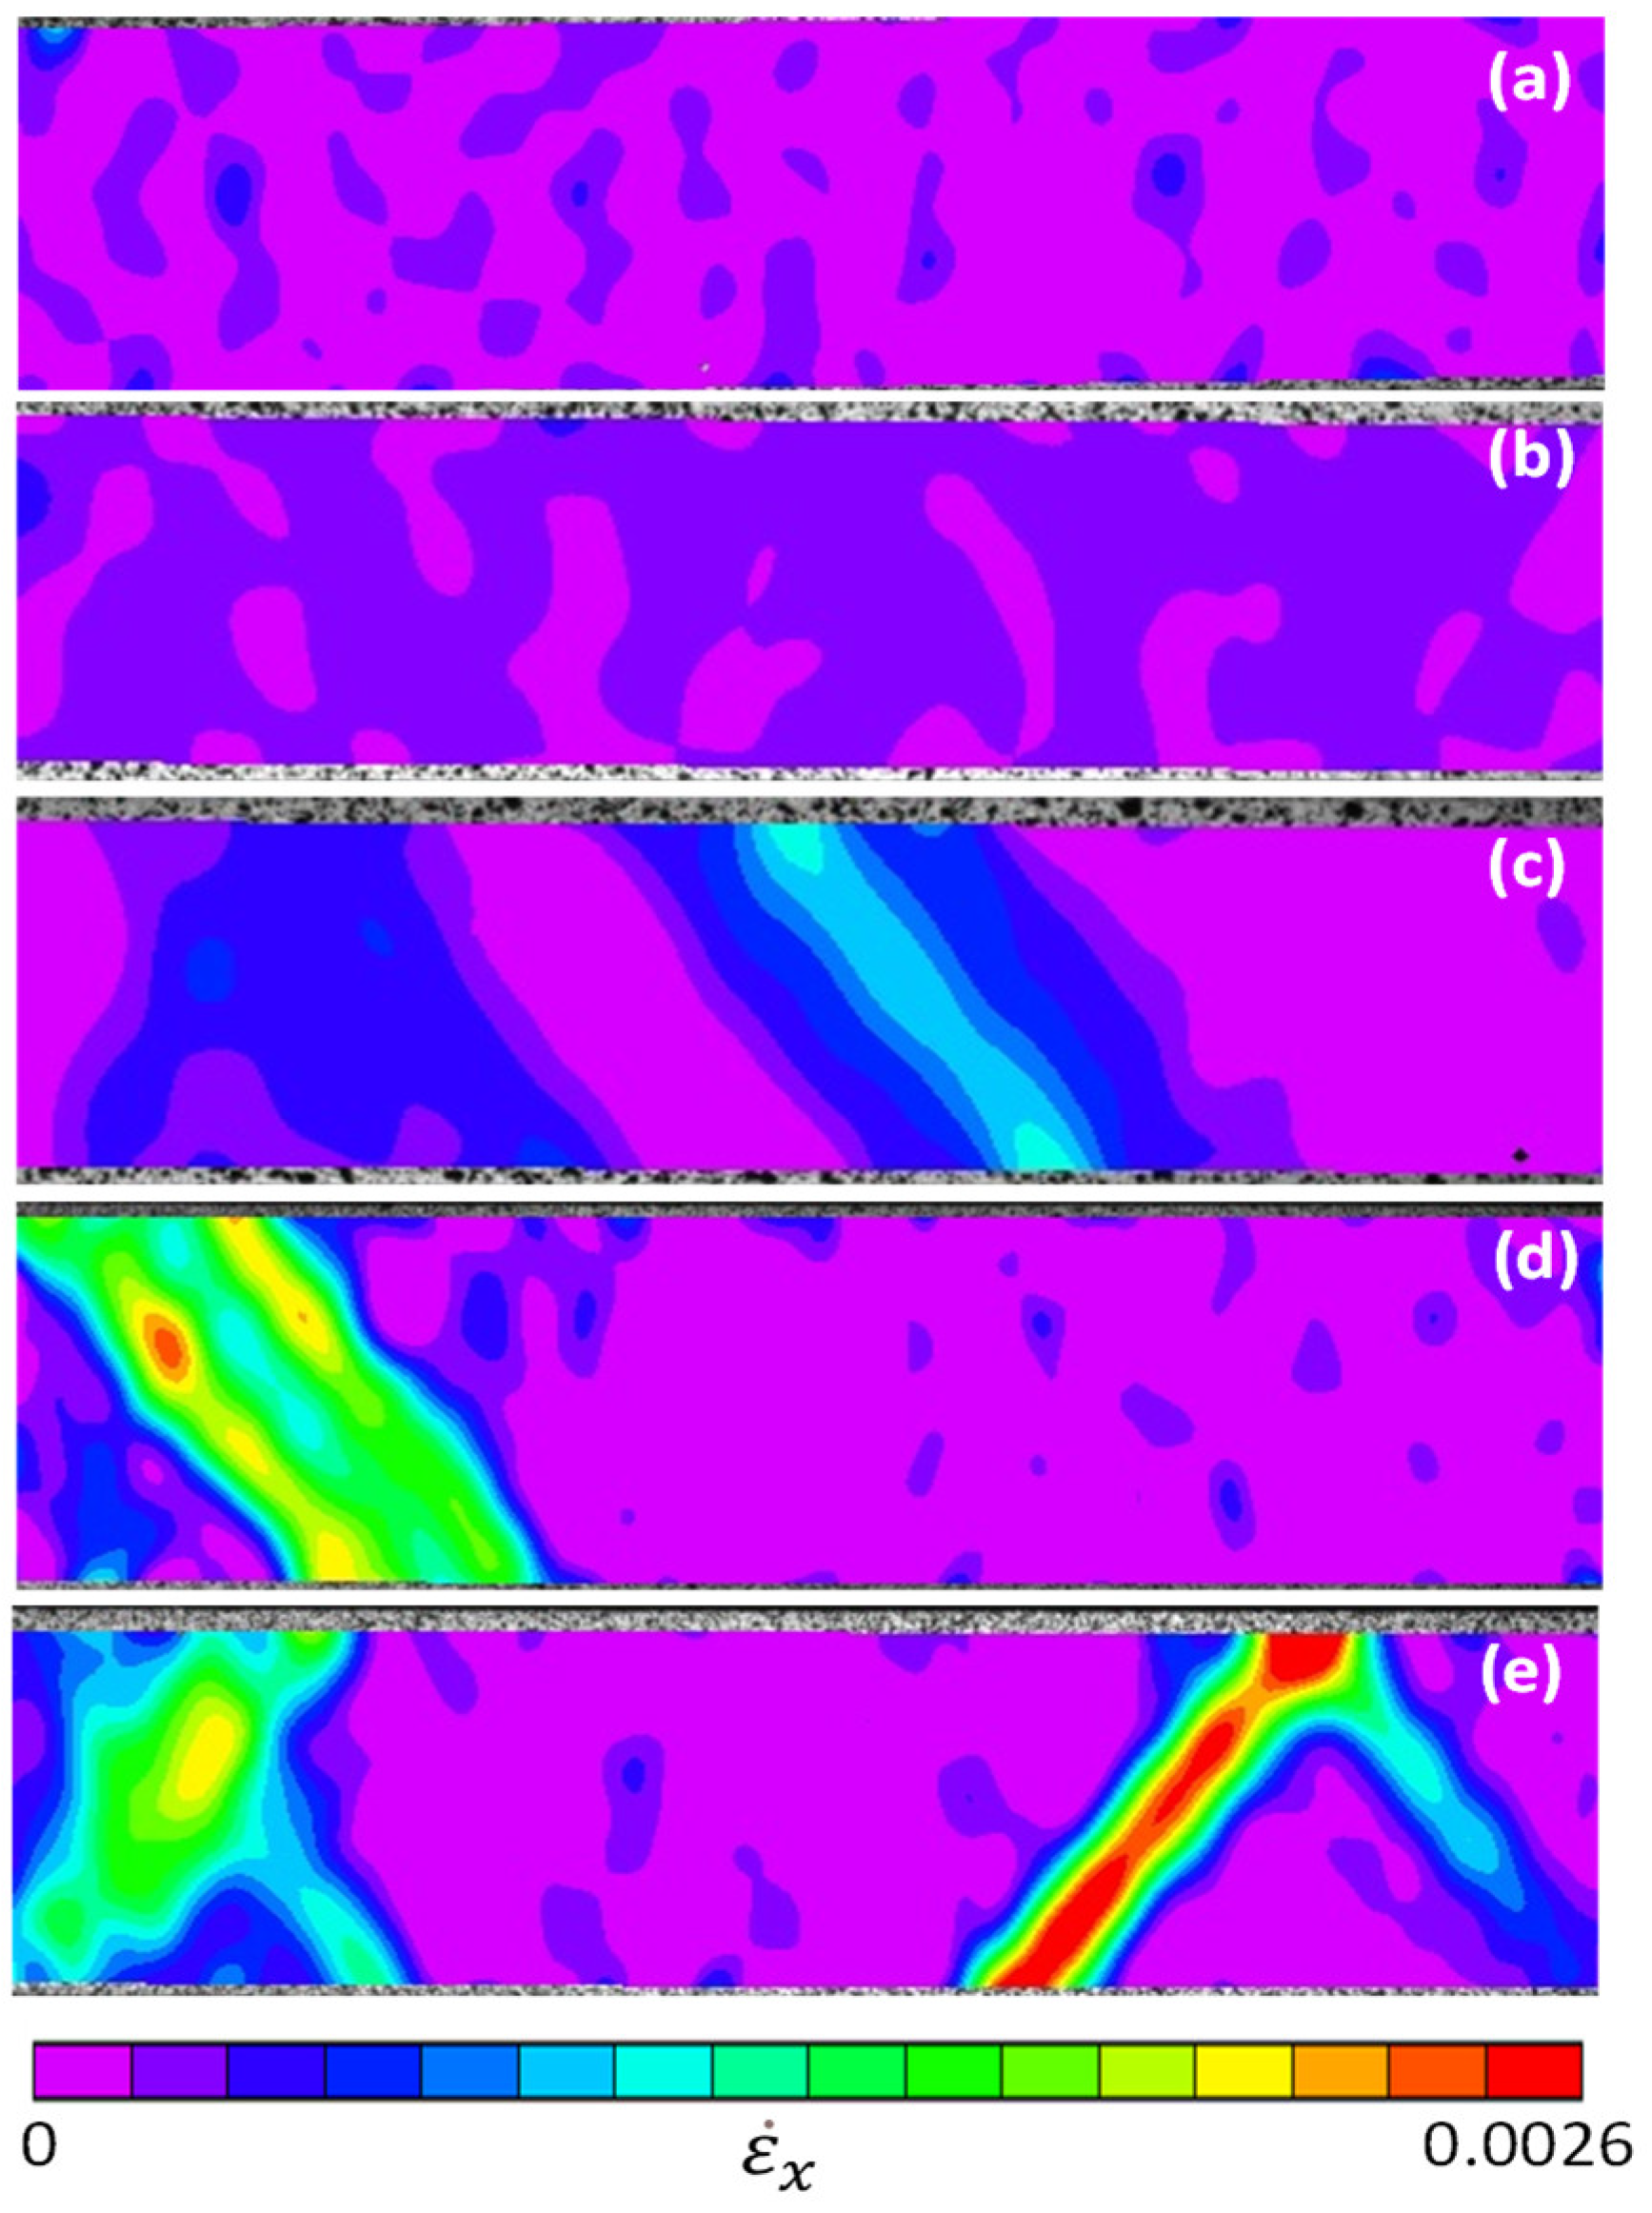
The strain-rate fields of other samples (S0, S1, S2 and S3) were also measured using the DIC technique. In a stress–strain curve, the point of 0.2% proof stress (σ0.2) is often used to evaluate the yielding ability. The σ0.2 of the S0~S4 samples was taken as a reference point, and the strain-rate fields of the five samples at σ0.2 are compared in Figure 12. It can be seen that plastic bands are present in the S2, S3, and S4 samples, while no plastic bands are found in the S0 and S1 samples. The average strain rate over the whole area shown in Figure 12 at σ0.2 was determined for the five samples and is given in Table 1. The maximum strain rate within the plastic bands is also measured. The maximum value in the plastic bands is one order larger than the average value over the whole area. It is noted that in addition to the point of σ0.2, plastic bands were not present at any point of the stress–strain curve in the S0 and S1 samples before the onset of specimen necking. Microstructure analysis shows that the S0~S4 samples have the same morphology but different dislocation densities. Figure 9 indicates that the S0 and S1 samples have higher initial dislocation densities. In Figure 8, red points show the sites of high local misorientation. From the S4 sample to S0 sample, the density of red points gradually increases, and their distribution is almost uniform. Those massive red points can easily provide sufficient micro-yielding sites; as a result, plastic bands are suppressed. As shown in Figure 10b–f, the shapes of the stress–strain curves in the elastic-to-plastic transition region are different; the S0 and S1 samples have round curves and the S2~S4 samples have flat curves. This shape variation is dependent on the occurrence of the Lüders phenomenon.
The optimal material behavior for the steel used was judged by a standard: a good balance of strength and ductility as well as no Lüders phenomenon. The shaded region in Figure 10a meets the standard. Apparently, the S1 sample has the best material behavior among the five samples. The heat-treatment conditions corresponding to the shaded region are the optimal ones.
As shown in Figure 1a, the Lüders strain () represents the length of the Lüders deformation process. When the Lüders strain is equal to zero, the Lüders deformation phenomenon completely disappears. Tsuchida et al. carried out an extensive study on the Lüders strain under different test conditions [6,11]. These experimental data were obtained from different steels (i.e., different chemical compositions and grain sizes) and under different tensile conditions, such as test temperature and strain rate. Those steels are mainly composed of ferrite. They proposed a model in which the Lüders strain, , is a function of a parameter, the work-hardening rate at the lower yield stress (LYS), (where is the true stress, and is the true strain).
where constant k is 8000 MPa. Equation (1) is a single parameter model. By using it, the can be conveniently determined as long as the work-hardening rate is known, irrespective of test condition and microstructure (chemical composition, grain size). In fact, this model delicately integrates the effects of grain size, strain rate, temperature, and carbon content on the Lüders strain. An increase in the work-hardening rate decreases the Lüders strain. A similar conclusion was obtained by Cai et al., that high work-hardening ability favors the inhibition of the Lüders band [30]. When the work-hardening rate is big enough, the Lüders strain approaches zero, i.e., the Lüders deformation phenomenon will disappear. The work-hardening rate is the gradient of a true stress–true strain curve. Although the curves in Figure 10 are nominal stress–strain curves, not true stress–strain curves, their gradients can be used to compare the trend of the work-hardening rate among the five samples. Figure 10b–f can qualitatively examine this inverse relation between the Lüders strain and the work-hardening rate: the work-hardening rates of the S0 and S1 samples in which Lüders deformation phenomenon is not present are much higher than those of the S2~S4 samples.
4. Conclusions
Five types of martensite phases with the same morphology but different initial dislocation densities were produced by tempering. Their plastic deformation behaviors were investigated using the DIC technique. The results obtained regarding the inhomogeneous plastic deformation (i.e., the Lüders deformation) of tempered martensite were as follows:
- (1)
- The amount of micro-yielding sites can be increased by increasing the initial dislocation density. When the initial dislocation density is high enough, the Lüders deformation can be suppressed.
- (2)
- Among the five samples, the S1 sample has the best behavior; it has a good balance of strength and ductility and no Lüders deformation phenomenon. The heat-treatment conditions between S0 and S2 are the optimal region for balancing the mechanical property and deformation behavior.
- (3)
- The Lüders deformation phenomenon is related to the work-hardening rate. Increasing the work-hardening rate is good for suppressing the Lüders deformation.
Author Contributions
Conceptualization, H.Q., R.U. and T.I.; methodology, H.Q.; software, H.Q.; validation, H.Q., R.U. and T.I.; formal analysis, H.Q.; investigation, H.Q.; resources, H.Q. and R.U.; data curation, H.Q.; writing—original draft preparation, H.Q.; writing—review and editing, H.Q., R.U. and T.I.; visualization, H.Q.; supervision, H.Q. All authors have read and agreed to the published version of the manuscript.
Funding
This research was partly funded by the Technical Research Aid of the JFE 21st Century Foundation.
Data Availability Statement
The data presented in this study are available on request from the corresponding author. The data are not publicly available due to legal reasons.
Conflicts of Interest
The authors declare no conflicts of interest.
References
- Piobert, A. Expériences sur la pénétration des projectiles dans le fer forgé. Mémoire L’artillerie 1842, 5, 502. [Google Scholar]
- Lüders, W. Uber die äeuerung der elasticität an stahlartigen eisenstäben und stahlstäben, und über eine beim biegen solcher stäbe beobachtete molecularbewegung. Dingler’s Polytech. J. 1860, 155, 18–22. [Google Scholar]
- Qiu, H.; Inoue, T.; Ueji, R. Experimental measurement of the variables of Lüders deformation in hot-rolled steel via digital image correlation. Mater. Sci. Eng. A 2020, 790, 139756. [Google Scholar] [CrossRef]
- Qiu, H.; Inoue, T.; Ueji, R. In-situ observation of Lüders band formation in hot-rolled steel via digital image correlation. Metals 2020, 10, 530. [Google Scholar] [CrossRef]
- Van Rooyen, G.T. Basic factors which influence the Lüders strain during discontinuous yielding. Mater. Sci. Eng. 1971, 7, 37–48. [Google Scholar] [CrossRef]
- Tsuchida, N.; Masuda, H.; Harada, Y.; Fukaura, K.; Tomota, Y.; Nagai, K. Effect of ferrite grain size on tensile deformation behavior of a ferrite-cementite low carbon steel. Mater. Sci. Eng. A 2008, 488, 446–452. [Google Scholar] [CrossRef]
- Zhang, Y.; Ding, H.; Zhu, H.K.; Zhou, X.D.; Zhang, Y.T.; Jia, N.; Zhang, N.X. Influence of microstructural morphology on the continuous/discontinuous yielding behavior in a medium manganese steel. Mater. Sci. Eng. A 2021, 824, 141746. [Google Scholar] [CrossRef]
- Hu, B.; Ding, F.L.; Tu, X.; Guo, Q.Y.; Ding, C.C.; Wang, Y.; Luo, H.W. Influence of lamellar and equiaxed microstructural morphologies on yielding behavior of a medium Mn steel. Materialia 2021, 20, 101252. [Google Scholar] [CrossRef]
- Lloyd, D.J.; Morris, L.R. Lüders band deformation in a fine grained aluminium alloy. Acta Metall. 1977, 25, 857–861. [Google Scholar] [CrossRef]
- Delwiche, D.E.; Moon, D.W. Strain profile of a propagating Lüders front. Mater. Sci. Eng. 1972, 9, 347–354. [Google Scholar] [CrossRef]
- Tsuchida, N.; Tomota, Y.; Nagai, K.; Fukaura, K. A simple relationship between Lüders elongation and work-hardening rate at lower yield stress. Scr. Mater. 2006, 54, 57–60. [Google Scholar] [CrossRef]
- El-Magd, E.; Scholles, H.; Weisshaupt, H. Influence of strain rate on the stress–strain curve in the range of Lüders strain. Steel Res. 1996, 67, 495–500. [Google Scholar] [CrossRef]
- VanRooyen, G.T. The stress and strain distribution in a propagation Lüders front accompanying the yield-point phenomenon in iron. Mater. Sci. Eng. 1968, 3, 105–117. [Google Scholar] [CrossRef]
- Cai, Y.L.; Yang, S.L.; Fu, S.H.; Zhang, Q.C. The influence of specimen thickness on the Lüders effect of a 5456 Al-based alloy: Experimental observations. Metals 2016, 6, 120. [Google Scholar] [CrossRef]
- Zhang, M.H.; Li, L.F.; Ding, J.; Wu, Q.B.; Wang, Y.D.; Almer, J.; Guo, F.M.; Ren, Y. Temperature-dependent micromechanical behavior of medium-Mn transformation-induced-plasticity steel studied by in situ synchrotron X-ray diffraction. Acta Mater. 2017, 141, 294–303. [Google Scholar] [CrossRef]
- Cottrell, A.H.; Bilby, B.A. Dislocation theory of yielding and strain ageing of iron. Phys. Soc. 1949, 62, 49–62. [Google Scholar] [CrossRef]
- Cottrell, A.H. A note on the Portevin-Le Chatelier effect. Lond. Edinb. Dublin Philos. Mag. J. Sci. 1953, 44, 829–832. [Google Scholar] [CrossRef]
- Marais, A.; Mazière, M.; Forest, S.; Parrot, A.; Le Delliou, P. Identification of a strain-aging model accounting for Lüders behavior in a C-Mn steel. Philos. Mag. 2012, 92, 3589–3617. [Google Scholar] [CrossRef]
- Wang, X.G.; Wang, L.; Huang, M.X. Kinematic and thermal characteristics of Lüders and Portevin-Le Chatelier bands in a medium Mn transformation-induced plasticity steel. Acta Mater. 2017, 124, 17–29. [Google Scholar] [CrossRef]
- Tsukahara, H.; Iung, T. Finite element simulation of the Piobert–Lüders behavior in an uniaxial tensile test. Mater. Sci. Eng. A 1998, 248, 304–308. [Google Scholar] [CrossRef]
- Onodera, R.; Nonomura, M.; Aramaki, M. Stress drop, Lüders strain and strain rate during serrated flow. J. Jpn. Inst. Met. 2000, 64, 1162–1171. [Google Scholar] [CrossRef]
- Hahn, G.T. A model for yielding with special reference to the yield-point phenomena of iron and related BCC metals. Acta Metall. 1962, 10, 727–738. [Google Scholar] [CrossRef]
- Ikeda, S.; Makii, K.; Shindo, Y.; Miura, M.; Hashimoto, S. The effect of precipitates on the plastic deformation behavior in high tensile strength IF sheet steels. Res. Dev. Kobe Steel Eng. Rep. 2002, 52, 39–42. [Google Scholar]
- Grassino, J.; Vedani, M.; Vimercati, G.; Zanella, G. Effects of skin pass rolling parameters on mechanical properties of steels. Int. J. Prec. Eng. Manufac. 2012, 13, 2017–2026. [Google Scholar] [CrossRef]
- Han, J.; Kang, S.-H.; Lee, S.-J.; Lee, Y.-K. Fabrication of bimodal-grained Al-free medium Mn steel by double intercritical annealing and its tensile properties. J. Alloys Compd. 2016, 681, 580–588. [Google Scholar] [CrossRef]
- Mohsenzadeh, M.S.; Mazinani, M. On the yield point phenomenon in low-carbon steels with ferrite-cementite microstructure. Mater. Sci. Eng. A 2016, 673, 193–203. [Google Scholar] [CrossRef]
- Liang, Z.Y.; Cao, Z.H.; Lu, J.; Huang, M.X.; Tasan, C.C. Influence of co-existing medium Mn and dual phase steel microstructures on ductility and Lüders band formation. Acta Mater. 2021, 221, 117418. [Google Scholar] [CrossRef]
- Mao, W.Q.; Gao, S.; Gong, W.; Harjo, S.; Kawasaki, T.; Tsuji, N. Quantitatively evaluating the huge Lüders band deformation in an ultrafine grain stainless steel by combining in situ neutron diffraction and digital image correlation analysis. Scripta Mater. 2023, 235, 115642. [Google Scholar] [CrossRef]
- Yin, W.J.; Briffod, F.; Hu, H.Y.; Yamazaki, K.; Shiraiwa, T.; Enoki, M. Quantitative investigation of strain partitioning and failure mechanism in ultrafine grained medium Mn steel through high resolution digital image correlation. Scripta Mater. 2023, 229, 115386. [Google Scholar] [CrossRef]
- Cai, Z.H.; Jing, S.Y.; Li, H.Y.; Zhang, K.M.; Misra, R.D.K.; Ding, H.; Tang, Z.Y. The influence of microstructural characteristics on yield point elongation phenomenon in Fe-0.2C-11Mn-2Al steel. Mater. Sci. Eng. A 2019, 739, 17–25. [Google Scholar] [CrossRef]
- Zhan, Z.D.; Shi, Z.G.; Wang, Z.M.; Lu, W.J.; Chen, Z.N.; Zhang, D.; Chai, F.; Luo, X.B. Effect of manganese on the strength–toughness relationship of low-carbon copper and nickel-containing hull steel. Materials 2024, 17, 1012. [Google Scholar] [CrossRef]
- Sugimoto, K.; Shioiri, S.; Kobayashi, J. Effects of mean normal stress on strain-hardening, strain-induced martensite transformation, and void-formation behaviors in high-strength TRIP-aided steels. Metals 2024, 14, 61. [Google Scholar] [CrossRef]
- Benzing, J.T.; Luecke, W.E.; Mates, S.P.; Ponge, D.; Raabe, D.; Wittig, J.E. Intercritical annealing to achieve a positive strain-rate sensitivity of mechanical properties and suppression of macroscopic plastic instabilities in multi-phase medium-Mn steels. Mater. Sci. Eng. A 2021, 803, 140469. [Google Scholar] [CrossRef]
- Liu, R.D.; Hu, Z.P.; Lin, C.Q.; Yang, D.P.; Gu, X.L.; Xu, X.; Guo, J.Y. A novel design to eliminate Lüders band in medium-Mn steel and its microstructure-property relationship. Crystals 2023, 13, 936. [Google Scholar] [CrossRef]
- Ma, J.W.; Lu, Q.; Sun, L.; Shen, Y. Two-step intercritical annealing to eliminate Lüders band in a strong and ductile medium Mn Steel. Metall. Mater. Trans. A 2018, 49, 4404–4408. [Google Scholar] [CrossRef]
- Qiu, H.; Ueji, R.; Inoue, T.; Kimura, Y. Plastic instability in medium-carbon tempered martensite steel. Materials 2021, 14, 4609. [Google Scholar] [CrossRef]
- Zhang, J.; Huang, M.X.; Sun, B.H.; Zhang, B.N.; Ding, R.; Luo, C.; Zeng, W.; Zhang, C.; Yang, Z.G.; van der Zwaag, S.; et al. Critical role of Lüders banding in hydrogen embrittlement susceptibility of medium Mn steels. Scr. Mater. 2021, 190, 32–37. [Google Scholar] [CrossRef]
- Ozerov, M.; Sokolovsky, V.; Yurchenko, N.; Astakhov, I.; Povolyaeva, E.; Plekhov, O.; Tagirov, D.; Stepanov, N.; Zherebtsov, S. Effect of cold rolling on microstructure and mechanical properties of a cast TiNbZr-based composite reinforced with borides. Metals 2024, 14, 104. [Google Scholar] [CrossRef]
- Yi, Y.X.; Yin, F.; Zhai, J.J.; Liu, Y.X. Microstructure evolution and numerical modeling of TC4 titanium alloy during ultrasonic shot peening process. Metals 2024, 14, 275. [Google Scholar] [CrossRef]
- Kato, M. Introduction to the Theory of Dislocations; Shokabo: Tokyo, Japan, 2003; p. 120. [Google Scholar]
Figure 1.
Exhibition of Lüders deformation on the stress–strain curve (a), and schematic illustration of the Lüders deformation process (b).
Figure 1.
Exhibition of Lüders deformation on the stress–strain curve (a), and schematic illustration of the Lüders deformation process (b).
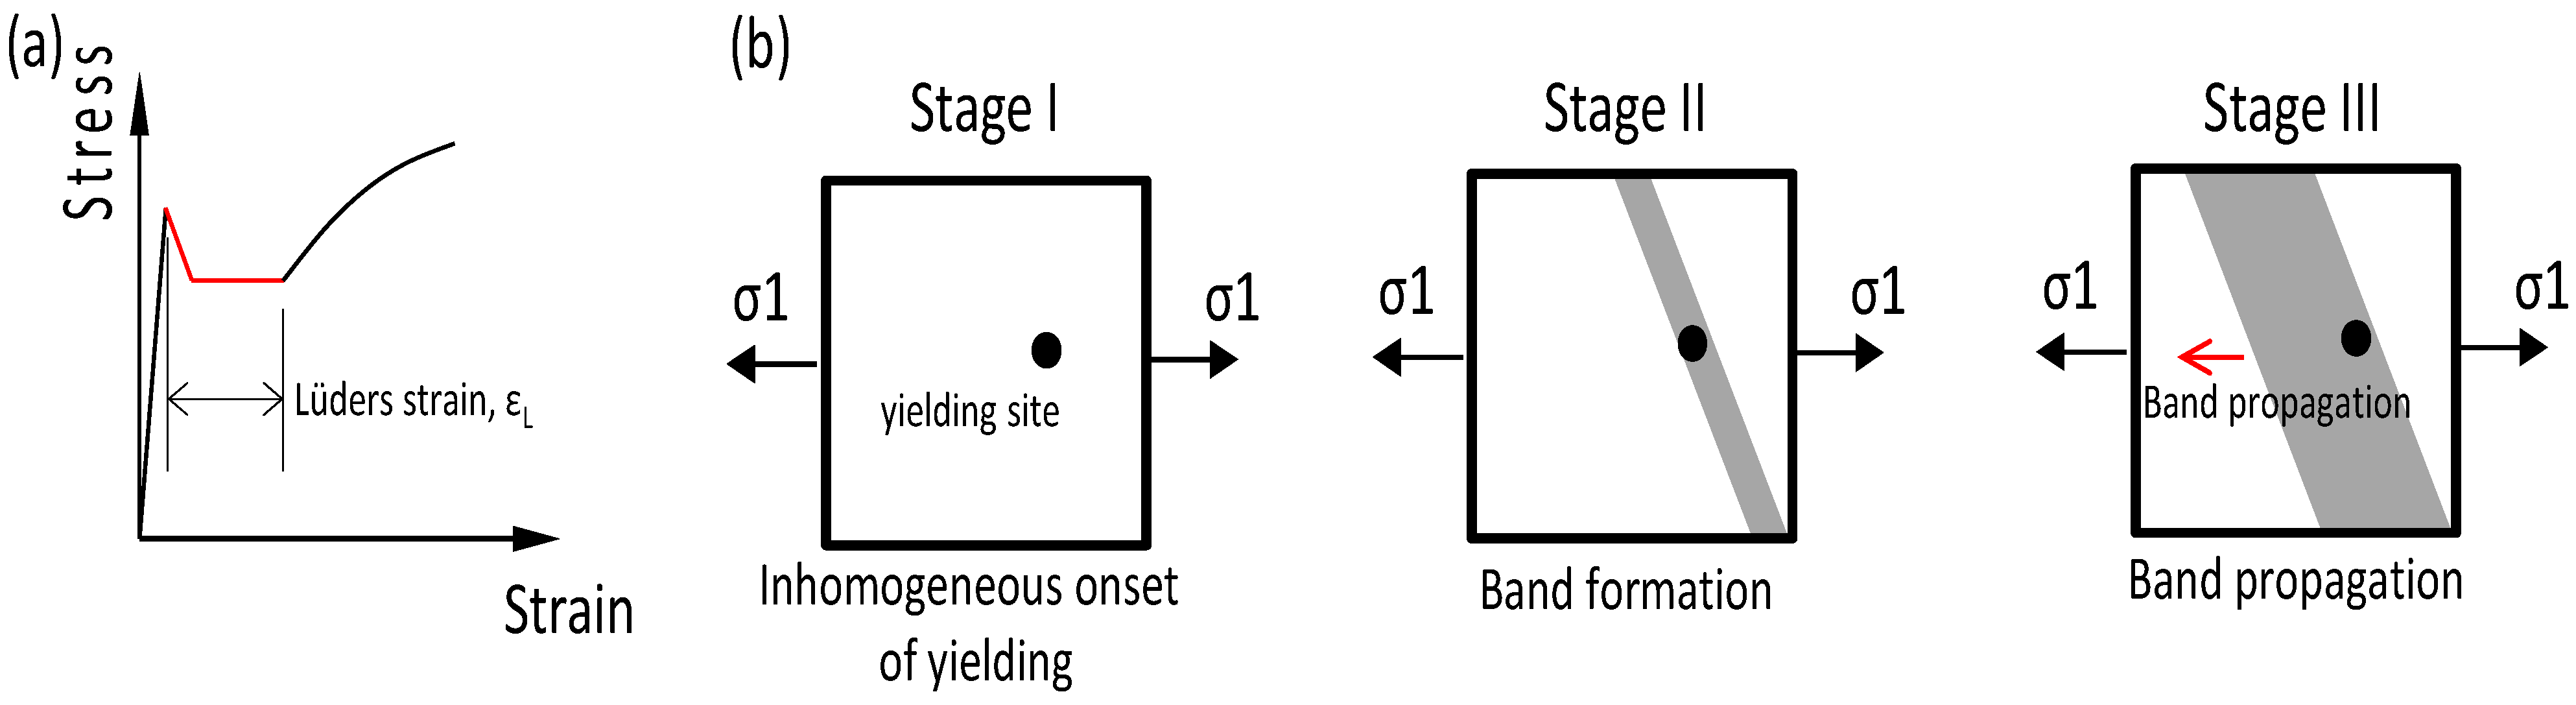
Figure 2.
Two conventional engineering methods for suppressing the Lüders phenomenon.
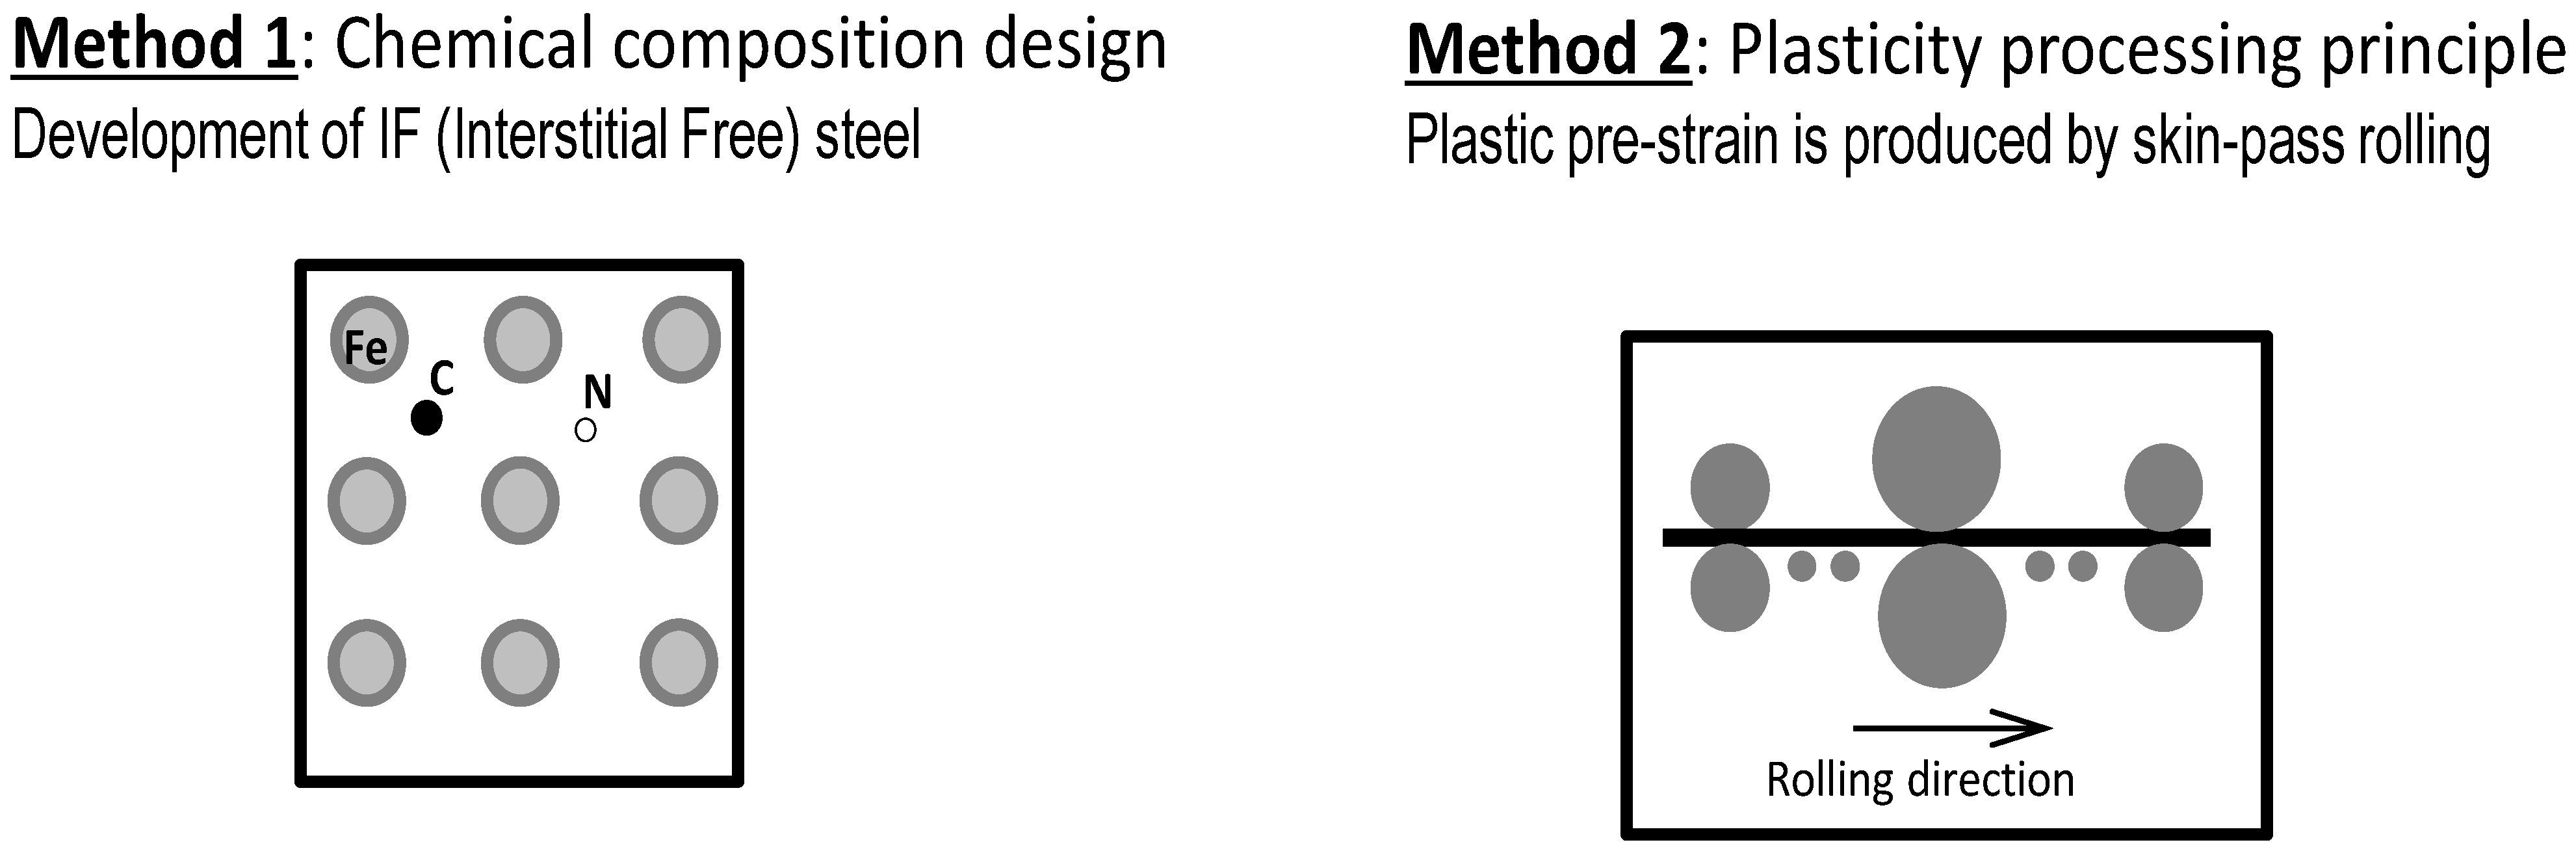
Figure 3.
Stress–strain curves of two tension tests of a medium-carbon tempered martensite steel (Fe-0.3C-1.5Mn) (adapted from Ref. [36]).
Figure 3.
Stress–strain curves of two tension tests of a medium-carbon tempered martensite steel (Fe-0.3C-1.5Mn) (adapted from Ref. [36]).
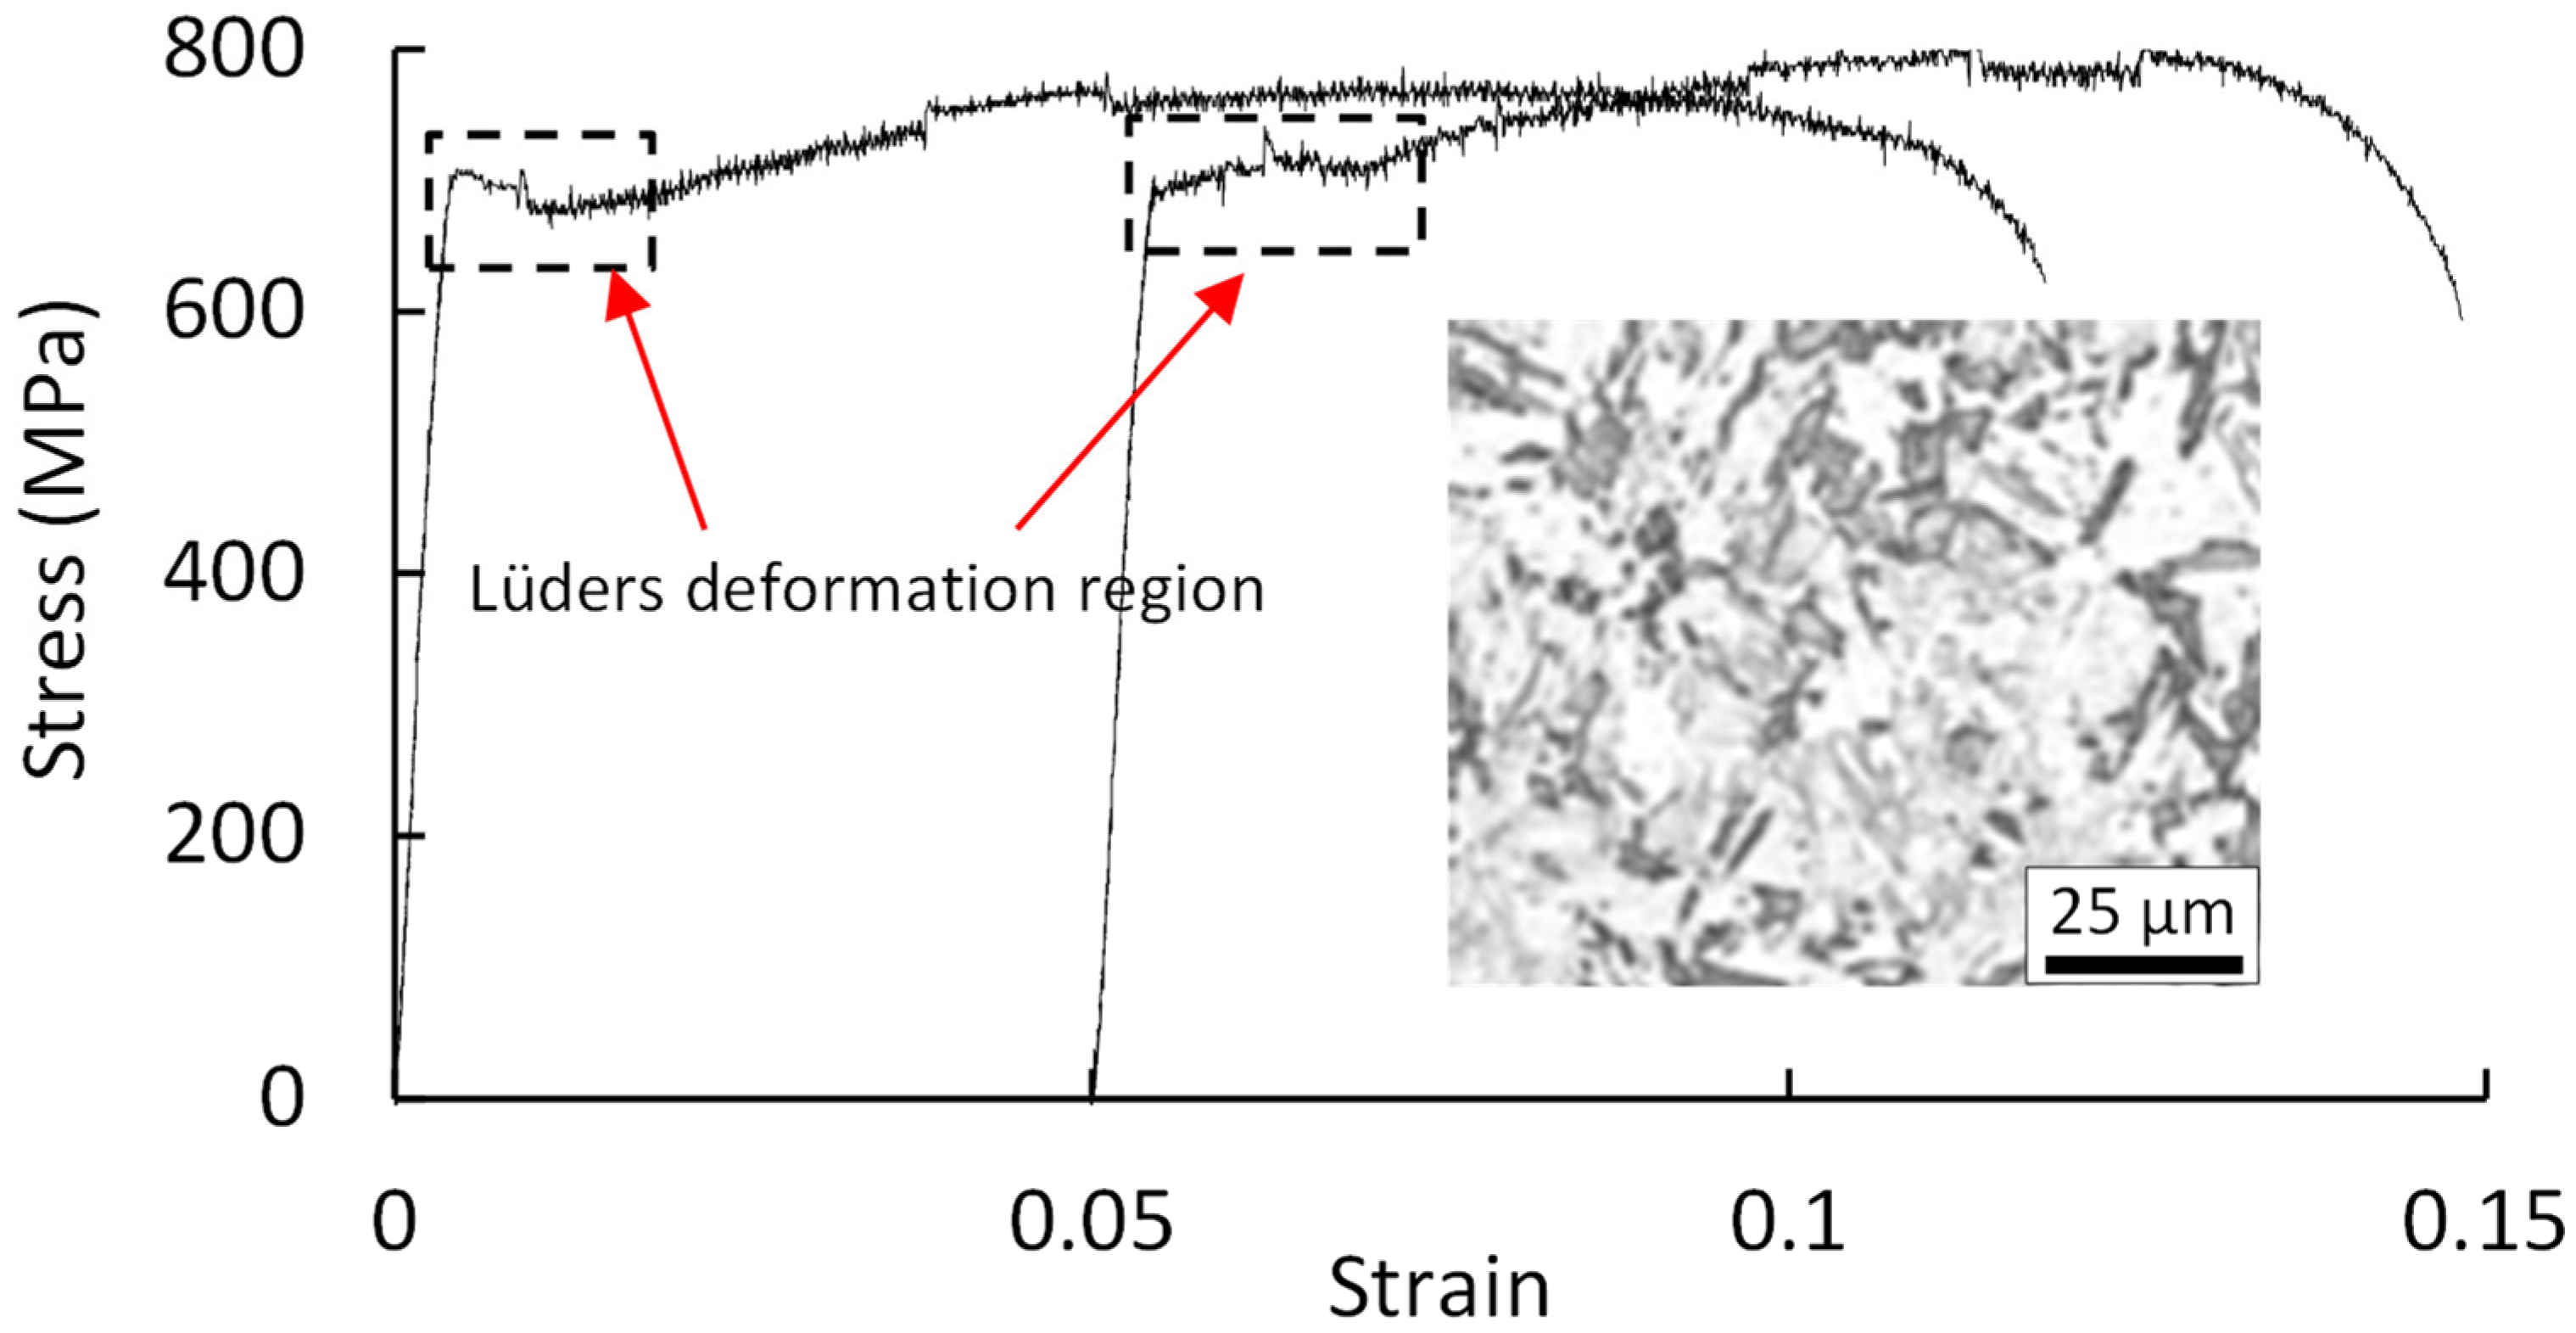
Figure 4.
Concept of suppressing inhomogeneous plastic deformation.
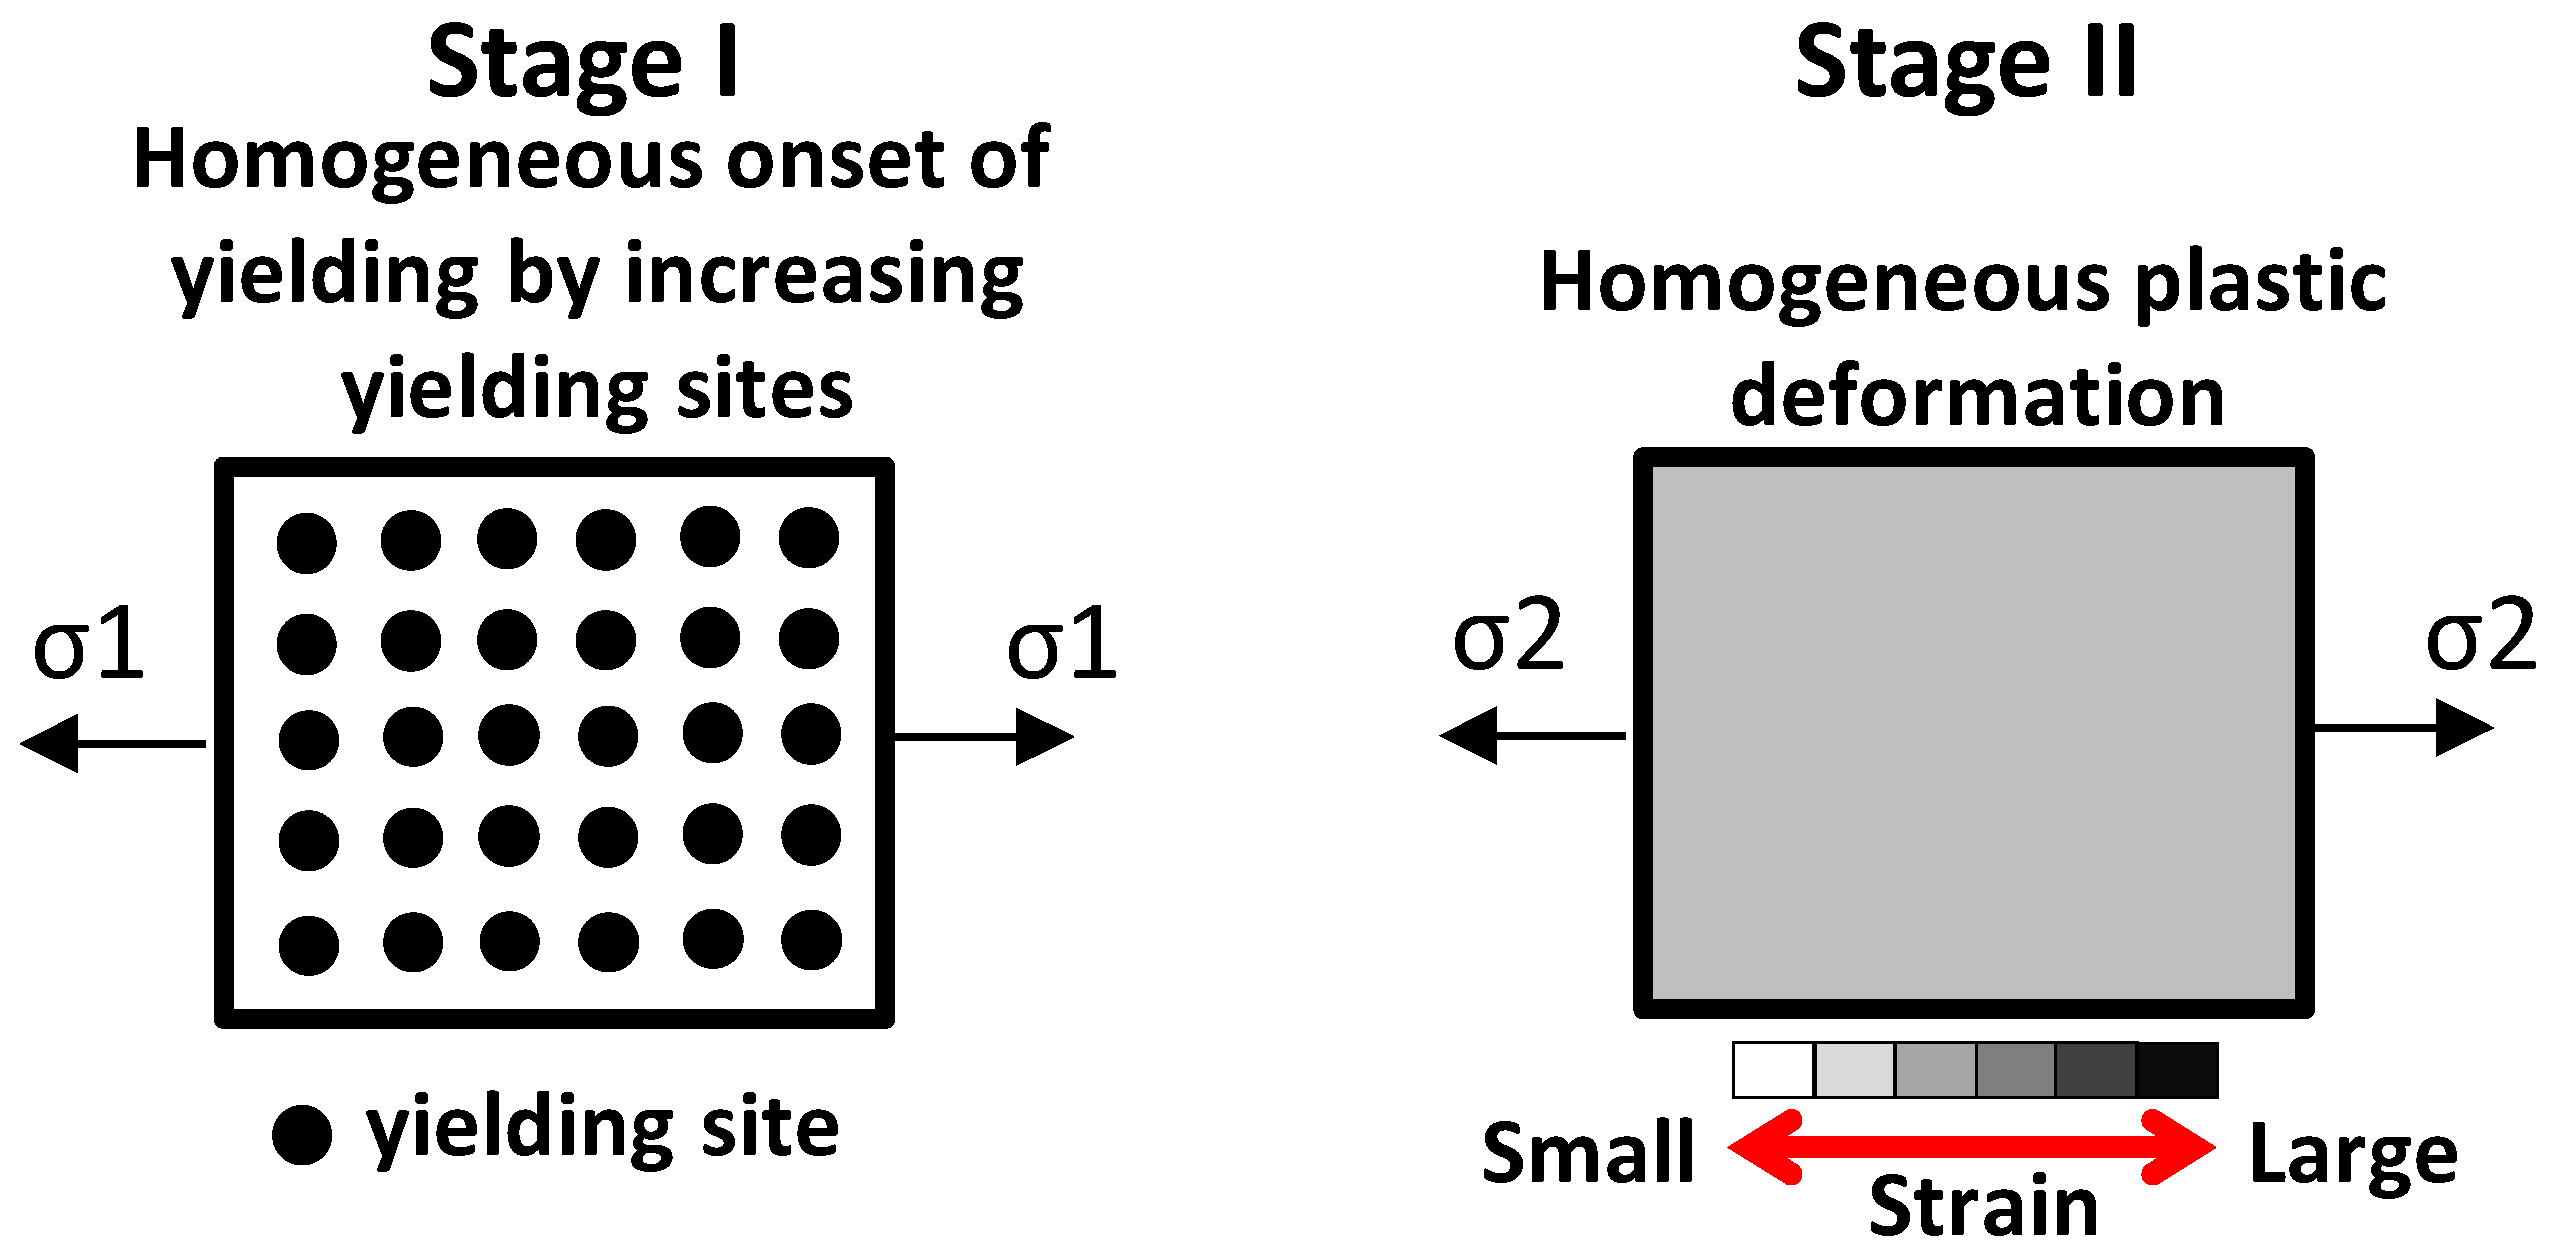
Figure 5.
Heat-treatment processes (black lines) and obtained samples (S0~S4). A reference heat treatment (dotted red lines) is given (adapted from Ref. [36]).
Figure 5.
Heat-treatment processes (black lines) and obtained samples (S0~S4). A reference heat treatment (dotted red lines) is given (adapted from Ref. [36]).
Figure 6.
The size of the dog-bone-type specimen and the spackle patterns on the front surface of the specimen. x, tension direction.
Figure 6.
The size of the dog-bone-type specimen and the spackle patterns on the front surface of the specimen. x, tension direction.
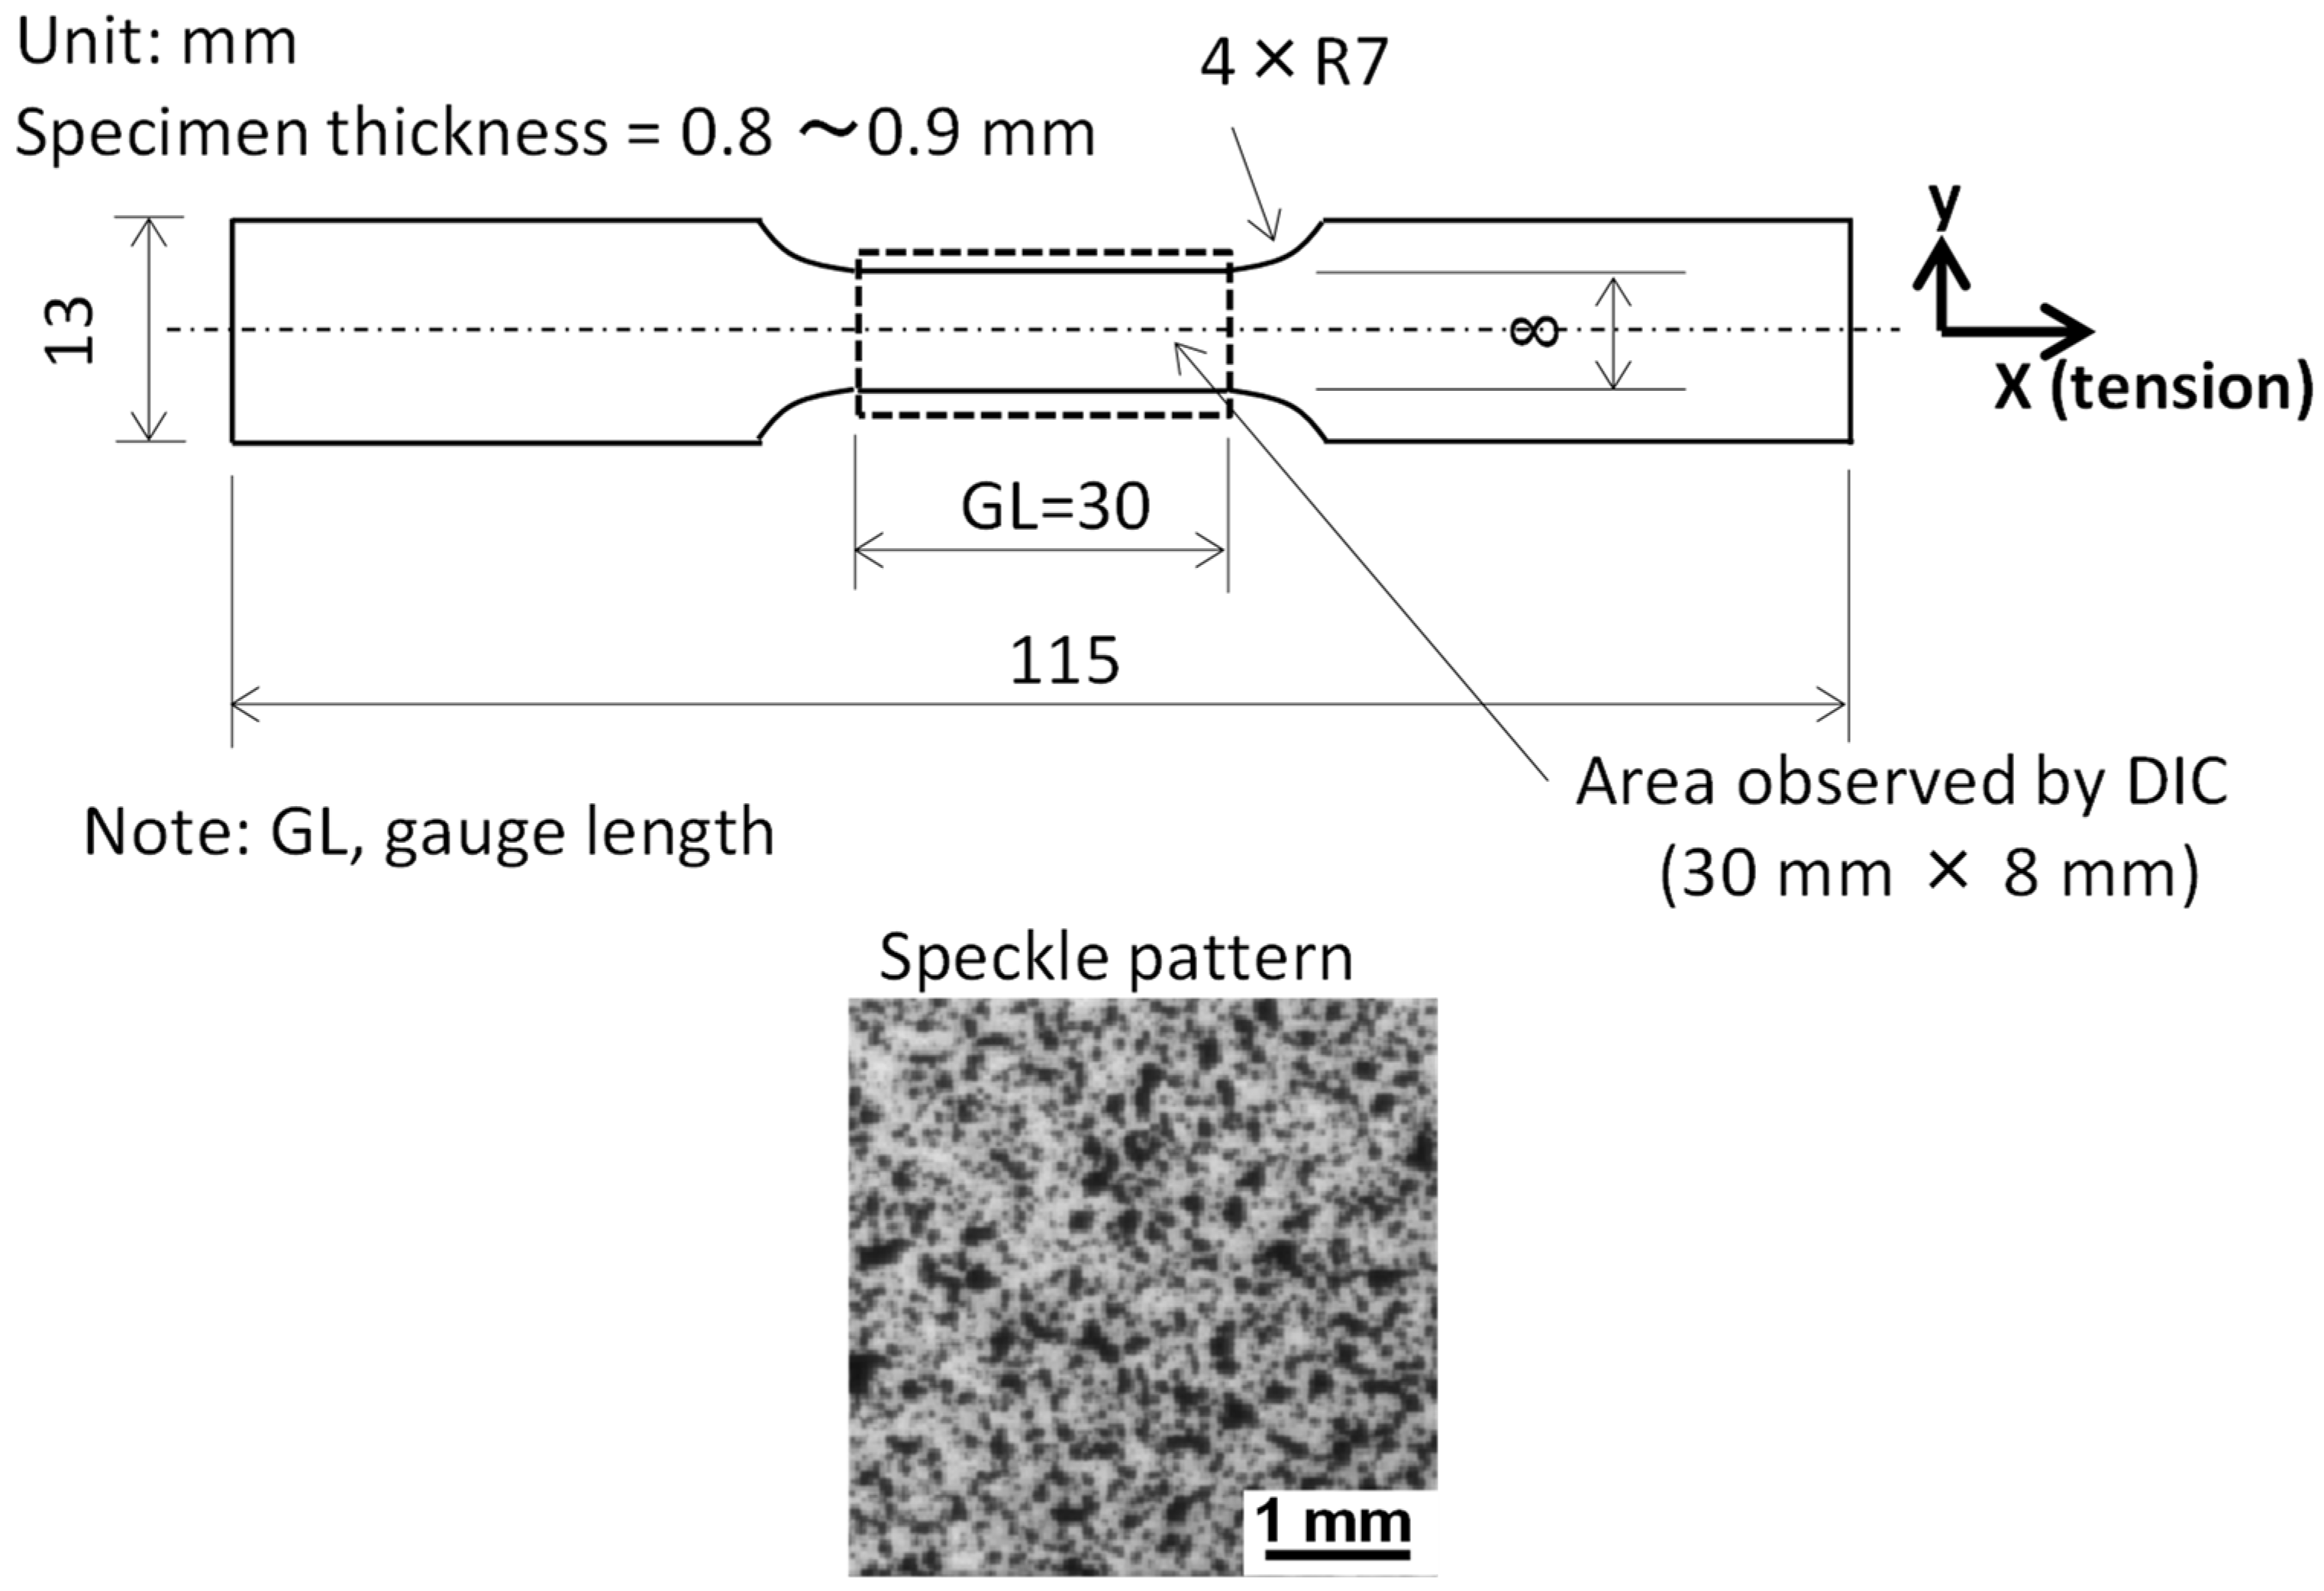
Figure 7.
Image quality (IQ) map (a) and inverse pole figure (IPF) of the S0 sample (b).
Figure 8.
KAM maps of S0, S1, S2, S3, and S4 samples.
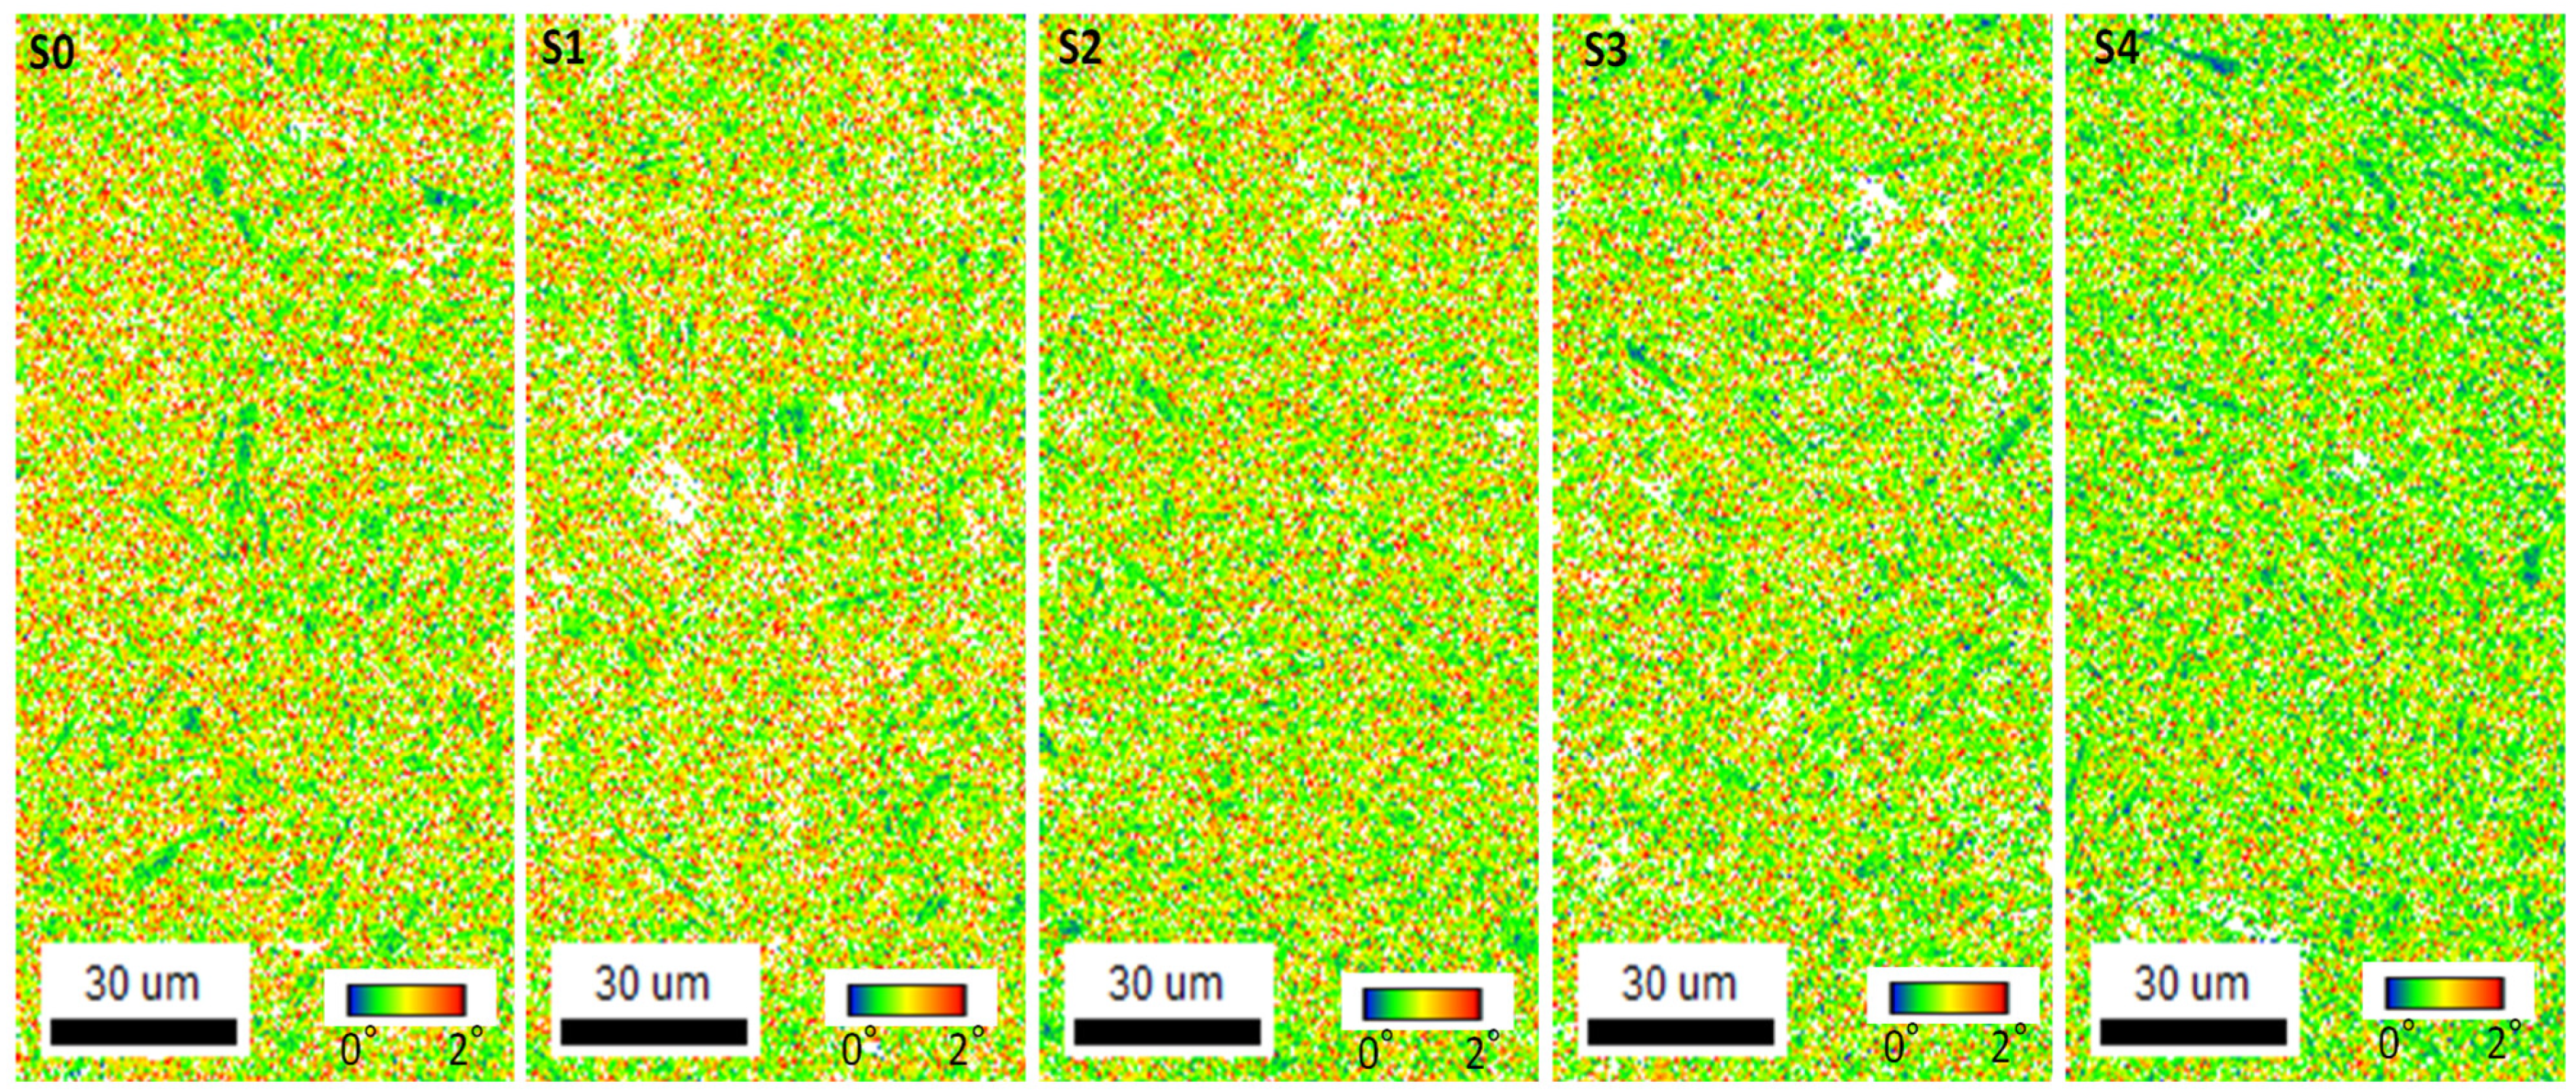
Figure 9.
The KAM average values for a 1st neighbor rank estimated by EBSD analysis for various samples (S0~S4).
Figure 9.
The KAM average values for a 1st neighbor rank estimated by EBSD analysis for various samples (S0~S4).
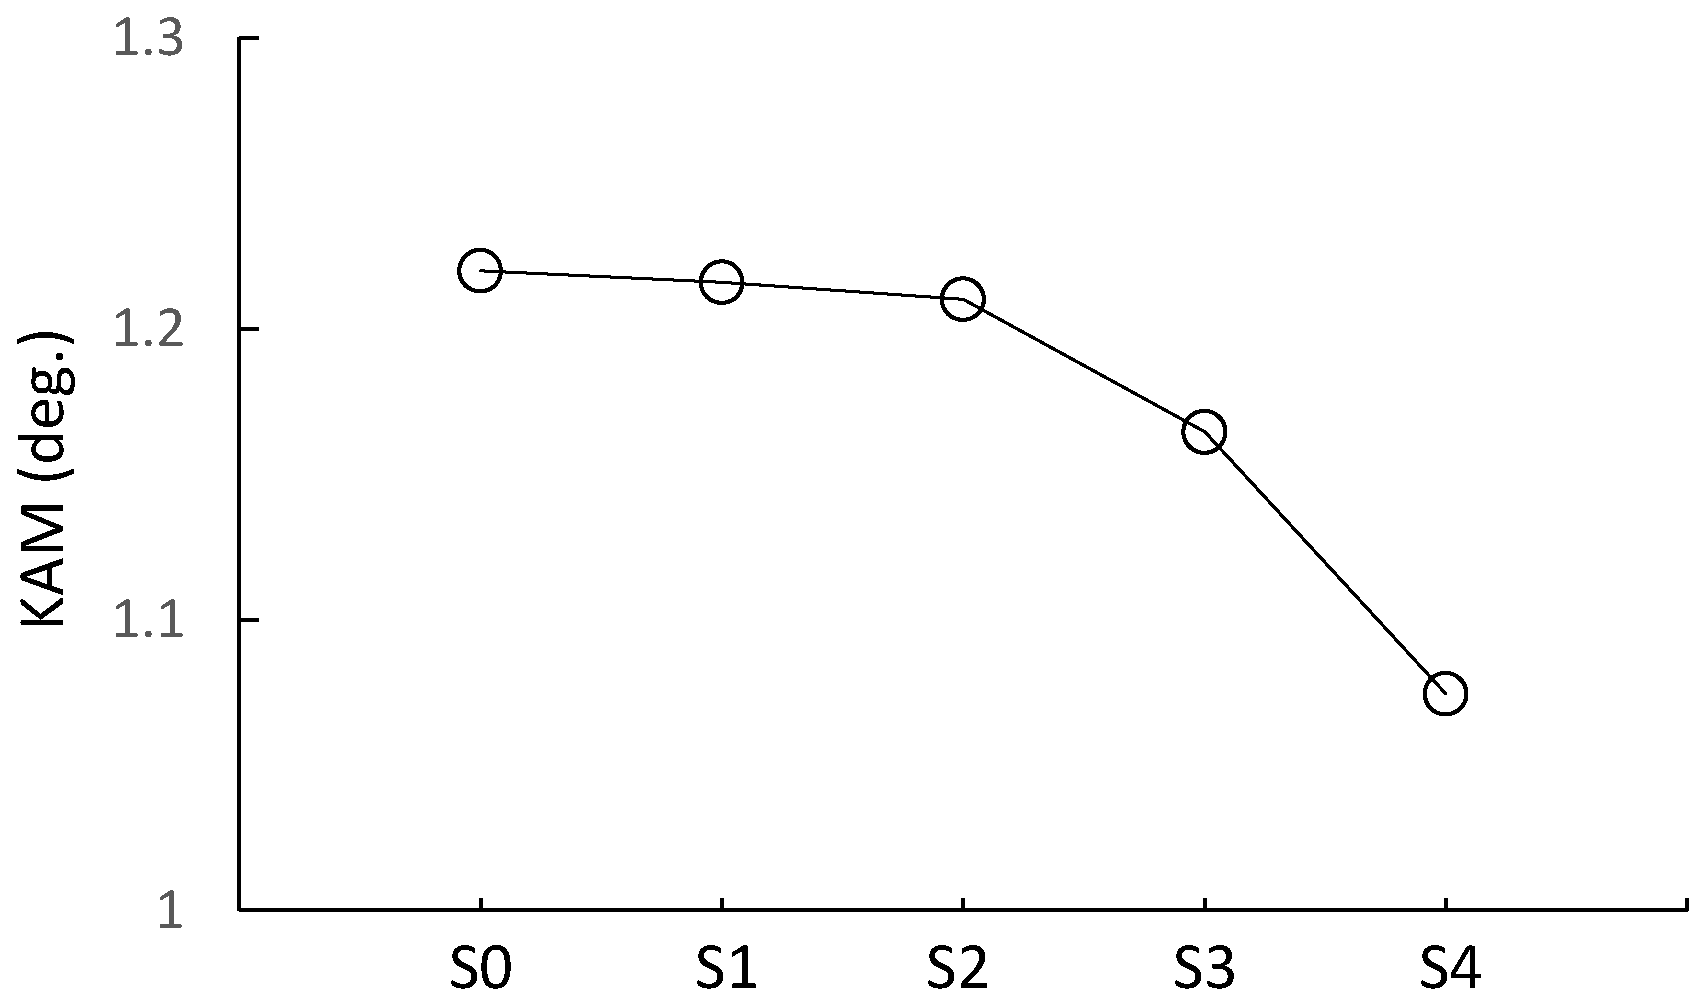
Figure 10.
Stress–strain curves of S0~S4 samples (a) and the enlargement of those curves around the point of 0.2% proof stress (σ0.2) for S0 (b), S1 (c), S2 (d), S3 (e), and S4 (f) samples.
Figure 10.
Stress–strain curves of S0~S4 samples (a) and the enlargement of those curves around the point of 0.2% proof stress (σ0.2) for S0 (b), S1 (c), S2 (d), S3 (e), and S4 (f) samples.
Figure 11.
Evolution of plastic bands in the S4 sample from point ① to point ⑲ in terms of the strain-rate field.
Figure 11.
Evolution of plastic bands in the S4 sample from point ① to point ⑲ in terms of the strain-rate field.
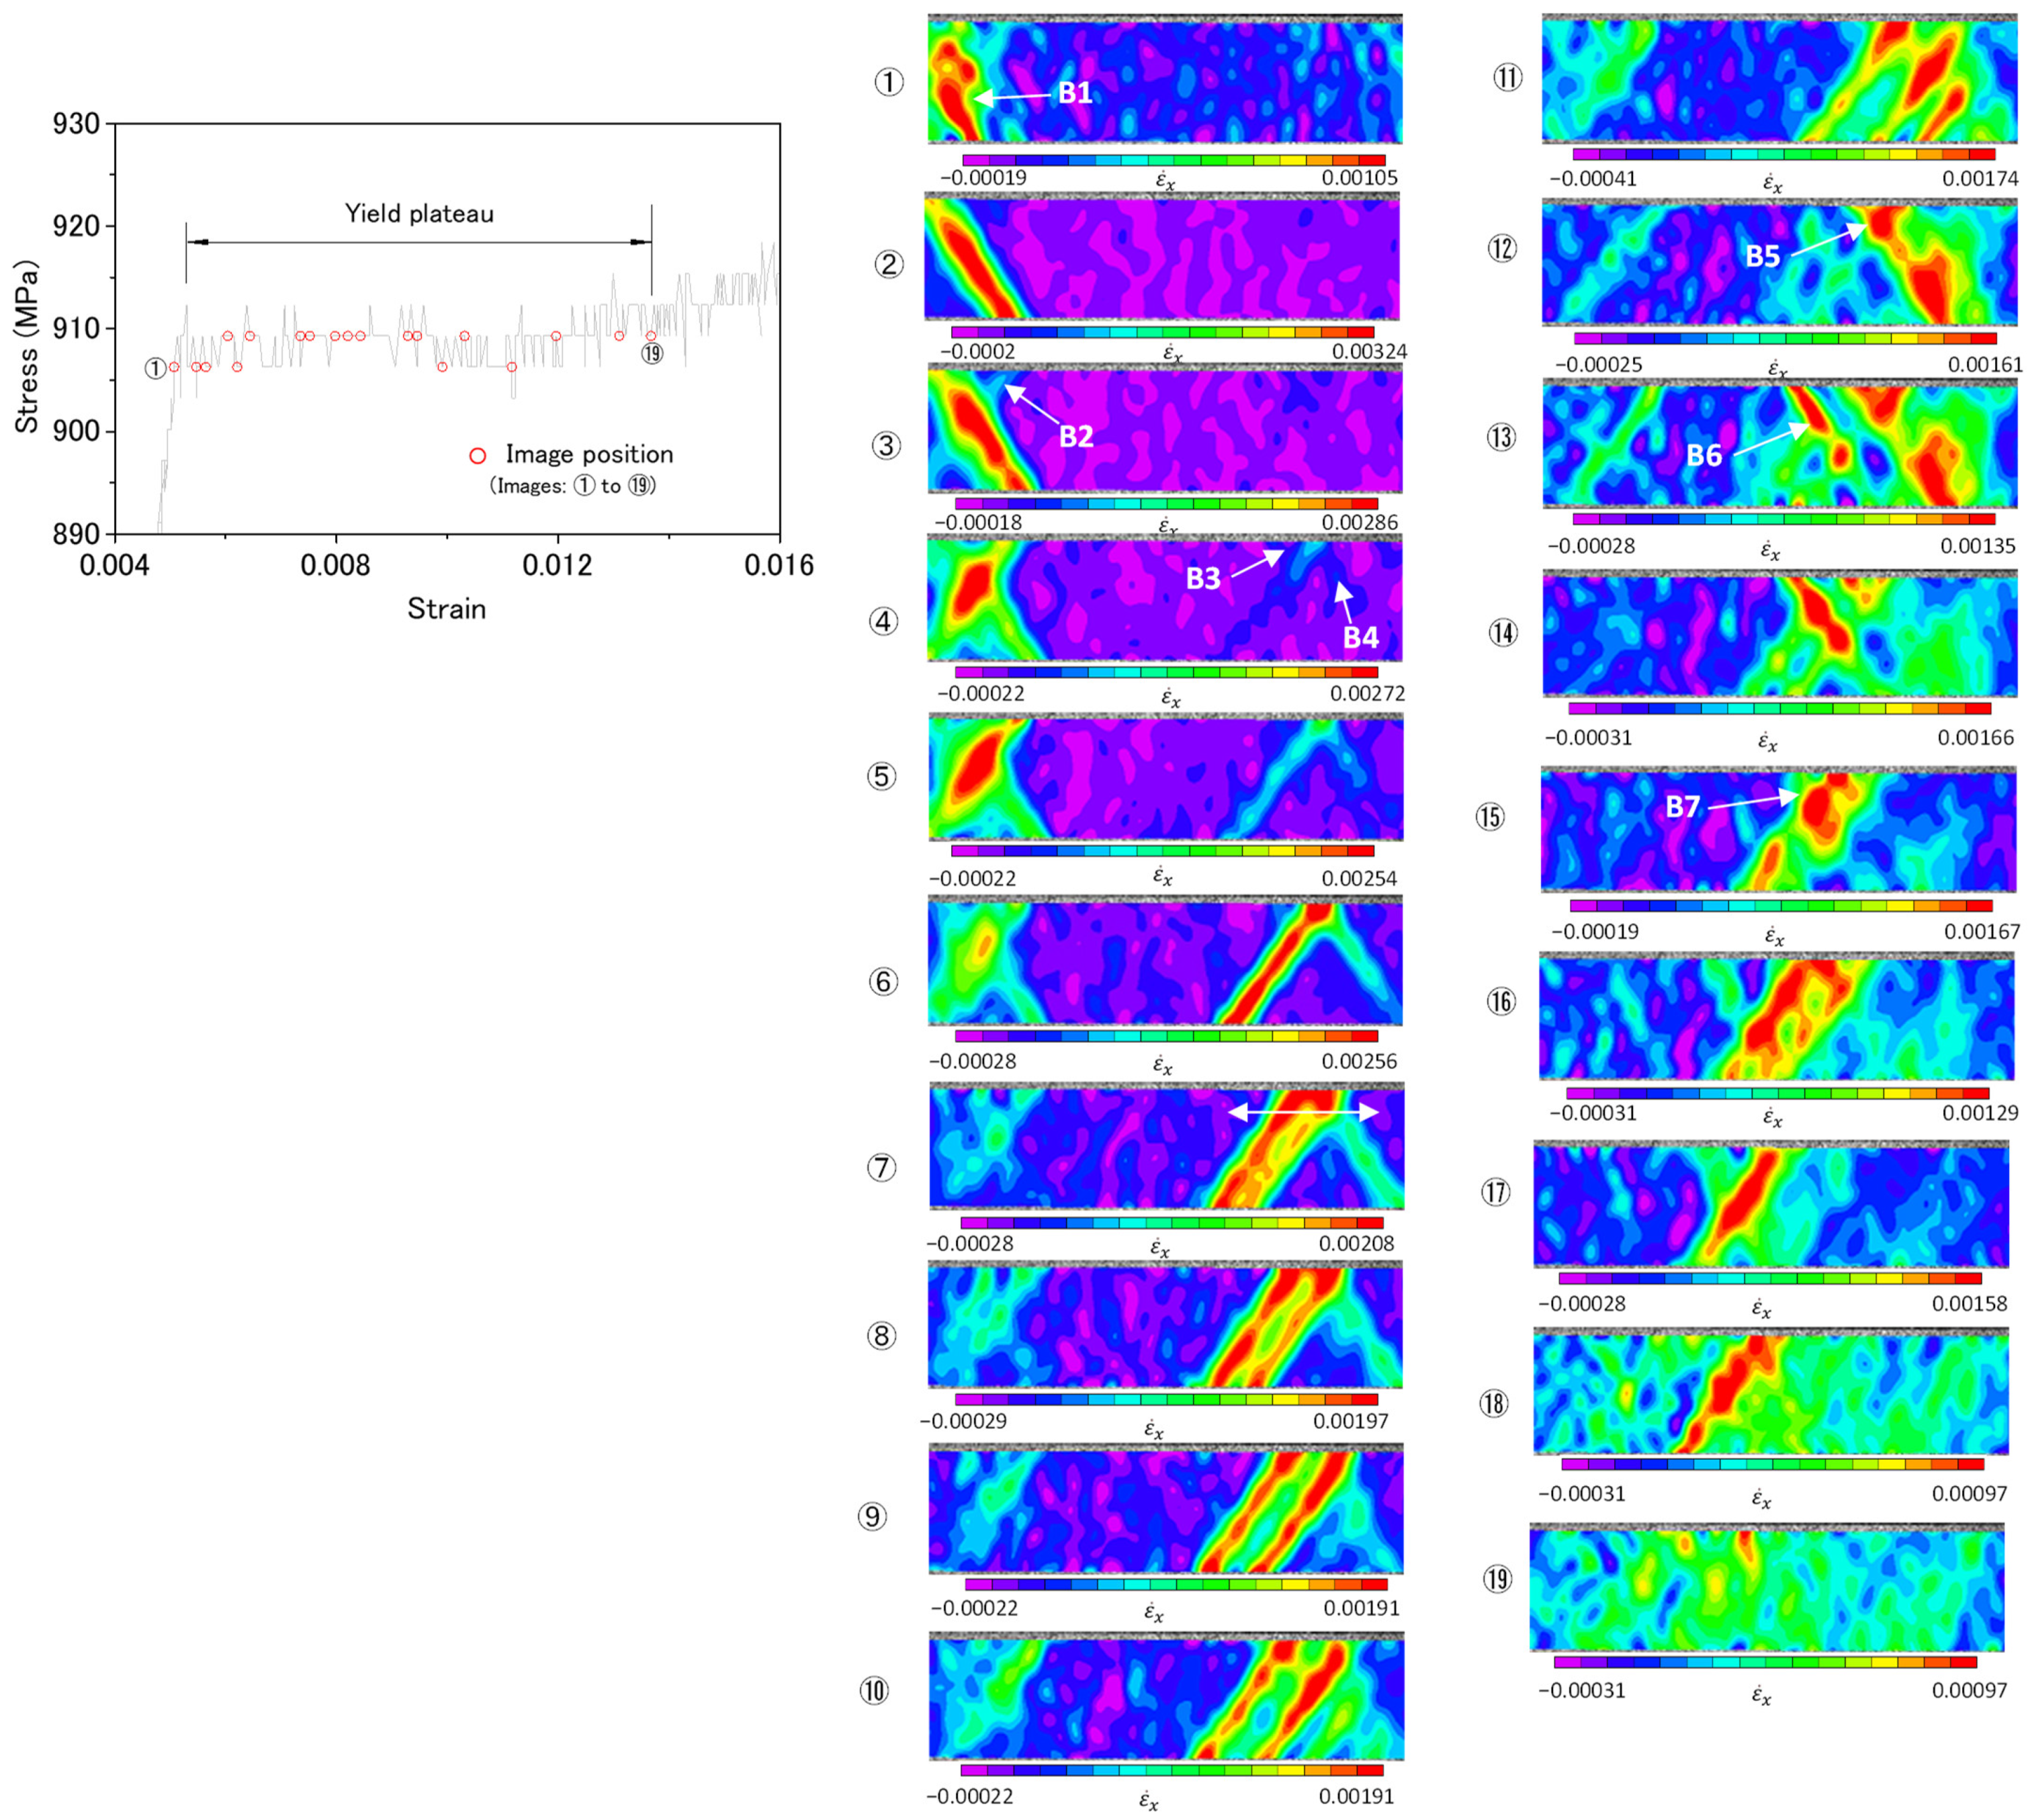
Figure 12.
Strain-rate field over the whole area observed by DIC, as shown in Figure 6 at the point of 0.2% proof stress. (a) S0 sample, (b) S1 sample, (c) S2 sample, (d) S3 sample, (e) S4 sample.
Figure 12.
Strain-rate field over the whole area observed by DIC, as shown in Figure 6 at the point of 0.2% proof stress. (a) S0 sample, (b) S1 sample, (c) S2 sample, (d) S3 sample, (e) S4 sample.

Table 1.
Strain rates obtained from Figure 12.
Table 1.
Strain rates obtained from Figure 12.
| Sample No. | Average Strain Rate (s−1) | Max. Strain Rate in the Band (s−1) |
|---|---|---|
| S0 | 1.02 × 10⁻⁴ | — |
| S1 | 1.83 × 10⁻⁴ | — |
| S2 | 2.61 × 10⁻⁴ | 1.09 × 10⁻³ |
| S3 | 3.21 × 10⁻⁴ | 2.37 × 10⁻³ |
| S4 | 4.62 × 10⁻⁴ | 3.33 × 10⁻³ |
Disclaimer/Publisher’s Note: The statements, opinions and data contained in all publications are solely those of the individual author(s) and contributor(s) and not of MDPI and/or the editor(s). MDPI and/or the editor(s) disclaim responsibility for any injury to people or property resulting from any ideas, methods, instructions or products referred to in the content. |
© 2024 by the authors. Licensee MDPI, Basel, Switzerland. This article is an open access article distributed under the terms and conditions of the Creative Commons Attribution (CC BY) license (https://creativecommons.org/licenses/by/4.0/).
Share and Cite
MDPI and ACS Style
Qiu, H.; Ueji, R.; Inoue, T. Suppression of Inhomogeneous Plastic Deformation in Medium-Carbon Tempered Martensite Steel. Metals 2024, 14, 306. https://doi.org/10.3390/met14030306
AMA Style
Qiu H, Ueji R, Inoue T. Suppression of Inhomogeneous Plastic Deformation in Medium-Carbon Tempered Martensite Steel. Metals. 2024; 14(3):306. https://doi.org/10.3390/met14030306
Chicago/Turabian StyleQiu, Hai, Rintaro Ueji, and Tadanobu Inoue. 2024. "Suppression of Inhomogeneous Plastic Deformation in Medium-Carbon Tempered Martensite Steel" Metals 14, no. 3: 306. https://doi.org/10.3390/met14030306
Note that from the first issue of 2016, this journal uses article numbers instead of page numbers. See further details here.