
Effect of Gating System Design on the Quality of Aluminum Alloy Castings


Department of Technological Engineering, Faculty of Mechanical Engineering, University of Žilina, Univerzitná 8215/1, 010 26 Zilina, Slovakia
*
Author to whom correspondence should be addressed.
Metals 2024, 14(3), 312; https://doi.org/10.3390/met14030312
Submission received: 7 February 2024
/
Revised: 1 March 2024
/
Accepted: 5 March 2024
/
Published: 7 March 2024
(This article belongs to the Special Issue Casting Alloy Design and Characterization)
Abstract
:In this paper, a naturally pressurized gating system has been designed to reduce the turbulence of the melt during casting. The influence of gate dimensions, foam filters, a trident gate and a vortex element were evaluated. Their effect on melt velocity, flow characteristics, number of oxides, casting properties and mechanical properties were observed. ProCAST Simulation software v.2023 and a water flow test were also evaluated to assist in the experimental evaluation of the castings. Melts showed a relationship between melt velocity and porosity of castings. Quantitative evaluation of the surface porosity showed a trend of decreasing porosity with decreasing melt velocity. The greatest reduction in the melt velocity was achieved by a M4 design, which was associated with the highest reduction in the oxides. The pores analyzed proved the presence of oxide layers on their inner surface and a possible theory of pore formation when the initiator of porosity is entrained double oxide layers. The best metal yield was achieved with M1, but the difference between M2 and M4 was negligible (2–5% yield difference), so it can be stated that the beneficial effect of the M4 design in providing the best quality castings is not negated by the increase in metal yield.
1. Introduction
The surface of the molten aluminum alloy reacts with the surrounding atmosphere to form a surface oxide layer due to the high affinity of aluminum for oxygen. The surface oxide layer is not harmful. The problem arises when the surface oxide layer is subjected to entrainment forces. When entrained into the bulk of the metal volume, a new oxide layer will form at the surface in a matter of milliseconds. Turbulence causes the entrained oxide layer to fold, trapping air between the layers. The oxide layer can deteriorate the final quality of the casting if it is entrained into the melt by the turbulence of the melt surface and solidifies in the casting [1,2,3,4,5]. Several studies in recent years indicate that entrained double oxide layers in the casting act as porosity initiators and that hydrogen contributes to pore formation by diffusing between the layers, thereby enlarging the pores [6,7,8].
In order to prevent such defects, it is important to understand the mechanism of their occurrence. The effort is to prevent their occurrence by choosing an appropriate design for the gating system. The design of a naturally pressurized gating system appears to be a suitable solution from the point of view of suppressing reoxidation during the filling of the gating system [9,10,11,12,13,14]. Its disadvantage is the high velocity of the melt entering the mold cavity through the gate. Supercritical velocity is a consequence of the fact that a naturally pressurized system has approximately the same ratio of cross-section area for all individual parts of the gating system, which means that there is no velocity reduction as, for example, with a negative pressure gating system, where the speed is reduced due to the law of conservation of energy (parts of the gating system closer to casting have higher cross-section areas).
The supercritical velocity causes a large amount of spattering of the melt in the cavity, which in turn causes a large number of entrained oxides in the casting, thus negating the advantage of a naturally pressurized gating system.
The high melt velocity exiting the gates in the naturally pressurized gating system needs to be reduced by a suitable solution. Research has shown that by introducing a filter into the gating system, it is possible to adjust the flow of the melt and reduce its velocity, but it is also important to pay attention to the location of the filter in the gating system, as inappropriate placement of the filter will have a negative effect [15,16,17,18,19,20,21]. In recent years, researchers have attempted to solve the problem of a naturally pressurized gating system by unconventional modification of its individual elements. Such possibilities include the introduction of a vortex element at the end of the runner [10,17], the use of the so-called vortex gate with an inserted filter in the upper part of the gate [2,10], or the “trident gate” with two filters and a bubble trap [10,21].
This paper deals with the use of filters and unconventional elements in the gating system and their influence on the melt flow in the gate area, melt velocity, number of oxides, foundry properties, porosity and mechanical properties of castings. Reoxidation cannot be completely eliminated from the casting process. However, the aim is to use the mentioned elements to reduce it as far as possible and to improve the quality of the castings from the aluminum alloy.
2. Materials and Methods
A specific casting was designed for the purpose of the experiment (Figure 1). Based on the dimensions and weight of the casting, a naturally pressurized gating system was calculated. At this stage of the experiment, the effect of dimensioned gates, foam filters, trident gates and a combination of trident gates with a vortex element at the end of the runner were observed. The foam filters’ dimensions were 50 × 50 × 20 mm. To compare the influence of each element, a gating system without a filter with a gate of the same cross-section as the runner was used as a reference sample.
An AlCu4Ti aluminum alloy with a chemical composition shown in Table 1 (measured on a Q2 ION spectrometer) was used for casts. This AlCu4Ti aluminum alloy is widely used in the automotive industry for components of spark-ignition and diesel engines of vehicles and was used based on the knowledge from other works [22,23,24].
The pouring height was 100 mm above the mold level. The maintained height of the melt level in the pouring basin was 30 mm above the level of the sprue. The casting temperature was 745 ± 5 °C, and the temperature of the molds and the environment were 17 ± 2 °C. Melting was conducted in an electric-resistant furnace without a degassing process. For the most relevant evaluation of the individual modifications to the gating systems, it was necessary to ensure that the quality of the melt prepared was approximately the same for each casting. Therefore, the density index (DI) was measured immediately before and after casting. The average DI values were 2.36–3.63%. The basic boundary conditions for the numerical simulation were set as follows: pouring height of 100 mm, casting temperature of 745 °C, initial mold temperature of 17 °C, resin-bonded sand used for the molds (with the appropriate setting of the heat transfer coefficient) and cast alloy AlCu4Ti. A tensile tests and impact tests were carried out in accordance with EN standards. The test equipment used for the tensile test was an Inspektdesk 50 kN and the impact test was performed on a PSW 30 Charpy impact tester.
The ProCAST simulation software v.2023 was used to evaluate the melt velocity in the gating system and in the mold cavity, the melt flow behind the gate, the number of oxides and the fluidity. The two-phase filling module was used during the simulations. The flow in the cavity was observed using a water experiment and compared with the simulations. During casting, the actual melt velocity in the runner and at the cavity entrance was evaluated using measurement points. After casting, mechanical properties were evaluated, and a fluidity test, porosity of castings, microscopic analysis and metal yield evaluation were also performed.
Design of Casting and Gating System
The proposed shape of the casting shown in Figure 2 allows for a comprehensive evaluation as it includes areas for fluidity testing, hot tear testing, mechanical properties testing and an area for evaluating melt flow in the mold cavity. The optimal design of the gating system can reduce the turbulent flow of the molten metal, minimizing the amount of gas and trapped impurities. Based on the dimensions and weight of the casting, the design of a naturally pressurized gating system was adapted, including the calculation of the cross-sectional dimensions of its individual parts. Figure 3 shows every modification of the gating system used in experimental works. A reference design without a filter (modification M1), where the cross-sectional area of the gate is the same as the cross-sectional area of the runner, is shown in Figure 3a. The next modification is a gating system with an extended gate (modification M2), shown in Figure 3b. The area of this gate has been dimensioned so that the melt velocity at this point is a maximum of 0.5 m·s−1, neglecting hydraulic losses, friction losses, etc. Figure 3c shows a modification of the gating system in which a 10 ppi foam filter (modification M3) and a 30 ppi foam filter (modification M4) were placed horizontally above the runner in the gate area. In the next modification (Figure 3d), the effect of the trident gate (modification M5) was evaluated. This type of gate contains the so-called bubble trap and chambers for one filter placed horizontally above the runner and the other filter placed vertically. Foam filters with a density of 20 ppi were inserted into the trident gate. The gate area remains unchanged compared to the M1 gate area. The final modification (Figure 3e) used a combination of a trident gate with two 20 ppi foam filters and a cylindrical vortex element at the end of the runner (modification M6).
3. Results and Discussion
3.1. Melt Velocity Determination
Melt velocity during pouring was evaluated by measurement points (1.4 mm diameter copper wires) placed in the mold as shown in Figure 4. For all gating system modifications, points RE, E1 and E2 were placed in the runner and point E4 was placed above the gate. In M1 and M2, point E3 was located approximately at the center of the gate height, and in M3 and M4, approximately at the center of the filter. In M5 and M6, E3 was located at the top of the trident gate. The melt velocity was only measured at points E2 and E4; points RE, E1 and E3 were only used as an aiding spots. Point E2 was located in front of the gate and E4 approximately 5 mm above the gate. Measuring the melt velocity at these points was chosen to assess the effectiveness of the gate system used in reducing the velocity of the melt entering the mold cavity. The measurement points were connected to the NATIONAL INSTRUMENTS NI USB-6008 module. The distance between the points and the time taken for the melt to travel that distance was known. The average melt velocity was calculated from the difference in distance between sensors and the voltage peaks reached over time at the measuring points. Time and voltage data for the measurement points were recorded using LabVIEW software—version 2018.
During pouring, it is not possible to maintain identical filling conditions every time, but the velocity values at point E2 show that the filling conditions were approximately the same for all modifications. Point E4 was the second point where the melt velocity was measured. The results show a decrease in melt velocity at this point in M2 to M5 compared to the reference gating system M1. At M6, the melt velocity could not be evaluated during pouring, because an unknown measurement error occurred. M4 and M3 achieved the best results when the melt velocity at point E4 decreased by approximately 85% compared to the reference gating system M1. In M2, the velocity decreased by 16% and in M5 by 47% compared to M1.
Using simulation software, the melt velocity in the region above the gate was analyzed using a color scale (Figure 5). From the results, it can be concluded that the melt velocities in the individual modifications are largely consistent with the values from the measurement points. For a better quantitative evaluation and comparison of the melt velocity, the velocity measurement in the simulations was carried out at points E2 and E4. The location of these points corresponded approximately to the location of the measurement points in the molds. The instantaneous maximum velocity of the melt was measured at these points. The results also show the highest reduction in velocity for the gate in M4 and M3, where there was a reduction of approximately 89% compared to the reference modification. Compared to M1, the reduction in velocity above the gate was 35% in M2, 63% in M5 and 74% in M6. The graph comparing the melt velocity values obtained from the simulations and those measured during casting are shown in Figure 6. From the graph it can be seen that there is a visible correlation between the values measured at the mold and those obtained from the simulations. The widening of the gate in M2 is not very effective in reducing the melt speed. The use of a foam filter in M3 and M4 are beneficial as it increases the gate area and radically reduces the melt velocity. The trident gate in M5 and M6 did not reduce the melt velocity as expected due to an undersized gate area. As can be seen from the simulations, even when the melt is slowed down using two filters, the velocity increases again in the region of the small cross-section gate. The vortex element at the end of the runner in M6 reduced the melt velocity after the gate compared to M5.
3.2. Melt Flow Determination
The flow behind the gate was analyzed by simulation and also by physical experiment with the inspection fluid. The inspection fluid experiment was conducted based on previous findings [17,18,25]. In these studies, the authors used water to observe the flow in a gate system. Most of the works use water at a temperature of 20 °C for experiments, which has a kinematic viscosity of 0.01 m2·s−1, and the kinematic viscosity of the liquid aluminum alloy is 0.00959 m2·s−1. The study [26] showed that even the Reynolds number is an important parameter in water experiments to obtain a reliable analogy when observing the nature of flow between metal and water, and that the Froude number has almost no effect. The study [27] found only small differences in the observed flow of water and steel, despite a difference in kinematic viscosity of about 18%. The authors of [25] found in their experimental conditions that water flow at a temperature of 53.1 °C results in a Reynolds number similar to that of an aluminum alloy melt.
Molds (Figure 7a) were made from sand blocks (Figure 7b) covered by PMMA sheets for the purpose of observing the flow using the inspection liquid experiment (Figure 7c). A gating system was milled into the sand block and the surface of the block was impregnated to prevent water seepage. As both the simulations and the experimental melts were cast in sand molds, the use of a sand block for the water experiment was also advantageous from the point of view of maintaining identical flow conditions, such as friction, etc. Based on the research work, water with a temperature of 53.1 ± 0.3 °C was chosen for the purpose of the water experiment. In order to maintain the same conditions as during the pouring of the liquid metal, the water was poured from a height of 100 mm and the water level in the pouring basin was maintained at the same level as during the pouring of the metal. A blue dye was added to the water to provide contrast between the flowing medium and the mold wall, and an orange dye was added to highlight any turbulence in the inspection liquid. The flow of the liquid in the mold was recorded on camera in ultra-slow motion.
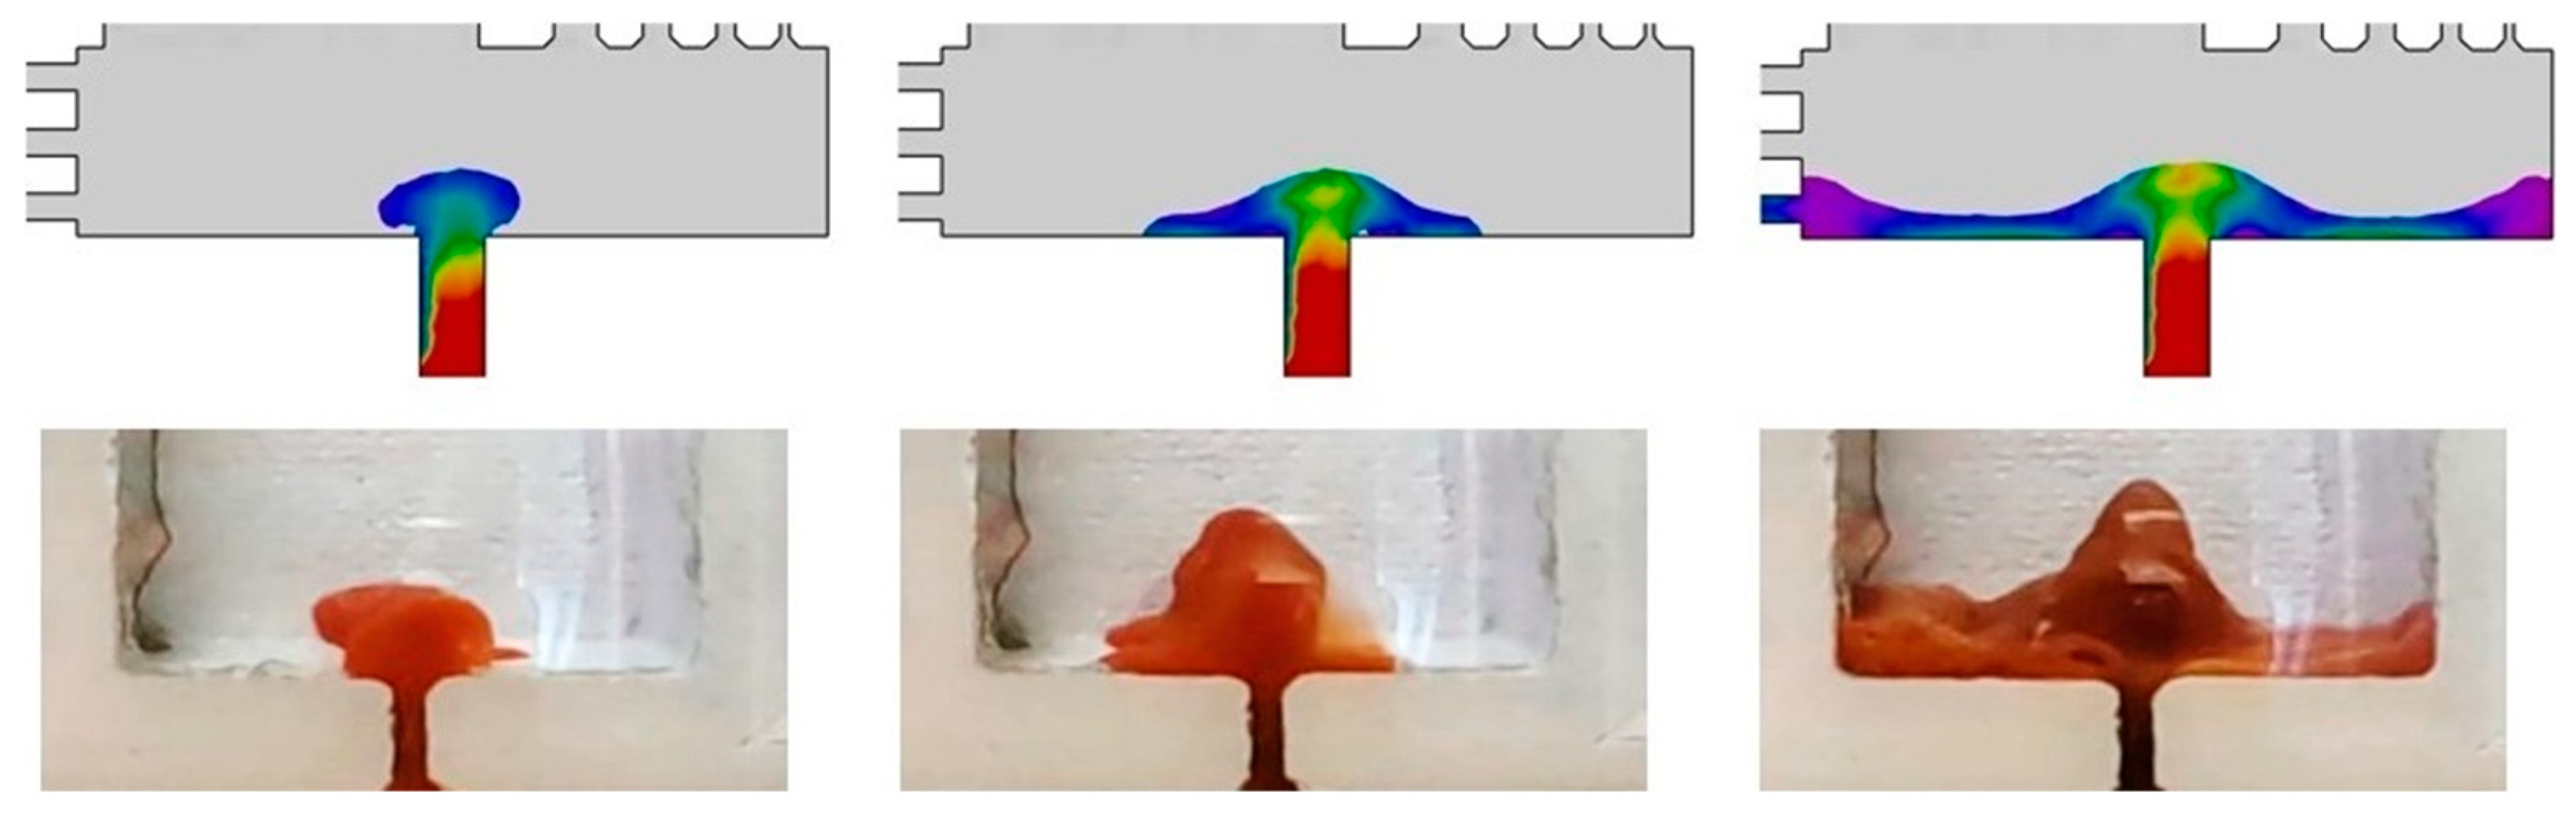
Both the simulations and the water experiment showed a large spattering in M1 and the formation of the so-called fountain effect (Figure 8). The filling of the mold cavity was turbulent in the following stages. In contrast, in M2, there was less spattering at the start of filling, but the flow was also turbulent and uncontrolled during filling (Figure 9). The foam filters in M3 and M4 ensured a much smoother filling of the mold cavity without spattering, which was associated with a significant reduction in velocity (Figure 10 and Figure 11). The higher density of the foam filter gave better results, which could be observed by simulations, and also by image analysis of the water test. In M5 and M6, a reduction in spatter was observed compared to the reference gating system, but the filling of the mold cavity was still turbulent (Figure 12 and Figure 13). This was a surprising finding, because according to the study [11], the most optimal system is the combined system with trident gates and a bubble trap. In the design with a vortex element at the end of the runner, a calmer cavity filling process was observed compared to the M5. As mentioned above, the trident gate was expected to have a greater effect on the velocity reduction behind the gate. Therefore, the advantage of the trident gate can be suppressed if the gate size is inappropriately designed. Based on the comparison of the flow analysis behind the gate using simulations and the water experiment, it is possible to see a major correlation between the results obtained.
3.3. Amount of Oxides Determination
The analysis of the trapped oxides by means of simulations (Figure 14) showed that their amount in the casting was highest in M1. An improvement can be seen in the M2 design compared to the reference design. M5 and M6 showed a significant reduction in their amount, but the best results were obtained in M3 and M4. When comparing the measured values of the melt velocity, it was possible to observe a tendency for the number of oxides in the castings to decrease as the melt velocity at the entrance to the mold cavity decreases, which is associated with a calmer filling process.
3.4. Casting Characteristics Evaluation
The casting contains parts for assessing fluidity (area A in Figure 15) and cracking susceptibility (area B in Figure 15). The part of the casting used for the fluidity evaluation consists of four test rods of circular cross-section with graduated diameters. The diameters of the test rods were 8 mm, 6 mm, 4 mm and 2 mm. The aim of this evaluation was to analyze the suitability of using individual elements in the gating system for casting thin-walled castings. The results obtained were also compared with the simulation. The rectangular section test rods used to evaluate the susceptibility to cracking had graduated arm lengths (142 mm, 112 mm and 82 mm). The end of the test bars was in the shape of a “T”, the purpose of which was to prevent the metal from shrinking and thereby initiating cracking.
Figure 16 shows the effect of each modification on fluidity. The best fluidity test results with test rod diameters of 8 and 6 mm were obtained with M2, and the worst results were obtained with M5 and M6, which was also consistent with the results of the simulations. With test rod diameters of 4 and 2 mm, the best results were obtained with M3 and M4. On the contrary, the lowest fluidity was observed in M5 and M6. The results of the fluidity of the 4 and 2 mm diameter test bars did not agree with the assessment made by the simulation software, where the best results were observed in M1 and M2 and, conversely, the worst in M3 and M4. The best combination of the ability to fill parts of the mold cavity with smaller and larger parts can be attributed to the M3 and M4 designs. In these, despite a significant reduction in melt speed after the gate, there was no significant reduction in melt flow in the 8 and 6 mm diameter rods compared to M1 and M2, and the best results were obtained in the 4 and 2 mm diameter rods. The good results obtained in M3 and M4 in all the test rods could be due to the reduced number of impurities in the melt after the gate. These are created during the turbulent filling of the mold cavity and oxides are entrained in the melt, while any impurity in the melt degrades its fluidity. The lowest fluidity of all test bars in the M5 and M6 designs could be due to the lower hydrostatic pressure compared to other designs; also, the trident gate and vortex element at the end of the runner prolong the time the melt takes to enter the mold cavity. As a result, the melt flowed into the cavity at a lower temperature compared to other modifications, which significantly reduced the fluidity. The influence of the gate design on the susceptibility to cracking was not observed. In the test bars used to assess cracking susceptibility, there was no violation in the integrity of the arms in any of the bars, nor was there any initiation of cracks.
3.5. Porosity Evaluation
In order to assess the quality of the castings, their porosity was evaluated on block-shaped samples with the dimensions of 125 × 40 × 5 mm, as shown in Figure 17. As part of the evaluation, the samples were subjected to surface porosity analysis. The result was a percentage expression of the area of the pores in relation to the total area of the section of the casting. The surface porosity of the castings was measured using the QuickPHOTO INDUSTRIAL 3.1 software based on the color contrast between the pore and the surface of the sample, which allowed the porosity to be quantified.
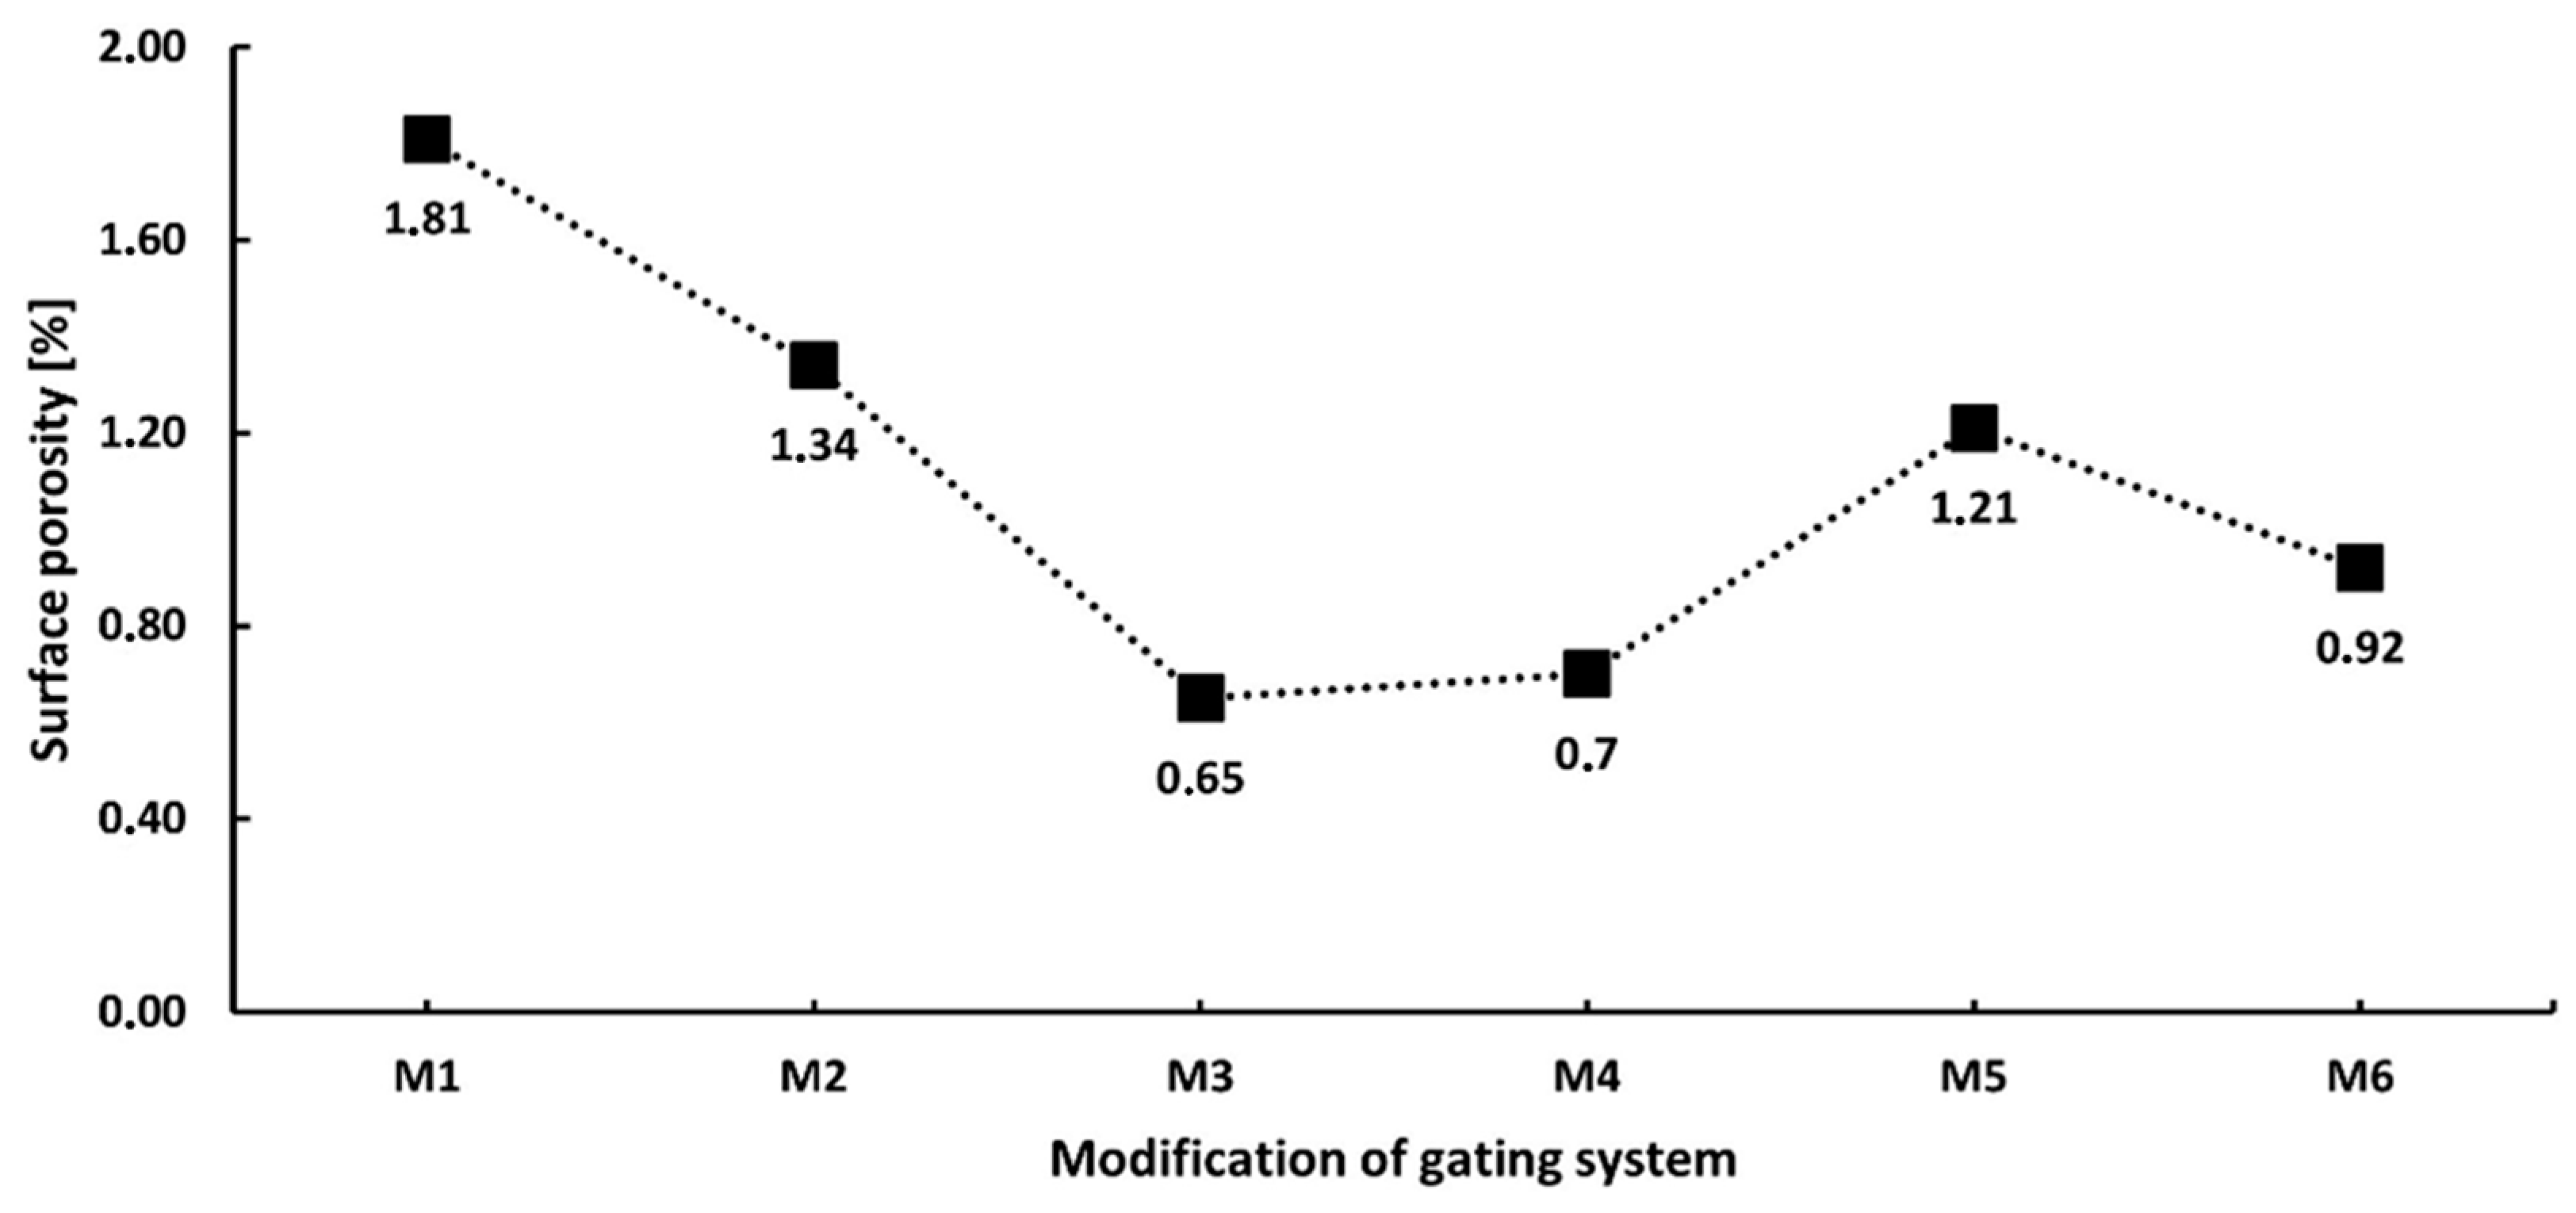
The highest rate of surface porosity was measured in construction M1. A significant reduction in porosity occurred in M3, where the surface porosity was reduced by 64% compared to M1. Similar results were seen in M4 where the results were improved by 61%. Compared to the reference gating system, the pore content was reduced by 26% in M2, 33% in M5 and 49% in M6. By analyzing the melt velocity and flow behind the gate, it can be seen that the cavity filling process becomes smoother as the velocity decreases. This is related to a smaller number of air bubbles trapped in the melt. From this, it is possible to observe a trend where the porosity of the castings decreases with a decrease in the speed of the melt entering the cavity. Figure 18 shows samples from the surface porosity evaluation and Figure 19 shows the surface porosity evaluation graph.
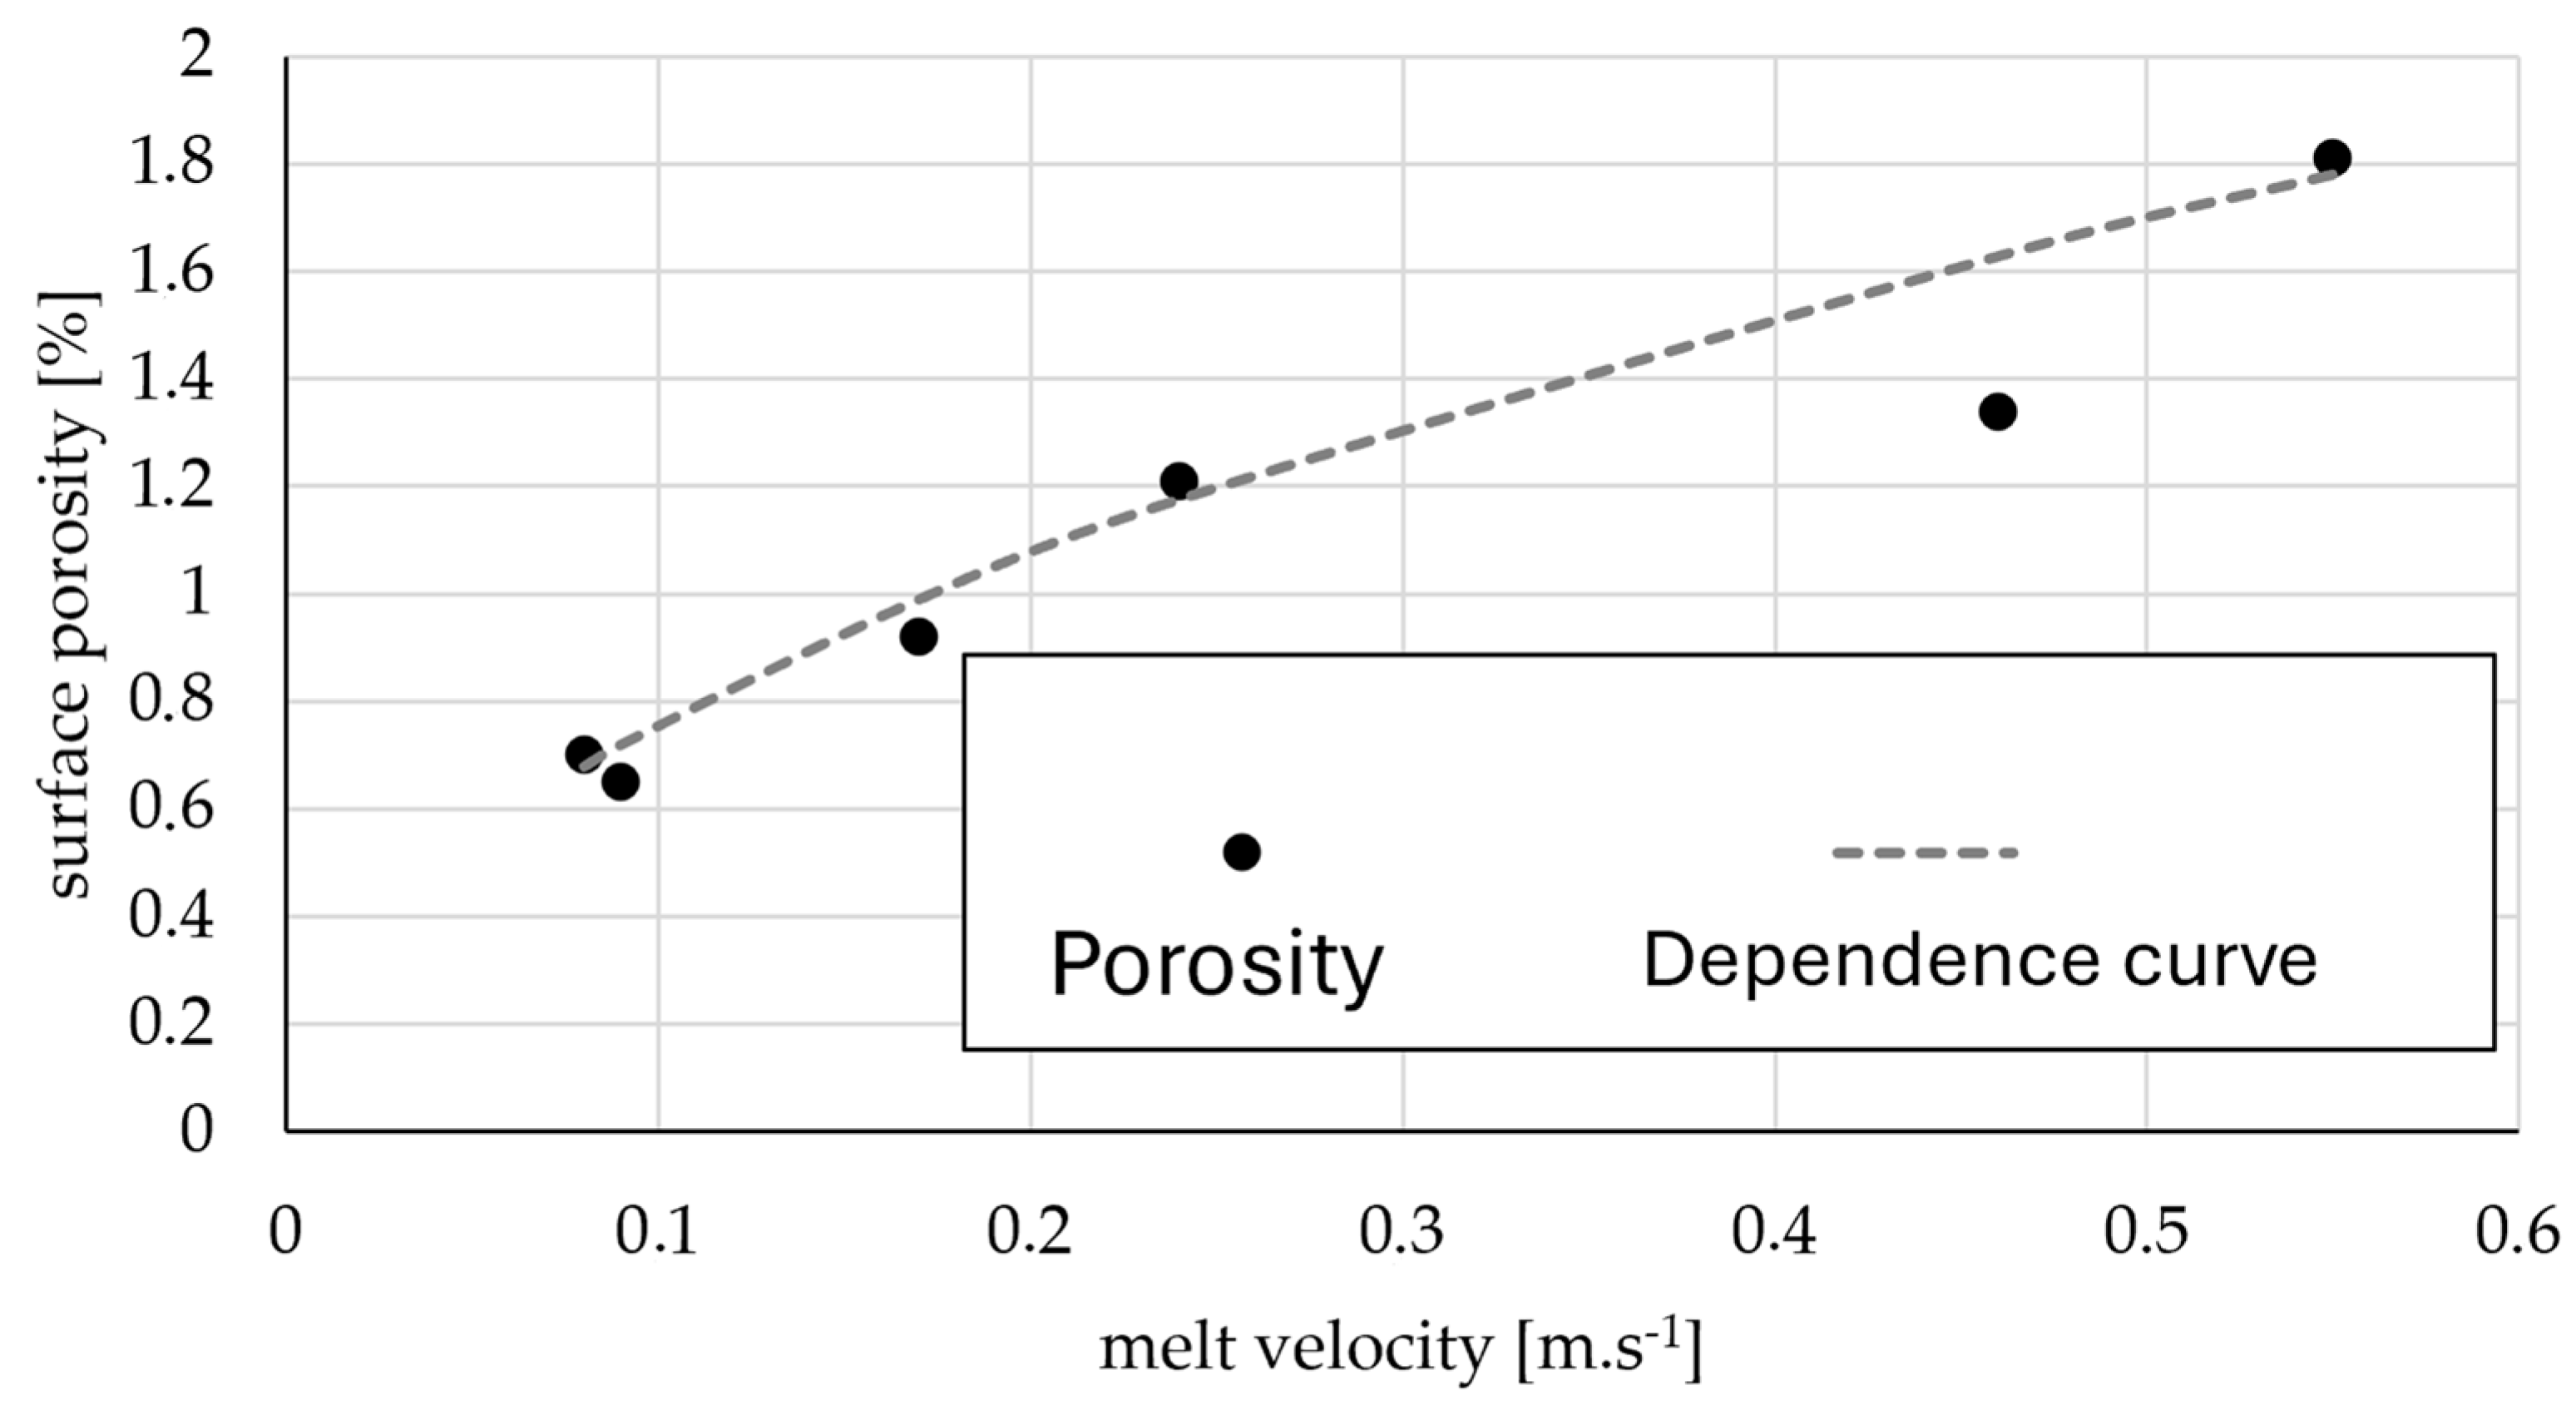
From the measured values, it is possible to observe a parabolic dependence between the surface porosity (SP) and the melt velocity in the gates v (Figure 20). This dependence can be described by the equation:
The direct dependence between the porosity and the speed of the melt in the gates documents its more significant influence than the conditions and the course of solidification of the casting.
Samples were taken from the center sections of the castings for tensile and impact toughness tests. The arrangement of the specimens for each test is shown schematically in Figure 21. A total of four tensile test specimens and four impact toughness test specimens were taken from the casting. After the tensile tests, the elongation was evaluated and the yield strength agreed.
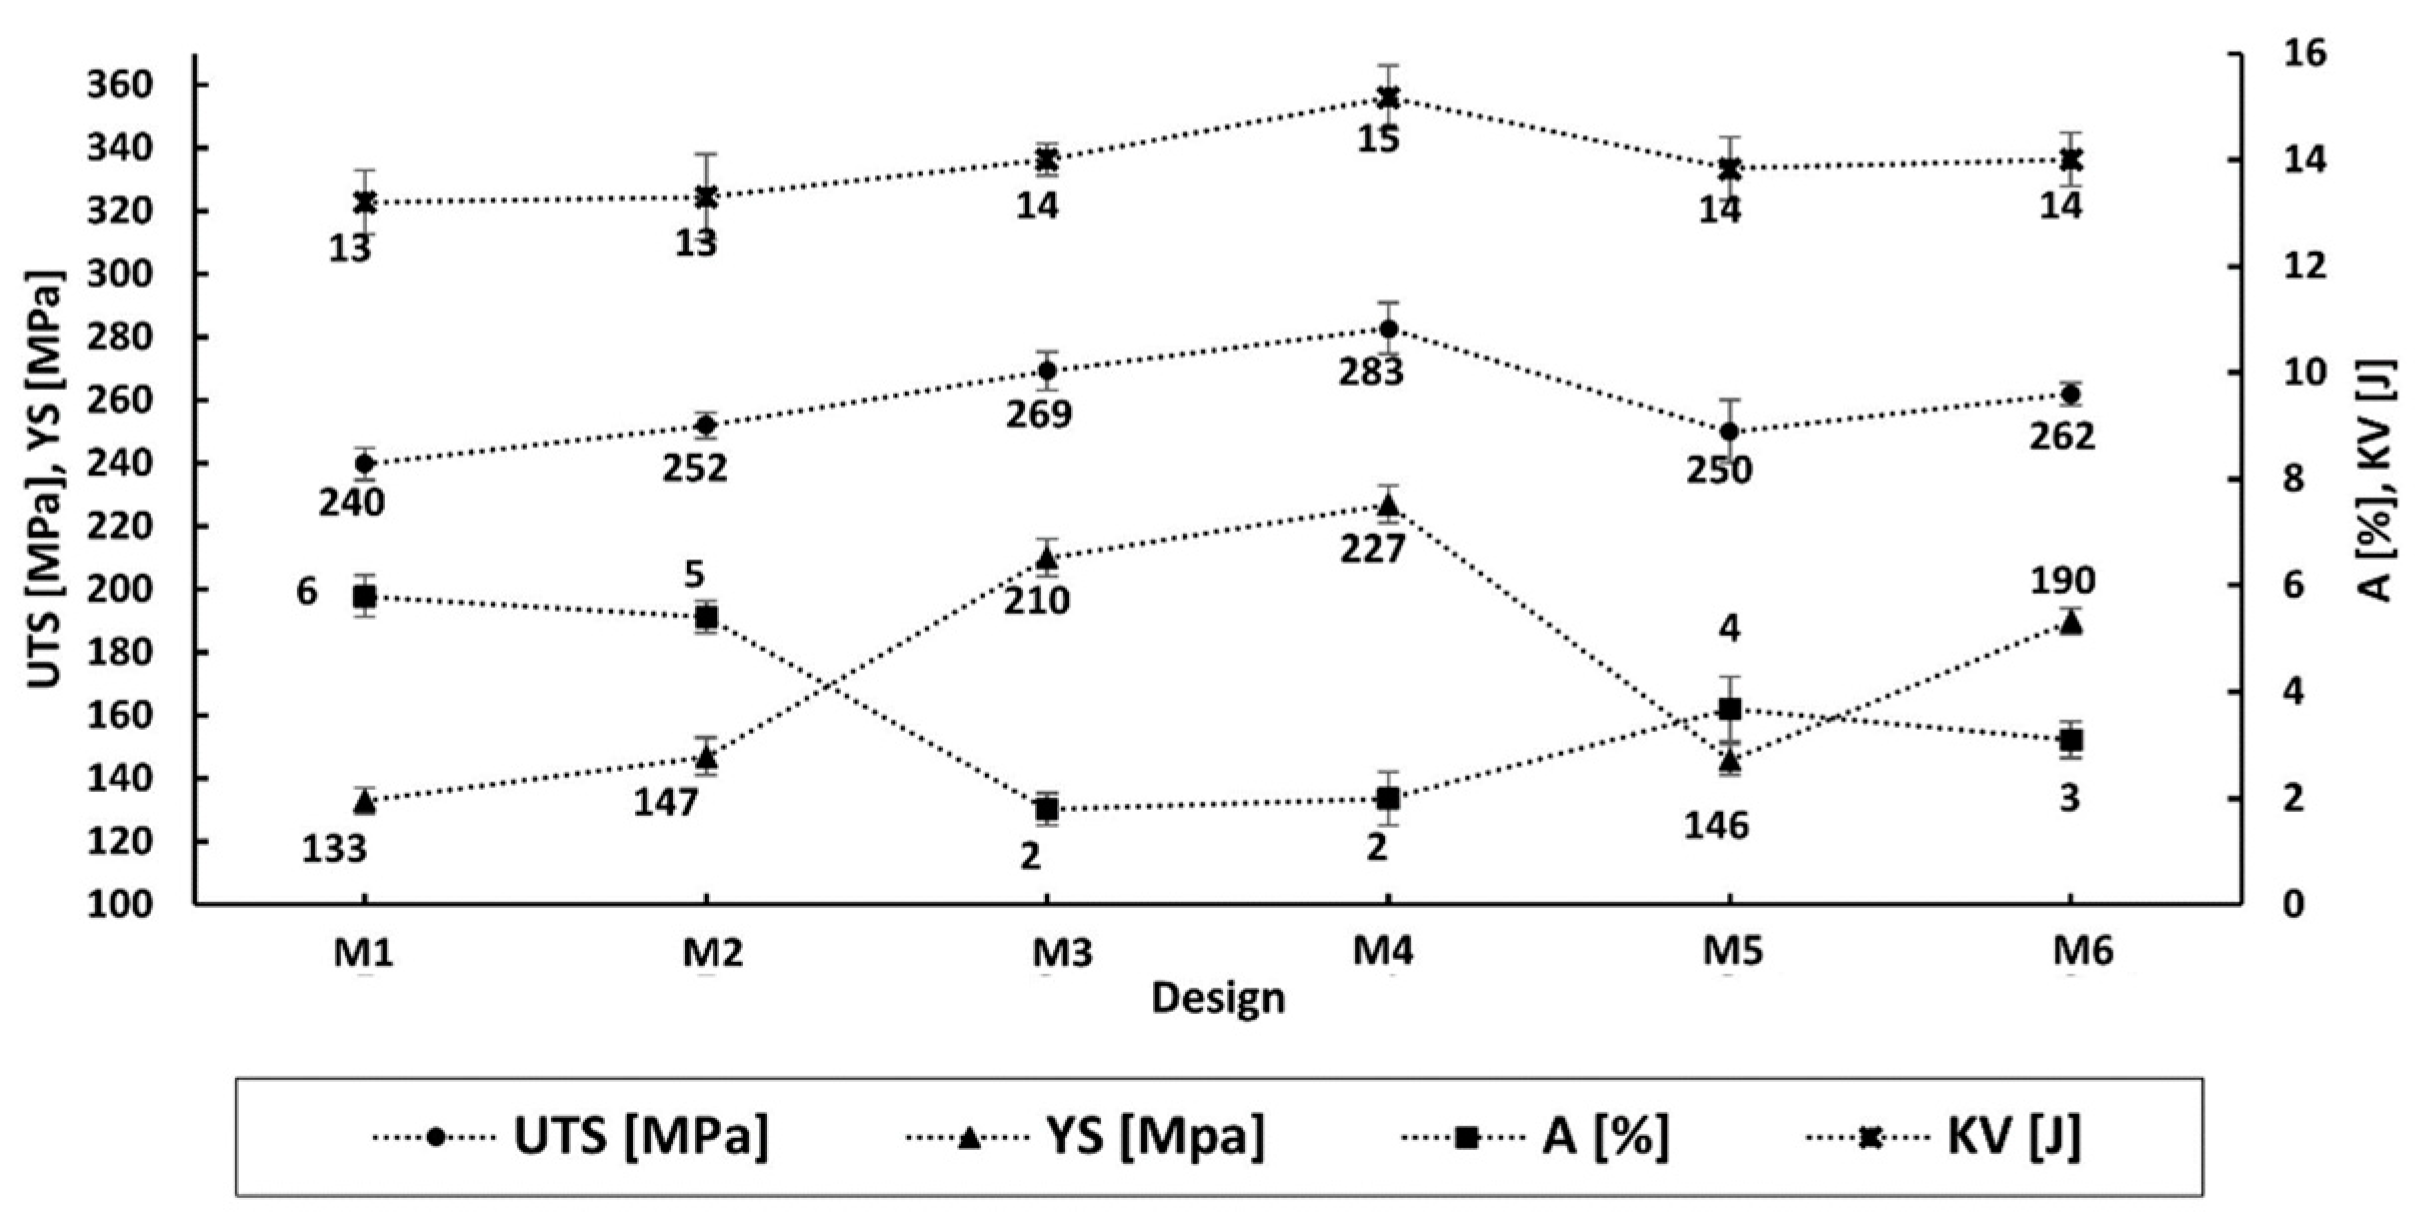
Figure 22 shows a graph of the mean values of the mechanical properties as a function of the modification of the gating system used. It can be seen from the graph that the modification of the gating system used did not have a significant effect on the impact toughness, except for M4 where it increased by 15% compared to M1. From the tensile and yield strength results, it can be seen that the greatest increase was achieved with the foam filter modifications M3 and M4, where better results were obtained with a higher filter density. Compared to the reference gating system M1, the tensile strength of M4 was improved by approximately 18% and the yield strength by 70%. The tensile strength limit and yield strength of M3 increased by 12% and 58%, respectively, and M6 increased by 9% and 43%, respectively. The results are relatively consistent with research in study [28], in which the application of 10 PPI filters had remarkable positive standardized effects on the UTS and % elongation. Filtration of the melt using foam filters has a beneficial effect on the mechanical properties. There is a breakdown of oxide films into smaller formations that do not have such a harmful effect, leading to an increase in the strength of the material. By using a permanent mold, an increase in ductility, mainly by changing the morphology of the eutectic, during solidification can occur. The increase in elongation in the mentioned study was surprising because of the use of sand molds. In the case of materials cast in sand molds, the increase in strength properties is accompanied by a decrease in plastic properties.
The M2 and M5 gating system designs achieved approximately the same values, with an increase in tensile strength of approximately 5% and an increase in yield strength of approximately 11%. Elongation decreased as tensile strength increased. From the evaluation, a certain relationship can be observed between the melt velocity, the flow behind the gate, the number of oxides in the castings, the porosity and the mechanical properties. As the melt velocity behind the gate decreases, the mold cavity fills more smoothly. As the simulations showed, this may also be related to the reduced number of solidified oxides in the castings. Porosity analysis also shows a trend towards a reduction in porosity. Modifications M3 and M4 obtained the lowest porosity values; therefore, the functional section of the samples is the least affected among them, which can also be attributed to obtaining the best values in mechanical properties.
3.6. Microscopic Analysis
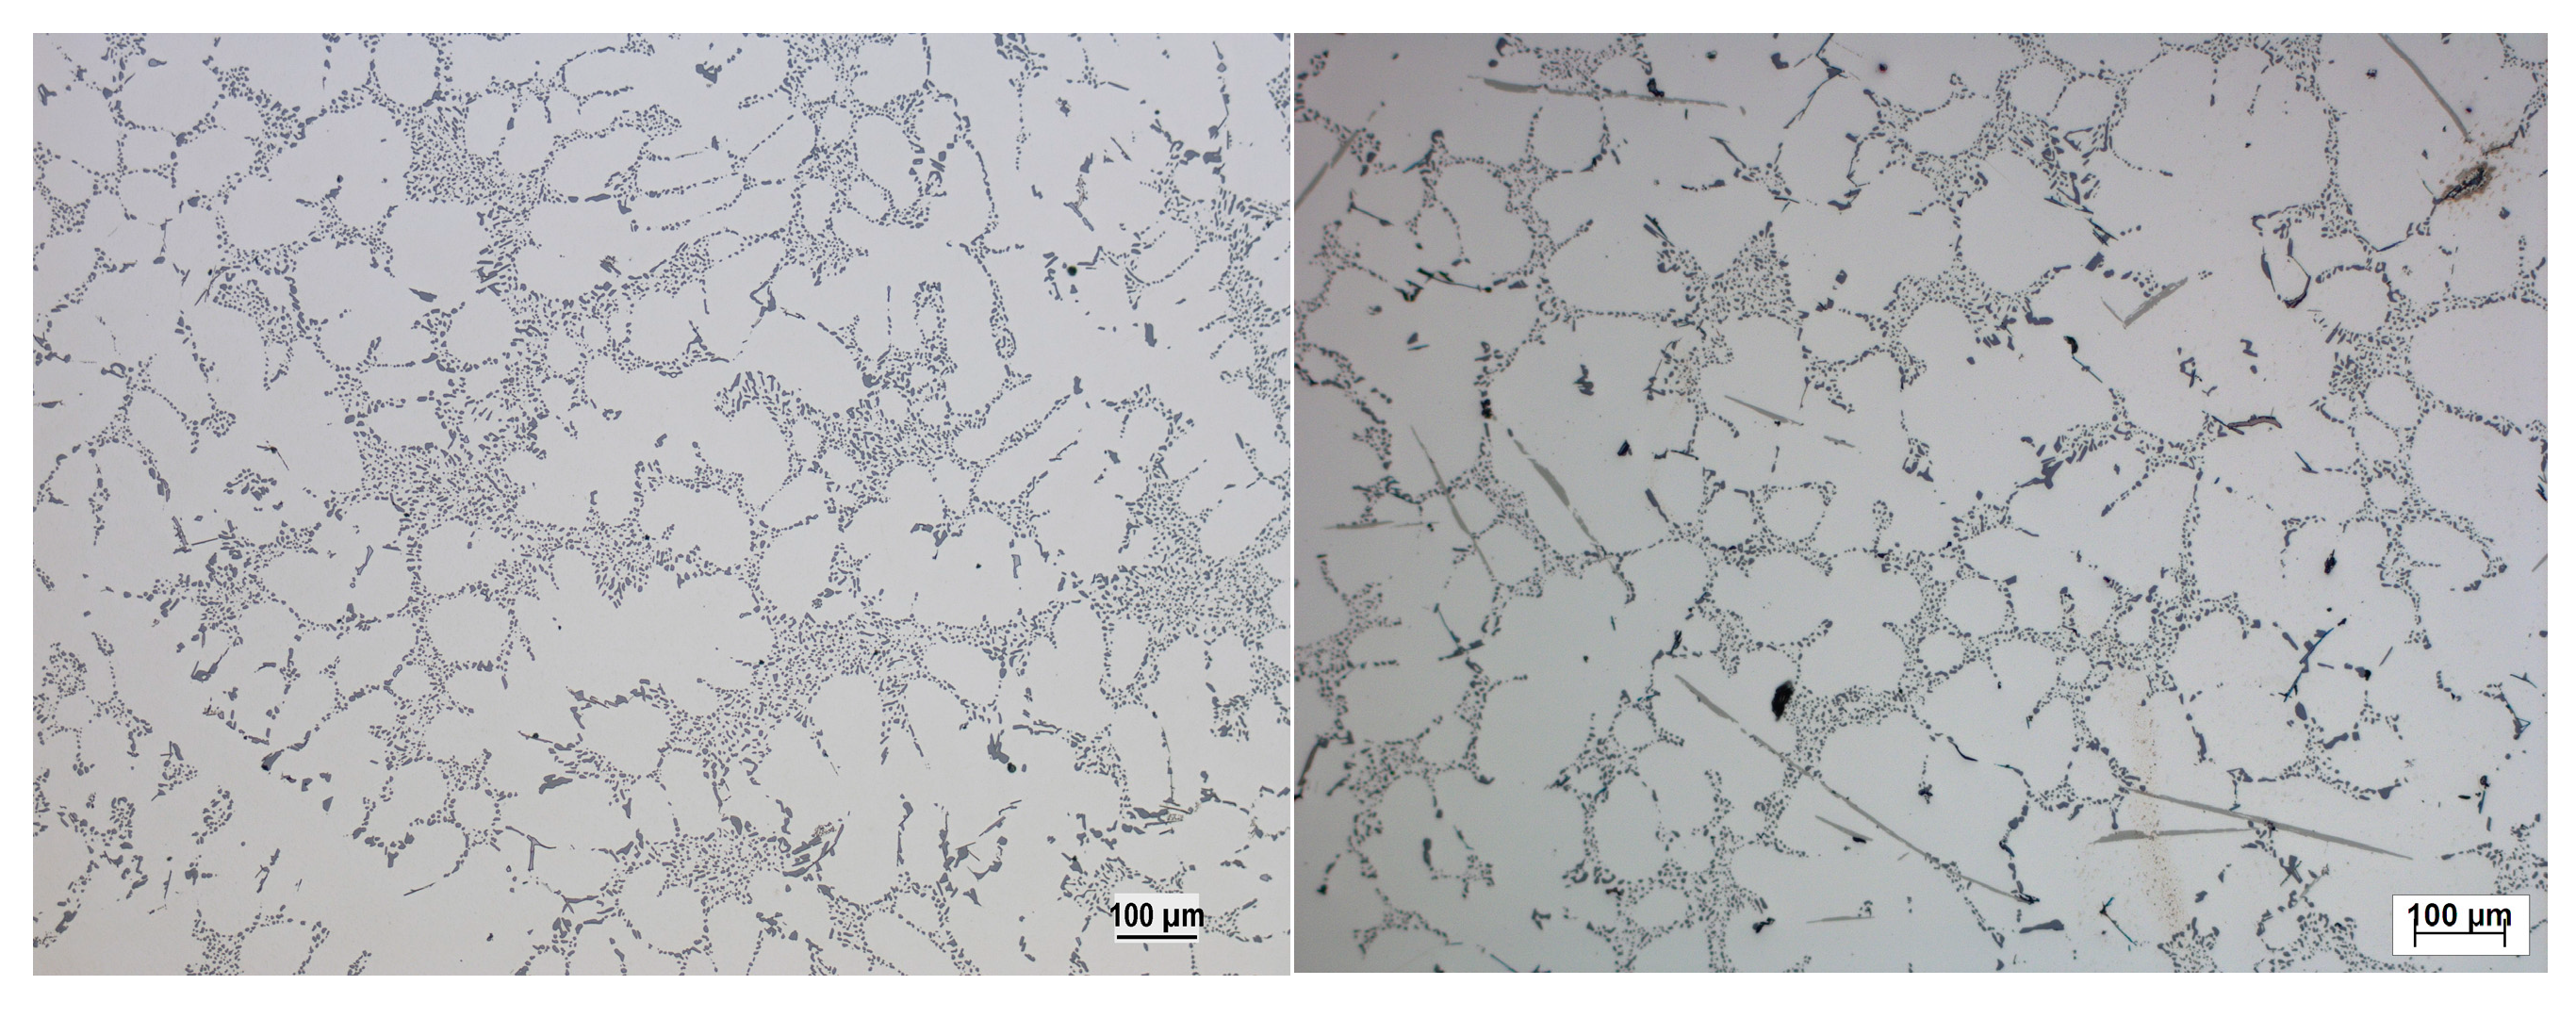
A high-quality primary alloy was chosen for the experiments so that the porosity in the casting was not affected by the nucleation of pores on internal impurities. The structure of the casting is formed by typical structural components for this type of alloy. It consists of dendrites of the alpha phase, eutectic (mechanical mixture of alpha phase and Al2Cu phase) and complex phases based on AlMnCu and AlFeCu (Figure 23 left). The matrix is formed by dendrites of the alpha phase with an SDAS index value for individual modifications in the range of 37 to 52 μm. These values are characteristic for solidification in sand molds. Pores were not observed in the close vicinity of complex phases (Figure 23 right); it can be assessed that the influence of intermetallic phases as initiators of porosity in casts was not confirmed. There was also no influence of the melt flow rate when filling the mold on the structure of the casting.
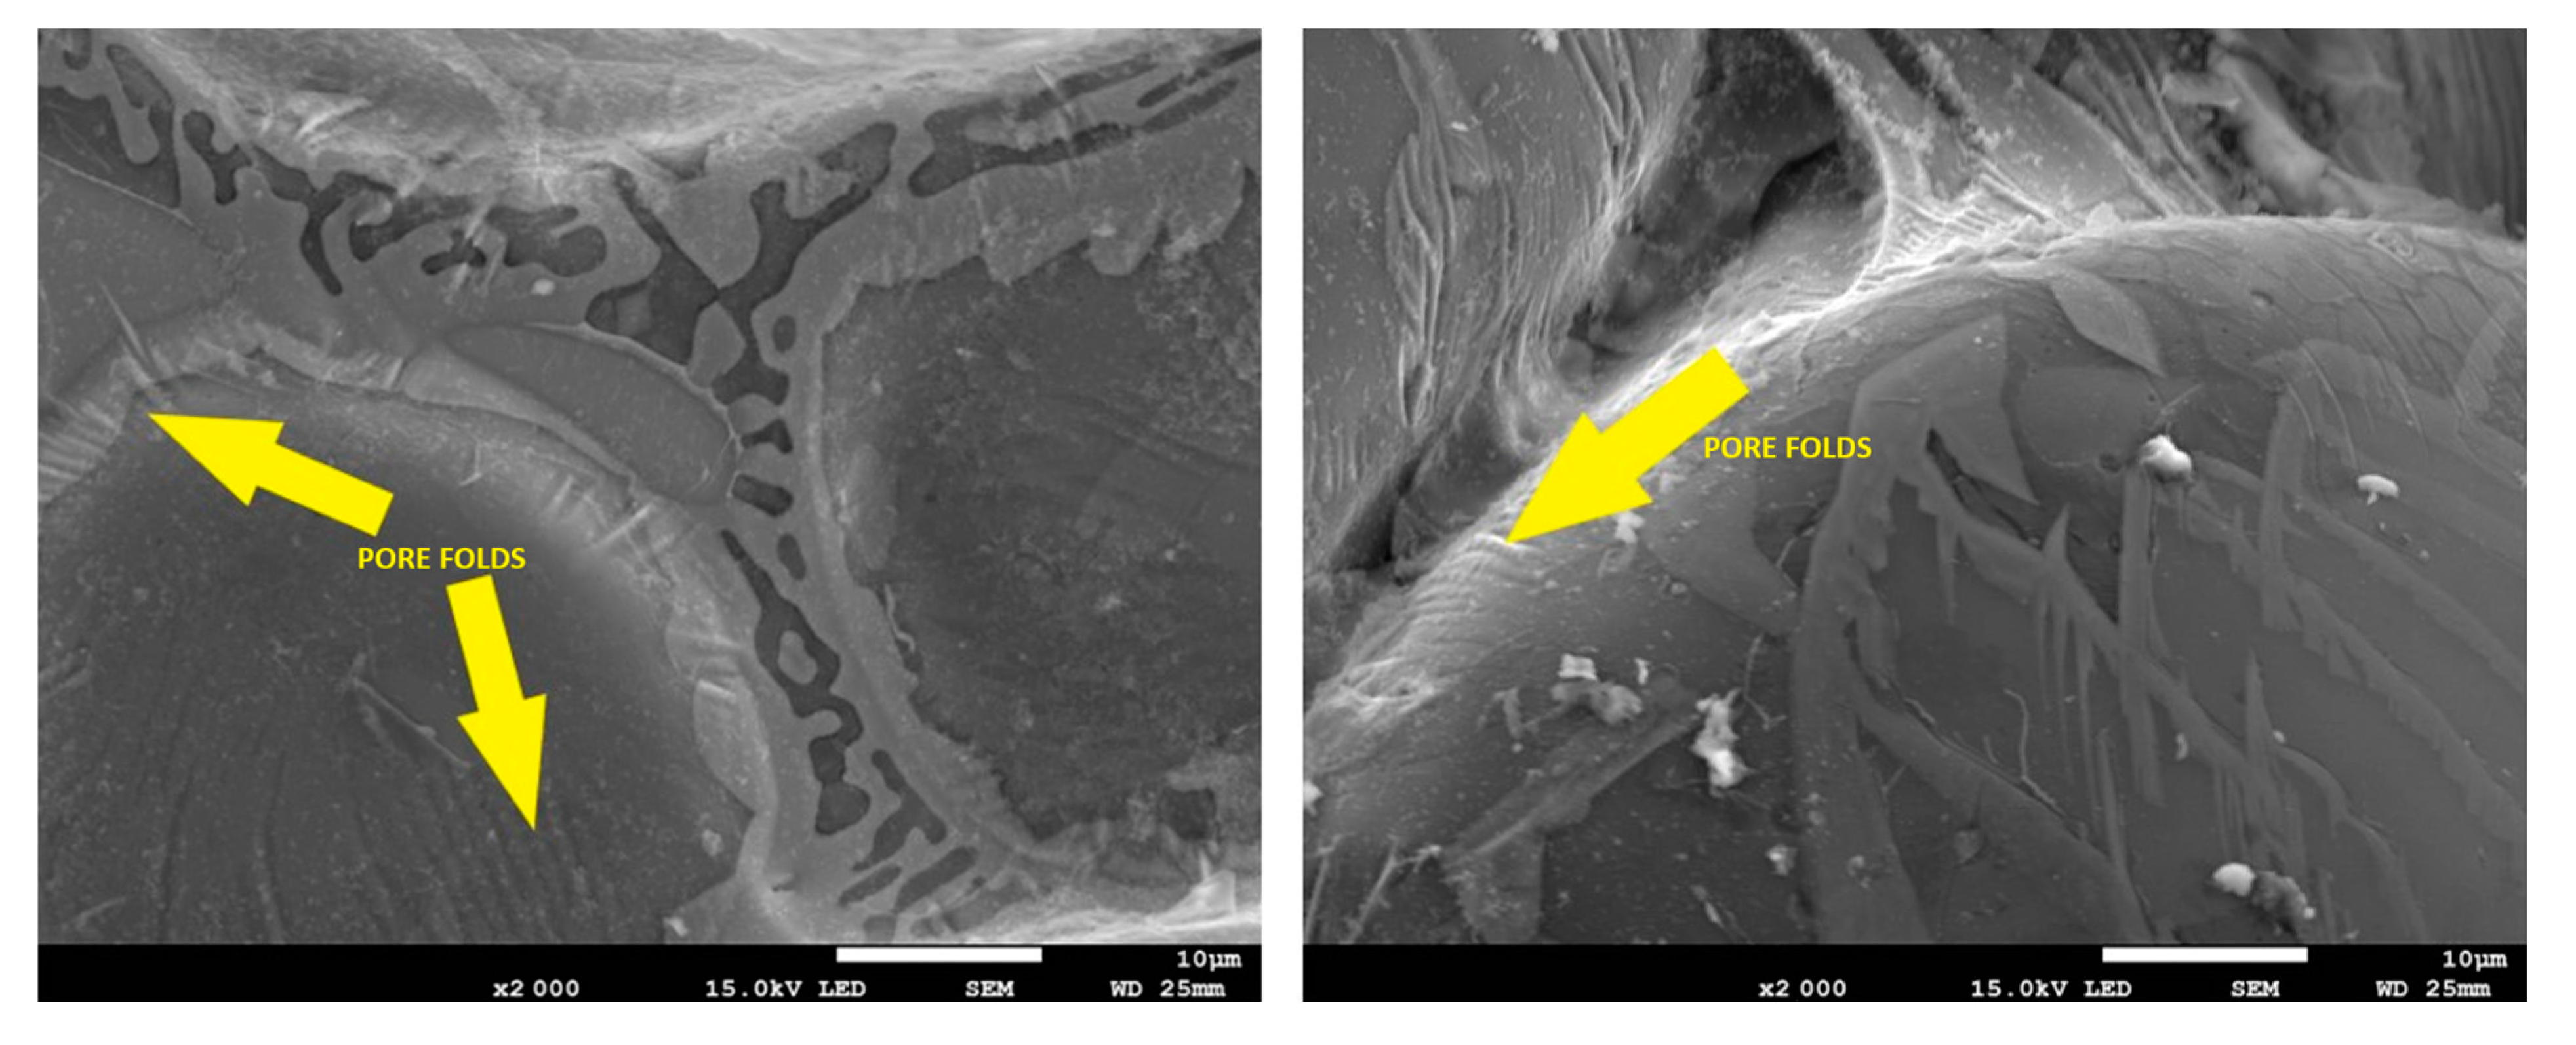
Results of the structure evaluation did not confirm the effect of structure formation on porosity; therefore, an evaluation using SEM-EDX analysis was performed. Since the initiator of the formation of porosity in our case was not individual structural components or impurities, the evaluation of the pore surface focused on the formation of oxides. The relationship between pores and double oxide layers was observed using SEM-EDX analysis because several studies have suggested that the mechanism of pore formation in castings is initiated by entrained double oxide layers. This mechanism suggests the presence of oxide layers on the inside of the pore surface. This theory and the presence of oxides in the pore region are also confirmed by other works [5,7,11]. Figure 24 shows SEM images of the inner surface of pores taken from a random area of a cast sample (M1 on the left and M4 design on the right) to assess areal porosity. The entire pore region was also subjected to EDX element map analysis (Figure 25). EDX analysis of the element map and point EDX analysis showed that there was a certain concentration of oxygen in the surface region of the pores, indicating the presence of an oxide layer. The other pores could also have been formed by this mechanism, as the presence of oxygen was also detected in the other pores analyzed by EDX analysis. The readings for the presence of oxygen may not be accurate, as EDX analyzers can have problems detecting the presence of elements with atomic numbers below 10, but they are able to detect its presence in the sample. In addition to the oxygen content, folds were also observed on the inner surface of the pores (Figure 26), which is a typical morphology of the oxide layer according to works [5] and, therefore, another sign of its presence.
3.7. Metal Yield Determination
The metal yield of each gating system modification was determined by weighing after removal from the mold. The best metal yield was achieved with M1, but the difference between M2 and M4 was negligible (2–5% yield difference). The metal yield of M5 was 11% lower than M1. The worst results were achieved by design M6, where the yield was 55% worse than M1. Even if the quality of the castings were improved with M6, such an increase in metal yield would not be negligible and would significantly increase the cost of the castings. The beneficial effect of the M4 design in providing the best quality castings is not negated by the increase in metal yield.
4. Conclusions
The following conclusions can be drawn from the results obtained:
- -
- The melt velocity in the naturally pressurized gating system, without the use of any element to reduce it, reached supercritical values. The modeling and experimental casts confirm the effectiveness of the gating systems presented here as a means of controlling the velocity of metal entering the mold cavity, although they also allow for a much less turbulent flow of metal through the gating system, thus reducing the possibility of double oxide formation caused by the reoxidation process.
- -
- According to the simulations, the melt velocity behind the gate and the associated nature of the filling of the mold cavity affected the number of oxides in the castings. As the melt velocity increased, there was more turbulent filling of the cavity and the formation of a greater number of oxides in the castings.
- -
- Experimental melts showed a relationship between melt velocity and porosity of the castings. Quantitative evaluation of the surface porosity of the castings showed a trend of decreasing porosity with decreasing melt velocity in the mold cavity. The porosity could be the result of the entrapment of air bubbles between the oxide layers during the impact of the melt from a great height and the turbulent nature of filling the mold cavity.
- -
- The direct dependence between the porosity and the speed of the melt in the gates (Figure 20) documents its more significant influence than the conditions and the course of solidification of the casting.
- -
- The use of a foam filter in the gate area provided the most significant reduction in melt velocity behind the gate compared to other gating system modifications. The higher density of the foam filter provided a greater reduction. The greatest reduction in melt velocity in the mold cavity was achieved with M4, which was associated with: the highest reduction in the oxides; the melt entered the mold cavity without spattering and a smooth filling of the mold cavity was ensured without turbulence, obtaining the most advantageous combination of fluidity, and achieving the lowest level of surface porosity in the castings. Tensile strength, yield strength and toughness were significantly increased, and the best casting quality was achieved without a significant increase in metal yield.
- -
- The pores analyzed proved the presence of oxide layers on their inner surface and a possible theory of pore formation when the initiator of porosity is entrained double oxide layers.
Author Contributions
Conceptualization, M.B. and M.G.; methodology, M.B.; software, E.K.; validation, R.P. and E.K.; formal analysis, R.P.; investigation, M.B.; resources, M.G.; data curation, E.K.; writing—original draft preparation, M.G.; writing—review and editing, M.B.; visualization, E.K.; supervision, R.P.; project administration, M.G.; funding acquisition, M.B. All authors have read and agreed to the published version of the manuscript.
Funding
This paper was supported by VEGA 1/0241/23 and KEGA 029ŽU-4/2023 projects.
Data Availability Statement
The raw data supporting the conclusions of this article will be made available by the authors on request.
Conflicts of Interest
The authors declare that they have no known competing financial interests or personal relationships that could have appeared to influence the work reported in this paper.
References
- Campbell, J. Complete Casting Handbook, 2nd ed.; Elsevier: Oxford, UK, 2015; p. 1054. [Google Scholar]
- Liu, J.; Wang, Q.; Qi, Y. Atomistic simulation of the formation and fracture of oxide bifilms in cast aluminum. Acta Mater. 2019, 164, 673–682. [Google Scholar] [CrossRef]
- Jalilvand, M.M.; Saghafian, H.; Divandari, M.; Akbarifar, M. Surface oxidation study of molten Mg–Al alloys by oxide/metal/oxide sandwich method. J. Magnes. Alloy 2021, 10, 1704–1717. [Google Scholar] [CrossRef]
- Chen, Q.; Griffiths, W. Modification of Double Oxide Film Defects with the Addition of Mo to An AlSi-Mg Alloy. Metall. Mater. Trans. B 2021, 52, 502–516. [Google Scholar] [CrossRef]
- Neuser, M.; Grydin, O.; Andreiev, A.; Schaper, M. Effect of Solidification Rates at Sand Casting on the Mechanical Joinability of a Cast Aluminium Alloy. Metals 2021, 11, 1304. [Google Scholar] [CrossRef]
- Nunes, H.; Emadinia, O.; Soares, R.; Vieira, M.F.; Reis, A. Adding Value to Secondary Aluminum Casting Alloys: A Review on Trends and Achievements. Materials 2023, 16, 895. [Google Scholar] [CrossRef]
- El-Sayed, M.A.; Essa, K.; Hassanin, H. Effect of runner thickness and hydrogen content on the mechanical properties of A356 alloy castings. Int. J. Met. 2022, 16, 2175–2186. [Google Scholar] [CrossRef]
- Gyarmati, G.; Fegyverneki, G.; Tokár, M.; Mende, T. Investigation on Double Oxide Film Initiated Pore Formation in Aluminum Casting Alloys. Int. J. Eng. Manag. Sci. 2020, 5, 141–153. [Google Scholar]
- Metzloff, K.; Mageza, K.; Sekotlong, D. Velocity measurement and verification with modelling of naturally pressurized gating system. Int. J. Met. 2020, 14, 610–621. [Google Scholar]
- Remišová, A.; Brůna, M. Analysis of Reoxidation Processes with Aid of Computer Simulation. Arch. Foundry Eng. 2019, 19, 55–60. [Google Scholar] [CrossRef]
- Dojka, R.; Jezierski, J.; Campbell, J. Optimized Gating System for Steel Castings. J. Mater. Eng. Perform. 2018, 27, 5152–5163. [Google Scholar] [CrossRef]
- Marquardt, W. Continuing the Conversation Naturally Pressurized Fill System. In Proceedings of the SFSA Technical and Operating Conference, Chicago, IL, USA, 11 December 2018; p. 30. [Google Scholar]
- Majidi, S.H.; Beckermann, C. Effect of pouring conditions and gating system design on air entrainment during mold filling. Int. J. Met. 2018, 13, 255–272. [Google Scholar] [CrossRef]
- Poweleit, D. Naturally Pressurized Gating Systems in Investment Castings. In Proceedings of the 73rd SFSA Technical and Operating Conference, Chicago, IL, USA, 11–14 December 2019; p. 17. [Google Scholar]
- Yavuz, H.; Kara, A.; Çubuklusu, H.E.; Aybarç, U. The effect of filter type on filling during Low Pressure Die Casting: A numerical study. J. Achiev. Mater. Manuf. Eng. 2016, 75, 71–77. [Google Scholar] [CrossRef]
- Hwang, H.Y.; Nam, C.H.; Choi, Y.S.; Hong, J.-H.; Sun, X. A study on effects of ceramic foam filter on flow aspect through water modeling experiment. China Foundry 2017, 14, 216–225. [Google Scholar] [CrossRef]
- Kheirabi, A.; Baghani, A.; Bahmani, A.; Tamizifar, M.; Davami, P.; Shabani, M.O.; Mazahery, A. Understanding the occurrence of the surface turbulence in a nonpressurized bottom gating system: Numerical simulation of the melt flow pattern. J. Mater. Des. Appl. 2015, 232, 230–241. [Google Scholar] [CrossRef]
- Lyu, C.; Papanikolaou, M.; Jolly, M. Numerical Process Modelling and Simulation of Campbell Running Systems Designs. In Shape Casting; Springer: Berlin/Heidelberg, Germany, 2019; pp. 53–64. [Google Scholar]
- Papanikolaou, M.; Pagone, E.; Jolly, M.; Salonitis, K. Numerical Simulation and Evaluation of Campbell Running and Gating Systems. Metals 2020, 10, 68. [Google Scholar] [CrossRef]
- Jezierski, J.; Dojka, R.; Janerka, K. Optimizing the Gating System for Steel Castings. Metals 2018, 8, 266. [Google Scholar] [CrossRef]
- Brůna, M.; Galčík, M.; Sládek, A.; Martinec, D. Possibilities of bifilm amount reduction in Al castings by gating system design optimization. Arch. Metall. Mater. 2021, 66, 549–559. [Google Scholar] [CrossRef]
- Bate, C.; King, P.; Sim, J.; Manogharan, G. A Novel Approach to Visualize Liquid Aluminum Flow to Advance Casting Science. Materials 2023, 16, 757. [Google Scholar] [CrossRef]
- Rajkumar, I.; Rajini, N.; Alavudeen, A.; Prabhu, T.R.; Ismail, S.O.; Mohammad, F.; Al-Lohedan, H.A. Experimental and simulation analysis on multi -gate variants in sand casting process. J. Manuf. Process. 2021, 62, 119–131. [Google Scholar] [CrossRef]
- Yousefian, P. Pore Formation in Aluminum Castings: Theoretical Calculations and the Extrinsic Effect of Entrained Surface Oxide Films. Master’s Thesis, University of North Florida, Jacksonville, FL, USA, 2017. [Google Scholar]
- Xinyi, Z.; Ning, Z.L.; Cao, F.Y.; Liu, S.-G.; Huang, Y.-J.; Liu, J.-S.; Sun, J.-F. Effect of Double Oxide Film Defects on Mechanical Properties of As-Cast C95800 Alloy. Acta Metall. Sin. 2017, 30, 541–549. [Google Scholar]
- Farhoodi, B.; Raiszadeh, R.; Ghanaatian, M.H. Role of double oxide film defects in the formation of gas porosity in commercial purity and Sr-containing Al alloys. J. Mater. Sci. Technol. 2014, 30, 154–162. [Google Scholar] [CrossRef]
- Tiryakioğlu, M.; Yousefian, P.; Eason, P.D. Quantification of entrainment damage in A356 aluminum alloy castings. Metall. Mater. Trans. A 2018, 49, 5815–5822. [Google Scholar] [CrossRef]
- El-Sayed, M.A.; Essa, K.; Hassanin, H. Influence of Bifilm Defects Generated during Mould Filling on the Tensile Properties of Al-Si-Mg Cast Alloys. Metals 2022, 12, 160. [Google Scholar] [CrossRef]
Figure 1.
Mold with foam filter and highlighted measurement points.

Figure 2.
Casting construction.

Figure 3.
Gating system modifications: (a) M1, (b) M2, (c) M3 and M4, (d) M5 and (e) M6.

Figure 4.
Measurement points placement in the molds.

Figure 5.
Simulation of melt velocity: (a) M1, (b) M2, (c) M3, (d) M4, (e) M5 and (f) M6.

Figure 6.
Graph of melt velocity evaluation.

Figure 7.
Mold for inspection liquid test, (a) mold dimensions, (b) mold sand blocks, (c) mold covered with PMMA.
Figure 7.
Mold for inspection liquid test, (a) mold dimensions, (b) mold sand blocks, (c) mold covered with PMMA.

Figure 8.
Fluid flow in M1, the color spectrum represents the amount of turbulent energy.

Figure 9.
Fluid flow in M2, the color spectrum represents the amount of turbulent energy.

Figure 10.
Fluid flow in M3, the color spectrum represents the amount of turbulent energy.

Figure 11.
Fluid flow in M4, the color spectrum represents the amount of turbulent energy.

Figure 12.
Fluid flow in M5, the color spectrum represents the amount of turbulent energy.

Figure 13.
Fluid flow in M6, the color spectrum represents the amount of turbulent energy.

Figure 14.
Simulation of number of oxides.

Figure 15.
Location of fluidity test and hot tearing evaluation.

Figure 16.
Fluidity test, the color spectrum represents susceptibility to misrun (red = maximum).

Figure 17.
Specimen placement for porosity evaluation.

Figure 18.
Porosity evaluation.

Figure 19.
Graph of porosity evaluation.

Figure 20.
Parabolic dependence between the surface porosity and the melt velocity in the gates3.6 Mechanical properties evaluation.
Figure 20.
Parabolic dependence between the surface porosity and the melt velocity in the gates3.6 Mechanical properties evaluation.

Figure 21.
Specimen placement for mechanical properties evaluation.

Figure 22.
Graph of mechanical properties evaluation.

Figure 23.
Structural components of investigated alloy.

Figure 24.
SEM analysis of inner pore surface with point EDX analysis (Left for M1, Right for M4).

Figure 25.
EDX map analysis of inner pore surface (M1 design).

Figure 26.
Oxide film folds in the inner pore surface.


Table 1.
Casting chemical composition.
| Element | Si | Fe | Cu | Mn | Zn | Ti | Al |
|---|---|---|---|---|---|---|---|
| w.% | 0.05 | 0.11 | 5.03 | 0.42 | 0.01 | 0.19 | bal. |
Disclaimer/Publisher’s Note: The statements, opinions and data contained in all publications are solely those of the individual author(s) and contributor(s) and not of MDPI and/or the editor(s). MDPI and/or the editor(s) disclaim responsibility for any injury to people or property resulting from any ideas, methods, instructions or products referred to in the content. |
© 2024 by the authors. Licensee MDPI, Basel, Switzerland. This article is an open access article distributed under the terms and conditions of the Creative Commons Attribution (CC BY) license (https://creativecommons.org/licenses/by/4.0/).
Share and Cite
MDPI and ACS Style
Brůna, M.; Galcik, M.; Pastircak, R.; Kantorikova, E. Effect of Gating System Design on the Quality of Aluminum Alloy Castings. Metals 2024, 14, 312. https://doi.org/10.3390/met14030312
AMA Style
Brůna M, Galcik M, Pastircak R, Kantorikova E. Effect of Gating System Design on the Quality of Aluminum Alloy Castings. Metals. 2024; 14(3):312. https://doi.org/10.3390/met14030312
Chicago/Turabian StyleBrůna, Marek, Marek Galcik, Richard Pastircak, and Elena Kantorikova. 2024. "Effect of Gating System Design on the Quality of Aluminum Alloy Castings" Metals 14, no. 3: 312. https://doi.org/10.3390/met14030312
Note that from the first issue of 2016, this journal uses article numbers instead of page numbers. See further details here.