Abstract
The nitrate pollution of waters and groundwaters is an important environmental and health concern. An interesting method to remove the oxidized forms of nitrogen from waters and wastewaters is chemical denitrification by means of metallic iron (Fe0). Particularly advantageous is the use of nanoscopic zero-valent iron particles due to the elevated surface area, which allows reaching extremely high reaction rates. In the present paper, the efficiency of nitrate reduction by means of nanoscopic Fe0 has been investigated under several operating conditions. The iron nanoparticles were synthesized by the chemical reduction of ferric ions with sodium borohydride. The effects of Fe0 dosage, initial N–NO3− concentration and pH on chemical denitrification were identified. In particular, the results of the tests carried out showed that it is possible to reach an almost complete nitrate reduction in treating solutions with a nitrate nitrogen concentration higher than 50 mg/L. Moreover, the process performance was satisfactory also under uncontrolled pH. By means of the trends detected during the experiments, the kinetic-type reaction was identified. Furthermore, a relation between the kinetic constant and the process parameters was defined.
1. Introduction
Nitrate pollution is a serious environmental problem, because it causes eutrophication phenomena and may lead to diseases when drinking water sources are contaminated. The sources of nitrogen compounds include nitrogenous fertilizers, animal manure, municipal and industrial wastewaters. Many physicochemical and biological processes, such as ion exchange, reverse osmosis and biological denitrification, have been used to remove nitrate from waters and wastewaters. However, ion exchange and reverse osmosis may be expensive, because they require frequent regeneration of the media and generate secondary waste [1]. Biological denitrification, the most widely-used method, produces excessive biomass and soluble microbial products that require further expensive treatment for use in drinking water supplies. Moreover, the microbial processes are generally slow and sometimes incomplete compared to chemical processes [1]. The N–NO3− chemical reduction to ammonia by means of microscopic zero-valent iron has been widely studied, because this metal is abundant, inexpensive and readily available and because its reduction process requires little maintenance [1,2,3,4,5,6,7,8,9,10,11,12]. The performance of Fe0 treatment is dependent on the pH value in the aqueous system. Generally, rapid reduction of nitrate by Fe0 occurred at pH ≤ 4, which is probably related to the enhanced iron corrosion in acid solution. Under environmental conditions, the iron corrosion products, such as iron oxides, oxide hydroxides or salts, which are usually coated on the Fe0 surface, could slow down the nitrate reduction reaction. Thus, the process requires acidic conditions to achieve the best performances. Several compounds, such as H2SO4, HCl, acetic acid and buffered agents, were used to speed up the rate of nitrate removal [3]. However, these methods are not convenient in practical applications, because the costs are significantly increased and because the release into waters of undesired compounds, such as sulfate, chloride etc., occurs. Moreover, in the nitrate removal by Fe0, a high transfer into the solution of soluble iron generally occurs. Therefore, in order to recovery these ions, further treatment is generally needed. In some works, the efficiency of the treatment was improved by the addition to the solution of a sufficient amount of Fe2+, because, in this way, it is possible to locally transform the corrosion products into reactive compounds, so as to facilitate nitrate reduction [4]. Furthermore, in the presence of Fe2+, dissolved oxygen does not seem to interfere with rapid nitrate reduction by Fe0 [4]. The adaptation of nano-scale zero-valent iron (NZVI) for the decontamination of water and wastewaters has several advantages compared to micro-scale ZVI. Reducing the particle size of granular Fe0 materials (mm) to 10–100 nm, it increases the surface area and, thus, the reaction rates. Moreover, the nano-Fe0 can be applied in the treatment process in slurry form, which facilitates the contact with the contaminant. These factors allow operating with lower dosages and obtaining a high and stable reactivity. Furthermore, the recovery of NZVI particles after the treatment could be easy accomplished. In fact, it is a common behavior that nanoparticles would aggregate in clusters in aqueous solution unless they are dispersed by a surfactant. Therefore, synthesized nanoscale iron particles can be easily separated from liquid by filtration or other physical separation processes [5]. In the present paper, the results of an experimental activity conducted to investigate the efficiency of nanoscale zero-valent iron (NZVI) particles for chemical denitrification of nitrate nitrogen in aqueous solutions, under different operating conditions, are reported. Nanosized iron was synthesized by chemical reduction of ferric ions with sodium borohydride. Several batch experiments were carried out to evaluate the influence of nitrate concentrations, iron amounts and pH on the process performance. In particular, contrary to the common zero-valent iron applications, the applicability of NZVI particles without pH setting was also verified. Furthermore, a detailed analysis was conducted to identify the type of reaction kinetics.
2. Experimental Section
2.1. Preparation of Nanosized Iron
In this study nanosized iron was synthesized by chemical reduction of ferric ions with sodium borohydride [1,5] according to the following reaction:
4Fe3+ + 3BH4− + 9H2O → 4Fe0 + 3H2BO3− + 12H+ + 6H2
In a typical synthesis procedure, 33.77 g of FeCl3·6H2O were dissolved in 250 mL of bi-distilled water (0.5 M of Fe3+). The resulting solution was transferred to a glass beaker of 500-mL capacity. Then, 9.45 g of NaBH4 powder were dissolved in 250 mL bi-distilled water (1 M of B5−), and this was added incrementally to the FeCl3·6H2O solution by means of a peristaltic pump with a flowrate of about 10 mL/min. The mixture was mechanically stirred at 250 rpm during the NaBH4 feeding. The mixing was stopped 15 min after the entire sodium borohydride solution was added. No surfactant was added to keep the iron particles dispersed. The mixture was centrifuged for 30 min at 4000 rpm, and the recovered solid was washed twice with bi-distilled water. The prepared wet NZVI was used immediately for batch experiments.
2.2. Nitrate Reduction by NZVI
The experiments were carried out in order to investigate the influence of NVZI, nitrate concentrations and pH on process performance. A total of 36 tests were conducted using wet iron amounts of 1 g/L, 2 g/L, 3 g/L and 5 g/L for the treatment of solutions with initial nitrate concentrations (Ni) of about 50 mgN/L, 70 mgN/L and 95 mgN/L, at conditions of pH 3, 5 and uncontrolled. Batch tests for nitrate reduction were conducted in 0.5-L glass beakers. The reactor was filled with 300 mL of nitrate standard solutions (prepared using KNO3 salt), then wet NZVI particles were added to the reaction solution. The dispersion was continuously mixed with a mechanical stirrer at 350 rpm for 60 min. During the tests conducted with the pH setting, HCl (1 N) was added to hold the established pH value. The reactions were conducted at atmospheric conditions at a temperature of about 20 °C. No attempts were made to exclude oxygen during the experiments. Samples of 5 mL were periodically taken and immediately analyzed, after a filtration at 0.45 μm, with respect to nitrogen compounds (N–NO3−, N–NO2− and N–NH4+) and dissolved iron ions.
2.3. Analytical Methods and Presentation of Results
The BET surface area of nanoparticles was determined by Micromeritics (Thermo Sorptomatic 1990, Waltham, MA, USA). XRD (Philips PW 1710, Amsterdam, The Netherlands) was used to characterize the iron corrosion products. During the nitrate removal tests, temperature, pH and dissolved oxygen were measured by a multiparametric analyzer (Hanna HI 98196, Padova, Italy); N–NO3−, N–NO2−, N–NH4+ and iron ions by colorimetric methods using a UV spectrophotometer (Thermo Genesys10uv, Waltham, MA, USA) [13]. Each measurement was carried out three times, and the mean value was considered. The results of the efficiencies reported were representative of the actual removal or production of the compounds. Thus, the values were not affected by dilution because of reactant additions in the various processes.
3. Results and Discussion
3.1. Nitrate Abatement by Fe0 Nanoparticles
The iron particles synthesized in this study were determined to have a specific surface area of 39.36 m2/g, in line with the values reported in the literature [1,5]. The results of the experiments conducted by means of the prepared nanoparticles are reported in Table 1 and Figure 1, Figure 2, Figure 3 and Figure 4. For each pH condition, growing nitrate reductions in response to the increase of Fe0 mass were detected. In particular, in treating solutions with an initial N–NO3− concentration of about 50 mg/L, at pH = 3 and with the lower amount of nanoparticles, an abatement close to 56% was obtained, reaching a residual concentration of about 23 mg/L (Figure 1a). This yield rapidly increased up to an almost complete nitrate abatement using a concentration of nanoparticles equal to 2 g/L. (Figure 1a).

Table 1.
Nitrate abatement, nitrate removed, ammonium produced, dissolved iron and the specific reaction rate (k) detected for each test.
| pH | Ni mg/L | Fe0 g/L | N–NO3− Abatement (%) | N–NO3− Removed (mg/L) | N–NH4+ Produced (mg/L) | Fe2+ mg/L | k min−1 |
|---|---|---|---|---|---|---|---|
| 3 | 50 | 1 | 56.1 | 28.2 | 27.6 | 198 | 0.013 |
| 2 | 99.9 | 49.2 | 47.8 | 491 | 0.091 | ||
| 3 | 99.9 | 49.6 | 46.3 | 705 | 0.185 | ||
| 5 | 99.9 | 50.8 | 48.5 | 1408 | 0.282 | ||
| 70 | 1 | 36.2 | 26.9 | 24.4 | 197 | 0.008 | |
| 2 | 74.3 | 52.9 | 49.3 | 605 | 0.025 | ||
| 3 | 84.4 | 59.2 | 58.5 | 803 | 0.034 | ||
| 5 | 99.9 | 71.7 | 70.2 | 1530 | 0.135 | ||
| 95 | 1 | 32.1 | 31.2 | 31.0 | 198 | 0.006 | |
| 2 | 60.2 | 58.6 | 57.6 | 491 | 0.019 | ||
| 3 | 92.4 | 89.6 | 88.3 | 705 | 0.029 | ||
| 5 | 99.9 | 98.5 | 97.3 | 1408 | 0.075 | ||
| 5 | 50 | 1 | 52.0 | 24.6 | 23.0 | 48 | 0.015 |
| 2 | 97.1 | 48.3 | 47.6 | 230 | 0.054 | ||
| 3 | 99.9 | 51.0 | 48.1 | 350 | 0.109 | ||
| 5 | 99.9 | 52.2 | 48.3 | 1200 | 0.209 | ||
| 70 | 1 | 38.3 | 26.3 | 23.0 | 96 | 0.008 | |
| 2 | 83.0 | 56.4 | 55.1 | 232 | 0.029 | ||
| 3 | 99.9 | 65.3 | 62.4 | 235 | 0.073 | ||
| 5 | 99.9 | 69.4 | 69.1 | 530 | 0.084 | ||
| 95 | 1 | 28.4 | 27.5 | 26.7 | 32 | 0.004 | |
| 2 | 61.0 | 57.9 | 56.5 | 126 | 0.014 | ||
| 3 | 69.2 | 66.4 | 64.6 | 168 | 0.019 | ||
| 5 | 73.1 | 71.2 | 70.1 | 370 | 0.029 | ||
| uncontrolled | 50 | 1 | 42.3 | 20.3 | 16.0 | 4.0 | 0.010 |
| 2 | 77.1 | 37.3 | 33.1 | 4.2 | 0.021 | ||
| 3 | 80.0 | 39.2 | 34.1 | 4.6 | 0.022 | ||
| 5 | 98.0 | 44.6 | 40.5 | 6.0 | 0.060 | ||
| 70 | 1 | 32.4 | 22.0 | 16.4 | 5.0 | 0.007 | |
| 2 | 59.2 | 42.9 | 30.1 | 6.3 | 0.015 | ||
| 3 | 60.5 | 44.1 | 34.6 | 7.0 | 0.016 | ||
| 5 | 87.1 | 59.2 | 41.5 | 6.8 | 0.034 | ||
| 95 | 1 | 29.5 | 28.7 | 20.7 | 4.0 | 0.005 | |
| 2 | 45.2 | 44.0 | 30.8 | 5.4 | 0.010 | ||
| 3 | 47.4 | 46.3 | 40.3 | 5.7 | 0.010 | ||
| 5 | 63.0 | 61.7 | 43.0 | 5.7 | 0.015 |
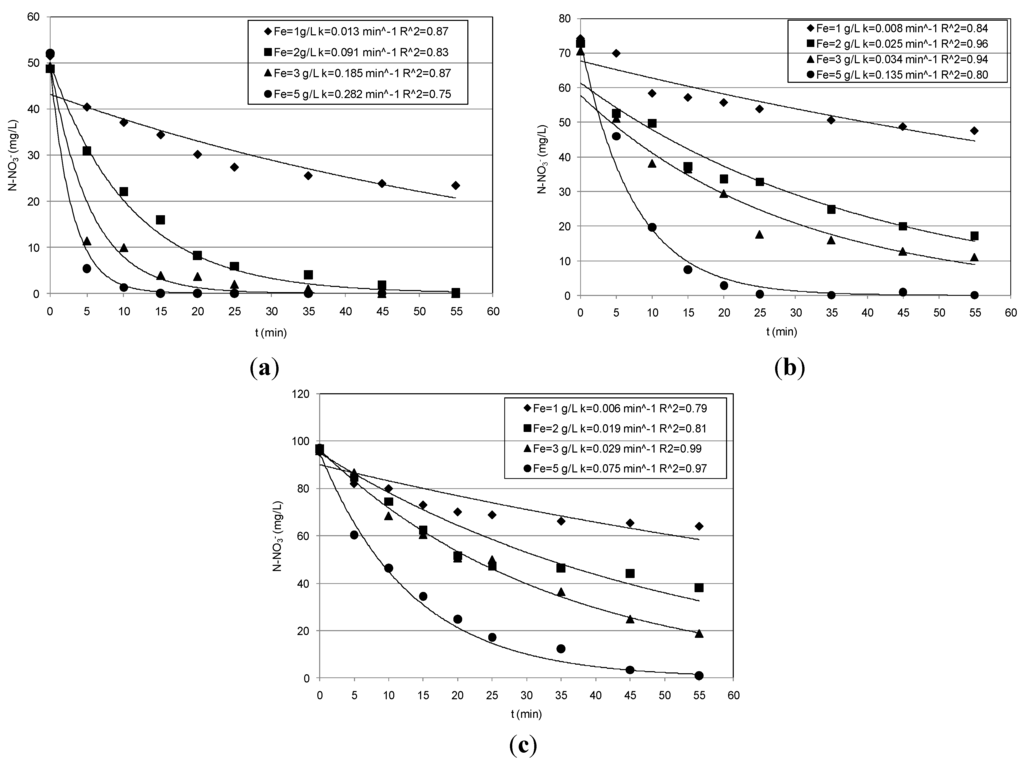
Figure 1.
Trends of nitrate concentrations detected during the tests conducted at pH = 3: (a) Ni = 50 mg/L; (b) 70 mg/L; (c) 95 mg/L.
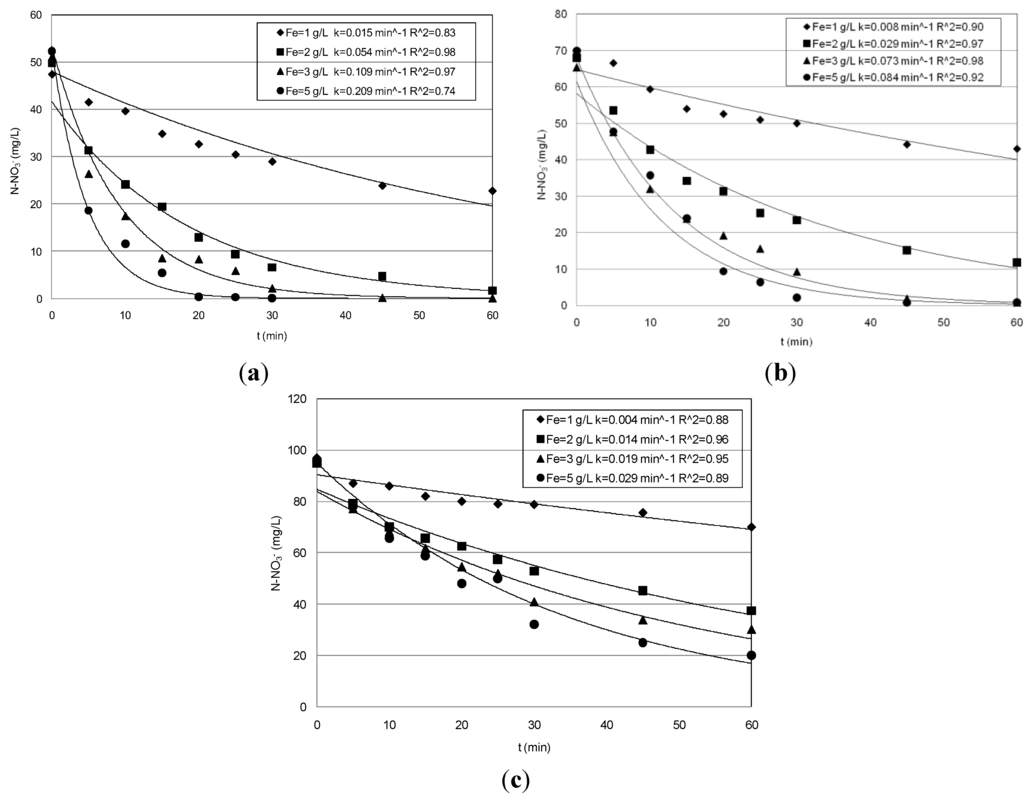
Figure 2.
Trends of nitrate concentrations detected during the tests conducted at pH = 5: (a) Ni = 50 mg/L; (b) 70 mg/L; (c) 95 mg/L.
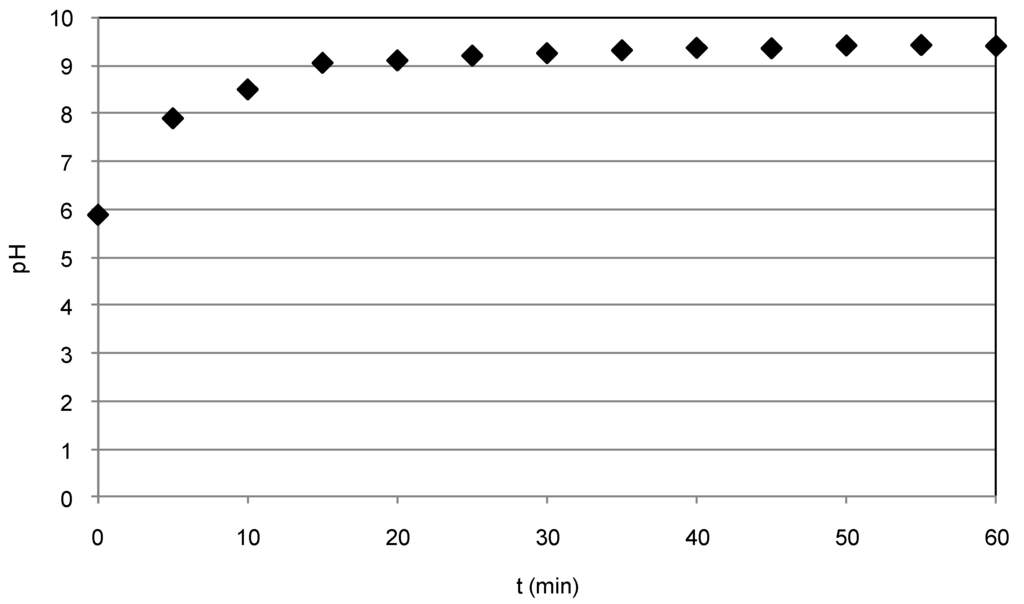
Figure 3.
pH trend during the test conducted with Fe0 = 3 g/L, Ni = 50 mg/L and uncontrolled pH.
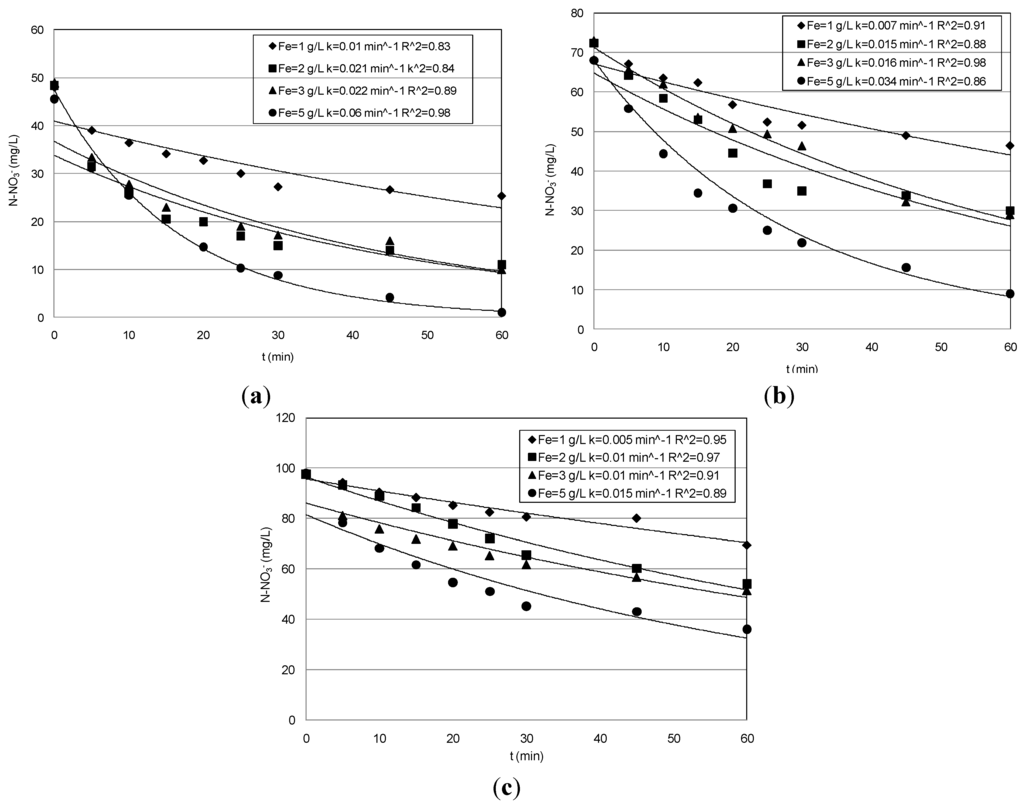
Figure 4.
Trends of nitrate concentrations detected during the tests conducted at uncontrolled pH: (a) Ni = 50 mg/L; (b) 70 mg/L; (c) 95 mg/L.
Smaller performances were obtained in the tests conducted with higher nitrate concentrations (Table 1). Indeed, the curves plotted in Figure 1b,c show slower decreasing trends in the tests carried out with solutions characterized by initial concentrations of 70 mg/L and 95 mg/L. This is also noticeable from the specific reaction rates (k) identified by interpolating the experimental results (see Section 3.2). By comparing the k values for the two last sets of tests (Table 1), just a moderate reduction was observed. Only with the greatest Fe0 quantity a notable gap between the kinetic constant values (k) was detected (Table 1). Anyhow, using the Fe0 amount of 1 g/L, the efficiencies were around 32% and 36% in treating 70 mg/L and 95 mg/L respectively; then they progressively increased, reaching a complete nitrate removal with the highest nanoparticles dosage (Table 1, Figure 1b,c).
These results, taking into account the amounts of nitrate and iron used for the experiments, are consistent with those detected by Yang [5], confirming the reduction power of nanoscopic Fe0 also in treating highly concentrated solutions. Moreover, our tests showed only slight reductions of the process performance with increasing the pH to five (Table 1, Figure 2).
In particular, the yields obtained during the tests conducted with the lower nitrate concentration were analogous to that obtained at pH = 3. Indeed, although a general reduction occurred in response to pH increase, the reactions rates were such that they ensured particularly high abatements in treating solutions with 50 mg/L of nitrate nitrogen (Figure 2a). Furthermore, compared to those observed at pH = 3, even higher abatements were detected with the initial nitrate amount of 70 mg/L (Table 1, Figure 2b). Instead, during the set of experiments carried out with 95 mg/L, lower performances were detected using Fe0 amounts of 3 g/L and 5 g/L. In fact, yields higher than 90% were obtained at pH = 3, while a maximum yield of about 70% was observed at pH = 5, reaching a final concentration of about 20 mg/L (Figure 2c). Thus, the above results indicate that, by increasing the process pH up to five, only a meaningful abatement reduction occurred for the highest nitrate concentrations tested in this study. In the experiments conducted without pH control, the initial value was about 5.9, 5.6 and 5.4 for the solutions with 50, 70 and 95 mg/L, respectively. The above initial pH values rapidly increased during the process up to reaching in a few minutes values higher than nine (Figure 3). However, remarkable nitrate reductions were also observed with these process conditions (Table 1). In particular, with the lower nitrate concentration, the yields increased from 42% to about 98% in response to iron dosage enhancement from 1 g/L–5 g/L (Table 1, Figure 4a). Maximum abatements around 87% and 63%, reaching residual concentration of about 9 mg/L and 35 mg/L, were obtained in treating solutions characterized with nitrate amount of 70 mg/L and 95 mg/L, respectively (Figure 4b,c).
These yields are significantly higher than those reported in other works in which a remarkable loss in process efficiency at a pH value higher than four was observed [5,14]. This is generally attributed to the formation, with the pH increase, of protective layers at the surface of nanosized ZVI that reduce the reactive sites for chemical reduction of nitrate [5]. To increase the process performance under uncontrolled pH, some works have tested Fe/Cu bimetallic nanoscopic materials [1,15]. In this way, however, a transfer in the solution of Cu ions could occur, which can form stable complexes that are difficult to remove, with the ammonia nitrogen [16] produced during the nitrate reduction.
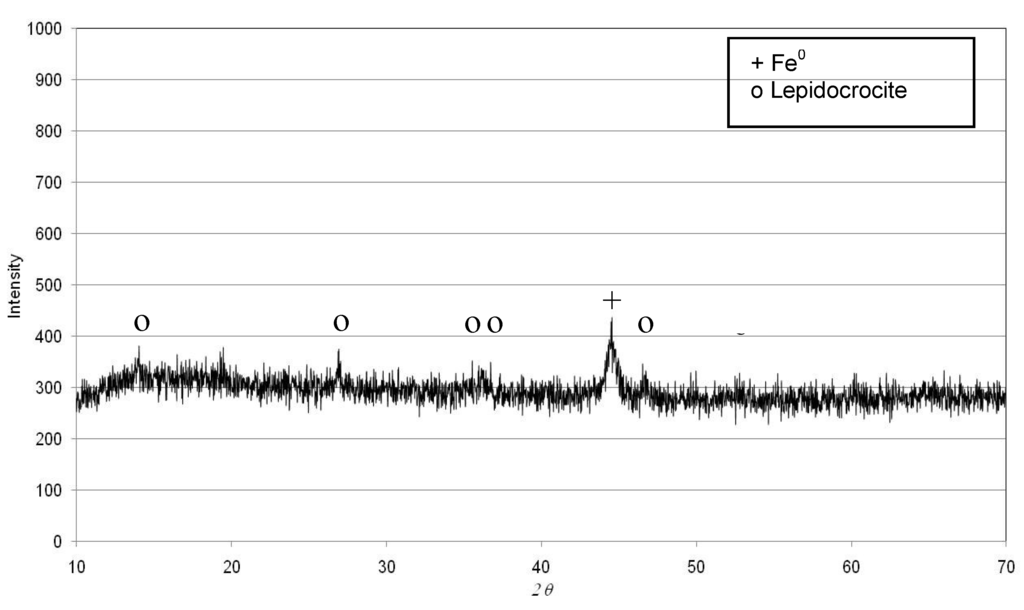
Figure 5.
XRD of iron corrosion product after the tests conducted with Fe0 = 3 g/L, Ni = 50 mg/L and pH = 3.
Our results, instead, are in agreement with Cheng et al. [17], who stated that also iron corrosion products may be responsible for appreciable nitrate reduction. In fact, as shown in Figure 4, in our tests the N–NO3− abatement proceeds beyond the time required to reach pH 9 (Figure 3) and, thus, over the corrosion products’ formation. Moreover, from the XRD analysis of iron particles recovered after the treatment, appreciable differences between the spectra obtained in the tests carried out at acid conditions and those under uncontrolled pH do not appear (Figure 5 and Figure 6). In fact, in both cases, it seems that the main iron corrosion product could be lepidocrocite (γ-FeOOH) [4]. These statements suggest that the prevailing amount of iron corrosion products is generated during the first minutes of treatment. Lepidocrocite could be initially-formed by O2 because our tests have been conducted in aerobic environment. Indeed, other works detected, in similar process conditions, mainly lepidocrocite instead of magnetite (Fe3O4) or maghemite (γ-Fe3O4) [4]. On the contrary, Fe3O4 and γ-Fe3O4 are commonly observed in experiments conducted in controlled anoxic conditions [4].
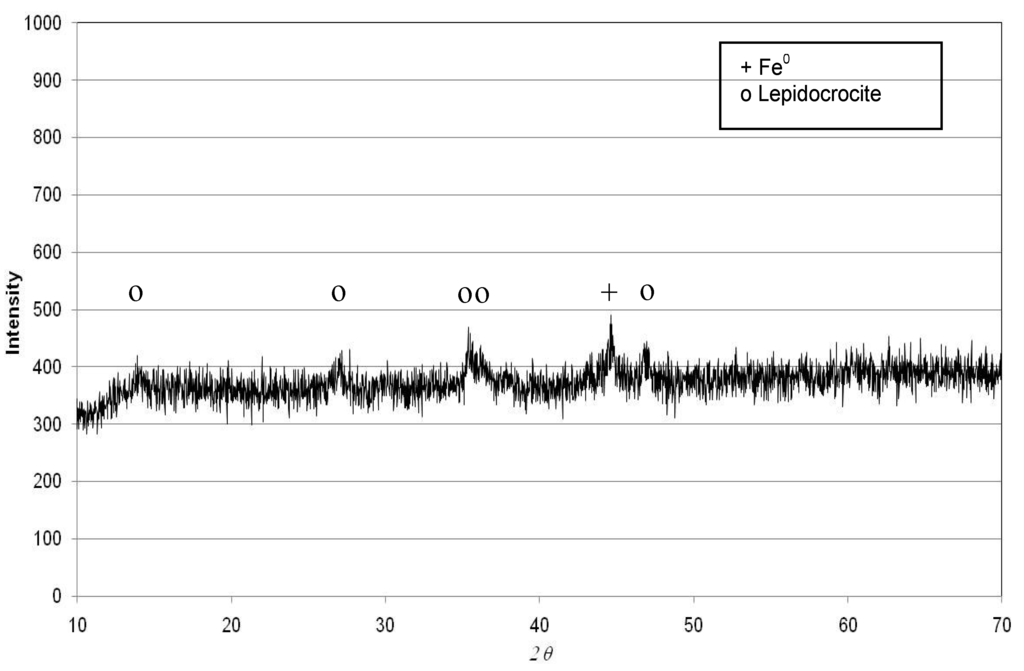
Figure 6.
XRD of iron corrosion product after the tests conducted with Fe0 = 3 g/L, Ni = 50 mg/L and uncontrolled pH.
The high yields of our treatment could be also attributed to the strong mixing rate that allowed disaggregation of the nanoparticle clusters, enhancing the mass transport of nitrate to the iron surface. Moreover, our tests being conducted under atmospheric conditions, the observed results do not show a meaningful dependence of nitrate reduction from dissolved oxygen. These statements are consistent with the founding of other works conducted both with microscopic and nanoscopic iron particles [5,17]. The experiments of the present study confirmed that the ammonium nitrogen was the major product of nitrate reduction (Table 1). In particular, very low differences between the removed nitrate amounts and the produced ammonia were detected during the experiments conducted at pH values of three and five. The nitrite amounts were always negligible; thus, it is presumable that a slight amount of nitrogen gas has been generated in each test. Lower concentrations of ammonium were detected by performing the process under uncontrolled pH (Table 1). This suggests that part of the produced ammonia has been stripped due to the rapid pH increase beyond nine during the treatment [1]. Without pH control, as expected, also restricted iron ions in the treated solutions were monitored (Table 1). These concentrations were much less than those detected during the other tests, in which the acid conditions promote the iron dissolution. The lower iron and ammonium ions that remain in solutions in the tests conducted in uncontrolled conditions, are clearly a positive aspect. Anyhow, the residual N–NH4+ makes it necessary to forecast further adequate treatments for its removal. A suitable and profitable technology may be the struvite precipitation process using low expensive reagents that was developed by the author [18,19].
3.2. Kinetic Analysis
The results discussed above show how the nitrate reduction through nanoscopic iron is affected by many factors. In order to analyze the influence of these factors, a kinetic analysis of the N–NO3− decreasing trends was conducted, which were monitored during the experimental tests. For each operating conditions tested, the N–NO3− removal exhibits typical trends of first order kinetics (Figure 1, Figure 2 and Figure 4). Thus, the reduction rate for nitrate can be expressed with the following equation:
where N is the nitrate concentration and k is the specific reaction rate (first order kinetic constant). By solving the above equation, the following behavior for nitrate concentrations as a function of time can be easily obtained:
By means of the previous equations, it is possible to accurately simulate the results of the investigation carried out. Indeed, the remarkable agreement between the experimental results and theoretical predictions (Figure 1, Figure 2 and Figure 4) is a good validation of the proposed kinetic model, which, furthermore, is consistent with the statements of other authors [1,5,20]. The abatement curves generally showed faster decreasing trends with the Fe0 amount enhancement and decreasing reaction rates in response to the growth of initial nitrate concentration and the process pH. However, the kinetic constants did not follow a linear relationship in response to the operating parameters’ change. In fact, a concomitant effect of these parameters occurred. By carefully analyzing the detected values of the kinetic constant, it was possible to identify, for the operating conditions tested in this study, a close dependence of the k constant on the ratio between the iron amount and the square of initial nitrate concentration (IN = Fe/Ni2) (Figure 7). In particular, the following function type was identified:
where the values of α and β change in response of process pH. The overall reaction rate can be expressed by means of the following relation of the process parameters:
The curves reported in Figure 7 show that, for a given pH, the kinetic constants detected in the various tests follow the same function of the IN ratio. Thus, at constant pH, this ratio can be considered the main parameter affecting the process rate. Other works, instead, identified the Fe/Ni ratio as the factor governing the process [5]. Our results clearly underline a greater effect of the nitrate amount to be removed on the reaction rate. From the trends reported in Figure 7, it can be noticed that the kinetic parameters are just lower in the tests conducted at pH 5 with respect to those at pH 3, while higher reductions of k values were observed by performing the experiments without pH control. Anyhow, as discussed above, also under uncontrolled pH, the process evolved with reaction rates and was able to ensure satisfactory yields in a reaction time of 60 min.
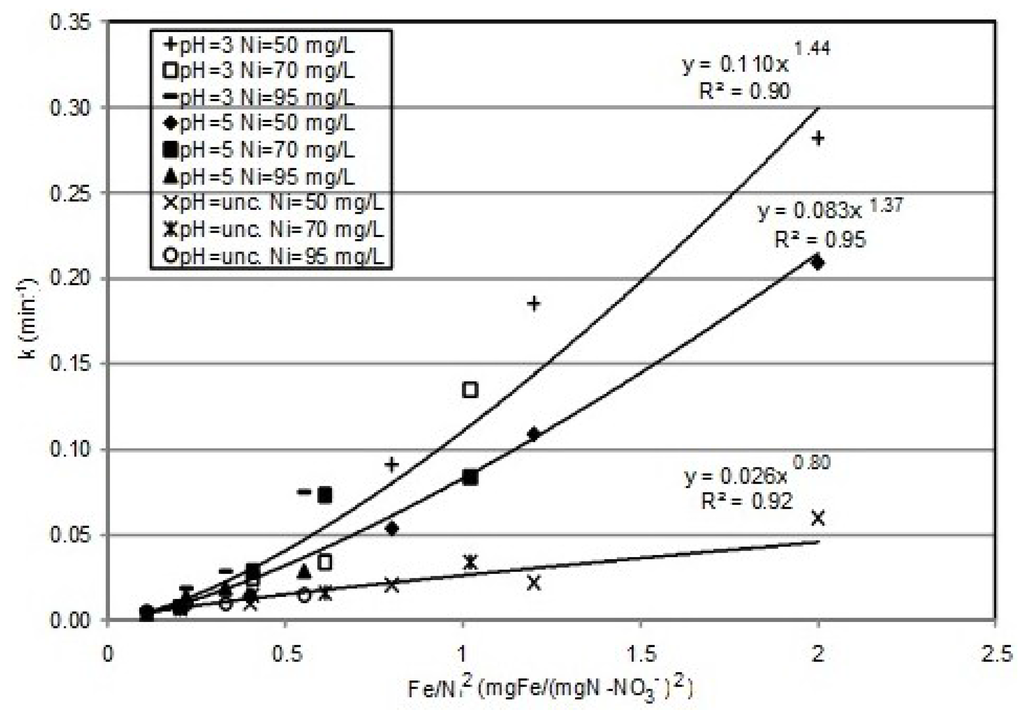
Figure 7.
Trends of the k constant vs. the Fe/Ni2 ratio.
4. Conclusions
The experiments conducted for this work allowed investigating the effects of operating conditions on nitrate reduction in wastewaters by means of nanoscopic zero-valent iron particles. In particular, the results of the tests carried out showed how the efficiency of the treatment is positively affected by the pH reduction. However, lower increases in process performance were detected by reducing the pH from five to three. Moreover, satisfactory yields were obtained also under uncontrolled pH. In fact, abatements up to 98%, 87% and 63% were reached in 60 min during the treatment of solutions characterized by initial nitrate nitrogen concentrations of 50 mg/L, 70 mg/L and 95 mg/L, respectively. The increase of Fe0 dosage clearly produces an enhancement of the nitrate abatement, while the initial N–NO3− amount of wastewaters negatively affected the reduction process. This statement was verified also by the kinetic analysis of trends detected during the conducted experiments. In fact, a first order kinetic-type reaction was identified for each operating condition tested, and the kinetic constant, for a given process pH, resulted in a positive function of the Fe/Ni2 ratio. The identification of the overall expression of the reaction rate could help to plan treatments for chemical denitrification of wastewaters. The results of the experiments proved, furthermore, that the nitrate reduction efficiently evolved also in aerobic conditions and that the ammonia nitrogen is the main process product. The residual N–NH4+ amount resulted in being lower in the tests conducted without pH control. In fact the basic conditions that were rapidly reached during the reactions cause ammonia stripping and the precipitation of iron corrosion compounds. The good efficiencies and the low residual ammonium and iron ions make the process under uncontrolled pH preferable. Indeed, in this way, the treatment is easier to manage and less expensive, avoiding the addition of acid. The costs of the process could be further reduced by exploiting unconventional sources, such as iron-rich clay minerals [21,22], for the nanoparticles’ generation. Anyhow further experiments are necessary to verify the applicability of the process under field conditions.
Acknowledgments
The author thanks Mr. Giuseppe Bevilacqua for the technical support.
Conflicts of Interest
The authors declare no conflicts of interest
References
- Hwang, Y.H.; Kim, D.G.; Shin, H.S. Mechanism study of nitrate reduction by nano zero valent iron. J. Hazard. Mater. 2011, 185, 1513–1521. [Google Scholar] [CrossRef] [PubMed]
- Noubactep, C.; Caré, S. On nanoscale metallic iron for groundwater remediation. J. Hazard. Mater. 2010, 182, 923–927. [Google Scholar] [CrossRef] [PubMed]
- Ruangchainikom, C.; Liao, C.H.; Anotai, J.; Lee, M.T. Effects of water characteristics on nitrate reduction by the Fe0/CO2 process. Chemosphere 2006, 63, 335–343. [Google Scholar] [CrossRef] [PubMed]
- Huang, Y.H.; Zhang, T.C. Effects of dissolved oxygen on formation of corrosion products and concomitant oxygen and nitrate reduction in zero-valent iron systems with or without aqueous Fe2+. Water Res. 2005, 39, 1751–1760. [Google Scholar] [CrossRef] [PubMed]
- Yang, G.C.C.; Lee, H.L. Chemical reduction of nitrate by nanosized iron: Kinetics and Pathways. Water Res. 2005, 39, 884–894. [Google Scholar] [CrossRef] [PubMed]
- Bhatnagar, A.; Sillanpää, M. A review of emerging adsorbents for nitrate removal from water. Chem. Eng. J. 2011, 168, 493–504. [Google Scholar] [CrossRef]
- Hansen, H.C.B.; Guldberg, S.; Erbs, M.; Koch, C.B. Kinetics of nitrate reduction by green rusts—Effects of interlayer anion and Fe(II):Fe(III) ratio. Appl. Clay Sci. 2001, 18, 81–91. [Google Scholar] [CrossRef]
- Huang, C.P.; Wang, H.W.; Chiu, P.C. Nitrate reduction by metallic iron. Water Res. 1998, 32, 2257–2264. [Google Scholar] [CrossRef]
- Huang, Y.H.; Zhang, T.C. Effects of low pH on nitrate reduction by iron powder. Water Res. 2004, 38, 2631–2642. [Google Scholar] [CrossRef] [PubMed]
- Rodríguez-Maroto, J.M.; García-Herruzo, F.; García-Rubio, A.; Gómez-Lahoz, C.; Vereda-Alonso, C. Kinetics of the chemical reduction of nitrate by zero-valent iron. Chemosphere 2009, 74, 804–809. [Google Scholar] [CrossRef] [PubMed]
- Luo, H.; Jin, S.; Fallgren, P.H.; Colberg, P.J.S.; Johnson, P.A. Prevention of iron passivation and enhancement of nitrate reduction by electron supplementation. Chem. Eng. J. 2010, 160, 185–189. [Google Scholar] [CrossRef]
- Tsai, Y.J.; Chou, F.C.; Cheng, T.C. Coupled acidification and ultrasound with iron enhances nitrate reduction. J. Hazard. Mater. 2009, 163, 743–747. [Google Scholar] [CrossRef] [PubMed]
- American Public Health Association. Standard Methods for the Examination of Water and Wastewater, 20th ed.; APHA: Washington DC, USA, 1998. [Google Scholar]
- Kassaee, M.Z.; Motamedi, E.; Mikhak, A.; Rahnemaie, R. Nitrate removal from water using iron nanoparticles produced by arc discharge vs. Reduction. Chem. Eng. J. 2011, 166, 490–495. [Google Scholar] [CrossRef]
- Liou, Y.H.; Lo, S.L.; Lin, C.J.; Kuan, W.H.; Weng, S.C. Chemical reduction of an unbuffered nitrate solution using catalyzed and uncatalyzed nanoscale iron particles. J. Hazard. Mater. 2005, 127, 102–110. [Google Scholar] [CrossRef] [PubMed]
- De Rosa, S.; Siciliano, A. A catalytic oxidation process of olive oil mill wastewaters using hydrogen peroxide and copper. Desalination Water Treat. 2010, 23, 187–193. [Google Scholar] [CrossRef]
- Cheng, F.; Muftikian, R.; Fernando, Q.; Korte, N. Reduction of nitrate to ammonia by zero-valent iron. Chemosphere 1997, 35, 2689–2695. [Google Scholar] [CrossRef]
- Siciliano, A.; de Rosa, S. Recovery of ammonia in digestates of calf manure through a struvite precipitation process using unconventional reagents. Environ. Technol. 2014, 35, 841–850. [Google Scholar] [CrossRef] [PubMed]
- Siciliano, A.; Ruggiero, C.; de Rosa, S. A new integrated treatment for the reduction of organic and nitrogen loads in methanogenic landfill leachates. Process Saf. Environ. Prot. 2013, 91, 311–320. [Google Scholar] [CrossRef]
- Choe, S.; Liljestrand, H.M.; Khim, J. Nitrate reduction by zero-valent iron under different pH regimes. Appl. Geochem. 2004, 19, 335–342. [Google Scholar] [CrossRef]
- Stucki, J.W.; Su, K.; Pentrakova, L.; Pentrak, M. Methods for handling redox-sensitive smectite dispersions. Clay Miner. 2014, 49, 359–377. [Google Scholar] [CrossRef]
- Pentrak, M.; Pentrakova, L.; Stucki, J.W. Iron and manganese reduction-oxidation. In Methods in Biogeochemistry of Wetlands; DeLaune, R.D., Reddy, K.R., Richardson, C.J., Megonigal, J.P., Eds.; Soil Science Society of America: Madison, WI, USA, 2013; pp. 701–721. [Google Scholar]
© 2015 by the authors; licensee MDPI, Basel, Switzerland. This article is an open access article distributed under the terms and conditions of the Creative Commons Attribution license (http://creativecommons.org/licenses/by/4.0/).