2. From Porous to Nanoporous Materials
Porous materials contain pores that partially replace solid matter [
9,
10,
11,
12,
13,
14,
15,
16,
17,
18,
19]. They form one of the broadest classes in materials science [
9,
10,
11,
12,
13,
14,
15,
16,
17,
18,
19]. In principle, any material can be fabricated in porous form. Ranging from carbon and silicon to ceramics and polymers, porous materials exhibit physical and chemical properties that show significant promise for applications in various fields of science and technology. Among them, it is the high surface area-to-volume ratio which represents the general feature common to the entire class and, often, it is the main source of interest [
9,
10,
11,
12,
13,
14,
15,
16,
17,
18,
19].
The surface area-to-volume ratio increases as porosity increases and characteristic lengths decrease. For this reason, interest has increasingly shifted on porous materials with pores in the nanometer range. Although the International Union of Pure and Applied Chemistry officially identifies pores with characteristic length between 2 and 50 nm as mesopores and larger ones as macropores [
20], materials with porosity on the nanometer scale are usually referred to as nanoporous (NP).
Porous materials can be fabricated by different methods depending on their chemical nature and the desired structural arrangement. Synthetic routes typically rely upon the use of forced gas bubbling in molten metals [
21], the use of suitable templates such as porous alumina [
22], and the use of the electrochemical deposition from a liquid crystalline plating mixture [
23]. Other methodologies take advantage of self-assembled structures of polymeric frameworks [
24] and inorganic-block copolymer micelles [
25], and of the chemical and electrochemical etching of binary and multinary alloys [
26]. Etching methods, also termed de-alloying, are particularly suited to the fabrication of NP metals.
Presently, NP metal foams represent one of the most rapidly growing research subjects in materials science. These materials exhibit a bi-continuous three-dimensional open-cell structure formed by pores that percolate through a solid network including ligaments and nodes [
27,
28]. These structural elements have irregular morphology and characteristic lengths distributed on the nanometer scale, which give rise to a disordered structure characterized by an unusually high surface area-to-volume ratio [
27,
28]. Unique physical and chemical properties arise due to the peculiar combination of structural features, which allow NP metal foams to show promise for a broad spectrum of applications including structural engineering [
27,
28,
29], catalysis [
30], sensing [
28,
31,
32], and energy [
33,
34,
35].
Although interest in NP metals has a primary focus on their technological potential, the challenging questions they pose concerning the structure-property relationships also represent an intriguing subject for fundamental research. This lays considerable emphasis on the structure itself, and, then, on the fabrication methods enabling its obtainment.
Whereas macroporous metal foams can be fabricated by various methods [
36], including physical vapor deposition, chemical and electrochemical deposition, powder metallurgy, casting and gas-eutectic transformation, NP metals have been mostly synthesized by chemical and electrochemical de-alloying. De-alloying allows the preferential, selective dissolution in aqueous medium of one or more elements from a parent alloy [
26,
37,
38,
39]. Involving individual atoms or small clusters, dissolution is accompanied by reconstruction at solid-liquid interfaces mediated by surface mass transport phenomena [
27]. Connected porosity grows gradually inside residual alloy, which finally consists of a disordered network of ligaments [
39]. Thermal treatments are commonly used subsequent to dissolution to relax internal stresses that arise because of the volume shrinkage [
40] or to coarsen the structure [
41].
Attractive due to its apparent simplicity, de-alloying also exhibits various limitations. First, it can hardly be utilized for alloys containing non-noble metals, which significantly restricts the range of NP metals that can be effectively synthesized [
27]. Second, it is typically performed in aqueous solution, which excludes the use of metals prone to oxidation [
27,
35]. Third, it depends on experimental variables that can be determined only partially, which ultimately results in a scarce control of atomic-scale mechanisms [
42].
Nevertheless, numerous binary alloys can form NP metals by de-alloying, including, among others, Cd–Mg [
43,
44], Cu–Au [
45,
46], Cu–Mn [
47,
48], Cu–Pd [
49], Cu–Zn [
50,
51], and Ag–Au [
52,
53,
54,
55]. The latter, in particular, is the typical starting material to fabricate NP Au, a material with unexpected physical and mechanical properties.
3. NP Au as the Typical Case Study
Although interest in NP Au foams arose recently after a pioneering work from the 1960s and 1970s [
51,
55,
56,
57], the fabrication method and material are remarkably ancient. In the twelfth century, layers of nearly pure Au were manufactured by pre-Columbian civilizations by depletion gilding, a special case of de-alloying based on the removal of other metals from the surface of Au alloys via surface enrichment processes [
58,
59]. Variants of depletion gilding were developed by European artisans during the Middle Ages [
53,
60,
61].
Nowadays, chemical and electrochemical de-alloying routinely produce NP Au structures consisting of bi-continuous disordered frameworks of pores and ligaments connecting at ligament junctions, or nodes. The typical structure can be seen in
Figure 1, where scanning electron microscopy (SEM) micrographs of two NP Au samples with different characteristic lengths are shown. Experimental findings indicate that pore size can vary in the range between 3 and 30 nm [
62,
63], resulting in a specific surface area of 10 to 150 m
2 g
−1 [
28,
64].
Figure 1.
SEM micrograph of NP Au.
The high surface area as well as excellent chemical stability and flexible manufacturing conditions make NP Au potentially suited to a broad range of applications in miniaturized actuation, sensing, catalysis, fuel cells, and biocompatible implants.
Actuation is enabled by the capability of NP Au surfaces to convert capillary forces due to electric charging to macroscopic displacements [
64,
65,
66,
67]. This allows fabricating layered structures with length variations similar to those shown by ceramic thermal actuators. It follows that electric charging can be utilized to tailor the NP Au properties on demand for limited time intervals [
68]. For example, it has been shown that composite beams formed by Au and NP Au layers can undergo considerable tip displacement [
69]. In this respect, the existence of a direct link between average mechanical stresses and expansion is still an open question [
70,
71].
Interestingly, the cause-effect relationship between the electric charging of surfaces and the deflection of a composite layered beam can be reversed. Therefore, elastic strain accumulation can be used to generate electric potential differences in electrochemical circuits [
72]. NP Au electrodes could enable, then, a new generation of energy harvesting devices.
In combination with the above-mentioned properties, NP Au surfaces also exhibit an electrochemical double layer with high capacitance, which allows amplifying the electrical response of sensors up to 30 times [
73]. Overall, this gives rise to unusually high mechanical responses to the adsorption of chemical species [
66,
67,
74].
A refined description of these phenomena takes into consideration that during a fluid adsorption in a mesopore, a pressure on the pore walls is exerted. This pressure, the value of which is in the order of 10
7 Pa, causes deformation of the pore, and as a result, deformation of the porous material as a whole. This effect has been experimentally observed for several mesoporous materials. The small strains, in the order of 10
−3 ÷ 10
−4, on the pore walls are in the linear elastic range and it is reasonable to assume a linear relation between the pressure in the pore and the experimentally observed strain with a proportionality which is constant called the pore-load modulus [
75,
76,
77]. In this regard, the pore-load modulus is influenced by the morphology and geometry of pores and their distribution. For materials with a chaotic pore structure (wide pore size distribution, different geometry, and orientation of pores) the calculation of the pore-load modulus can be very complex [
75,
76,
77].
For example, NP Au-coated cantilevers undergo relevant chemo-mechanical deformation consequent to the adsorption of biomolecules [
78]. NP Au-based sensors have shown remarkable selectivity towards specific prostate antigens [
79] and probe DNA [
80]. In addition, NP Au has been shown to allow effective electrochemical sensing of
p-nitrophenol molecules [
81], as well as the rapid measurement of
Escherichia coli bacteria concentration in food and water [
82]. Similarly, NP Au-based detectors for neural activity provided a superior signal-to-noise ratio due to low electrode-electrolyte impedance [
83].
Surface topology and, in particular, the high density of atomic step edges make NP Au a good catalyst for methanol oxidation in gaseous environments [
84] and for oxygen reduction in fuel cells [
85]. In these cases, catalytic properties are sensitive to the concentration of residual Ag in NP Au [
66], as well as to surface coatings [
28].
A significant surface plasmon resonance results in optical properties of NP Au that are quite different from those of bulk Au [
86]. For this reason, NP Au also represents a candidate material for tunable surface-enhanced Raman spectroscopy [
87,
88]. Moreover, the residual Ag content affects and tunes the functionality of NP Au substrates in surface-enhanced Raman scattering [
89].
All the above-mentioned properties and behaviors depend strongly on both the NP Au morphology and the surface area-to-volume ratio [
69]. Even more pronounced are the effects of NP Au structural features on its mechanical properties.
4. Mechanical Behavior
NP metal foams with open cell structures exhibit a complex response to mechanical deformation. In this respect, not only do they differ from their bulk counterparts, but also from other NP materials. For example, NP Au foams undergo brittle fracture upon tensile deformation despite the ductility of bulk Au. At the same time, the mechanical properties of NP metals do not find correspondence in the tensile or compressive behavior of NP ceramics and polymers.
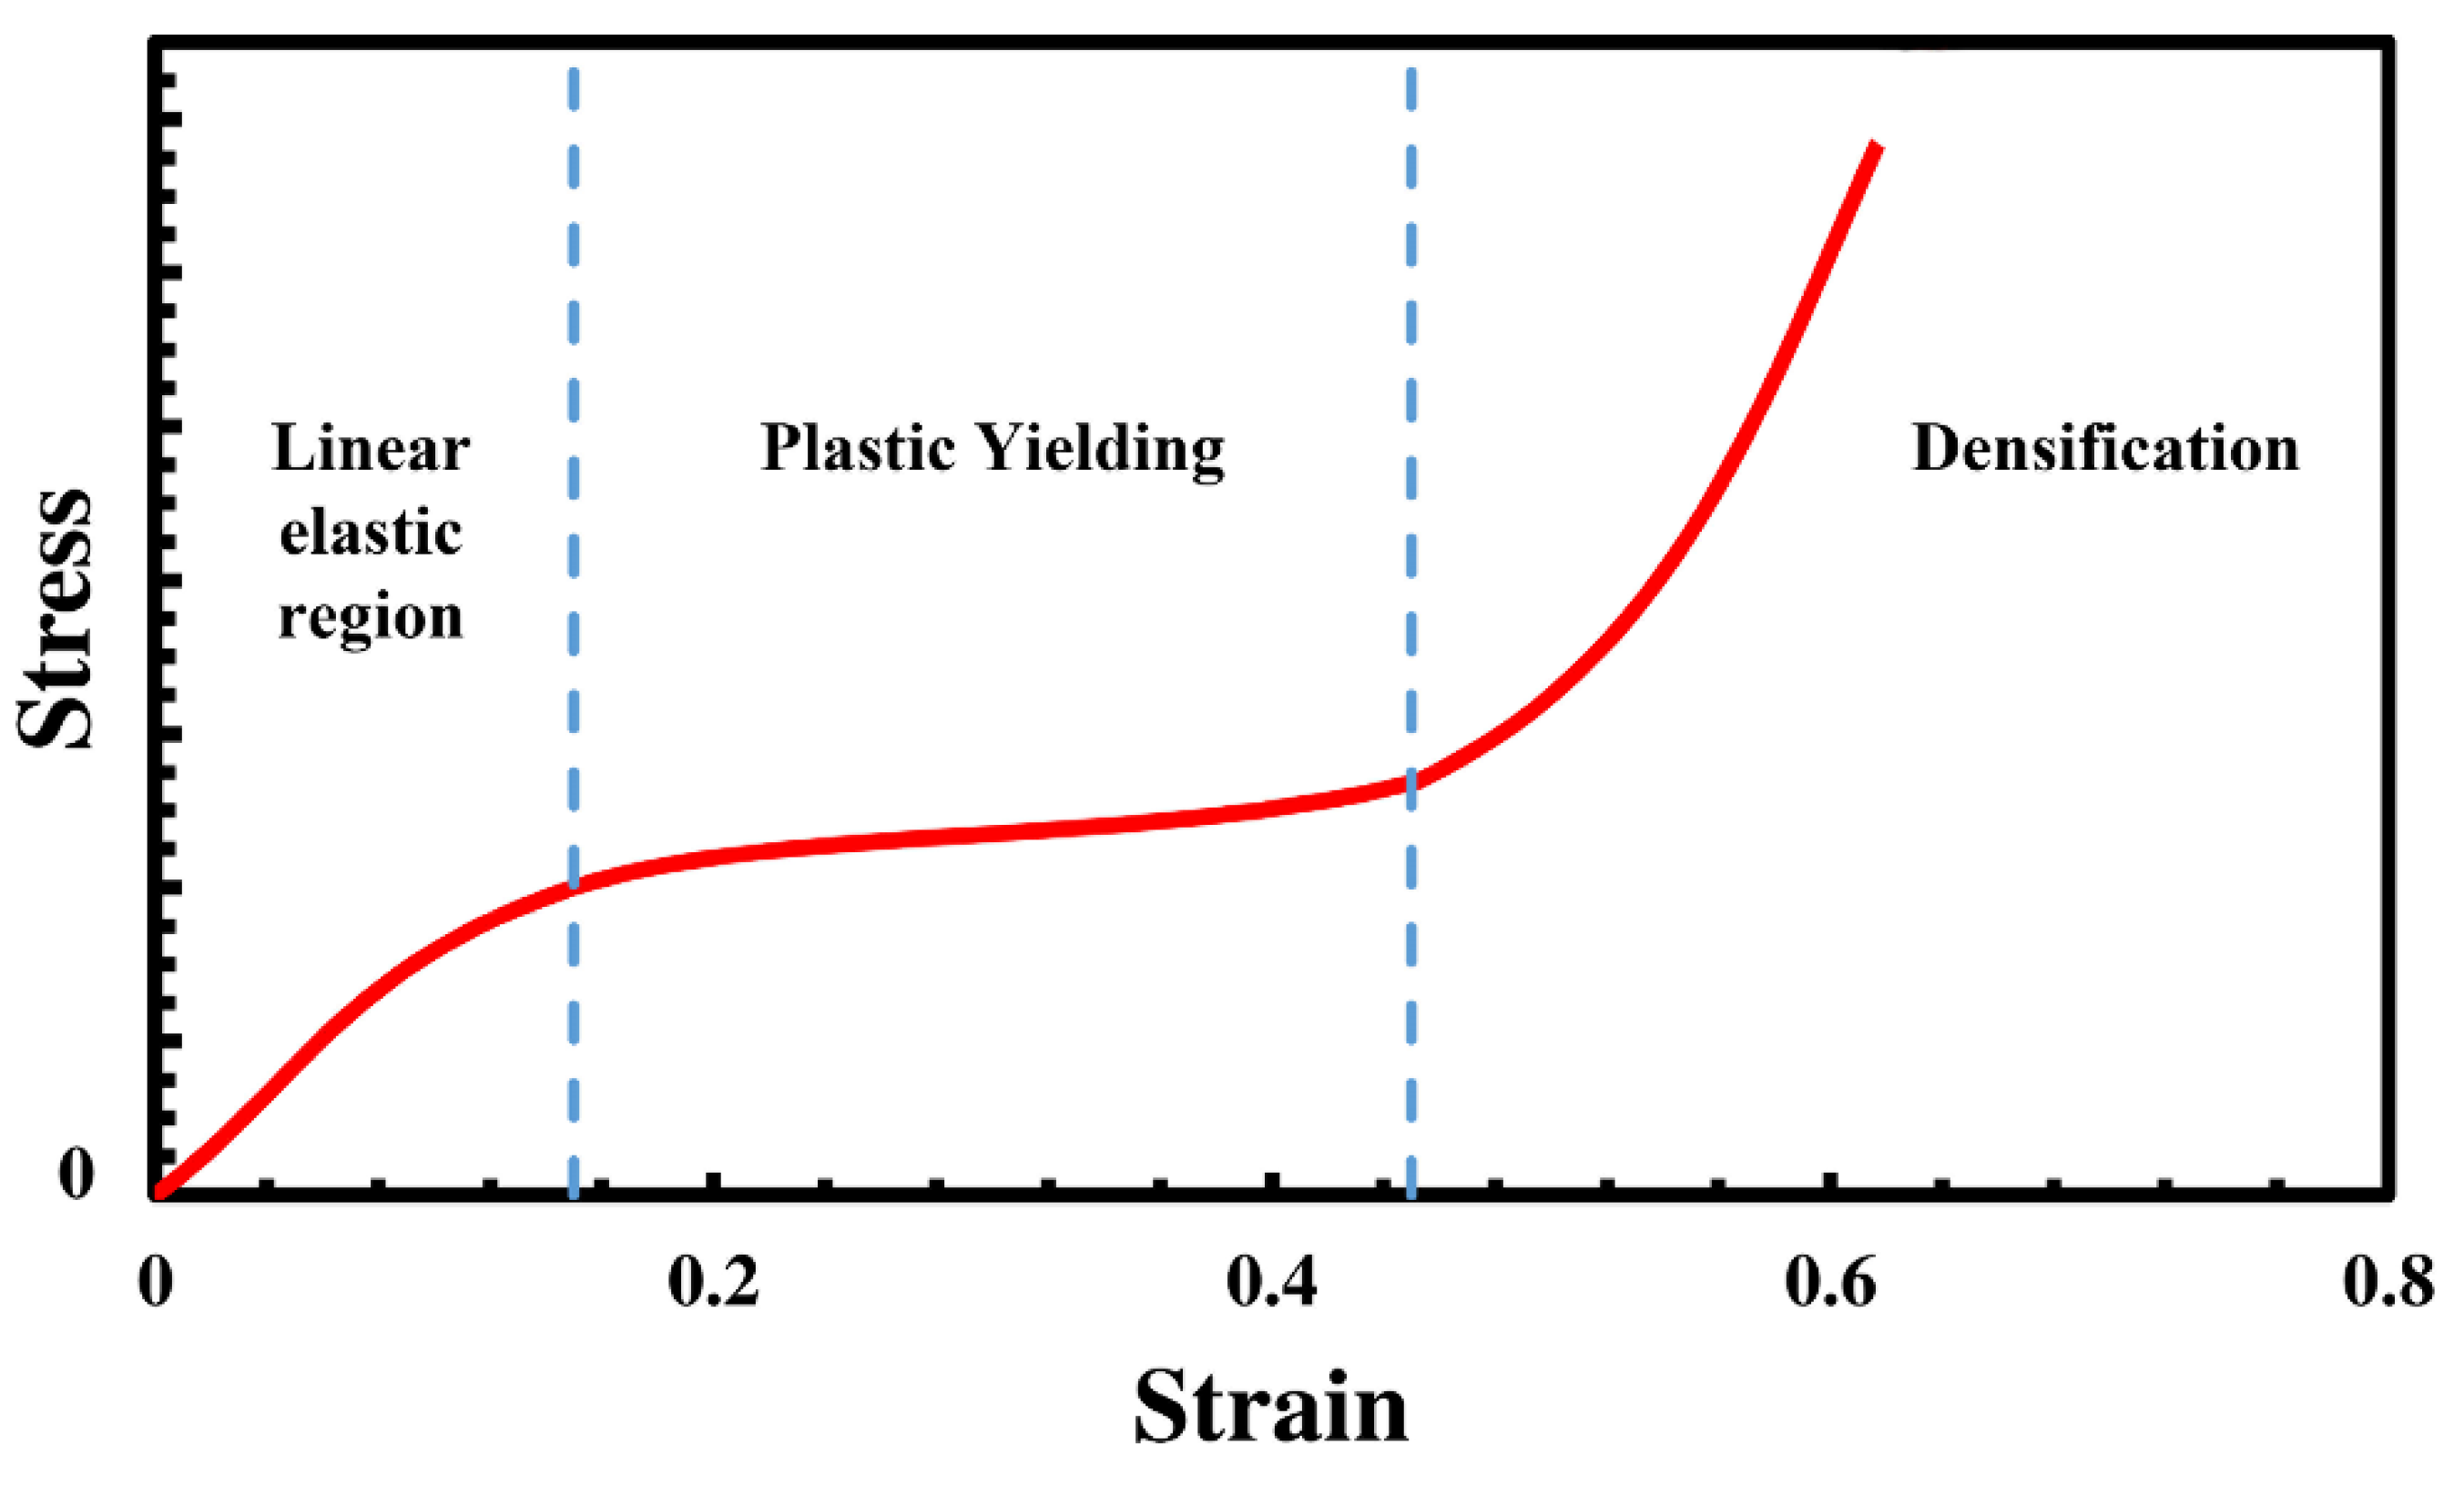
The typical stress-strain curve resulting from the compression of NP metal foams is shown in
Figure 2. Three different deformation stages can be identified. The first one consists of a linear elastic region governed by the bending of structural elements, mostly corresponding to ligaments. In the second deformation stage, the stress-strain curve exhibits a definite plateau resulting from the progressive collapse of open cells. The final sudden increase of stress in the third stage is due to the impingement of structural elements against each other and the consequent foam densification. The slope of the linear portions of the stress-strain curve provides a measure of the effective Young’s modulus of the NP metal foam at different degrees of compaction. Though in the first deformation stage this quantity is significantly lower than the Young’s modulus of the bulk material, it tends to coincide with the latter in the third deformation stage.
Figure 2.
A typical stress-strain curve for NP Au under compressive deformation conditions.
Strongly depending on the NP metal foam history, Young’s modulus and yield strength typically range from about 3 to 40 GPa and from about 10 to 240 MPa, respectively [
47,
90,
91,
92,
93,
94,
95,
96]. The breadth of these ranges stems from the diversity of approaches utilized to measure the mechanical quantities, as well as from the influence of experimental conditions and sample fabrication methods on measurements.
Deformation in NP metals was first investigated by Li and Sieradzki in 1992 [
97]. Focusing on the fracture behavior of NP Au foams, they did not find evidence of any inherent relationship between ligament brittleness and ligament size [
97]. Different from bulk solids [
98], NP metals exhibit, upon nanoindentation, a yield strength approximately coincident with hardness [
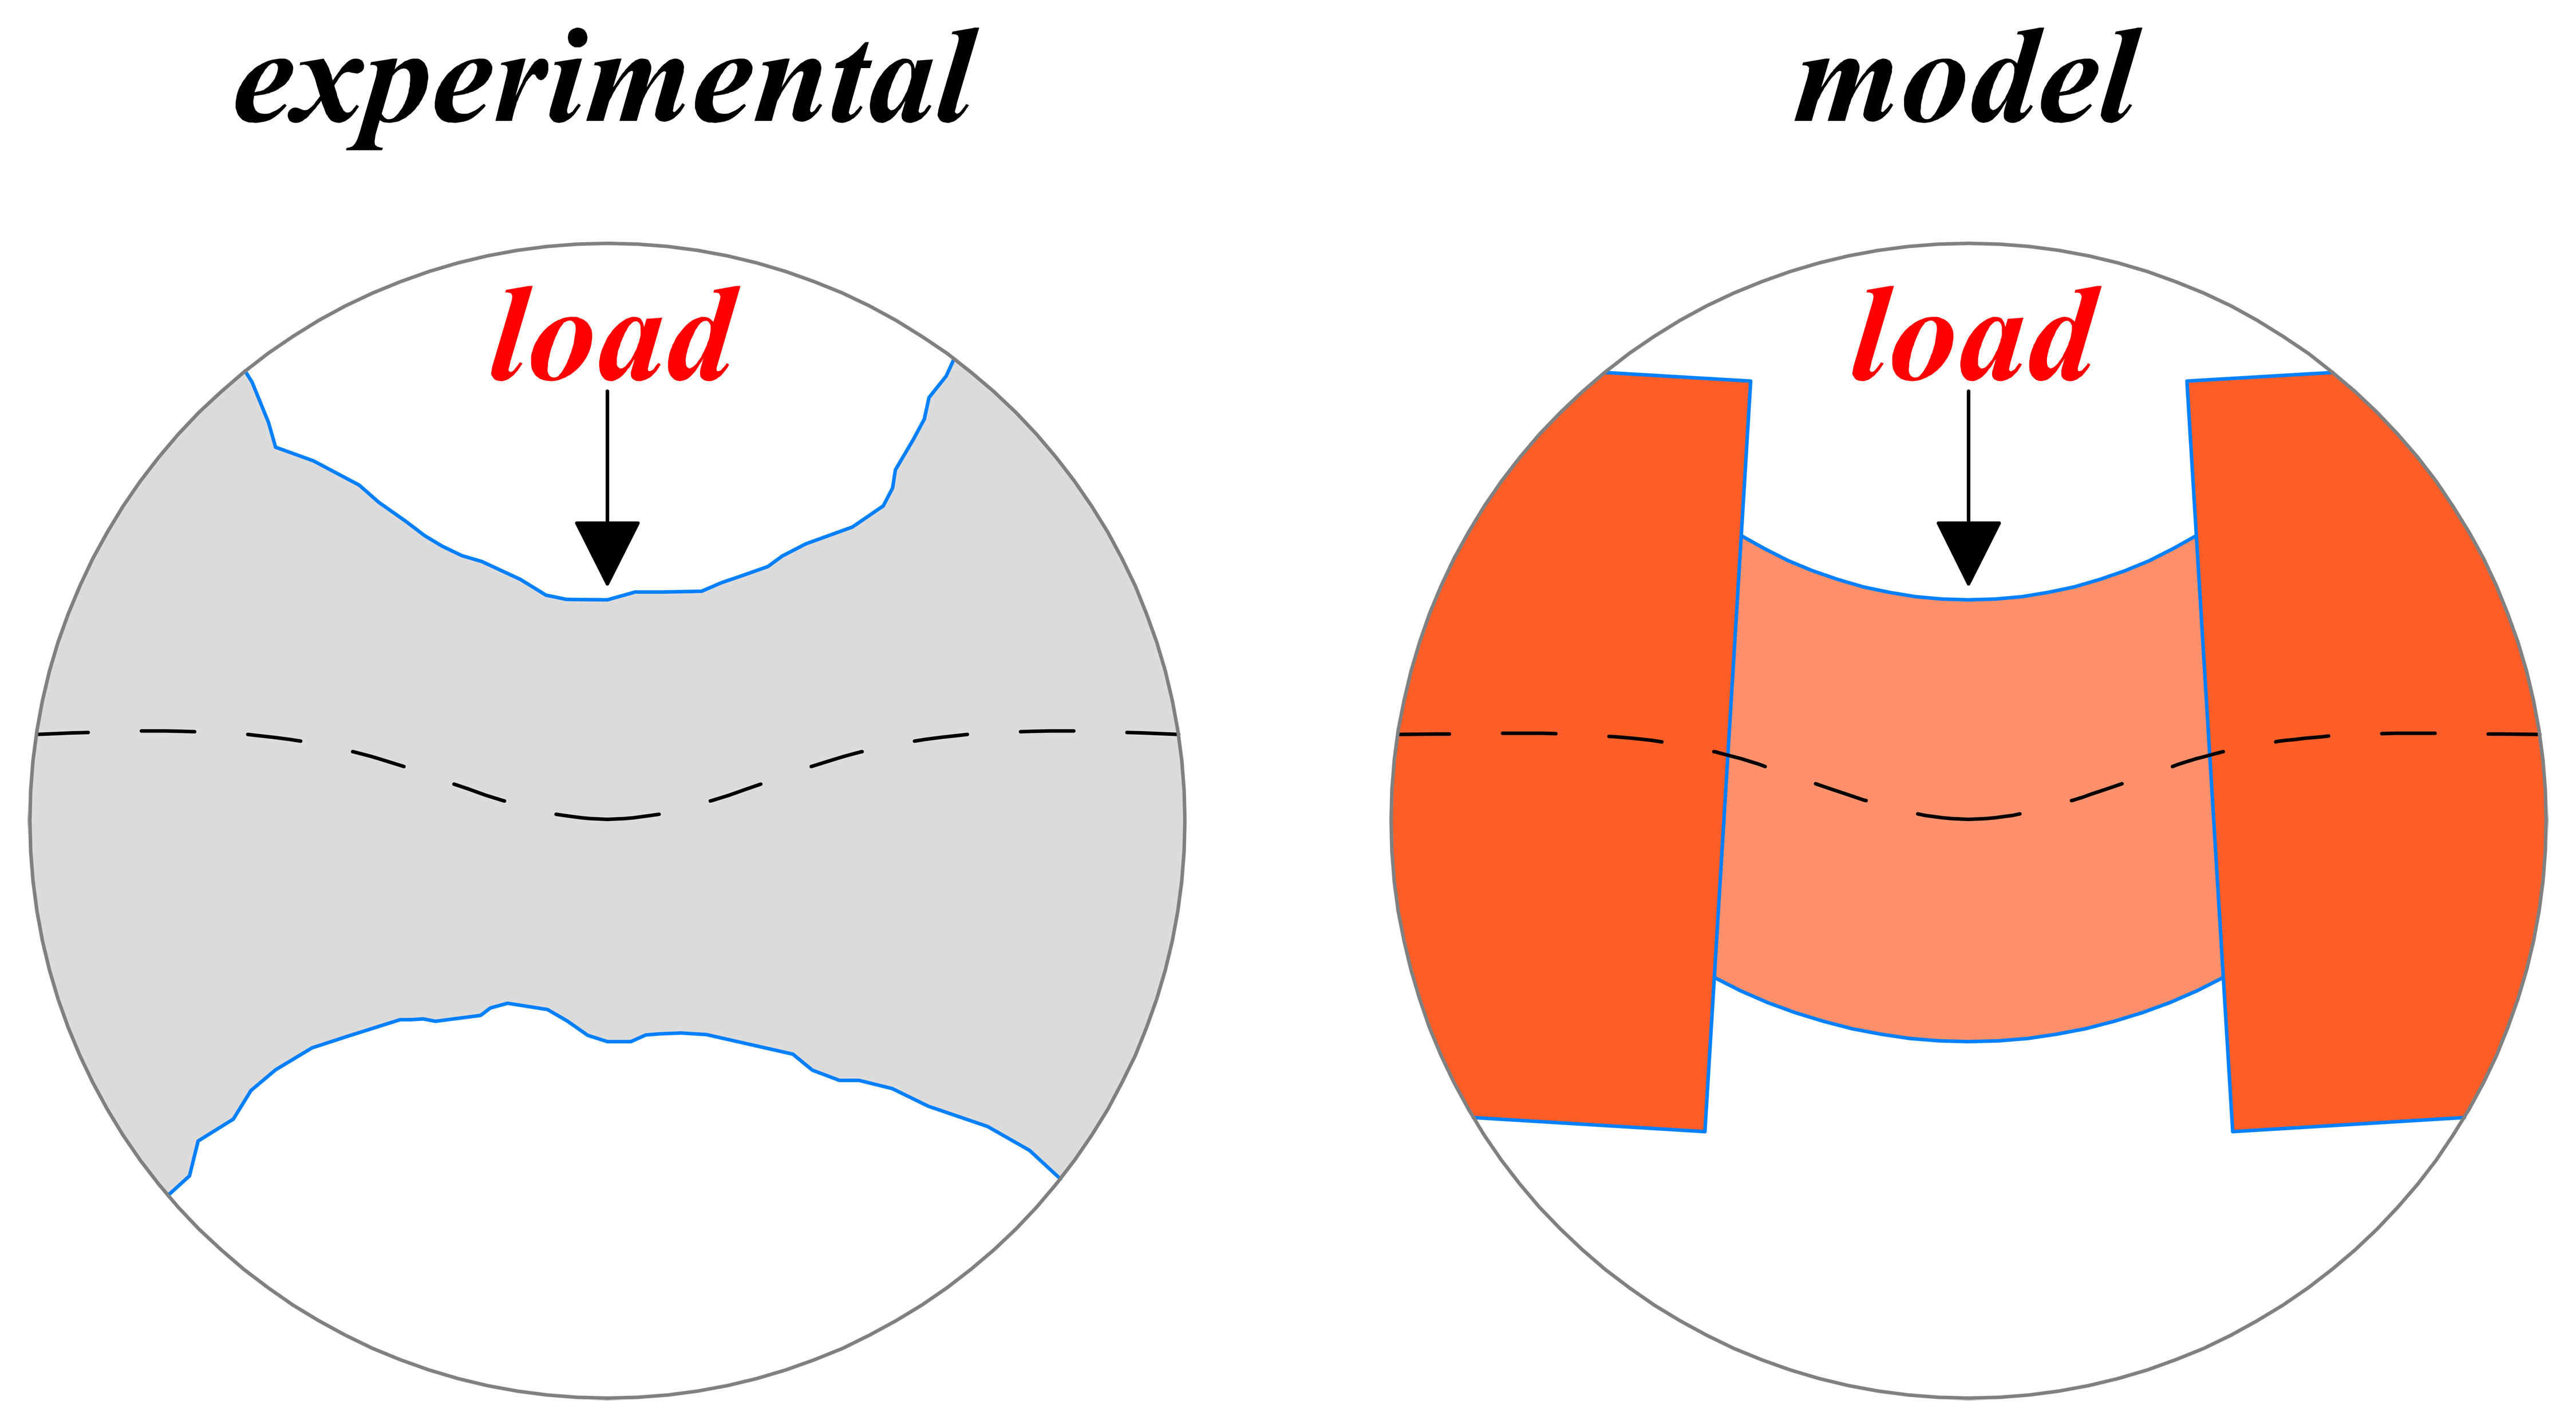
90]. When the indenter compresses the foam, plastic collapse occurs beneath it. No lateral expansion is observed, which points out that the effective Poisson’s ratio is approximately equal to zero.
Performing uniaxial compression tests on cylindrical micropillars of different radii, Volkert
et al. investigated the elastic behavior of NP Au foams, finding a Young’s modulus of about 7 GPa [
95]. Similar values were measured by Biener
et al. under depth-sensing nanoindentation conditions [
91]. No smooth size effect was detected.
In contrast, working on NP Au foams with relative densities between 25% and 41%, Hodge
et al. obtained Young’s modulus values that were unexpectedly large, and explained the result with contributions arising from the tensile and compressive deformation of ligaments [
99]. Along the same line, Mathur and Erlebacher showed that Young’s modulus of NP Au becomes four times larger when the ligament diameter decreases from 12 to 3 nm [
100]. Similarly, stress-free NP Au films with a ligament size below 10 nm exhibited a definite Young’s modulus enhancement [
101]. Surface stresses and the moment of inertia of the NP Au foam were invoked to rationalize the observed stiffening.
Experimental findings suggest that NP Au foams with ligament sizes smaller than 30 nm tend to have higher residual Ag contents [
99]. Being equal to other morphological factors, this implies a higher relative density of the NP Au foam, which in turn enhances the Young’s modulus [
99].
Concerning the plastic deformation behavior, Hodge
et al. showed that the hardness of NP Au measured by nanoindentation decreases with the indenter size and the characteristic length of the foam structure [
3]. For NP Au foams with relative density around 42% and ligament size of about 100 nm, Biener
et al. found remarkably high hardness and deformation mechanisms governed by ductile densification [
90]. Along the same line, Volkert
et al. showed that the yield strength of NP Au foams with 15 nm ligaments approaches the intrinsic strength of bulk Au [
95]. More specifically, individual ligaments of NP Au foams with relative density of about 36% were estimated to have yield stress of 1.5 GPa, a value close to the theoretical shear strength of bulk Au when deformation is not mediated by dislocations [
95].
Nanoindentation measurements on NP Au foams with relative densities ranging from 20% to 42% allowed Hodge
et al. to relate the decrease in ligament size with the decrease in yield strength [
3]. Hakamada and Mabuchi also observed a simple power-law dependence of the yield stress on the ligament diameter [
102]. This seems to suggest that NP Au undergoes deformation mechanisms similar to those of Au nanowires [
102], dominated by the reduction of defect concentration and the suppression of dislocation activity due to size effects [
103,
104].
Experimental evidence indicates that fabrication methods affect the yield strength [
93]. Following a modified de-alloying method, Jin
et al. obtained NP Au free of cracks by reducing the volume shrinkage [
93]. The consequent elimination of undesirable material failures, mostly related to stress corrosion cracking and brittle cracks [
105], allowed NP Au to exhibit considerable ductility, fracture being substantially absent up to full density [
93]. In contrast with previous and subsequent findings, very low yield strength values were measured [
93].
Various experimental studies on NP Au foams suggest that the deformation of individual ligaments is similar to the one of Au micropillars and nanowires [
92,
95,
98,
106]. In all cases, scale-dependent yield strength values are observed [
92,
95,
98,
106]. Furthermore, as in the case of NP Au foams, the yield strength of Au micropillars and nanowires can approach theoretical values when the characteristic length of structures is below 200 nm [
92,
95,
98,
106]. The observed behavior has been related to the presence of free surfaces, which limit the concentration of dislocation sources [
91,
95].
TEM micrographs of deformed NP Au demonstrate the formation of surface steps, which suggests that local plastic collapse can take place because of bending processes due to localized plastic deformation at nodes [
92]. Although no perfect dislocation was found in ligaments, high densities of Shockley partial dislocations and twins were observed at ligament junctions [
92], consistent with deformation mechanisms based on strain gradient hardening [
107].
A more complicated deformation behavior was observed by Sun
et al. in 150 nm thick NP Au films with ligament diameters between 10 and 20 nm [
108]. TEM analyses performed during indentation showed that only the outermost layers were compacted initially [
108]. Only after their plastic collapse, other layers became involved in compaction, the rest of the underlying foam structure remaining unaffected [
108]. Dislocations were also shown to involve the entire ligament, and to glide easily to nodes [
108].
The true stress-strain relationship obtained by Volkert
et al. by uniaxial compression pointed out remarkable strain hardening for NP Au [
95]. A similar behavior was observed by Dou and Derby [
92], explained with the contact between ligaments due to low strain densification. However, Biener
et al. did not find evidence of strain hardening in compressed NP Au micropillars [
91].
5. Phenomenological Modeling of Mechanical Properties
Experimental findings clearly indicate that achieving the capability of fine-tuning the structural features of NP Au foams is one of the crucial steps on the way to their practical exploitation. To this aim, gaining a deeper understanding of the relationship between structure and mechanical properties is also necessary, as it would enable a rational design of NP metals for structural application.
Rationalizing the mechanical response of NP metal foams is a challenging issue. Difficulties mostly stem from the inextricable combination of mechanical deformations on different length scales. On the microscopic level, individual ligaments exhibit deformation modes depending on various factors, including material properties, characteristic lengths, aspect ratio, and configuration of local mechanical stresses [
37,
38,
39,
40,
90]. On the macroscopic level, morphological details increasingly affect local responses, finally producing an overall mechanical response that is a complex function of the arrangement of ligaments and pores, relative density, and distribution of characteristic lengths [
37,
38,
39,
40,
90,
99]. Inherent structural disorder prevents relating global deformation to local deformation mechanisms, which makes a comprehensive model of mechanical properties particularly difficult to develop.
In this respect, important achievements have been obtained by using structural models based on regular, repetitive unit cells. These have been given different geometries, such as cubic [
1,
2], tetrahedral [
109], tetrakaidecahedral [
110], and those derived by bubble aggregates [
111]. Using such models provides a reasonable line of approach to the overall NP metal foam behavior, although the oversimplification of structural features restricts the model validity to the initial stages of mechanical deformation. It follows that the proposed models can only roughly estimate the effective Young’s modulus, shear modulus, and Poisson’s ratio of metal foams.
In the 1980s, Ashby and Gibson chose the cubic unit cell to model the relationship between structural and mechanical properties of mesoscopic and macroscopic foams [
1,
2]. Years later, their model also provided the first conceptual framework to connect the mechanical properties of NP metals with their morphological features [
1,
2]. It describes the porous structure as a regular and periodic three-dimensional arrangement of connected beams with a square cross-section and large aspect ratios [
1,
2]. The typical structural unit used in the model is shown in
Figure 3 together with SEM micrographs of macroscopic and NP metal foams for comparison. Since length
l is much longer than thickness
t, beams respond to mechanical stresses as thin flexural components for which three-point bending is the dominant deformation mode, as shown in
Figure 3 [
1,
2].
Figure 3.
The structural unit cell used in the Ashby and Gibson model.
The relative density φ of the NP metal foam is proportional to the ligament characteristic lengths [
1,
2]. In particular [
1,
2],
Fundamental physics allows writing for the relative Young’s modulus
Erel and yield strength σ
rel of NP metal foams with the following scaling equations [
1,
2]:
Here,
Eeff and σ
eff are the effective Young’s modulus and yield strength of the metal foam,
E and σ are the Young’s modulus and yield strength of the bulk material, and
C1 and
C2 are proportionality constants. Based on the fitting to experimental data, these constants have been determined to approximately equal 1.0 and 0.3, respectively [
1,
2].
Despite the approximations involved, Equations (2) and (3) clearly suggest that relative density is the most influential factor on the mechanical behavior of metal foams. In general, a reduction of relative density results in the depression of mechanical properties, including stiffness, strength, and ductility [
97,
112]. However, the model holds only at low relative densities, when open-cell metal foams mainly deform by ligament bending [
109,
113]. At higher relative densities,
i.e., in the presence of thicker ligaments, tensile and compressive stress contributions must be taken into due account. To this aim, a refined version of the Ashby and Gibson model was developed to improve the description of the yield process [
99,
100]. The result is an expression alternative to Equation (3),
which includes an additional term depending on φ.
Overall, the model predicts relatively simple power-law relationships between mechanical quantities and relative density [
1,
2]. Though this prediction is widely supported by experimental evidence in mesoscopic and macroscopic foams [
1,
2], its validity for NP metal foams is still debated.
At least three broad sets of experimental observations suggest that Ashby and Gibson’s model provides an oversimplified description of the mechanical behavior of NP metal foams. On the one hand, transmission electron microscopy (TEM) and SEM micrographs show that NP metals exhibit a structure quite far from an ordered arrangement of beams due to the periodic repetition of a regular unit cell [
114]. On the other, a detailed analysis of TEM and SEM micrographs points out that mass significantly agglomerates at ligament junctions, transforming these into massive nodes. In addition, ligaments exhibit relatively low aspect ratios, with length comparable with thickness [
7,
8,
115]. Both these features are predicted to significantly affect the bending behavior of individual ligaments [
7,
8,
115]. Finally, accurate mechanical measurements on NP Au foams reveal that the degree of mechanical deformation does not depend exclusively on relative density, but also on ligament length and thickness [
4,
7,
95]. Therefore, more refined modeling approaches are needed to progress in the field.
Various attempts have been made to rationalize the observed differences between experimental data and Ashby and Gibson’s model predictions by slightly modifying the original equations. Focusing on the plastic behavior of NP Au foams, Hodge
et al. pointed out a Hall-Petch-like dependence of the yield strength σ
lig of individual ligaments on the ligament thickness,
t [
99]. Accordingly,
where
k is a material constant describing the size dependence of yield strength [
99]. Aimed at taking into account the Hall-Petch-like behavior of individual ligaments, Hodge
et al. proposed incorporating Equation (4) into Ashby and Gibson’s model expression for the relative yield strength dependence on the relative density, which finally led to this equation [
99]:
where
C is a constant determined by best-fitting.
Fan and Fang extended Hodge
et al.’s approach to NP metal foams of higher relative density [
5]. To this aim, Ashby and Gibson’s term related to the contribution of cell corners to relative density was included in Equation (5b), which was re-written as [
5]:
Starting from numerical simulation results, Sun
et al. found instead that Ashby and Gibson’s model equation hypothesized the axial yielding of ligaments:
satisfactorily fits the estimated relative yield strength [
6].
Following a different approach, Huber
et al. developed a refined structural model of NP metal foams by using a tetrahedral unit cell with a central spherical node connected to four similar nodes by four beams [
4]. The resulting diamond-like lattice structure exhibits a relative yield strength:
where
cσ is a proportionality constant,
cR is a scaling factor between node and ligament radii,
r is the ligament radius, and
l the node spacing [
4]. Equation (8) is able to fit the σ
rel values obtained by numerical simulations based on the finite element method [
4]. Huber
et al. also show that disorder can significantly affect the σ
rel estimates, and that a correction factor should be taken into account [
4].
The elastic deformation behavior of NP metal foams was also modeled following the same approaches. In this regard, Sun
et al. show that the relative Young’s modulus of NP Au foams with fine ligaments is fitted satisfactorily by the expression:
where
C2 and
C3 are proportionality constants [
6].
Along a different line, Liu and Antoniou demonstrated that mass agglomeration at ligament junctions can remarkably affect elastic behavior, inducing a stiffening of the NP metal foam [
7]. Using a unit cell formed by a cubic node with six ligaments, the relative Young modulus was written as:
where
d is a measure of the mass agglomerated at the nodes [
7]. Scaling predictions generally agree quite well with experimental data [
7].
The tetrahedral structure studied by Huber
et al. results in a relative Young’s modulus [
4]:
which is in substantial agreement with Ashby and Gibson’s model [
1,
2]. The exponent of the power law is, indeed, the same, and the value of the proportionality constant
cE is similar to the one estimated by Ashby and Gibson [
4]. Interestingly, nodal mass and disorder have smaller effects on the
Erel value [
4].
Overall, it can be concluded that the discrepancy between experimental behavior and model predictions progressively led to the development of a research line aimed at rationalizing the relationship between mechanical properties and structural features. Nevertheless, despite evident advances in the understanding of the complex scenario, there is still considerable room to improve modeling by integrating the conceptual framework with novel ideas and methods. One of these concerns is the response of individual ligaments to mechanical forces. A modeling approach to this issue is formulated in the following.
6. Ligament Deformation and Mechanical Properties in NP Au
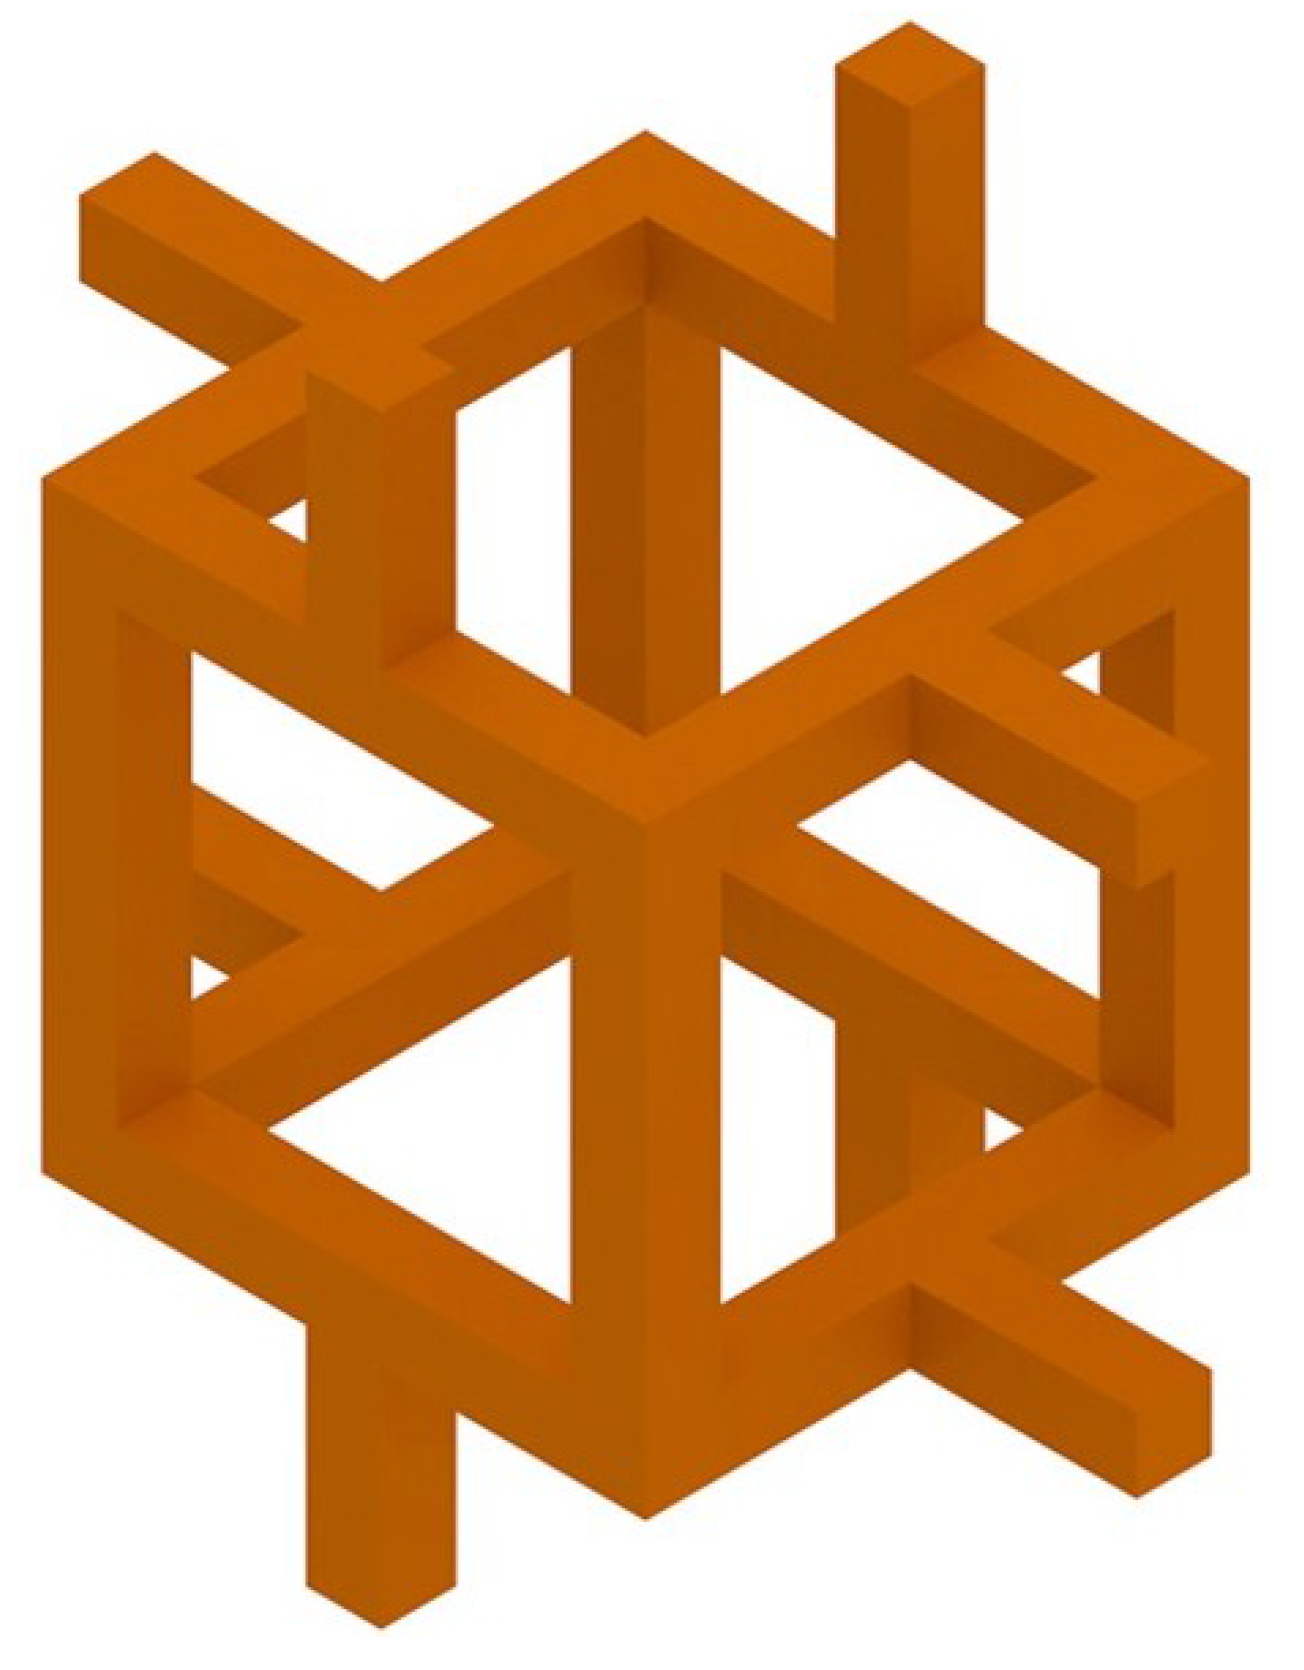
The proposed model describes the NP Au structure as a regular, periodic arrangement of the structural unit schematically shown in
Figure 4a,b. The unit consists of a cubic node with sides
t + 2
d long connecting six semi-ligaments of length
h/2. Whereas
t is the ligament thickness,
d roughly measures mass agglomeration at nodes. The unit is enclosed in a cubic unit cell of side:
Two variants of the base unit have been taken into account. One has ligaments with a square cross-section and cross-sectional area Asq = t2. The other has ligaments with a circular cross-section and cross-sectional area Acir = πt2/4.
Figure 4.
(a) Unit cells with ligaments having square and circular cross sections; (b) Characteristic lengths associated with ligaments and nodes; (c) Idealized bending behavior of a ligament.
For a bulk metal, the unit cell volume
l3 is fully occupied by the mass
mb = ρ
l3, where ρ is the bulk density. For a NP Au sample that nominally occupies the same macroscopic volume of the bulk solid, only a fraction of the volume is really occupied by mass. Such mass is equal to
msq = [(
t + 2
d)
3 + 3
t2h]ρ and
, respectively, for NP Au structures with square and circular ligaments. Therefore, the relative density ϕ of the NP Au structures considered can be simply calculated by the expressions:
The mechanical response of unit cells can be evaluated by considering ligaments as thick beams simply supported at both ends and with a concentrated load
P at the middle point. The load induces the ligament elastic deflection, as schematically shown in
Figure 4c. According to Timoshenko’s elasticity theory for beams [
116,
117], beam deflection
w and so-called bending rotation ψ are related to each other as described by the following equation:
Here,
E and
G are, respectively, the Young’s modulus and the shear modulus of the bulk material,
I is the moment of inertia of the ligament plane cross-sectional area, and
k is an empirical correction factor related to the stress distribution within the ligament cross-section [
117]. Equation (14) can be solved by taking into account the usual condition [
117]:
and the boundary conditions:
Equation (15) expresses the fact that the second derivative of the bending rotation ψ is directly proportional to the mechanical load P. Instead, Equations (16) and (17) relate to the assumption that the bending rotation ψ and bending deflection dψ/dx are equal to zero, respectively, at the middle point and at the ends.
It can be shown that the maximum deflection at the ligament middle point is equal to:
where the second term in the square brackets represents a mathematical expression accounting for the distribution of shear stresses across the ligament cross-sectional area. In this expression,
ν is Poisson’s ratio and
A is the cross-sectional area of ligaments at the middle point.
In the elastic deformation regime, stress and strain are related through Young’s modulus
E according to the equation [
117]:
where σ and ε are, respectively, the elastic stress and strain. For the elastically deformed ligament, strain can be calculated by the expression:
whereas the corresponding stress is:
In agreement with Ashby and Gibson’s approach [
2], the effective Young’s modulus of the NP structure can then be defined as:
It follows that the effective elastic modulus can be expressed as:
The moment of inertia
I and shear deformation coefficient
k depend on the geometry of the cross-section. For a square cross-section, they are equal to:
For a circular cross-section, the expressions change to:
Simple algebra shows that the effective elastic modulus for ligaments with a square cross-section is:
whereas for ligaments with a circular cross-section it becomes equal to:
Equations (28) and (29) express the relative Young’s modulus for NP Au structures with ligaments of square or circular cross-sections, and can be utilized to make predictions to be compared with experimental findings.
A similar modeling approach can be followed to express the yield strength of NP Au, which provides information on the plastic behavior of the NP Au foams. To this aim, it is worth noting that based on Equation (18), the load
P can be expressed as:
Correspondingly, the movement acting along the beam is equal to:
According to Timoshenko’s deformation theory [
116], the energy stored in the deformed beam is:
where
s is the integration variable along the ligament length. Once Equation (31) for
M is substituted in Equation (32), taking into account that a single unit cell includes two deforming ligaments, the total potential energy of deformation is equal to:
Following Timoshenko [
116], the work
Q can be expressed as:
According to Love’s theorem [
118],
where
V is the deformation energy. Under the condition that
U is numerically equal to
V, the latter can be written as:
The condition imposed by Love’s theorem is that:
Substituting Equations (33) and (34) in (37) results in the equation:
which allows expressing the deflection
w as a function of the stress σ as follows:
In turn, substituting Equation (39) in (31) allows us to express the moment
M as:
which makes the dependence of
M on the mechanical stress σ and on the ligament characteristic lengths
t,
h, and
l explicit. Since the plastic moment is equal to [
2]:
where σ
ys is the yield strength of the material, the relative yield strength of a NP Au foam can be expressed as:
Different from the case of elastic deformation behavior, the ligament cross-section geometry affects yield strength through the shear deformation coefficient k only.
For NP Au foams with ligaments having square cross-sections, the yield strength can be expressed as:
whereas it is equal to:
in the case of ligaments with circular cross-sections.
7. Model Predictions
Equations (12) and (13) describe the variation of relative density ϕ with the characteristic lengths
t,
d,
h, and
l. For illustration purposes, the parametric variation of ϕ with the ratios
t/
l and
d/
l, with the ratio
h/
l kept constant, is shown in
Figure 5a,b for both cases of ligaments with square and circular cross-sections. It can be seen that ϕ increases as
t/
l increases, and decreases as
d/
l increases. This is in line with general expectations, since the thickening of ligaments and the mass agglomeration, due to the mutual constraints on characteristic lengths, determine an increase of the fraction of nominal volume occupied by the mass.
The parametric variation of ϕ with the ratios
h/
l and
d/
l, with the ratio
t/
l kept constant, is shown, instead, in
Figure 6a,b. In this case, ϕ increases as
h/
l decreases, and increases as
d/
l increases. These results are again in agreement with general expectations. Relative density increases as ligaments get shorter or mass agglomerates at nodes.
Overall,
Figure 5 and
Figure 6 indicate that ϕ can reach maximum and minimum values of about 0.5 and 0.1, respectively, as the characteristic lengths
t,
h,
d, and
l are allowed to vary in realistic ranges of values,
i.e., they are comparable with those obtained from experimental measurements.
Figure 5.
Relative density ϕ as a function of the ratios t/l (a) and d/l (b). The ratio h/l is kept constant at 0.5. Dotted (• • •) and dashed (‒ ‒ ‒) lines refer to the cases of ligaments with square and circular cross-sections, respectively.
Figure 6.
Relative density ϕ as a function of the ratios h/l (a) and d/l (b). The ratio t/l is kept constant at 0.245. Dotted (• • •) and dashed (‒ ‒ ‒) lines refer to the cases of ligaments with square and circular cross-sections, respectively.
Concerning the variation of the relative Young’s modulus
E/
Es and yield strength σ/σ
ys with relative density ϕ and characteristic lengths, results are shown in
Figure 7. Model predictions have been obtained by keeping the ratio
h/
l constant at the value of 0.5.
Model curves reveal that both E/Es and σ/σys increase with ϕ. This is exactly what can be expected based on simple intuition when ligaments get thicker and nodes less massive. Analogously, E/Es and σ/σys increase with the ratio d/l. In this case, mass agglomeration at nodes depresses the NP Au foam elasticity, increasing the tendency to yield at the same time. Finally, E/Es and σ/σys increase with the ratio t/l. The reason is simply related to the bending behavior of individual ligaments, which get increasingly stiffer as their thickness increases.
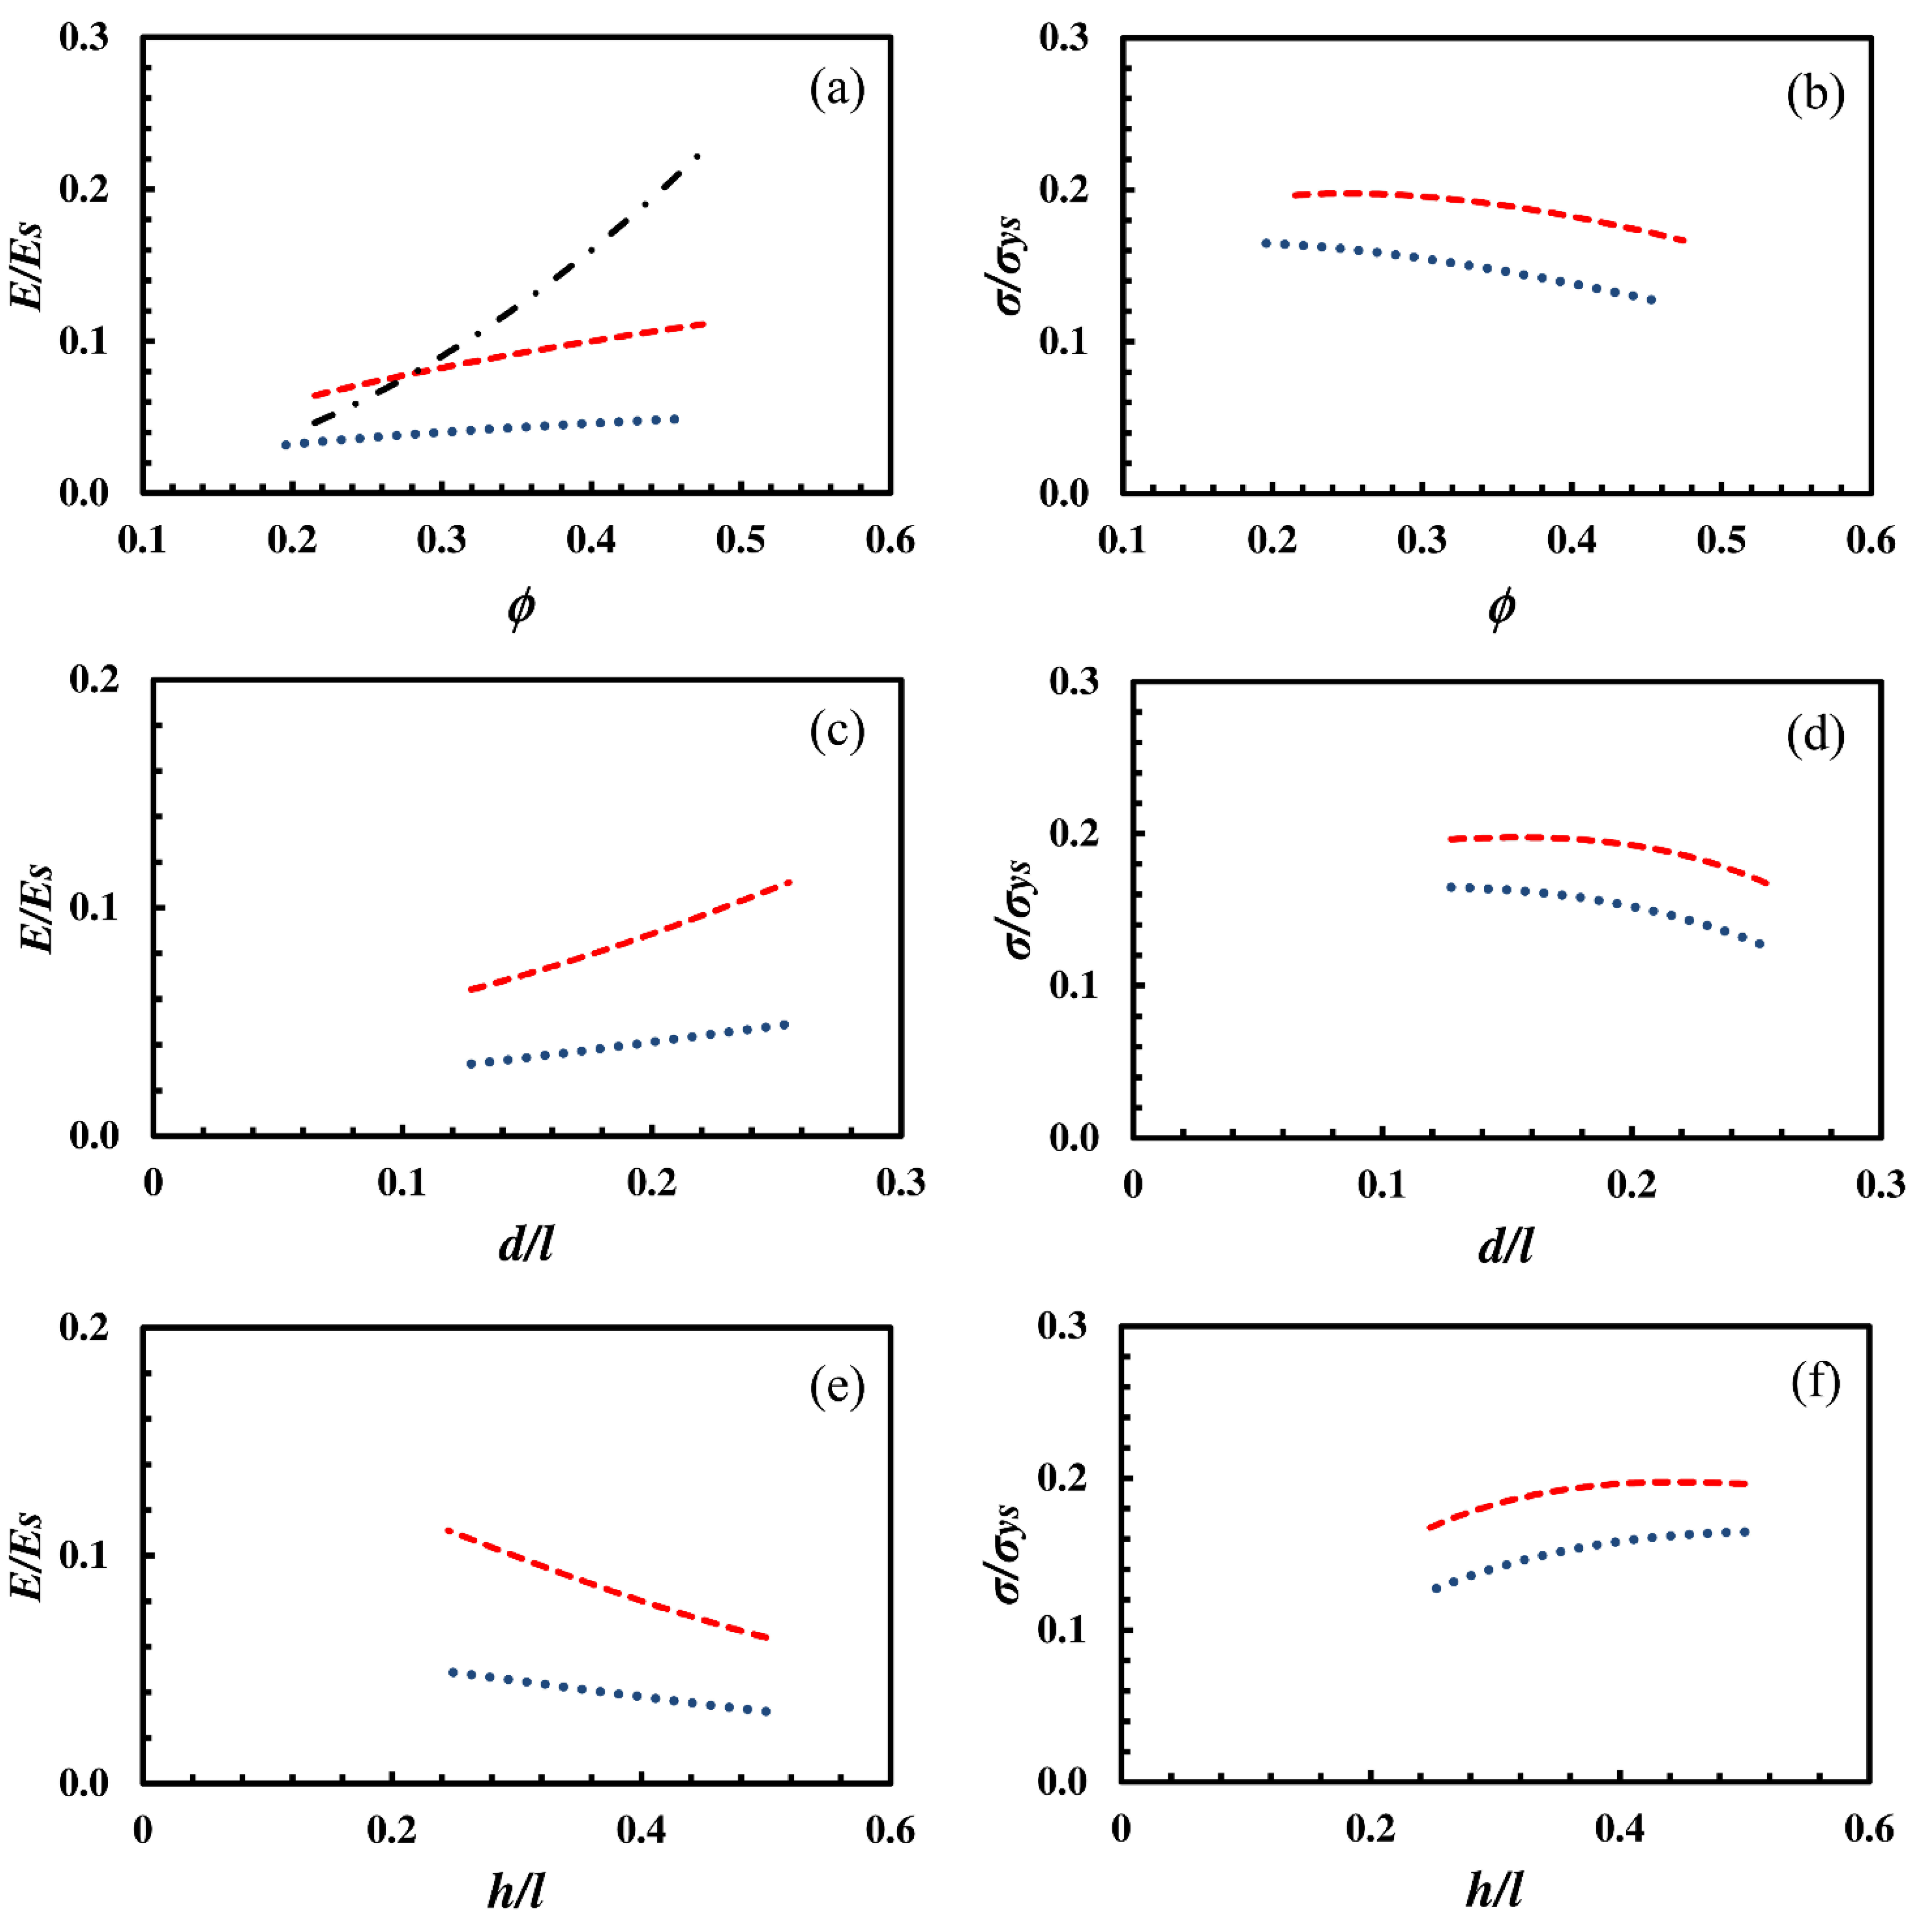
Another set of model curves concerning the relative Young’s modulus
E/
Es and yield strength σ/σ
ys is shown in
Figure 8. In this case, the ratio
t/
l has been kept constant at 0.245.
The relative Young’s modulus E/Es increases as relative density ϕ and the ratio d/l increase, whereas it decreases as the ligament length increases. In contrast, the relative yield strength σ/σys is predicted to decrease with the relative density ϕ and d/l ratio. As the ligament length increases, σ/σys increases.
Apart from providing a general map of the variation of E/Es and σ/σys with relative density and characteristic lengths, the sets of model curves also point out that the thickness of ligaments is more influential than their length on the elastic and plastic behaviors. Furthermore, having the same relative density ϕ, NP Au structures with ligaments with square cross-sections exhibit E/Es and σ/σys values larger than NP Au structures with ligaments with circular cross-sections.
Figure 7.
The relative Young’s modulus E/Es and the relative yield strength σ/σys as a function of relative density ϕ, respectively (a) and (b); of the ratio d/l, respectively (c) and (d); and of the ratio t/l, respectively (e) and (f). Results were obtained keeping h/l constant at the value of 0.5. Dashed (‒ ‒ ‒) and dotted (• • •) lines refer to the cases of ligaments with square and circular cross-sections, respectively. The dash dot line (− · − ·) indicates the values obtained with Gibson and Ashby’s model.
Figure 8.
The relative Young’s modulus E/Es and the relative yield strength σ/σys as a function of relative density ϕ, respectively (a) and (b); of the ratio d/l, respectively (c) and (d); and of the ratio t/l, respectively (e) and (f). Results were obtained keeping t/l constant at the value of 0.245. Dashed (‒ ‒ ‒) and dotted (• • •) lines refer to the cases of ligaments with square and circular cross-sections, respectively. Dash-dot line (− · − ·) indicates the values obtained with Gibson and Ashby’s model.
8. Comparison with Experimental Findings
The comparison between experimental findings and modeling predictions can be used to validate the modeling approach and test its capabilities and limitations. In particular, Equations (28), (29), (43) and (44) can be used to predict the relative Young’s modulus and yield strength. To this aim, it is necessary to evaluate characteristic lengths in real NP Au structures.
The unit cell depicted in
Figure 4 univocally defines the characteristic lengths involved in modeling. These include the distance
l between two adjacent nodes connected by a ligament, the effective ligament length
h, the ligament thickness
t, and the characteristic length
d of nodes. Characteristic lengths are not independent from each other. Two links exist between them, defined by Equations (12) and (13). These equations define clear conditions on the possible values that characteristic lengths can assume. Therefore, they also provide a way to indirectly estimate the effective ligament length
h affected by bending and the characteristic length
d associated with mass agglomeration at ligament junctions.
In this respect, it is worth noting that this is particularly useful in light of the difficulties in the direct determination of h and d from SEM micrographs. The irregular morphology of NP Au indeed does not allow any simple method to distinguish between node and ligament, particularly for massive nodes and thick ligaments. On the contrary, the distance l between two adjacent nodes connected by a ligament and the ligament thickness t are lengths much easier to measure.
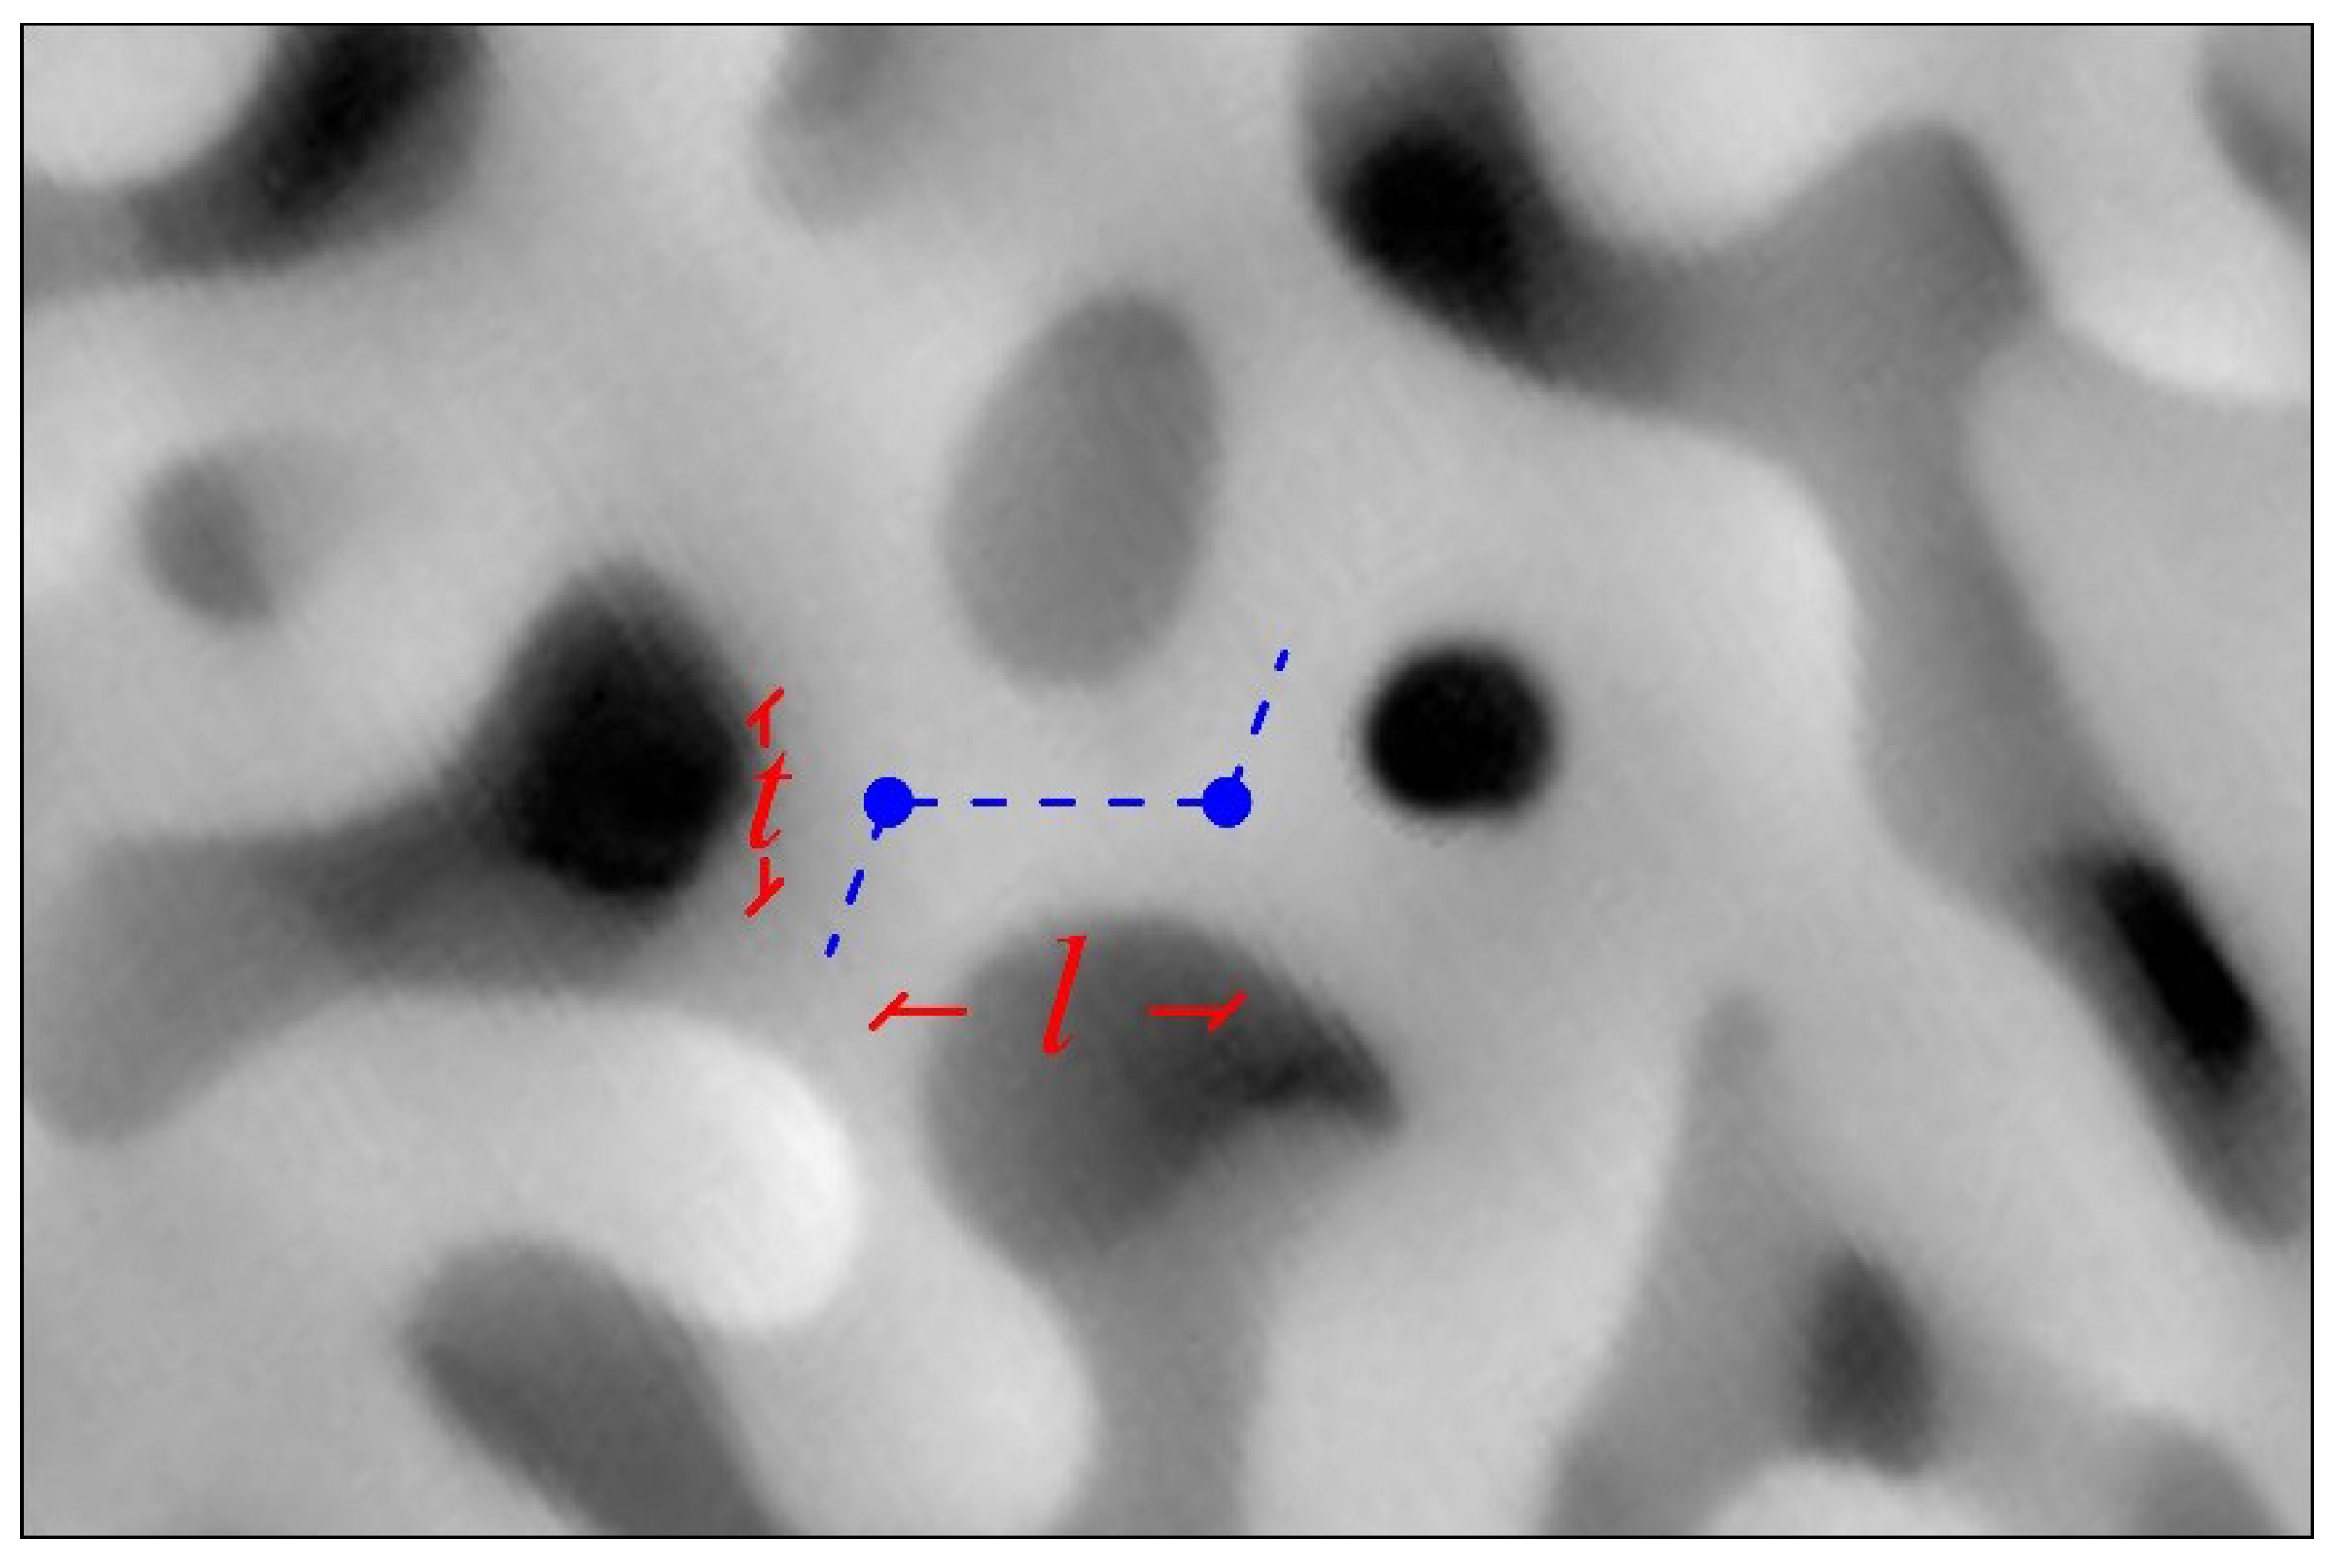
A simple method was followed to this aim. The distance
l between two adjacent nodes was measured by identifying the intersections between the axis of the ligament connecting the two nodes and the axes of two other ligaments, one per node. The distance between the two intersection points was set equal to
l. The ligament thickness
t was measured along the direction perpendicular to the ligament axis at half distance between the adjacent nodes. Measurements were performed on restricted areas of SEM micrographs. An example is shown in
Figure 9, where
l and
t are estimated for a representative ligament.
Figure 9.
The average distance between two adjacent nodes connected by a ligament, l, and the average ligament thickness, t.
To estimate reliable average values for the two characteristic lengths, the largest possible number of independent measurements on a corresponding number of ligaments was carried out. Reliable values for the effective ligament length h and for the characteristic length of nodes d can be calculated by imposing the simultaneous verification of Equations (12) and (13) using the average l and t estimates.
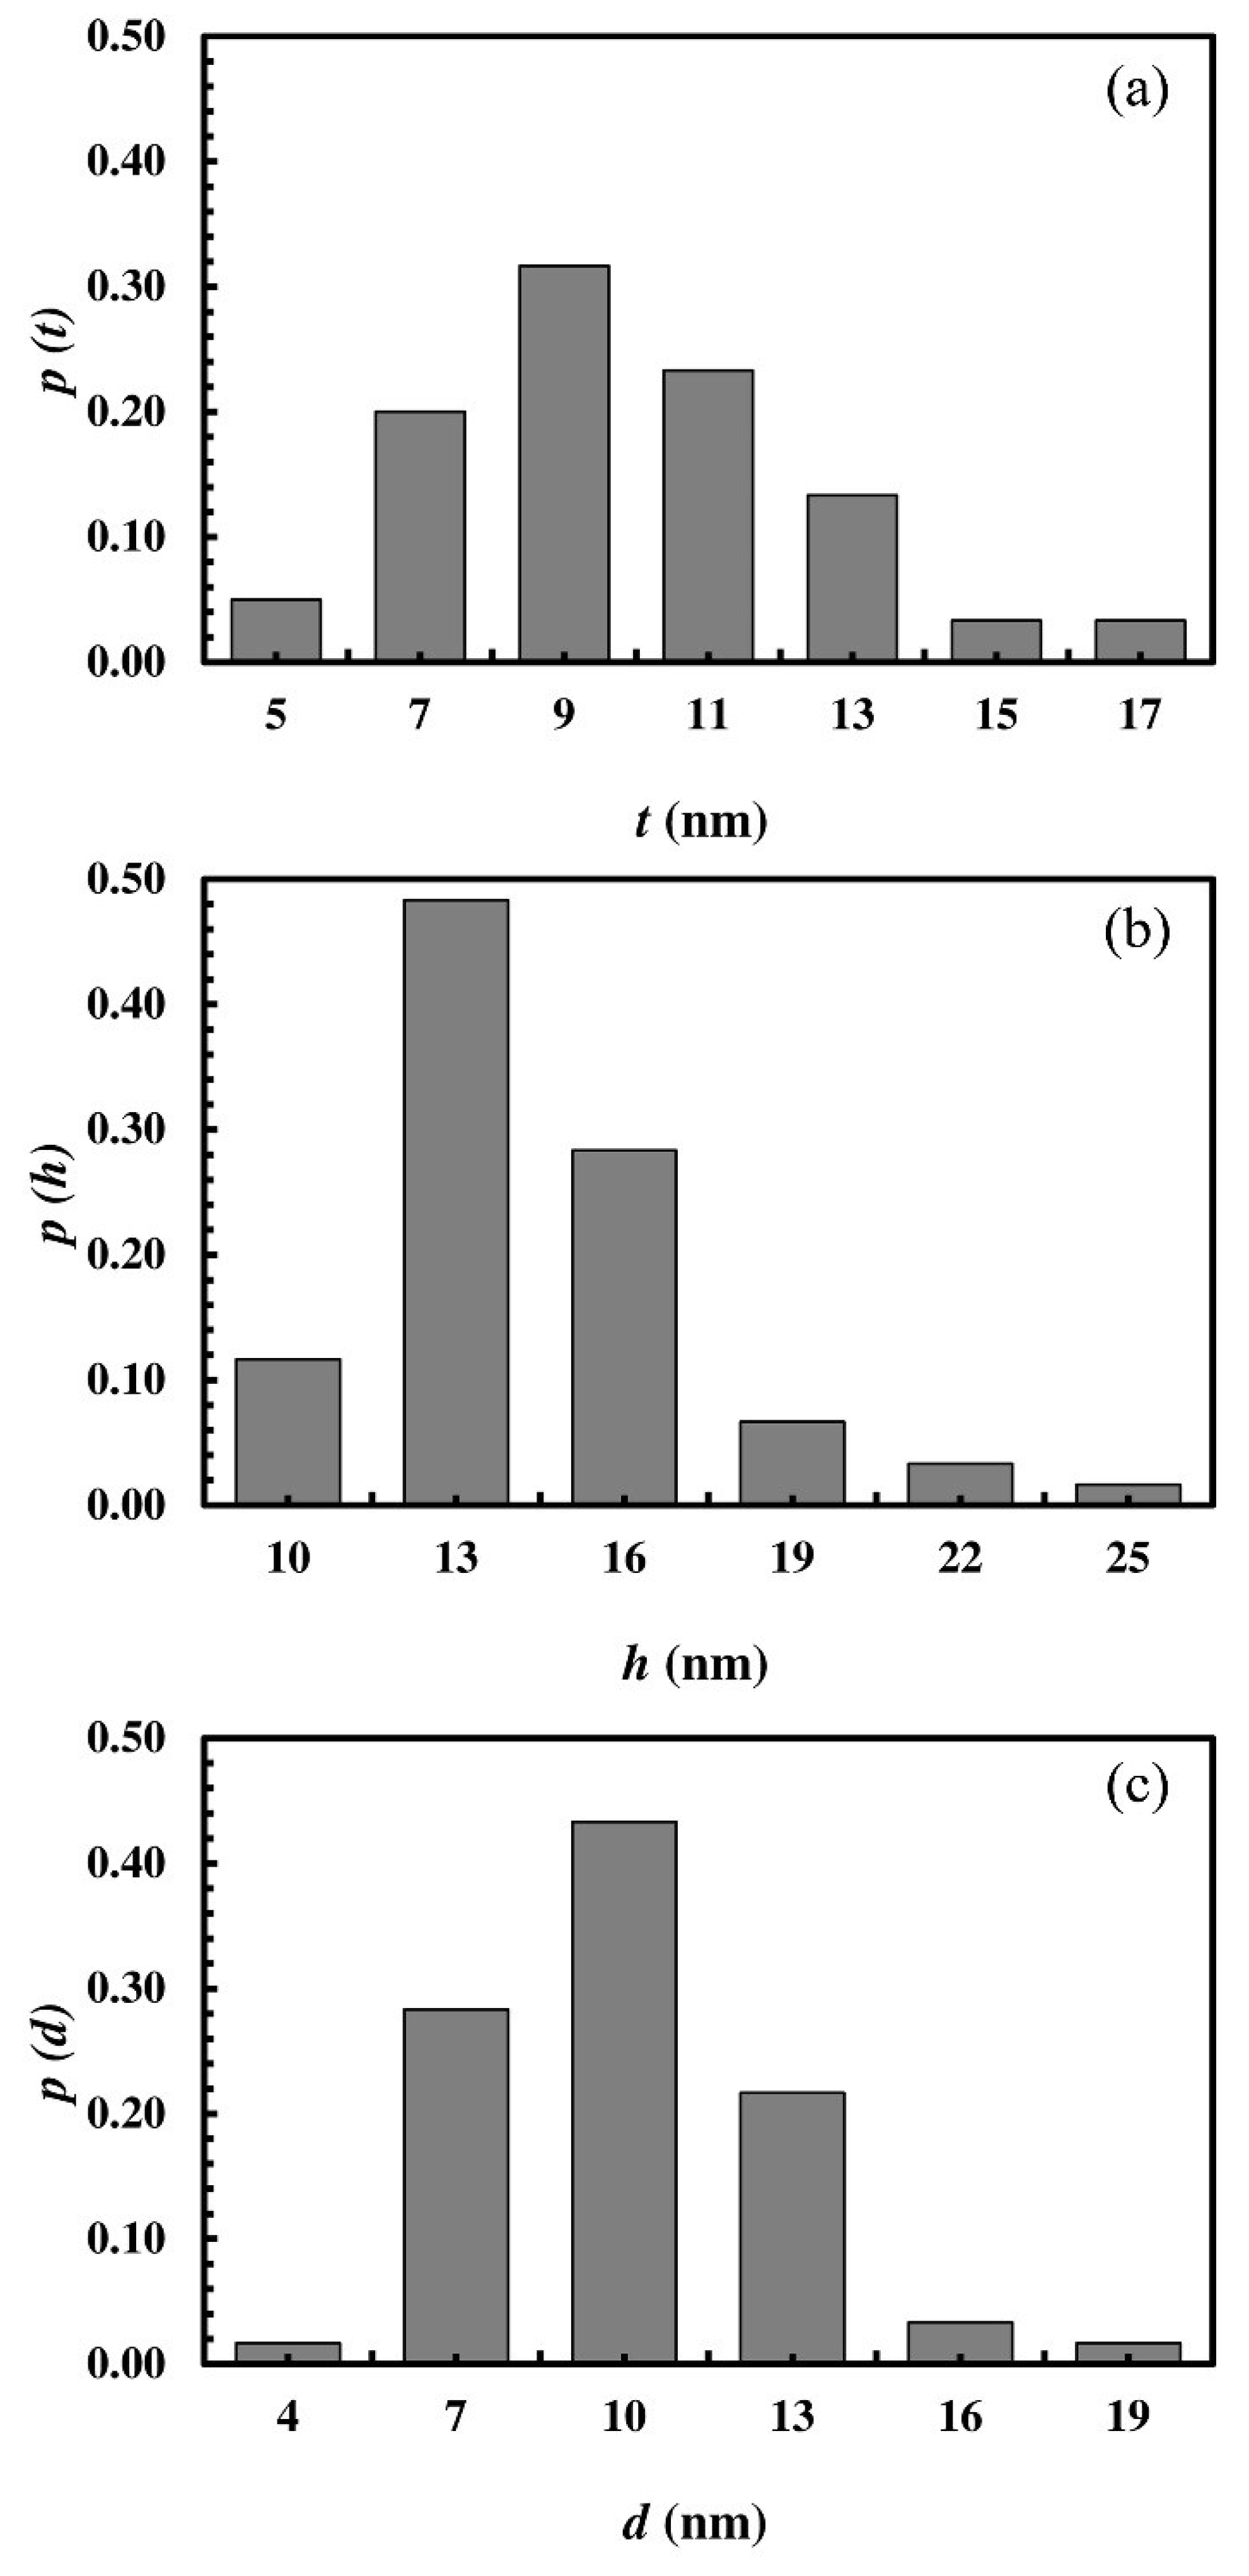
The above-mentioned method was applied to the analysis of data available in the literature. SEM micrographs were analyzed to construct the statistical distributions
p of the characteristic lengths. For illustration purposes,
Figure 10 shows the data obtained from the analysis of SEM micrographs reported in the work of Volkert
et al. [
95].
Figure 10.
Statistical distributions of (
a) effective ligament length
h; (
b) ligament thickness
t; and (
c) characteristic length of nodes
d. These distributions are obtained from image analysis applied to previous work by Volkert
et al. [
95].
It can be seen that the ligament thickness t ranges approximately between 5 and 17 nm. The calculated effective ligament length h varies, instead, between 10 and 25 nm, and the calculated characteristic node length d between 4 and 19 nm. Most probable values for t, h, and d are equal to 9, 13, and 10 nm, respectively.
Measured and calculated values of the different characteristic lengths can be utilized to predict the relative Young’s modulus and relative yield strength of the NP Au foams studied by Volkert
et al. [
95]. Model predictions are shown in
Figure 11a,b as a function of relative density ϕ. The cases of NP Au foams with ligaments having square and circular cross-sections are shown separately. For ligaments with square cross-sections, the relative Young’s modulus
E/
Es ranges between 0.03 and 0.21. For ligaments with circular cross-sections,
E/
Es ranges, instead, between 0.01 and 0.97. Regarding relative yield strength σ/σ
ys, it ranges between 0.07 and 0.38 for ligaments with square cross-sections, and between 0.06 and 0.29 for ligaments with circular cross-sections. For both
E/
Es and σ/σ
ys, modeling predictions almost overlap with experimental estimates.
Figure 11.
The relative Young’s modulus
E/
Es and the relative yield strength σ/σ
ys as a function of relative density ϕ. Data refer to the cases of ligaments with square, (
a) and (
b), and circular, (
c) and (
d), cross-sections, respectively. Model predictions (open symbols) are derived from the calculation of the relative elastic modulus and relative yield strength for different ligaments with their characteristic lengths measured by image analysis. The full symbol is the experimental value of the considered nanoporous metal [
95].
Similar calculations were performed to predict the relative Young’s modulus
E/
Es of NP Au foams starting from the experimental information reported in Liu and Antoniou’s work [
7]. As in the previous case, model predictions and experimental findings are shown in
Figure 12.
Once again, it can be seen that predicted and measured values exhibit an acceptable agreement, particularly in the light of the fragmentary information available.
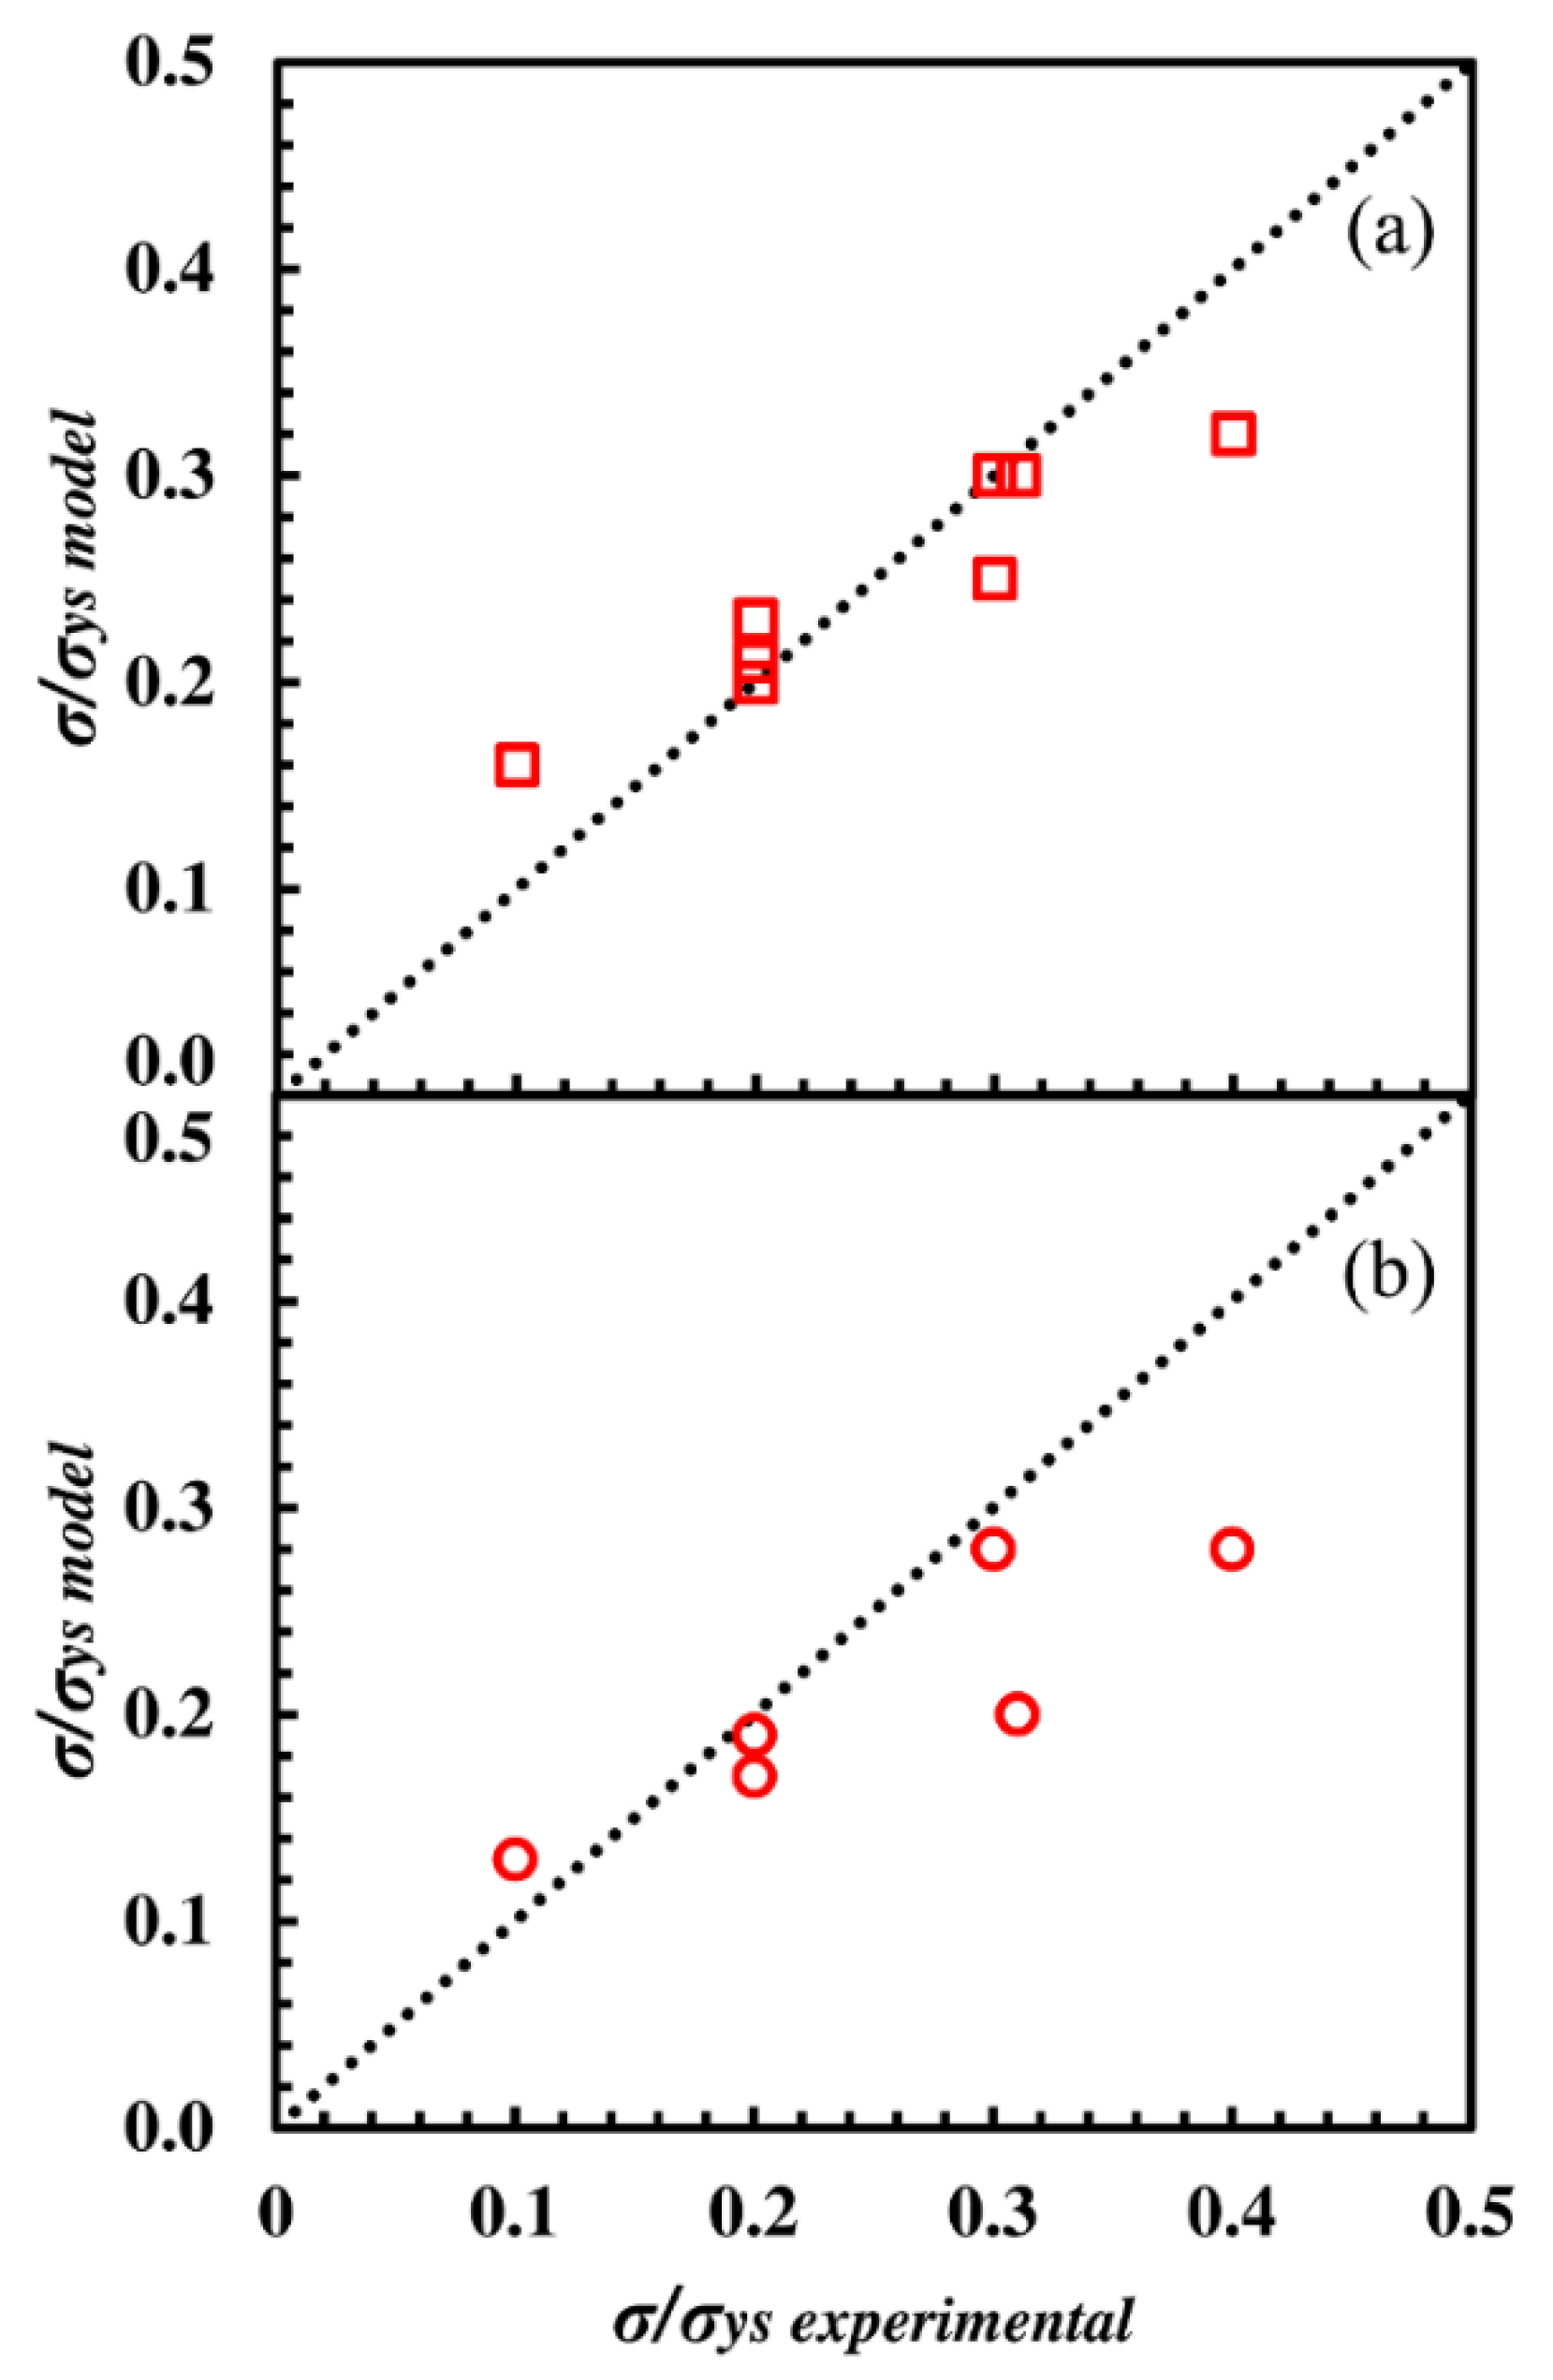
Predictions on the yield strength behavior of NP Au foams were made starting from experimental data discussed in works by Volkert
et al.,
Biener et al., and Hodge
et al. [
3,
90,
95]. Model predictions and experimental findings are compared in
Figure 13a,b, where modeling estimates are plotted as a function of experimental data.
It can be seen that points mostly arrange along the 45° line shown in the figure, demonstrating that modeling predictions and experimental values almost overlap.
Figure 12.
Relative Young’s modulus
E/
Es of NP Au foams as a function of relative density ϕ. Experimental data (•) are taken from Table 2 of Reference [
7]. Model predictions: part (
a) shows the case of ligaments with square (□) cross-section and part (
b) shows the case of ligaments with circular (○) cross-section.
Figure 13.
Relative yield strength σ/σ
ys values predicted by model equations as a function of experimental estimates. Experimental data are taken from References [
3,
90,
95]. Model predictions: part (
a) shows the case of ligaments with square (□) cross-section and part (
b) shows the case of ligaments with circular (○) cross-section.
Overall, the proposed model satisfactorily accounts for the elastic and plastic deformation of NP Au, reproducing its relative Young’s modulus and relative yield strength values to a remarkable extent. The satisfactory agreement between experimental data and modeling predictions clearly suggests that taking into account the flexural behavior of thick ligaments significantly improves the conceptual framework and the capability of the theoretical framework to correctly describe the mechanical properties of NP metals.


