Article

Effect of Cu Content on Atomic Positions of Ti50Ni50xCux Shape Memory Alloys Based on Density Functional Theory Calculations

School of Mechanical and Aerospace Engineering, Nanyang Technological University, 50 Nanyang Avenue, Singapore 639798, Singapore
*
Author to whom correspondence should be addressed.
These authors contributed equally to this work.
Metals 2015, 5(4), 2222-2235; https://doi.org/10.3390/met5042222
Submission received: 11 August 2015 / Revised: 16 November 2015 / Accepted: 23 November 2015 / Published: 26 November 2015
(This article belongs to the Special Issue Shape Memory Alloys 2014)

Abstract

:
The study of crystal structures in shape memory alloys is of fundamental importance for understanding the shape memory effect. In order to investigate the mechanism of how Cu content affects martensite crystal structures of TiNiCu alloys, the present research examines the atomic displacement of Ti50Ni50xCux (x = 0, 5, 12.5, 15, 18.75, 20, 25) shape memory alloys using density functional theory (DFT). By the introduction of Cu atoms into TiNi martensite crystal to replace Ni, the displacements of Ti and Ni/Cu atoms along the x-axis are obvious, but they are minimal along the y- and z-axes. It is found that along the x-axis, the two Ti atoms in the unit cell move in opposite directions, and the same occurred with the two Ni/Cu atoms. With increasing Cu content, the distance between the two Ni/Cu atoms increases while the Ti atoms draw closer along the x-axis, leading to a rotation of the (100) plane, which is responsible for the decrease in the monoclinic angle. It is also found that the displacements of both Ti atoms and Ni/Cu atoms along the x-axis are progressive, which results in a gradual change of monoclinic angle and a transition to B19 martensite crystal structure.

Graphical Abstract

1. Introduction

TiNi-based shape memory alloys (SMAs) have been widely used in the aerospace and biomedical fields because of their superior shape memory effect (SME), high superelasticity, and favorable biocompatibility [1,2,3,4,5]. In order to fulfill the requirement of high response frequency in the automotive and aerospace industries, TiNiCu SMAs in which Cu substitutes for Ni have been widely studied due to their narrow martensitic transformation (MT) temperature hysteresis in comparison with TiNi binary alloys [6,7,8,9]. In order to design new SMAs possessing very small transformation temperature hysteresis, understanding the effect of alloying on martensite structures is of vital importance. Previously reported works have studied the effects of Cu content on transformation temperature [10], microstructure [7,8,11,12], stress-strain characteristic and fatigue life [13,14,15], as well as applications as actuators [5,16]. Earlier research has found that the Cu content in TiNiCu alloys has little influence on the MT temperature but obvious effect on the MT pathway [11,12,17]. TiNiCu alloys with Cu content of less than 7.5 at. % are known to show the B2→B19′ transformation. For the alloys with Cu content between 7.5 at. % and 15 at. %, the B2→B19→B19′ transformation takes place, and for Cu ≥ 15 at. %, there is a direct B2→B19 transformation. Meanwhile, the transformation temperature hysteresis becomes smaller with increasing Cu content in the TiNiCu alloy [7,8,10].
With the rapid development of high-performance computing, the ab initio density functional theory (DFT) has become one of the most widely used approaches to investigate the crystal structures of SMAs at the quantum level [18,19,20]. Using the DFT method, Huang et al. [21] predicted a base-centered orthorhombic (BCO) structure with a 107° monoclinic angle in TiNi martensite, which is significantly different from the experimental reported value of 96.8°. Using a SeqQuest code based on the DFT, a new martensite structure in TiNi denoted as the B19″ phase was reported by Vishnu et al. [22]. Moreover, using experimental and theoretical DFT methods, the bonding and microstructural stability in Ni55Ti45 has been studied by Stott et al. [23,24] The present authors’ earlier computational study [25] found that with Cu addition to TiNi, the martensite lattice parameters a and c and the monoclinic angle decrease, whereas the lattice parameter b increases with increasing Cu content. Meanwhile, more electrons escaped from the Ti atoms as the Cu atoms attract more electrons compared to Ni atoms. We also learned that when the Cu content reaches 20 at. %, the monoclinic martensite crystal structure changes to an orthorhombic crystal structure. Meanwhile, the transformation hysteresis is reduced to as low as 5 K.
In order to effectively design SMAs with the required transformation hysteresis, understanding the atomic displacement and subsequent crystal structure transition as a result of alloying is of primary importance. However, the mechanism of Cu addition in modifying the martensite crystal structure is not clearly understood. In the present study, in order to determine how Cu content affects the martensite crystal structures of TiNiCu alloys, a first principle investigation on the atomic displacement of martensitic Ti50Ni50xCux (x = 0, 5, 12.5, 15, 18.75, 20, 25) alloys has been performed. The results presented in this research may provide insight for a better understanding of the transformation hysteresis in TiNiCu SMAs.

2. Computation Methodology

All present calculations are performed with the generalized gradient approximation (GGA) of Perdew, Burke and Ernzerhof (PBE) [26] based on the DFT method as implemented in the Cambridge Serial Total Energy Package (CASTEP) code [27,28]. The cutoff energy of the plane wave was set to 1000 eV to ensure a high degree of accuracy. The integrations in the Brillouin zone were performed on a grid of 9 × 6 × 6 Monkhorst-Pack set. The self-consistent field (SCF) tolerance was set to be 5.0 × 10⁻⁷ eV/atom and the smearing parameter of 0.05 eV was used. The convergence tolerance of energy, maximum force, maximum stress and maximum displacement were set to be 5.0 × 10⁻⁶ eV/atom, 0.01 eV/Å, 0.02 GPa and 5.0 × 10⁻⁴ Å, respectively. The ultrasoft pseudo-potentials were used to represent all ions. Pseudo-atomic calculations performed for Ti, Ni and Cu are 3s23p63d24s2, 3d84s2 and 3d104s1, respectively.
The martensite crystal structures of TiNiCu alloys with different Cu contents have been reported [21,29,30,31,32,33] and are listed in Table 1. The B19 and B19′ phases were observed in experiments, while the BCO structure was obtained from computational calculations. In the present calculations, all initial crystal structures were set to monoclinic structures, i.e., the B19′ phase. The original atomic positions of Ni and Ti were taken as x = 0.0525, y = 0.25, z = 0.693 and x = 0.4726, y = 0.25, z = 0.221, respectively [34].
Table 1. Lattice parameters of B19, B19′ and base-centered orthorhombic (BCO) from previous experimental and theoretical work.
AlloyPhasea (Å)b (Å)c (Å)β (°)Ref.
Ti50Ni50BCO (Comp.)2.943.9974.936107.0[21]
Ti50Ni50B19′-Monoclinic (Exp.)2.894.124.6296.5[27,28]
Ti50Ni30Cu20B19-Orthorhombic (Exp.)2.884.284.52-[27,28]
In order to obtain and visualize the atomic displacements in TiNiCu alloys with different Cu contents, the same unit cell has been used and all TiNiCu initial structures were optimized by the Virtual Crystal Method (VCM). The VCM is performed in which the ionic pseudo-potential, i.e., Ni50−xCux, is approximated by the weighted average of those of Ni and Cu in a unit cell, followed by conducting the usual ab initio self-consistent pseudo-potential calculation [35]. In a VCM simulation of Ti50Ni50xCux one creates a new, virtual atom, which is a mixture of Ni and Cu with appropriate weightages. Then, the actual calculation was performed on a unit cell with only the normal Ti atoms and the virtual Ni–Cu atoms. The calculation results were compared with the observations from the Supercell Method (SM). The unit cells of B19′ and B19 martensite structures are shown in Figure 1, in which four atoms were indicated for each unit cell.
Figure 1. Schematic of the unit cell of (a) B19′ martensite structure and (b) B19 martensite structure.
Metals 05 02222 g001

3. Results and Discussion

The calculated atomic positions of Ti and Ni/Cu as a result of Cu addition from VCM and SM are listed in Table 2, in which reported experimental data are also included. The calculated results from two methods are compared and cross-checked.
Table 2. Atomic coordinates (x, y, z) of Ti and Ni in TiNiCu alloys from Virtual Crystal Method (VCM) and Supercell Method (SM).
AlloysAtomic Coordinate (Ni/Cu)Atomic Coordinate (Ti)
xyzxyz
Ti50Ni50 (Exp.)0.05250.250.6930.47260.250.221
Ti50Ni50 (Comp.)0.08980.250.6710.35180.250.215
Ti50Ni45Cu5—VCM0.06390.250.6700.38700.250.215
Ti50Ni45Cu5—SM0.06600.250.6690.38510.250.228
Ti50Ni37.5Cu12.5—VCM0.04710.250.6690.40260.250.213
Ti50Ni37.5Cu12.5—SM0.04690.250.6910.41880.250.215
Ti50Ni35Cu15—VCM0.03490.250.6710.41660.250.212
Ti50Ni35Cu15—SM0.03250.250.6830.43960.250.208
Ti50Ni31.25Cu18.75—VCM0.01260.250.6770.46080.250.213
Ti50Ni31.25Cu18.75—SM0.01170.250.6790.46270.250.216
Ti50Ni30Cu20—VCM0.01160.250.6770.46200.250.212
Ti50Ni30Cu20—SM0.00570.250.6840.47800.250.213
Ti50Ni25Cu25—VCM−0.00190.250.6790.50640.250.212
Ti50Ni25Cu25—SM−0.00020.250.6820.50030.250.213
From the calculated results listed in Table 2, it can be observed that the two computational methods used in the present research yield similar results and the trends are identical, which implies that the calculated results are accurate and reliable. Specifically, the atomic coordinates from the SM method are the average values of the corresponding atoms while those from VCM can be obtained directly. With higher accuracy, the results from the VCM method were used to visualize the atomic displacements in the unit cell. From Table 2, it can be clearly observed that in the x-direction, the displacements of Ni/Cu and Ti atoms are clearly evident. Increasing Cu content leads to a displacement of Ni/Cu atoms along the [ 1 ¯ 00 ] direction and Ti atoms in the [100] direction. Both Ni/Cu and Ti atoms remain unshifted in the [010] direction with increasing Cu content. The displacements of Ni/Cu and Ti atoms along the [001] direction are relatively small in all the alloys considered here.
Since Ni/Cu and Ti atoms remain unchanged along the [010] direction, it can be stated that all the atomic displacements have occurred within the (010) plane. The schematic projections of the crystal structures along the y-axis for TiNiCu alloys containing different Cu contents are illustrated in Figure 2. The positions of the Ni/Cu site (blue) and Ti site (grey) along “a” and “c” lattice parameters with respect to the binary alloy have been indicated. The dashed circles represent the original positions of the Ni and Ti atoms in the computational Ti50Ni50 B19′ structure.
The three-dimensional (3D) diagrams are shown in Figure 3. From this figure, it is obvious that all the atomic displacements occurred with (010) planes, i.e., (010) plane at y = 0.25 (as listed in Table 2) and (010) plane at y = 0.75, respectively. We label the atoms within the (010) plane at y = 0.25 as Ni/Cu(A) and Ti(A), and the atoms within the (010) plane at y = 0.75 as Ni/Cu(B) and Ti(B), respectively. As shown in Figure 2, the Ti atoms on the left and right sides are Ti(A) and Ti(B), respectively, while the Ni/Cu atoms in upper and lower positions are Ni/Cu(A) and Ni/Cu(B), respectively. The monoclinic angles and the atom displacement directions are indicated in these two figures.
The crystal structure is determined by the atomic arrangements in the crystalline solids. From Figure 2 and Figure 3, we observe that along the x-axis, the two Ti atoms shifted in the opposite directions, as did the two Ni/Cu atoms. With increasing Cu content, the distance between the two Ni/Cu atoms increases along the x-axis, while that between the Ti atoms decreases. Specifically for the Ni/Cu atom, when the Cu content reaches 25 at. %, the x-parameter is near zero. This form of atomic displacement within the (010) plane leads to a rotation of the (100) plane. As shown in Figure 4, from Ti50Ni50 to Ti50Ni25Cu25, the (010) and (001) planes remain unchanged. However, the (100) plane rotates along the [010] direction, leading to a decrease in the monoclinic angle. As a result, the crystal structure changes from the monoclinic (B19′) to orthorhombic (B19).
Moreover, this change is gradual. From Table 2 and Figure 2, it can be clearly observed that the displacements of both the Ti and Ni/Cu atoms in the x-direction are continuous, which results in a continuous change of the monoclinic angle and lattice parameters, leading to successive changes in the crystal structure. Thus, it can be surmised that, with increasing Cu content in TiNiCu alloys, the change in the martensite crystal structure from monoclinic B19′ to orthorhombic B19 is not dramatic but gradual. Furthermore, MT temperatures can be affected by various factors, in particular the chemical content. Accompanied by the change of the martensite crystal structure from B19′ to B19, the transformation hysteresis in TiNiCu SMAs drastically reduces from as high as 30 K to as low as 5 K. Through understanding the pathway of transition of martensite crystal structures from B19′ to B19 as a result of alloying, it might help to understand the drastic change in the transformation hysteresis due to Cu addition.
Figure 2. Projections of the martensite crystal structures along the <010> direction of (a) binary Ti50Ni50; (b) Ti50Ni45Cu5; (c) Ti50Ni37.5Cu12.5; (d) Ti50Ni35Cu15; (e) Ti50Ni31.25Cu18.75; (f) Ti50Ni30Cu20; and (g) Ti50Ni25Cu25, comparing the typical relative average positions of the Ni site (blue) and Ti site (grey) along ‘a’ and ‘c’ lattice parameters with respect to the binary alloy.
Metals 05 02222 g002
Figure 3. 3D diagrams showing the atomic positions of (a) Ti50Ni45Cu5; (b) Ti50Ni37.5Cu12.5; (c) Ti50Ni35Cu15; (d) Ti50Ni31.25Cu18.75; (e) Ti50Ni30Cu20; and (f) Ti50Ni25Cu25.
Metals 05 02222 g003
Accommodation of Cu in the monoclinic martensitic TiNi takes place by substitution of the Ni atom, and it is assumed that replacements are controlled primarily by the size mismatch of Cu [36]. The atomic radii of Ti, Ni and Cu are 1.45 Å, 1.29 Å and 1.28 Å, respectively. As the atomic radius of Cu is slightly smaller than that of Ni, the size mismatch is not significant, which is consistent with the previous observation that there is no dramatic change of crystal structure when substituting Cu in TiNiCu martensitic alloys [25].
Figure 4. Schematic diagram showing the transition of martensite crystal structure from B19′ to B19 as a result of Cu addition in TiNi.
Metals 05 02222 g004
Our earlier work noted that more electrons escape from the Ti atoms in comparison with the equiatomic TiNi binary alloy with increasing Cu content [25]. The more charge transfer between Ti and Ni/Cu atoms, the stronger the interaction between them will be, and the higher the bonding force between them is, leading to a shorter bond length. In Figure 5, the bond lengths of Ni/Cu(A)–Ti(A) and Ni/Cu(A)–Ti(B) as a function of Cu content in TiNiCu alloys are presented. It can be observed that, with increasing Cu content in TiNiCu martensite, the bond length between Ni/Cu(A) and Ti(B) atoms increases, leading to an increase of lattice parameter b, which agrees well with previous observations [25]. For the bond length between Ni/Cu(A) and Ti(A) atoms, it decreases initially and then increases. When Cu content increases from 0 at. % to 15 at. %, more electrons escape from Ti(A) to Ni/Cu(A), leading to a stronger interaction and resulting in a decrease of bond length between them. In addition, the weak interaction between Ni/Cu(A) and Ti(B) leads to an increase of bond length between them. When Cu content is more than 15 at. %, less electrons escape from Ti(A) to Ni/Cu(A), leading to a weak interaction which results in an increase of bond length between them. Meanwhile, the interaction between Ni/Cu(A) and Ti(B) becomes stronger, and when Cu content reaches 20 at. %, the bond length between them begins to decrease.
Figure 5. Variation of Ni/Cu–Ti bond length with Cu content. (See text for details).
Metals 05 02222 g005
Figure 6 presents the band structures and associated partial density of states (DOS) of TiNiCu alloys for several symmetry directions in k space. The number of bands varies when a different number of unit cells was used to carry out the calculations. From this figure, most of the bands are observed near and below the Fermi level and the bands are similar at lower energy. For TiNiCu with Cu content between 5% and 20%, a narrow gap exists near the Fermi level, which is different from the TiNi binary alloy and Ti50Ni25Cu25. Moreover, bands at higher energy are only observed in the TiNi binary alloy and Ti50Ni25Cu25, which also indicates that the TiNiCu with Cu content between 5% and 20% is the transition phase from monoclinic to orthorhombic.
On the other hand, in this figure, the partial local s, p and f DOS are very small in all compounds compared to the d DOS, which indicates that, for TiNiCu alloys, d orbital character plays a primary role in DOS, the same as in the TiNi binary alloy. In partial DOS, the Ti, Ni and Cu states exhibit sharp peaks, in which the peak apex of the Ti d-states occurs at a higher energy than the peak apex of the Ni and Cu d-states. It also can be observed that with Cu content exceeding 15%, a dual peak is shown at a lower energy, which shows that with increasing Cu content, the Cu d-states are making an increasingly important contribution to the partial DOS which may be responsible for the transition of the crystal structure.
Figure 6. Band structures and associated partial density of states for (a) binary Ti50Ni50; (b) Ti50Ni45Cu5; (c) Ti50Ni37.5Cu12.5; (d) Ti50Ni35Cu15; (e) Ti50Ni31.25Cu18.75; (f) Ti50Ni30Cu20; and (g) Ti50Ni25Cu25 with the Fermi level defined at 0 eV.
Metals 05 02222 g006
Figure 7 shows the two-dimensional (2D) plots for the total electron density projection in the XZ plane, from which an electronic charge depletion at the Ti lattice site and accumulation at the Ni/Cu site, with increasing Cu content, can be observed. When Cu content is below 15%, the charge density is approximately symmetrically distributed throughout the crystal structure. However, it becomes uneven when Cu content exceeds 15%. More charge transfer between Ti(A) and Ni/Cu(B) is observed, which may lead to a lower bonding force between Ti(A) and Ni/Cu(A), and hence an increase in the bond length, being consistent with our previous observations of bond length. In addition, the gradual change in the charge density redistribution plays an essential role in the gradual change of crystal structures.
Figure 7. 2D total electron density projection plots in the XZ plane with color legend indicating magnitude of charge distribution for (a) binary Ti50Ni50; (b) Ti50Ni45Cu5; (c) Ti50Ni37.5Cu12.5; (d) Ti50Ni35Cu15; (e) Ti50Ni31.25Cu18.75; (f) Ti50Ni30Cu20; and (g) Ti50Ni25Cu25.
Metals 05 02222 g007

4. Conclusions

The present research has studied the atomic positions and displacements in the martensite crystal structure of Ti50Ni50xCux (x = 0, 5, 12.5, 15, 18.75, 20, 25) alloys using density functional theory. Based on the crystal structure optimizations of TiNiCu martensite consisting of different amounts of Cu substituting for Ni, the following conclusions can be drawn:
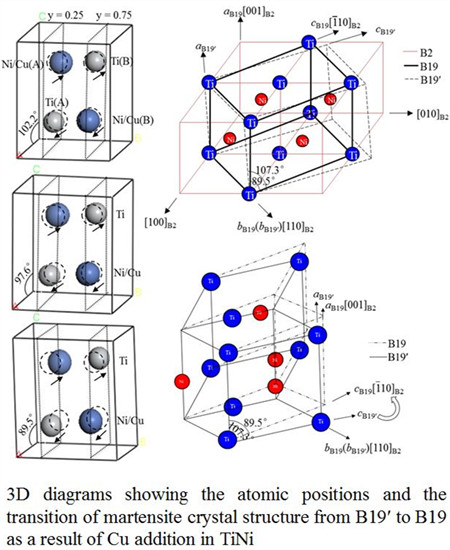
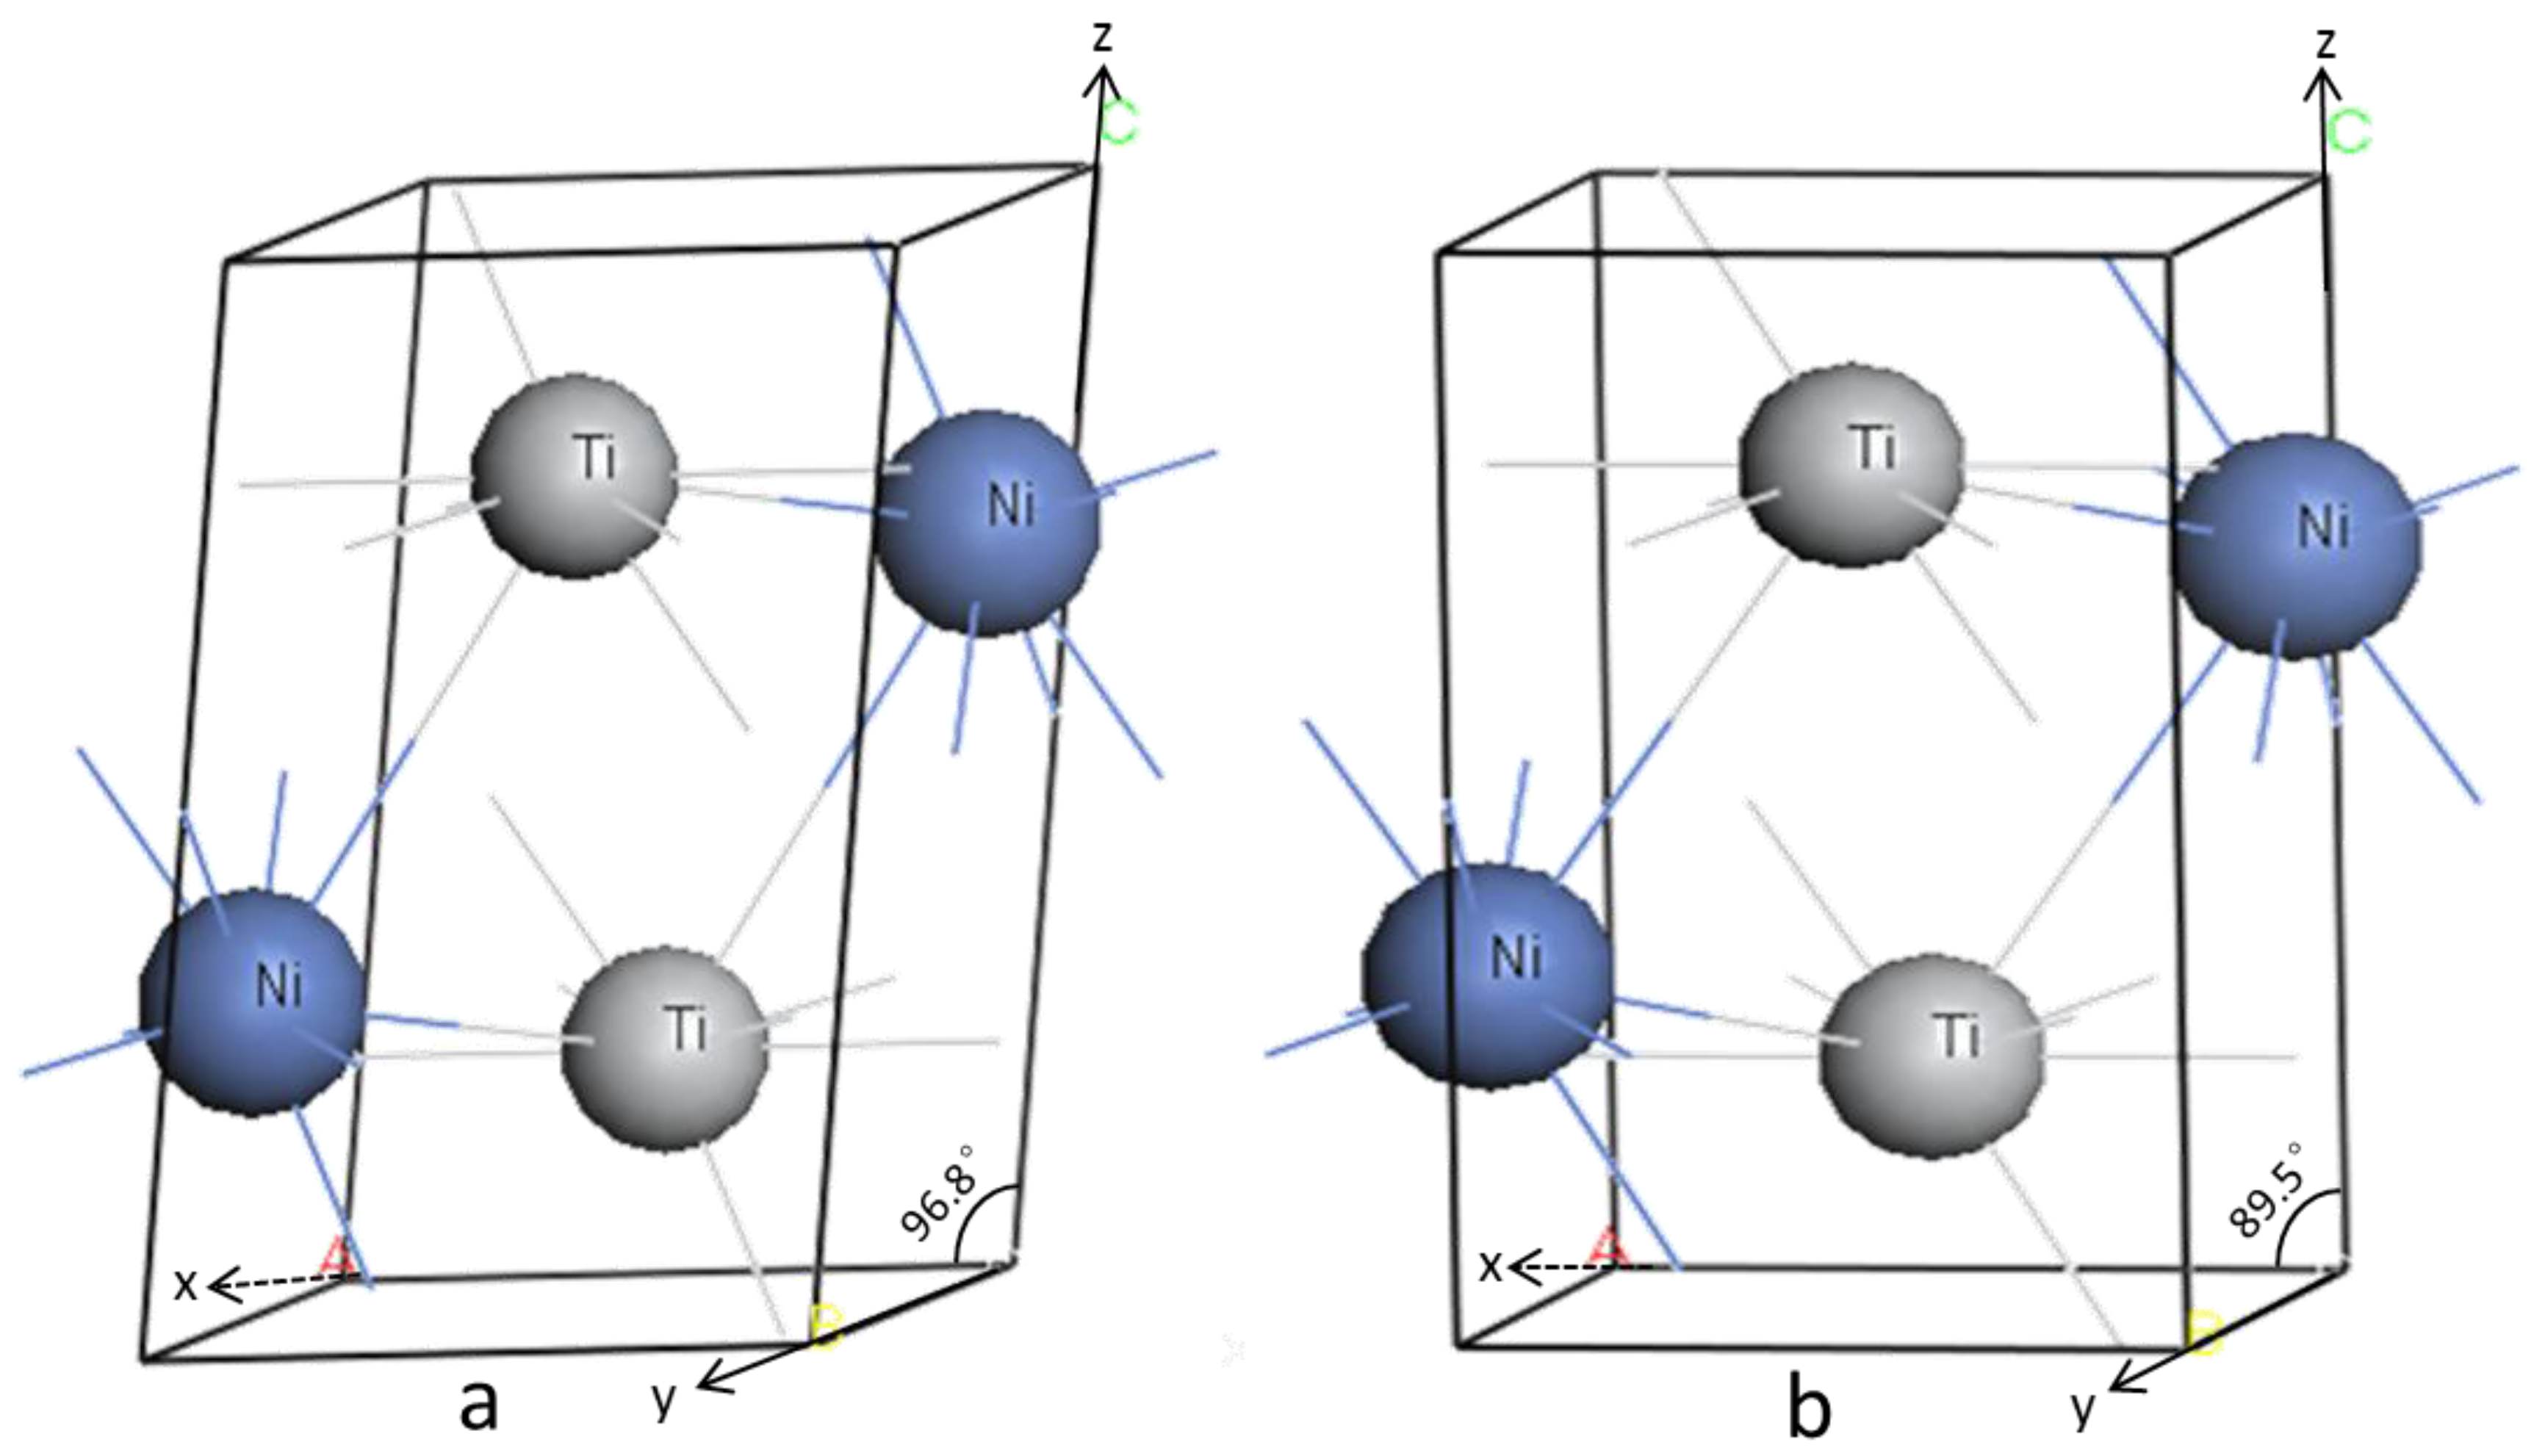
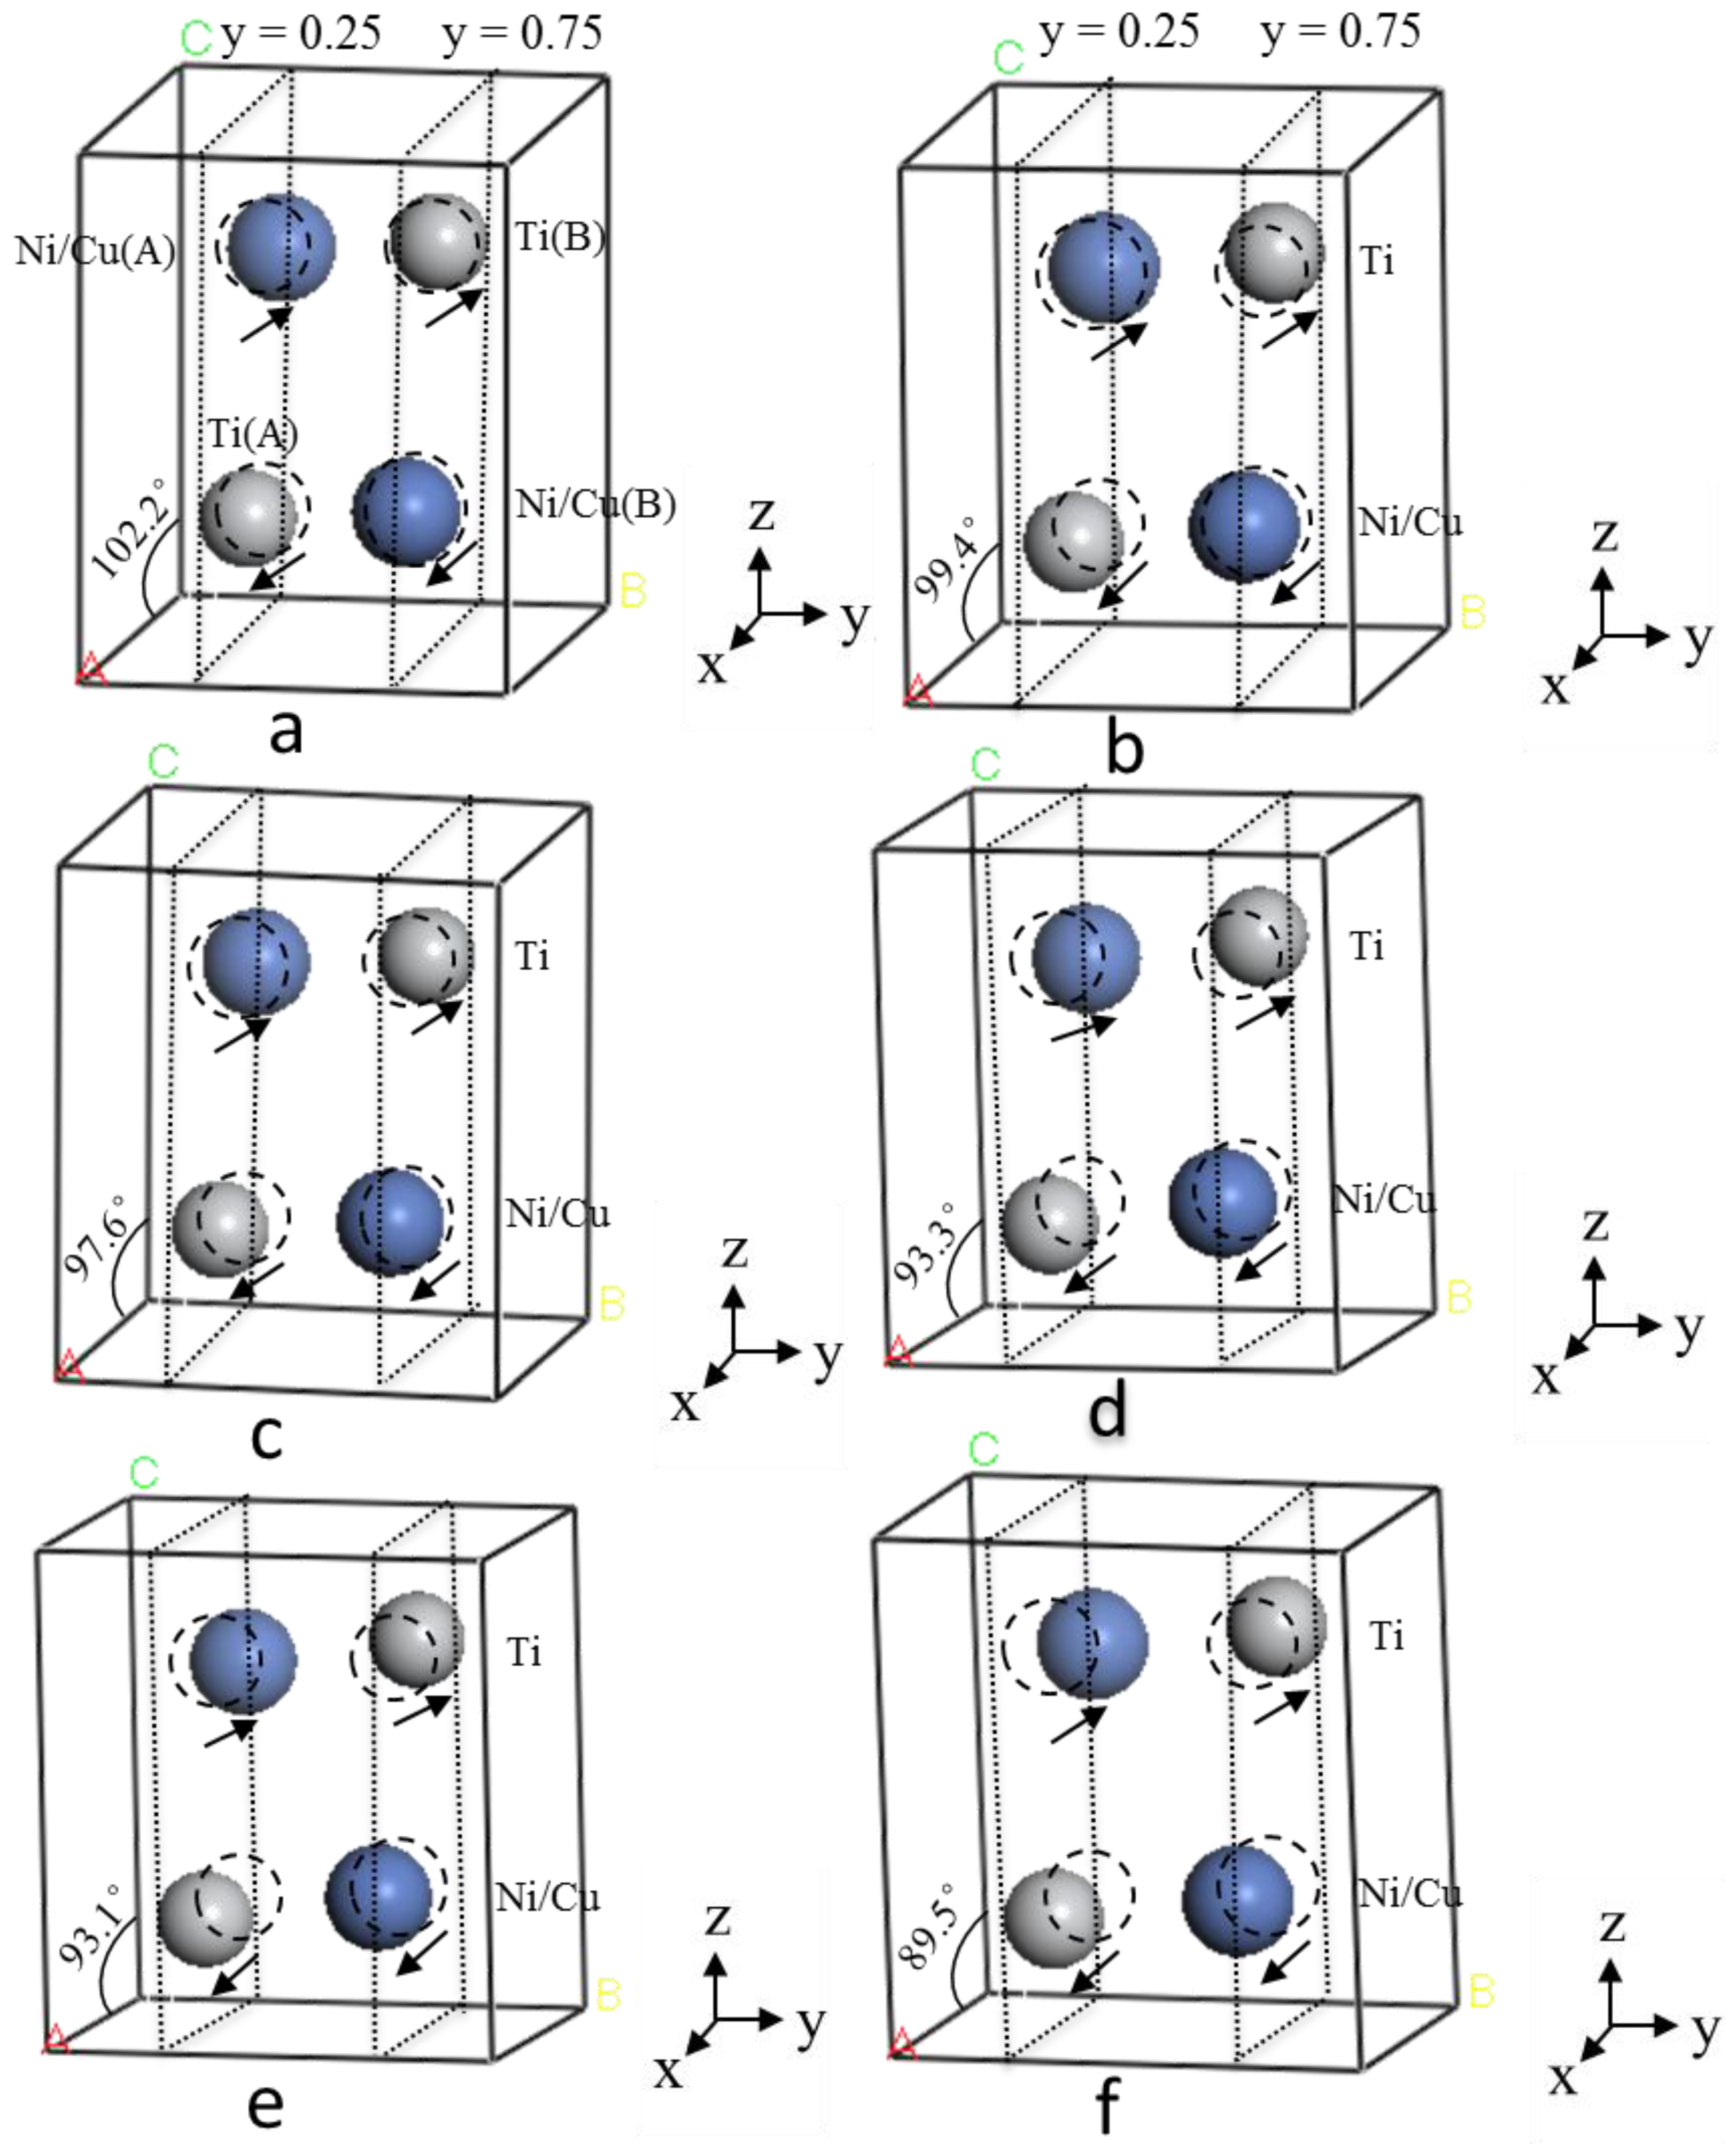
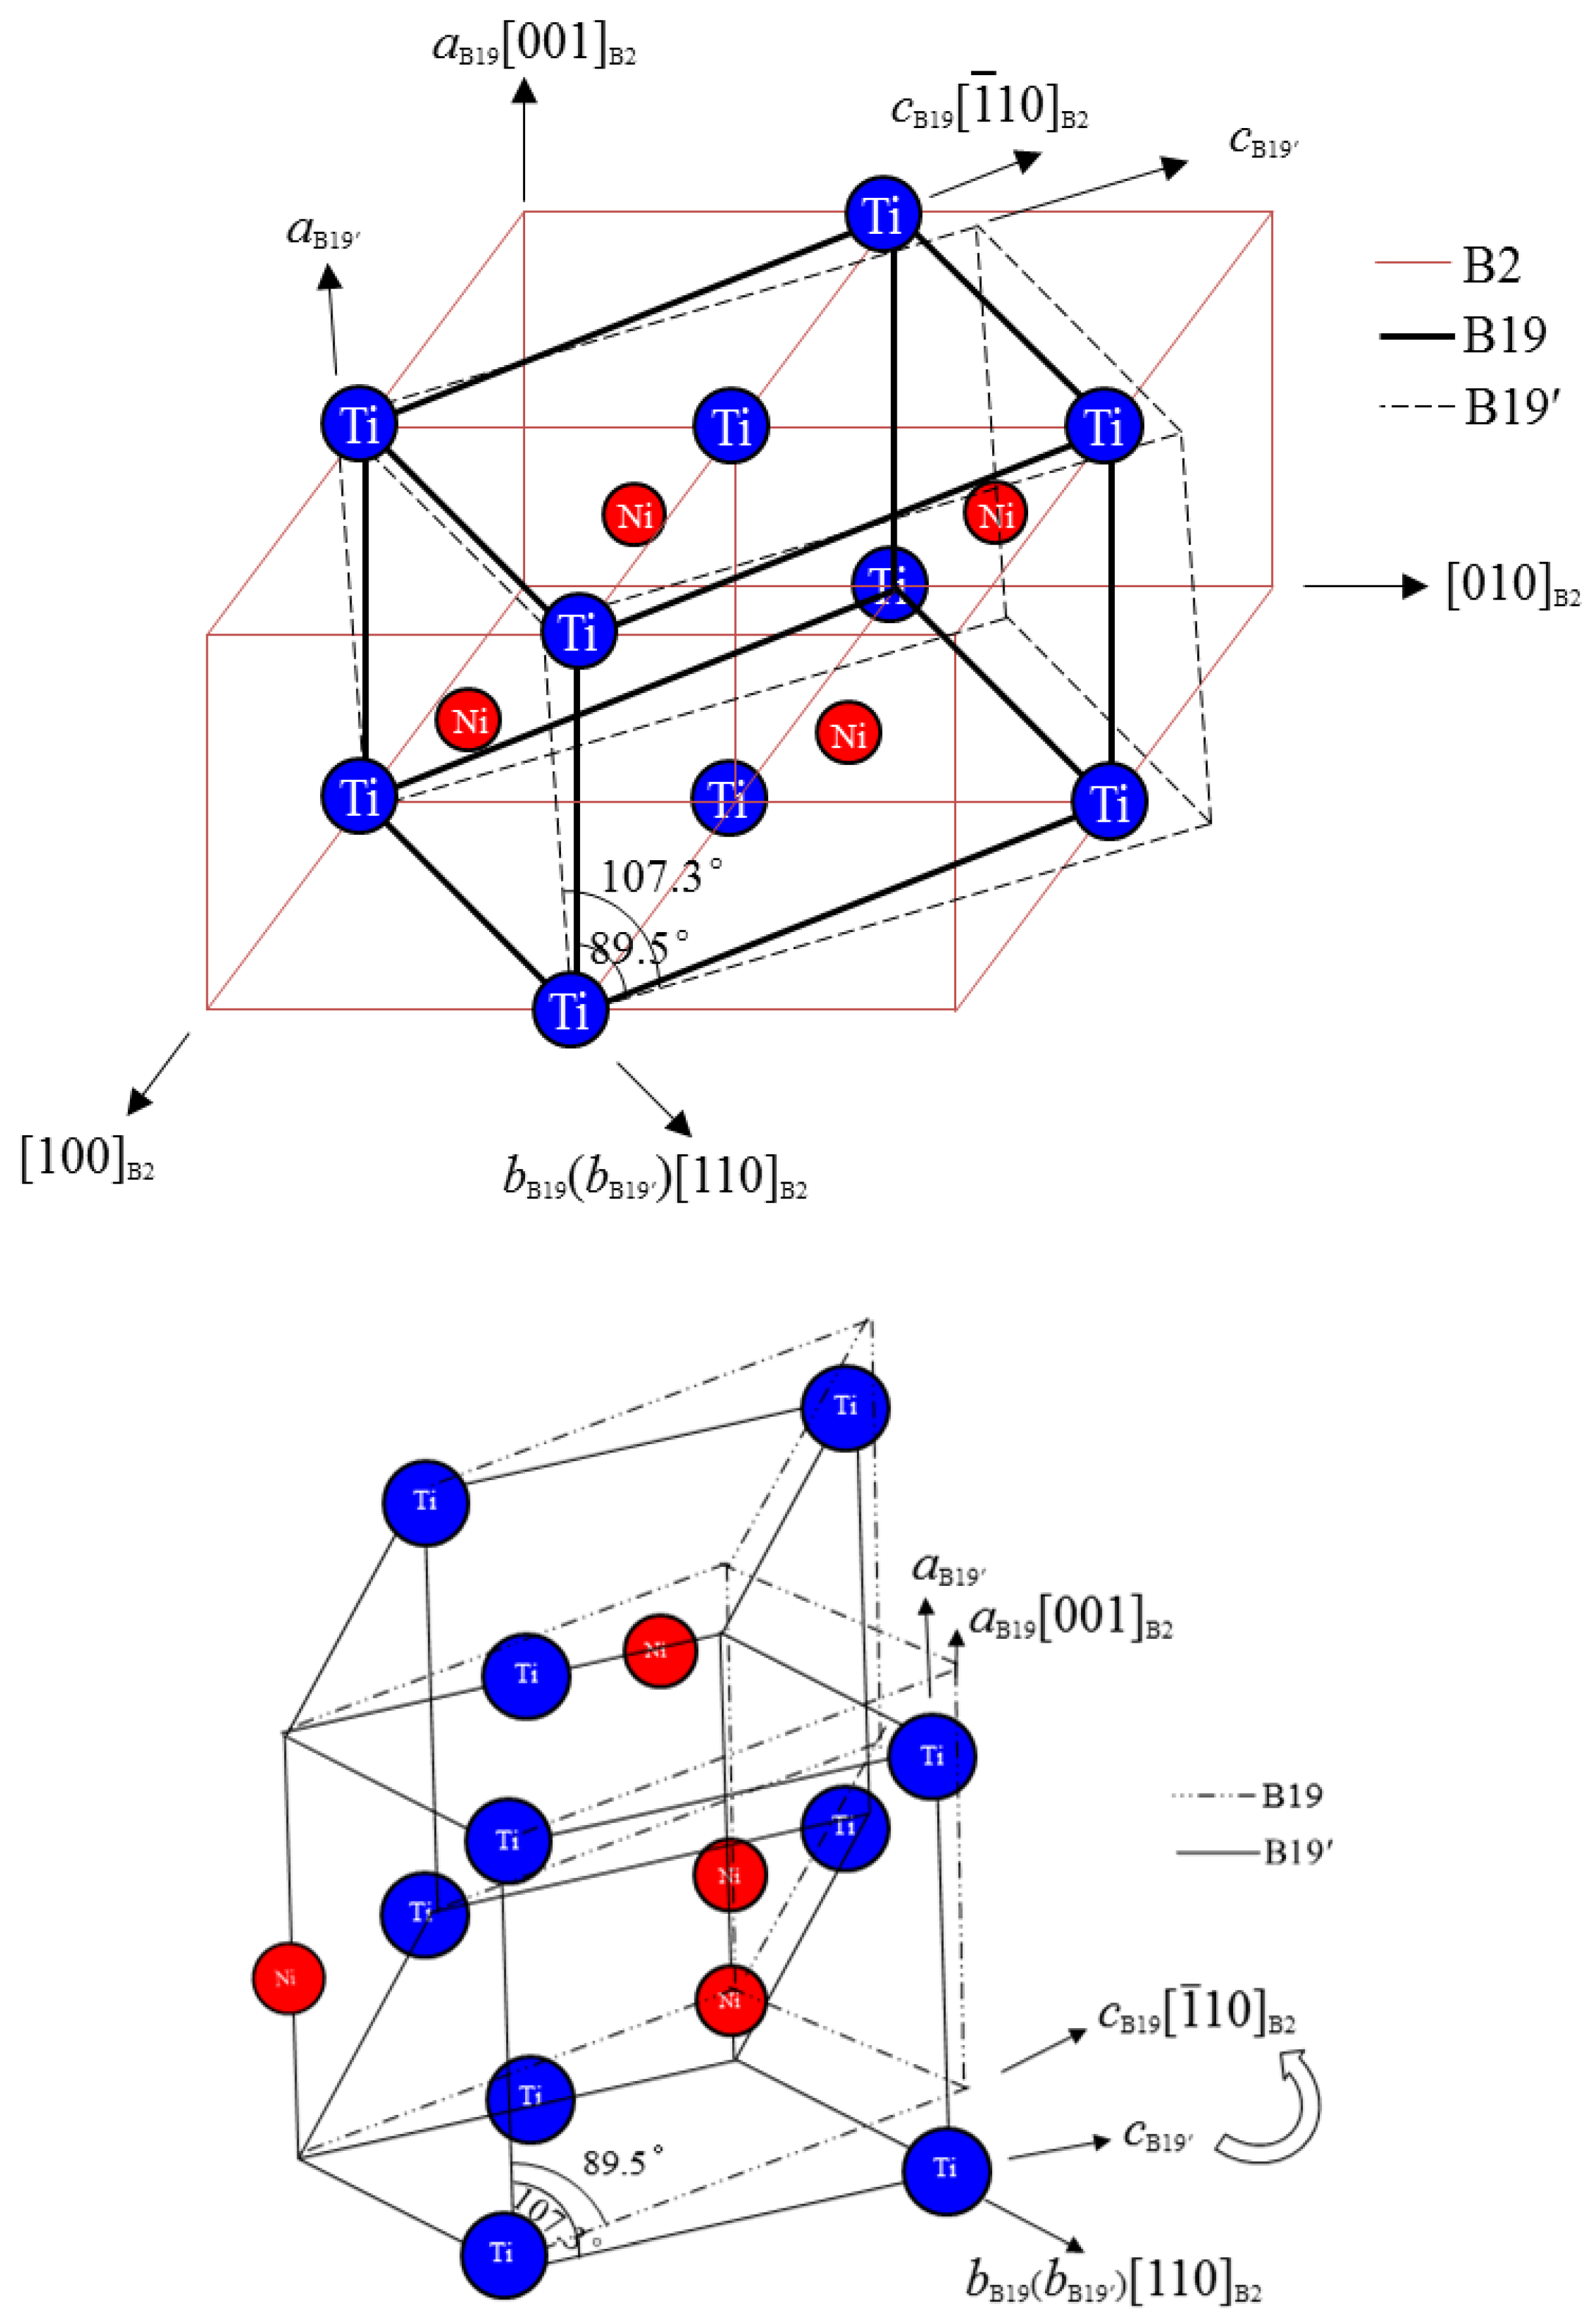
  • As a result of Cu addition to TiNi, the shifting of Ti and Ni/Cu atoms along the x-axis is clearly evident, but is minimal along the y and z axes. With increasing Cu content, the distance between two Ni/Cu atoms increases along the x-axis while the Ti atoms become closer, which is responsible for the rotation of the (100) plane, leading to a decrease in the monoclinic angle.
  • Due to the similar sizes of Ni and Cu atoms, by introduction of Cu into TiNi, the displacements of both Ti and Ni/Cu atoms along the x-axis are progressive, indicating no dramatic change in TiNiCu martensite crystal structures, but the monoclinic angle decreases gradually until the orthorhombic structure is formed.
  • With increasing Cu content, the charge transfer between Ti and Ni/Cu atoms is suggested to be responsible for the observed atomic displacement. The increase of bond length between the Ni/Cu(A) and Ti(B) atoms leads to an increase of lattice parameter b.
  • Through revealing the pathway of crystal structure change due to Cu-addition it might help to provide some useful information for understanding the drastic change in transformation hysteresis in TiNiCu alloys and for adjusting the transformation hysteresis through adjusting the chemical content of particular SMAs of interest.
  • The results obtained from this research suggest a plausible approach for investigating the effect of alloying on the crystal structure change in SMAs apart from the traditional experimental approach and provide reasonable predictions.

Acknowledgments

The author Liangliang Gou would like to thank the Nanyang Technological University (NTU) for his PhD scholarship. The utilization of the computing facilities at the High Performance Computing Center (HPCC) is also acknowledged.

Author Contributions

Liangliang Gou, Yong Liu and Teng Yong Ng conceived and designed the study. Liangliang Gou performed the computational calculations and drafted the paper. Yong Liu and Teng Yong Ng reviewed and edited the manuscript. All authors contributed to explain the results, read and approve the manuscript.

Conflicts of Interest

The authors declare no conflict of interest.

References

  1. Otsuka, K.; Ren, X. Physical metallurgy of Ti–Ni-based shape memory alloys. Prog. Mater. Sci. 2005, 50, 511–678. [Google Scholar] [CrossRef]
  2. Frick, C.P.; Ortega, A.M.; Tyber, J.; Gall, K.; Maier, H.J. Multiscale structure and properties of cast and deformation processed polycrystalline NiTi shape-memory alloys. Metall. Mater. Trans. A 2004, 35, 2013–2025. [Google Scholar] [CrossRef]
  3. Chang, S.-H.; Chiu, W.C. Selective leaching and surface properties of Ti50Ni50−xCux (x = 0–20 at. %) shape memory alloys for biomedical applications. Appl. Surf. Sci. 2015, 324, 106–113. [Google Scholar] [CrossRef]
  4. Es-Souni, M.; Es-Souni, M.; Fischer-Brandies, H. Assessing the biocompatibility of NiTi shape memory alloys used for medical applications. Anal. Bioanal. Chem. 2005, 381, 557–567. [Google Scholar] [CrossRef] [PubMed]
  5. Grossmann, C.; Frenzel, J.; Sampath, V.; Depka, T.; Eggeler, G. Elementary transformation and deformation processes and the cyclic stability of NiTi and NiTiCu shape memory spring actuators. Metall. Mater. Trans. A 2009, 40, 2530–2544. [Google Scholar] [CrossRef]
  6. Massalski, T.B.; Murray, J.L.; Bennet, L.H.; Baker, H. Binary Alloy Phase Diagrams; ASM International: Materials Park, OH, USA, 1986. [Google Scholar]
  7. Saburi, T.; Watanabe, Y.; Nenno, S. Morphological characteristics of the orthorhombic martensite in a shape memory Ti–Ni–Cu alloy. ISIJ Int. 1989, 29, 405–411. [Google Scholar] [CrossRef]
  8. Nam, T.H.; Saburi, T.; Shimizu, K. Cu-content dependence of shape memory characteristics in Ti–Ni–Cu alloys. Mater. Trans. JIM 1990, 31, 959–967. [Google Scholar] [CrossRef]
  9. Lin, K.N.; Wu, S.K. Multi-stage transformation in annealed Ni-rich Ti49Ni41Cu10 shape memory alloy. Intermetallics 2010, 18, 87–91. [Google Scholar] [CrossRef]
  10. Otsuka, K.; Ren, X. Recent developments in the research of shape memory alloys. Intermetallics 1999, 7, 511–528. [Google Scholar] [CrossRef]
  11. Tang, W.; Sandström, R.; Wei, Z.; Miyazaki, S. Experimental investigation and thermodynamic calculation of the Ti–Ni–Cu shape memory alloys. Metall. Mater. Trans. A 2000, 31, 2423–2430. [Google Scholar] [CrossRef]
  12. Tadaki, T.; Wayman, C. Electron microscopy studies of martensitic transformations in Ti50Ni50−xCux alloys. Part I. Compositional dependence of one-third reflections from the matrix phase. Metallography 1982, 15, 233–245. [Google Scholar] [CrossRef]
  13. Strnadel, B.; Ohashi, S.; Ohtsuka, H.; Ishihara, T.; Miyazaki, S. Cyclic stress-strain characteristics of TiNi and TiNiCu shape memory alloys. Mater. Sci. Eng. A 1995, 202, 148–156. [Google Scholar] [CrossRef]
  14. Strnadel, B.; Ohashi, S.; Ohtsuka, H.; Miyazaki, S.; Ishihara, T. Effect of mechanical cycling on the pseudoelasticity characteristics of TiNi and TiNiCu alloys. Mater. Sci. Eng. A 1995, 203, 187–196. [Google Scholar] [CrossRef]
  15. Miyazaki, S.; Mizukoshi, K.; Ueki, T.; Sakuma, T.; Liu, Y. Fatigue life of Ti–50 at. % Ni and Ti–40Ni–10Cu (at. %) shape memory alloy wires. Mater. Sci. Eng. A 1999, 273, 658–663. [Google Scholar] [CrossRef]
  16. Grossmann, C.; Frenzel, J.; Sampath, V.; Depka, T.; Oppenkowski, A.; Somsen, C.; Neuking, K.; Theisen, W.; Eggeler, G. Processing and property assessment of NiTi and NiTiCu shape memory actuator springs. Mater. Werkst. 2008, 39, 499–510. [Google Scholar] [CrossRef]
  17. Nam, T.H.; Saburi, T.; Kawamura, Y.; Shimizu, K.I. Shape Memory Characteristics Associated With the B2→B19 and B19→B19′ Transformations in a Ti–40Ni–10Cu (at. %) Alloy. Mater. Trans. JIM 1990, 31, 262–269. [Google Scholar] [CrossRef]
  18. Koch, W.; Holthausen, M.C. A Chemist’s Guide to Density Functional Theory; Wiley-Vch: Weinheim, Germany, 2001. [Google Scholar]
  19. Hohenberg, P.; Kohn, W. Inhomogeneous electron gas. Phys. Rev. 1964. [Google Scholar] [CrossRef]
  20. Kohn, W.; Sham, L.J. Self-consistent equations including exchange and correlation effects. Phys. Rev. 1965. [Google Scholar] [CrossRef]
  21. Huang, X.; Ackland, G.J.; Rabe, K.M. Crystal structures and shape-memory behaviour of NiTi. Nat. Mater. 2003, 2, 307–311. [Google Scholar] [CrossRef] [PubMed]
  22. Guda, V.; Strachan, K.A. Phase stability and transformations in NiTi from density functional theory calculations. Acta Mater. 2010, 58, 745–752. [Google Scholar] [CrossRef]
  23. Stott, A.C.; Abel, P.B.; DellaCorte, C.; Pepper, S.V.; Dixon, D.A. Computational Studies of the NiTi Alloy System: Bulk, Supercell, and Surface Calculations. MRS Proc. 2011, 1295, 15–20. [Google Scholar] [CrossRef]
  24. Stott, A.C.; Brauer, J.I.; Garg, A.; Pepper, S.V.; Abel, P.B.; DellaCorte, C.; Noebe, R.D.; Glennon, G.; Bylaska, E.; Dixon, D.A. Bonding and Microstructural Stability in Ni55Ti45 Studied by Experimental and Theoretical Methods. J. Phys. Chem. C 2010, 114, 19704–19713. [Google Scholar] [CrossRef]
  25. Gou, L.; Liu, Y.; Ng, T.Y. An investigation on the crystal structures of Ti50Ni50−xCux shape memory alloys based on density functional theory calculations. Intermetallics 2014, 53, 20–25. [Google Scholar] [CrossRef]
  26. Perdew, J.P.; Burke, K.; Ernzerhof, M. Generalized gradient approximation made simple. Phys. Rev. Lett. 1996, 77, 3865–3868. [Google Scholar] [CrossRef] [PubMed]
  27. Payne, M.C.; Teter, M.P.; Allan, D.C.; Arias, T.; Joannopoulos, J. Iterative minimization techniques for ab initio total-energy calculations: Molecular dynamics and conjugate gradients. Rev. Mod. Phys. 1992, 64, 1045–1097. [Google Scholar] [CrossRef]
  28. Clark, S.J.; Segall, M.D.; Pickard, C.J.; Hasnip, P.J.; Probert, M.I.J.; Refson, K.; Payne, M.C. First principles methods using CASTEP. Z. Kristallogr. 2005, 220, 567–570. [Google Scholar]
  29. Nam, T.H.; Saburi, T.; Nakata, Y.; Shimizu, K. Shape memory characteristics and lattice deformation in Ti–Ni–Cu alloys. Mater. Trans. JIM 1990, 31, 1050–1056. [Google Scholar] [CrossRef]
  30. Bricknell, R.; Melton, K.; Mercier, O. The structure of NiTiCu shape memory alloys. Metall. Mater. Trans. A 1979, 10, 693–697. [Google Scholar] [CrossRef]
  31. Rösner, H.; Schloßmacher, P.; Shelyakov, A.; Glezer, A. The influence of coherent ticu plate-like precipitates on the thermoelastic martensitic transformation in melt-spun Ti50Ni25Cu25 shape memory alloys. Acta Mater. 2001, 49, 1541–1548. [Google Scholar] [CrossRef]
  32. Xie, Z.; Cheng, G.; Liu, Y. Microstructure and texture development in Ti50Ni25Cu25 melt-spun ribbon. Acta Mater. 2007, 55, 361–369. [Google Scholar] [CrossRef]
  33. Tong, Y.; Liu, Y.; Xie, Z.; Zarinejad, M. Effect of precipitation on the shape memory effect of Ti50Ni25Cu25 melt-spun ribbon. Acta Mater. 2008, 56, 1721–1732. [Google Scholar] [CrossRef]
  34. Liu, Y.; Xie, Z. Twinning and detwinning of <011> type II twin in shape memory alloy. Acta Mater. 2003, 51, 5529–5543. [Google Scholar] [CrossRef]
  35. Jhi, S.H.; Ihm, J.; Louie, S.G.; Cohen, M.L. Electronic mechanism of hardness enhancement in transition-metal carbonitrides. Nature 1999, 399, 132–134. [Google Scholar] [CrossRef]
  36. Zarinejad, M.; Liu, Y.; White, T.J. The crystal chemistry of martensite in NiTiHf shape memory alloys. Intermetallics 2008, 16, 876–883. [Google Scholar] [CrossRef]

