
Guideline for Forming Stiffened Panels by Using the Electromagnetic Forces

State Key Laboratory of Solidification Processing, School of Materials Science & Engineering, Northwestern Polytechnical University, Xi’an 710072, China
*
Author to whom correspondence should be addressed.
Metals 2016, 6(11), 267; https://doi.org/10.3390/met6110267
Submission received: 9 July 2016
/
Revised: 7 October 2016
/
Accepted: 28 October 2016
/
Published: 7 November 2016
(This article belongs to the Special Issue Aluminum Alloys)
Abstract
:Electromagnetic forming (EMF), as a high-speed forming technology by applying the electromagnetic forces to manufacture sheet or tube metal parts, has many potential advantages, such as contact-free and resistance to buckling and springback. In this study, EMF is applied to form several panels with stiffened ribs. The distributions and variations of the electromagnetic force, the velocity and the forming height during the EMF process of the bi-directional panel with gird ribs are obtained by numerical simulations, and are analyzed via the comparison to those with the flat panel (non-stiffened) and two uni-directional panels (only with X-direction or Y-direction ribs). It is found that the electromagnetic body force loads simultaneously in the ribs and the webs, and the deformation of the panels is mainly driven by the force in the ribs. The distribution of force in the grid-rib panel can be found as the superposition of the two uni-directional stiffened panels. The velocity distribution for the grid-rib panel is primarily affected by the X-directional ribs, then the Y-directional ribs, and the variation of the velocity are influenced by the force distribution primarily and secondly the inertial effect. Mutual influence of deformation exists between the region undergoing deformation and the deformed or underformed free ends. It is useful to improve forming uniformity via a second discharge at the same position. Comparison between EMF and the brake forming with a stiffened panel shows that the former has more advantages in reducing the defects of springback and buckling.
1. Introduction
The development of the modern fuselage structure in aerospace industry makes it necessary to pursue possible methods to form the parts with a desired contour. The stiffened panels (integrally stiffened structure) have become one of the important parts of modern aircrafts, benefiting from their high strength, high structural efficiency and low weight. The stiffened panels forming technology, is therefore one of the key technologies in aerospace industry. However, the improved structural stiffness of the stiffened panels, due to the stiffened ribs, increases the forming difficulty.
The traditional forming processes for the stiffened panels (panels after machining the ribs with desired arrangement form from plate) include creep age forming, shot peen forming, roll forming, brake forming, etc. [1]. Creep age forming (CAF), which appeared in the 1980s, is accomplished by combining creep forming and age hardening simultaneously. This process is widely applied in aircraft manufacture [2]. Eberl et al. verified the feasibility of CAF in forming the commercial aircraft stiffened plates via practical experiments [3]. One of the key problems during CAF is the springback because the plastic strain level is very low and the elastic strain maintains a high level after forming [4]. The comparison of springback with different plates, including flat, beam stiffened, waffle and isogrid plates, was studied through experiment and numerical simulation, which showed that the springback of the four plates ranged from 12.2% to 15.7% [5]. Unavoidable and unpredictable springback, even about 70% [6], which makes it difficult for the accurate design of the forming tools to compensate for the elastic strain. For the shot peen forming, the advantages lies in no die use and fatigue property improvement because of the existence of the residual compressive stress in the formed surface of the parts, which make the shot peen forming one of the preferred forming methods [7]. However, the surface roughness after shot peen forming is poor and thus subsequent correction is necessary for the panels with complicated structure [8]. Meanwhile, due to the limited forming ability, it is unsuitable or difficult to form the stiffened panels with a complex contour or curvature, as well as high stiffened ribs panels, with shot peen forming [9]. Roll forming, also being called roll bending based on the continuous local plastic deformation, is a method with low cost tools and low time consuming, thus can be adaptable to different contours. However, there are certain limits in the forming of the stiffened panels, due to the occurrence of mark-off, support material needed in the pockets of the panels sometimes and simple contour only [10]. The basic principle of the brake forming (e.g., air bending) is three point bending. The workpiece undergoes discontinuous local plastic deformation under the press of a punch. As a traditional forming method, brake forming is widely used in the formation of aircraft stiffened panels owing to several advantages, such as the low tool cost, strong applicability to various part shapes and compound stiffened styles. For example, Yan et al. utilized the incremental-press bending method to form a stiffened panel with grid ribs successfully after designing suitable forming path with the help of a back-propagation neural network response surface method [11]. However, because the forces apply directly on the ribs by the punch and then the deformation of the web is driven by the ribs, the defects, such as springback and fracture, are the main disadvantages with this technology. Studies on the defects during the brake forming process can be found with respect to buckling [12] and springback [13]. In a word, all these forming limitations and forming equality issues lying in the traditional process for forming the stiffened panels make the exploration of innovative forming approaches urgent to meet the developing requirements in aircraft industry.
Electromagnetic forming (EMF) is a high-speed forming process that utilizes the electromagnetic forces, produced under the effects of the eddy current induced by the coil magnetic field and the magnetic fields stemming from the coil and the eddy current itself, to manufacture parts. According to Daehn [14], the advantages of this process can be deemed as reduction of die fabricate cost and production cycle, the improvement of the materials mechanical properties and the decrease of springback and residual stress. In addition, because of the induced eddy currents flowing through the entire panel, the web of the stiffened panel is also affected by the electromagnetic field, that is, there are electromagnetic body forces loading in the ribs and the web at the same time. Different from the traditional stiffened panel forming methods where the forces load on the surface of the web or the ribs only, EMF produces the body force on the part, which with will be useful to increase the forming ability. These unique advantages make EMF become a potential method for forming the aircraft stiffened panels of aluminum alloys, which are with good electrical conductivity. However, most of researches on EMF, according to Psyk et al. [15], focus on relatively smaller and simpler parts (non-stiffened) that can be formed through one to several discharges with a coil which is usually fixed at a given location. The fixed coil makes it difficult to apply EMF directly to form large-scale components, such as the aircraft stiffened panels.
An electromagnetic incremental forming (EMIF) technology was developed by Cui et al. [16], and EMIF was validated to be effective to solve the difficulty in the large-scale component forming. In the EMIF process, a small coil is utilized, which moves along some certain 2D/3D paths with accompanying discharging for many times, to produce the large-scale and complicated-shape parts. By comparing with the traditional EMF process, some new parameters, such as coil overlap rate, discharge pass etc., are introduced with EMIF. Kamal and Daehn [17] reported the large clearance between the coil and the workpiece can reduce the efficiency of EM induction, and the multi-discharge cannot increase the forming depth significantly while can improve the quality of the workpiece. Zhao et al. [18] simulated the EMIF process of tubes, and analyzed the influence of coil path and coil overlap rate on the forming results. Their results showed the forming uniformity increased with higher overlap rate. Cui et al. [19] produced a circular plate successfully by using a six-turn coil with the discharging energy no more than 6 kJ, and contrastively studied the effect of several discharging paths and discharging parameters to verify the feasibility of the EMIF.
Because the EMF process is a complicated process involving the coupled effects of magnetic field and deformation field, the finite element method (FEM) becomes an effective tool for the processing study. In a typical EMF simulation, the control of the air distortion is one of the key technologies because the deformation of the workpiece will conversely lead to severe deformation of the air, resulting in the distortion of the air elements. Through a 2D FE simulation for electromagnetic sheet forming process, Fenton and Daehn [20] claimed that the introduction of the Arbitrary Lagrange Euler (ALE) method can effectively control the air distortion and then a more accurate result was obtained. Ma et al. [21] utilized the ALE method to simulate EMF process of a flat panel (non-stiffened), where the distortion of the air mesh was controlled availably. In the simulation of sheet process with EMIF, Cui et al. [19] used the morphing and remeshing technology to describe the air movement caused by the workpiece deformation, and pointed that the remeshing method is more suitable than the morphing method for the overlap region simulation during the EMIF. In addition, the coupling strategy adopted is another key technology. Generally, multi-physics problems can be solved by two methods: direct coupling and indirect coupling. The direct coupling method reflects the most accurate physical mechanism, however, the calculation efficiency of this method is low. Thus, it is practical to adopt the latter coupling method. Oliveira and Worswick [22] proposed a “loose” coupling strategy to simulate a 3D free-bulging of aluminum alloy sheet, and their FE model is verified by comparing the final geometry and strain distributions of the workpiece between the simulated and experimental results. Yu et al. [23] mentioned a sequential coupling method considering the mesh morphing technology to simulate the EMF process with tubes. Their results supported the sequential model with higher accuracy than the results by using loose coupling method. Employing the sequential coupling method to realize the iterative coupling between magnetic field and structural field, Cui et al. [24] analyzed electromagnetic sheet bulging process and obtained the change regulation of the magnetic forces.
For the stiffened panels, the existence and deformation of the ribs increase the forming difficulty. Additionally, the distribution of the ribs will make the panel forming process significantly different from the traditional sheet EMF process, which can be attributed to the distinct distribution of the magnetic forces. Therefore, it is necessary to investigate the EMF process of the stiffened panel. In this study, the contents on materials study, experimental methods and numerical simulation preparations are presented in Section 2. The FE model established for the stiffened panels during the EMIF process is given in Section 3. Finally, the distribution of electromagnetic force, the evolvement rule of velocity and height of the stiffened panels with different rib arrangements, as well as the comparison of forming quality of the stiffened panels obtained by the brake forming and EMIF are discussed in Section 4. Conclusions are presented in Section 5.
2. Material and Methods
2.1. Material and Blank
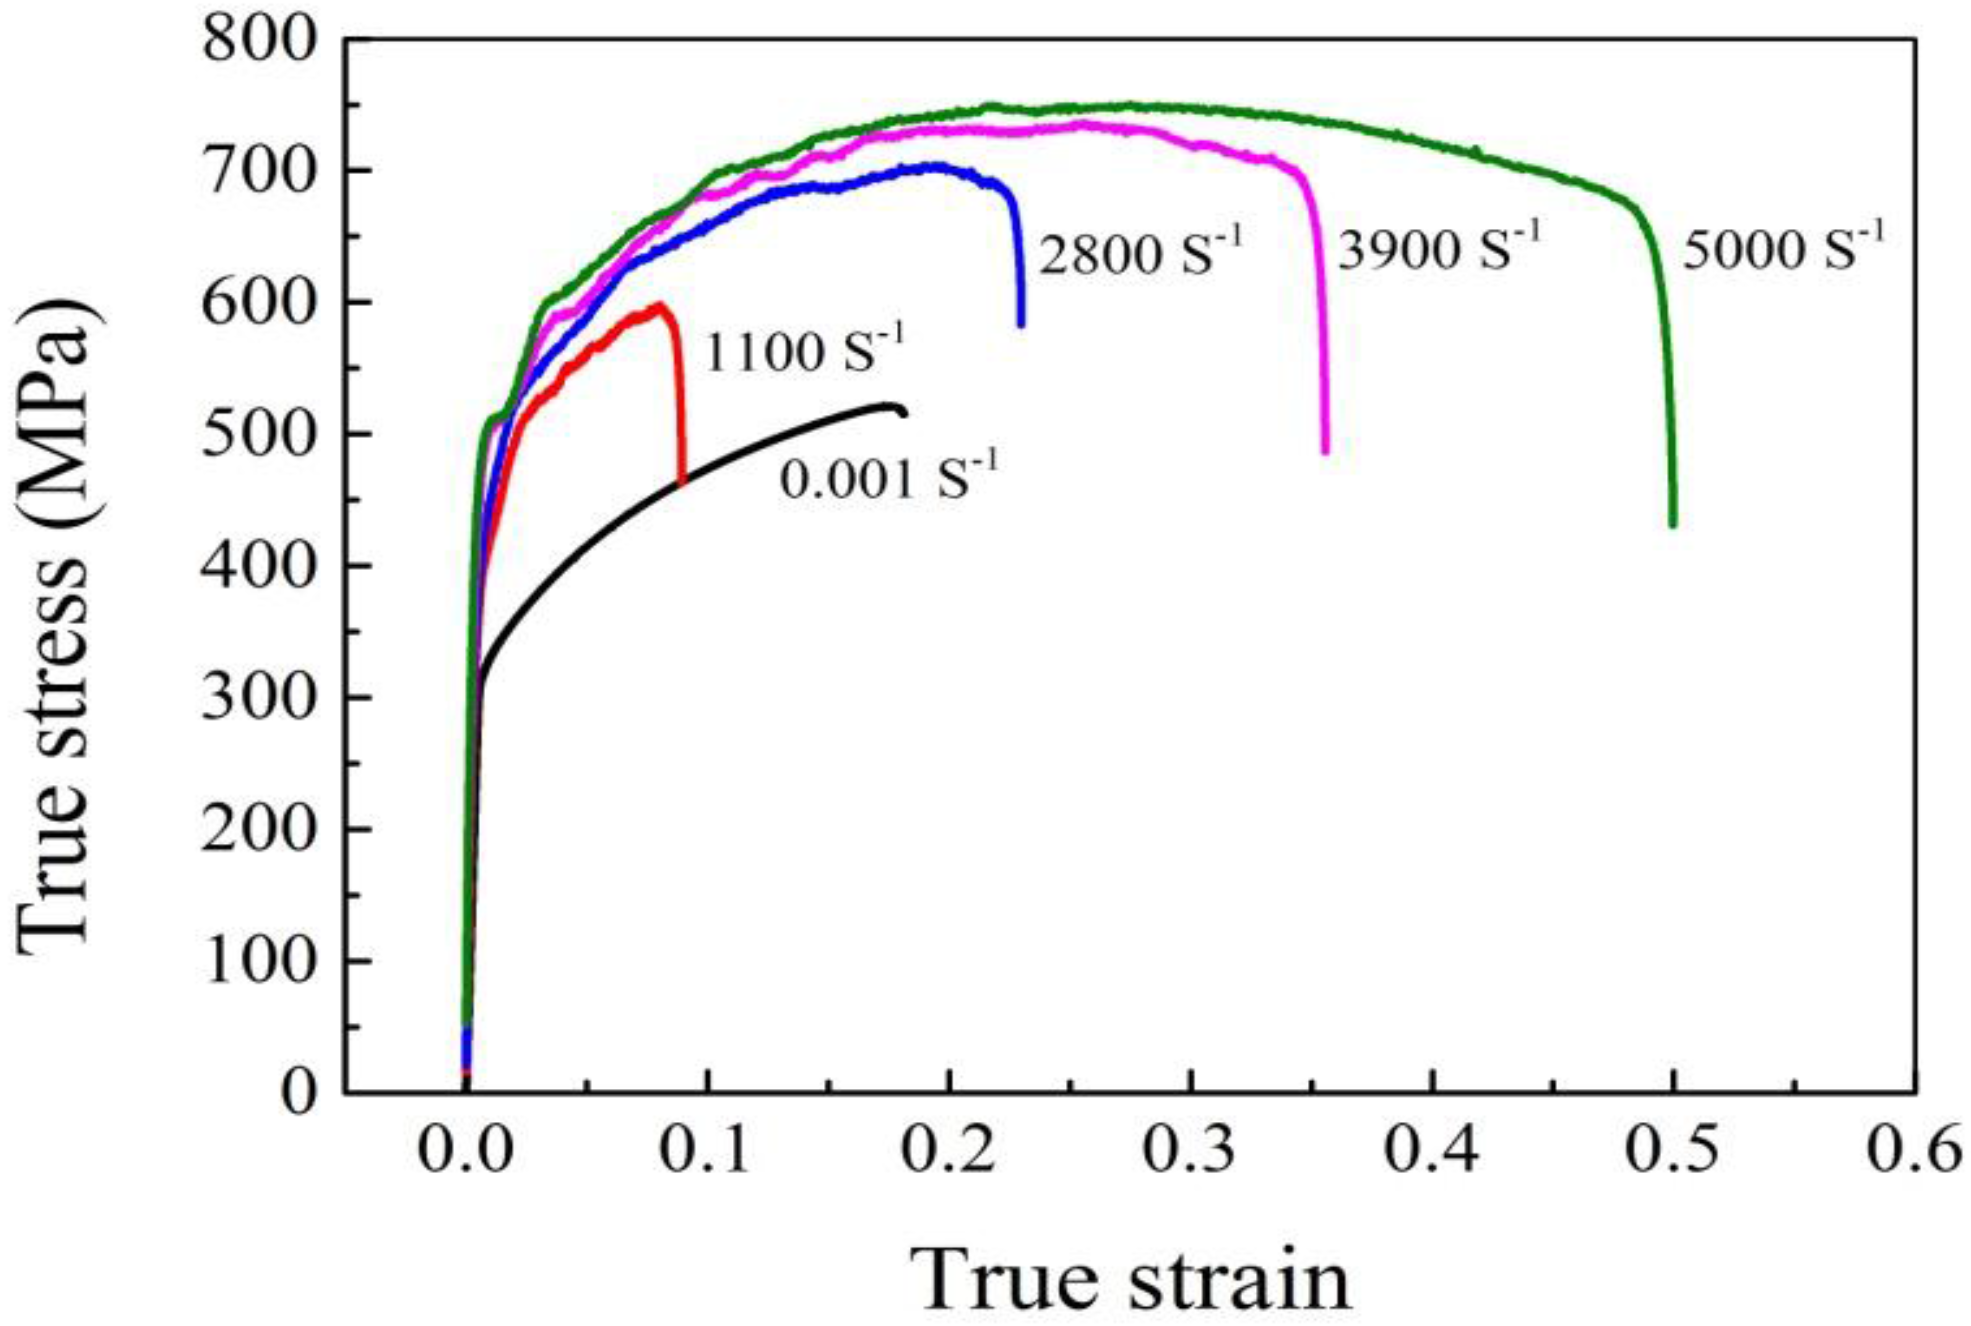
The 2A12-T4 aluminum alloy is used in this study [25]. With EMF, the strain rate effect must be considered [26], and so the stress–strain data at various strain rates via quasi-static tests and Hopkinson bar tests are provided here. The quasi-static experiments were measured by SANS® CMT5205 (Shenzhen, China) electronic universal testing machine at room temperature under a fixed strain rate of 10−3 s−1. The specimens used were standard tablet specimen referring to ISO 6892-1:2009 [27] with a gauge length of 50 mm. The dynamic experiments, in which the cylindrical specimens with the sizes of Φ5 mm × 5 mm were used, were conducted and measured by a self-designed split Hopkinson pressure bar (SHPB) machine at room temperature under different strain rates of 1100 s−1, 2800 s−1, 3900 s−1 and 5000 s−1, respectively. The original material was a rolled sheet, and all the test specimens were machined to have the coincident axis with the rolling direction. All the test experiments were conducted repeatedly at least three times under each condition, especially for the dynamic experiments, to ensure repeatable and consistent. The results of the quasi-static and dynamic tests are shown in Figure 1. Remarkable strain rate sensibility can be found for the alloy, and the larger strain rate leads to the higher yield stress and strength limit while stress softening at a large strain.
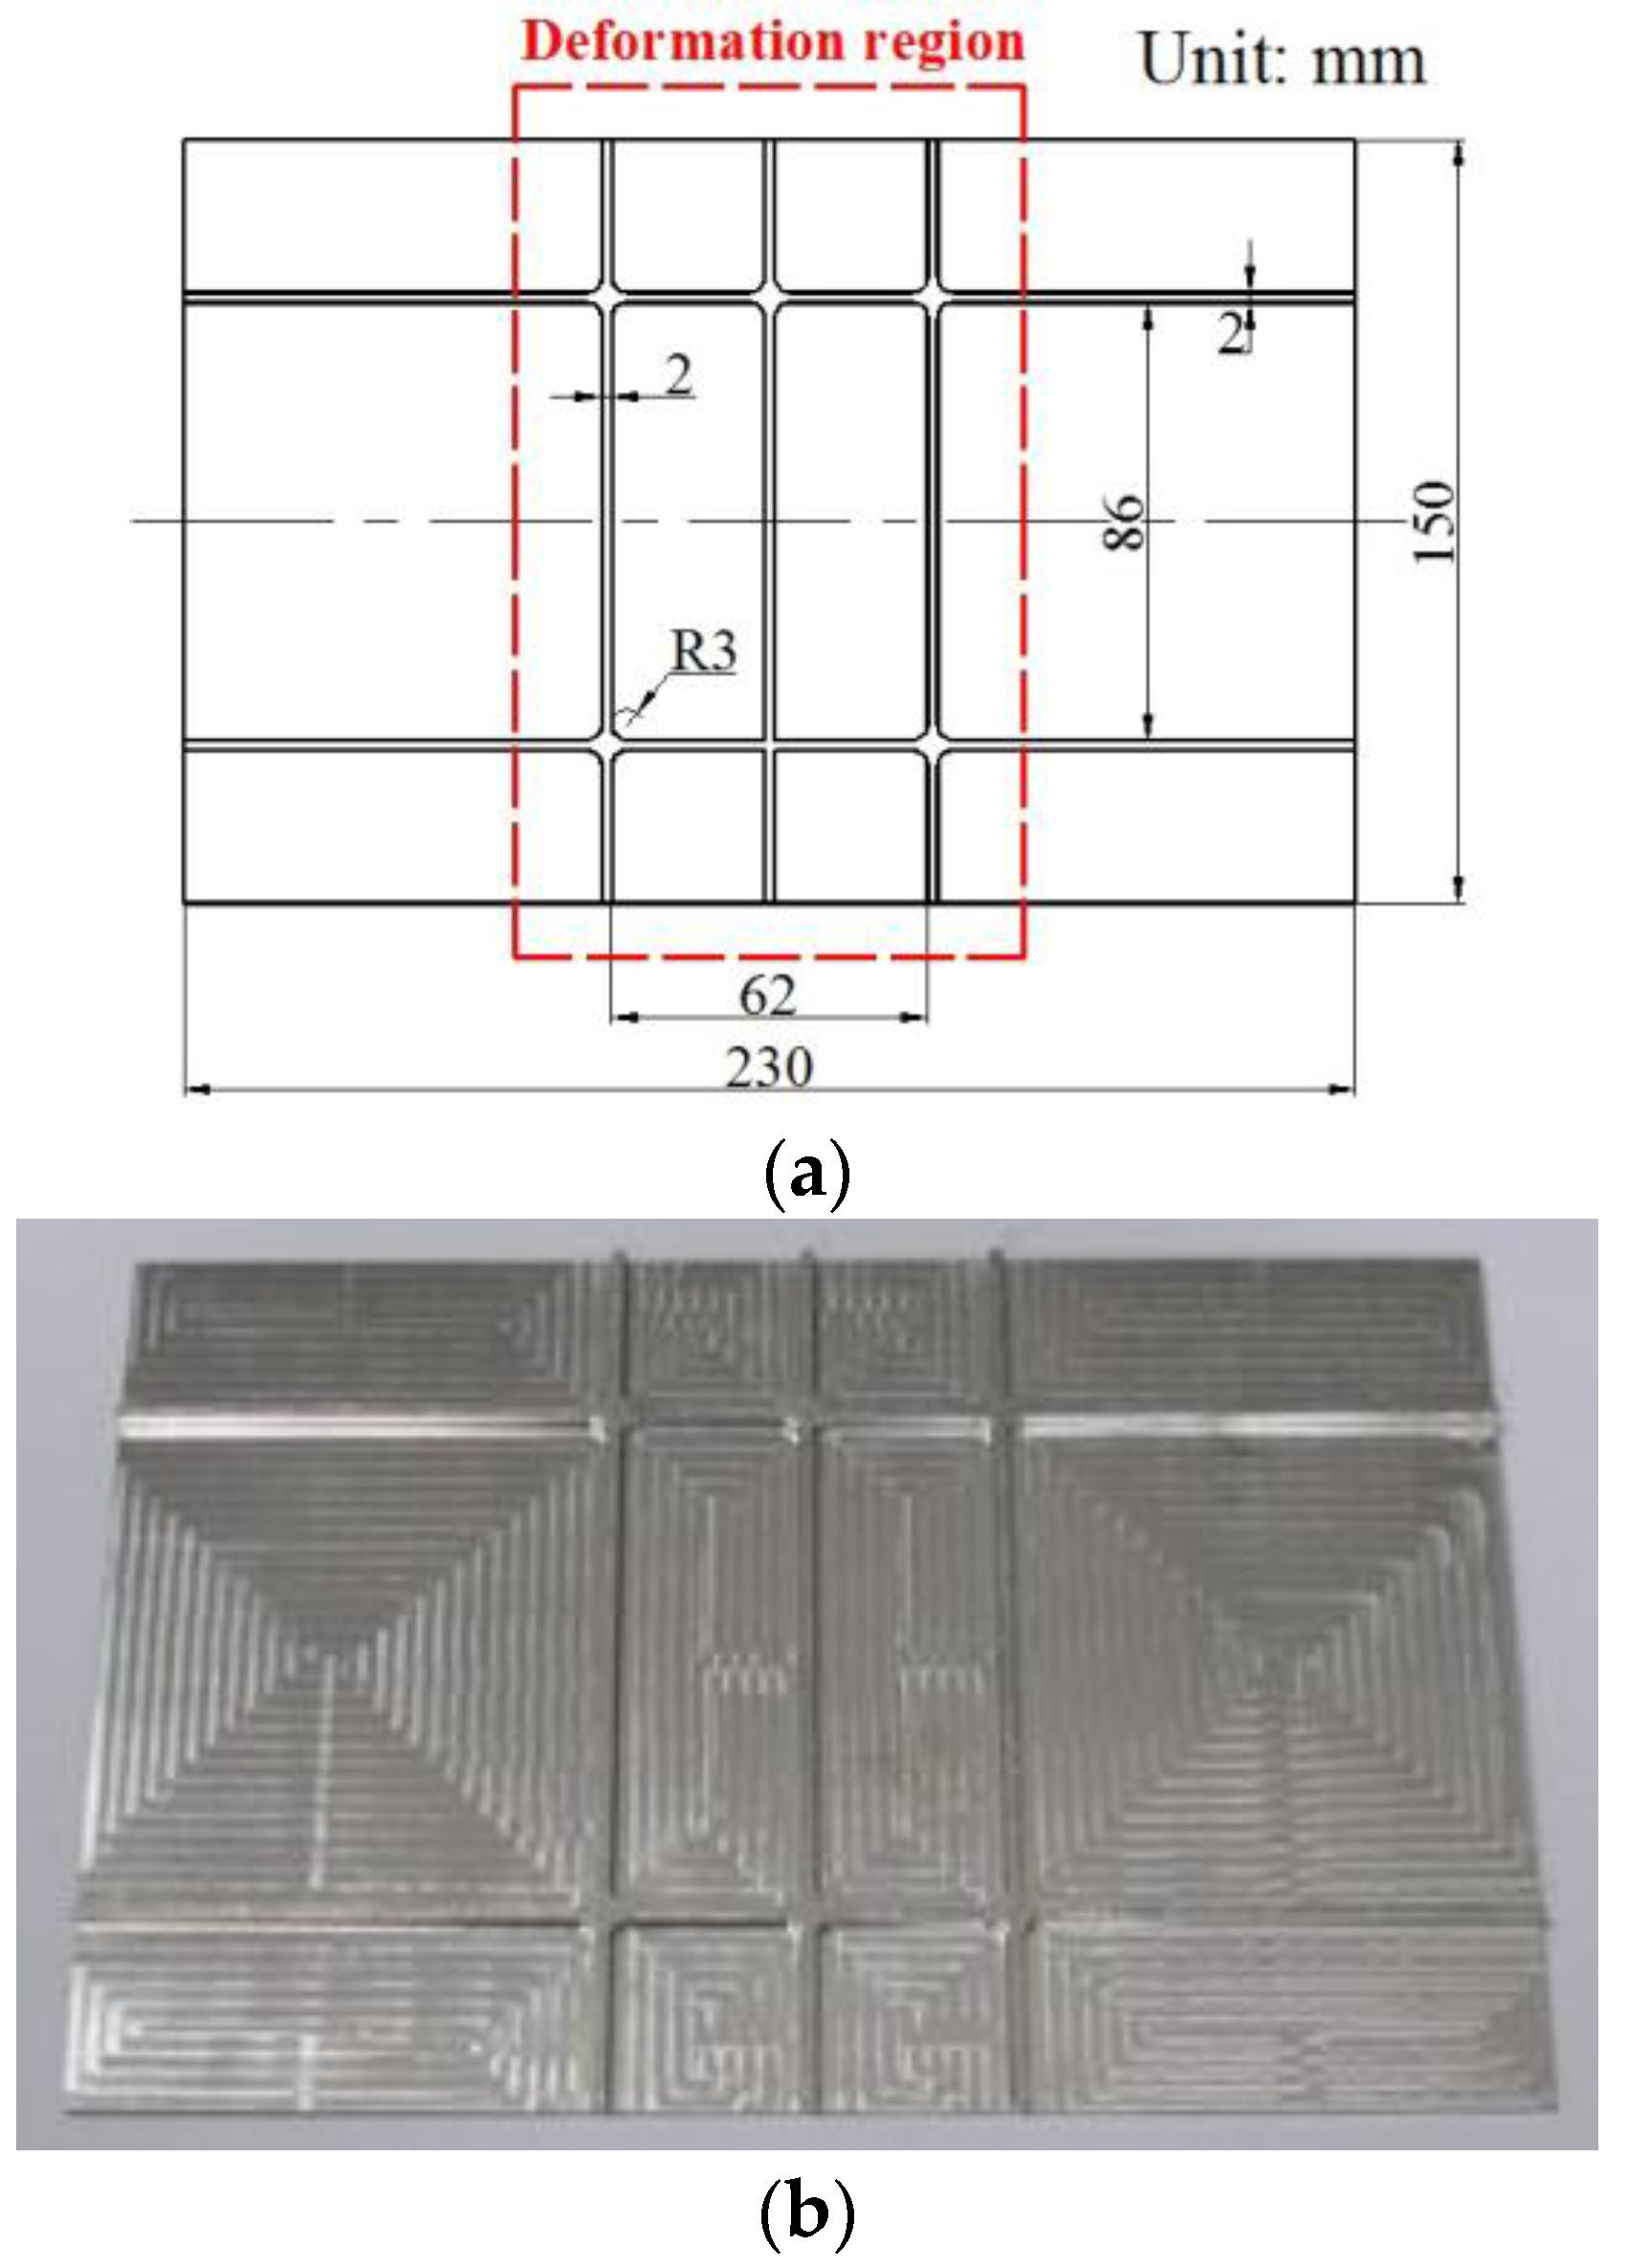
The stiffened panel is usual composed of a web and several ribs. In this study, a grid-rib panel blank is adopted, as shown in Figure 2. The size of the main deformation region is 150 mm × 100 mm. The height of the web is 2 mm and the heights of all the ribs are 4 mm. In comparison, three decomposition panels from the grid-rib panel (GP), that is, panel with transversal ribs only (called X-rib panel, XP), panel with longitudinal ribs only (Y-rib panel, YP) and panel without any ribs (flat panel, FP) are studied, where the sizes of these three panels are consistent with the grid-rib panel.
2.2. Forming Set-Up
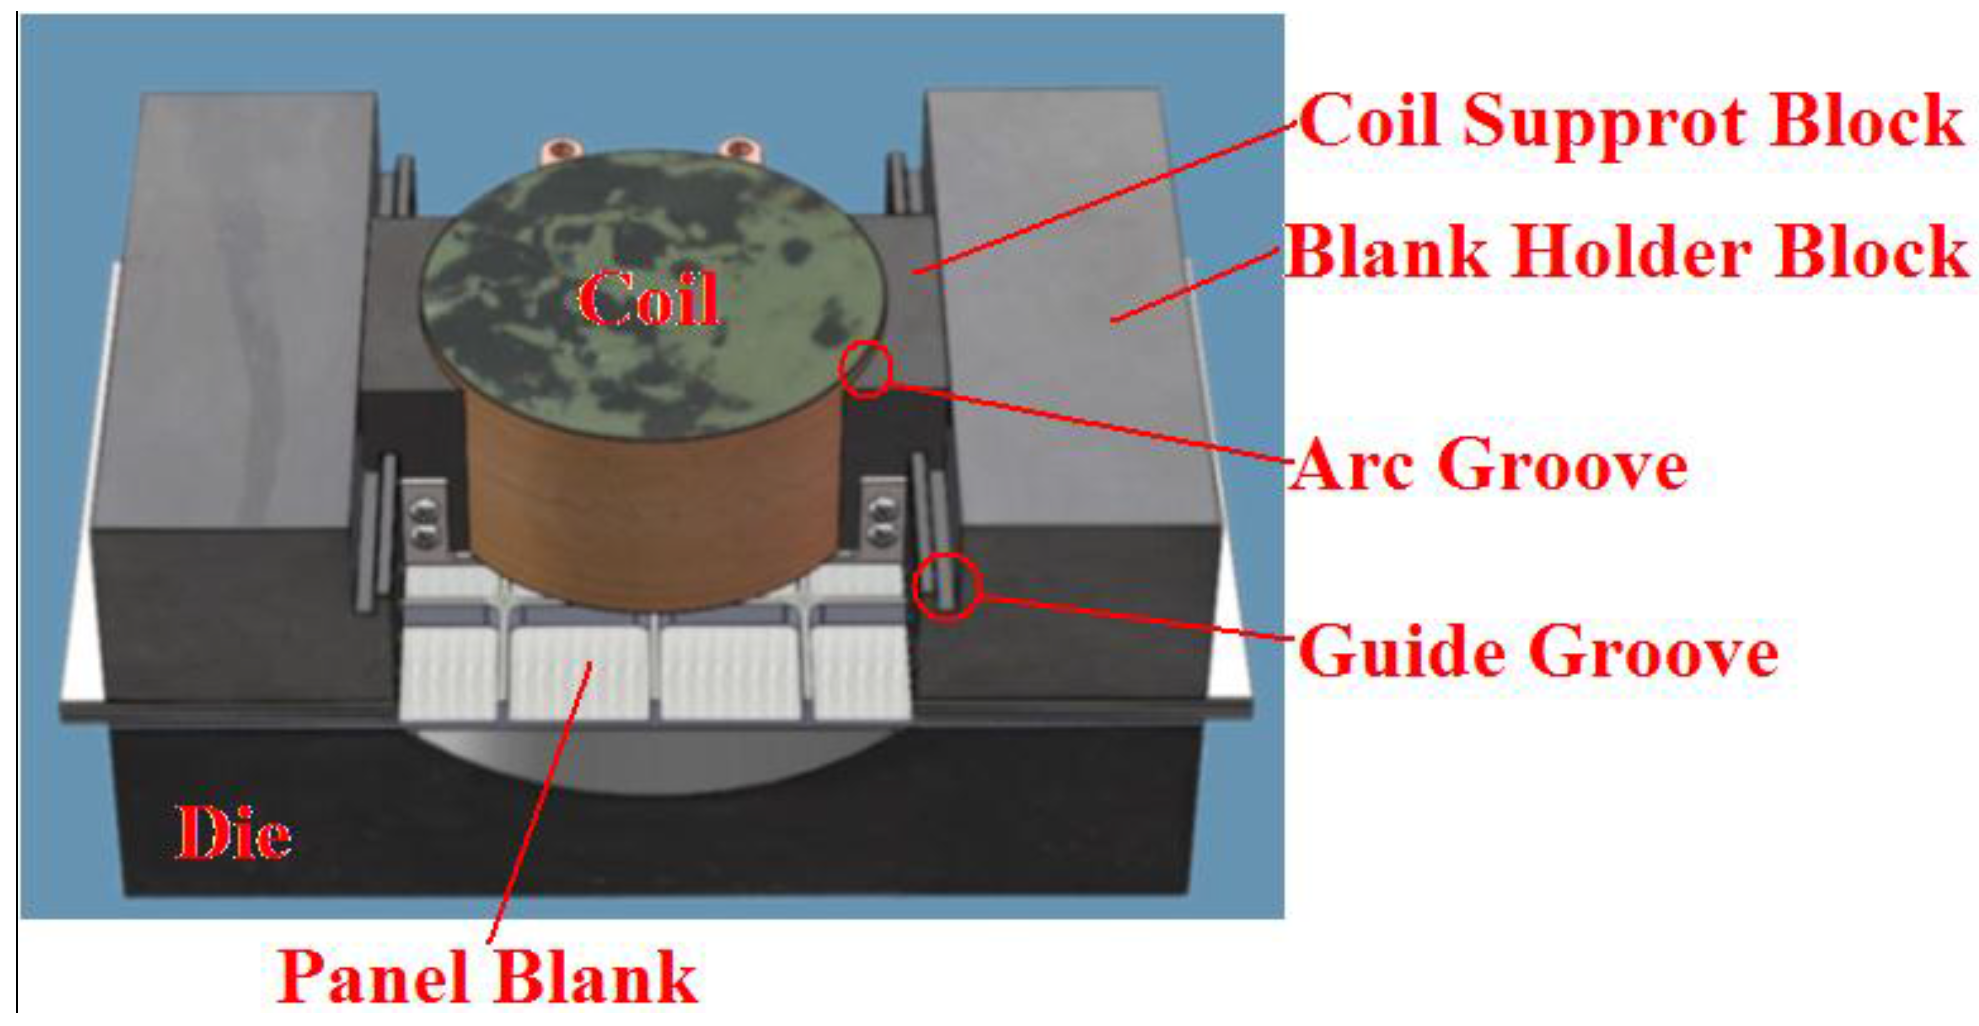
The experimental set-up is shown in Figure 3, which includes two blank holder blocks with guide grooves and two coil support blocks with arc grooves and guide grooves simultaneously, which are connected by bolts. The incremental distances were accurately and manually controlled using a Vernier caliper. The initial gap between the bottom surface of the copper wire and the top surface of the ribs of the panel blank was 5 mm.
2.2.1. Die
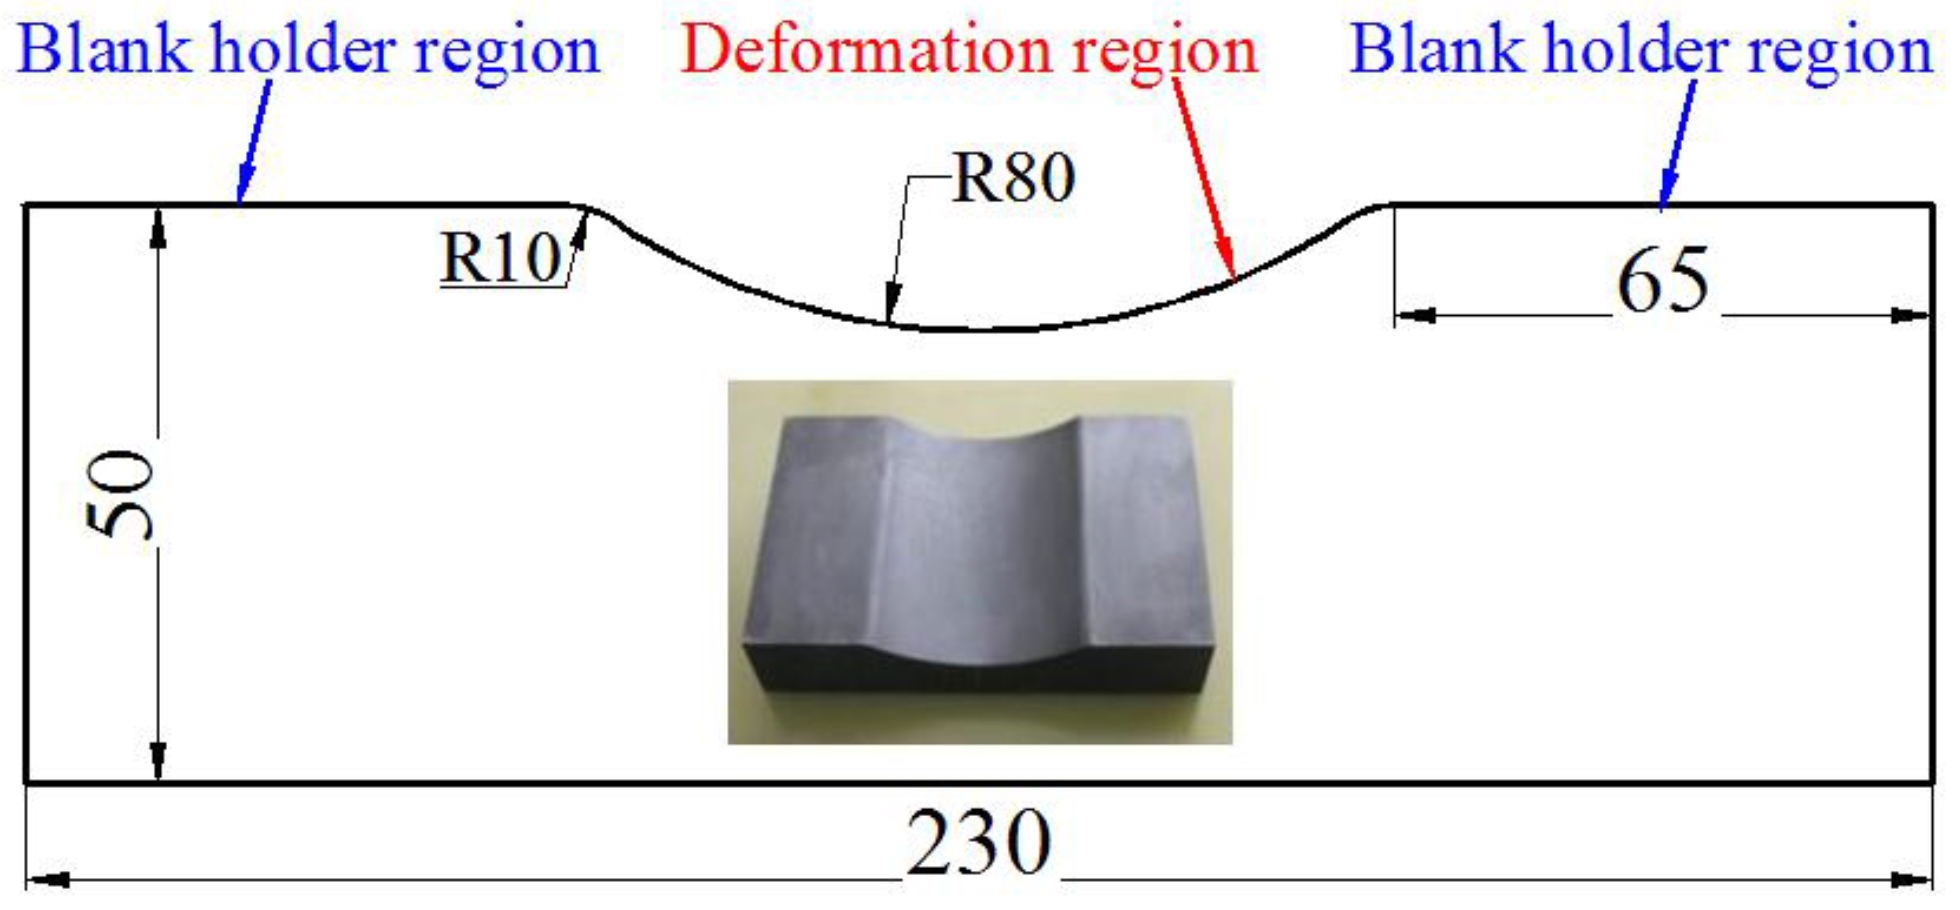
The single curvature die, 230 mm × 150 mm × 50 mm in length, width and height, respectively, is used, as shown in Figure 4. The curvature radius is 80 mm and the transition fillet radius is 10 mm.
2.2.2. Coil
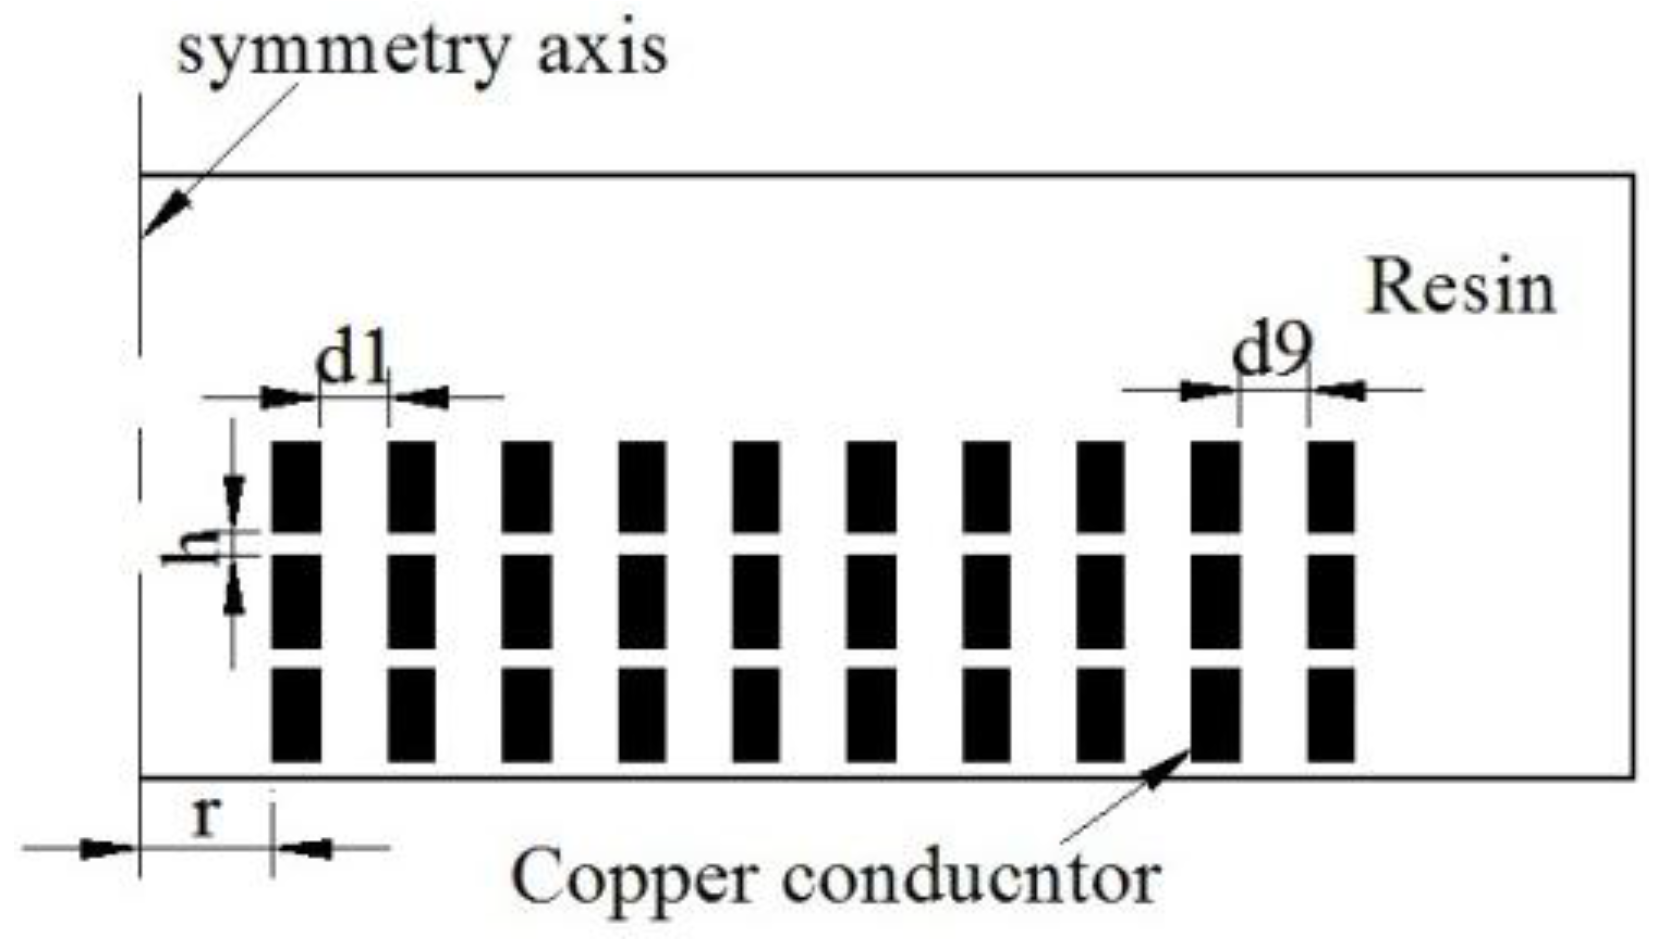
A flat circular spiral coil is selected in this study due to its reliable performance and large load endurance capacity and the simplified form is shown in Figure 5. The distance between two adjacent turns of the coil is designed as a gradual decrease from the inside to the outside (Table 1), which makes more epoxy resin in the coil to improve the support force.
2.3. Forming Stations and Coil Paths
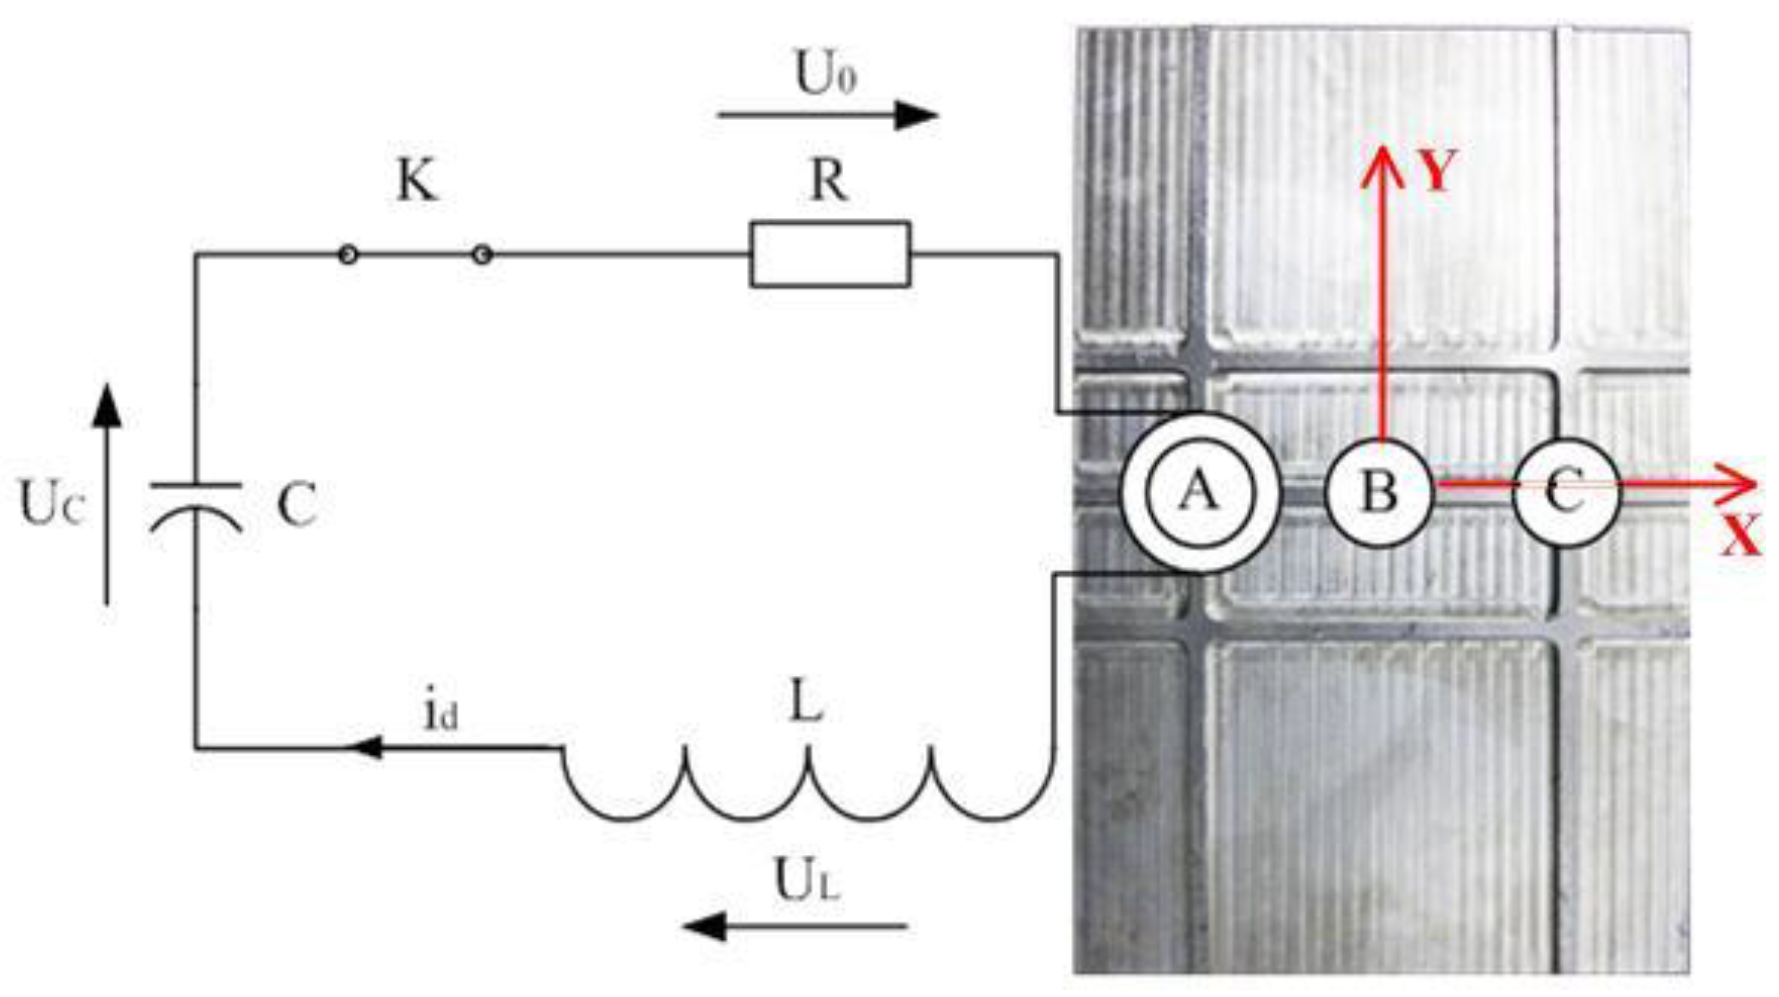
For the sake of describing forming stations (coil position) and paths, a Cartesian coordinate system is constructed, which is oriented from the center of the panel blank, as shown in Figure 6, and the forming stations are designed along the X axis, where station B is in the center of the panel, while station A and station C are symmetrical about station B. The distance between two forming stations is 40 mm. Two coil support blocks, which are installed on two arc grooves, are designed to move the coil accurately, as shown in Figure 3.
To analyze the forming rule of the stiffened panels in the EMIF process, the forming processes of four panels (Table 2), are studied using the established FE model. As seen from Table 2, the ratio of rib height to web thickness is relatively small, as a result, a capacitor with a capacity of 80 μF is adopted. As seen from Table 3, in the first station there are twice discharges with different voltages to study the forming rule under the same station and the multi-discharging conditions.
3. Numerical Simulation
3.1. Establishment of the FE Model
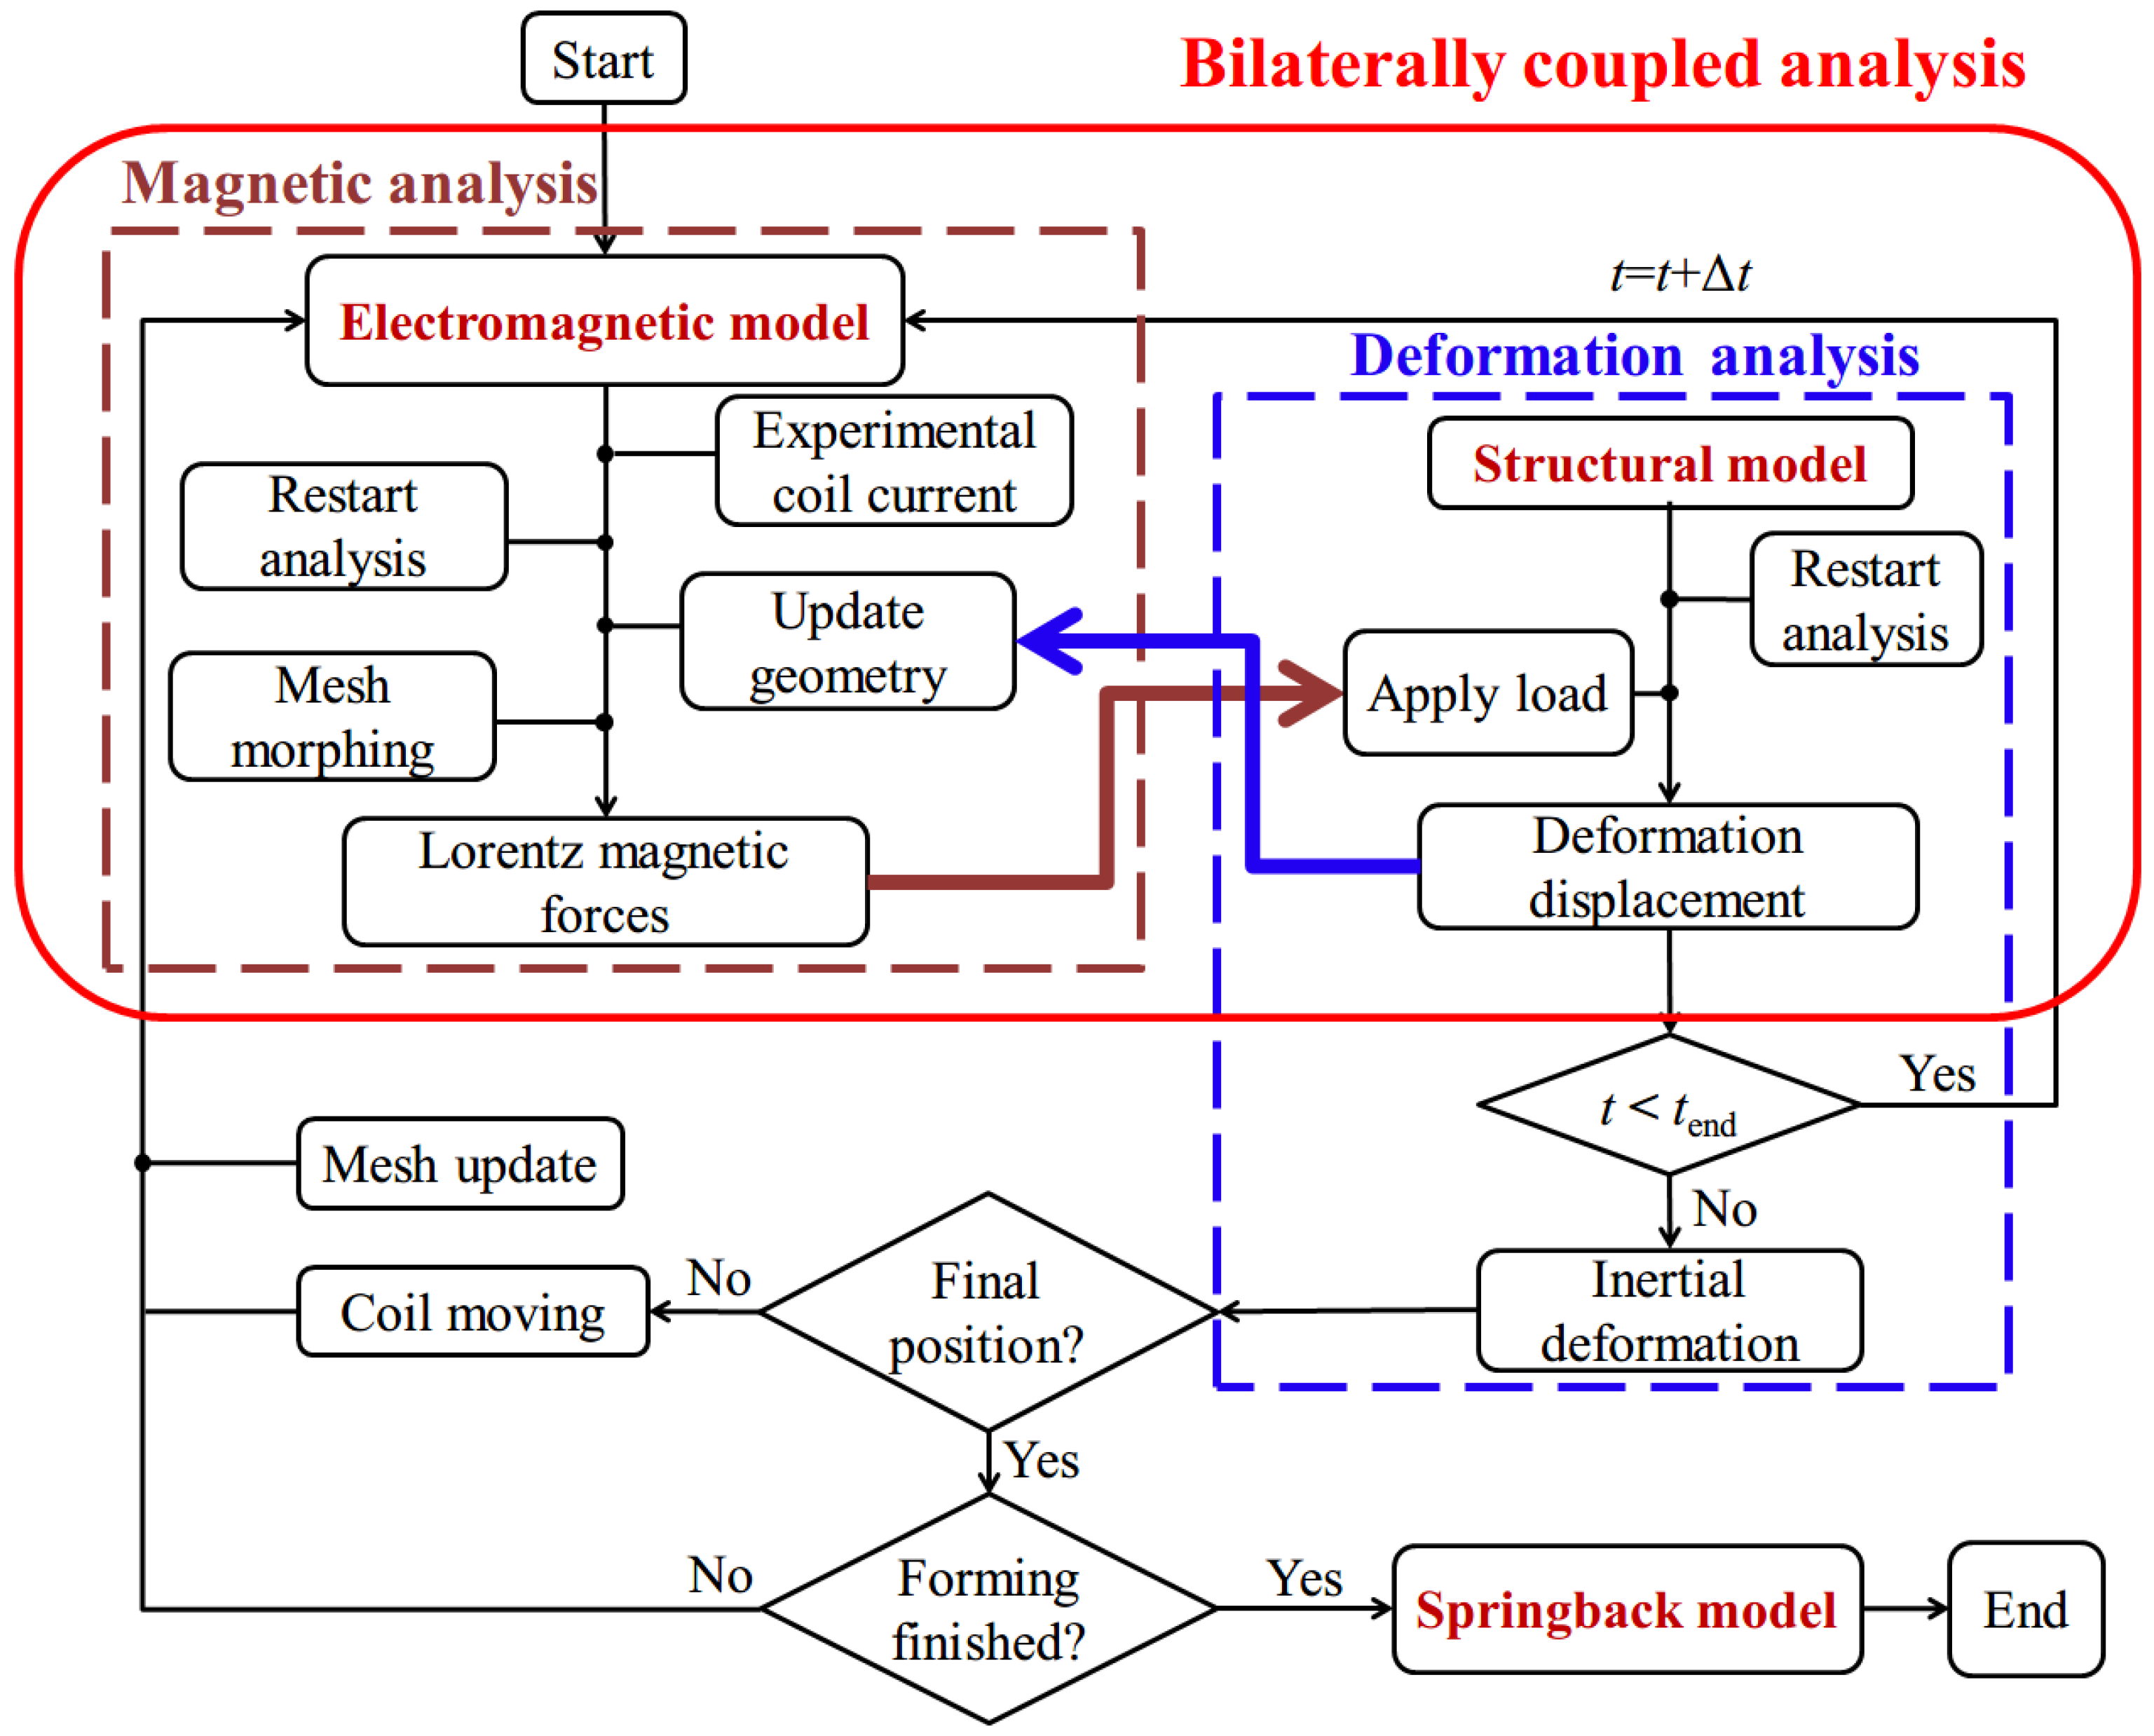
The EMIF process of the stiffened panels (EMIF-SP) is composed of four basic stages: generation of the induced eddy current and the magnetic field surround the workpiece, plastic formation, shift of the coil station and unloading springback. Mutual effects and multi-factors occur at every stage in the forming process. Therefore, it is necessary to build a whole-process model that includes these stages to accurately analyze the mechanisms and governing principles of EMIF-SP. By using the ANSYS V8.1 software (Pittsburgh, PA, USA), a bilaterally coupled model of EMIF-SP has been established in this study to analyze the EMIF process. In the model, an electromagnetic model, a structural model and a springback model are included. The detailed calculation flowchart is shown in Figure 7. The electromagnetic model is established to simulate the magnetic field existing surround the workpiece, which is resulted by the coil magnetic field when an impulse current flow through the coil. By dividing the coil current into n increments and then loading each increment into the electromagnetic model in a step-by-step manner, the electromagnetic force can be obtained. Then, by loading the electromagnetic force into the workpiece in the structural model, the plastic forming process of the stiffened panel can be simulated. When the deformation completes at every increment, the geometry of the workpiece and air must be updated in the electromagnetic model for the next-increment magnetic field calculation. This cycle is repeated until the total current loading is finished. The stiffened panel continues to deform under inertial effect until the velocity of each point reaches zero. For the next station discharge, the coil must be moved to the next forming station. The electromagnetic force calculation and deformation analysis are applied repeatedly on each new station using the same method until all forming stations have been loaded. Finally, the holder is removed, and the workpiece springback due to unloading can be simulated using the springback model.
The electromagnetic circuit model is based on the EMF system in Cao et al. [28], where an additional crowbar circuit is used to effectively reduce the temperature rise of the coil.
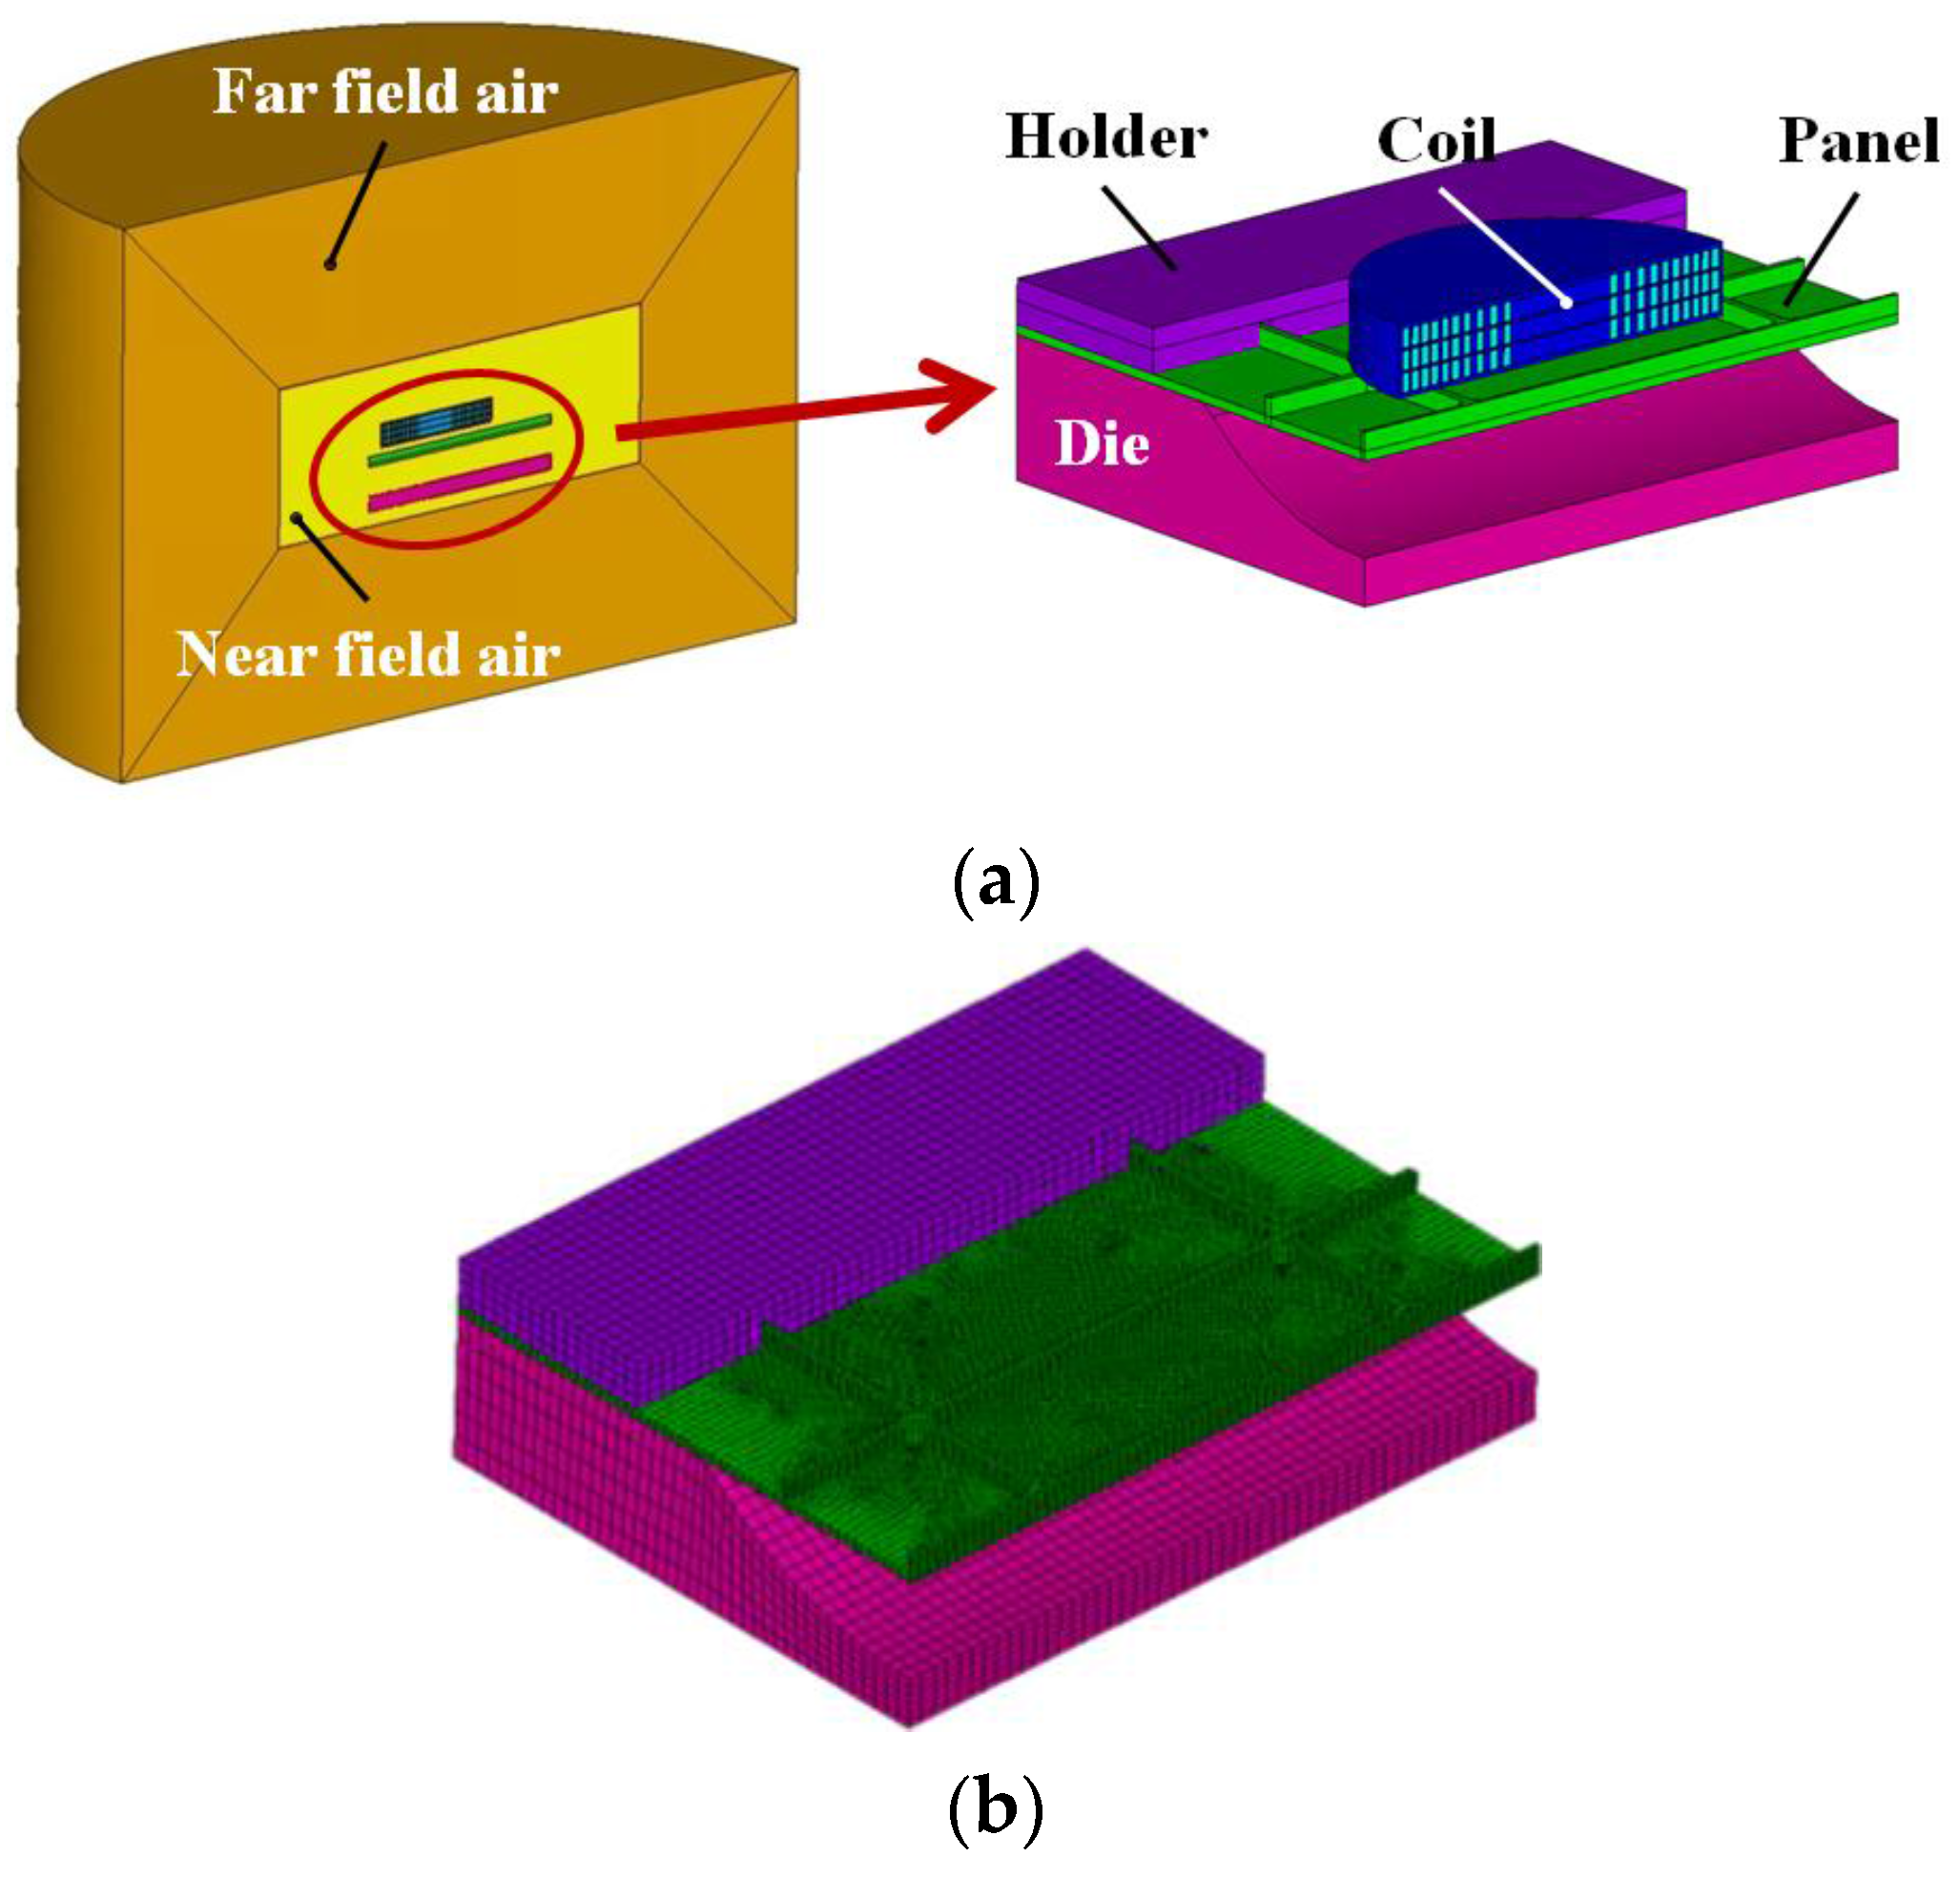
Considering the symmetry of deformation process and boundary conditions about X axis, a half multi-physics coupling FE model of the entire EMIF process for the stiffened panels is established according to the aforementioned four stages, shown as Figure 8.
The main system parameters during the EMIF-SP process are listed in Table 3.
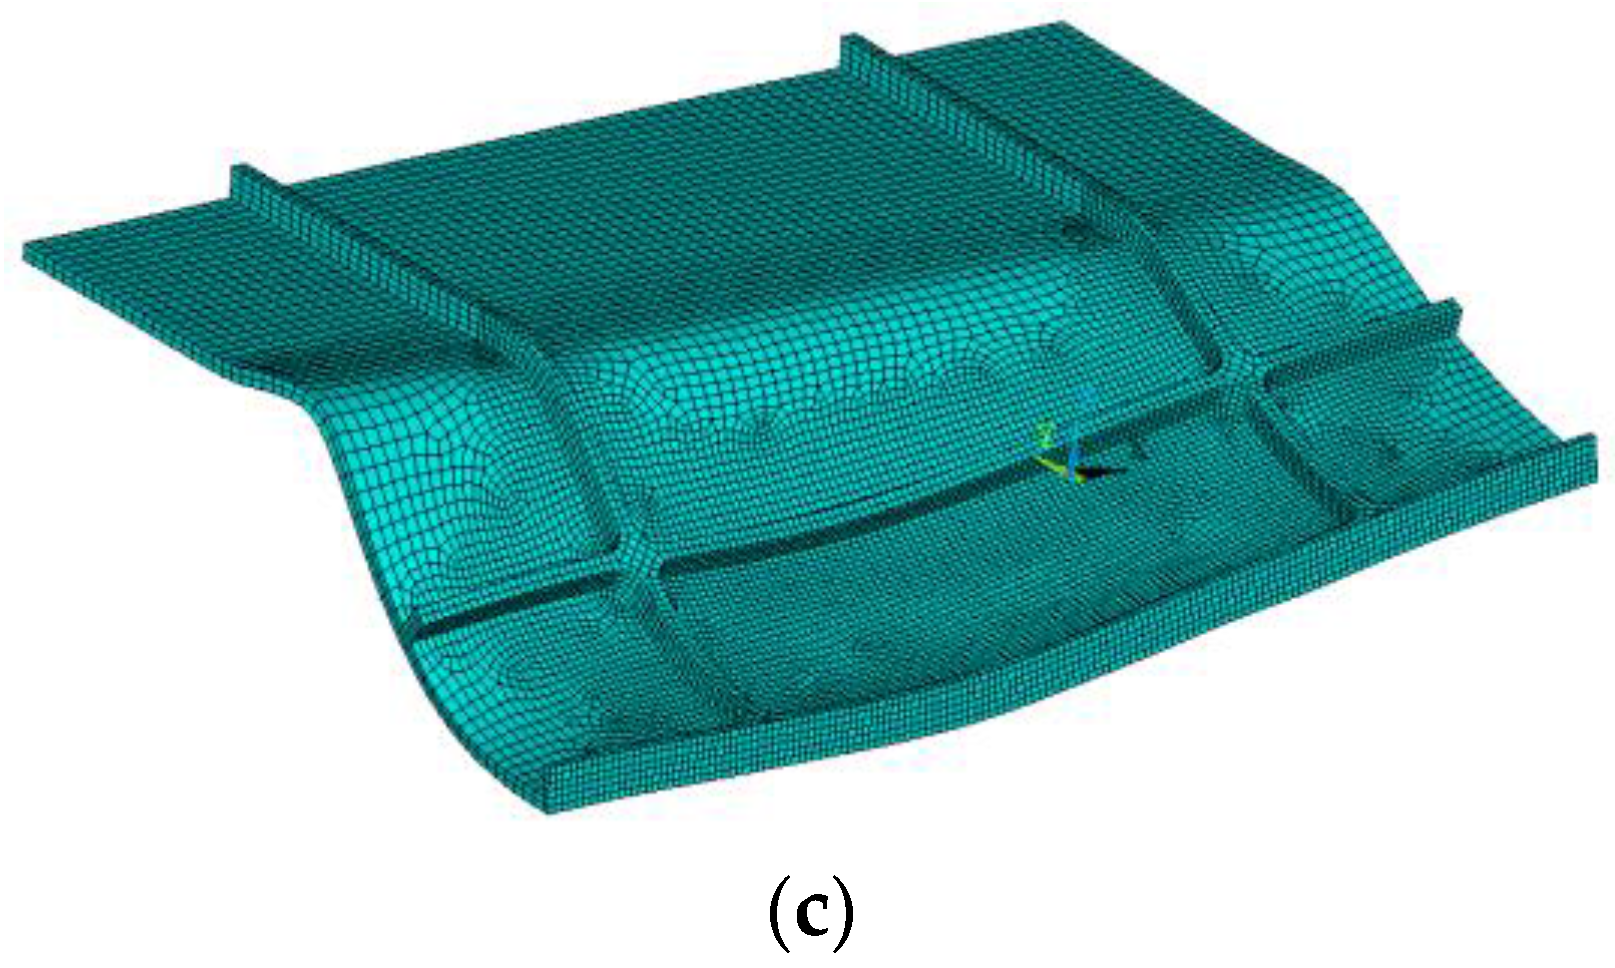
The panel and the coil are surrounded by air in the electromagnetic model, thus large distortion of the air meshes occurs because there is large plastic deformation or location change in the coil, which will interrupt the analysis. To solve this problem, the tetrahedral elements are adopted for the near-field air because the update of the air via remeshing operation could be easily achieved to guarantee excellent meshes with greater changes in the coil or the panel for the purpose of successful computation. Such changes in the meshes during the simulating process are shown in Figure 9, where the yellow part is the one-layer meshes closed to the panel. It can also be seen that the air meshes can be adjusted according to the panel geometry or the coil station.
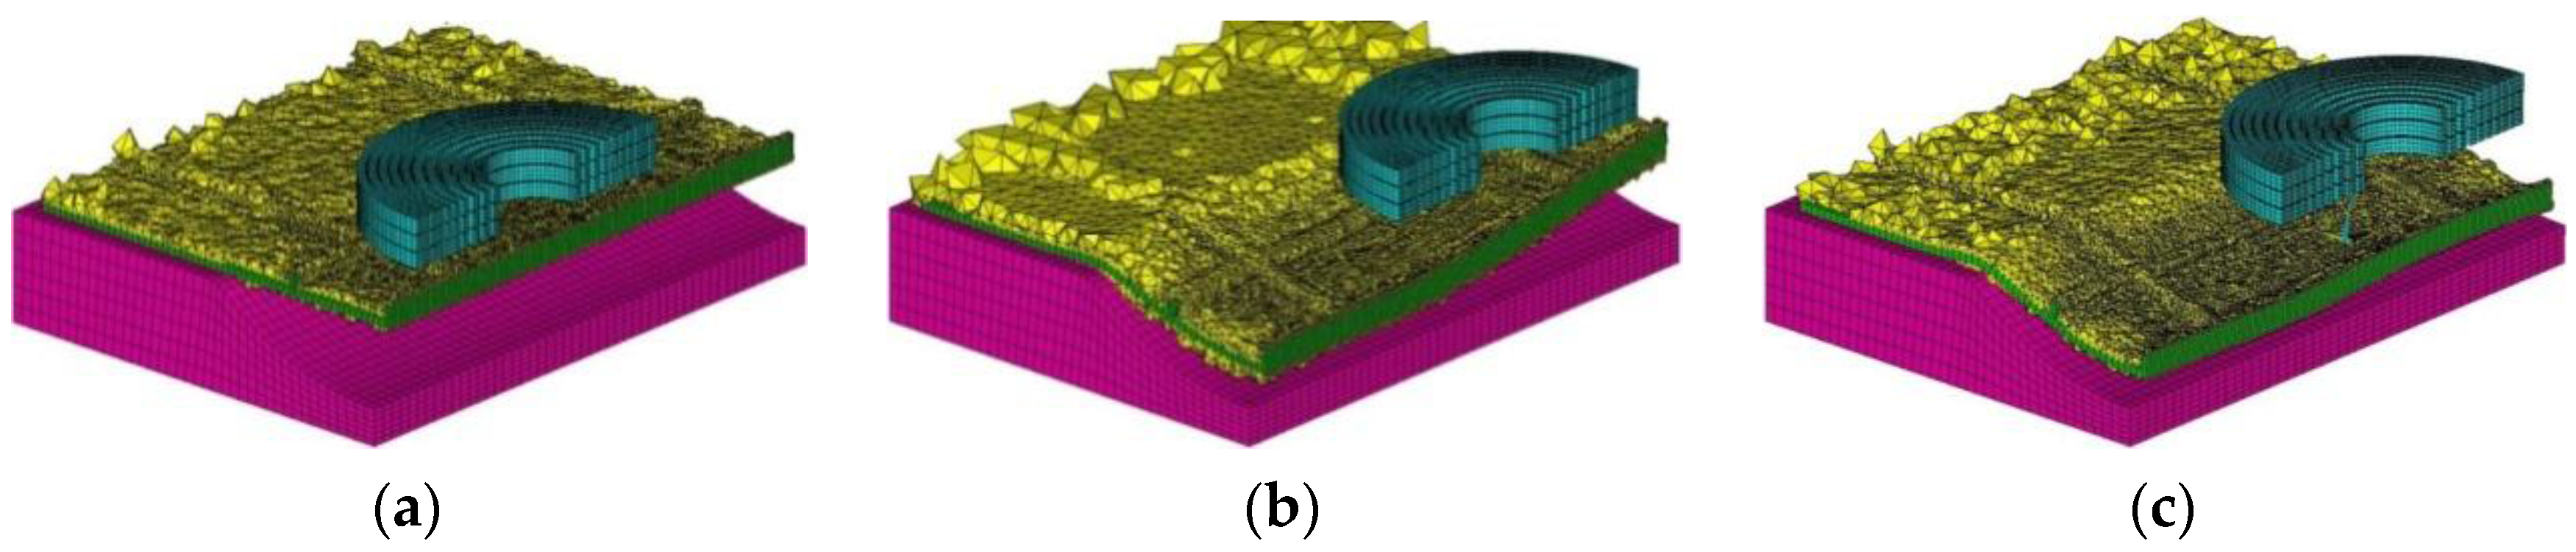
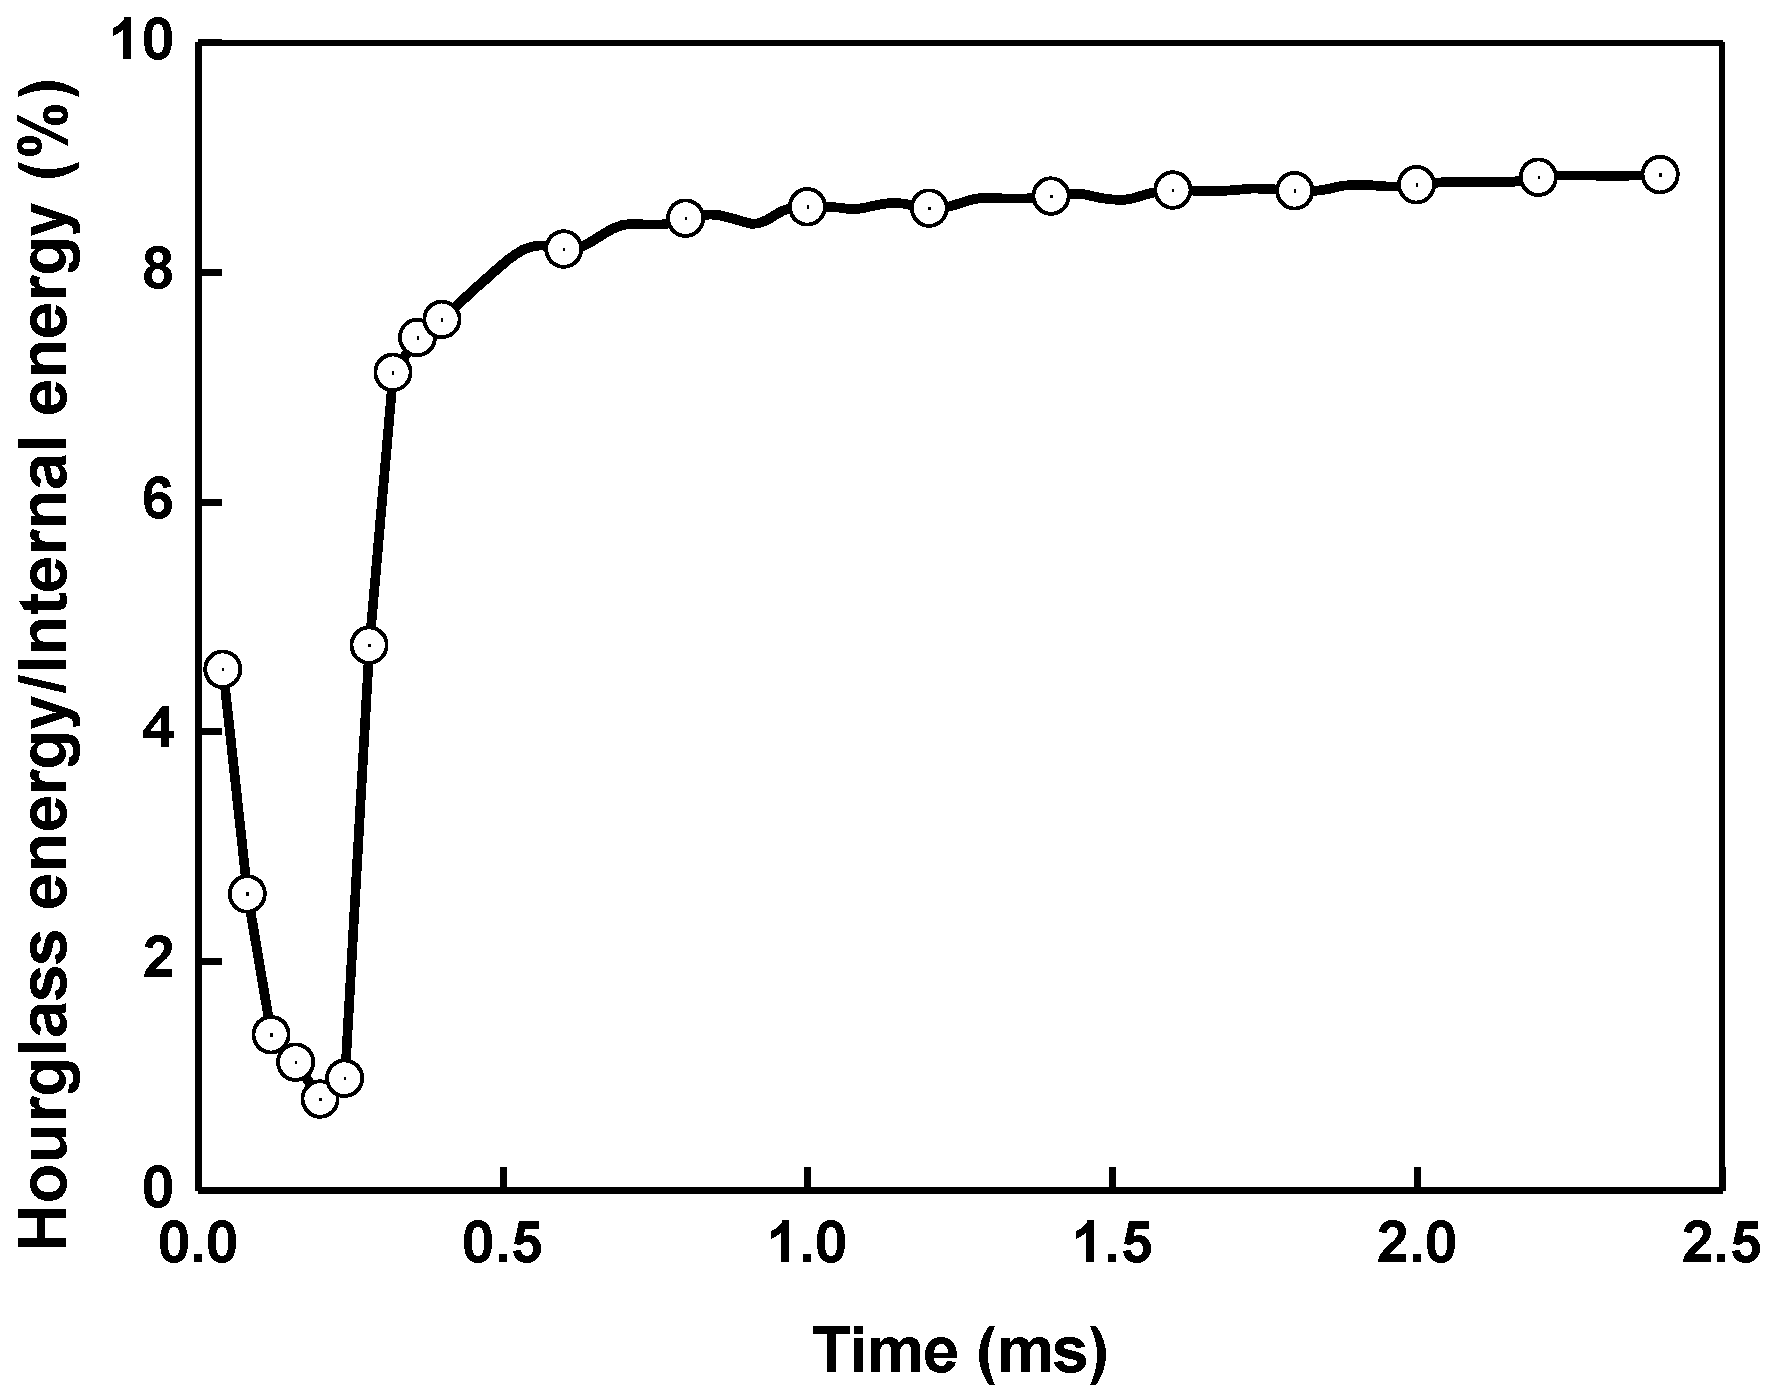
The ALE algorithm and smoothing treatment are employed for the air elements. To improve computational efficiency, the singe point integral algorithm is used, though it is prone to increase the hourglass energy in explicit dynamic analysis, which can be fixed through choosing the hourglass control type to be viscous form. The hourglass energy does not exceed 10% of the internal energy in this study, as shown in Figure 10.
3.2. Verification of the FE Model
To verify the established model, experiments and simulations for single discharge at station A and then C (Figure 6) are conducted. Parameters used in the experiments are as follows:
- (1)
- The capacitance is 160 μF.
- (2)
- For station A: X coordinate is −28 mm and the voltage is 7 kV. For station C, X coordinate is 28 mm and the voltage is 9.8 kV.
The system parameters in Table 3 are adopted in the experiments.
For the simulation, the same parameters in the experiments are adopted. The current data in the simulations are obtained from the experimental measurement. The simulation approach is based on the bilaterally coupled model established in Section 3.1.
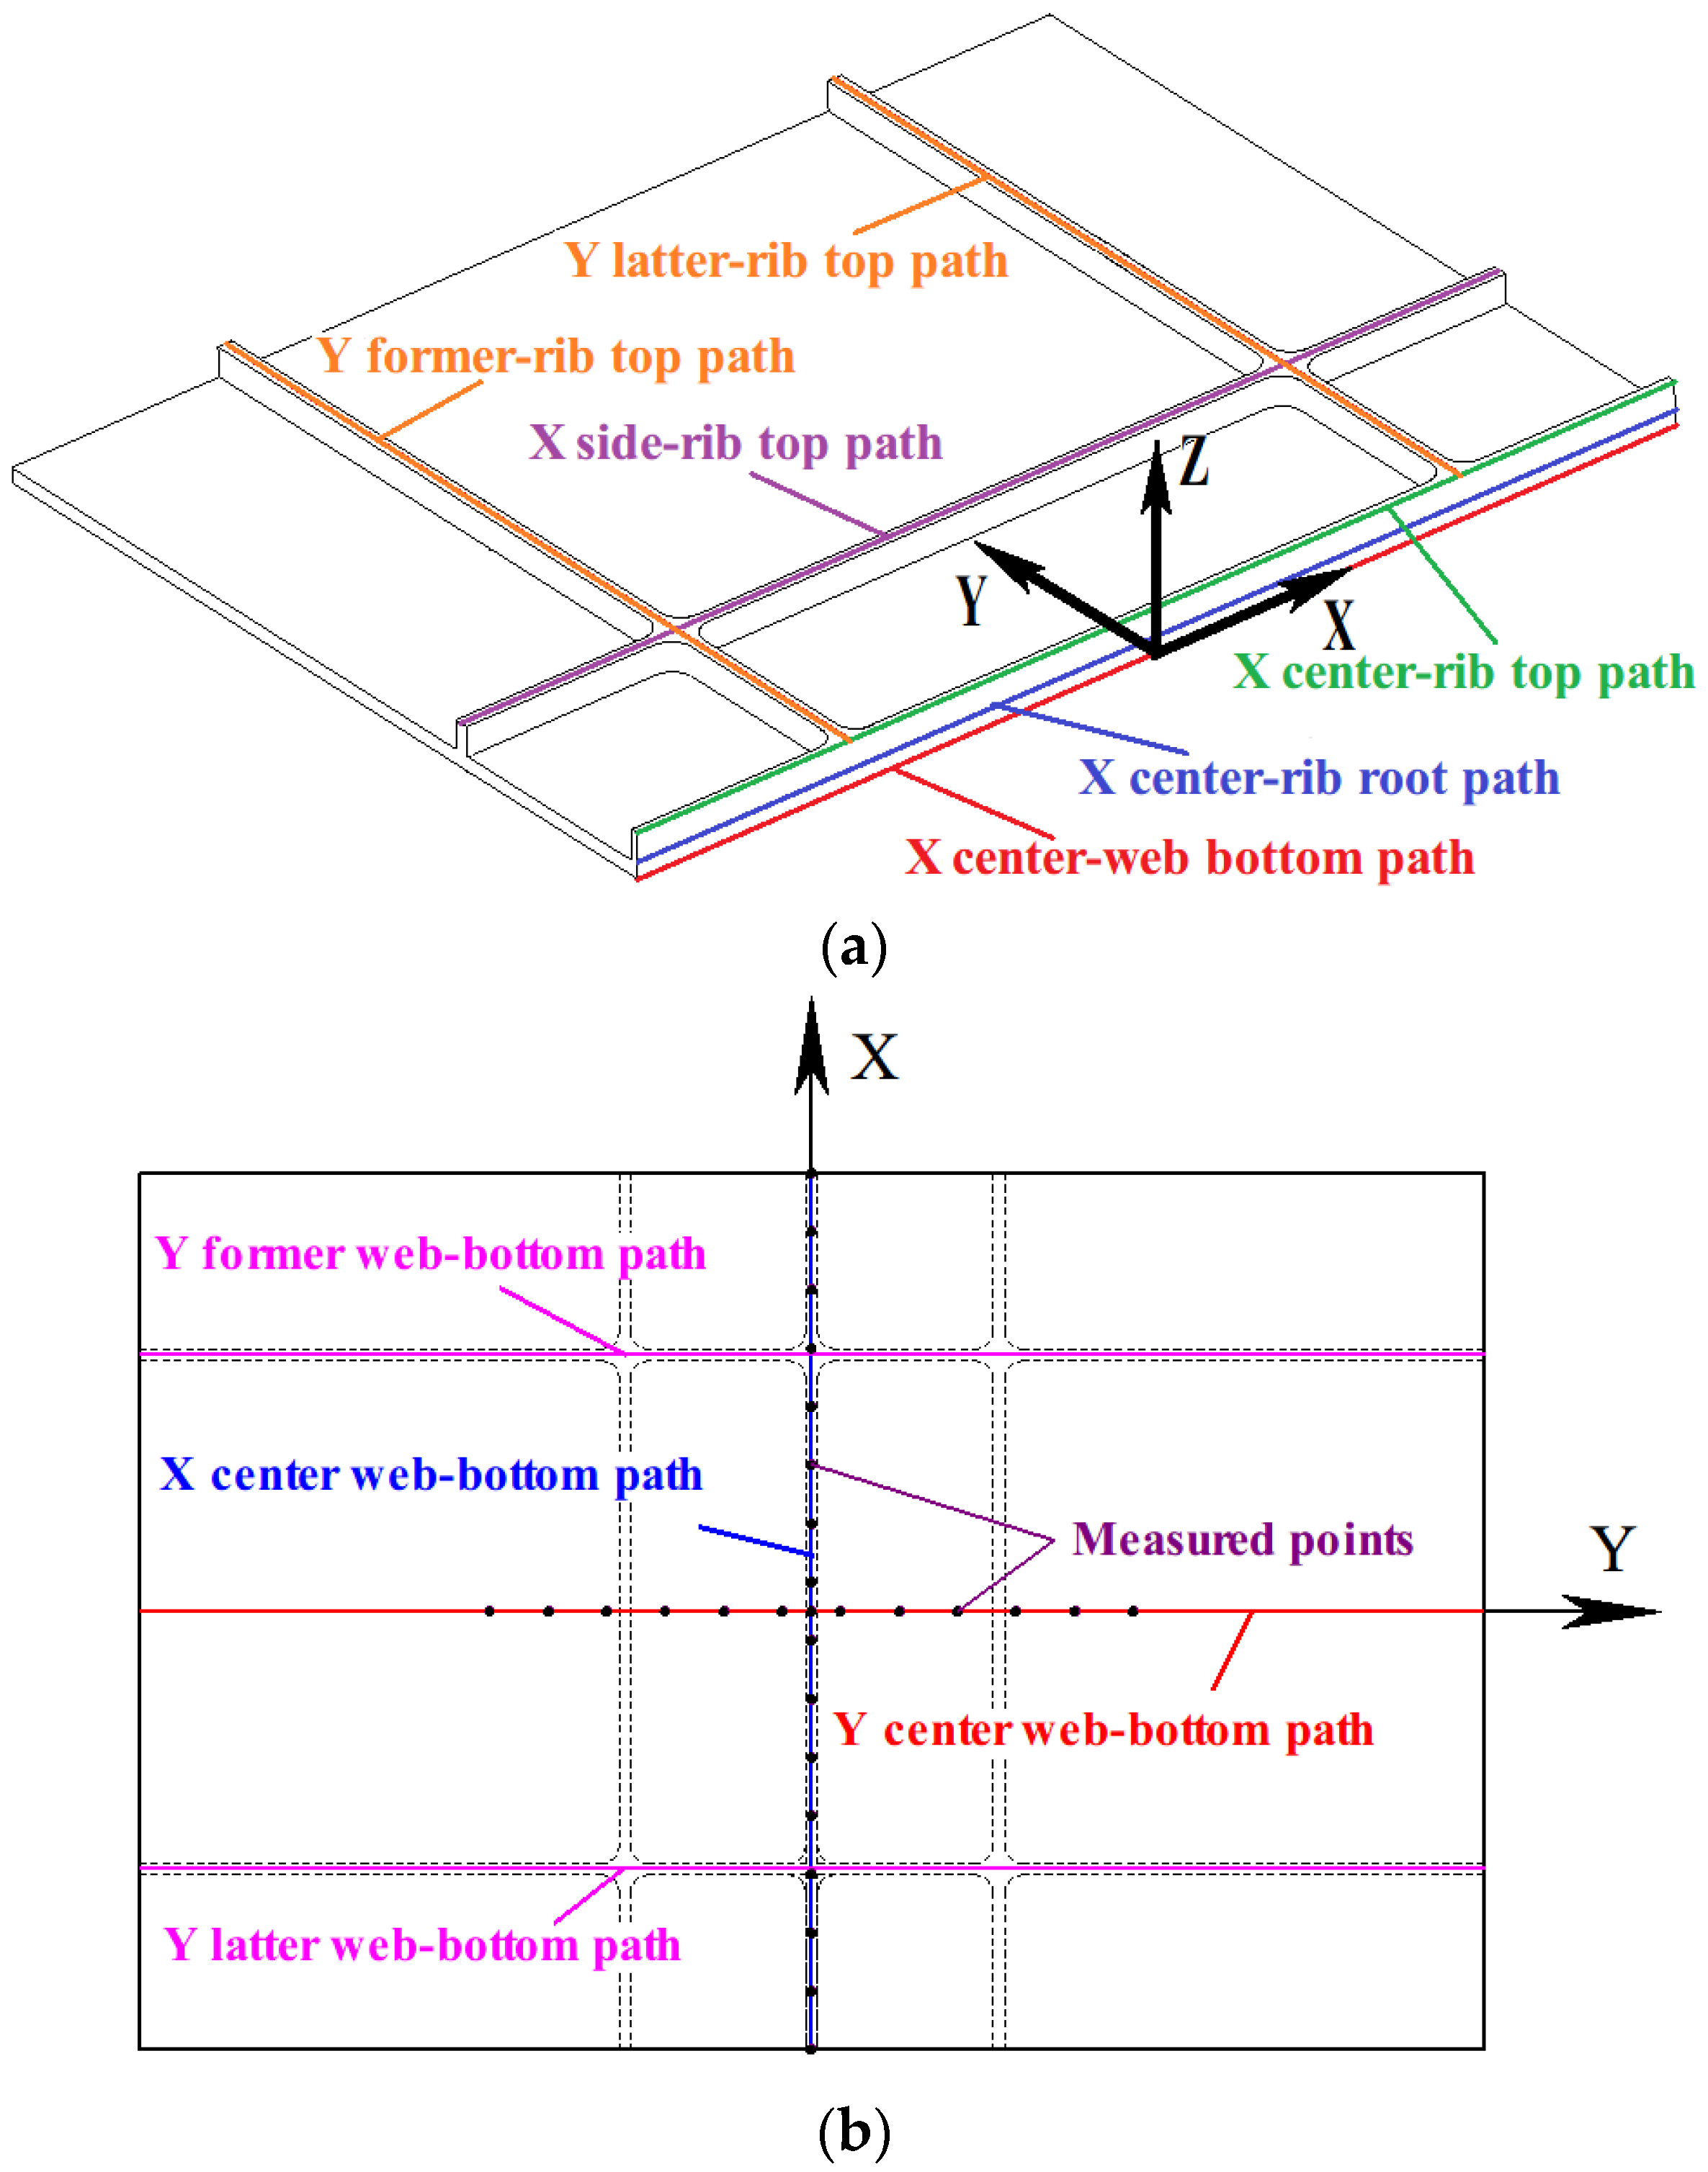
In order to compare the experimental and simulated results, several paths are defined, as shown in Figure 11. Figure 11a shows the paths from the top view of the panel and Figure 11b is from the bottom view of the panel.
Figure 12 shows the comparison between the experimental and simulation results after discharging at station A and station C. Comparisons of the formed profile and the forming height distribution along the X center web-bottom path (Figure 11) shows good agreement in the formed profile between experiments and simulations. After the first discharge at station A (Figure 12a), the workpiece touches the die at the free end close to station A while the deformation of the part far from the coil are insufficient; the forming height decreases with the increase of X coordinate. The workpiece acquires a higher forming height after the second discharge at station C (Figure 12b); the forming height increases slightly and then come to steady with the increase of X coordinate. Comparison between experimental and simulated results shows that the established FE model for the entire EMIF process of the stiffened panels is reliable.
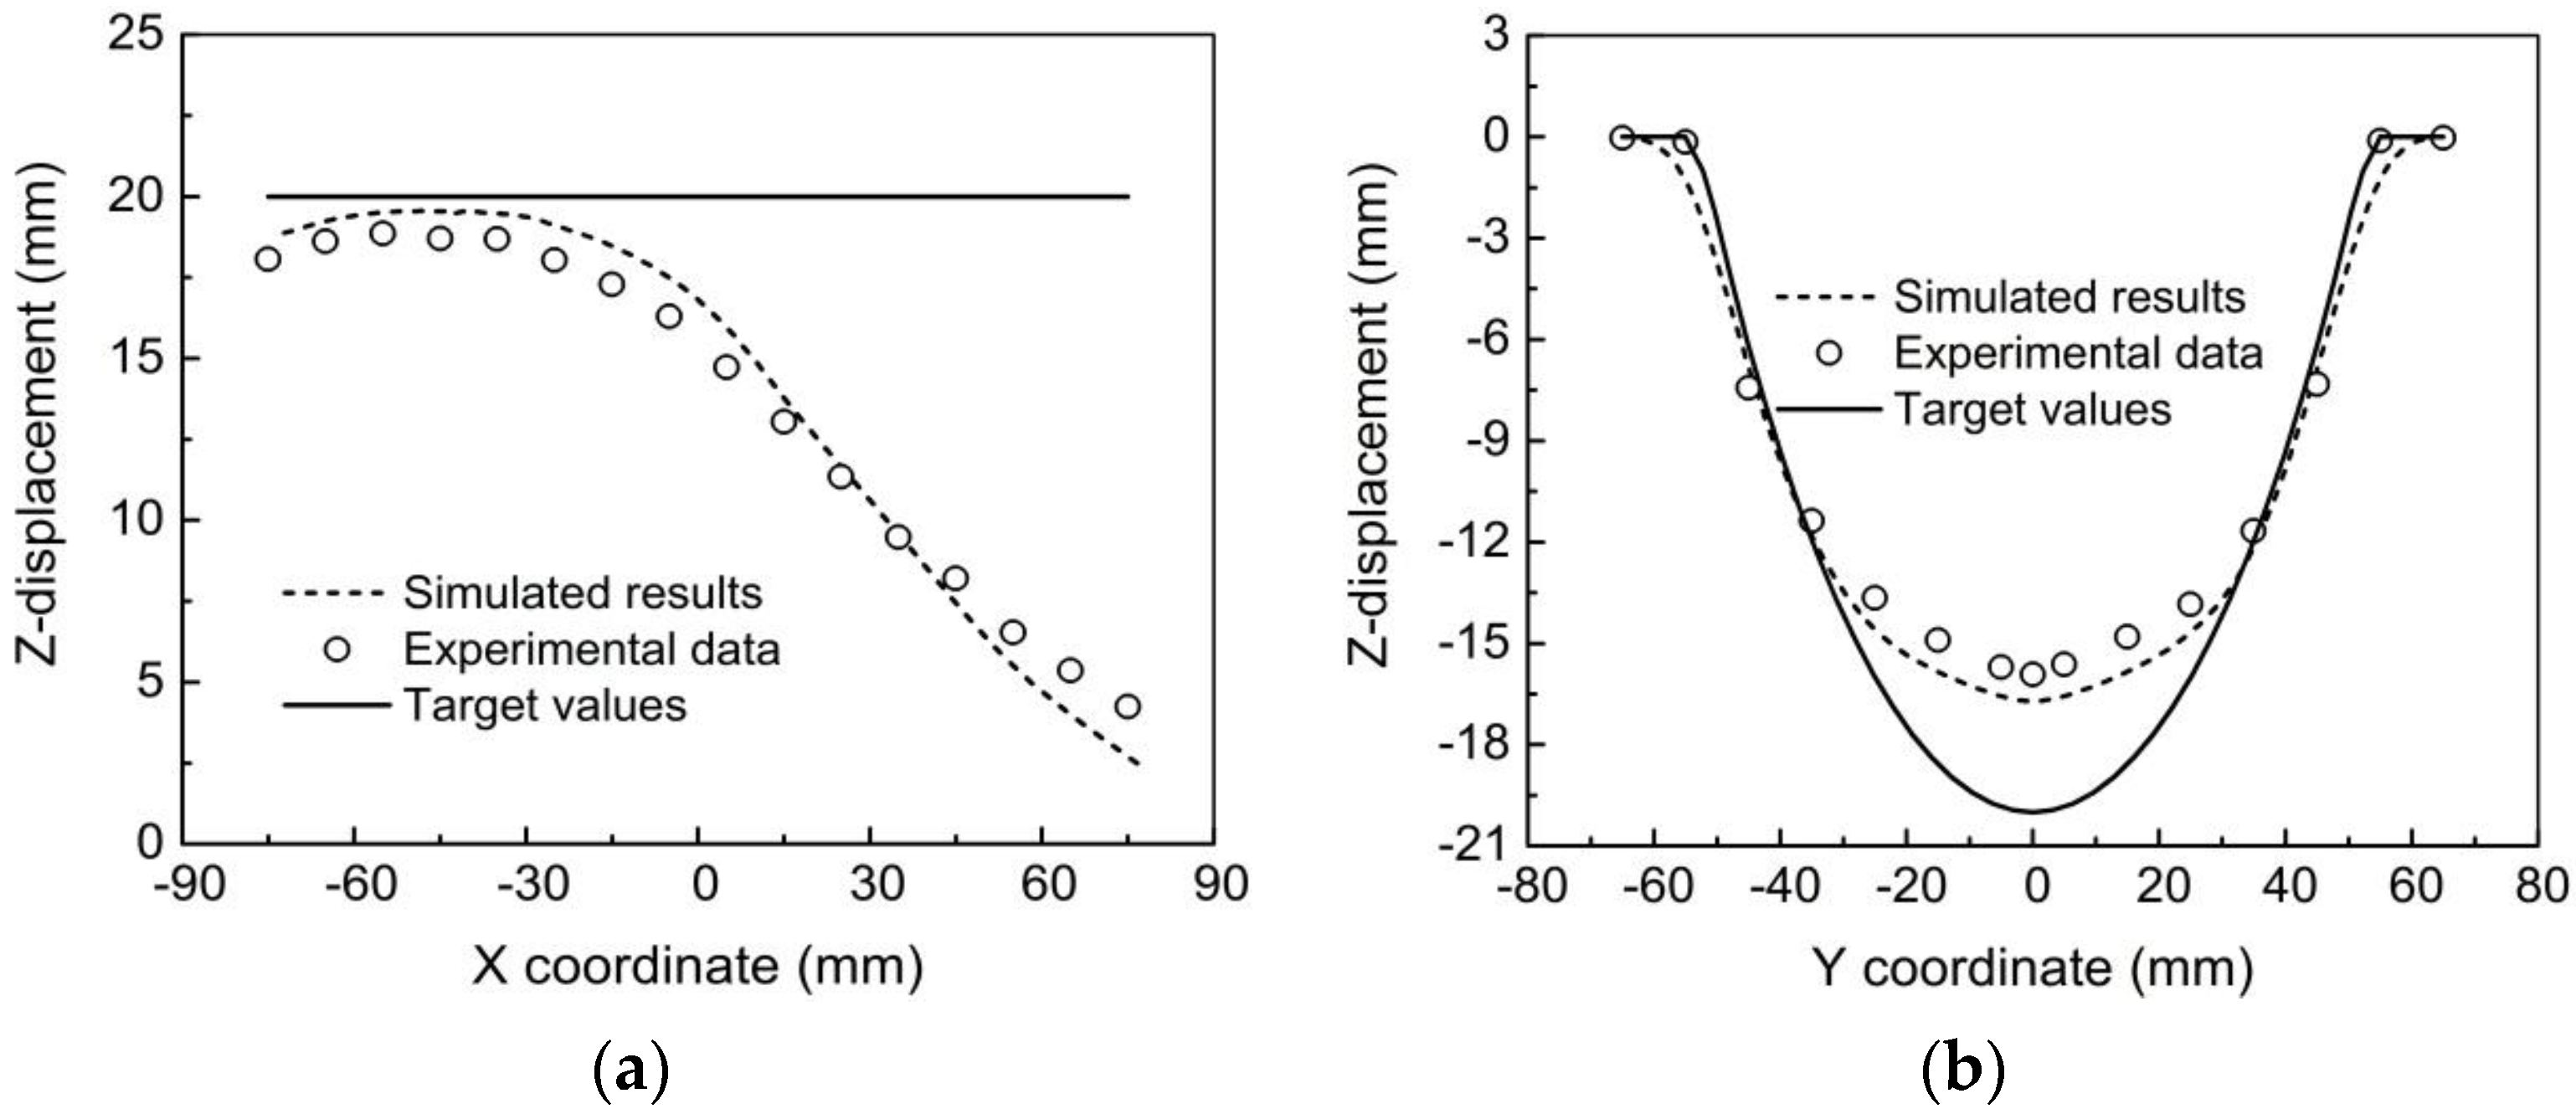
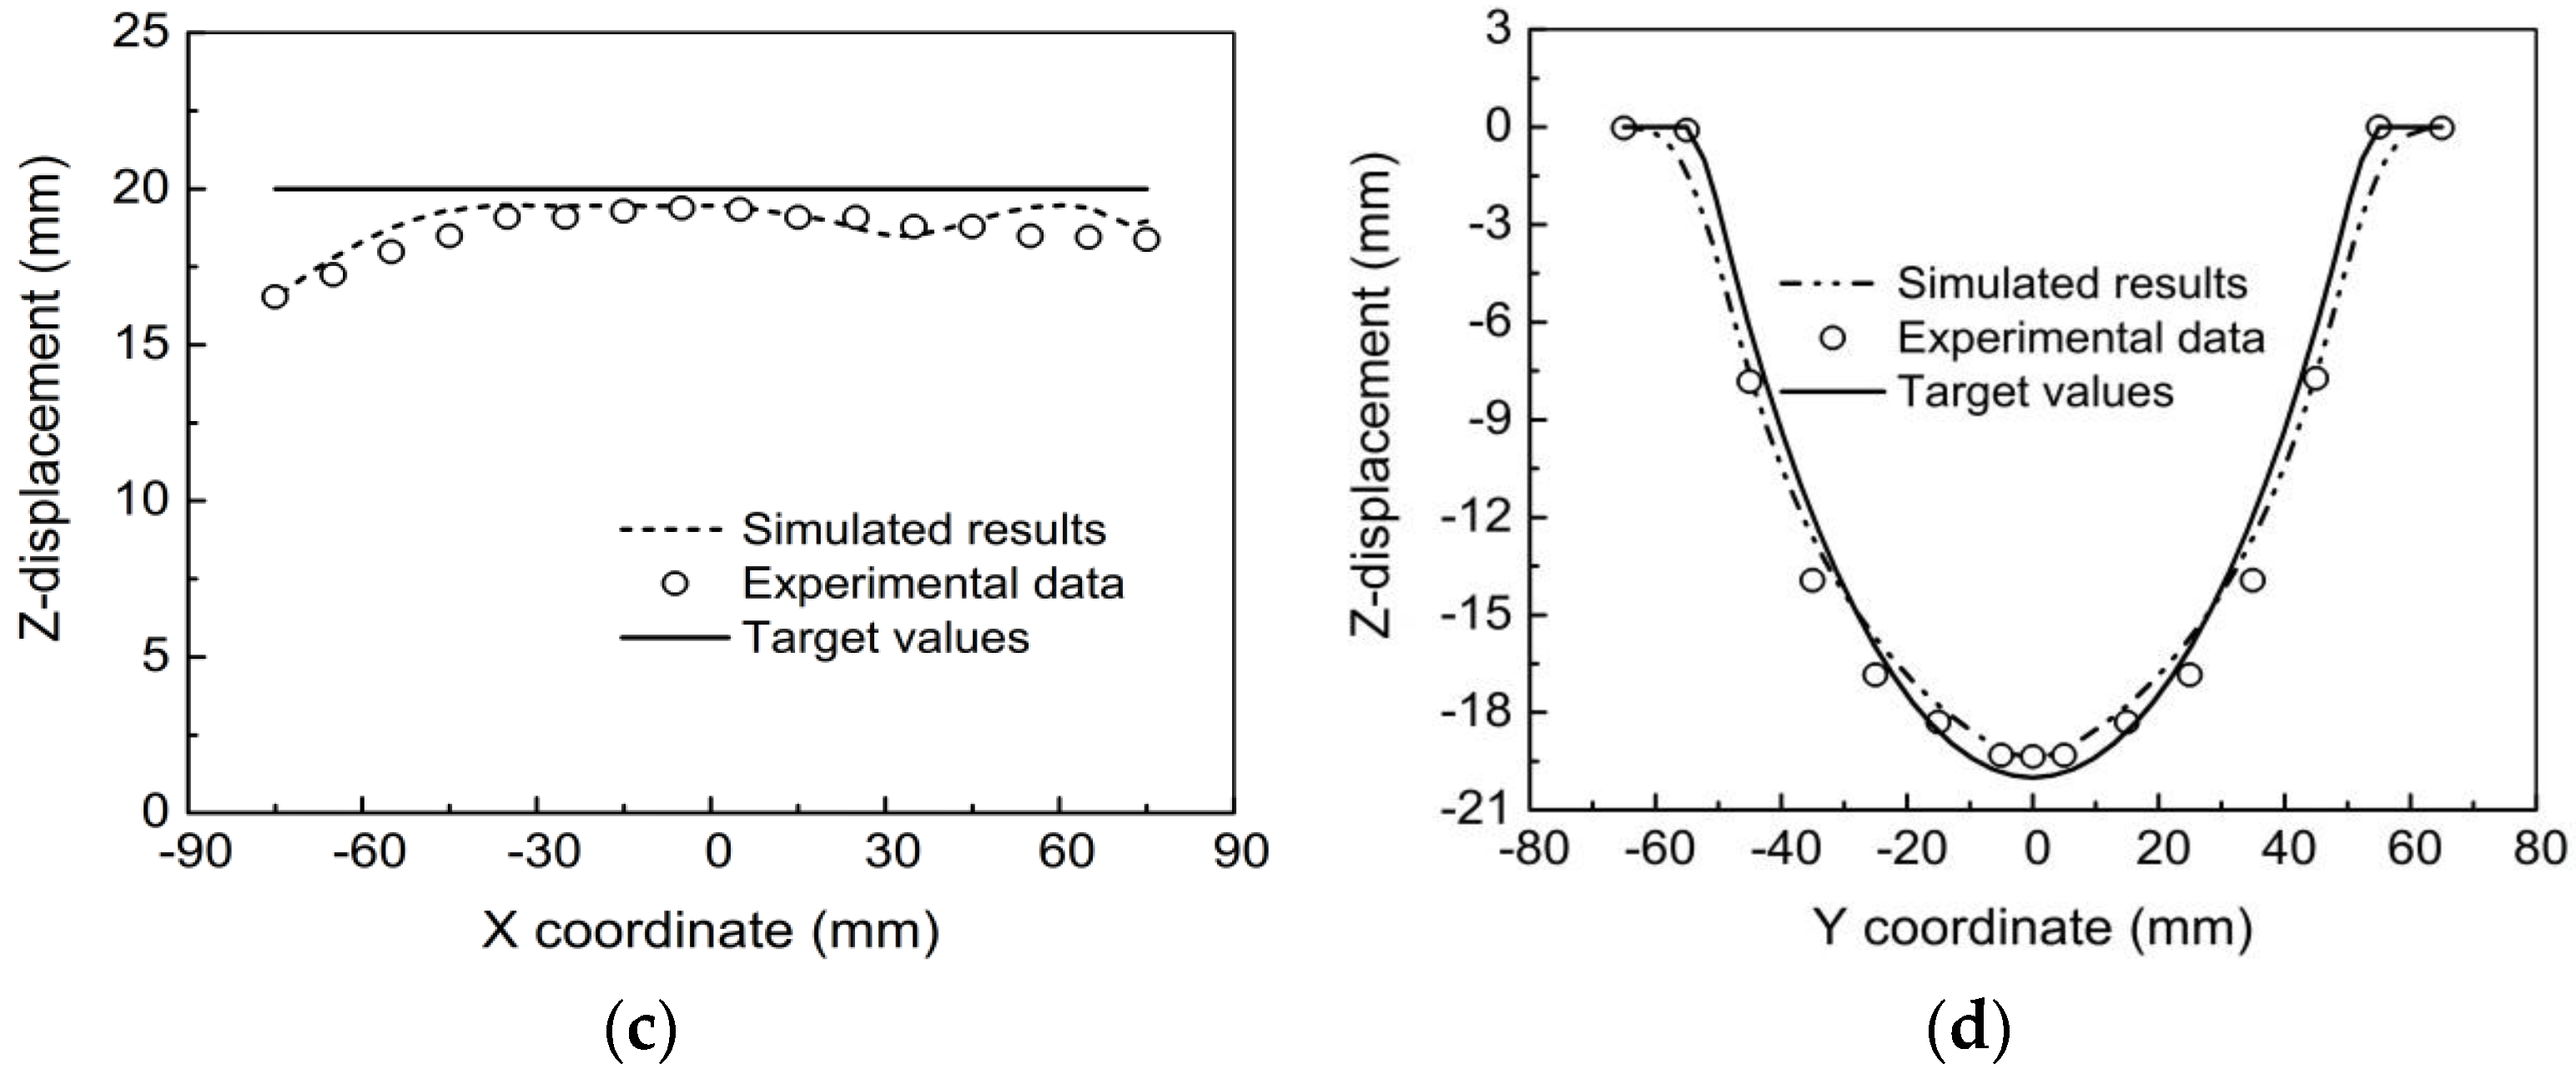
To quantify the comparison, Figure 13 shows the forming depths of the panel along the X center web-bottom path and the Y center web-bottom path after discharges at the first and then second stations. The experimental data at 16 and 15 equal-interval points are measured. Figure 13a,b shows the comparison of the simulated results with the experimental data after discharging at the first station (station A) along the two paths. It can be observed from Figure 13a,b that the simulation and experimental results coincide well with a maximum error of only 6.5% along X direction path and 9.2% along Y direction path, respectively. Figure 13c,d shows the comparison after discharging at the second station (station B). It can be found that the maximum error is 5.4% and 7.2% along X and Y direction paths, respectively. This comparison indicates that the model established in this study is reliable.
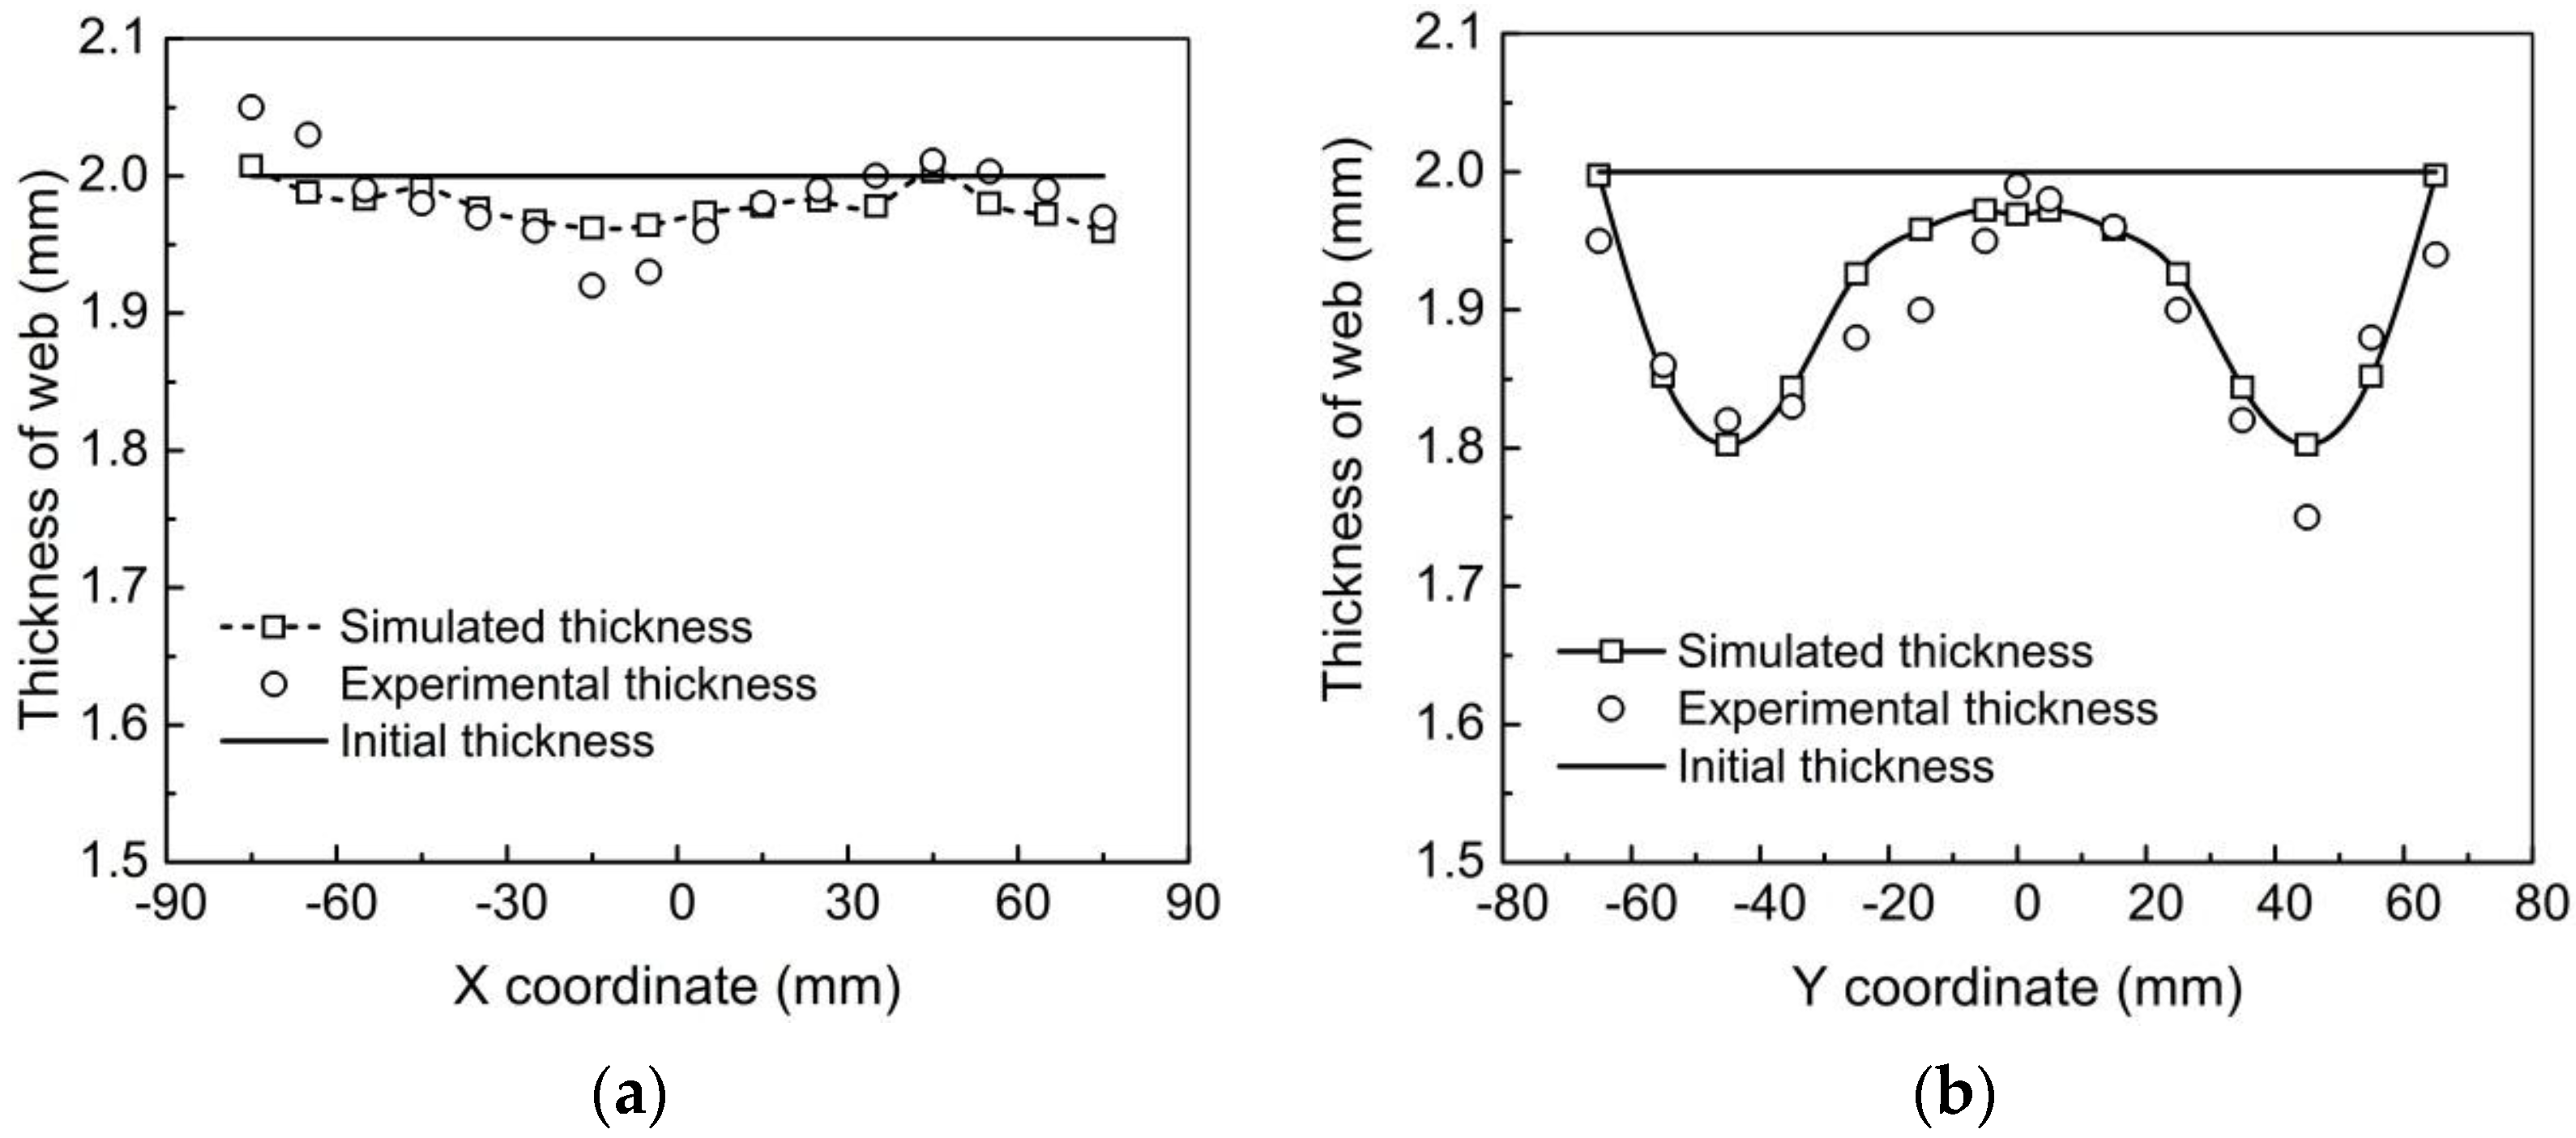
In addition, the thickness distribution in the web between experimental and simulated results after discharging at the second station is quantified here, which is shown in Figure 14. It can be found that along the X center web-bottom path (Figure 14a), there are local thinning both in the center (X = 0) and the positive free end (X = 75 mm); local thickening occurs mainly in the negative free end (X = −75 mm). The maximal relative error between the simulated and experimental results is 2.1%. From Figure 14b, along the Y center web-bottom path, there are obvious thinning phenomena along almost the entire path, except for the center position, and the maximal relative error is 3.1%. The comparisons of the web thickness between the simulated and experimental results verify again the reliability of the established model.
3.3. Determination of the Discharge Time and Deformation Time
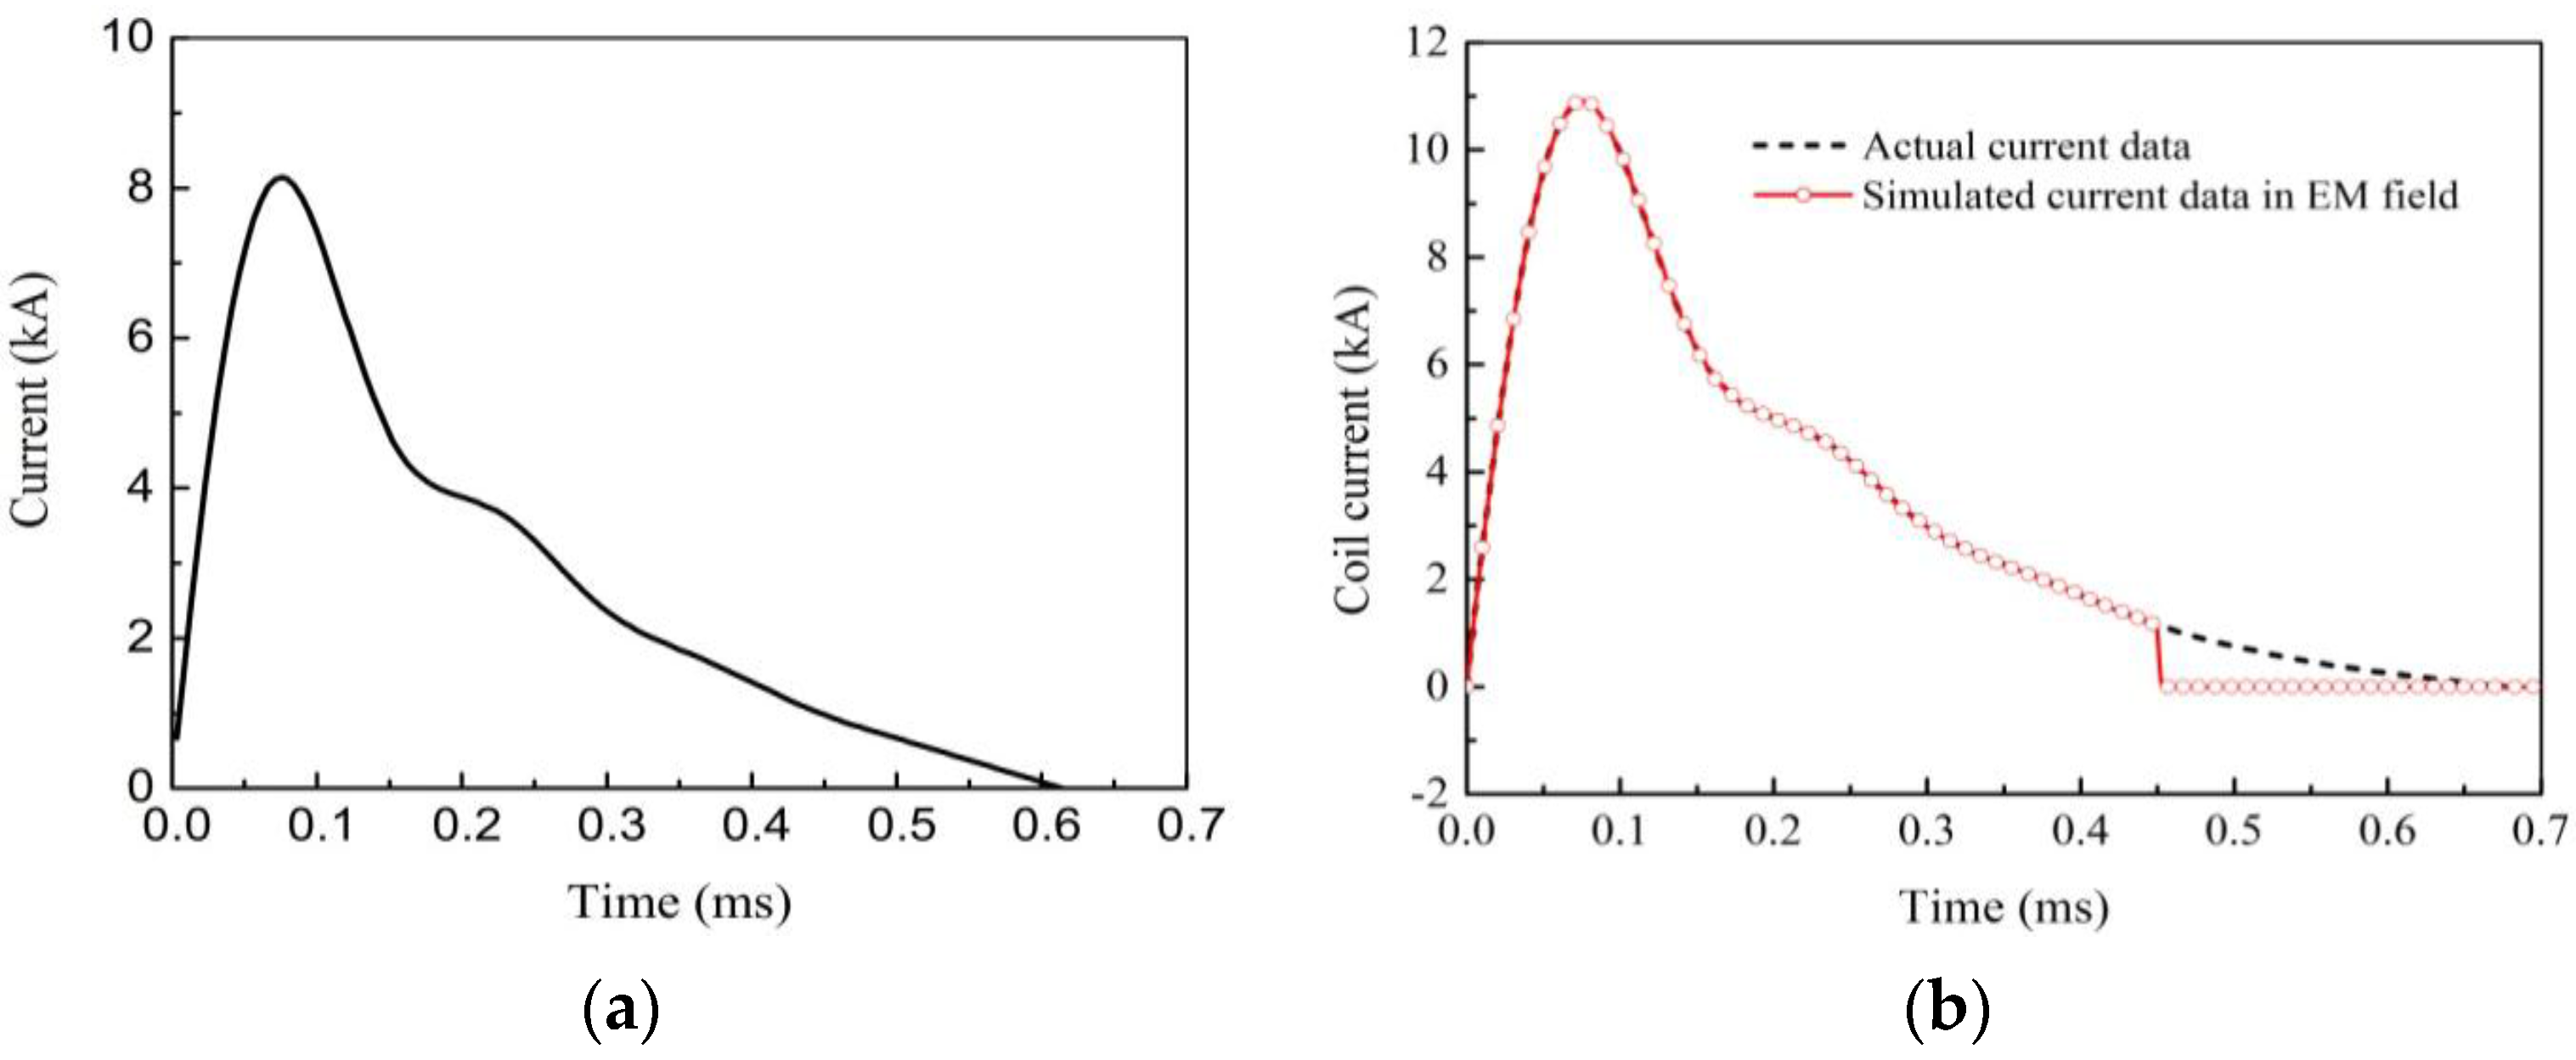
The discharge current of the coil in the experiment is taken as the input in the simulation. The measured coil current is shown in Figure 15, and the detailed description of the current characteristic is presented by Cao et al. [28]. In order to improve the calculation efficiency of the model, especially the EM model, the current–time curve in the simulation is also idealized, according to the research of Oliveira et al. [22]. Only a part of the actual current data is adopted in the EM field, and the rest during the inertial deformation are set to zero in the structural field. In this study, the discharge time is set to 0.45 ms. It can be seen from Figure 15 that the change trend of the coil generally characterizes a single sine shape, which is with a large increase rate before the peak value and then decayed gradually and at last comes to zero at the end of the forming. The current takes only 75 μs to reach the peak, which is useful to obtain a high strain rate in a short time.
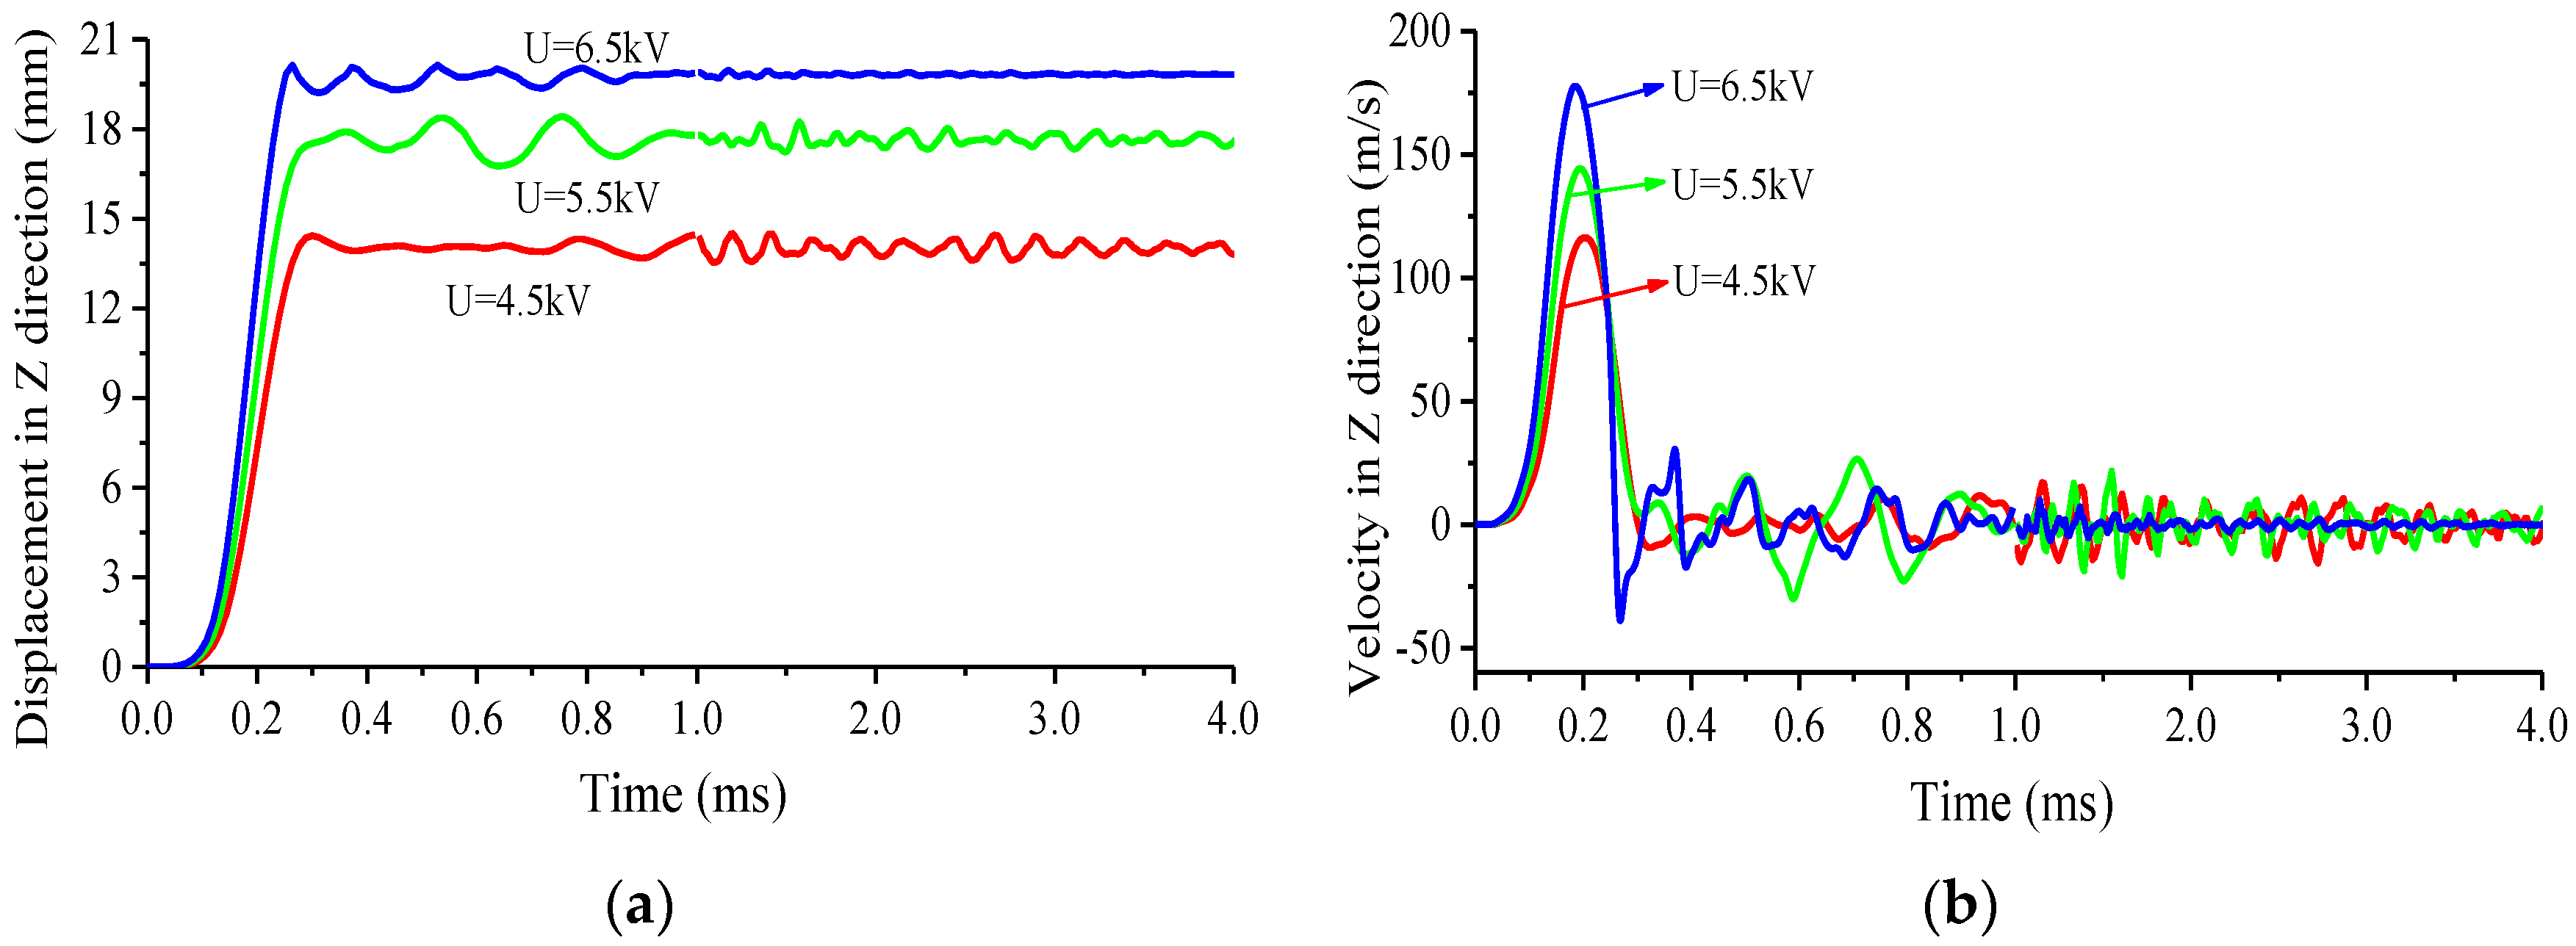
Due to the high-speed forming of EMF, the inertial effect of the workpiece is the major factor to keep the deformation proceeding when the action of the electromagnetic force disappears or can be neglected. It is necessary to determine the total deformation time, which consists of the discharge time and the inertial deformation time. Figure 16 demonstrates the evolution of the displacement and velocity with time under different voltages and the capacitance of each voltage maintains 320 μF, which is sampled at the center node at the top of the rib along the X center rib-top path. It can be seen from Figure 16 that the displacement mainly produces before the half of the discharge time; the effect of the voltage on the displacement time is close to each other, and the displacement changes no more than 1 mm after t = 0.75 ms under the voltage of 4.5 kV and t = 0.85 ms under the other two voltages; similar rules can also be observed with the velocity. The fluctuation of the displacement in period after the calculated total deformation time is mainly caused by the explicit algorithm adopted in the dynamic analysis in this study, and thus it should be neglected. In the simulation, three times discharges take place in a sequential but discontinuous mode, and the time of each discharge lasts 0.75 ms, 0.85 ms and 0.85 ms, respectively. That is to say, 0–0.75 ms is the first discharge period, 0.75–1.60 ms the second period and 1.60–2.45 ms the third period.
4. Results and Discussion
In order to study the influence of ribs on the formation of the stiffened panels, four types of panels are simulated here and the results are analyzed contrastively. The simulation conditions are listed in Table 4. The current data in Figure 15 are used as the input in the simulation.
4.1. Electromagnetic Force Distribution
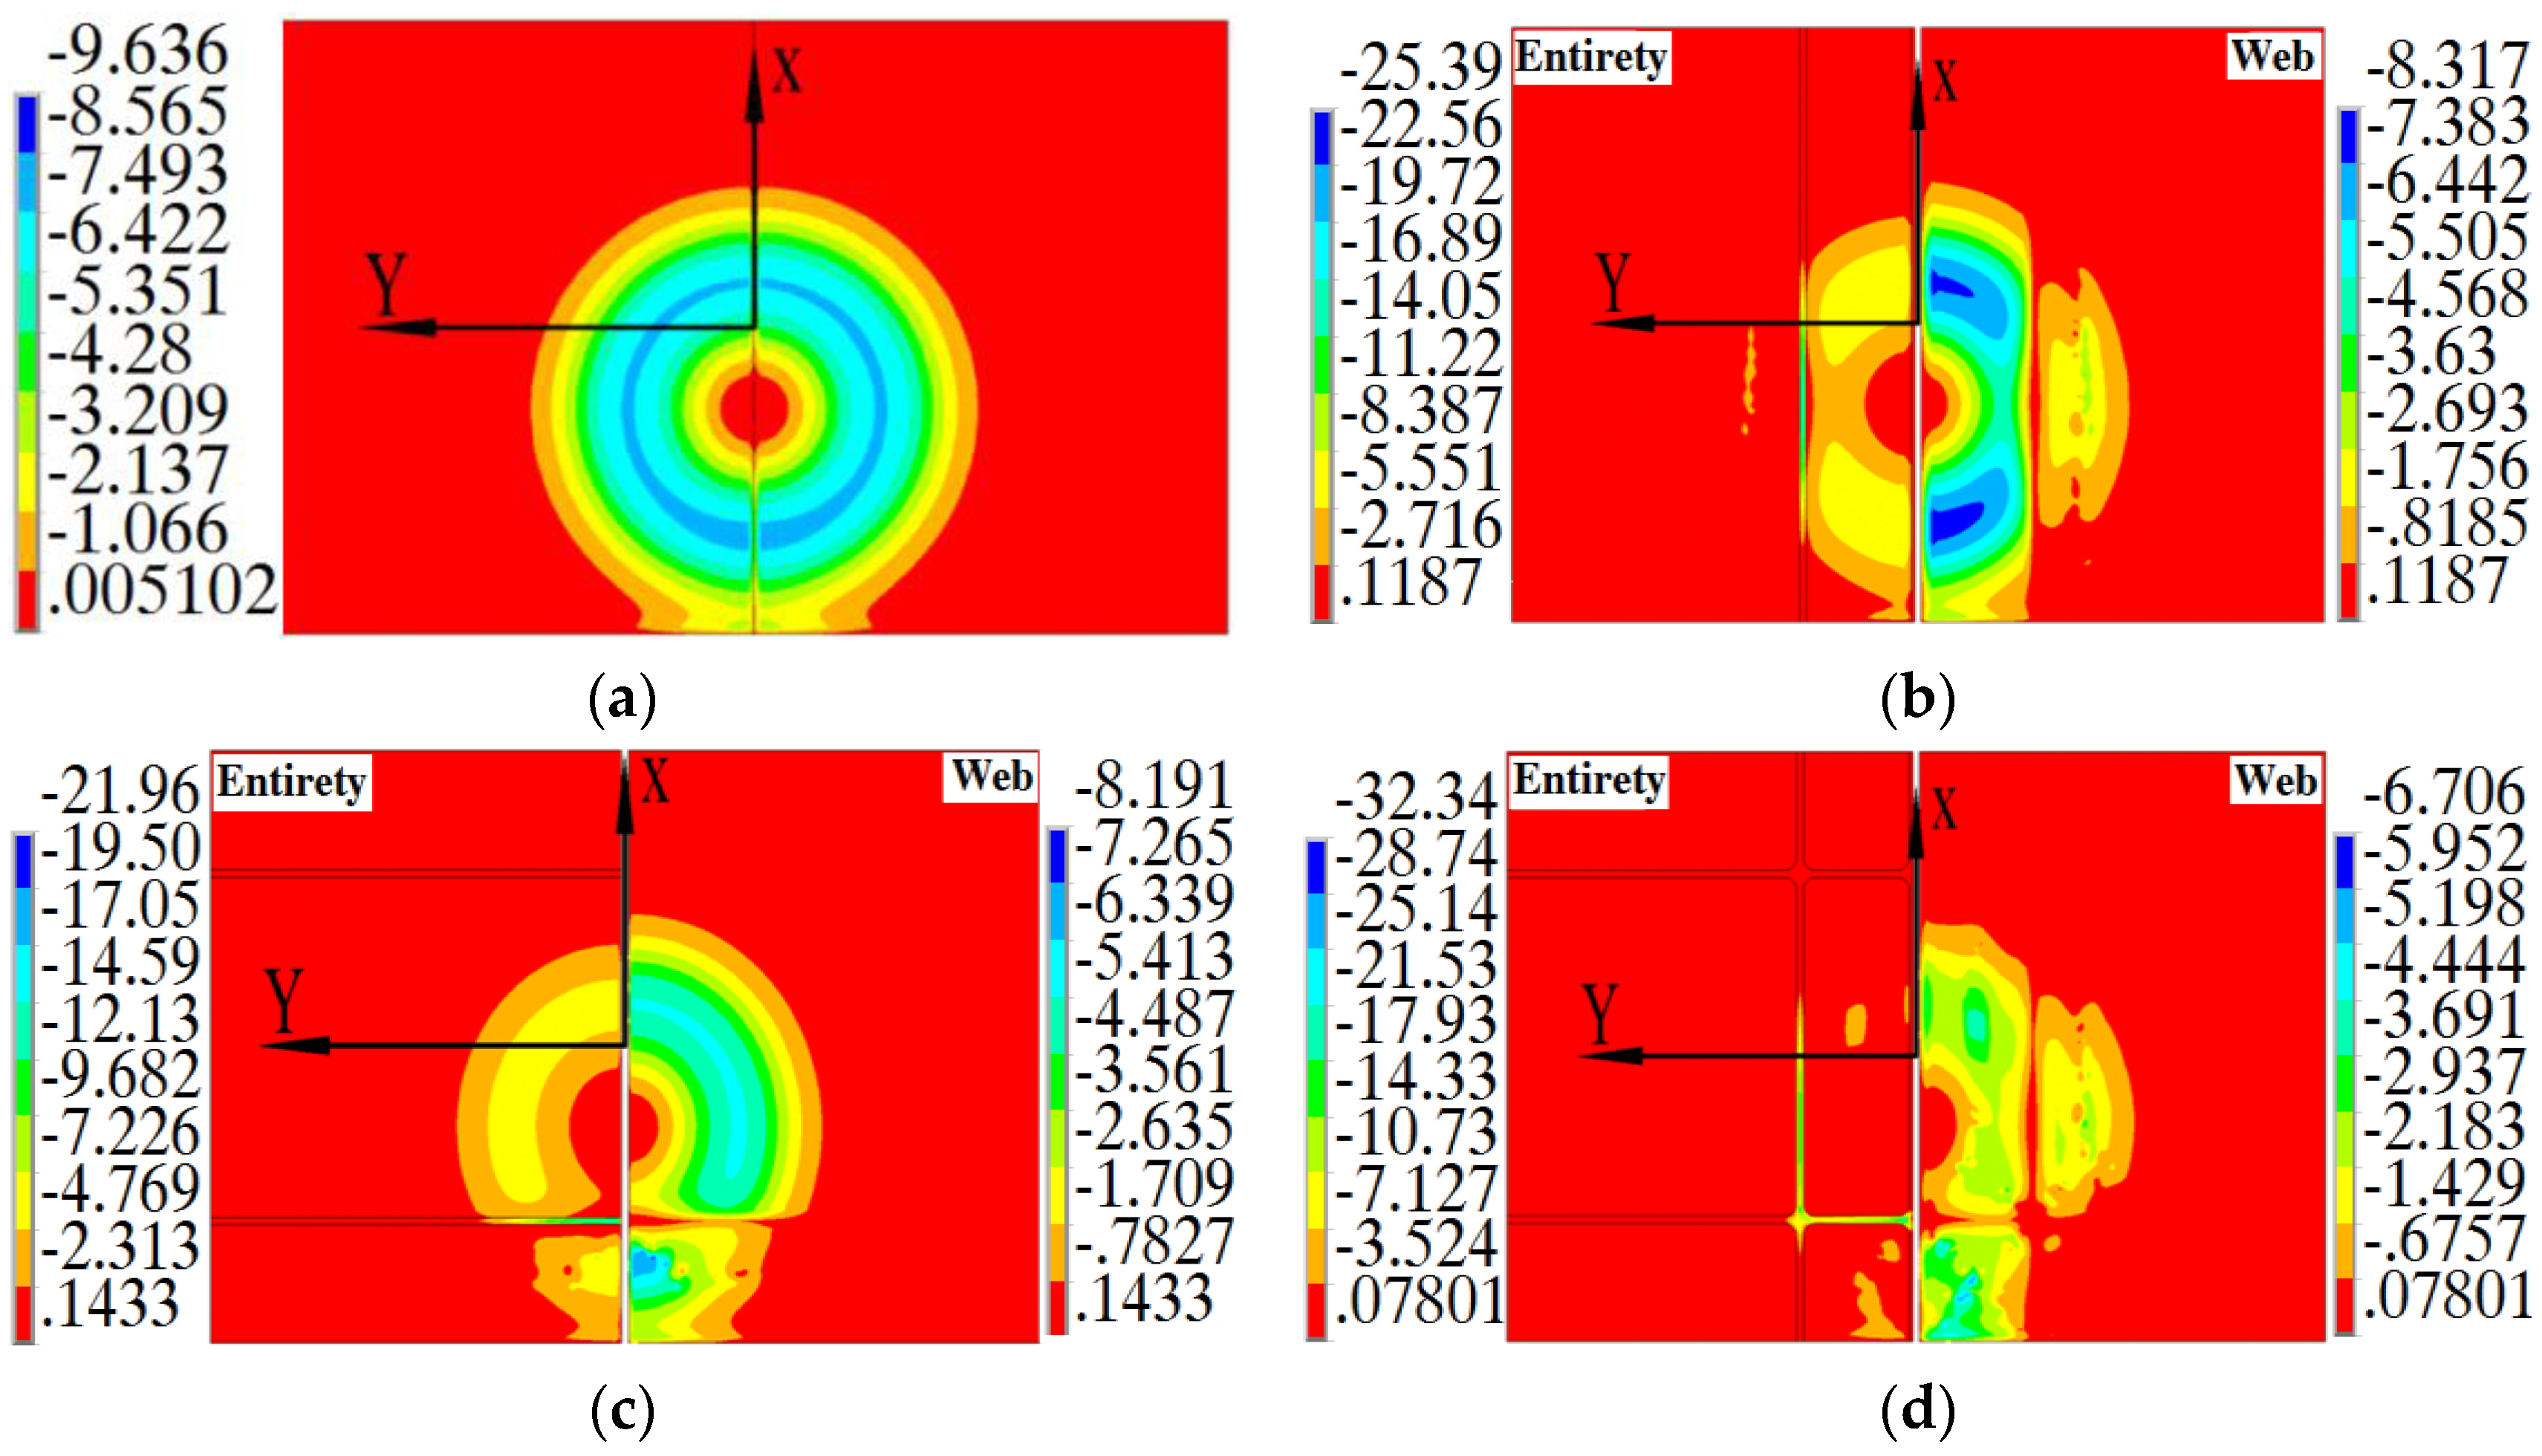
Figure 17 shows the peak electromagnetic forces loading in the four panels during the first discharge. In this section, the distribution of electromagnetic forces for the grid-rib is analyzed via comparison with flat panel, X-rib panel and Y-rib panel. For three stiffened panels, the force distributions include results in the entire panel and the web only. As shown in Figure 17a, the force distribution on FP exhibits several “rings”; the maximal value locates in the region corresponding to the 2/3 coil radius; the forces in the center of the “rings”, corresponding to the 1/6 of the coil radius, are near zero. From Figure 17b, different from that on FP, the force on XP mainly concentrates on the ribs, and the maximal value is approximately three times larger than that on the web, which can be attributed to the smaller distance between the rib and the coil and the larger one between the web and the coil. The force distribution on the web is discontinuous near the side of the X-direction ribs (as defined in Figure 11), where the maximal value concentrates in the region close to the symmetry plane, also corresponding to the 2/3 coil radius. From Figure 17c, force distribution in YP shows that the force also concentrates in the Y-direction former ribs (Figure 11). There is also discontinuous distribution of the force in the web and the large force locates in the region between the former-rib and the free end, instead of the symmetry plane like the case of XP. Because the bending direction is identical to the ribs direction of YP, the force concentrates in the former rib and the web near the former rib, which benefits for the reduction of the forming difficulty of YP. For GP in Figure 17d, the comparison of the force in the ribs of XP and YP shows that the large force concentrates in both of the two directions ribs (X direction side-rib and Y direction former-rib) with GP, which can be treated as a superposition effect of X and Y directions ribs. However, the comparison of the maximal value in the ribs shows that the force in GP are larger than that in the other two stiffened panels, which may be caused by the closed structure with grid ribs availing to reduce the leak of magnetic flux in comparison to the open structure of XP and YP. The distribution of the force in the web is more discontinuous with GP than with the other two panels, while the maximal value locates at the same position with YP. Note that the maximal value in the web of GP is smaller than that of the other three panels due to the fact that the induced eddy current mainly concentrates in the closed structure of the ribs of GP.
It can also be found that the force distributes simultaneously in the ribs and web of the stiffened panels; the maximal forces in the ribs of each stiffened panel are much larger than that in the webs, indicating that the deformation of the stiffened panels is mainly driven by the deformation of the ribs. Considering the electromagnetic force distributing in the entire volume of the conductive materials, Liu et al. [29] showed that the electromagnetic force plays a positive role in improving the formability of sheets. It is the same for promoting the formability of the stiffened panels, which distinguishes from the traditional forming processes of the stiffened panels, such as brake forming process [11], where the force acts on the top surface of the ribs, creep age forming process [2] where the force acts on the bottom surface of the web. In addition, the surface defects of the parts, e.g., mark-off and scratch in brake forming [1], can also be avoided because there is no mechanical contact between the forming tool (the coil) and the workpiece in the EMF process.
4.2. Velocity Distribution
In the sheet forming with a die, it is very important to obtain the distribution of sheet velocity for the sake of controlling the deformation of the sheet [30], especially for the high-speed forming process, e.g., electromagnetic forming. By considering that the largest velocity of the grid-rib panel appears in the discharging forming stage for each pass, the Z-velocity distributions of aforementioned four panels during the first discharging forming stage in the EMIF process are studied with the velocity variation characteristics being concerned, which is shown in Figure 18.
From Figure 18a, at the beginning of the discharge (t = 0.05 ms), the velocity exhibits a ring-shape distribution, where the center of the ring corresponds to the center of coil. It can be explained as that the maximal magnetic force in the flat panel corresponds to the half of the coil radius and almost zero at the coil center (Figure 17a). The velocity ring becomes an elliptical ring (t = 0.10 ms) and gradually narrows into an oval at t = 0.15 ms, 1/3 of single discharge time. At t = 0.25 ms, the elliptical region reduces further, the large velocity also appears at the free end of the workpiece adjacent to the coil (the negative free end area, NEA). The maximal velocity reaches 130.5 m/s at t = 0.15 ms in the electromagnetic forces loading stage. Note that there is reverse velocity distribution (along the positive direction of Z axis) in local areas, which firstly distributes around the velocity ring (t = 0.10 ms), and then appears at the free end area of the workpiece far from the coil (the positive free end area, PEA) over time. The maximal value of the reverse velocity occurs in the middle stage of discharge (t = 0.25 ms).
Due to the influence of the X direction ribs, the velocity distribution of the X-rib panel, as shown in Figure 17b, is significantly different from the flat panel (Figure 18a). At the beginning (t = 0.05 ms), the large velocity region in the X-rib panel distributes like two crescents and disconnected in the center-rib. This crescent-shape velocity distribution can be explained as that the initial velocity distribution is greatly related to the distribution of the electromagnetic force in the X-rib panel at the beginning of the forming process, and thus the both concentrate in the same region (Figure 17b) at t = 0.05 ms. The inhomogeneous velocity distribution will lead to that the velocity near the center rib lags behind the large velocity region (i.e., the two side ribs). Then, the high velocity concentration area in the two crescents turns into two small elliptical regions at t = 0.10 ms, locating near the X-direction side ribs. At t = 0.25 ms, the large velocity region extends from the elliptical region to the NEA with a peak shape. The largest velocity also appears at t = 0.15 ms, reaching up to 111.6 m/s, which is smaller than the flat panel at the same time. It can be explained as that the increase of structural stiffness caused by the ribs and the velocity lag of the center rib increases the forming difficulty of the X-rib panel, though the largest electromagnetic force on the X-rib panel is about three times larger than that on the flat panel. In addition, Figure 18b shows a reverse velocity distribution, which mainly distributes in PEA at t = 0.15 ms.
Figure 18c shows that the velocity distribution and the largest velocity in the Y-rib panel are similar to those in the flat panel (Figure 18a) at the same time. The difference between the two panels lies in that there is the large velocity in the Y-rib panel former-rib (as defined in Figure 11). The largest velocity of the Y-rib panel is 122 m/s at t = 0.15 ms, which is slightly lower than that of the flat panel at the same time. The reverse velocity distribution (t = 0.10–0.25 ms) in the Y-rib panel still mainly distributes in PEA, and the largest reverse velocity is 38.9 m/s at t = 0.35 ms. Figure 18c indicates that the influence of the Y-direction ribs on the velocity is weaker than that of the X-direction ribs, because the distance between two adjacent X-direction ribs is less than that between two adjacent Y-direction ribs and thus bend deformation of the ribs may occur along the Y direction.
The velocity distribution of the grid-rib panel, as shown in Figure 18d, is similar to that of the X-rib panel (Figure 18b), indicating the velocity distribution in the gird-rib panels is affected by the X-direction ribs and then the Y-direction ribs. Under the influence of the Y-direction ribs, in the initial stage of discharge (t = 0.05 ms), the large crescent-shape velocity distribution in the grid-rib panel cuts off by the Y-direction ribs, and then the crescent-shape velocity distribution changes to elliptic distribution area (t = 0.10 ms). The reverse velocity distribution of grid-rib panel is consistent with that of the X-rib panel in Figure 18b.
Figure 18 shows that, at t = 0.25 ms, the maximal velocity reduces by comparing with the one at t = 0.15 ms for all the panels. The decrement value for XP is the smallest, the largest for FP and YP and the middle for GP, which indicates the ribs parallel to the bending direction (Y direction) and the flat panel increase or promote the velocity attenuation, while ribs perpendicular to the bending direction prevent the velocity attenuation. For the grid-rib panel, it can be seen as the superposition effect of the X-direction ribs and the Y-direction ribs.
In summary, as shown in Figure 18, the large velocity distribution of the four panels evolves from the large magnetic force region at the beginning of the process, then to the coil center region, and finally to NEA velocity distribution; the existence of ribs affects the velocity distribution, and the influence of X-direction ribs shows significantly higher than that of the Y direction ribs; there is reverse velocity distribution for all of the panels during the EMIF process. The velocity exceeds 100 m/s for all the panels, which is far greater than that of the traditional forming process, for example the brake forming. The higher velocity with EMF is conducive to reduce the springback [14].
4.3. Forming Height
Forming heights of the four panels along two X direction paths (X center web-bottom path and X side web-bottom path in Figure 11, shorten as Xc path and Xs path, respectively) at different times are shown in Figure 19. It can be seen from Figure 19a that, along the Xc path, the forming height curves for FP and YP almost coincide with each other in the early stage of the first discharge (t = 0.15 ms) due to the similar distribution of velocity in Figure 18a,c. The forming height distributes in a bimodal shape, where the peaks correspond to the velocity “ring” at the same time in Figure 18a and Figure 18c, respectively, and the trough between the two peaks locates correspondingly to the coil center. The height curves for XP and GP are almost coincident, distributing in a unimodal shape, where the peak locates in the region corresponding to the coil center. The forming heights of FP and YP are larger than those of the rest two panels along the Xc path. Along the Xs path, the height curves of the four panels exhibit a unimodal distribution, where the position of the peak approximates correspondingly to the coil center. The forming heights at this time are influenced by the distribution of velocity.
From Figure 19b, along both the X direction paths, the forming height of the four panels at the end of the first pass (t = 0.75 ms) reduces parabolically with the X coordinate; by comparing to the early stage of discharge, the forming height increases obviously as the result of the inertial effect because the velocity reduces after t = 0.15 ms (Figure 18); the forming height along the Xc path remains larger than that along the Xs path. Figure 19b shows that the forming height in NEA after the first discharging at station A are larger than the other regions for the four panels due to the inertial effect. It can also be found that the forming height for FP and YP, XP and GP has the identical values in pairs along the two paths at the beginning of discharging stage, but with different distributions at the end of the inertial deformation stage. The final forming height for the four panels follows the sequence of XP, FP, GP and YP (from the largest to the smallest) as the result of the different velocity attenuation effect of ribs as shown in Figure 18.
From Figure 19c, in the second discharge at the same station (t = 0.90 ms), the forming height of the four panels along both of the two X direction paths continues to increase. Along the Xc path, the forming height of the four panels reduce parabolically with X coordinate, and the largest height appears in NEA. Along the Xs path, the forming height of the Y-rib panel decreases parabolically with X coordinate, but for the other three panels it increases slightly and then decreases. The forming height reduces and changes to the reverse direction (along the positive direction of Z axis) in the region far from the coil (PEA). The height differentiations at the end of the first station discharge (Figure 19b) diminish after the second discharge at the same station.
From Figure 19d, along both the two X direction paths, the forming heights of the four panels at the end of the second pass (t = 1.60 ms) reduce parabolically with the increase of the X coordinate. Along the Xc path, the order of the forming height in NEA from the largest to smallest is similar to that in Figure 19b at the same place; the forming height for the grid-rib panel in PEA is 0.56 mm, and there are reverse deformation for the other three panels. Along the Xs path in NEA, the maximal forming height appears with FP (10.95 mm); there is also are reverse deformation for the other three panels. The shape changes of the height curves in Figure 19d show that the uniformity improves after the second discharge in comparison to the on at the end of the first discharge in Figure 19b.
From Figure 19e, along both the two X direction paths, the forming height of the four panels in the early stage of the discharge at the second station (t = 1.75 ms) changes slightly in comparison to the one at t = 1.60 ms, and reduces also parabolically with the increase of X coordinate, however, the reduction extent is less than that in Figure 19c,d. There is no reverse deformation.
It can be seen from Figure 19f that, the height curves for the four panels distribute in the style of the letter “W” at the end of the second station (t = 2.45 ms), where the position of the peak locates in the geometric center of the panels. Along both of the two X direction paths, the forming height increases mainly in the region under the coil in the new station. The forming height along the Xc path reduces in the region far from the coil (NEA), due to the effect of the main deformation region. Comparison of the forming heights at t = 1.75 ms and t = 2.45 ms in NEA shows that there is also reverse deformation in the third discharge stage. In addition, the different distributions occur again at the end of the second station forming stage.
From Figure 19, there are reverse deformation regions, mainly locating in the free end region and resulting from the influence of deforming region on the deformed or undeformed regions. It is obvious that the reverse deformation reduces the forming height, and thus is disadvantage to improve the fittability of the workpiece to the die. In addition, there are less electromagnetic forces in the free ends during the entire forming process, which indicates that the deformation of these regions is mainly driven by the inertial effect of the panels.
Figure 20 shows the forming height of four panels along two Y direction paths (Y former web-bottom path and Y latter web-bottom path, shorten as Yf path and Yl path respectively) at different times during the EMIF process. It can be seen from Figure 20 that the distribution curves of forming height for the four panels along both of the two Y direction paths exhibit a parabolically declining law. From Figure 20a, in the early stage of the first discharge (t = 0.15 ms), the forming height along the Yf path is larger than that the one along the Yl path.
From Figure 20b, at the end of the first pass forming (t = 0.75 ms), the increasing rates of the forming height of the four panels are larger than that at t = 0.15 ms in Figure 20a. Along the two Y direction paths, the forming height increases about twice from t = 0.15 ms to t = 0.75 ms in NEA, which can be attributed to the inertial effect on the deformation region.
From Figure 20c, the forming height of the four panels in the early stage of the second discharge (t = 0.90 ms) continues to increase in comparison to the first pass forming. The large forming height mainly occurs in the rib center along the two paths.
At the end of the second pass forming (t = 1.60 ms), as shown in Figure 20d, along the Yf path, except for the flat panel, the forming height for the rest three panels decreases in comparison to the early stage of the second discharge in Figure 20c, which indicates that there is reverse deformations for these three panels. Along the Yl path, the forming height reduces in comparison to the height in the second discharge, which also indicates there is reverse deformation.
From Figure 20e, in the early stage of the discharge at the second station (t = 1.75 ms), along the Yf path, except for the flat panel, the forming height for the rest three panels increases in comparison to the second pass forming in Figure 20d, while the forming height of the flat panel decreases, which indicates that there is reverse deformations for the flat panel. Along the Yl path, the forming height in the rib center increased for all of the four panels in comparison to the second pass forming.
From Figure 20f, at the end of the second station forming (t = 2.45 ms), the forming height curves are very close to each other along the two different Y direction paths. Along the Yf path, the forming height of the four panels decreases in comparison to the early stage of the discharge at the current station in Figure 20e, which indicates that there is reverse deformations for all the panels. Along the Yl path, the forming height in the rib center increases significantly in comparison to the height in the early stage of discharge at the present station.
4.4. Comparison with Brake Forming
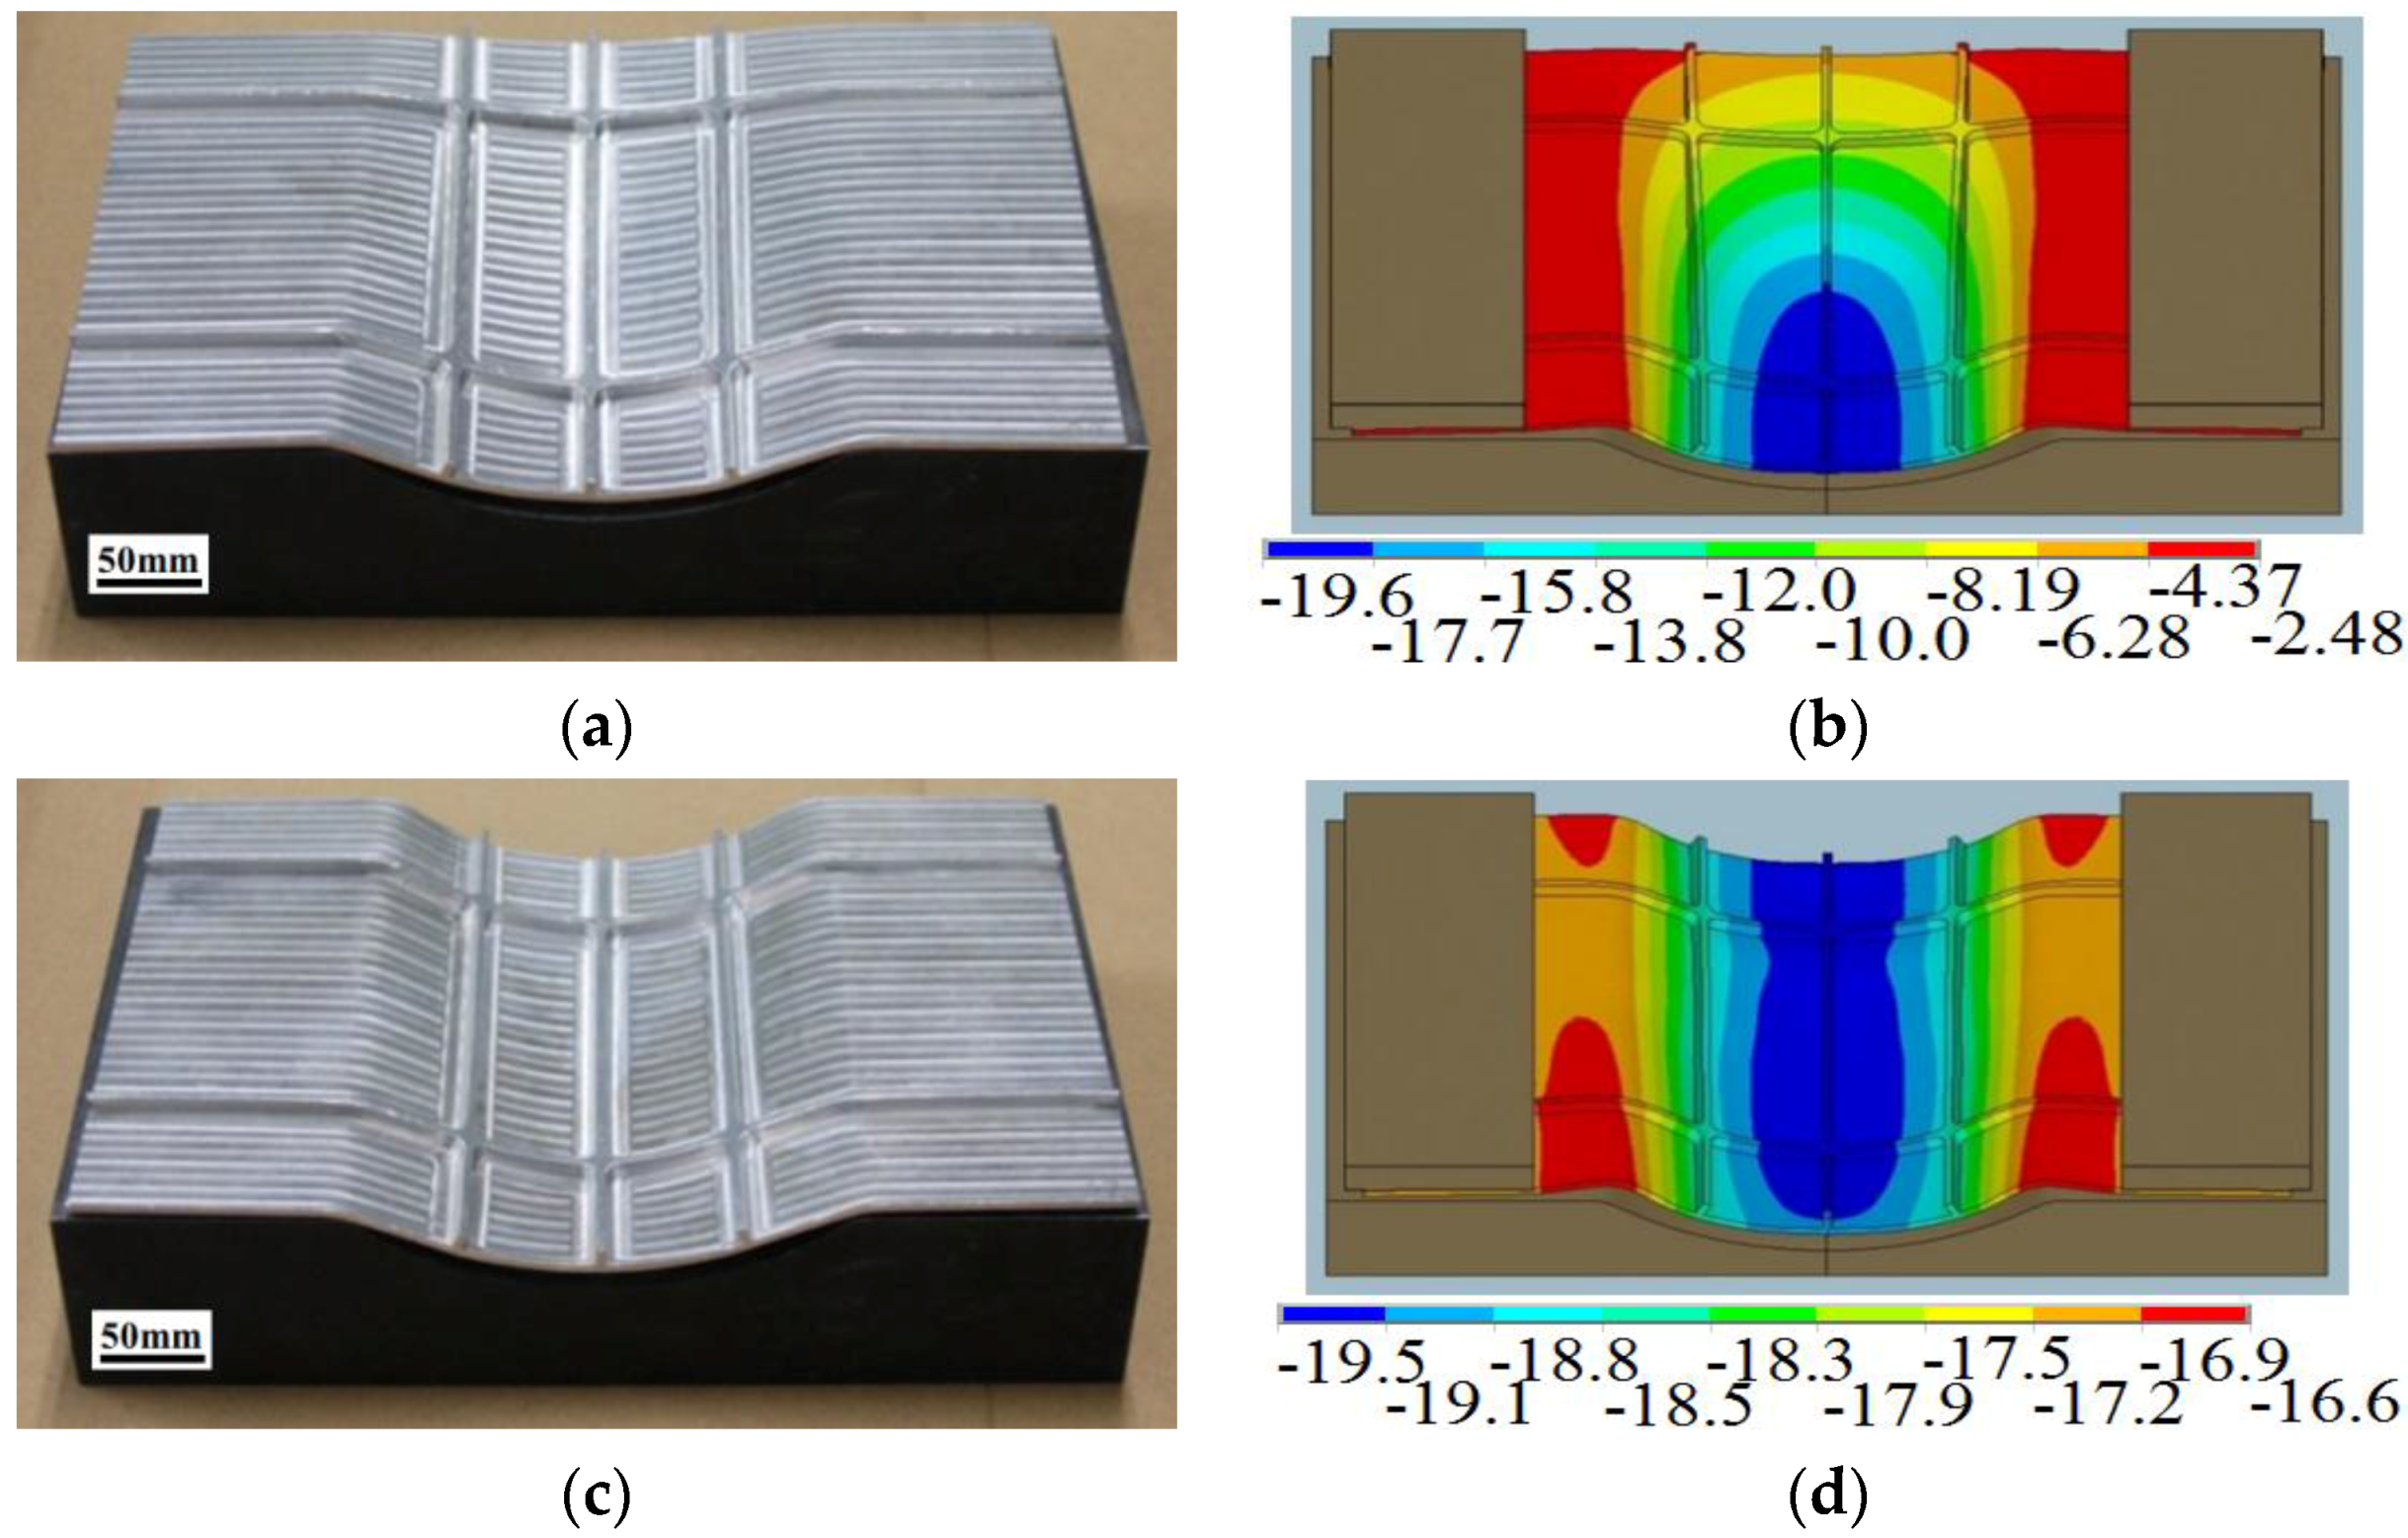
As mentioned in Section 1, the brake forming is widely used in the aircraft industry due to its high applicability. In this section, a comparison of the simulated results between one-pass brake forming (BF) and one-discharge electromagnetic forming (EMF) is conducted. The sizes of the grid-rib panel in Figure 2 are used, except for the height of the ribs. In this section, the height of the ribs is set to 10 mm in order to observe the instability more easily. In the EMF model, the input parameters, including geometric sizes of the coil, die and blank holder block, electromagnetic parameters, etc., are identical to those in Table 3 and Section 4; the coordinate of the initial station at the coil center is (0,0); the data in Figure 15 are used as the input current for the EMF model. In the BF model, the sizes of the die and blank holder block are similar to those in the one-discharge EMF process. The axis of the punch is perpendicular to the width direction of the grid-rib panel, as shown in Figure 21. From Figure 22, the Z direction displacements in the two forming processes reach the same value (11.4 mm) at the end of EMF.
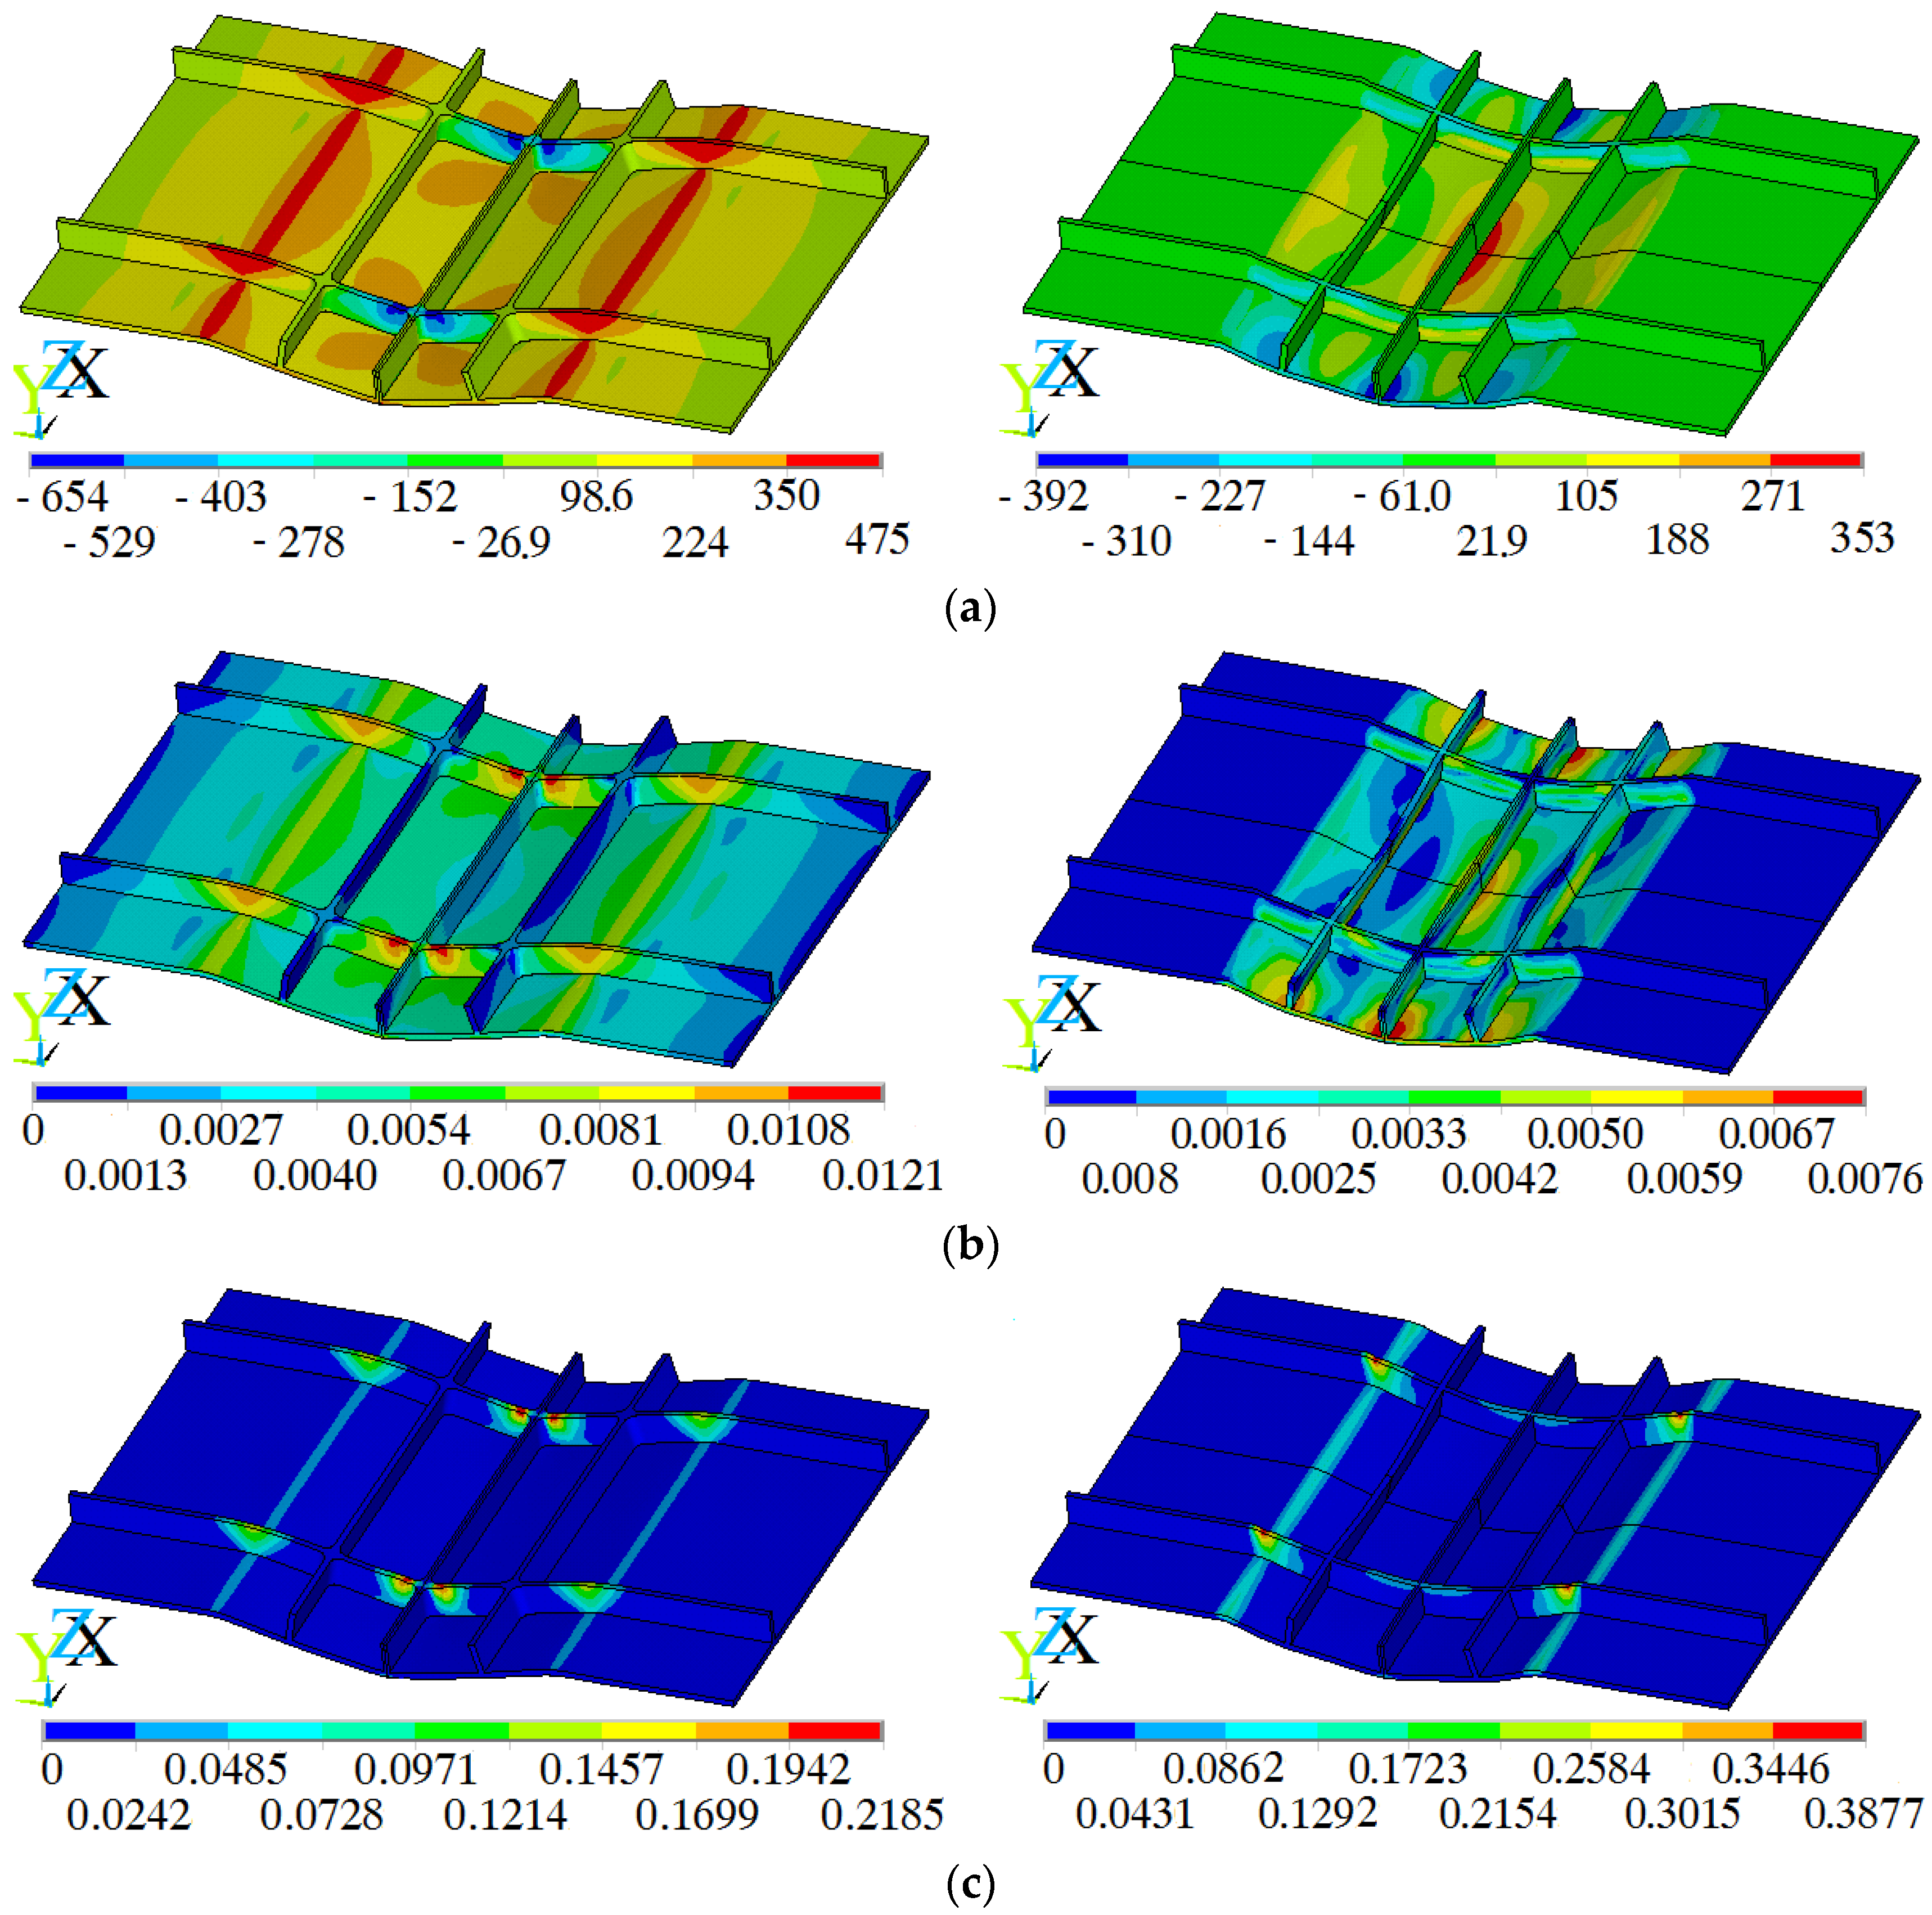
As shown in Figure 22a, the tensile and compressive normal stresses along the Y direction with BF are larger than those with EMF, especially for the compressive stress. The large compressive stress concentrates at the cross position of the center rib along the X-direction and Y-direction ribs, which means buckling is more inclined to occur with BF than with EMF. However, large tensile or compressive stress with EMF mainly concentrates in the web under the X-direction ribs. The buckling of the web can be prevented or weakened by the ribs. The distribution of the equivalent elastic strain in Figure 22b shows that the maximal elastic strain with BF is larger than that with EMF, indicating a smaller springback during the EMF process. Moreover, the elastic strain mainly concentrates in the ribs for the BF, more easily leading to springback than the EMF where the elastic strain concentrates in the web. Figure 22c shows that plastic strain mainly occurs at the cross position of the X and Y-direction ribs with BF; with EMF, the maximal plastic strain mainly concentrates in the transition fillet area, however, the plastic strain level of the cross ribs in the concerned deformation regions is obviously lower than that with BF.
Due to the characteristics of the distribution of stress and strain with BF as discussed above, buckling and springback are the main defects that limit the application of BF to form the complex parts, e.g., the stiffened panels with high ribs. Comparison of the distributions of stress and strain with the brake forming to those with the electromagnetic forming in Figure 22 implies that the advantages of smaller elastic strain in the web and plastic strain in the cross ribs make the electromagnetic forming technology competent for forming the stiffened panels.
5. Conclusions
The forming rules of the bi-directional stiffened panels with grid ribs during the EMIF process are studied by FE simulations aided by experiments. The distributions of the electromagnetic force, the forming velocity and the height are analyzed by the comparison among the grid-rib panel, flat panel and two uni-directional stiffened panels (the panel with the X-direction ribs, the panel with the Y-direction ribs). The main conclusions are as follows:
- (1)
- Different from traditional stiffened panels forming process, there are electromagnetic body forces loading in the ribs and webs simultaneously, which increases the forming ability of the stiffened panels. The large force of GP concentrates in both the two direction ribs, indicating the superposition effect of the two direction ribs.
- (2)
- The velocity distribution of the grid-rib panel is mainly affected by the X-direction ribs, next is the Y-direction ribs; the ribs along the bending direction and the flat panel promote the velocity attenuation while the ribs perpendicular to the bending direction prevent the velocity attenuation. For the grid-rib panel, it can be seen as the superposition of the X-direction ribs and the Y-direction ribs.
- (3)
- The decrease of the forming height at the free ends of the four panels at the end of each pass indicates that the mutual influence exists between the region undergoing deformation and the deformed or undeformed regions; the reverse velocity distribution exists for all the panels during the EMIF process, which mainly locates in the two free ends and thus is harmful for improving the forming height. Therefore, the reverse velocity should be avoided.
- (4)
- The comparison of the simulation results with the brake forming to those with the electromagnetic forming shows that EMF has a small elastic deformation in the web and a smaller plastic deformation in the ribs in the deformation region, which helps prevent or reduce the defects, such as springback and buckling that commonly happen in the traditional brake forming process.
Acknowledgments
This work is supported by the National Science Fund for Distinguished Young Scholars of China (51625505), the Key Program Project of the Joint Fund of Astronomy and National Science Foundation of China (Project U1537203) and the National Key Basic Research Program of China (973 Program, Grant No. 2011CB012804). The authors would also express thanks to the Wuhan National High Magnetic Field Center of Huazhong University of Science and Technology, for the help in the forming experiment. The author also wishes to thank Hongwei Li for his kindly help in improving this article.
Author Contributions
Jinqiang Tan performed the experiments, simulation and wrote this paper under the guidance of Mei Zhan; Shuai Liu assisted in performing experiments and analyzing simulation results.
Conflicts of Interest
The authors declare no conflict of interest.
References
- Munroe, J.; Wilkins, K.; Gruber, M. Integral Airframe Structures (IAS)—Validated Feasibility Study of Integrally Stiffened Metallic Fuselage Panels for Reducing Manufacturing Costs; Boeing Commercial Airplane Group: Seattle, WA, USA, 2000. [Google Scholar]
- Zhan, L.H.; Lin, J.G.; Dean, T.A. A review of the development of creep age forming: Experimentation, modeling and applications. Int. J. Mach. Tools Manuf. 2011, 51, 1–17. [Google Scholar] [CrossRef]
- Erbel, F.; Gardiner, S.; Campanile, G.; Surdon, G.; Venmans, M.; Prangnell, P. Ageformable panels for commercial aircraft. J. Aerosp. Eng. 2008, 222, 873–886. [Google Scholar]
- Ho, K.C.; Lin, J.G.; Dean, T.A. Modelling of springback in creep forming thick aluminum sheet. Int. J. Plast. 2004, 20, 733–754. [Google Scholar] [CrossRef]
- Lam, A.C.L.; Shi, Z.S.; Yang, H.L.; Wan, L.; Davies, C.M.; Lin, J.G.; Zhou, S.J. Creep-age forming AA2219 plates with different stiffener designs and pre-form age conditions: Experimental and finite element studies. J. Mater. Proc. Technol. 2015, 219, 155–163. [Google Scholar] [CrossRef]
- Ribeiro, F.C.; Marinho, E.P.; Inforzato, D.J.; Costa, P.R.; Batalha, G.F. Creep age forming: A short review of fundaments and applications. J. Achiev. Mater. Manuf. Eng. 2010, 43, 353–361. [Google Scholar]
- Yamada, Y.; Takahashi, T.; Ikeda, M.; Sugimoto, S.; Ohta, T. Development of shot peening for wing integral skin for continental business jets. Mitsubishi Heavy Ind. Tech. Rev. 2002, 39, 57–61. [Google Scholar]
- Miao, H.Y.; Demers, D.; Larose, S.; Perron, C.; Levesque, M. Experimental study of shot peening and stress peen forming. J. Mater. Proc. Technol. 2010, 210, 2089–2102. [Google Scholar] [CrossRef]
- Wang, X.F.; Guo, X.L.; Chen, G.N.; Silvanus, J. Remark of integral panel forming. Mod. Manuf. Technol. Equip. 2008, 3, 1–4. [Google Scholar]
- Lai, S.B.; Chen, T.X.; Yu, D.Y. Dynamic explicit analysis method for roll bending forming of integrally stiffened panel with rubber filler. Spacecr. Eng. 2012, 3, 41–47. [Google Scholar]
- Yan, Y.; Wan, M.; Wang, H.B.; Huang, L. Design and optimization of press bend forming path for producing aircraft integral panels with compound curvatures. Chin. J. Aeronaut. 2010, 23, 274–282. [Google Scholar]
- Yu, Y.; Wang, H.B.; Min, M. Prediction of stiffener buckling in press bend forming of integral panels. Trans. Nonferr. Met. Soc. China 2011, 21, 2459–2465. [Google Scholar]
- Yu, Y.; Wang, H.B.; Min, M. FEM modeling for press bend forming of doubly curved integrally stiffened aircraft panel. Trans. Nonferr. Met. Soc. China 2012, 22, s39–s47. [Google Scholar]
- Daehn, G.S. High Velocity Metal Forming. In ASM Handbook, Volume 14B, Metalworking: Sheet Forming; ASM International: Columbus, OH, USA, 2006; pp. 405–418. [Google Scholar]
- Psyk, V.; Risch, D.; Kinsey, B.L.; Tekkaya, A.E.; Kleiner, M. Electromagnetic forming—A review. J. Mater. Proc. Technol. 2011, 211, 787–829. [Google Scholar] [CrossRef]
- Cui, X.H.; Mo, J.H.; Li, J.J.; Zhao, J.; Xiao, S.J. Produce a large aluminum alloy sheet metal using electromagnetic-incremental (EM-IF) forming method: Experiment and Numerical simulation. In Proceedings of the 5th International Conference on High Speed Forming, Dortmund, Germany, 24–26 April 2012; pp. 59–70.
- Kamal, M.; Daehn, G.S. A uniform pressure electromagnetic actuator for forming flat sheets. J. Manuf. Sci. Eng. 2007, 129, 369–379. [Google Scholar] [CrossRef]
- Zhao, J.; Mo, J.H.; Cui, X.H.; Qiu, L. Research on numerical simulation and forming uniformity of electromagnetic incremental tube bulging. J. Plast. Eng. 2012, 19, 92–99. (In Chinese) [Google Scholar]
- Cui, X.H.; Mo, J.H.; Li, J.J.; Zhao, J.; Zhu, Y.; Huang, L.; Li, Z.W.; Zhong, K. Electromagnetic incremental forming (EMIF): A novel aluminum alloy sheet and tube forming technology. J. Mater. Proc. Technol. 2014, 214, 409–427. [Google Scholar] [CrossRef]
- Fenton, G.K.; Daehn, G.S. Modeling of electromagnetically formed sheet metal. J. Mater. Proc. Technol. 1998, 75, 6–16. [Google Scholar] [CrossRef]
- Ma, S.G.; Zhan, M.; Tan, J.Q.; Zhang, P.P. 3D sequentially coupled model to simulate electromagnetic sheet forming. J. Plast. Eng. 2012, 19, 54–58. (In Chinese) [Google Scholar]
- Oliveira, D.A.; Worswick, M. Electromagnetic forming of aluminium alloy sheet. J. Phys. IV France 2003, 110, 293–298. [Google Scholar] [CrossRef]
- Yu, H.P.; Li, C.F.; Deng, J.H. Sequential coupling simulation for electromagnetic mechanical tube compression by finite element analysis. J. Mater. Proc. Technol. 2009, 209, 707–713. [Google Scholar]
- Cui, X.H.; Mo, J.H.; Xiao, S.J.; Du, E.H. Numerical simulation of electromagnetic sheet bulging based on FEM. Int. J. Adv. Manuf. Technol. 2011, 57, 127–134. [Google Scholar] [CrossRef]
- ISO 209:2007. Aluminium and Aluminum Alloy—Chemical Composition; ISO: Geneva, Switzerland, 2007. [Google Scholar]
- Tan, J.Q.; Zhan, M.; Liu, S.; Huang, T.; Guo, J.; Yang, H. A modified Johnson-cook model for tensile flow behaviors of 7050-T7451 aluminum alloy at high strain rates. Mater. Sci. Eng. A 2015, 631, 214–219. [Google Scholar] [CrossRef]
- ISO 6892-1:2009. Metallic Materials-Tensile Testing. Part 1: Method of Test at Room Temperature; ISO: Geneva, Switzerland, 2009. [Google Scholar]
- Cao, Q.L.; Han, X.T.; Lai, Z.P.; Xiong, Q.; Zhang, X.; Chen, Q.; Xiao, H.X.; Li, L. Analysis and reduction of coil temperature rise in electromagnetic forming. J. Mater. Proc. Technol. 2015, 225, 185–194. [Google Scholar] [CrossRef]
- Liu, D.H.; Zhou, W.H.; Li, C.F. Influence of body force effect of the pulsed magnetic forces of the dynamic forming limits of AA5052 sheets. J. Plast Eng. 2013, 6, 62–67. [Google Scholar]
- Neugebauer, R.; Bouzakis, K.D.; Denkena, B.; Klocke, F.; Sterzing, A.; Tekkaya, A.E.; Wertheim, R. Velocity effects in metal forming and machining processes. CIRP Ann. Manuf. Technol. 2011, 2, 627–650. [Google Scholar] [CrossRef]
Figure 1.
True stress–strain of 2A12-T4 alloy at various strain rates.

Figure 2.
The grid-rib panel: sizes (a); and the experimental blank sample (b).

Figure 3.
Forming equipment during electromagnetic incremental forming (EMIF) of stiffened panels.

Figure 4.
The single curvature die.

Figure 5.
Structure schematic diagram of the flat spiral coil.

Figure 6.
Defined coordinate system of the workpiece.

Figure 7.
Flowchart of FE (finite element) model of EMIF for stiffened panels.

Figure 8.
The multi-physics coupling model of the grid-rib panel during EMIF: (a) electromagnetic field model; (b) forming model; and (c) springback model.
Figure 8.
The multi-physics coupling model of the grid-rib panel during EMIF: (a) electromagnetic field model; (b) forming model; and (c) springback model.


Figure 9.
Air meshes at different moments: (a) initial; (b) deformation after the first station; and (c) deformation after the second station.
Figure 9.
Air meshes at different moments: (a) initial; (b) deformation after the first station; and (c) deformation after the second station.

Figure 10.
Ratio of hourglass energy to total energy.

Figure 11.
The defined paths of the grid-rib panel: (a) from the top view of the panel, 1/2 model shown only; and (b) from the bottom view of the panel.
Figure 11.
The defined paths of the grid-rib panel: (a) from the top view of the panel, 1/2 model shown only; and (b) from the bottom view of the panel.

Figure 12.
Profile comparisons between the experimental and simulated results: (a,b) experimental and simulated results after station A, respectively; and (c,d) experimental and simulated results after station C, respectively. The units for (b) and (d) are both millimeters.
Figure 12.
Profile comparisons between the experimental and simulated results: (a,b) experimental and simulated results after station A, respectively; and (c,d) experimental and simulated results after station C, respectively. The units for (b) and (d) are both millimeters.

Figure 13.
Comparison of Z-displacement between experimental and simulated results along X center web-bottom path (a,c) and Y center web-bottom path (b,d): (a,b) after the first station; and (c,d) after the second station.
Figure 13.
Comparison of Z-displacement between experimental and simulated results along X center web-bottom path (a,c) and Y center web-bottom path (b,d): (a,b) after the first station; and (c,d) after the second station.


Figure 14.
Comparison of web thickness between experimental and simulated results along: X center web-bottom path (a); and Y center web-bottom path (b).
Figure 14.
Comparison of web thickness between experimental and simulated results along: X center web-bottom path (a); and Y center web-bottom path (b).

Figure 15.
Experimental and simulated coil current data ((a) U = 9.9 kV, C = 80 μF; and (b) U = 12 kV, C = 80 μF).
Figure 15.
Experimental and simulated coil current data ((a) U = 9.9 kV, C = 80 μF; and (b) U = 12 kV, C = 80 μF).
Figure 16.
Change of central node’s: displacement (a); and velocity (b) at different U (C = 320 μF).
Figure 16.
Change of central node’s: displacement (a); and velocity (b) at different U (C = 320 μF).

Figure 17.
Electromagnetic force (N) distribution in four panels in the first discharge during EMIF: (a) Flat panel (FP); (b) X-rib panel (XP); (c) Y-rib panel (YP); and (d) Grid-rib panel (GP).
Figure 17.
Electromagnetic force (N) distribution in four panels in the first discharge during EMIF: (a) Flat panel (FP); (b) X-rib panel (XP); (c) Y-rib panel (YP); and (d) Grid-rib panel (GP).

Figure 18.
Z-velocity (m/s) distribution of: flat panel (a); X-rib panel (b); Y-rib panel (c); and grid-rib panel (d) during EMIF.
Figure 18.
Z-velocity (m/s) distribution of: flat panel (a); X-rib panel (b); Y-rib panel (c); and grid-rib panel (d) during EMIF.

Figure 19.
Z direction height distribution along X direction paths of four panels during EMIF: (a) t = 0.15 ms; (b) t = 0.75 ms; (c) t = 0.90 ms; (d) t = 1.60 ms; (e) t = 1.75 ms; and (f) t = 2.45 ms. Xc and Xs represent X center web-bottom path and X side web-bottom path, respectively.
Figure 19.
Z direction height distribution along X direction paths of four panels during EMIF: (a) t = 0.15 ms; (b) t = 0.75 ms; (c) t = 0.90 ms; (d) t = 1.60 ms; (e) t = 1.75 ms; and (f) t = 2.45 ms. Xc and Xs represent X center web-bottom path and X side web-bottom path, respectively.

Figure 20.
Z direction height distribution along Y direction paths of four panels during EMIF: (a) t = 0.15 ms; (b) t = 0.75 ms; (c) t = 0.90 ms; (d) t = 1.60 ms; (e) t = 1.75 ms; and (f) t = 2.45 ms. Yf and Yl represent Y former web-bottom path and Y latter web-bottom path, respectively.
Figure 20.
Z direction height distribution along Y direction paths of four panels during EMIF: (a) t = 0.15 ms; (b) t = 0.75 ms; (c) t = 0.90 ms; (d) t = 1.60 ms; (e) t = 1.75 ms; and (f) t = 2.45 ms. Yf and Yl represent Y former web-bottom path and Y latter web-bottom path, respectively.

Figure 21.
Geometric model of the brake forming (BF) process.

Figure 22.
Comparison of simulated results between BF (left) and EMF (right): (a) σy (MPa); (b) equivalent elastic strain; and (c) equivalent plastic strain.
Figure 22.
Comparison of simulated results between BF (left) and EMF (right): (a) σy (MPa); (b) equivalent elastic strain; and (c) equivalent plastic strain.


| Parameters | Value | Parameters | Value | Parameters | Value |
|---|---|---|---|---|---|
| Rectangular section | 2 mm × 4 mm | Layer gap h | 0.4 mm | Turn gap d5 | 0.95 mm |
| Total turns N | 30 | Turn gap d1 | 1.8 mm | Turn gap d6 | 0.95 mm |
| Layers | 3 | Turn gap d2 | 1.8 mm | Turn gap d7 | 0.7 mm |
| Inner radius R | 7 mm | Turn gap d3 | 1.7 mm | Turn gap d8 | 0.7 mm |
| Height H | 12.8 mm | Turn gap d4 | 1.2 mm | Turn gap d9 | 0.7 mm |
| Blank Form | Rib Height (mm) | Rib Width (mm) | Web Thickness (mm) |
|---|---|---|---|
| Flat panel (FP) | 0 | 0 | 2 |
| X-rib panel (XP) | 4 | 2 | 2 |
| Y-rib panel (YP) | 4 | 2 | 2 |
| Grid-rib panel (GP) | 4 | 2 | 2 |
Table 3.
System parameters and forming conditions during electromagnetic incremental forming for stiffened panels (EMIF-SP).
| Materials & Boundary Condition | Parameter | Value |
|---|---|---|
| Air Coil (copper) | Relative permeability Relative permeability Resistance Inductance Reference resistivity Density Elastic modulus Poisson’s ratio | 1 1 20 mΩ 15 μH 1.7 × 10⁻⁸ Ω·m 8.9 × 10³ kg/m3 90 GPa 0.33 |
| Panel (2A12-T4 Al alloy) | Relative permeability Reference resistivity Density Elastic modulus Poisson’s ratio Yield strength Ultimate strength | 1 3 × 10⁻⁸ Ω·m 2.77 × 10³ kg/m3 69 GPa 0.31 284 MPa 495 MPa |
| Die/Blank holder block (42CrMo4) | Relative permeability Density Elastic modulus Poisson’s ratio | 1 7.85 × 10³ kg/m3 206 GPa 0.3 |
| Circuit line | Line resistance Line inductance | 25 mΩ 6.5 μH |
| Contact set (Blank holder block-Panel) | Static friction factor Dynamic friction factor | 0.17 0.15 |
| Contact set (Die-Panel) | Static friction factor Dynamic friction factor | 0.17 0.15 |
| Discharge Capacity (μF) | X Coordinate at the 1st Pass (mm) | Voltage at the 1st Pass (kV) | X Coordinate at the 2nd Pass (mm) | Voltage at the 2nd Pass (kV) | X Coordinate at the 3rd Pass (mm) | Voltage at the 3rd Pass (kV) |
|---|---|---|---|---|---|---|
| 80 | −20 | 9.9 | −20 | 12 | +20 | 12 |
© 2016 by the authors; licensee MDPI, Basel, Switzerland. This article is an open access article distributed under the terms and conditions of the Creative Commons Attribution (CC-BY) license (http://creativecommons.org/licenses/by/4.0/).
Share and Cite
MDPI and ACS Style
Tan, J.; Zhan, M.; Liu, S. Guideline for Forming Stiffened Panels by Using the Electromagnetic Forces. Metals 2016, 6, 267. https://doi.org/10.3390/met6110267
AMA Style
Tan J, Zhan M, Liu S. Guideline for Forming Stiffened Panels by Using the Electromagnetic Forces. Metals. 2016; 6(11):267. https://doi.org/10.3390/met6110267
Chicago/Turabian StyleTan, Jinqiang, Mei Zhan, and Shuai Liu. 2016. "Guideline for Forming Stiffened Panels by Using the Electromagnetic Forces" Metals 6, no. 11: 267. https://doi.org/10.3390/met6110267
Note that from the first issue of 2016, this journal uses article numbers instead of page numbers. See further details here.