Article

Crack Detection Method Applied to 3D Computed Tomography Images of Baked Carbon Anodes

1
Département de Génie Civil, Aluminium Research Centre—REGAL, Université Laval, Québec, QC G1V 0A6, Canada
2
Département de Génie Chimique, Aluminium Research Centre—REGAL, Université Laval, Québec, QC G1V 0A6, Canada
3
Département de Génie des Mines, de la Métallurgie et des Matériaux, Aluminium Research Centre—REGAL, Université Laval, Québec, QC G1V 0A6, Canada
4
Alcoa Primary Metals, Alcoa Technical Center, Alcoa Center, PA 15069-0001, USA
*
Author to whom correspondence should be addressed.
Metals 2016, 6(11), 272; https://doi.org/10.3390/met6110272
Submission received: 13 September 2016 / Revised: 28 October 2016 / Accepted: 3 November 2016 / Published: 9 November 2016

Abstract

:
Carbon anodes used in the aluminium industry were imaged through destructive and non-destructive testing (NDT) methods. For the latter case, computed tomography (CT), which has previously been used to map the 3D apparent density distribution, was extended to crack detection. Previous work has shown how to overcome technical hurdles related to crack detection by using percolation-based algorithms operating on low-resolution images of full-scale baked carbon anodes. The previous application to 2D images was extended here to the 3D case. The crack detection algorithm has been performed on anode slices containing several independent macro cracks with different morphologies.

Graphical Abstract

1. Introduction

Of all materials used in an electrolysis cell, only carbon anodes (approximately 30 anodes per cell) could be considered consumable items requiring regular replacement. These anodes are consumed during electrolysis and replaced after approximately 26 days of operation, depending on a number of factors including cell technology. Hence a large number of anodes, and consequently a large quantity of raw materials, are required to operate a plant. To stay economically competitive and considering the large amount of anodes consumed each year, aluminium producers need to reduce the cost of their anode production. Part of the solution is to reduce the cost of the raw materials. The drawback is that producers now have to deal with continuous changes in raw material properties due to shortages of traditional quality anode coke [1]. This results in wide variations in the physical properties of baked anodes and could lead, e.g., to electrical resistivity variations [2,3] and anode cracking [4,5,6]. This latter type of defect is generally related with green anode production processes (mixing, forming and cooling) or baking processes (release of induced stresses, pitch devolatilisation and final baking temperature) [6] and could lead, though not exclusively, to an increase of energy consumption (increase of electrical resistivity) during the electrolysis process or ultimately to anode failure (corner, vertical or horizontal cracks) [6].
One solution to minimize the effect of variations in raw materials properties is to use numerical simulation methods to model the manufacturing process and/or to improve the process control. The objective is to predict the anode characteristics, to control the process parameters more efficiently, and to take corrective actions before the anode is produced. To achieve this goal, a series of experimental data must be collected first in order to validate the models, particularly for crack quantification.
Several image processing techniques are available for crack detection and have been developed and/or used by several authors [7,8,9]. Torok et al. [9] reviewed the 2D and 3D techniques applied for inspection of building materials and highlighted that most techniques have been applied for the 2D case. 3D image generation techniques, such as X-ray computed tomography, have opened the way for the development of 3D crack detection techniques. These 3D techniques are generally based on region growing or template matching methods [10]. Considering the wide variety of 3D crack patterns in carbon anodes (no single template would be appropriate), the former technique has been chosen for its relative simplicity. Different region growth algorithms are available in the literature [8,10]. However, few of them are applicable for the 3D case as highlighted by Ehrig et al. [10], who investigated two different region growth techniques: percolation and Hessian-driven percolation [11]. Ehrig et al. [10] also argued that the percolation method could be too computer-time consuming and that the Hessian-driven percolation algorithm [11] is the most suited method for crack identification except in the case of thin cracks (crack of few pixels in width).
In the present case, an algorithm able to identify cracks a few pixels in width is needed, as explained later in Section 2.1. Therefore, the region growing technique based on the liquid permeation model, namely the percolation method, has been investigated as an alternative to Hessian-driven percolation. The basic idea behind a percolation algorithm is to fill a crack with pixels/voxels as water would fill it from a starting point. A lot of effort has already been put into increasing the efficiency of the percolation algorithm [7,12,13,14]. This method has both advantages and disadvantages. In addition to its simplicity, the method has the potential to overcome an important hurdle in this investigation, i.e., the low resolution of the images. The main downside is that the chosen method proposed by Yamaguchi and Hashimoto [12,13] has been improved only for 2D images [7,12,13,14]. Therefore, an extension of the percolation algorithm to the 3D case was needed and has been developed. The proposed algorithm has then been used to identify cracks in various industrial anodes samples.

2. Materials and Methods

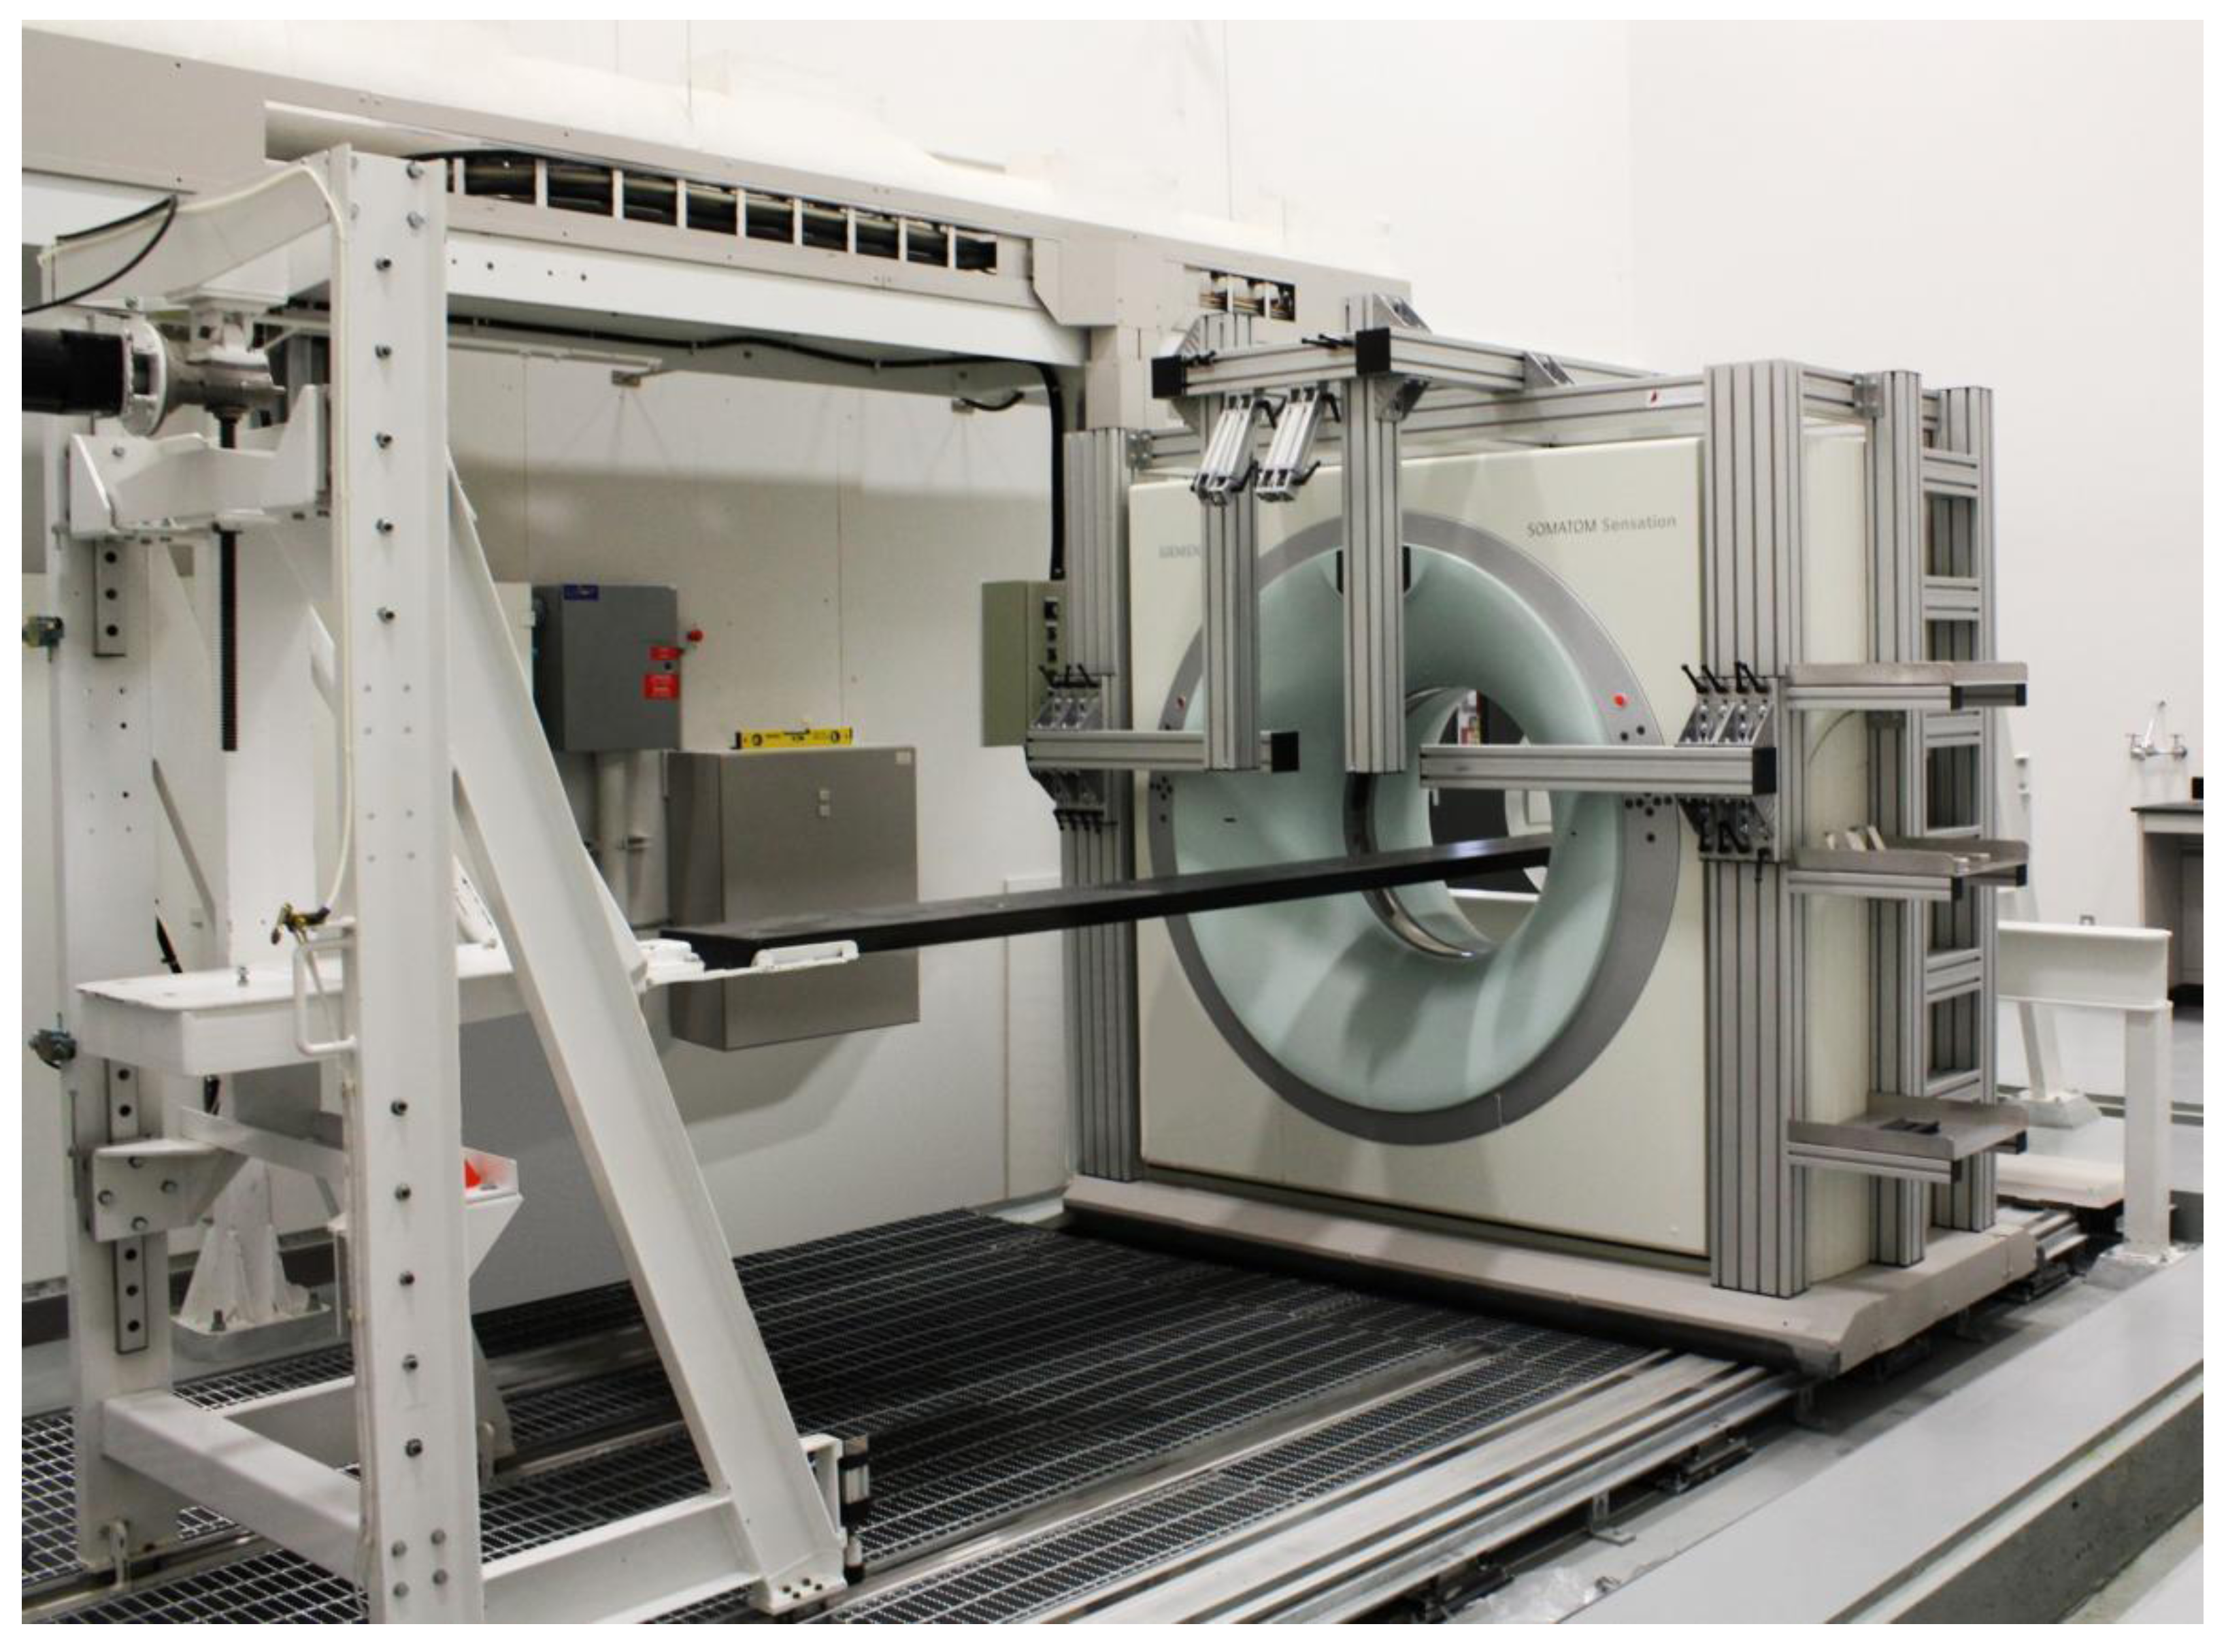
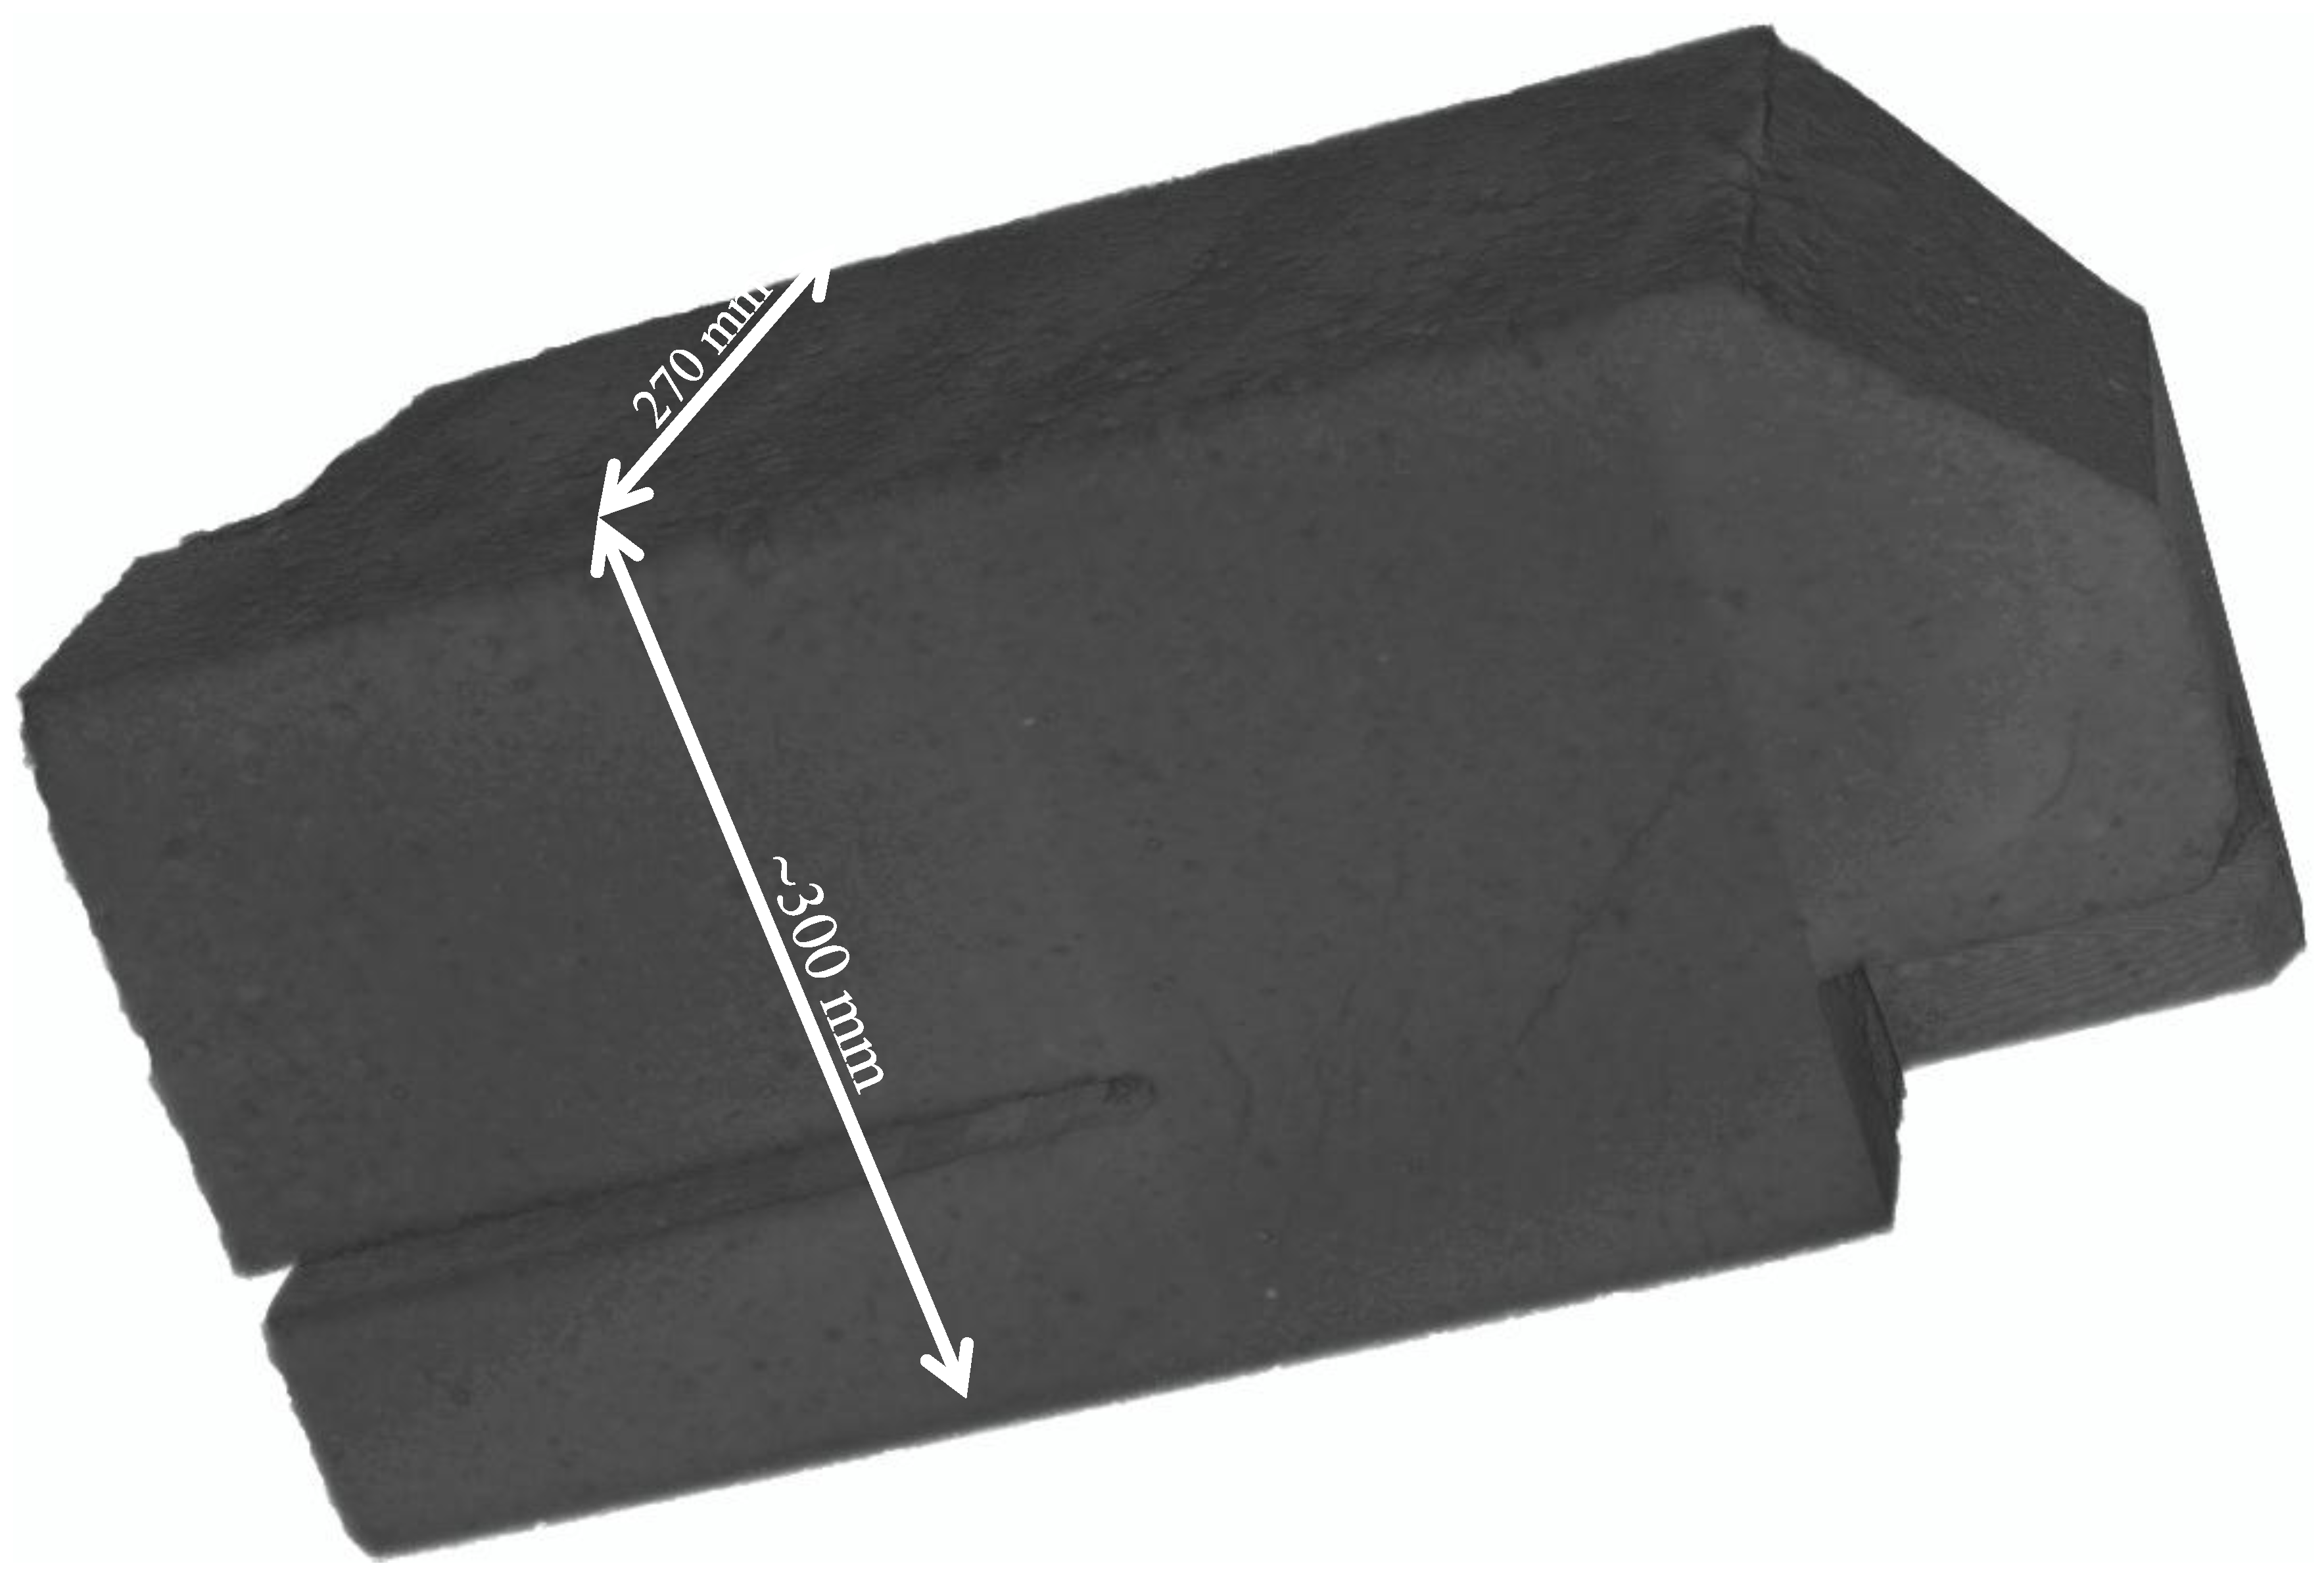
2.1. X-ray Computed Tomography

X-ray computed tomography has been used for decades now in science to reveal the internal structures of objects from living beings to engineering materials (e.g., [15,16,17,18]) including the carbon materials used in the aluminium production industry [19,20,21,22,23]. Its main advantage is that it is a non-destructive technique. Thus, it can preserve object integrity such as cracks inside materials. Hence, carbon anode images have been obtained by scanning a whole baked anode block using computed tomography (3D non-destructive testing (NDT) imaging tool). Unfortunately, the scanning area of the X-ray apparatus used in this investigation (Siemens Somatom Sensation 64, maximum resolution of 0.09 × 0.04 × 0.09 mm3) is limited to objects of less than 40 × 40 mm2 cross-section, which is smaller than the anode section (Figure 1). The anode block was thus sliced in 52 pieces of 50 mm thick [4] as illustrated in Figure 2. Care was taken to ensure that the cracks of interest were not affected by the slicing operation. Furthermore, in order to implement the method in the industry, cost analysis (scanning and volume reconstruction times) had to be kept low. Hence, image resolution had to be adapted to the object size [24] resulting in a voxel (volumetric pixel) resolution of 0.7 × 0.6 × 0.7 mm3. This means that most visible cracks (1–2 mm width) have a width of 2–3 voxels only. Using this resolution, a typical anode slice contains approximately 70 × 468 × 1068 voxels (approximately 35 million voxels). Therefore, contrast between most anode cracks (1–2 mm width) and background carbon is low.

2.2. 2D Algorithm Overview
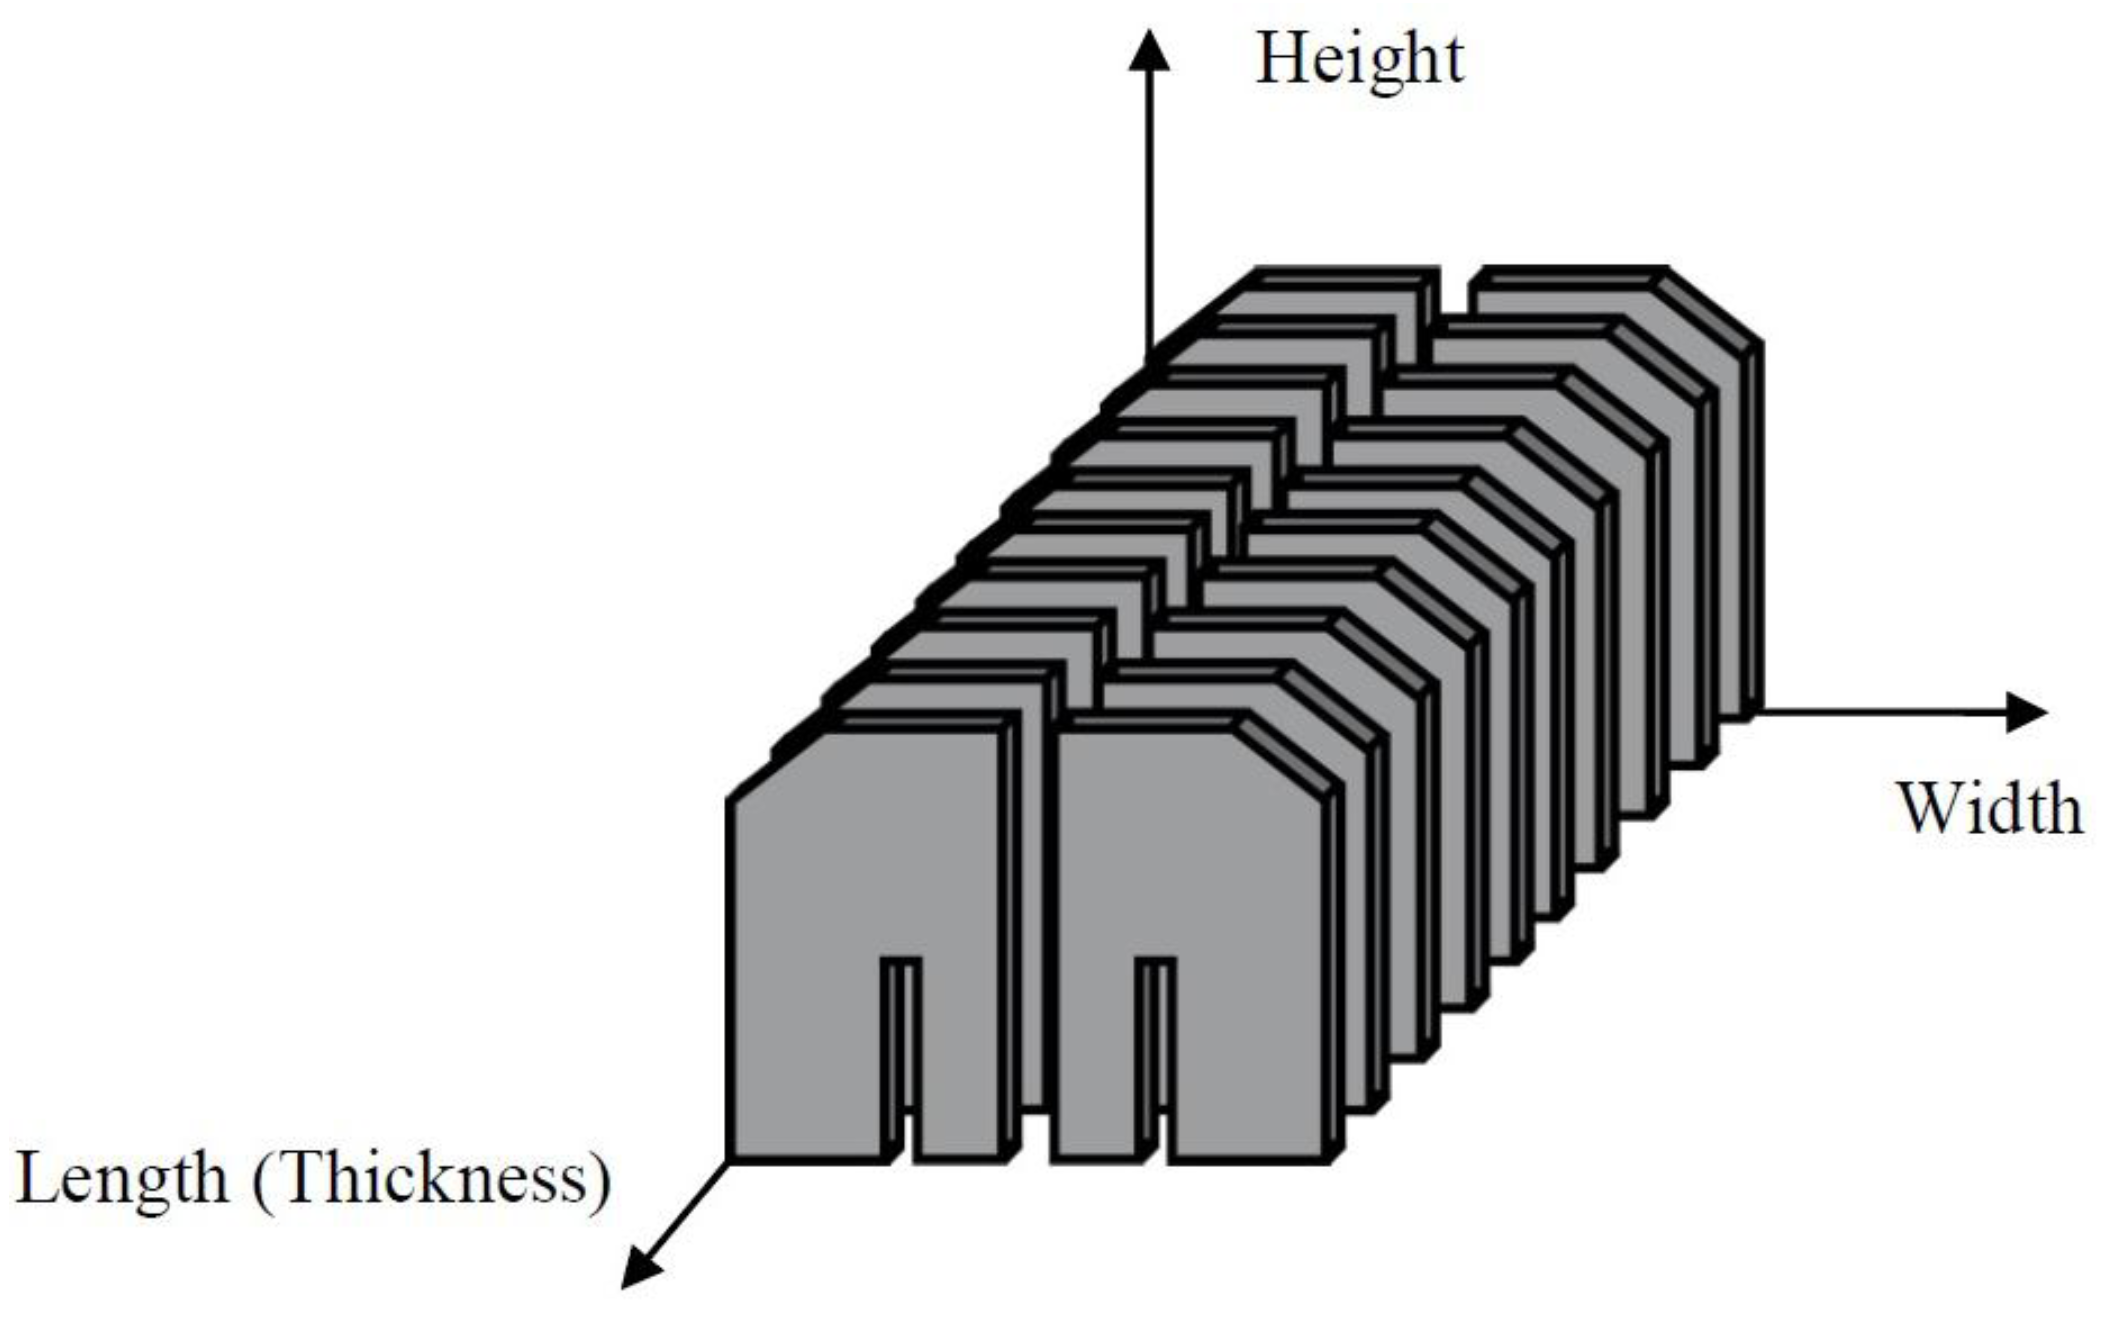
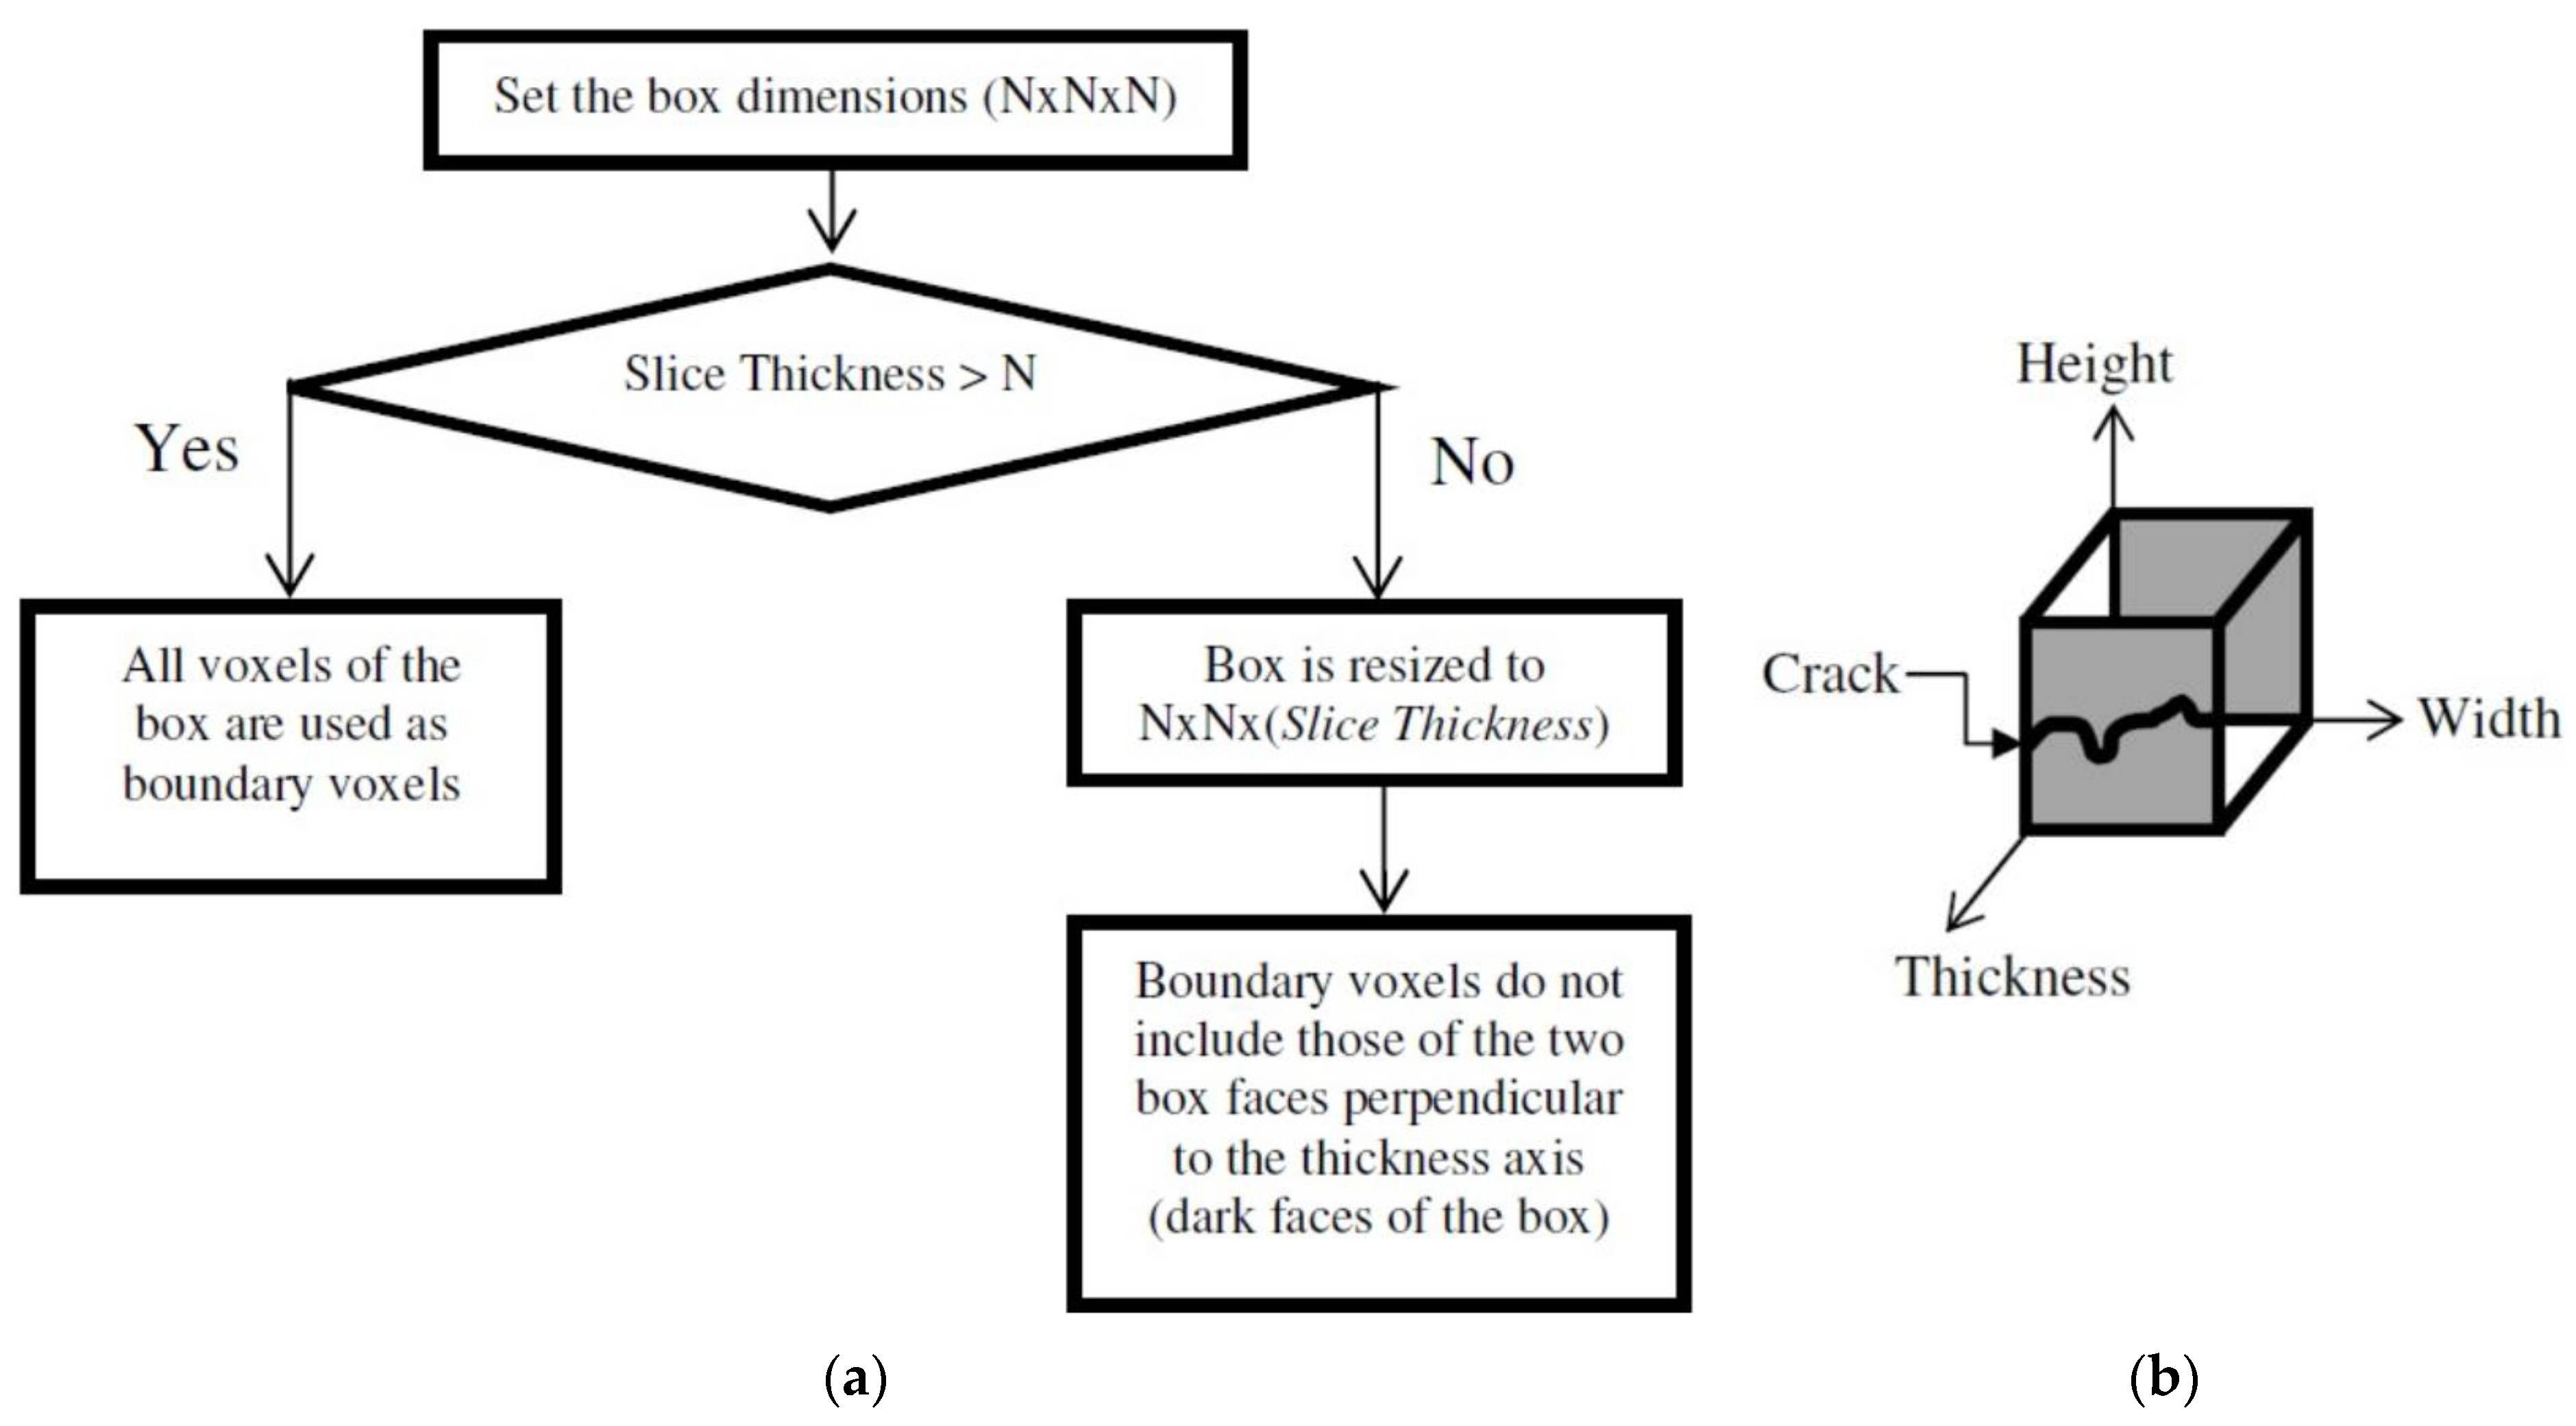
The percolation method proposed by Yamaguchi et al. [12] is similar to a scalable window processing and takes into account the connectivity of the percolated pixels. The method requires setting a local investigation window containing the focal pixel, or seed pixel. A seed voxel is a voxel within a crack that is used as a starting point for the algorithm to fully investigate the crack boundaries. This seed pixel is then percolated and some features of the percolated region are used to determine if the resulting cluster is a crack or not. To speed up the method, which was otherwise slower than conventional methods, Yamagachi et al. [12] introduced two processes preventing useless percolation. First, if the seed pixel is located in the background, i.e., not in a crack or in a pore, the percolation ends. The percolation also ends after reaching the boundaries of the local window if the circularity of the percolated region is higher than a given threshold.
Several modifications have been applied to the percolation process to improve the 2D percolation [7,12,13,14]. The scheme of the resulting algorithm and definition of all parameters can be found in Yamaguchi et al. [14]. The proposed algorithm is a two steps process applied to each pixel candidate (seed pixel), which are obtained using a pre-processing technique [7,24]. In the first step, percolation is performed until it reaches the boundary of a predetermined investigation window (N × N pixels). If the geometrical constraint is satisfied (i.e., circularity or roundness of the percolated region less than a specified threshold Fc), the percolation moves to the second step. The second phase of the algorithm consists of increasing incrementally the investigation window size up to a maximum size of M pixels or until the circularity reaches the threshold. In any case, only a percolated region with circularity less than the specified threshold will be identified as a crack.

2.3. 3D Algorithm

The 3D algorithm developed in Matlab® is a direct extension of the 2D algorithm. To extend the 2D algorithm to the 3D case, three challenges had to be overcome. The first was to apply the percolation by inspecting the 3D neighbor voxels (26 neighbors for each voxel) of all the voxels included in the Dp region of interest instead of the 2D neighbor pixels (8 neighbors for each pixel). This part was relatively straightforward. The second was to define an investigation box (3D) instead of a window (2D). The box faces (or window sides) are used to define the boundary voxels that will cause processing to stop when the percolation reaches those limits. As for the window, the box dimensions must be representative of the typical crack length (approximately 5–15 cm in the case of carbon anodes) embedded in the investigated sample [14]. The box must also be able to adapt to the case study. In the present case, the samples consist of anode slices having a thickness of 50 mm (approximately 80 voxels). Moreover, cracks are parallel to the thickness/width plane and are, in most cases, much longer than the slice thickness (i.e., most cracks propagate through 2 to 4 anode slices).
The investigation box thus proposed is shown in Figure 3. If the investigation box is fully embedded in the sample volume then the six faces of the box are considered boundary voxels. Otherwise, if the investigation box is not completely embedded in the sample volume (i.e., box thickness is larger than the sample volume thickness) then the box’s dimensions are modified to fit in the sample volume by removing boundary voxels. Thus only four faces remains in the list of boundary voxels. As shown in Figure 3, if the slice thickness is smaller than the investigation box, the voxels of the dark faces of the box shown in Figure 3b are removed from the boundary voxels to avoid ending the process prematurely. Similarly to the 2D percolation process, the investigation box dimensions increases iteratively in the second phase, e.g., N × N × N → (N + 2) × (N + 2) × (N + 2). The flowchart shown in Figure 3 is also applied during the iteration process.
The last challenge was to define a relevant 3D crack criterion (e.g., circularity in 2D). A three-dimensional object can be classified using several morphological features [25,26]. At this stage, it was however unnecessary to do so. Only a threshold value applied to a defined parameter is needed to distinguish a crack from a pore (or any other structures). The selected parameter was the sphericity Ψ (Equation (1)). It is defined as the ratio of the surface area of a sphere with the same volume Vp as the given region of interest to the surface area (Ap) of the region of interest [27]. In the present case, anode macro cracks are relatively thin compared to their length and width. Hence, the sphericity was found to be a sufficient criterion for the 3D algorithm.
Ψ = π 1 / 3 ( 6 V p ) 2 / 3 A p

3. Results and Discussion
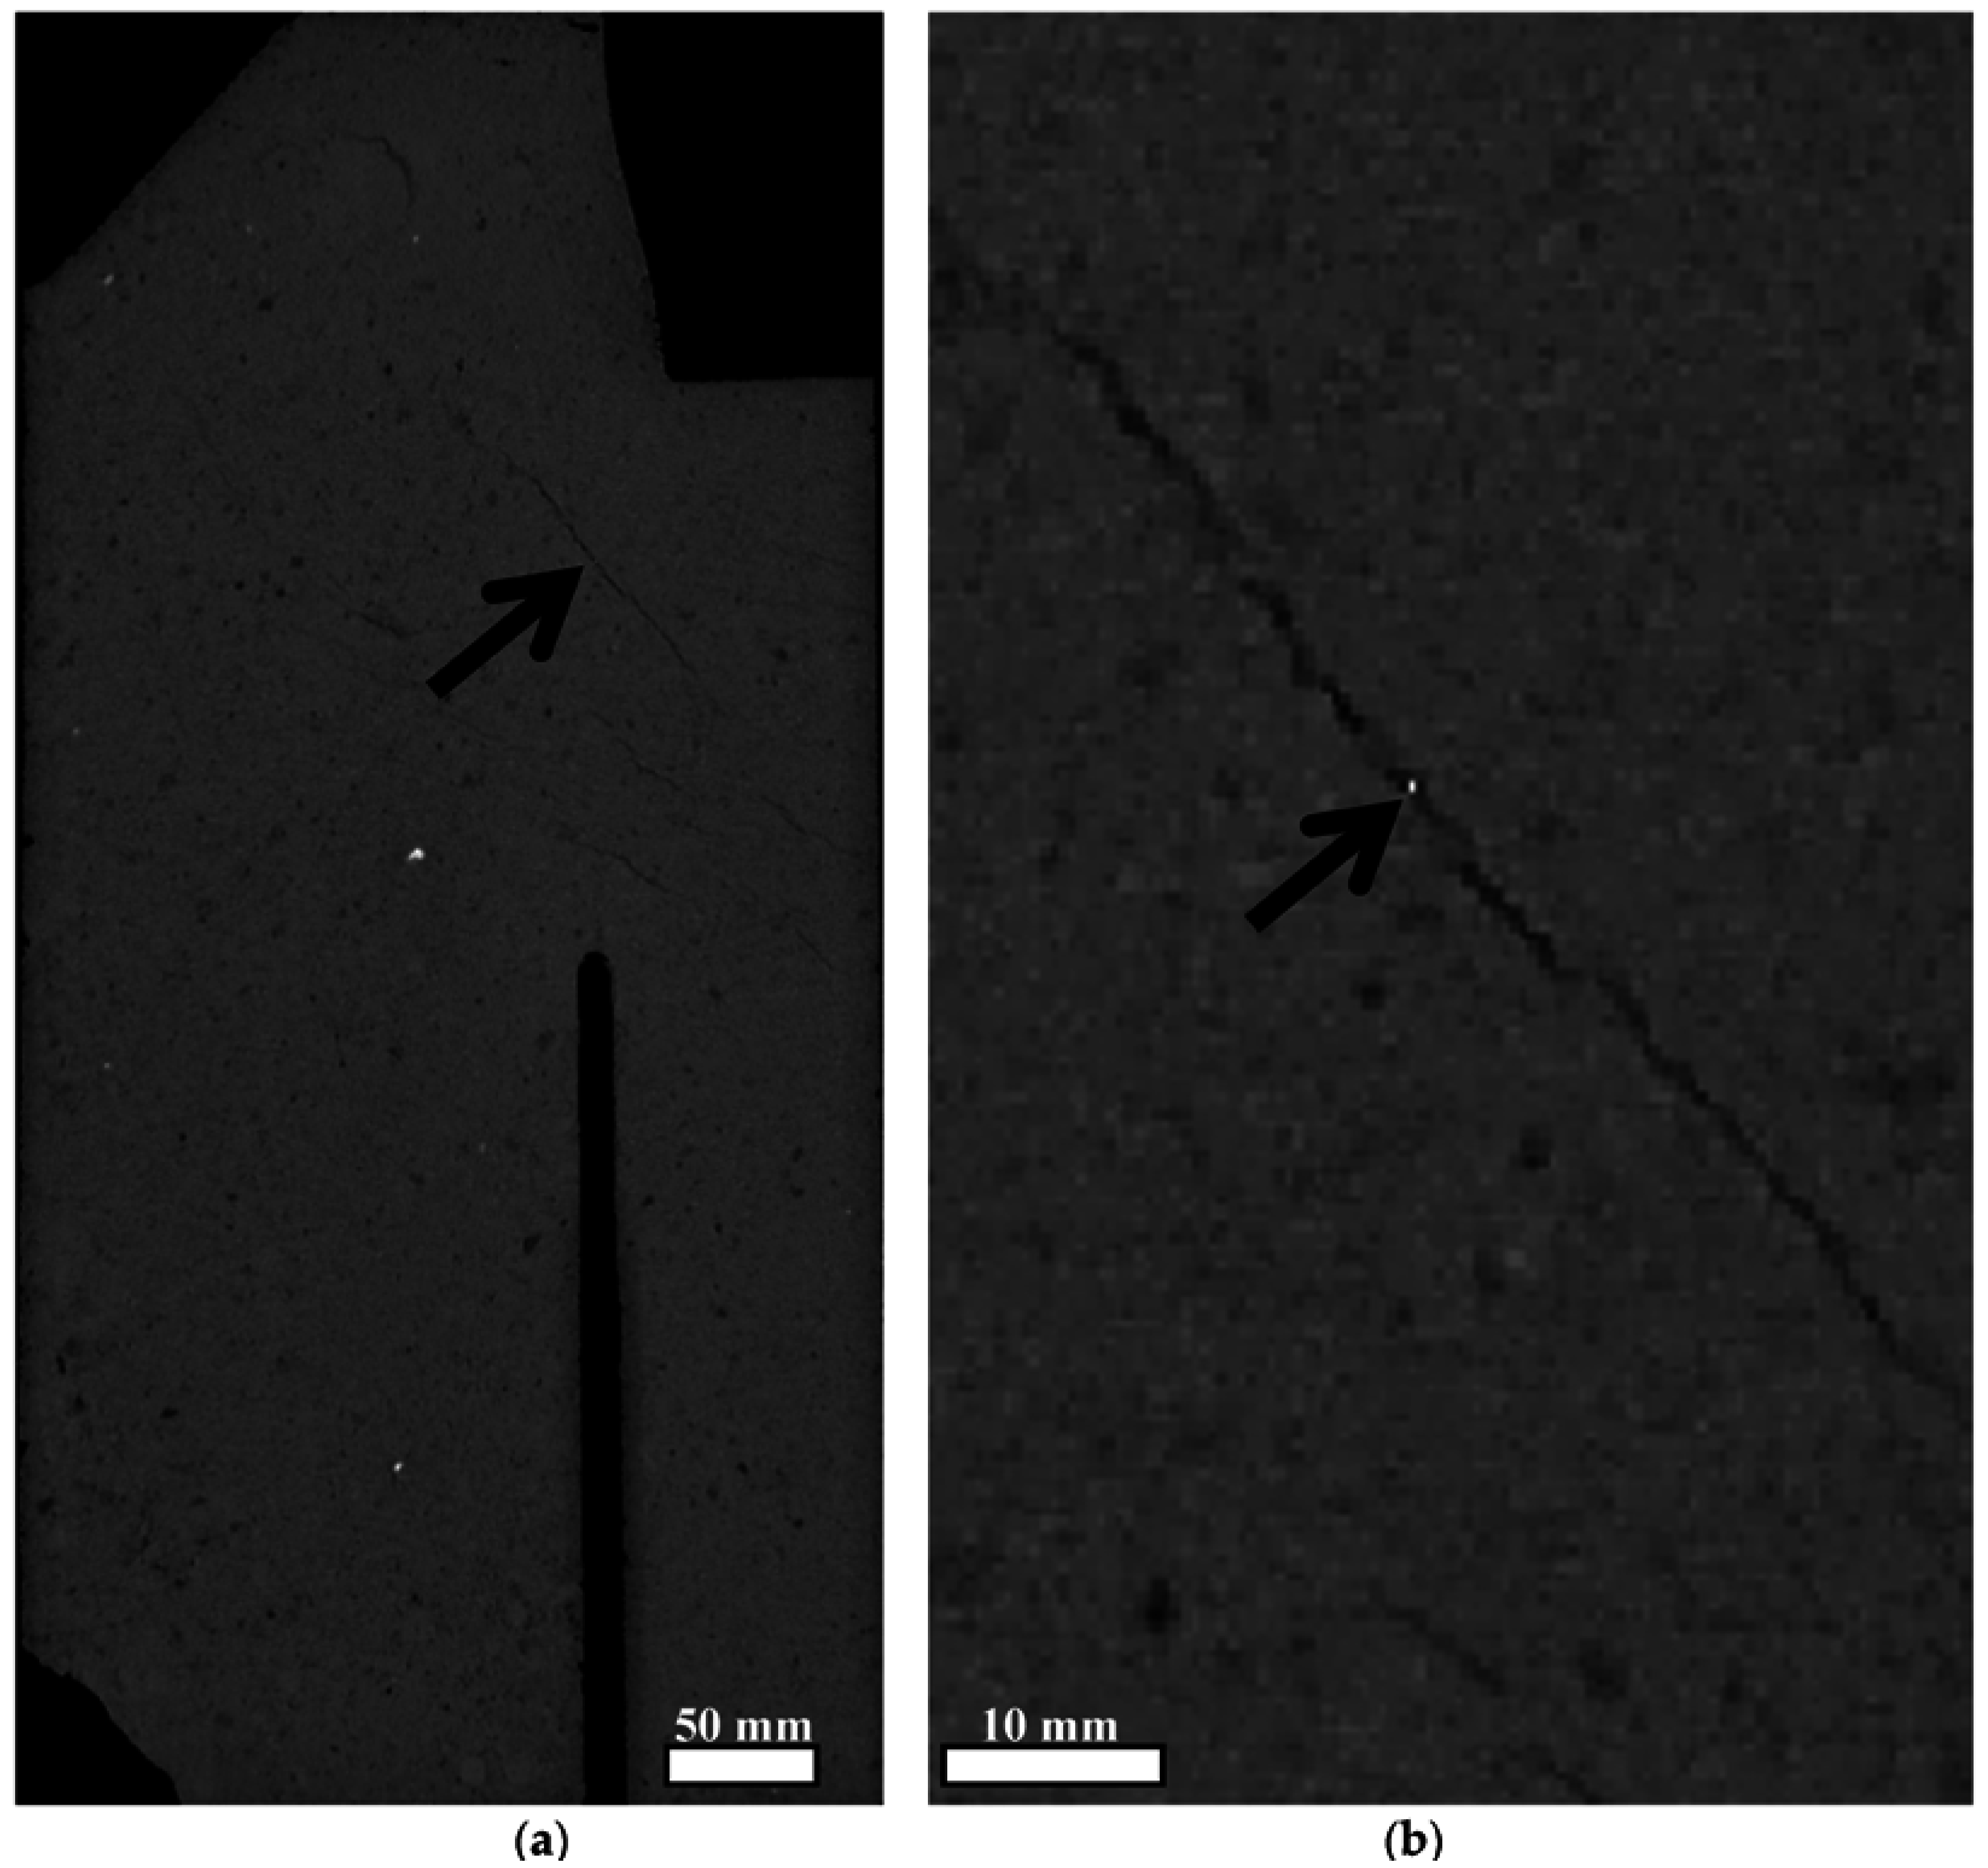
As mentioned previously, carbon anodes can exhibit different crack patterns [6]. In the present study cracks related to baking have been used to test the proposed 3D crack detection algorithm. Those cracks are generally correlated with significant density variation within the anode (slots and stub hole regions), as highlighted by Ben Boubaker et al. [28]. Variations in thermal (e.g., thermal expansion coefficient) and mechanical properties (Young, modulus, Poisson’s ratio, etc.) between zones of different densities could then induce stresses leading to anode cracking when the anodes are cooled down after baking. The number of visible cracks on an anode slice is generally limited (0–10) depending on the anode quality. In the present case, cracks with different morphologies were used to test the algorithm.

3.1. Pre-Processing

In order to reduce computation time, it is preferable to define the candidate voxels or seed voxels (starting voxels for the percolation method) [14] instead of performing the percolation on each voxel in the 3D volume. In the present case, the same method used in the 2D analysis [24], i.e., the non-decimated wavelet transform (NDWT), was used to identify the seed voxels within the 3D volume (anode slice). Briefly, the NDWT method performs the convolution between a finite length wave (called a wavelet) of a given shape and the image signals in a given direction. Different frequency bands can be analysed by stretching the length of the wave and repeating the convolution process. Smaller waves capture the high frequency details (e.g., cracks). In this application, the Harr wavelet with one decomposition level was used. In a typical anode slice (70 × 468 × 1068 voxels with a resolution of 0.7 × 0.6 × 0.7 mm3), after filtering the NDWT results [24], approximately 10,000 voxels (0.03%) are tagged as seed voxels. However, not all seed voxels will initiate a percolation process since some of them may have been included in the region of interest (Dp) in a previous percolation analysis. The result of pre-processing for a typical 50 mm anode slice is shown in Figure 4. It is difficult to distinguish seed voxels located in cracks from those located in pores. For visualisation purposes, Figure 5 shows the seed voxels in the height/width plane located at half-thickness (thickness = 35 voxels).

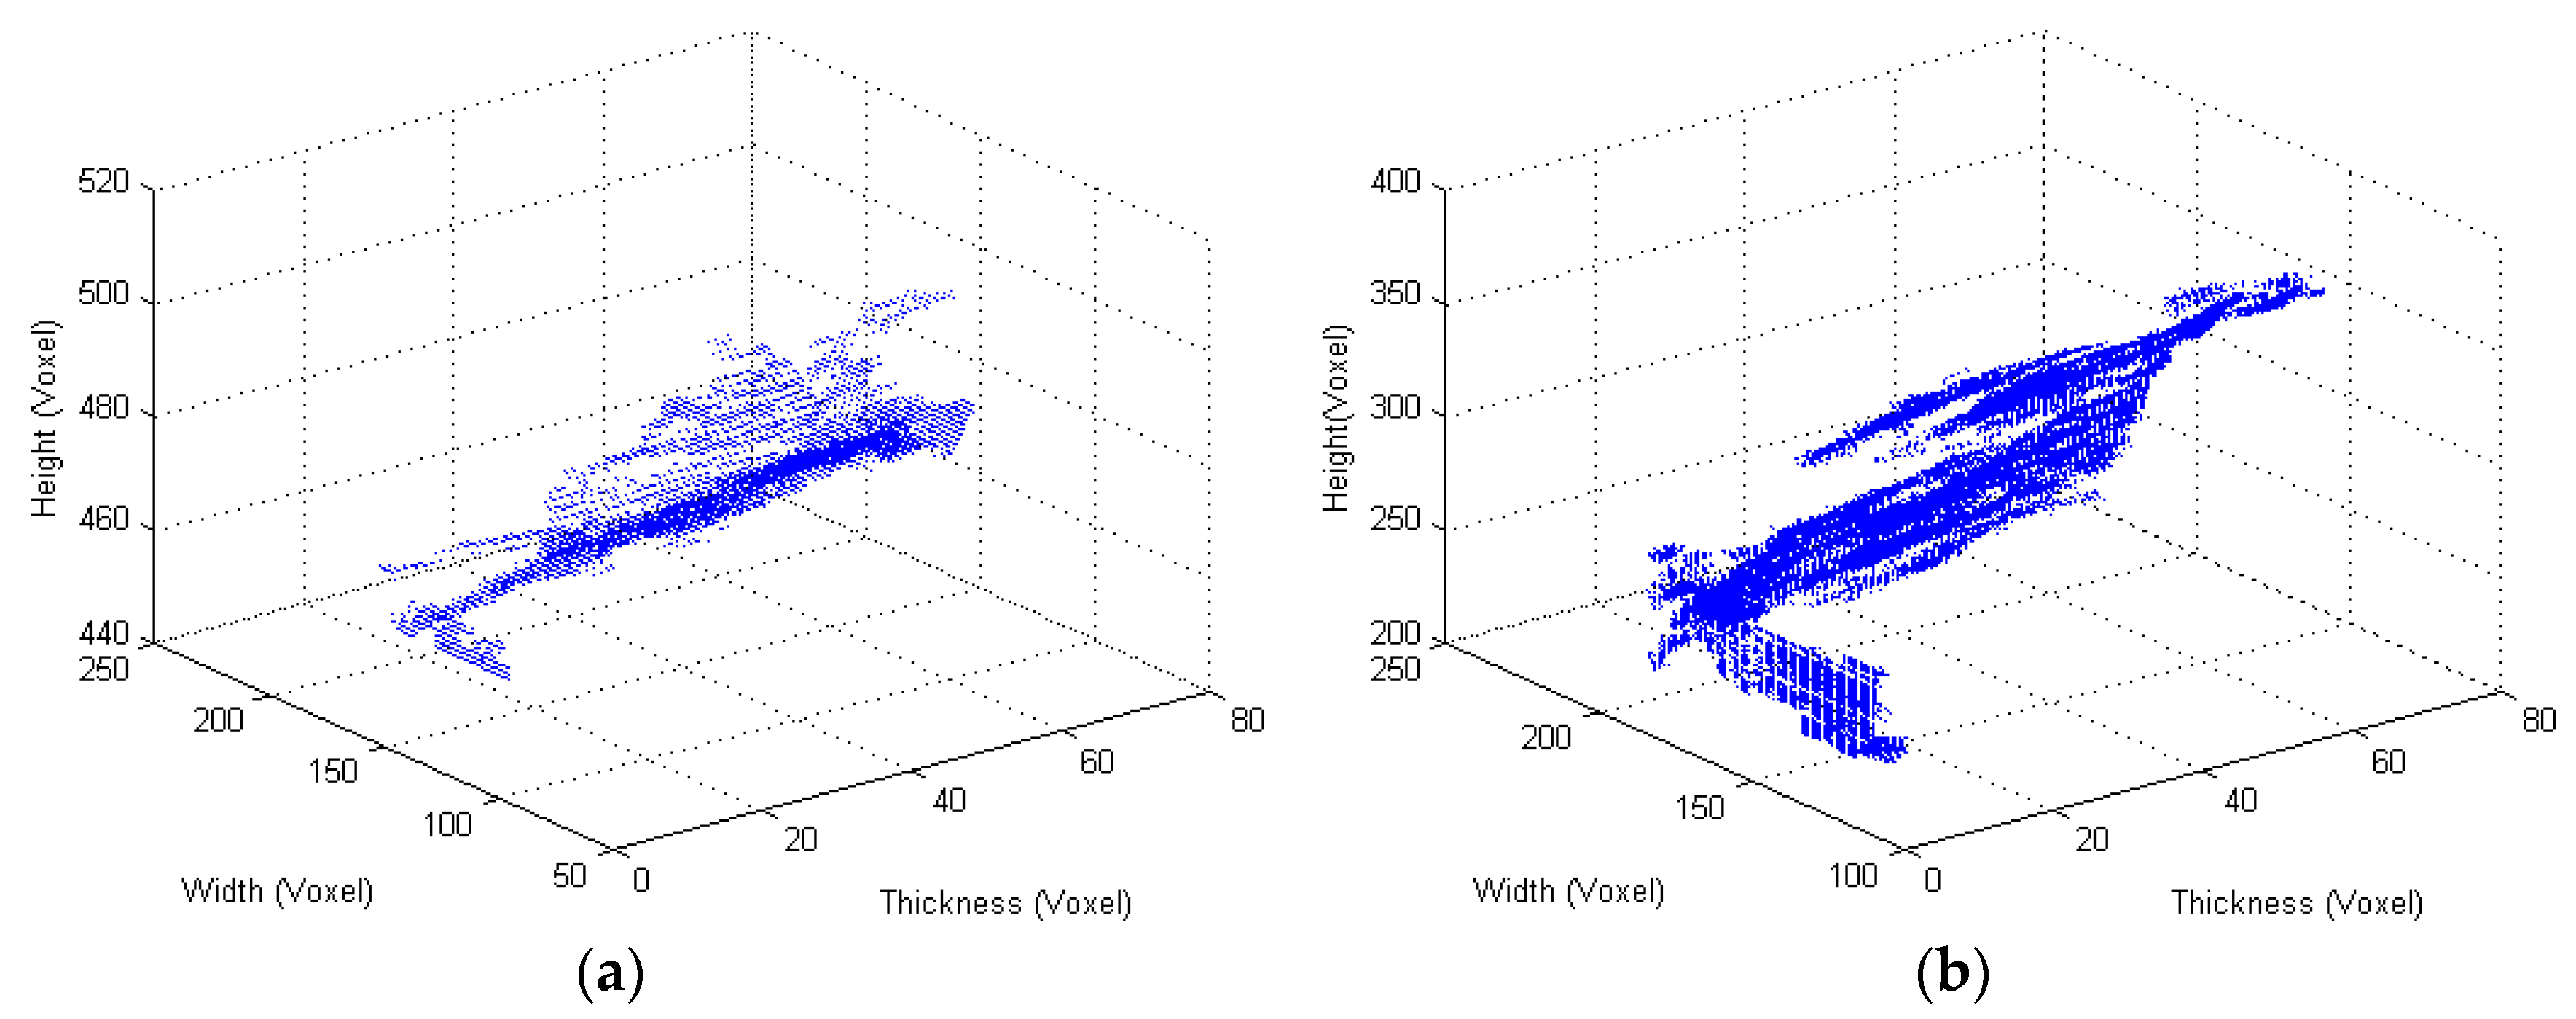
3.2. 3D Percolation—Anode Slice

Two seed voxels located in cracks with two different sizes and morphologies, shown in Figure 6, have been used to demonstrate the performance of the 3D percolation algorithm. The algorithm is not yet optimized from a computation time point of view. Hence only the crack detection efficiency is analyzed. The first seed voxel is located near an anode slot and the second one close to an anode stub hole. As seen in that figure, cracks have a width of approximately 2 to 3 voxels (1.4–2.1 mm) and seem, from a 2D point of view, to be discontinuous. Also, the 3D percolation process has been used with and without the boundary voxels of the dark faces of the investigation box shown in Figure 4. The sphericity threshold has been set to Ψ = 0.5. Figure 7 and Figure 8 show the crack detection results on both seed voxels by using an investigation box (100 × 100 × 100 voxels) containing all boundary voxels (including the voxels of the dark faces of Figure 3b). In the first case (seed voxel #1), the percolation process leads to a crack containing 2078 voxels. In the second case, 1367 voxels were identified. Compared to 2D percolation results [24] the 3D algorithm without constraint on the investigation box did not perform well (Figure 8), i.e., visible crack continuations are not detected by the algorithm.
The use of a constrained investigation box (i.e., using the flowchart of Figure 3) on the selected seed voxels led to the results shown in Figure 9 and Figure 10. A total of 6243 voxels were identified as part of the crack in the first case (seed voxel #1) and 17,832 in the second one (seed voxel #2). A third crack seems to have been identified in Figure 10. However, the percolation process identified a volume where all identified voxels are connected, as shown in Figure 9a. Hence, both cracks on the left end of Figure 10 are part of the same 3D crack (percolated region related to seed voxel #2). The 3D algorithm has performed well in the second case (seed voxel #2), i.e., most voxels of the cracks have been identified (Figure 9b). While the algorithm also seems to have performed well for the first seed voxels (Figure 9a), some parts of the cracks have been missed (right end of Figure 10). This is mainly related to the image’s low resolution limitation. Moreover, in both cases, the percolation has identified some anode side voxels (at Thickness = 0) as parts of cracks. This is directly related with the constraint on the investigation box, where voxels on the box dark faces (Figure 3) are excluded from the boundary voxels (the initial investigation box is larger than the width). Hence, the algorithm is unable to stop the percolation at this location during the first phase of the percolation process. Reducing the initial investigation box would decrease the crack detection performance [24]. This could be avoided by increasing the anode volume investigated, e.g., an anode slice of 200 to 300 mm thick or eventually on a full anode block. Alternatively, decreasing the sphericity threshold (e.g., Ψ = 0.25) could have helped to eliminate the “side voxels” but this did not significantly improve the detection result.

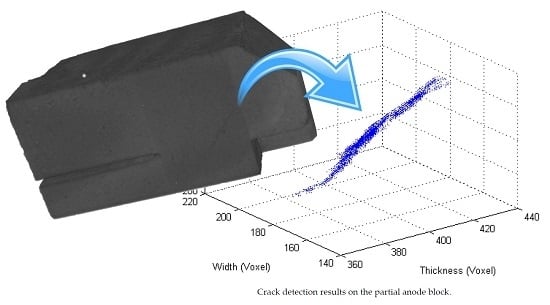
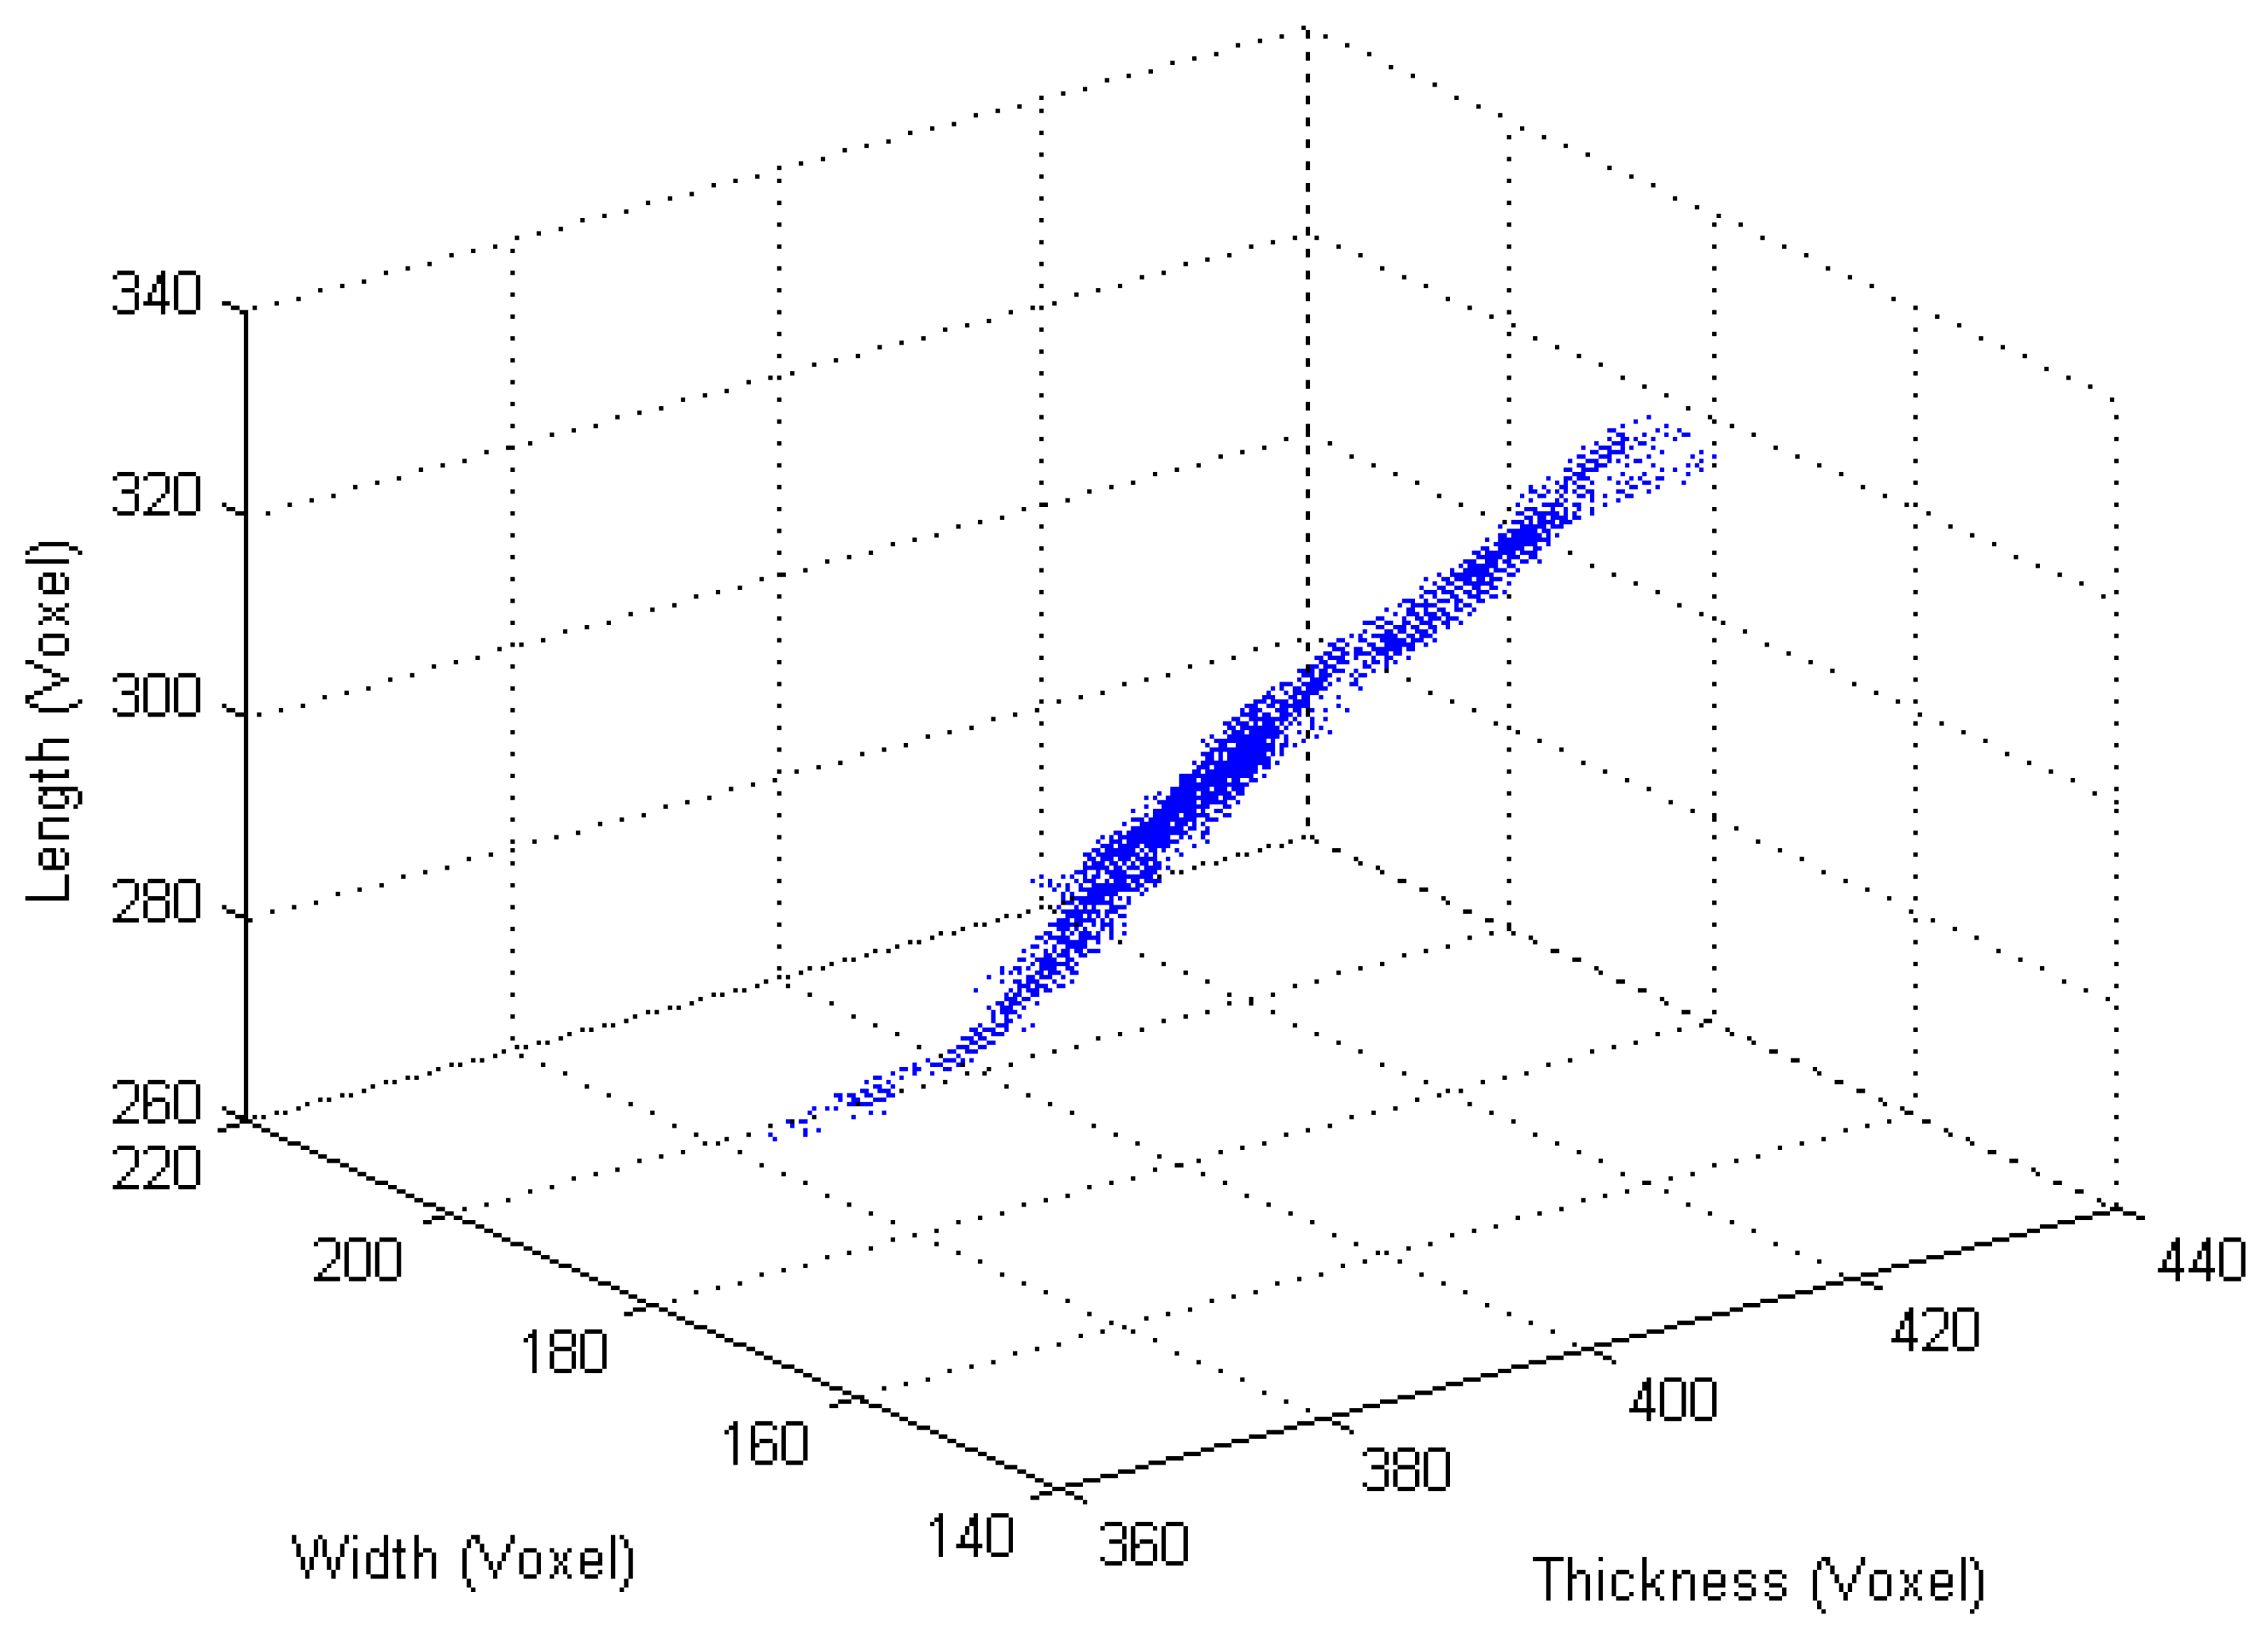
3.3. 3D Percolation—Partial Anode Block

As pointed out in Section 3.2, voxels excluded from the investigation box (Figure 3) cannot be used to stop the percolation process in thin anode slices. A larger anode sample with similar crack morphologies is needed to fully test the algorithm. Another anode has thus been cut with the same pattern shown in Figure 2 but with a slice thickness of 270 mm instead of 50 mm, as shown in Figure 11. The voxel dimensions were kept the same, i.e., 0.7 × 0.6 × 0.7 mm3. In that case, the crack is totally embedded in the anode sample. Hence, all voxels of an investigation box can be used. A 2D view of the crack investigated is shown in Figure 12 as well as the seed voxel used to start the percolation process.
A representative percolation run with the same parameters as presented in Section 3.2 (initial box dimension of 100 × 100 × 100 voxels with a sphericity threshold of Ψ = 0.5 ) is presented in Figure 13. The voxel count at the end of the percolation is 19,319. In this representative run, the percolation ended by reaching the sphericity threshold. Hence, the investigation box did not affect the percolation process, which was the goal of using a thicker anode slice. Figure 14 shows 2D views of the percolated region superimposed on anode images at three different locations inside the anode sample. It can be seen that most of the central part of the crack has been detected. However, the algorithm still misses some parts of the crack as obtained on the thinner anode slices (Figure 8 and Figure 10). Again, this is mainly related to the image low-resolution limitation. The sphericity threshold can be increased to include the missing voxels but the algorithm will flood the investigation box and cracks will not be detected. Hence, the easiest way to overcome this problem would be to increase image resolution, but it would also lead to a significant increase of the analysis cost.

4. Conclusions

A 3D crack detection tool, based on a percolation method, has been developed as a non-destructive quantification technique for baked carbon anodes. The proposed algorithm is a direct extension of a 2D percolation algorithm previously adapted for low-resolution images. The development of the algorithm required the proposal of an adaptive investigation box taking into account the main features of the cracks of interest, and the percolated volume sphericity was used as the threshold criterion for crack identification.
The performance of the proposed 3D algorithm was tested on 3D images of partial volumes of a baked carbon anode (anode slice) obtained using a CT scanner. The results have shown the necessity of an adaptive investigation box when cracks are not completely embedded within the anode sample. The percolation process is, however, most effective when investigated cracks are fully embedded in the anode sample. The proposed algorithm encountered, as with all other algorithms available in the literature, crack detection problems when applied to low resolution images. Nevertheless, unlike the Hessian-driven method, the 3D percolation proposed in this work was able to partially identify thin cracks (few voxels width). Hence, in its current state and without increasing the image resolution (0.7 × 0.6 × 0.7 mm3), the algorithm could be used by the industry to qualify, but not yet quantify, their anodes by highlighting the presence and spreading of cracks.
In summary, the algorithm is very promising for quantifying cracks and could help enhance anode quality control. To improve the 3D crack detection, higher resolution images are required. This will be investigated in the upcoming months on the same anode samples investigated in this paper. This will be achieved by increasing the reconstruction time (so the analysis cost) in order to reach the maximum resolution (0.09 × 0.04 × 0.09 mm3) of the apparatus used in this study, i.e., the Siemens Somatom Sensation 64. Finally, the proposed algorithm will be challenged with the Hessian-driven method to see at which point the percolation algorithm proposed will lose its advantage (from a resolution point of view) over the former one.

Acknowledgments

Authors would like to acknowledge the financial support of the Natural Sciences and Engineering Research Council (NSERC) and Alcoa. A part of the research presented in this paper was financed by the Fonds de Recherche du Québec-Nature et Technologie (FRQNT) by the intermediary of the Aluminium Research Centre-REGAL. Particular gratitude is dedicated to Hugues Ferland, from the REGAL group, at Laval University and to Louis-Frédéric Daigle, from INRS-ETE, for their technical support.

Author Contributions

Donald Picard, Julien Lauzon-Gauthier and Carl Duchesne conceived and designed the experiments; Donald Picard performed the experiments; Houshang Alamdari, Mario Fafard and Donald P. Ziegler contributed in data analysis; Donald Picard wrote the paper and all co-authors commented/corrected it.

Conflicts of Interest

The authors declare no conflict of interest.

References

  1. Edwards, L.; Backhouse, N.; Darmstadt, H.; Dion, M.-J. Evolution of Anode Grade Coke Quality, Proceedings of the Light Metals 2012—TMS 2012 Annual Meeting and Exhibition, Orlando, FL, USA, 11–15 March 2012; Minerals, Metals and Materials Society: Orlando, FL, USA, 2012; pp. 1207–1212.
  2. Andoh, M.-A.; Kocaefe, D.; Bhattacharyay, D.; Kocaefe, Y.; Marceau, D.; Morais, B. Measurement of the Electric Current Distribution in an Anode, Proceedings of the Light Metals 2016—TMS 2016: 145th Annual Meeting and Exhibition, Nashville, TN, USA, 14–18 February 2016; Minerals, Metals and Materials Society: Nashville, TN, USA, 2016; pp. 889–894.
  3. Kocaefe, Y.; Kocaefe, D.; Bhattacharyay, D. Quality Control via Electrical Resistivity Measurement of Industrial Anodes, Proceedings of the Light Metals 2015—TMS 2015 Annual Meeting and Exhibition, Orlando, FL, USA, 15–19 March 2015; Minerals, Metals and Materials Society: Orlando, FL, USA, 2015; pp. 1097–1102.
  4. Amrani, S.; Kocaefe, D.; Kocaefe, Y.; Bhattacharyay, D.; Bouazara, M.; Morais, B. Characterization of cracking mechanisms of carbon anodes used in aluminum industry by optical microscopy and tomography. J. Mater. Eng. Perform. 2016, 25, 4274–4282. [Google Scholar] [CrossRef]
  5. Chamam, Y.; Kocaefe, D.; Kocaefe, Y.; Bhattacharyay, D.; Morais, B. Effect of Heating Rate during Baking on the Properties of Carbon Anodes Used in Aluminum Industry, Proceedings of the Light Metals 2016—TMS 2016: 145th Annual Meeting and Exhibition, Nashville, TN, USA, 14–18 February 2016; Minerals, Metals and Materials Society: Nashville, TN, USA, 2016; pp. 947–951.
  6. Meier, M.W. Cracking Behaviour of Anodes; R & D Carbon Ltd.: Sierre, Switzerland, 1996. [Google Scholar]
  7. Yamaguchi, T.; Hashimoto, S. Fast crack detection method for large-size concrete surface images using percolation-based image processing. Mach. Vis. Appl. 2010, 21, 797–809. [Google Scholar] [CrossRef]
  8. Naebe, M.; Abolhasani, M.M.; Khayyam, H.; Amini, A.; Fox, B. Crack damage in polymers and composites: A review. Polym. Rev. 2016, 56, 31–69. [Google Scholar] [CrossRef]
  9. Torok, M.M.; Golparvar-Fard, M.; Kochersberger, K.B. Image-based automated 3D crack detection for post-disaster building assessment. J. Comput. Civ. Eng. 2014, 28, 13. [Google Scholar] [CrossRef]
  10. Ehrig, K.; Goebbels, J.; Meinel, D.; Paetsch, O.; Prohaska, S.; Zobel, V. Comparison of crack detection methods for analysing damage processes in concrete with computed tomography. In Proceedings of the International Symposium on Digital Industrial Radiology and Computed Tomography, Berlin, Germany, 20–22 June 2011.
  11. Paetsch, O.; Baum, D.; Ehrig, K.; Meinel, D.; Prohaska, S. Automated 3D Crack Detection for Analyzing Damage Processes in Concrete with Computed Tomography, Proceedings of the iCT2012—Conference on Industrial Computed Tomography University of Applied Sciences, Wels, Austria, 19–21 September 2012; University of Applied Sciences Upper Austria: Wels, Austria, 2012; pp. 321–330.
  12. Yamaguchi, T.; Hashimoto, S. Automated crack detection for concrete surface image using percolation model and edge information. In Proceedings of the IECON 2006—32nd Annual Conference on IEEE Industrial Electronics, Paris, France, 6–10 November 2006; pp. 3355–3360.
  13. Yamaguchi, T.; Hashimoto, S. Image processing based on percolation model. IEICE Trans. Inf. Syst. 2006, E89-D, 2044–2052. [Google Scholar] [CrossRef]
  14. Yamaguchi, T.; Nakamura, S.; Hashimoto, S. An efficient crack detection method using percolation-based image processing. In Proceedings of the ICIEA 2008—3rd IEEE Conference on Industrial Electronics and Applications, Singapore, 3–5 June 2008; pp. 1875–1880.
  15. Babaei, F.; Hong, T.L.C.; Yeung, K.; Cheng, S.H.; Lam, Y.W. Contrast-enhanced X-ray micro-computed tomography as a versatile method for anatomical studies of adult zebrafish. Zebrafish 2016, 13, 310–316. [Google Scholar] [CrossRef] [PubMed]
  16. Cnudde, V.; Boone, M.N. High-resolution X-ray computed tomography in geosciences: A review of the current technology and applications. Earth Sci. Rev. 2013, 123, 1–17. [Google Scholar] [CrossRef]
  17. Helliwell, J.R.; Sturrock, C.J.; Grayling, K.M.; Tracy, S.R.; Flavel, R.J.; Young, I.M.; Whalley, W.R.; Mooney, S.J. Applications of X-ray computed tomography for examining biophysical interactions and structural development in soil systems: A review. Eur. J. Soil Sci. 2013, 64, 279–297. [Google Scholar] [CrossRef]
  18. Mazonakis, M.; Damilakis, J. Computed tomography: What and how does it measure? Eur. J. Radiol. 2016, 85, 1499–1504. [Google Scholar] [CrossRef] [PubMed]
  19. Adams, A.N.; Karacan, O.; Grader, A.; Mathews, J.P.; Halleck, P.M.; Schobert, H.H. The non-destructive 3-D characterization of pre-baked carbon anodes using X-ray computerized tomography. Light Met. 2002, 2002, 535–539. [Google Scholar]
  20. Sommerseth, C.; Thorne, R.J.; Orvik, S.R.; Sandnes, E.; Ratvik, A.P.; Lossius, L.P.; Linga, H.; Svensson, A.M. Spatial Methods for Characterising Carbon Anodes for Aluminium Production, Proceedings of the Light Metals 2015—TMS 2015 Annual Meeting and Exhibition, Orlando, FL, USA, 15–19 March 2015; Minerals, Metals and Materials Society: Orlando, FL, USA, 2015; pp. 1141–1146.
  21. Picard, D.; Alamdari, H.; Ziegler, D.; Dumas, B.; Fafard, M. Characterization of Prebaked Carbon Anode Samples Using X-ray Computed Tomography and Porosity Estimation, Proceedings of the Light Metals 2012, Orlando, FL, USA, 11–15 March 2012; Minerals, Metals and Materials Society: Orlando, FL, USA, 2012; pp. 1283–1288.
  22. Azari, K.; Alamdari, H.; Aryanpour, G.; Picard, D.; Fafard, M.; Adams, A. Mixing variables for prebaked anodes used in aluminum production. Powder Technol. 2013, 235, 341–348. [Google Scholar] [CrossRef]
  23. Suriyapraphadilok, U.; Halleck, P.; Grader, A.; Andresen, J.M. Physical, chemical and X-ray computed tomography characterization of anode butt cores. In Light Metals 2005; Kvande, H., Ed.; Minerals, Metals and Materials Society: San Francisco, CA, USA, 2005; pp. 617–621. [Google Scholar]
  24. Picard, D.; Lauzon-Gauthier, J.; Duchesne, C.; Alamdari, H.; Fafard, M.; Ziegler, D. Automated Crack Detection Method Applied to ct Images of Baked Carbon Anode, Proceedings of the Light Metals 2014, San Diego, CA, USA, 16–20 February 2014; Minerals, Metals and Materials Society: San Diego, CA, USA, 2014; pp. 1275–1280.
  25. Heimann, T.; Meinzer, H.P. Statistical shape models for 3D medical image segmentation: A review. Med. Image Anal. 2009, 13, 543–563. [Google Scholar] [CrossRef] [PubMed]
  26. Roseman, A.M. Particle finding in electron micrographs using a fast local correlation algorithm. Ultramicroscopy 2003, 94, 225–236. [Google Scholar] [CrossRef]
  27. Legland, D.; Kieu, K.; Devaux, M.-F. Computation of minkowski measures on 2D and 3D binary images. Image Anal. Stereol. 2007, 26, 83–92. [Google Scholar] [CrossRef]
  28. Ben Boubaker, M.; Picard, D.; Duchesne, C.; Tessier, J.; Alamdari, H.; Fafard, M. The potential of acousto-ultrasonic techniques for inspection of baked carbon anodes. Metals 2016, 6, 151. [Google Scholar] [CrossRef]
Figure 1. Siemens Somatom Sensation 64 designed for the human body but adapted for material research. Courtesy of INRS-ETE, Quebec, QC, Canada.
Metals 06 00272 g001
Figure 2. Slicing scheme of the investigated anode (approximately 0.6 × 0.6 × 1.5 m3).
Metals 06 00272 g002
Figure 3. Flowchart for investigation box size determination: (a) flowchart; (b) investigation box.
Metals 06 00272 g003
Figure 4. Seed voxels of a typical 50 mm anode slice containing cracks and pores (10 voxels ≈ 7 mm).
Metals 06 00272 g004
Figure 5. Seed voxels (white voxels, some are identified with black arrows) of a typical anode image (center of the slice) containing cracks and pores: (a) full scale; (b) image zoomed in the region containing most cracks.
Metals 06 00272 g005
Figure 6. Selected seeds voxels (white voxels identified with black arrows) for 3D percolation process: (a) seed voxel #1; (b) seed voxel #2.
Metals 06 00272 g006
Figure 7. Cracks detection results (10 voxels ≈ 7 mm) without restriction on the investigation box (Ψ = 0.5): (a) seed voxel #1; (b) seed voxel #2.
Metals 06 00272 g007
Figure 8. Cracks detection results (white regions) without restriction on the investigation box. Image located at mid width of the anode slice. Left crack: near stub hole. Right crack: near anode slot.
Metals 06 00272 g008
Figure 9. Crack detection results (10 voxels ≈ 7 mm) with restriction on the investigation box (Ψ = 0.5): (a) seed voxel #1; (b) seed voxel #2.
Metals 06 00272 g009
Figure 10. Crack detection results (white regions) with restriction on the investigation box. Image located at mid-width of the anode slice. Left crack: near stub hole. Right crack: near anode slot.
Metals 06 00272 g010
Figure 11. Partial anode block.
Metals 06 00272 g011
Figure 12. 2D view of the crack (top right) used to test the 3D percolation algorithm on thick anode slice: (a) full view; (b) zoom on the cracked zone investigated with the seed voxel (white dot identified with a black arrow).
Metals 06 00272 g012
Figure 13. Crack detection results (10 voxels ≈ 7 mm) on the partial anode block with restriction on the investigation box (Initial box dimensions of 100 × 100 × 100 voxels and Ψ = 0.5).
Metals 06 00272 g013
Figure 14. 2D views of the percolated region (white) on partial anode block: (a) image located near the left end of the partial anode block; (b) image located at the mid width (135 mm) of the partial anode block; (c) image located near the right end of the partial anode block.
Metals 06 00272 g014

