Article

Corrosion of Fe-(9~37) wt. %Cr Alloys at 700–800 °C in (N2, H2O, H2S)-Mixed Gas

School of Advanced Materials Science and Engineering, Sungkyunkwan University, Suwon 16419, Korea
*
Author to whom correspondence should be addressed.
Metals 2016, 6(11), 291; https://doi.org/10.3390/met6110291
Submission received: 18 October 2016 / Revised: 14 November 2016 / Accepted: 15 November 2016 / Published: 23 November 2016
(This article belongs to the Special Issue Alloy Steels)

Abstract

:
Fe-(9, 19, 28, 37) wt. %Cr alloys were corroded at 700 and 800 °C for 70 h under 1 atm of N2, 1 atm of N2/3.2%H2O mixed gas, and 1 atm of N2/3.1%H2O/2.42%H2S mixed gas. In this gas composition order, the corrosion rate of Fe-9Cr alloy rapidly increased. Fe-9Cr alloy was always non-protective. In contrast, Fe-(19, 28, 37) wt. %Cr alloys were protective in N2 and N2/3.2%H2O mixed gas because of the formation of the Cr2O3 layer. They, however, became nonprotective in N2/3.1%H2O/2.42%H2S mixed gas because sulfidation dominated to form the outer FeS layer and the inner Cr2S3 layer containing some FeCr2S4.

1. Introduction

Fe-Cr alloys are widely used as high-temperature structural materials. They oxidize when exposed to air or oxygen at high temperatures. When the Cr content in iron was ~5 wt. %, triple oxide layers such as Fe2O3/Fe3O4/FeO formed, and the oxidation rate was mainly controlled by the growth rate of FeO that formed on the alloy side [1]. The non-stoichiometric wustite grows much faster than the nearly stoichiometric Fe3O4 and Fe2O3. With an increase in the Cr content to ~10 wt. %, dispersed particles of the FeCr2O4 spinel formed more inside the FeO layer, and FeCr2O4 particles blocked the diffusion of Fe2+ ions to make the FeO layer thinner. With the further increase in the Cr content to ~15 wt. %, a mixed spinel, Fe(Fe,Cr)2O4, formed, which decreased the oxidation rate significantly. When the Cr content exceeded ~20 wt. %, the oxidation rate dropped sharply, forming a thin, continuous Cr2O3 layer containing a small amount of dissolved Fe ions [1,2,3]. When Fe-Cr alloys were exposed to S2 gas at 1 atm, an FeS layer formed below 1.86 wt. %Cr, an outer Fe1–xS layer and an inner (FeS, FeCr2S4) mixed layer formed in the range of 1.86–38.3 wt. %Cr, and a solid solution of FeS-Cr2S3 formed above 38.3 wt. %Cr [4]. Although Cr decreased the sulfidation rate, even Fe-Cr alloys with high Cr contents displayed insufficient corrosion resistance. This is attributed to the fact that sulfidation rates of common metals are 10–100 times faster than oxidation rates because the sulfides have much larger defect concentrations and lower melting points than the corresponding oxides [5]. The sulfidation of Fe-(20, 25, 30) wt. %Cr steels in 94Ar/5H2/1H2S mixed gas at 600 °C for 718 h resulted in the formation of the outer FeS layer and the inner FeCr2S4 layer [6]. On the other hand, the corrosion of conventional oxidation-resistant alloys by water vapor and H2S gas has been a serious problem [3]. Water vapor and H2S gas release hydrogen atoms, which ingress in the metals interstitially, form hydrogen clusters, and cause hydrogen embrittlement. Water vapor that is present in many industrial gases can form metal hydrides, and change not only the reaction at the scale/metal interface but also the mass transfer in scales, accelerating the corrosion rate [3,7]. In this study, Fe-Cr alloys were corroded at 700 and 800 °C in (N2, H2O, H2S) mixed gas in order to understand their corrosion behavior in hostile (H2O, H2S)-containing environments for practical applications. The aim of this study is to examine the influence of the Cr content and the (N2, H2O, H2S)-containing gas on the high-temperature corrosion of Fe-Cr alloys, which has not been adequately investigated before.

2. Experimental Procedures

Four kinds of hot-rolled ferritic Fe-Cr alloy sheets, viz., Fe-(8.5, 18.5, 28.3, 36.9) wt. %Cr, were prepared. They are termed as Fe-(9, 19, 28, 37)Cr, respectively, in this study. They were homogenized at 900 °C for 1 h under vacuum, cut into a size of 2 mm × 10 mm × 15 mm, ground up to a 1000-grit finish with SiC papers, ultrasonically cleaned in acetone, and corroded at 700 and 800 °C for 70 h under 1 atm of total pressure. Each test coupon was suspended by a Pt wire in a quartz reaction tube within the hot zone of an electrical furnace (Ajeon, Seoul, Korea), as shown in Figure 1. Three kinds of corrosion atmospheres were employed, viz. 1 atm of N2, (0.968 atm of N2 plus 0.032 atm of H2O) that was achieved by bubbling the N2 gas through the water bath kept at 25 °C, and (0.9448 atm of N2 plus 0.031 atm of H2O plus 0.0242 atm of H2S) that was achieved by bubbling N2 gas through the water bath kept at 25 °C and simultaneously flowing the N2-5%H2S gas into the quartz reaction tube. The N2 gas was 99.999% pure, and H2S gas was 99.5% pure. Nitrogen gas was blown into the reaction tube during heating and cooling stages. After finishing the corrosion test in N2, N2/3.2%H2O, and N2/3.1%H2O/2.42%H2S gas, the test coupons were furnace-cooled, and characterized by a scanning electron microscope (SEM, Jeol JSM-6390A, Tokyo, Japan), a high-power X-ray diffractometer (XRD, Mac Science M18XHF-SRA, Yokohama, Japan) with Cu-Kα radiation operating at 40 kV and 300 mA, and an electron probe microanalyzer (EPMA, Shimadzu, EPMA 1600, Kyoto, Japan).

3. Results and Discussion

Table 1 lists the weight gains of Fe-(9, 19, 28, 37)Cr alloys due to corrosion at 700 and 800 °C for 70 h, which were measured using a microbalance before and after corrosion. Fe-9Cr always displayed the worst corrosion resistance, gaining excessive weight. For example, Fe-9Cr oxidized fast even in the N2 gas through the reaction with impurities such as 3 ppm H2O and 2 ppm O2 in the N2 gas (99.999% pure). Fe-9Cr oxidized faster in the N2/H2O gas than in the N2 gas because of water vapor [7]. Water vapor dissociates into oxygen and hydrogen, oxidizes the metal, and forms voids within the oxide scale according to the equation [1,3],
M + H2O → MO + (2H or H2)
Fe-9Cr corroded the most seriously in N2/H2O/H2S gas, because H2S was much more harmful than H2O. H2S dissociates into hydrogen and sulfur. Sulfur forms non-protective metal sulfides according to the following equation:
M + H2S → MS + (2H or H2)
Hydrogen, which is released from H2S and H2O, dissolves and ingresses into the alloy and the scale interstitially, generates lattice point defects, forms hydrogen clusters and voids, causes hydrogen embrittlement, produces volatile hydrated species, and accelerates cracking, spallation and fracture of the scale. Hence, no metals are resistant to H2O/H2S corrosion. As listed in Table 1, Fe-(19, 29, 37)Cr displayed much better corrosion resistance in N2 and N2/3.2%H2O with weight gains of 1–2 mg/cm2 than Fe-9Cr. Fe-(19, 29, 37)Cr formed 0.3- to 1.3-μm-thick, adherent oxide scales. However, even Fe-(19, 29, 37)Cr failed in N2/3.1%H2O/2.42%H2S with large weight gains, forming non-adherent, fragile sulfide scales as thick as 35–750 μm. This scale failure made the weight gains measured in N2/H2O/H2S gas inaccurate. In N2/H2O/H2S gas, the amount of local cracking, spallation and void formation in the scale varied for each test run. Although the accurate measurement of weight gains in N2/H2O/H2S gas was impossible, it was clear that weight gains due to scaling decreased sharply with the addition of Cr.
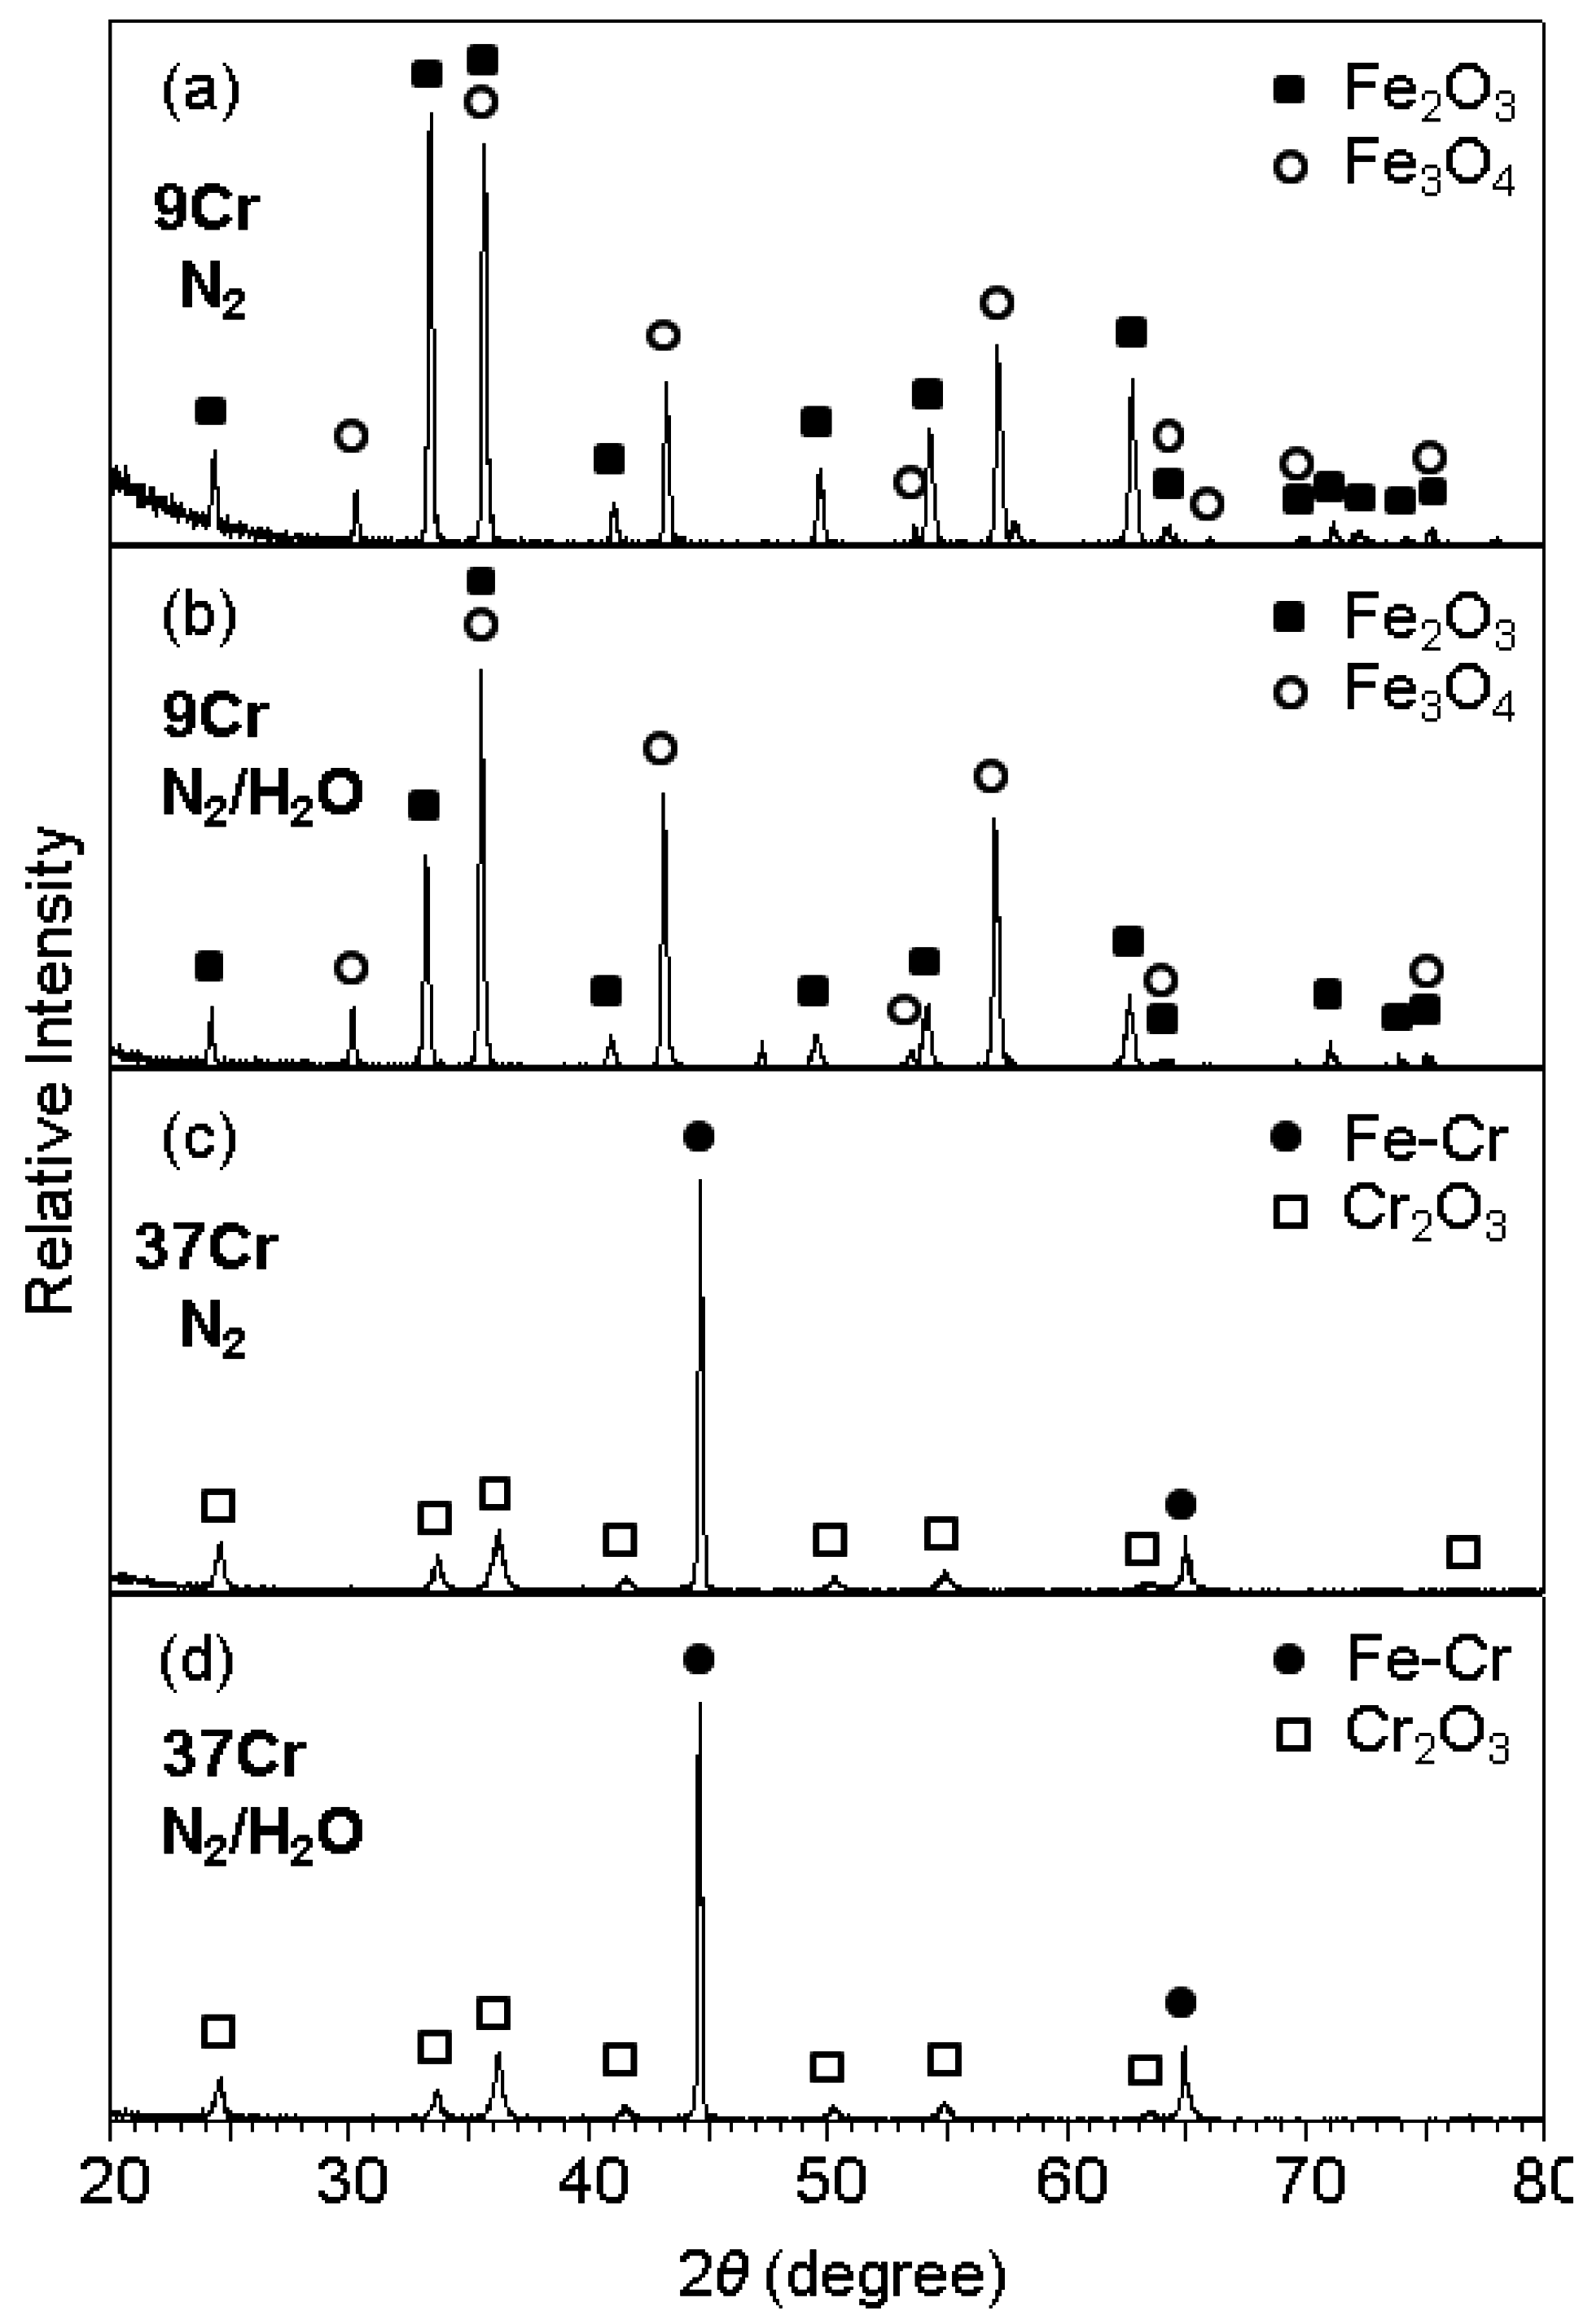
Figure 2 shows the XRD patterns of scales formed after corrosion at 800 °C for 70 h. The corrosion of Fe-9Cr in N2 and N2/H2O resulted in the formation of Fe2O3 and Fe3O4, as shown in Figure 2a,b. Oxide scales formed on Fe-9Cr in N2 and N2/H2O were 90 and 100 μm thick, respectively. Since X-rays could not penetrate such thick oxide scales, FeO and Cr-oxides such as FeCr2O4, which might form next to the alloy [1], were absent in Figure 2a,b. In contrast, Fe-(19, 28, 37)Cr alloys oxidized at much slower rates in N2 and N2/H2O than Fe-9Cr alloy, as listed in Table 1. Fe-(19, 28, 37)Cr alloys formed the protective Cr2O3 scale, as typically shown in Figure 2c,d. Here, the Fe-Cr peaks were strong owing to the thinness of the oxide scales. In Fe-(19, 28, 37)Cr alloys, Cr was dissolved in the α-Fe matrix.
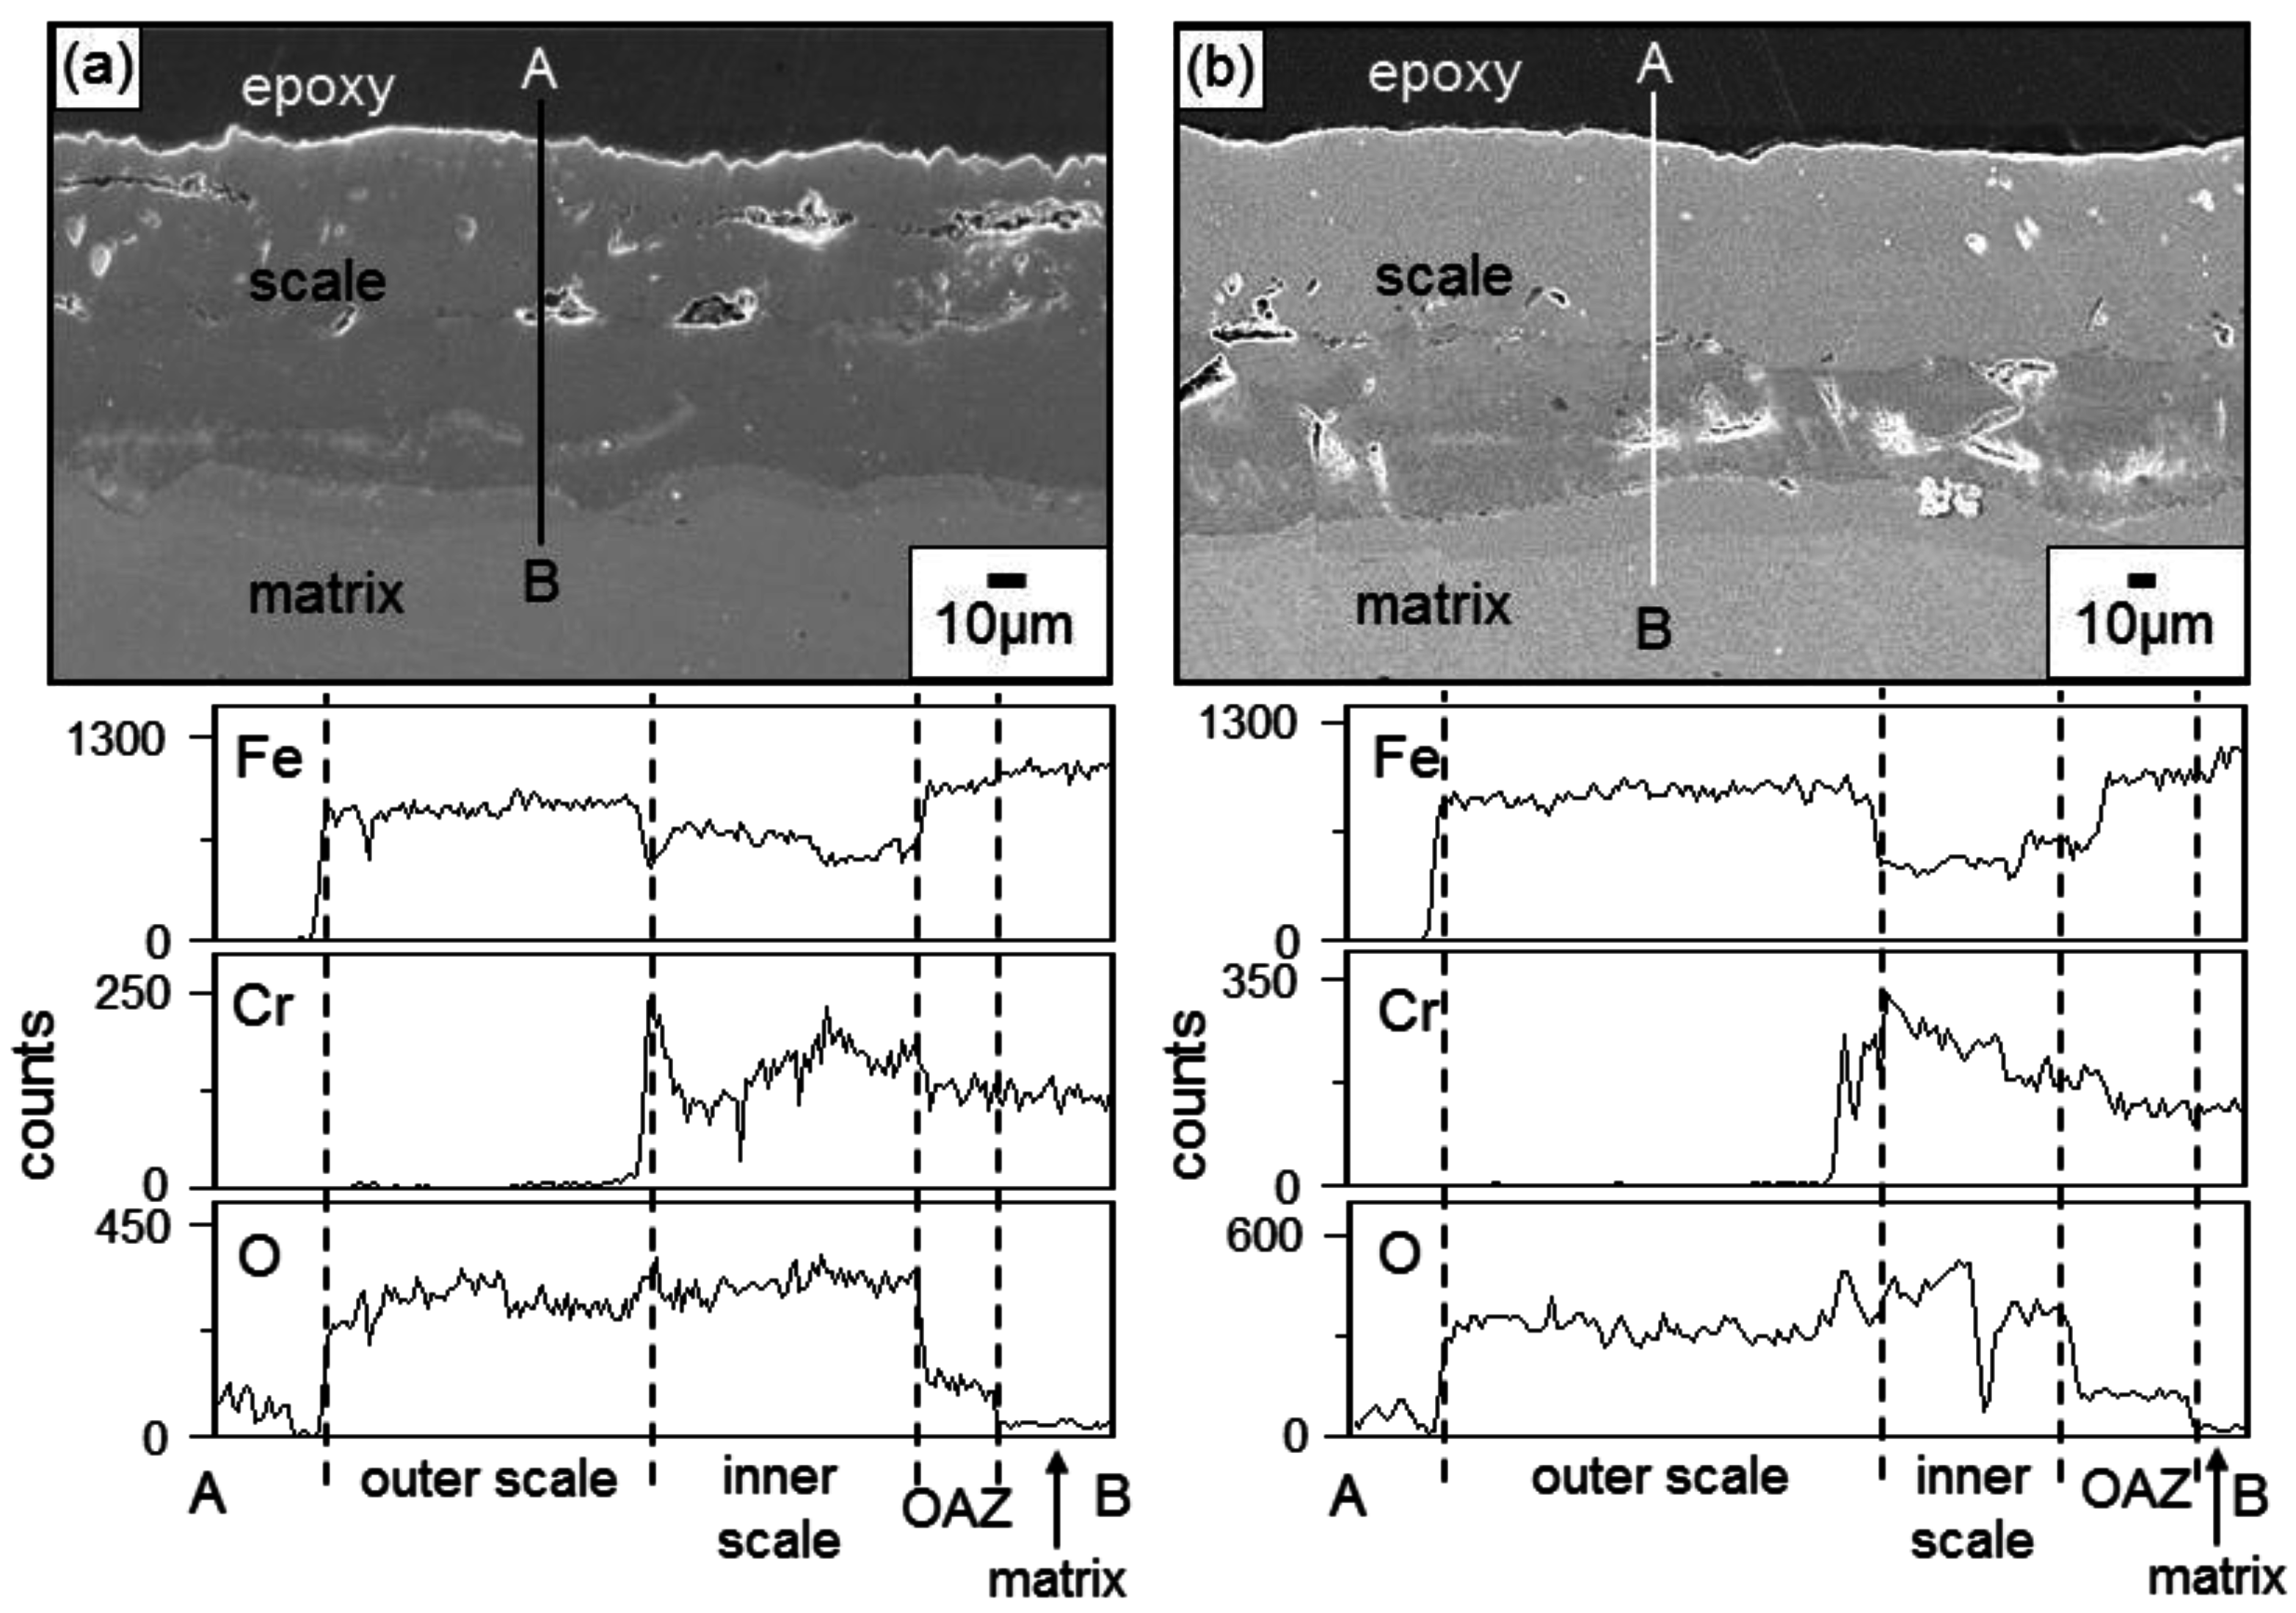
Figure 3 shows the EPMA analytical results on the scales formed on Fe-9Cr after corrosion at 700 °C for 70 h. The oxide scales that formed after corrosion in N2 and N2/H2O were about 90 and 140 μm thick, respectively. The scale morphology and elemental distribution in N2 gas were similar to those in N2/H2O gas, as shown in Figure 3, indicating that the same oxidation mechanism operated in N2 and N2/H2O gas. Voids were sporadically scattered in both oxide scales, below which the oxygen-affected zone (OAZ) existed. Voids formed owing to the volume expansion during scaling, hydrogen released from the water vapor, and the Kirkendall effect arose due to the outward diffusion of cations during scaling. In both oxide scales, the outer layer consisted of iron oxides, while the inner layer consisted of (Fe,Cr) mixed oxides. This indicated that Fe2+ and Fe3+ ions were more mobile than Cr3+ ions. The oxidation in N2 and N2/H2O gas was mainly controlled by the outward diffusion of iron ions through the inner (Fe,Cr) mixed oxide layer. Iron oxidized preferentially in N2 and N2/H2O gas because iron is the base element and its oxide, FeO, is a non-stoichiometric compound with a relatively fast growth rate.
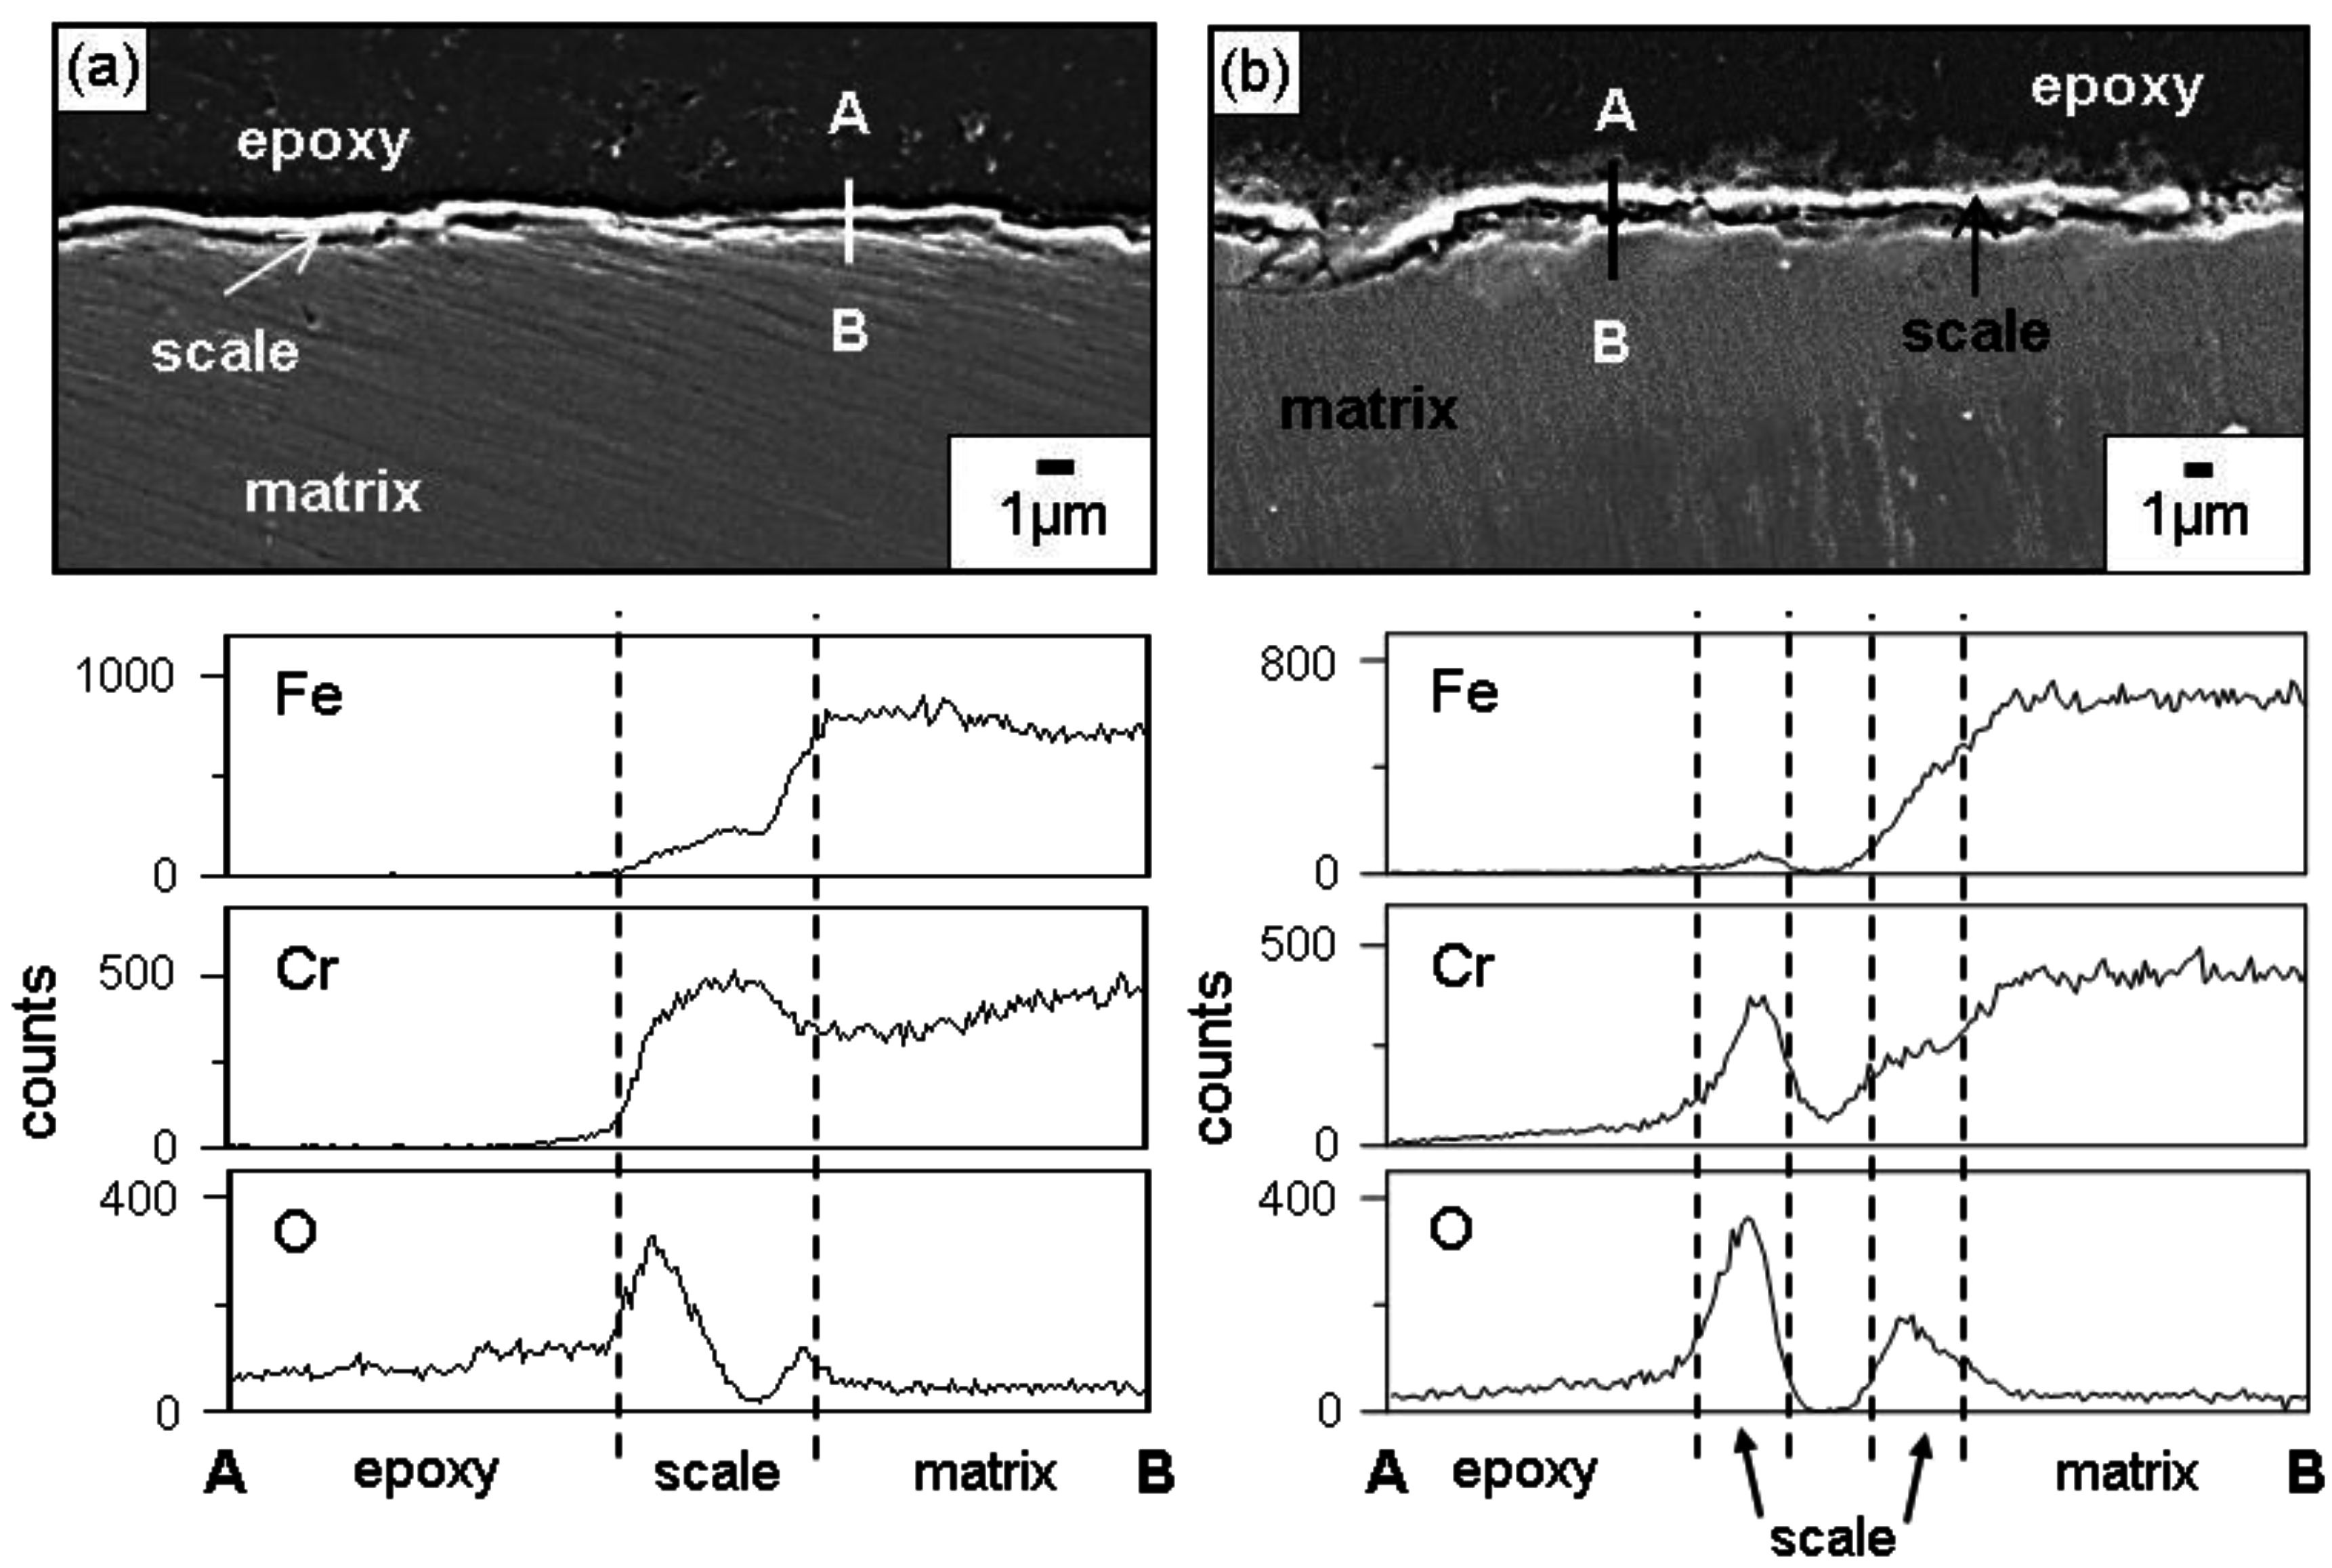
Figure 4 shows the EPMA analytical results on the scales formed on Fe-37Cr after corrosion at 700 °C for 70 h. The oxide scales that formed after corrosion in N2 and N2/H2O were about 0.6 and 1.1 μm thick, respectively. In N2 and N2/H2O gas, the Cr2O3 scale formed (Figure 2c,d), in which Fe was dissolved (Figure 4). The complete dissolution of Fe2O3 in Cr2O3 is possible, because Cr2O3 and Fe2O3 have the same rhombohedral structure [8]. Like Fe-37Cr, Fe-(19, 28)Cr also formed a thin Cr2O3 scale containing some Fe when they corroded in N2 and N2/H2O gas. Once the thin but protective Cr2O3 scale formed, the outward diffusion of iron ions was suppressed so that good corrosion resistance was achieved.
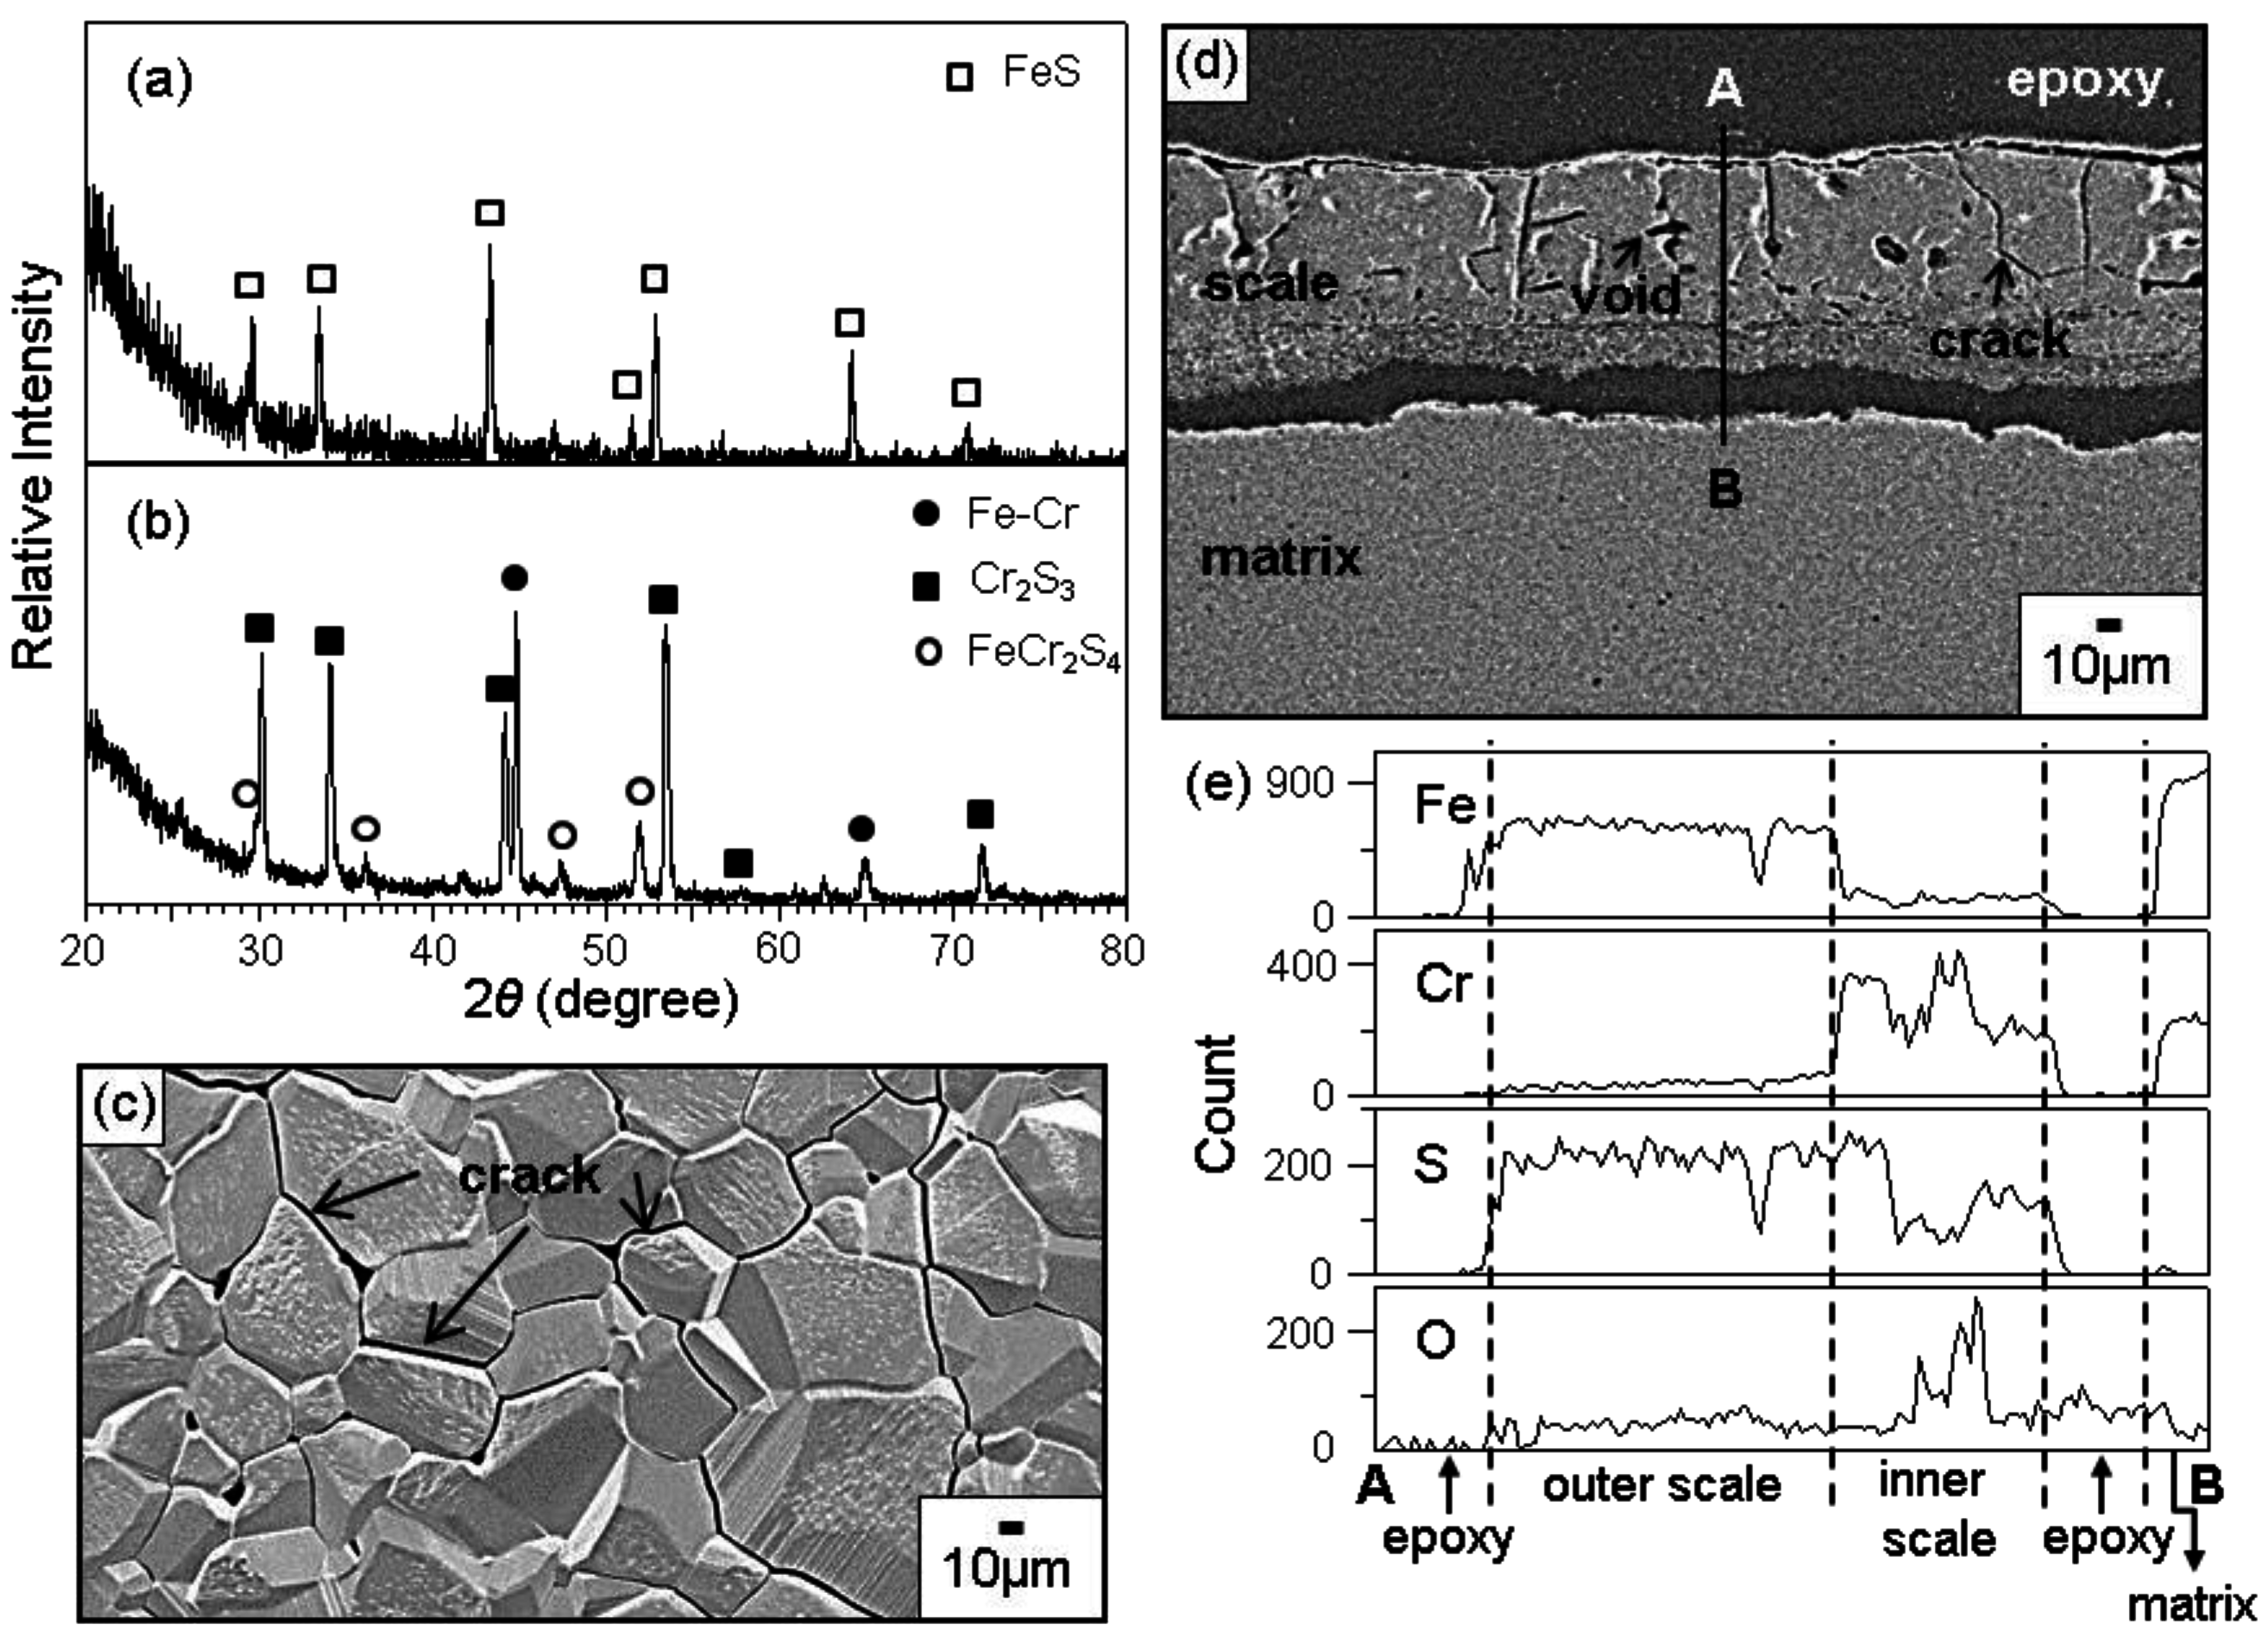
In N2/3.1%H2O/2.42%H2S gas, Fe-(9-37)Cr alloys could not form Cr2O3, and corroded fast, as typically shown in Figure 5. The scales formed on Fe-(9, 19, 28, 37)Cr alloys consisted primarily of the outer FeS layer (Figure 5a), and the inner Cr2S3 layer containing some FeCr2S4 (Figure 5b). Since FeS grows fast owing to its high non-stoichiometry, outer FeS grains were coarser than the inner (Cr2S3, FeCr2S4) mixed grains. In Figure 5c, cracks propagated inter- and trans-granularly due mainly to the excessive growth stress generated in the thick outer scale. The scale shown in Figure 5d was about 100 μm thick, and had cracks and voids. A small amount of Cr was dissolved in the outer FeS layer (Figure 5e). The preferential sulfidation of iron in the outer FeS layer decreased the sulfur potential underneath, and thereby increased the oxygen potential in the inner Cr2S3-rich layer, leading to the incorporation of oxygen in the inner Cr2S3-rich layer. FeS is a p-type metal-deficit compound, which grows fast by the outward diffusion of Fe2+ ions [5,9,10]. Its defect chemical equation is as follows.
1 / 2 O 2 = O o + 2 h · + V Fe "
here, OO, h· and V Fe " mean the O atom on the O site, the electron hole in the valence band with a + 1 charge, and the iron vacancy with a − 2 charge. The defect chemical reaction for the dissolution of Cr2S3 in FeS is as follows.
Cr 2 S 3 = 2 Cr Fe · + V Fe " + 3 S s
Hence, the doping of Cr3+ ions would increase the concentration of iron vacancies, leading to the enhancement of the FeS growth. Oxygen was incorporated in the inner Cr2S3-rich layer (Figure 5e). However, no oxides were detected in Figure 5b, because their amount was small or oxygen was dissolved in the sulfide scales. Grains in the inner layer were fine owing to the nucleation and growth of Cr2S3, together with some FeCr2S4 and probably some oxides. In N2/3.1%H2O/2.42%H2S gas, Fe-(9, 19, 28, 37)Cr alloys sulfidized preferentially owing to the high sulfur potential in the test gas.

4. Conclusions

When Fe-9Cr alloy corroded at 700 and 800 °C in N2 and N2/3.2%H2O gas, thick, porous oxide scales formed, which consisted of the outer iron oxide layer and the inner (Fe,Cr) mixed oxide layer. Under the same corrosion condition, Fe-(19, 28, 37)Cr alloys formed thin, dense, protective Cr2O3 oxide layers, in which iron was dissolved to a certain extent. In N2/3.1%H2O/2.42%H2S gas, Fe-(9, 19, 28, 37)Cr alloys corroded fast, forming thick, non-adherent, fragile scales, which consisted of the outer FeS layer and the inner Cr2S3 layer containing some FeCr2S4. The preferential sulfidation of Fe-(9, 19, 28, 37)Cr alloys in the H2S-containing gas was responsible for the poor corrosion resistance of Fe-(9, 19, 28, 37)Cr alloys.

Acknowledgments

This research was supported by Basic Science Research Program through the National Research Foundation of Korea (NRF) funded by the Ministry of Education (2016R1A2B1013169), Korea.

Author Contributions

Min Jung Kim conceived and designed the experimental procedure and drafted the paper. Muhammad Ali Abro prepared the samples, conducted the experiments and analyzed the data. All the results were discussed with Dong Bok Lee who supervised the experimental work and finalized the paper.

Conflicts of Interest

The authors declare no conflict of interest.

References

  1. Birks, N.; Meier, G.H.; Pettit, F.S. Introduction to High Temperature Oxidation of Metals, 2nd ed.; Cambridge University: New York, NY, USA, 2006. [Google Scholar]
  2. Khanna, A.S. Introduction to High Temperature Oxidation and Corrosion; ASM Int.: Metals Park, OH, USA, 2002; p. 135. [Google Scholar]
  3. Young, D. High Temperature Oxidation and Corrosion of Metals; Elsevier: Oxford, UK, 2008. [Google Scholar]
  4. Mrowec, S.; Walec, T.; Werber, T. High-temperature sulfur corrosion of iron-chromium alloys. Oxid. Met. 1969, 1, 93. [Google Scholar]
  5. Mrowec, S.; Przybylski, K. Transport properties of sulfide scales and sulfidation of metals and alloys. Oxid. Met. 1985, 23, 107. [Google Scholar] [CrossRef]
  6. Schulte, M.; Rahmel, A.; Schutze, M. The Sulfidation Behavior of Several Commercial Ferritic and Austenitic Steels. Oxid. Met. 1998, 49, 33. [Google Scholar] [CrossRef]
  7. Saunders, S.R.J.; McCartney, L.N. Current Understanding of Steam Oxidation—Power Plant and Laboratory Experience. Mater. Sci. Forum 2006, 119, 522. [Google Scholar] [CrossRef]
  8. Asteman, H.; Norling, R.; Svensson, J.-E.; Nylund, A.; Nyborg, L. Quantitative AES depth profiling of iron and chromium oxides in solid solution, (Cr1−xFex)2O3. Surf. Interface Anal. 2002, 34, 234. [Google Scholar] [CrossRef]
  9. Mrowec, S.; Wedrychowska, M. Kinetics and mechanism of high-temperature sulfur corrosion of Fe-Cr-Al alloys. Oxid. Met. 1979, 13, 481. [Google Scholar] [CrossRef]
  10. Danielewski, M.; Mrowec, S.; Stolosa, A. Sulfidation of iron at high temperatures and diffusion kinetics in ferrous sulfide. Oxid. Met. 1982, 17, 77. [Google Scholar] [CrossRef]
Figure 1. Corrosion testing apparatus.
Metals 06 00291 g001
Figure 2. XRD patterns taken after corrosion testing at 800 °C for 70 h. (a) Fe-9Cr in N2; (b) Fe-9Cr in N2/3.2%H2O; (c) Fe-37Cr in N2; (d) Fe-37Cr in N2/3.2%H2O.
Metals 06 00291 g002
Figure 3. EPMA cross-section and line profiles of Fe-9Cr after corrosion at 700 °C for 70 h in (a) N2; and (b) N2/3.2%H2O.
Metals 06 00291 g003
Figure 4. EPMA cross-section and line profiles of Fe-37Cr after corrosion at 700 °C for 70 h in (a) N2; and (b) N2/3.2%H2O.
Metals 06 00291 g004
Figure 5. Fe-19Cr after corrosion at 700 °C for 40 h in N2/3.1%H2O/2.42%H2S. (a) XRD pattern after corrosion; (b) XRD pattern taken after grinding off the outer scale; (c) SEM top view; (d) EPMA cross-section; (e) EPMA line profiles of along A–B denoted in (d).
Metals 06 00291 g005
Table 1. Weight gain of Fe-(9, 19, 28, 37)Cr alloys measured after corrosion at 700 and 800 °C for 70 h under 1 atm of N2, N2/3.2%H2O, and N2/3.1%H2O/2.42%H2S gas.
Temp.GasWeight Gain (mg/cm2)
9Cr19Cr28Cr37Cr
700 °CN21951–21–21–2
N2/H2O2201–21–21–2
N2/H2O/H2S205047020070
800 °CN22351–21–21–2
N2/H2O4001–21–21–2
N2/H2O/H2Smassive spalling1530690550

