Article

Formation and Disruption of W-Phase in High-Entropy Alloys

1
College of Engineering, Swansea University, Bay Campus, Swansea SA1 8EN, Wales, UK
2
Centre of Nanohealth, Swansea University, Singleton Park, Swansea SA2 8PP, Wales, UK
3
Sustainable Product Engineering Centre for Innovative Functional Industrail Coatings (SPECIFIC), Baglan Bay Innovation & Knowledge Centre, Central Avenue, Baglan, Port Talbot SA12 7AX, Wales, UK
*
Authors to whom correspondence should be addressed.
Metals 2016, 6(5), 106; https://doi.org/10.3390/met6050106
Submission received: 1 April 2016 / Revised: 26 April 2016 / Accepted: 29 April 2016 / Published: 6 May 2016
(This article belongs to the Special Issue Process-Structure-Property Relationships in Metals)

Abstract

:
High-entropy alloys (HEAs) are single-phase systems prepared from equimolar or near-equimolar concentrations of at least five principal elements. The combination of high mixing entropy, severe lattice distortion, sluggish diffusion and cocktail effect favours the formation of simple phases—usually a bcc or fcc matrix with minor inclusions of ordered binary intermetallics. HEAs have been proposed for applications in which high temperature stability (including mechanical and chemical stability under high temperature and high mechanical impact) is required. On the other hand, the major challenge to overcome for HEAs to become commercially attractive is the achievement of lightweight alloys of extreme hardness and low brittleness. The multicomponent AlCrCuScTi alloy was prepared and characterized using powder X-ray diffraction (PXRD), scanning-electron microscope (SEM) and atomic-force microscope equipped with scanning Kelvin probe (AFM/SKP) techniques. Results show that the formation of complex multicomponent ternary intermetallic compounds upon heating plays a key role in phase evolution. The formation and degradation of W-phase, Al2Cu3Sc, in the AlCrCuScTi alloy plays a crucial role in its properties and stability. Analysis of as-melted and annealed alloy suggests that the W-phase is favoured kinetically, but thermodynamically unstable. The disruption of the W-phase in the alloy matrix has a positive effect on hardness (890 HV), density (4.83 g·cm−3) and crack propagation. The hardness/density ratio obtained for this alloy shows a record value in comparison with ordinary heavy refractory HEAs.

Graphical Abstract

1. Introduction

Ever since their discovery, high-entropy alloys (HEAs) have become one of the major research topics in materials engineering. Outstanding mechanical and structural features, coupled with simple crystal structures, make HEAs promising as materials for high-temperature applications, in which high hardness should be coupled with high chemical and mechanical stability [1].
According to their density, melting point and hardness, HEAs can be classified as heavy/light, refractory, soft/hard materials. In many cases, refractory (with melting point above 2000 °C) HEAs are characterized by high hardness (600–900 HV): however, since their main components are Mo, Nb, Ta or Zr, their density equals or surpasses 10 g·cm−3 [2,3,4], which limits their application.
Conversely, only few alloys display micro-hardness values of 800 HV or more. Such hardness values have usually been obtained for refractory HEAs (such as MoTiVFeNiZrCoCr) or for light Al-based HEAs with moderate density (3–5 g·cm−3) through mechanical alloying [5]. Nevertheless, high-temperature applications demand a sensible balance between strength and tensile ductility, and no known single-phase HEA satisfies such requirements. Perfectly tuned properties may be obtained by combining a soft matrix (bcc) with finely distributed intermetallics, a combination already known to improve hardness [6,7].
The design of new HEAs is driven by the principle of configurational entropy maximization, with consequent Gibb’s free energy reduction. This is mostly achieved by combining at least five principal elements at 5–35 at. % concentrations. However, the relative affinities of metals, synthetic route and mechanical treatments also play a role in the formation of single-phase HEAs. Therefore, trials have often led to the development of equimolar multicomponent alloys consisting of intermetallic compounds and solid solutions of different space groups [8,9]. As a matter of fact, many HEAs originally believed to consist of a single bcc or fcc phase contain minor inclusions and intermetallic phases when investigated by Powder X-ray Diffraction (PXRD), high-resolution scanning-electron microscope (SEM) and transmission electron microscope (TEM). It may therefore be necessary to extend the definition of a HEA to include these systems [10].
While models based exclusively on ternary phase diagrams fail to predict the formation of single phase HEAs, the information extracted from simple systems can certainly prove useful in directing new synthetic approaches.
In the current study, we focus on the key role played by multicomponent intermetallic compounds in the phase formation of equimolar HEAs containing elements likely to form complex ordered binary and especially ternary phases, such as Al, Cu and Sc [11]. We present the formation and disruption of ternary Al-Cu-Sc intermetallic compounds (Al4Cu4Sc and Al2Cu3Sc) in the equimolar AlCrCuScTi alloy. We highlight the effect of the degradation of these phases on density, hardness and crack formation.

2. Materials and Methods

2.1. Synthesis and Heat Treatment

The target alloy has been prepared using induction melting. Al, Cr, Cu, and Ti were taken as fine powders or grains (Goodfellows, Huntingdon, UK) and mixed with 1 mm Sc grains; metals were used in equiatomic proportions. The total mass of the melted sample was 10 g. The powders were pressed into a pellet (11 mm in diameter and 10–15 mm in height) using a steel press mould, under a pressure equivalent to 10 t. The pellet was placed in a BN crucible (Kennametal, Newport, UK) and melted using an induction coil in a glove-box operated under Ar pressure, in order to protect metals from high-temperature oxidation. Complete melting of the sample was achieved above 1600 °C. After 5 min at the melting temperature, the sample was cooled down naturally to room temperature. The as-melted material was thermally annealed in a dynamic vacuum (10−2 Pa) at 1000 °C for 4 h, followed by natural cooling to room temperature. Part of the homogenized sample was fast-heated (1–2 min) to 1400 °C using an induction coil in a glove-box and quenched in high purity hydrostatic oil. The three samples are referred to in the text as “as-melted”, “annealed” and “quenched”.

2.2. Material Characterization

All samples were mounted in carbonised resin, polished using MetaDiTM Supreme Polycrystalline Diamond Suspension (Buehler, Esslingen am Neckar, Germany) (1 μm) and etched with a 5% solution of HNO3 in ethanol.
Morphology and elemental composition were analysed using a Hitachi S-4800 Field Emission scanning-electron microscope (SEM, Hitachi, Tokyo, Japan) equipped with energy dispersive X-ray (EDX) analyser. The average elemental composition was obtained from 2.5 × 1.5 mm maps and locally.
Density was measured using flotation in water in the ATTENSION equipment (Biolin Scientific, Stockholm, Sweden). The results are an average of five measurements.
Vickers hardness was investigated on a WilsonR VH3100 Automatic Knoop/Vickers Hardness tester (Buehler, Esslingen am Neckar, Germany): 50–60 individual points under a 9.81 N (1 kg) testing load were measured to get statistically significant results. In order to investigate cracking phenomena, various forces of 2.94, 9.81, 19.62, 29.43, 49.04 and 98.10 N were applied. Lengths of indentation and cracks were measured using ×50 magnification with 0.2 μm accuracy.
Atomic-force microscope equipped with scanning Kelvin probe (AFM/SKP) measurements were performed in AC mode on the annealed alloy using a JPK NanoWizard3 Instrument (JPK, Berlin, Germany), equipped with a FM-50 Pointprobe® tip. The SKP scanning was performed at 10 nms−1 with 5 µms−1 speeds.
Powder X-ray diffraction profiles for the as melted and annealed powdered samples were collected at room temperature at the ID-09A beam-line at the ESRF (λ = 0.4145 Å, MAR 555 flat panel detector (marXperts GmbH, Norderstedt, Germany) company, city, country, beam size 10 × 15 μm2). LaB6 was used as external standard for calibration. For data analysis, two-dimensional images were first integrated to one-dimensional intensity counts as a function of diffraction angle using the FIT2D software (Version 18, ESRF, Grenoble, France, 2016). Phase identification was performed using the Crystallography Open Database and the Inorganic Crystal Structure Database.

3. Results

The data related to the average composition, density and hardness of the AlCrCuScTi alloy are summarized in Table 1.
The amount of Al in the sample is reduced during heat treatment. The high temperatures required by the synthetic route leads to the partial evaporation of Al. The alloy should therefore be considered quasi-equimolar. The density of the multicomponent homogeneous alloy (ρest) can be estimated using the following formula:
ρ est = c i A i c i A i ρ i
where ci, Ai and ρi are respectively concentration, atomic weight and density of the ith element. Density values for pure metals were taken from [12].
Both the as-melted and thermally annealed alloys show high brittleness and can be easily ground to a fine powder. Because of the easy formation of cracks during indentation, Vickers hardness of the quenched material can only be roughly estimated. The thermal annealing results in a drastic increase of hardness and decrease in the brittleness of the alloy. To compare the brittleness of the as-melted and annealed samples, indentations with various testing forces were performed. Since the indenter is bigger than the individual domains characteristic for the sample, no significant differences in hardness values were detected among different areas of indention. Anstis et al. demonstrated that the crack length forming in a material during Vickers indentation can be used to characterize ductile-brittle transitions in hard and soft materials. Indentation at various forces produces pyramid-shaped traces linked to material ductility, as well as symmetrical cracks related to the sample’s brittleness [13].
Plotting the logarithmic pressure load, LogP versus the logarithm of indentation length, Log(d), and versus the total length of crack, Log(2c), gives a straight line, whose slope is close to 2 and to 3/2 respectively (Figure 1). The intersection of the two lines identifies the critical load Pcrit. For P > Pcrit brittle cracks appear while for P < Pcrit only plastic deformation is observed. This methodology gives good estimated information about the ductile-brittle transition, especially if mechanical tests cannot be performed. The as-melted alloy displays cracks at the lowest load (2.94 N), and Pcrit can be estimated as 2.26 N. Since the material has a fairly uniform element distribution and microstructure, brittle cracks propagate in the volume over large distances. The annealed sample, on the other hand, has a more resilient grain structure due to the intermetallic phase, which inhibits cracks propagation in the matrix: the annealed alloy does not show crack formation at moderate loads (below 10 N) and above 10 N only small asymmetric cracks can be detected (Figure 3). Therefore, Pcrit can be estimated as 10 N approximately. Higher hardness (1.5 times greater) and critical load (at least 4 times greater), combined with suppressed crack propagation, make the annealed alloy more mechanically stable in comparison with the as-melted alloy.
The as-melted, annealed and quenched AlCrCuScTi alloy microstructures are presented in Figure 2. The thermal annealing results in a relatively rapid stress release and phase equilibration. According to pyrometric data recorded during induction melting, the melting temperature for AlCrCuScTi alloy can be estimated as 1200–1250 °C. As the annealing temperature was above 4/5 of the melting temperature it allows easier diffusion of metallic atoms in the sample and further homogenisation.
The as-melted alloy presents a homogeneous polished surface and an even distribution of elements. Its microstructure is dominated by large (50 µm) spear-like Cr-rich structures surrounded by Ti-rich areas (Figure 2G,J). Between them, Al, Sc and Cu are distributed in a relatively uniform matrix (Figure 2A,D).
After heat treatment, the alloy consists of evenly distributed hexagonal-shaped inclusions embedded in a uniform matrix (Figure 2C). However, atomic-force microscope equipped with scanning Kelvin probe (AFM-SKP) measurements performed between inclusions reveals the existence of a finer structure, a phase characterized by a different electrical potential grows along grain boundaries and over bigger grains (Figure 3). In fact, a few raised regions (of maximum height 0.7 µm) can be associated with a minor phase protruding slightly from the matrix, probably due to a higher hardness and resistance to polishing. Quite interestingly, the same areas are identified in the Volta potential map as having 150 mV lower potential values.
EDX analysis shows the dark inclusions to be Sc-rich, and surrounded by Cu-rich areas (Figure 2I,F,L). The grains consist of Al and Ti, while Cr segregates in areas far from those containing Sc.
The quenched sample has an intermediate microstructure between the as-melted and the annealed sample (Figure 2B,E,H,K). It is dominated by dendrite-like structures growing in a Cu/Ti-rich matrix Dendrites consist mostly of Al and Sc, with an inter-dendritic phase of Cr. The surface shows many defects and holes, which fill with carbon during the mounting operation.

4. Discussion

It has been shown for a number of Al-based alloys containing minor Sc and Cu additions that a noticeable microstructural feature is the appearance of a ternary phase having a ThMn12-type crystal structure with lattice parameters estimated as a = 8.63 Å, c = 5.10 Å [14]. Its formation and disruption after thermal annealing is responsible for the change in mechanical properties of the alloy. At the Al-rich corner of the Al-Cu-Sc ternary phase diagram, the Al-Cu-Sc W-phase forms by the combination of the Al-Cu phase (ϑ-phase, Al2Cu) and the Al-Sc phase (Al3Sc) [15,16]. Various compositions have been proposed for the W-phase—Al5–8Cu7–4Sc, Al5.4–8Cu6.6–4Sc, Al8−xCu4+xSc—but further studies are needed to determine the stability range of the phase, its homogeneity range and its detailed crystal structure.
Moreover, no studies have been performed on the Sc-rich corner of the Al-Cu-Sc phase diagram. As such, the as-melted AlCrCuScTi alloy here is the first example of W-phase formation in an over-saturated Sc alloy. The crystallization of the AlCrCuScTi alloy from a homogeneous melt can be driven by entropy with the formation of a high-entropy alloy or by the entropy of formation of binary and ternary compounds, with subsequent formation of multiphase composites. The formation of the W-phase as a main component of AlCrCuScTi alloy suggests an entropy driven pathway, which can be associated with the relatively high thermodynamic stability of Al-Cu-Sc ternary phases.
The XRD profile (Figure 4) of the as-melted alloy is dominated by cubic phases (fcc- and bcc-based alloys and partially ordered intermetallics, characterised by various cell parameters, ordering type and occupancies) and intermetallic compounds (Al3Sc, Al4Cu4Sc (W-phase) and Al2Cu3Sc—a ternary phase formed in Sc excess). The existing phases are summarized in Table 2: despite its extremely low formation enthalpy, Sc2O3 is not present. The inherent multiphase complex nature of the alloy makes realistic indexing of all lines impossible.
The W-phase appears disrupted in the quenched sample (Figure 2). Al and Sc segregate in the form of dendrite-like structures from the Cu matrix. Ultimately, the thermal annealing process leads to the coalescence of Sc from these structures. Conversely, the XRD profile of the annealed alloy (Figure 4) shows traces of the pre-existing Sc-containing ternary phases, and the formation of hcp alloys (a combination of Sc and Ti in different ratios).
The comparison between as-melted, heat-treated and quenched alloys highlights the major role played by temperature in the formation of different intermetallics. The instability of the W-phase is related to the high content of scandium in the sample. While Sc drives the formation of the W-phase in a kinetically determined reaction, its segregation pushes the disaggregation of the very same phase when the sample approaches thermodynamic equilibrium.
The formation of ternary Al-Cu-Sc phases in an equiatomic five-component system shows an important limitation in the design of single- or nearly single-phase high-entropy alloys. The crystallization of a ternary compound with relatively high thermodynamic stability causes the formation of multiphase composites. It seems that the formation of stable ternary compounds is preferable and cannot be suppressed by configurational entropy.

5. Conclusions

The present study reports the formation of Al2Cu3Sc and Al4Cu4Sc W-phase in the frame of High-Entropy Alloys development. The results show that:
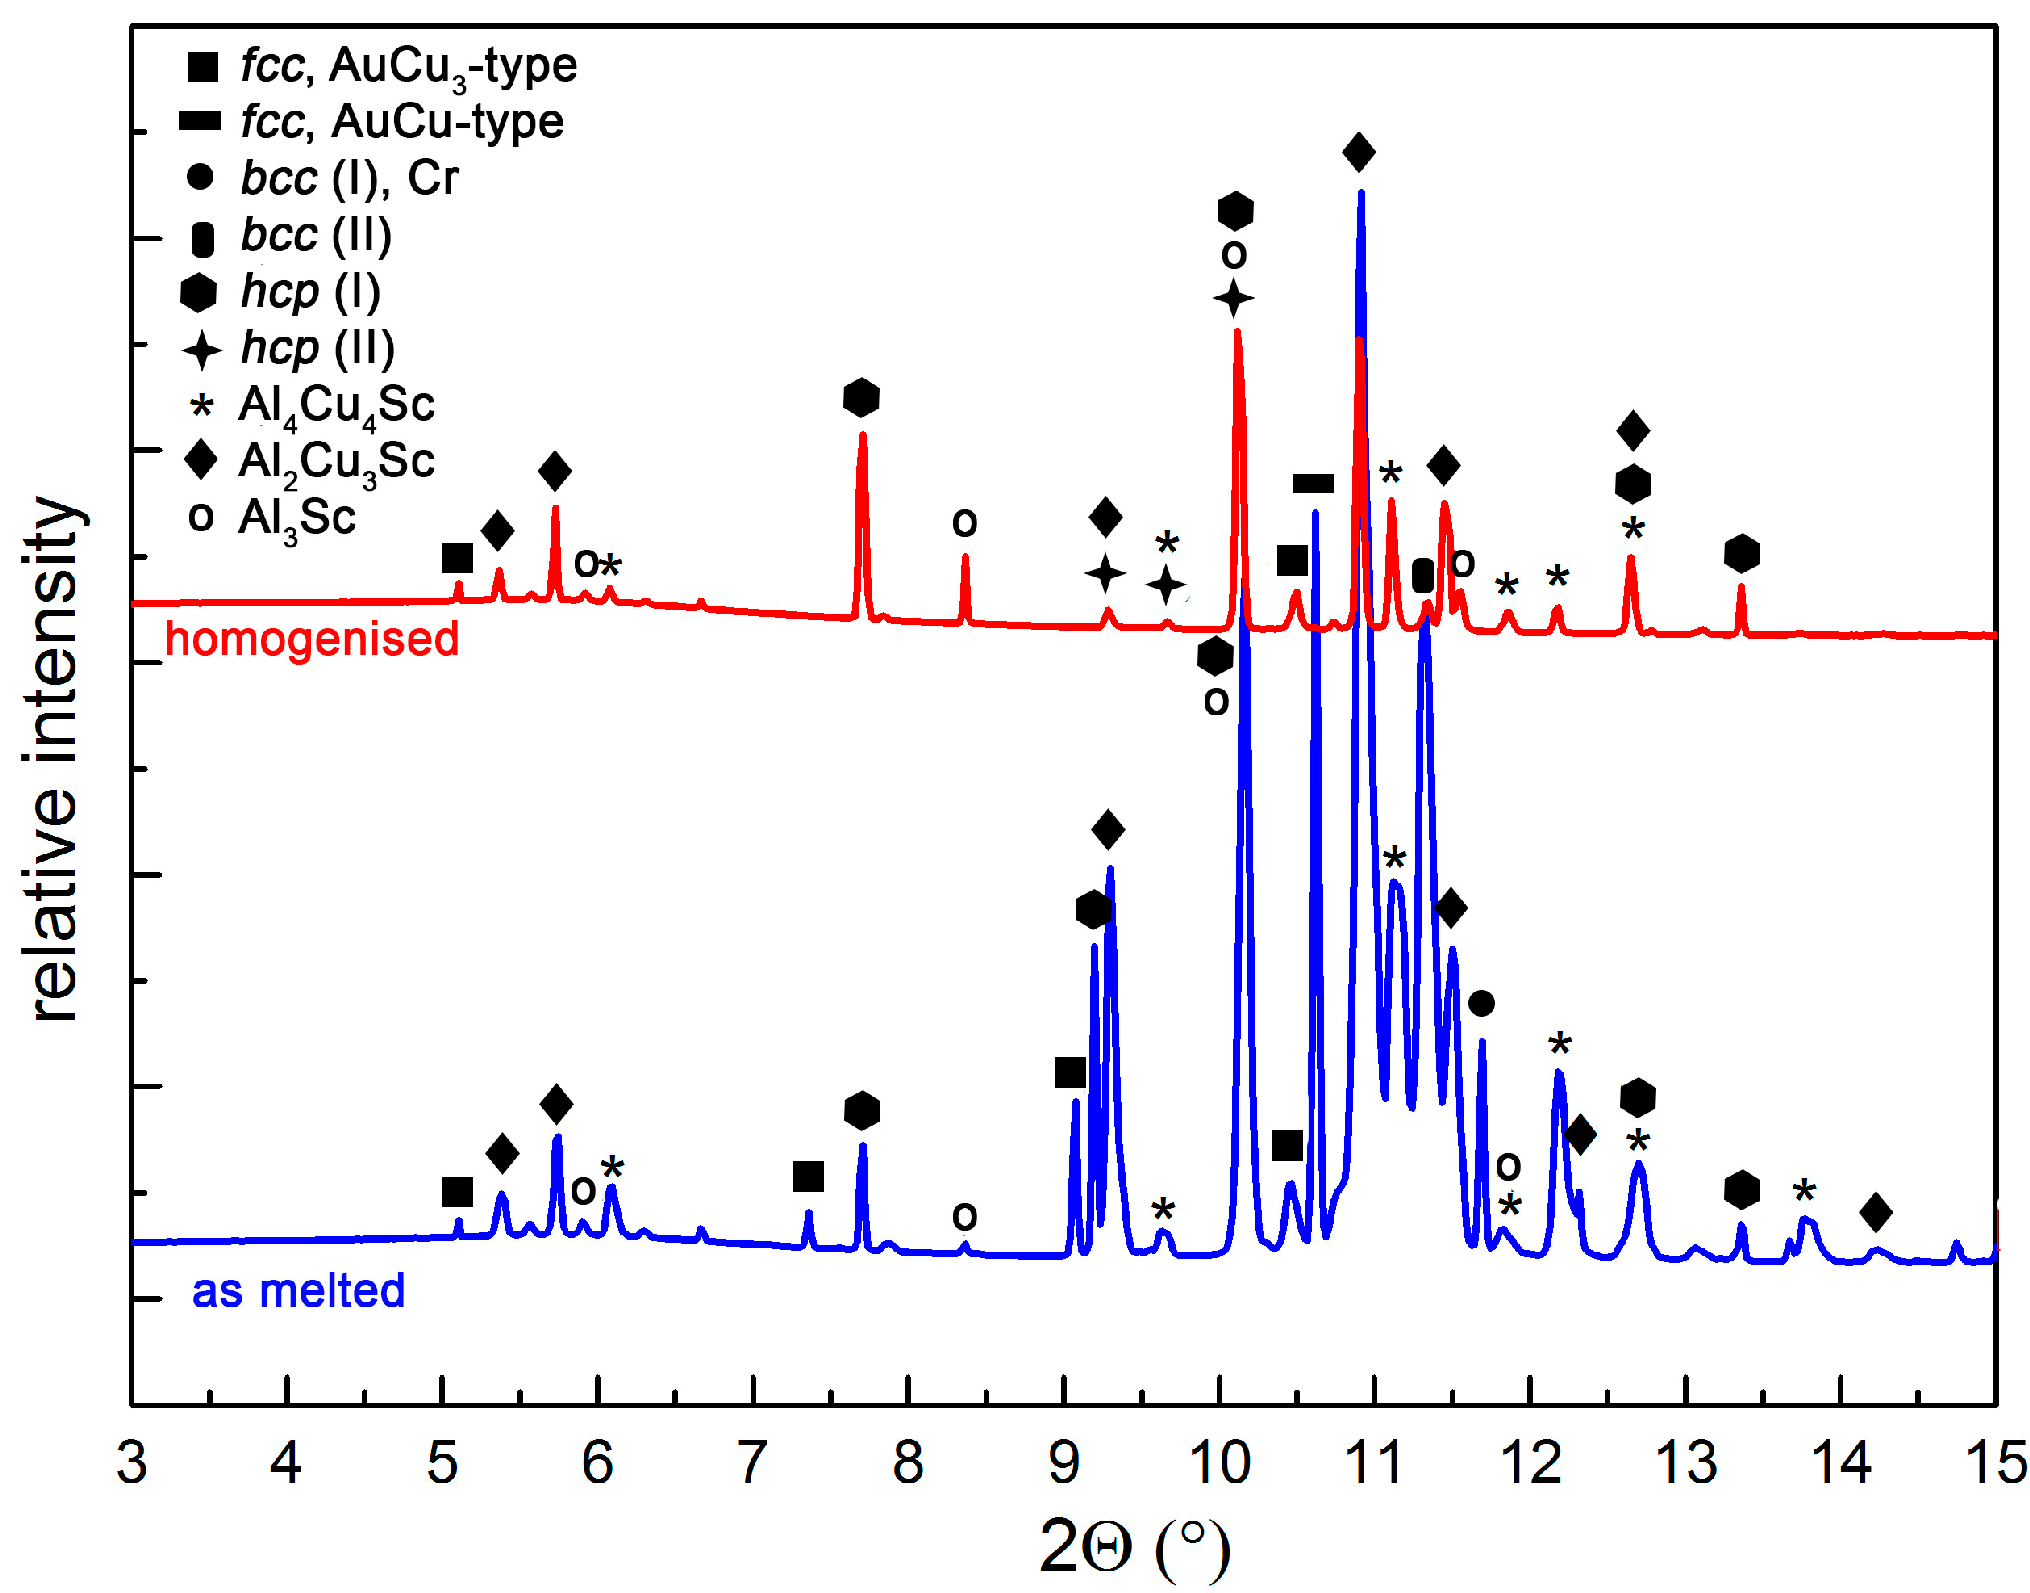
  • The high concentration of scandium required by equimolarity brings forth the formation of intermetallic compounds, preventing the formation of a single phase. Among them, formation of Al2Cu3Sc compound has been detected for the first time in a multicomponent alloy.
  • The synthesis of a single-phase Al, Cu and Sc containing HEA is not compatible with melting from powders, due to the formation of stable intermetallic compounds.
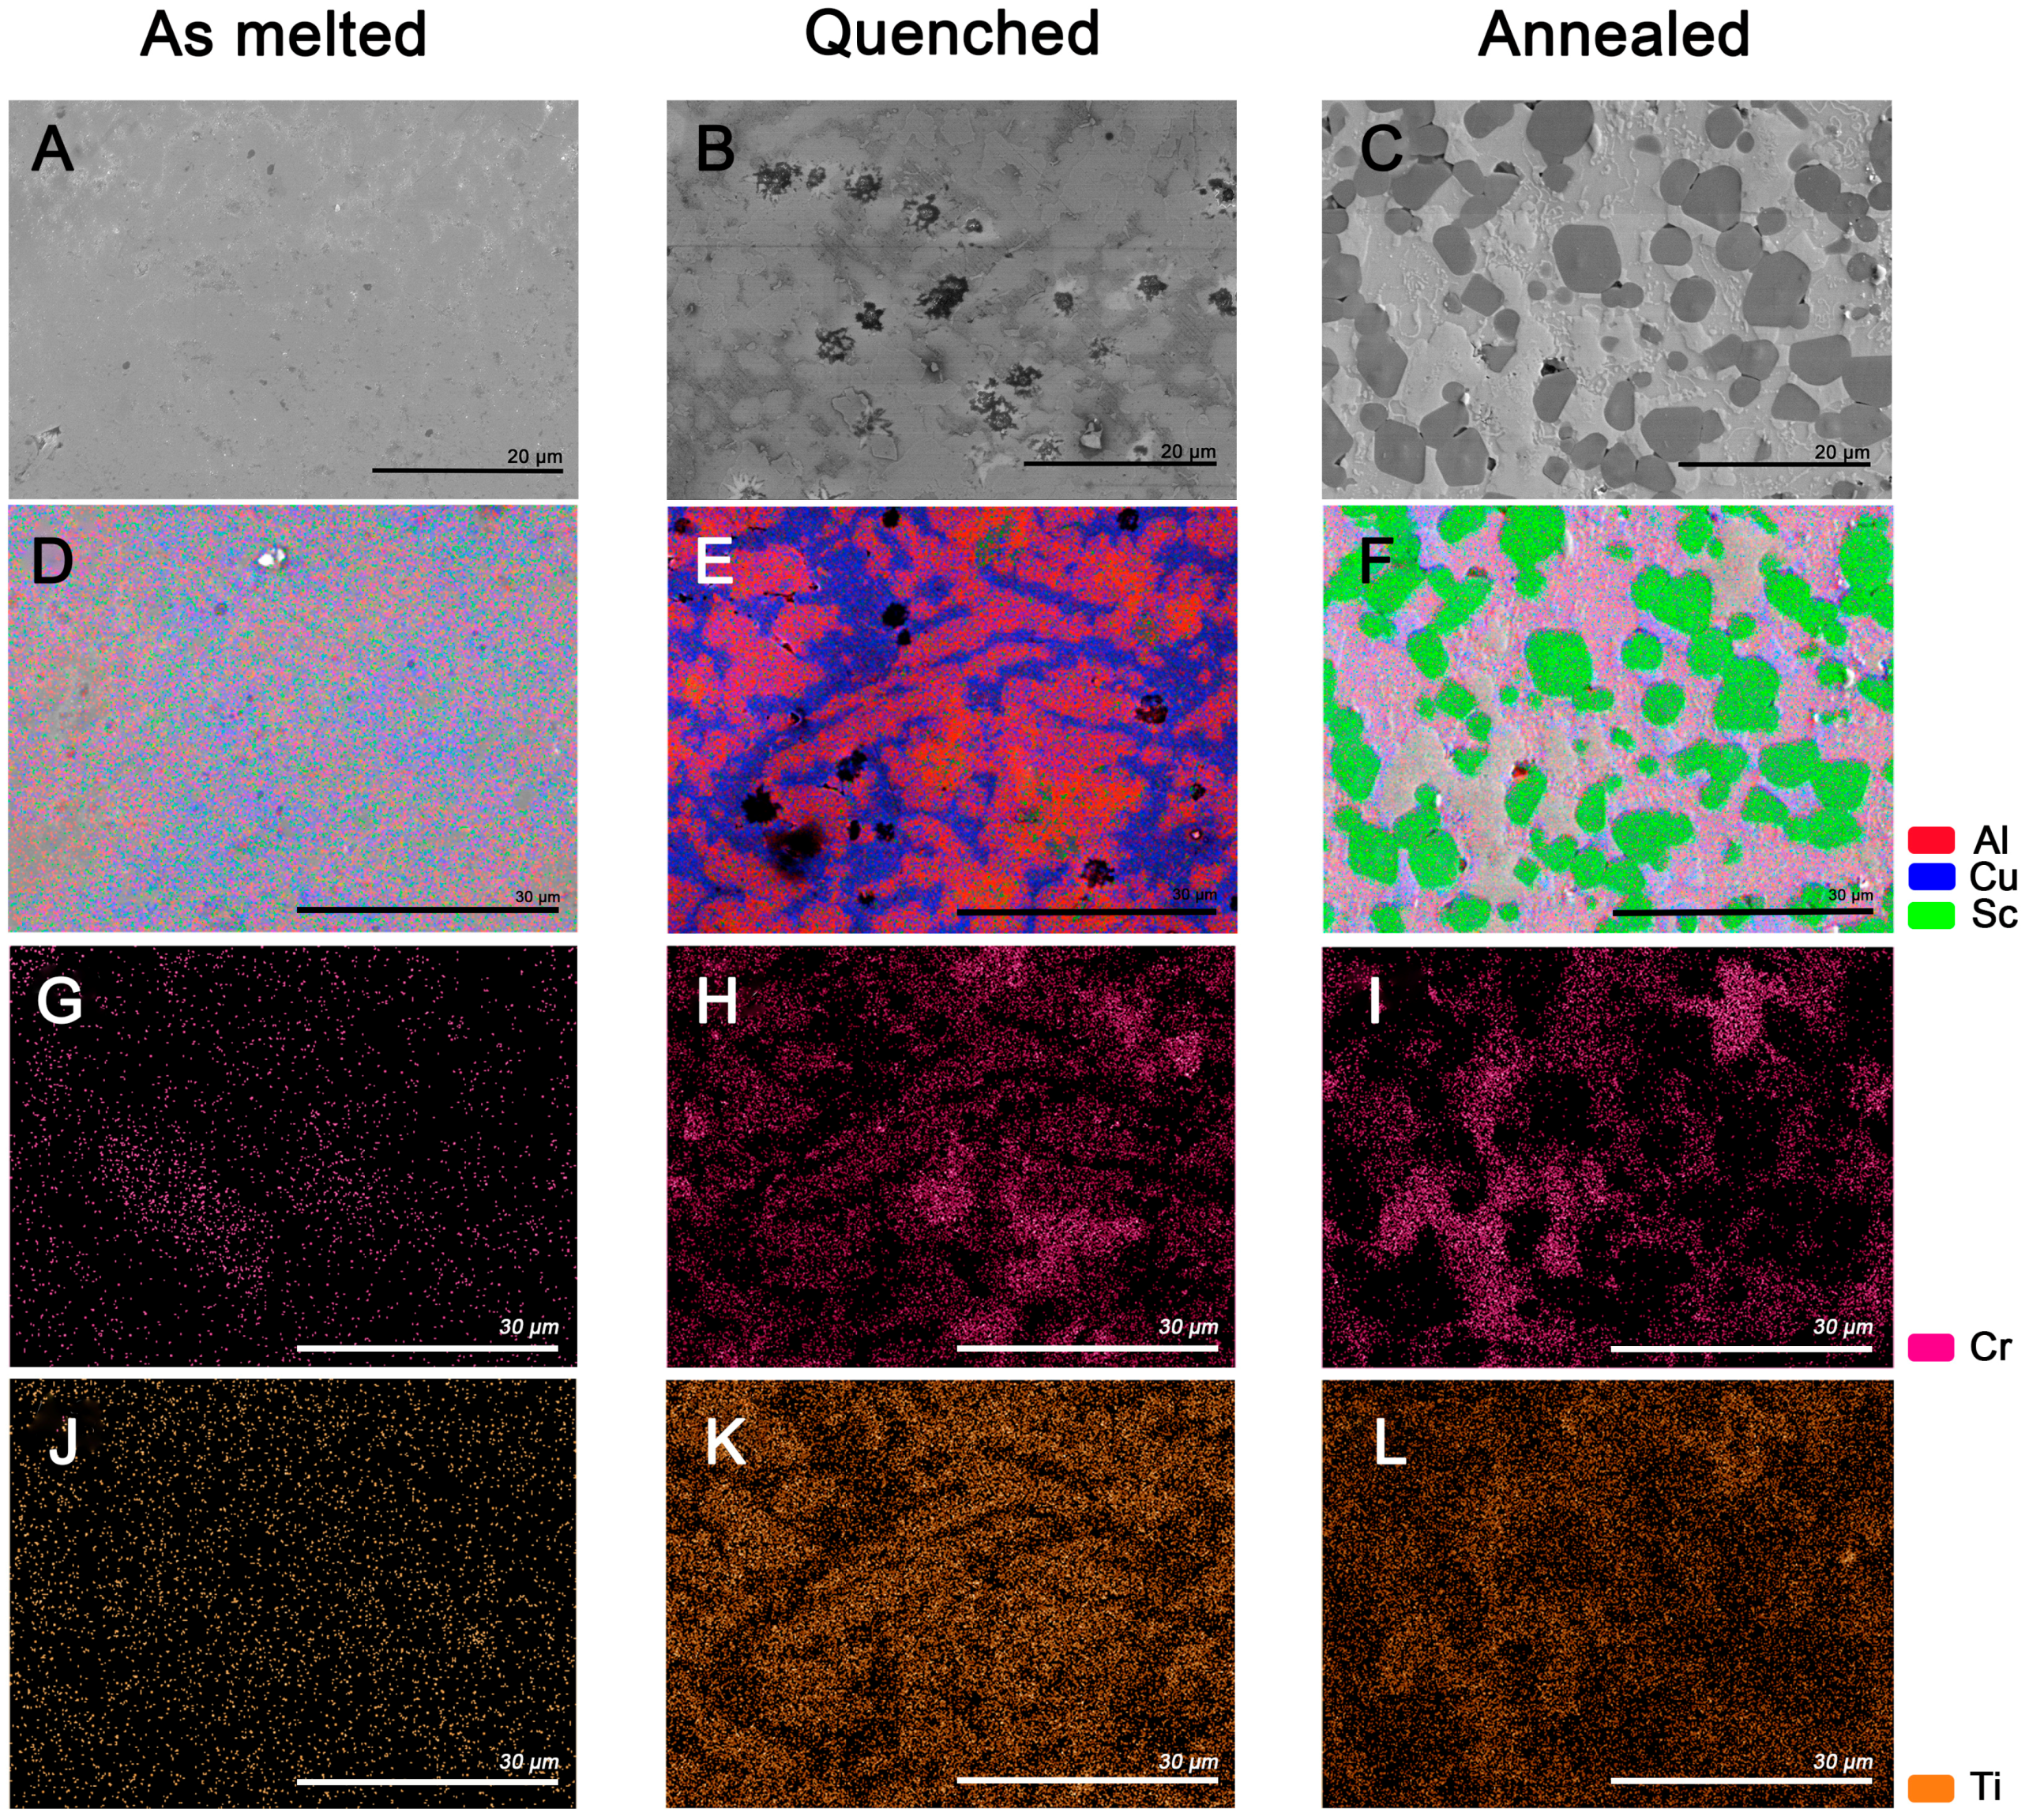
  • The product of the W-phase degradation following heat-treatment is a combination of intermetallics in a soft hcp-Sc/Ti alloy matrix. The thermally annealed alloy has increased hardness (890 HV) and crack resistance.

Acknowledgments

The authors gratefully acknowledge the financial support provided by the Welsh Government and Higher Education Funding Council for Wales through the Sêr Cymru National Research Network in Advanced Engineering and Materials, and the Materials Advanced Characterisation Centre (MACH1) at Swansea University. The authors thank European Synchrotron Radiation Facility (ESRF, France) for providing us measurement time and support.

Author Contributions

Sephira Riva and Kirill V. Yusenko conceived and designed the experiments; Sephira Riva and Kirill V. Yusenko performed synthetic and analytical experiments including synchrotron-based PXRD and analyzed data; Sephira Riva and Chung M. Fung performed SEM experiments; Sephira Riva, Ronald N. Clark and Justin R. Searle performed AFM experiments; Nicholas P. Lavery and Stephen G.R. Brown contributed to the experiment design and data evaluation; Nicholas P. Lavery is the director of the MACH1 centre, and he built and developed the materials synthesis equipment and methodology; all authors contributed equally writing the paper.

Conflicts of Interest

The authors declare no conflict of interest.

Abbreviations

The following abbreviations are used in this manuscript:
SEM-EDXScanning electrode microscope equipped with energy dispersed X-ray analyzer
AFMAtomic force microscopy
SKPScanning Kelvin probe
PXRDPowder X-ray diffraction

References

  1. Samaei, A.T.; Mirsayar, M.M.; Aliha, M.R.M. Microstructure and mechanical behaviour of modern high temerature alloys. Eng. Sol. Mech. 2015, 3, 1–20. [Google Scholar] [CrossRef]
  2. Pogrebnjak, A.D.; Bagdasaryan, A.A.; Yakushchenko, I.V.; Beresnev, V.M. The structure and properties of high-entropy alloys and nitride coatings based on them. Russ. Chem. Rev. 2014, 83, 1027–1061. [Google Scholar] [CrossRef]
  3. Zhang, Y.; Zuo, T.T.; Tang, Z.; Gao, M.C.; Dahmen, K.A.; Liaw, P.K.; Lu, Z.P. Microstructures and properties of high-entropy alloys. Prog. Mater. Sci. 2014, 61, 1–93. [Google Scholar] [CrossRef]
  4. Senkov, O.N.; Wilks, G.B.; Miracle, D.B.; Chuang, C.P.; Liaw, P.K. Refractory high-entropy alloys. Intermetallics 2010, 18, 1758–1765. [Google Scholar] [CrossRef]
  5. Pradeep, K.G.; Wanderka, N.; Choi, P.; Banhart, J.; Murty, B.S.; Raabe, D. Atomic-scale compositona characterization of a nanocrystalline AlCrCuFeNiZn high-entropy alloy using atom probe tomography. Acta Mater. 2013, 61, 4696–4706. [Google Scholar] [CrossRef]
  6. Fu, Z.; Chen, W.; Xiao, H.; Zhou, L.; Zhu, D.; Yang, S. Fabrication and properties of nanocrystalline Co0.5FeNiCrTi0.5 high entropy alloy by MA-SPS technique. Mater. Des. 2013, 44, 535–539. [Google Scholar] [CrossRef]
  7. Dong, Y.; Lu, Y.; Kong, J.; Zhang, J.; Li, T. Microstructure and mechanical properties of multi-component AlCrFeNiMox high-entropy alloys. J. Alloy. Compd. 2013, 537, 96–101. [Google Scholar] [CrossRef]
  8. Li, L.; Huang, L.; Song, X.; Ye, F.; Lin, J.; Cheng, G. Microstructure and performance of TiAlBeSc alloys with low density. Rare Met. Mater. Eng. 2012, 5, 826–829. [Google Scholar] [CrossRef]
  9. Lin, Y.C.; Cho, Y.H. Elucidating the microstructural and tribological characteristics of NiCrAlCoCu and NiCrAlCoMo multicomponent alloy cladlayers synthesized in situ. Surf. Coat. Technol. 2009, 203, 1694–1701. [Google Scholar] [CrossRef]
  10. Santodonato, L.J.; Zhang, Y.; Feygenson, M.; Parish, C.M.; Gao, M.C.; Weber, R.J.K.; Neuefeind, J.C.; Tang, Z.; Liaw, P.K. Deviation from high-entropy configurations in the atomic distribution of a multi-principal-element alloy. Nat. Commun. 2015, 6. [Google Scholar] [CrossRef] [PubMed]
  11. Riva, S.; Yusenko, K.Y.; Lavery, N.P.; Jarvis, D.J.; Brown, S.G.R. The scandium effect in multicomponent alloys. Int. Mater. Rev. 2016. [Google Scholar] [CrossRef]
  12. Haynes, W.M. CRC Handbook of Chemistry and Physics: A Ready-Reference Book of Chemical and Physical Data, 96th ed.; CRC Press: Boca Raton, FL, USA, 2015; p. 2766. [Google Scholar]
  13. Anstis, G.R.; Chantikul, P.; Lawn, B.R.; Marshall, D.B. A critical evaluation of indentation techniques for measuring fracture toughness: I, Direct crack measurements. J. Am. Ceram. Soc. 1981, 64, 533–538. [Google Scholar] [CrossRef]
  14. Kharakterova, M.L. Phase composition of Al-Cu-Sc alloys at temperatures of 450 and 500 °C. Russ. Metall. 1991, 4, 195–199. [Google Scholar]
  15. Gazizov, M.; Teleshov, V.; Zakharov, V.; Kaibyshev, R. Solidification behaviour and the effects of homogenisation on the structure of an Al-Cu-Mg-Ag-Sc alloy. J. Alloy. Compd. 2011, 509, 9497–9507. [Google Scholar] [CrossRef]
  16. Norman, A.F.; Prangnell, P.B.; McEwen, R.S. The solidification behaviour of dilute aluminium-scandium alloys. Acta Mater. 1998, 46, 5715–5732. [Google Scholar] [CrossRef]
Figure 1. Optical microscope image of the indentation of the as-melted alloy with 9.81 N load (A) and of the annealed alloy with 29.43 N load (B) (the arrow shows the formation and prolongation of a single crack); (C) LogP vs. Log(d) and Log(2c) plots for as-melted alloy; (D) LogP vs. Log(d) plot for annealed alloy (two points at low loadings show no cracks formation, tree data-points at high load pressure display moderate crack formation).
Metals 06 00106 g001
Figure 2. SEM images of as melted (A), quenched (B) and annealed (C) AlCrCuScTi alloy. EDX elemental composition maps of Al, Cu and Sc for as melted (D), quenched (E) and annealed (F) AlCrCuScTi alloy respectively. EDX elemental composition maps of Cr distribution for as melted (G), quenched (H) and annealed (I) AlCrCuScTi alloy respectively. EDX elemental composition maps of Ti distribution for as melted (J), quenched (K) and annealed (L) AlCrCuScTi alloy respectively.
Metals 06 00106 g002
Figure 3. Thermally annealed AlCrCuScTi alloy: AFM (A) and SKP (B) images.
Metals 06 00106 g003
Figure 4. A comparison of PXRD profiles for the as-melted (below) and annealed (above) AlCrCuScTi alloy (λ = 0.4145 Å).
Metals 06 00106 g004
Table 1. Properties of as-melted, annealed and quenched AlCrCuScTi alloy.
AlCrCuScTiAverage Composition (±0.5 at. %) from 2.5 mm × 1.5 mm MapsDensity (±0.02 g·cm−3)Hardness
AlCrCuScTiHVMPa
Nominal20202020204.71 (estimated)--
As melted21.720.021.617.419.34.84636 ± 276237 ± 267
Annealed16.719.119.523.323.34.83890 ± 208728 ± 196
Quenched18.122.320.220.520.8-797 ± 107816 ± 98
Table 2. Phases in the as melted and annealed AlCrCuScTi alloy, according to PXRD profiles.
PhaseAs-Melted AlloyAnnealed Alloy
fcc AuCu3-typeYesTraces
fcc AuCu-typeYesNo
bcc (I) CrYesNo
bcc (II)YesTraces
hcp (I)YesYes
hcp (II)NoYes
Al4Cu4ScYesTraces
Al2Cu3ScYesTraces
Al3ScTracesTraces

