Article

Investigation of the Failure of Advanced High Strength Steels Heterogeneous Spot Welds

1
Laboratoire MATEIS, CNRS UMR5510, Université de Lyon, INSA-Lyon, Villeurbanne Cedex, Lyon F-69621, France
2
ArcelorMittal Global Research and Development Maizières, Maizières-lès-Metz Cedex, Metz F-57283, France
*
Author to whom correspondence should be addressed.
Metals 2016, 6(5), 111; https://doi.org/10.3390/met6050111
Submission received: 7 April 2016 / Revised: 26 April 2016 / Accepted: 3 May 2016 / Published: 13 May 2016

Abstract

:
Nowadays, environmental regulation encourages carmakers to reduce the global vehicle weight. Steelmakers develop grades with high performance (Advanced High Strength Steels, AHSS) and fine steel sheet assemblies are used in car body structures, with an optimized thickness in each part. However, unusual fracture modes are sometimes observed during the mechanical tests of heterogeneous AHSS welds, made of dissimilar steel grades and sheet thicknesses. Weld fractures can occur with a strength lower than expected. This study aims at understanding these fracture mechanisms and focuses on two common steel grades joined by Resistance Spot Welding (RSW): DP600 (a dual phase steel) and Usibor®1500 (a martensitic steel). The parameters affecting the failure modes and load bearing capacity are investigated during two common types of tests: the Cross Tension and Tensile Shear tests. The positive effects of heterogeneous welding with respect to the corresponding homogeneous configurations are discussed, as well as the consequences of a so-called Dome failure occurring at the weld nugget boundary.

Graphical Abstract

1. Introduction

Nowadays, car manufacturers have to consider the environmental regulation and need to reduce the global vehicle weight. On the other hand, they are expected to produce vehicles with high durability and best protection in case of accident. It is thus necessary to develop new materials that allow reducing the weight and strengthening the structure. Fine steel sheet assemblies with different thicknesses optimizing each part of the assembly are used and steelmakers develop steel grades with a good compromise between mechanical strength and ductility, namely Advanced High Strength Steel (AHSS). However, the so-called third generation of these steels has different physical and metallurgical characteristics (thermal conductivity, hardenability, etc.), which could interfere with usual welding processes. Moreover, when the use of AHSS in vehicle structures is targeted, the designers often have to join different steel grades together, which corresponds to a heterogeneous welding situation.
During the mechanical tests of heterogeneous AHSS welds, complex failure modes may be observed in addition to the usual Button Pull-Out (BPO or mode 1 in the classification of the American Welding Society, AWS [1]) and Full or Partial Interfacial Failures (FIF, AWS mode 8 or PIF, AWS modes 4 and 5). Namely, additional situations such as Partial or Total Dome Failures (PDF or TDF, AWS mode 3) are sometimes observed, corresponding to fracture along the interface between the Heat Affected Zone (HAZ) and the Fusion Zone (FZ). They are observed following usual standards to determine the weldability [2,3,4]. In these standards, Cross Tension and Tensile Shear tests (Figure 1) are mainly used to assess the weld performance. These fractures generally occur with a strength lower than expected. The interface appears like a weak point and such failure modes may be rejected by carmakers even if the load bearing capacity remains higher than the specified criterion.
The geometrical parameters of weld assemblies are known to directly influence their mechanical response. Among these parameters, the weld nugget diameter and the corresponding sheet thickness are among the most important and strongly affect the mechanical behavior of spot welds. Numerous authors use them directly to express the spot weld strength [5,6,7,8,9]. Others insist also on the role of the steel microstructure in the spot weld zone [10,11,12]. The weld nugget size is in fact the main varying parameter with the increase of welding current intensity during the determination of the welding range for a given sheet configuration. Some authors (e.g., Chao [9] and others [13,14,15,16,17]) focused on the failure mode transition with increasing weld diameter, proposing simple analytical relations expressing the transition from Interfacial Failure to Button Pull-Out. However, these simple relations usually fail to predict the fracture mode when heterogeneous configurations are considered.
Spot weldability of steels is generally assessed in the labs using homogeneous welding (identical steel sheets welded together), while heterogeneous welding is in fact a common situation in the automotive industry. Investigating it can become a tedious problem because of the number of possible steel sheet combinations. Such investigations are however necessary in the global context of vehicle structure optimization introduced above. As a consequence, a number of studies have been dedicated since the 2000s to AHSS welding [8,17,18,19,20,21,22,23,24,25] and their heterogeneous configurations [15,26,27,28,29]. Several conclusions can be highlighted in this context: (i) the frequent existence of a critical nugget diameter for failure mode transition (depending on sheet thicknesses) [13]; (ii) the fact that the failure mode of spot welds is not a characteristic of their strength [19]; and (iii) the positive deviation of Cross Tension Strength (CTS) observed for AHSS dissimilar spot welding configurations [14]. Among these studies, most were obtained in Tensile Shear, much fewer in Cross Tension (e.g., Khan [16], Biro [30]) and, to the knowledge of the authors, none considering simultaneously these two complementary loading modes on the same heterogeneous spot welds.
The present study focuses on the heterogeneous welding of Usibor®1500 and DP600 steels. Homogeneous welding of Usibor®1500 (Hot-Stamped 22MnB5) was studied in different perspectives. First, Youn-Suk [18] focused on the microstructure of homogeneous Usibor®1500 spot welds and linked the hardness profile with fine microstructure observation. Second, a thermal study of RSW on homogeneous Usibor®1500 was done by Hong-Seok [20]. Concerning heterogeneous welding of Usibor®1500, results can be found in the literature about a Usibor®1500-DP780 steel [27]. However, the combined effect steel grade and thickness heterogeneity was not thoroughly explored to date. Therefore, it is proposed here to study the sheet thickness influence on heterogeneous welding of Usibor®1500 with DP600 steels. Different sheet thickness configurations will be chosen and the assemblies weldability according to the ISO standards will be characterized. Cross tension and tensile shear tests will be carried out and the resulting strengths and microstructures will be compared. Particular attention will be paid to failure modes and fracture mechanisms observations.

2. Materials and Methods

2.1. Materials

Two AHSS automotive steel grades were investigated in this study: Usibor®1500 (ArcelorMittal, Mouzon, France), a hot-stamped 22MnB5 martensitic steel and DP600 (ArcelorMittal, Florange, France), a Dual Phase steel. They were available in cold rolled and annealed state. Usibor®1500 is coated with a 25 µm thick AluSi® coating (ArcelorMittal, Mouzon, France) and presents a high strength (~1500 MPa) due to its martensitic nature (Figure 2a). DP600 is made of a ferritic matrix with hard phase islets (usually martensite, Figure 2b). The ferritic phase ensures an important ductility while hard phase content leads the mechanical resistance. DP600 is coated with pure zinc (10 µm thick GI coating). Two sheet thicknesses (1.2 mm and 2 mm) were used for each grade in the welding configurations. The chemical compositions of the corresponding base materials are collected in Table 1.

2.2. Welding and Testing Procedure

The steel sheets were cut into 125 × 38 mm coupons along the transverse direction and resistance spot welded following ISO 18278-2 standard [2]. Four configurations with a different sheet combination, as detailed in Table 2, were welded with a SCHLATTER Selecta P2 machine (SCHLATTER, Zurich, Switzerland) with 50 Hz alternating current. Welding current ranges were identified for each configuration, as defined in the ISO standard [2] by a minimum welding intensity corresponding to a minimal nugget size and a maximum intensity corresponding to the appearance of expulsion. Once the range was identified, three intensities were chosen representing the lower end, middle and upper end of the welding range. Seven spots were welded for each intensity, resulting in 21 spot welds for one configuration. Among the seven spot welds, one was used for micrographic observations, three for Cross Tension test [3] and three for Tensile Shear test [4]. During all experiments (from welding to observations), Usibor®1500 was taken as the upper sheet.
Mechanical tests were carried out on Zwick tensile machine (Zwick GmbH & Co. KG, Ulm, Germany) with a 100 kN load cell at a crosshead speed of 15 mm/min. Special hydraulic jaw assemblies were used in cross tension [3] and tensile shear [4], according to the standards.
Two important characteristics of spot weld fracture are usually extracted and compiled after such destructive tests: failure load and failure mode. While the former is explicitly defined by the maximum load reached during the test, the latter refers to a specific classification (Figure 3) and measurement procedure described in the following. Mild steel spot welds usually fail by Button Pull-Out (BPO) or Full Interfacial Failure (FIF). AHSS usually present additional failure modes: Partial Interfacial Failure (PIF) but also the so-called Total (or Partial) Dome Failure, where the fracture path follows the FZ-HAZ interface.
Failure modes are investigated with the naked eyes first. If a button was formed, its diameter is measured using a vernier caliper along two perpendicular directions. Moreover, in all cases but BPO, the weld nugget size is investigated using an eye magnifier to allow measuring the interfacial diameter.

2.3. Microstructure Investigations

Metallographic observations were done on the undamaged dedicated sample of each configuration in order to characterize the weld geometry, but also on broken cross tension and tensile shear samples to identify the failure zones. Samples were cut at the middle section, polished and chemically etched. Chemical etching was composed of two chemical reagents, Béchet-Beaujard (Picric acid) and Nital 3%. Béchet-Beaujard allows first revealing the molten nugget perimeter, then Nital 3% reveals ferritic and martensitic microstructures. Microscopic observations were done using a Zeiss Imager A1m device (ZEISS, Sartrouville, France).
Micro-hardness tests were carried out on metallographic samples to characterize the Heat Affected Zones (HAZ) and Fusion Zone (FZ). These measurements were done with a EMCOTEST M1C010 device (EMCO-TEST, Kuchl, Austria) with a 500 g Vickers setting (HV0.5). All profile lines began with Usibor®1500 base metal zone, went through the fusion zone and ended within the DP600 base metal.
SEM observations on fracture surfaces were done to determine the fracture mechanisms. These observations were done using JEOL6390 device (JEOL Europe, Croissy, France) with secondary electron detector.

3. Results

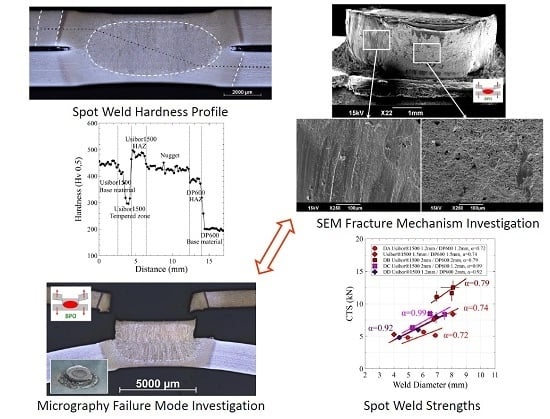
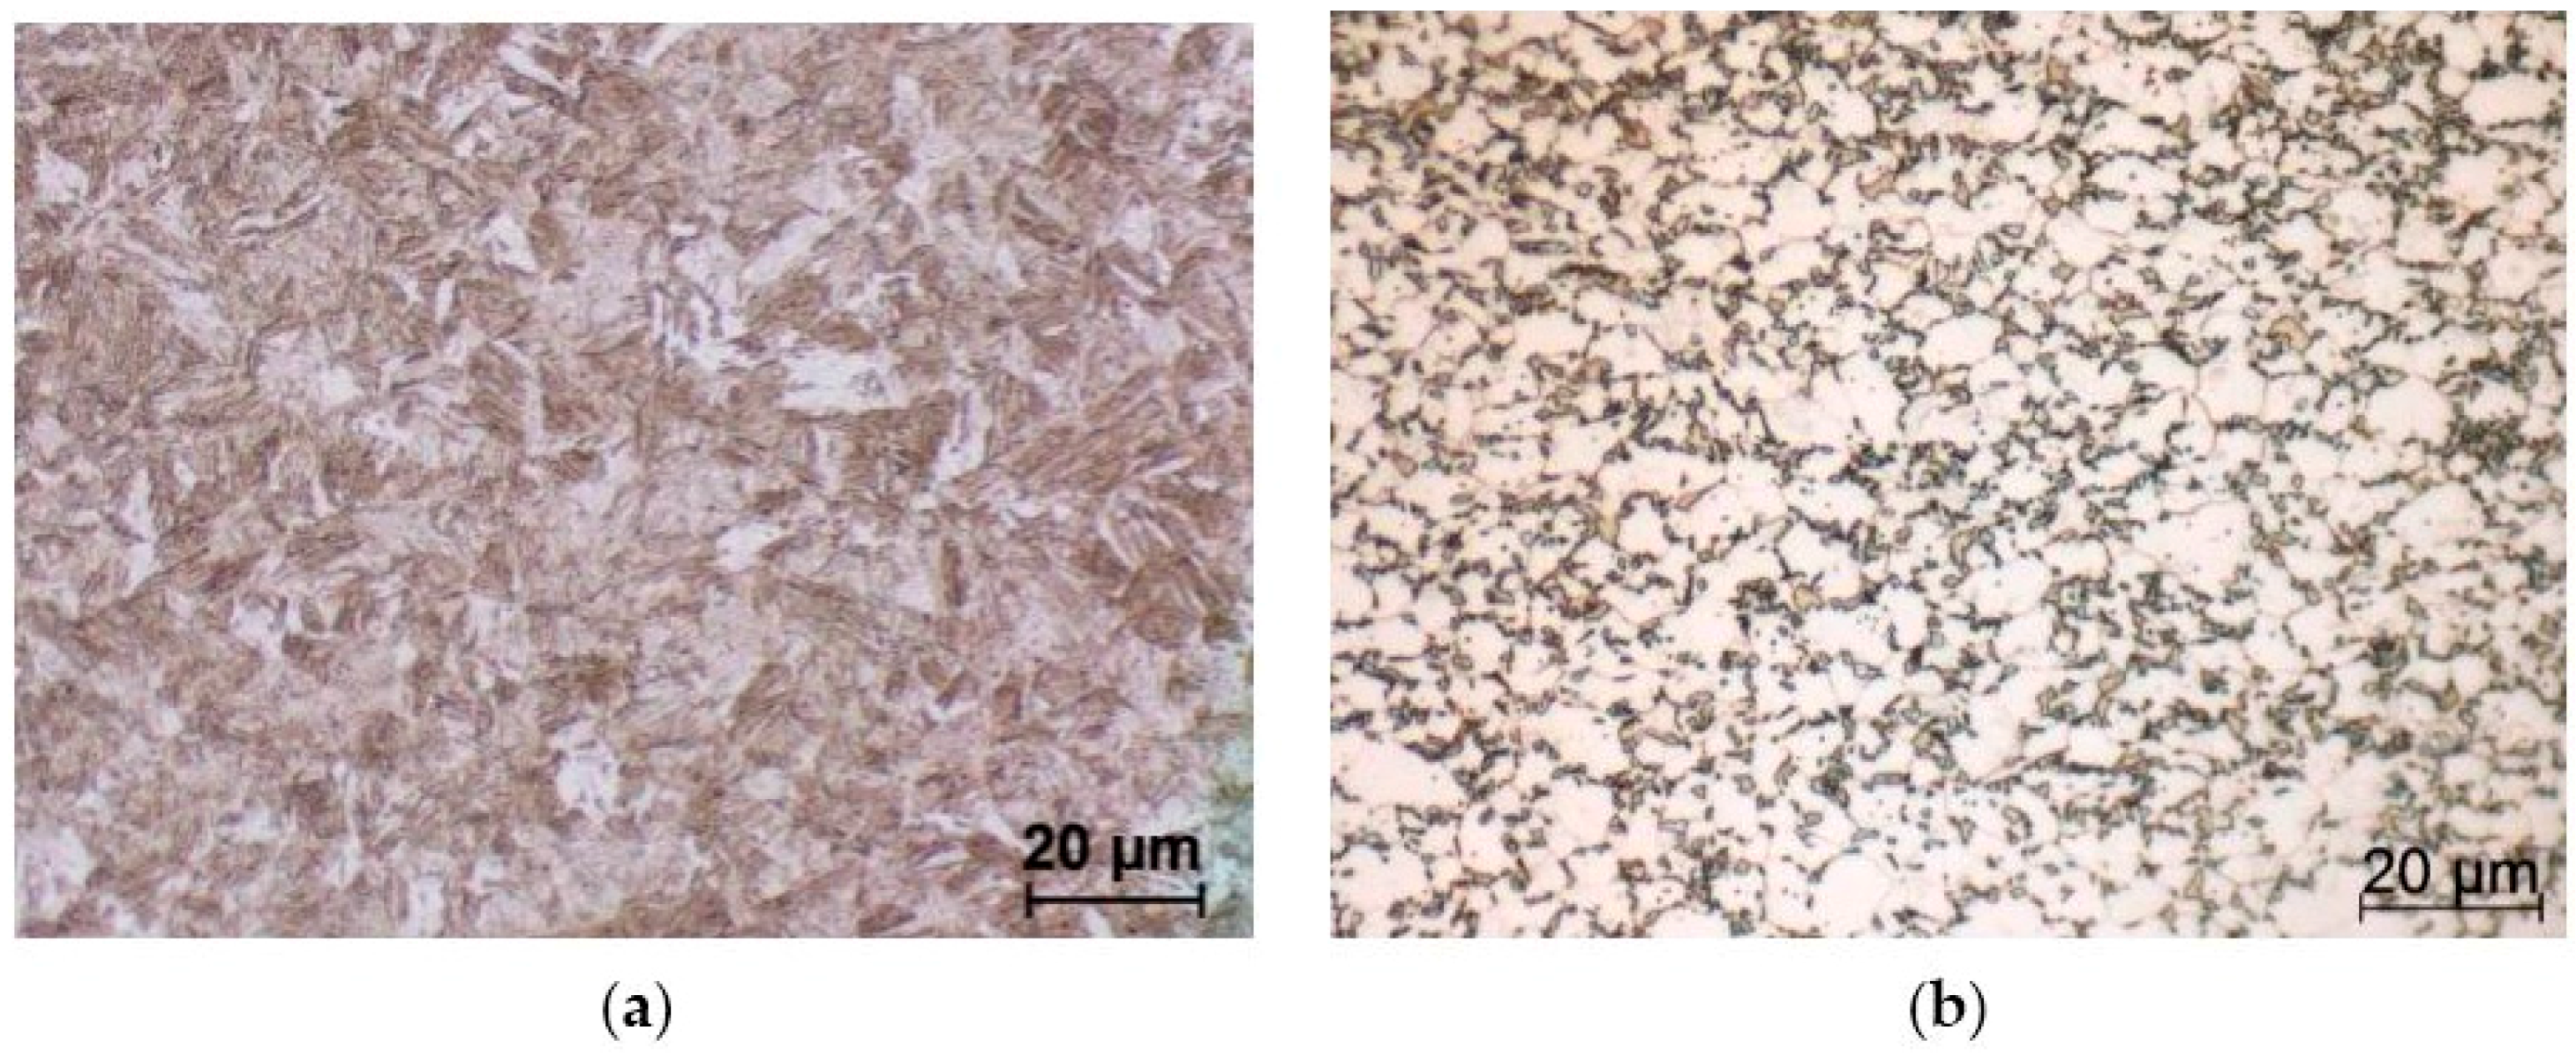
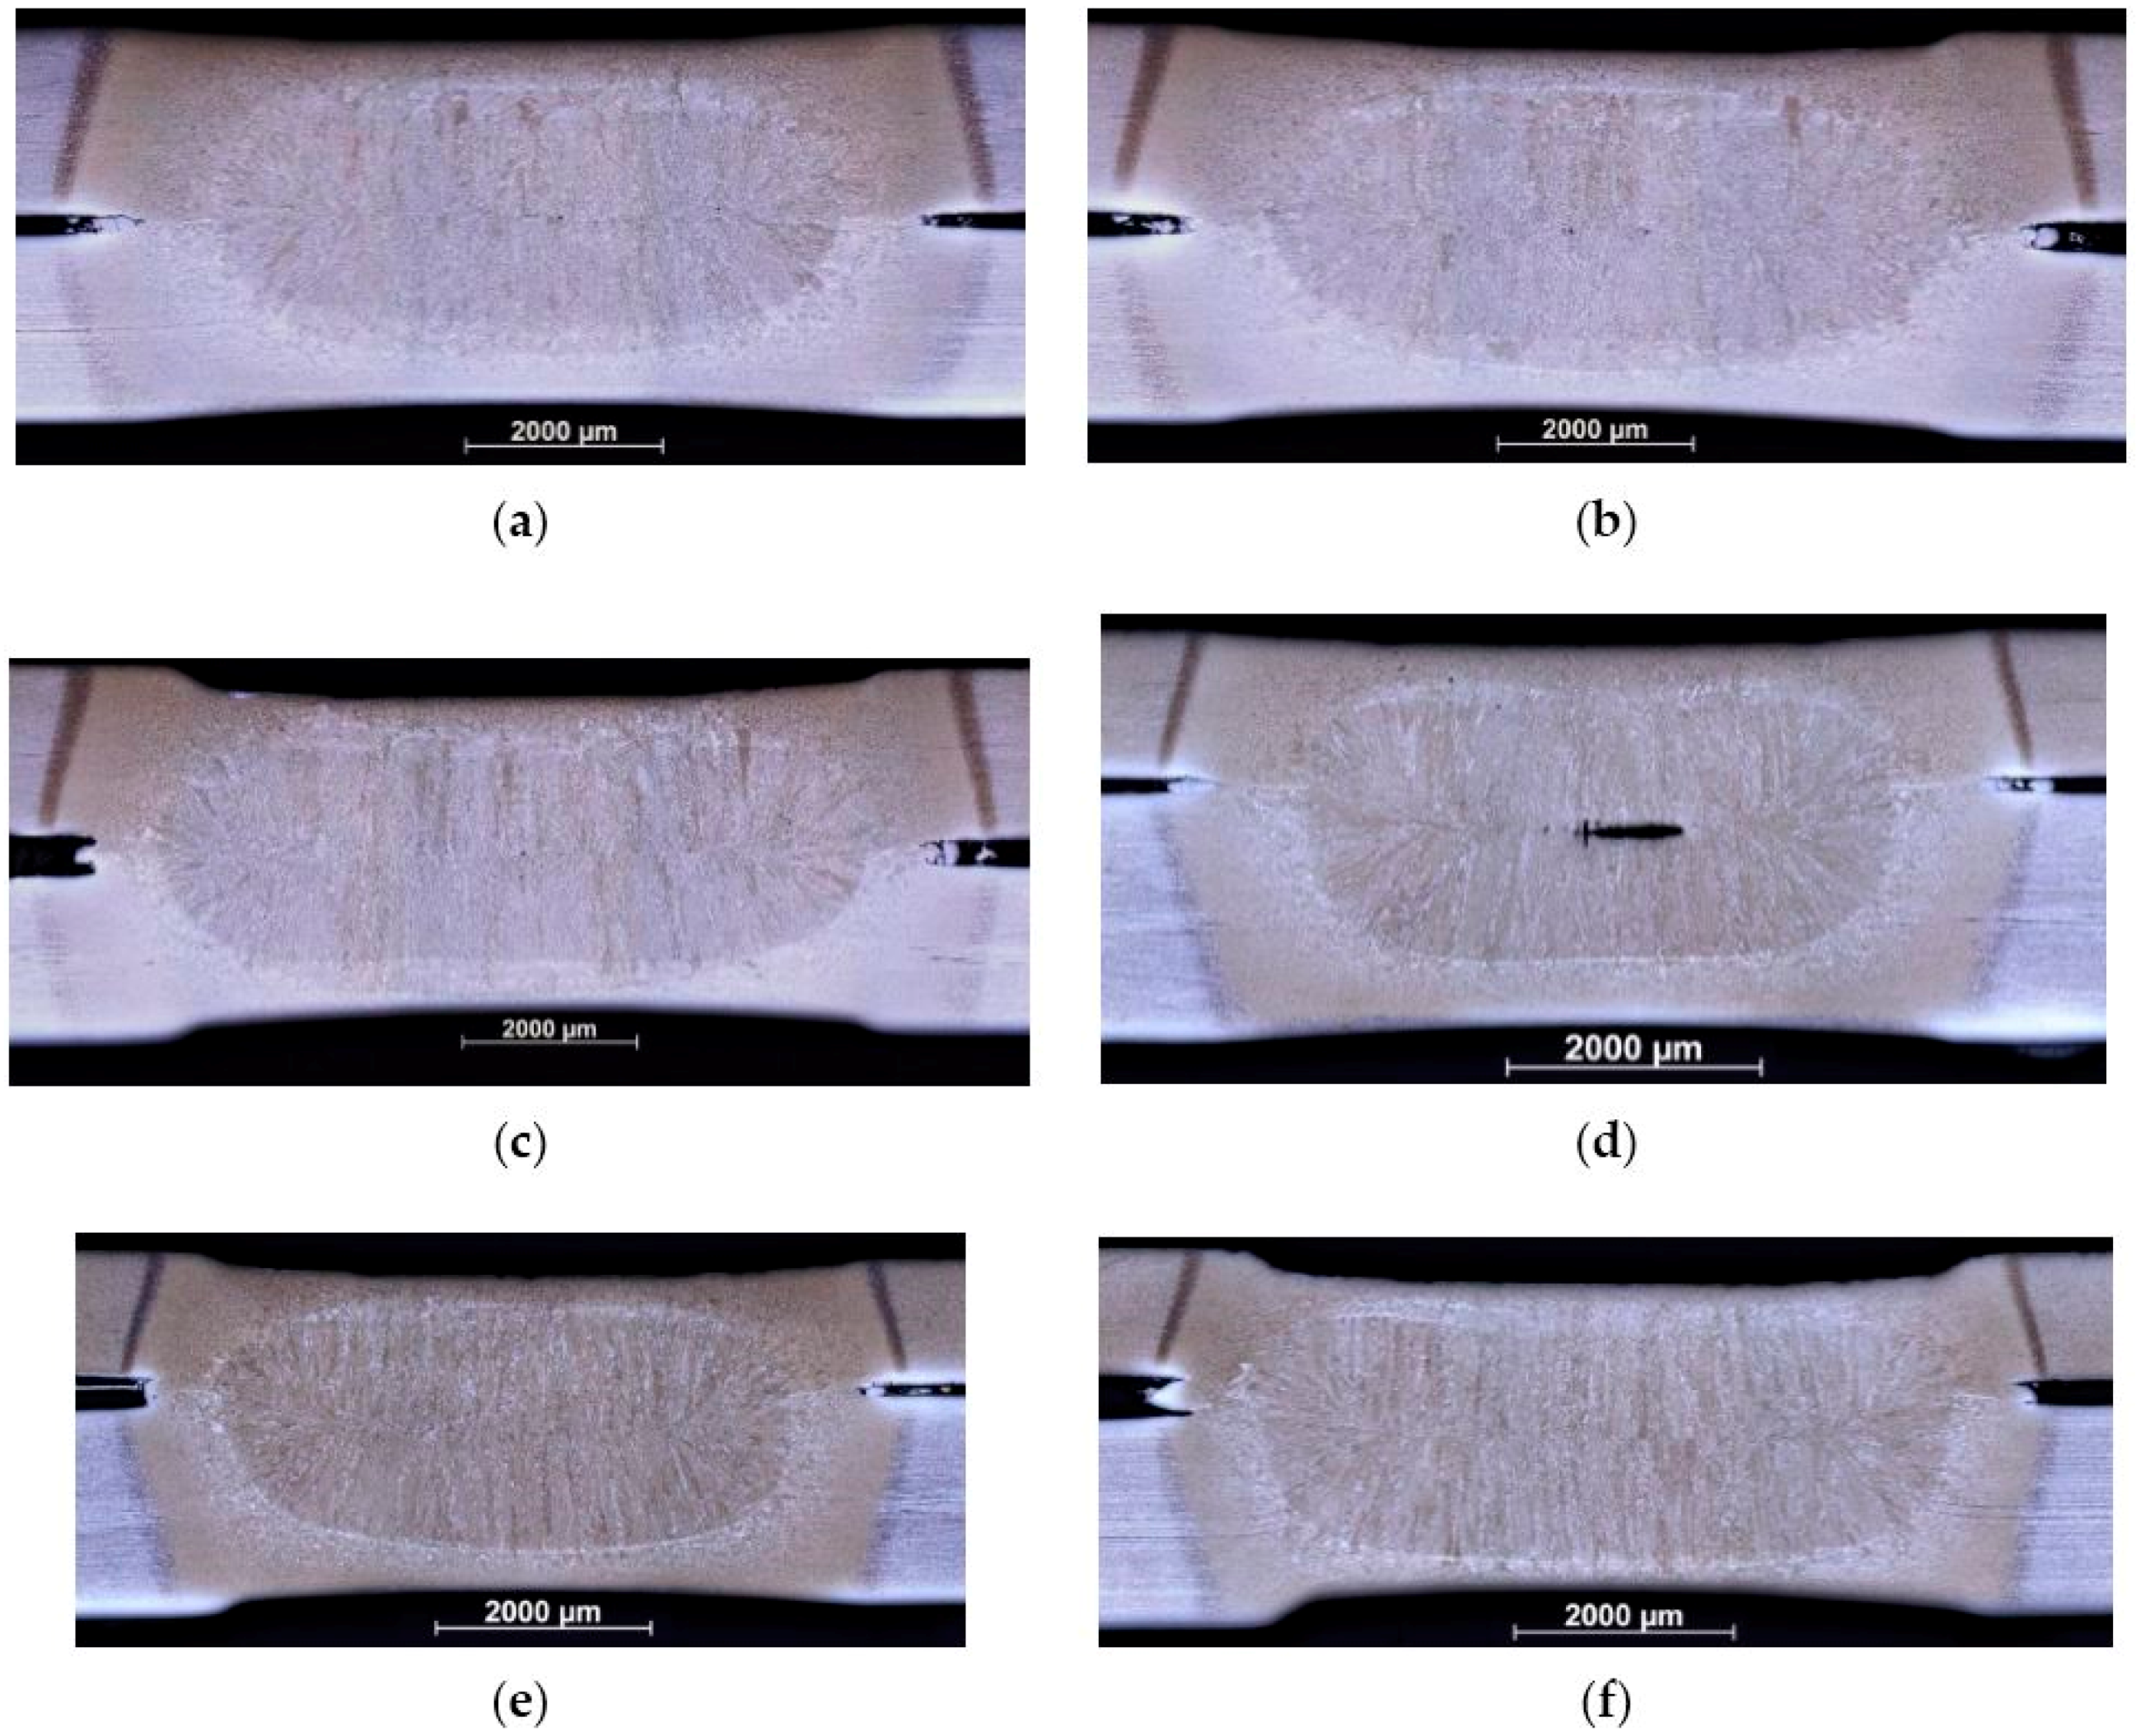
3.1. Spot Weld Microstructural Zones

Dissimilar resistance spot welding of different steel grades is known to give rise to phenomena such as chemical homogenisation in the weld nugget and sometimes also to a global nugget shift in position towards one sheet or the other [31]. Figure 4 shows the present Usibor-DP spot welds cross sections for two thickness configurations (DB, homogeneous and DD, heterogeneous) and the three positions in the welding range (lower end, middle and upper end). One can observe the increase in nugget size with increasing welding current intensity regardless of the configuration, as already observed by several authors [5,6,7,8,9].
It is important to note that the weld nugget chemical composition depends on the ratio of sheet thicknesses on the Usibor and DP sides. Focusing on carbon content in the two types of steels (Table 1) and considering a simple rule of mixture, a thin Usibor sheet on top of a thick DP one (DD configuration) will produce a fusion zone with a lower average carbon content than in the homogeneous thickness configurations (DA or DB). Consequently, the maximum carbon content in the fusion zone will be obtained in the DC configuration (thick Usibor sheet with a thin DP one). These tendencies are verified by average hardness measurement of the weld nugget for the four configurations: weld nugget hardness is about 420 HV in DA and DB configurations, 470 HV in DC and 419 HV in DD configurations. This is in accordance with the facts that the fusion zone is mainly martensitic and that martensite hardness is strongly dependent on carbon content.
Microhardness profiles are presented in Figure 5 for DB and DC configurations. The resistance spot welding process has direct consequences on local microstructures and hardness in the two steel grades. The DP600 ferritic-martensitic steel shows a Heat Affected Zone (HAZ) almost two times harder than the base metal. This is a well-known consequence of the local thermal cycle exceeding the complete austenitization temperature AC3 and the subsequent fast cooling rate giving rise to an almost fully martensitic microstructure. The situation is different on the Usibor side, where the base metal is already mainly martensitic with a high hardness. The local thermal cycle induces first some martensite tempering (hardness drop) where the peak temperature did not exceed about 700 °C. A higher peak temperature (above AC3, closer to the weld nugget) produces some fresh martensite as in the DP600 HAZ, but with a higher hardness due to the higher carbon content of Usibor. Note that for the sake of simplicity in this presentation, the global “HAZ” label is given only to the zones where the peak temperature exceeded AC3 in the solid state, even if metallurgical transformations may have occurred below (e.g., martensite tempering). The weld nuggets present intermediate hardness levels due to the chemical homogenization discussed above. Based on the preceding and according to literature [18,27], six different hardness zones can be highlighted in these profiles:
  • Usibor base metal
  • Usibor tempered zone
  • Usibor HAZ
  • Fusion zone
  • DP600 HAZ
  • DP600 base metal

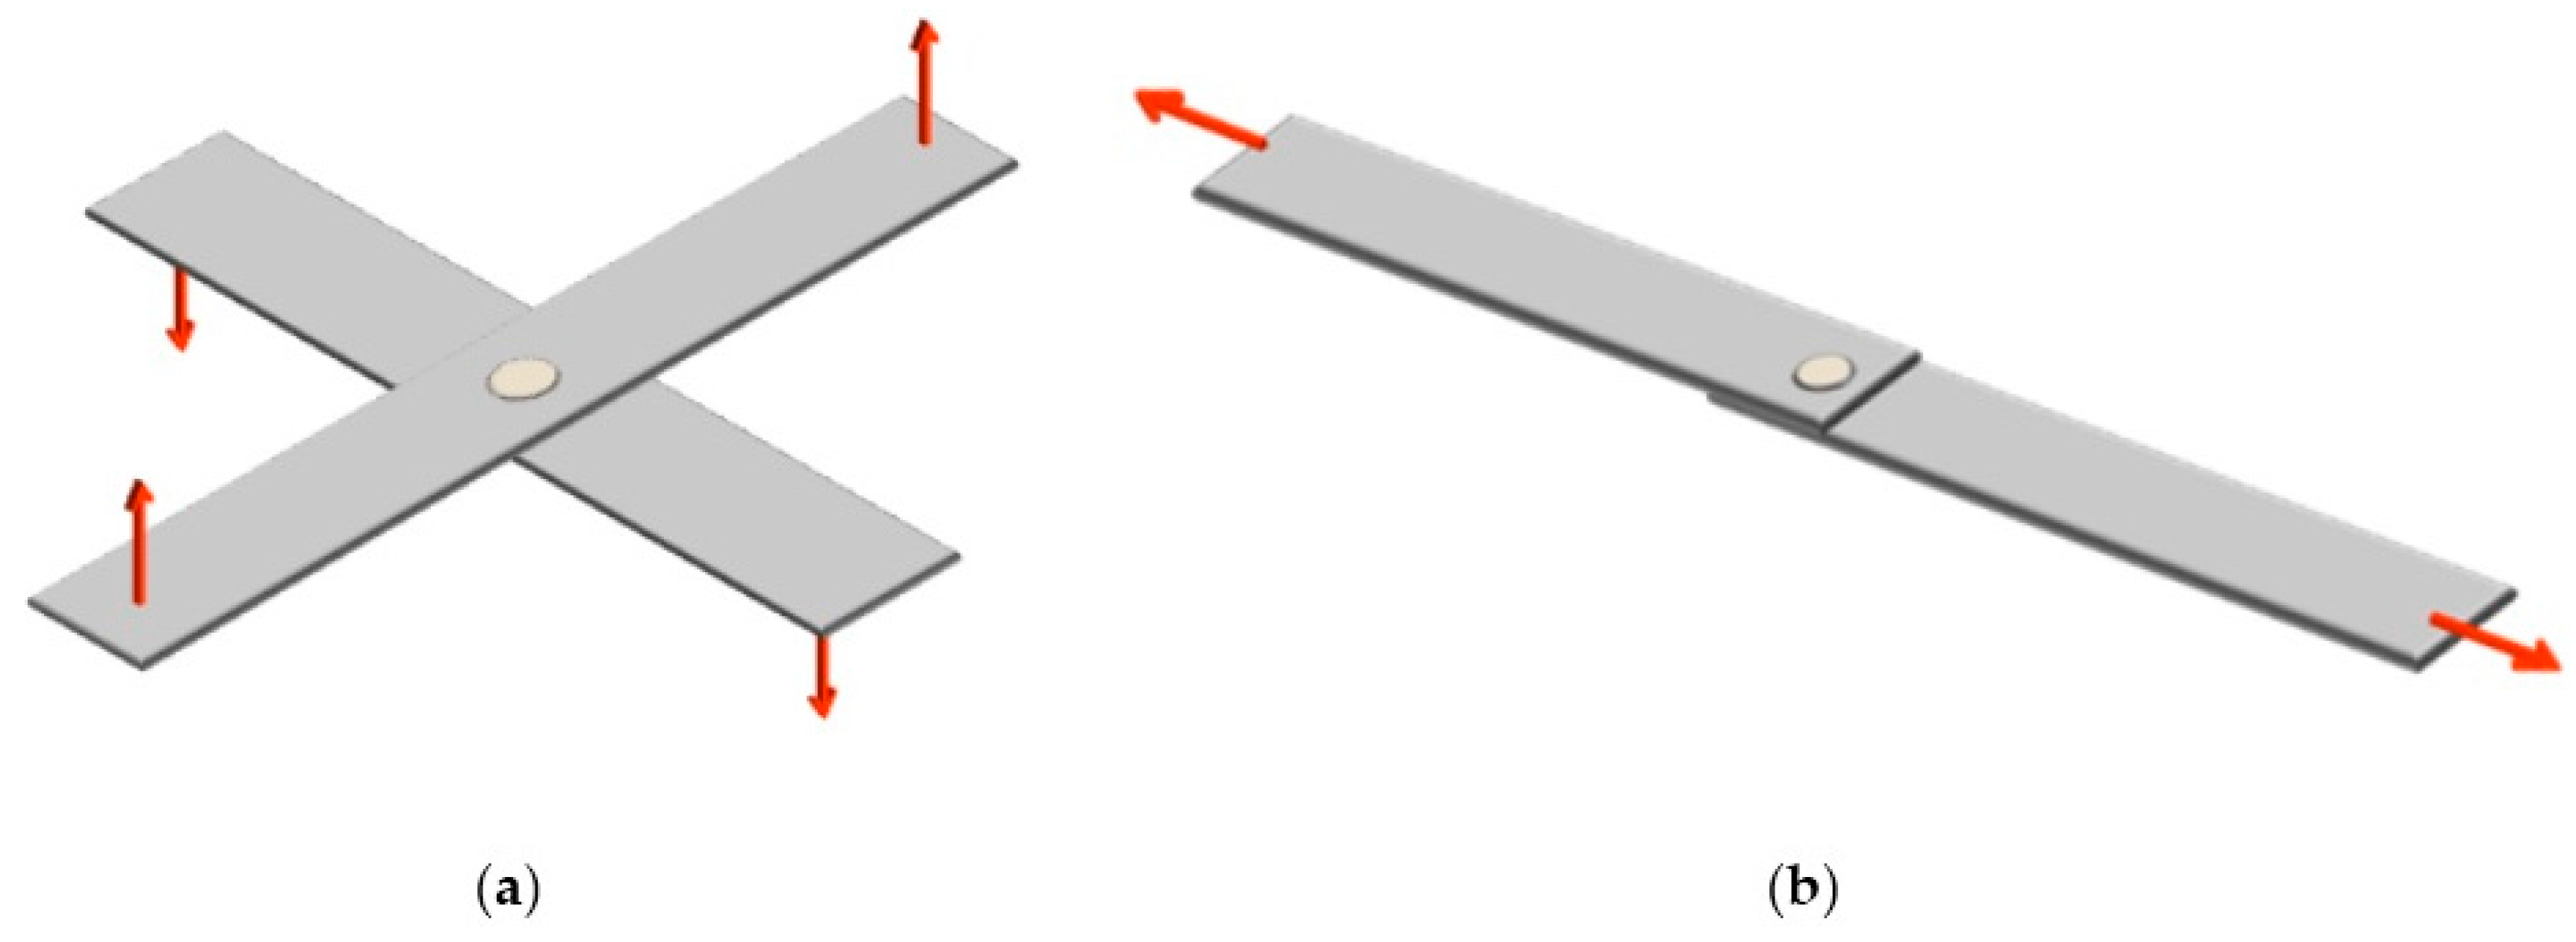
3.2. Cross Tension Tests

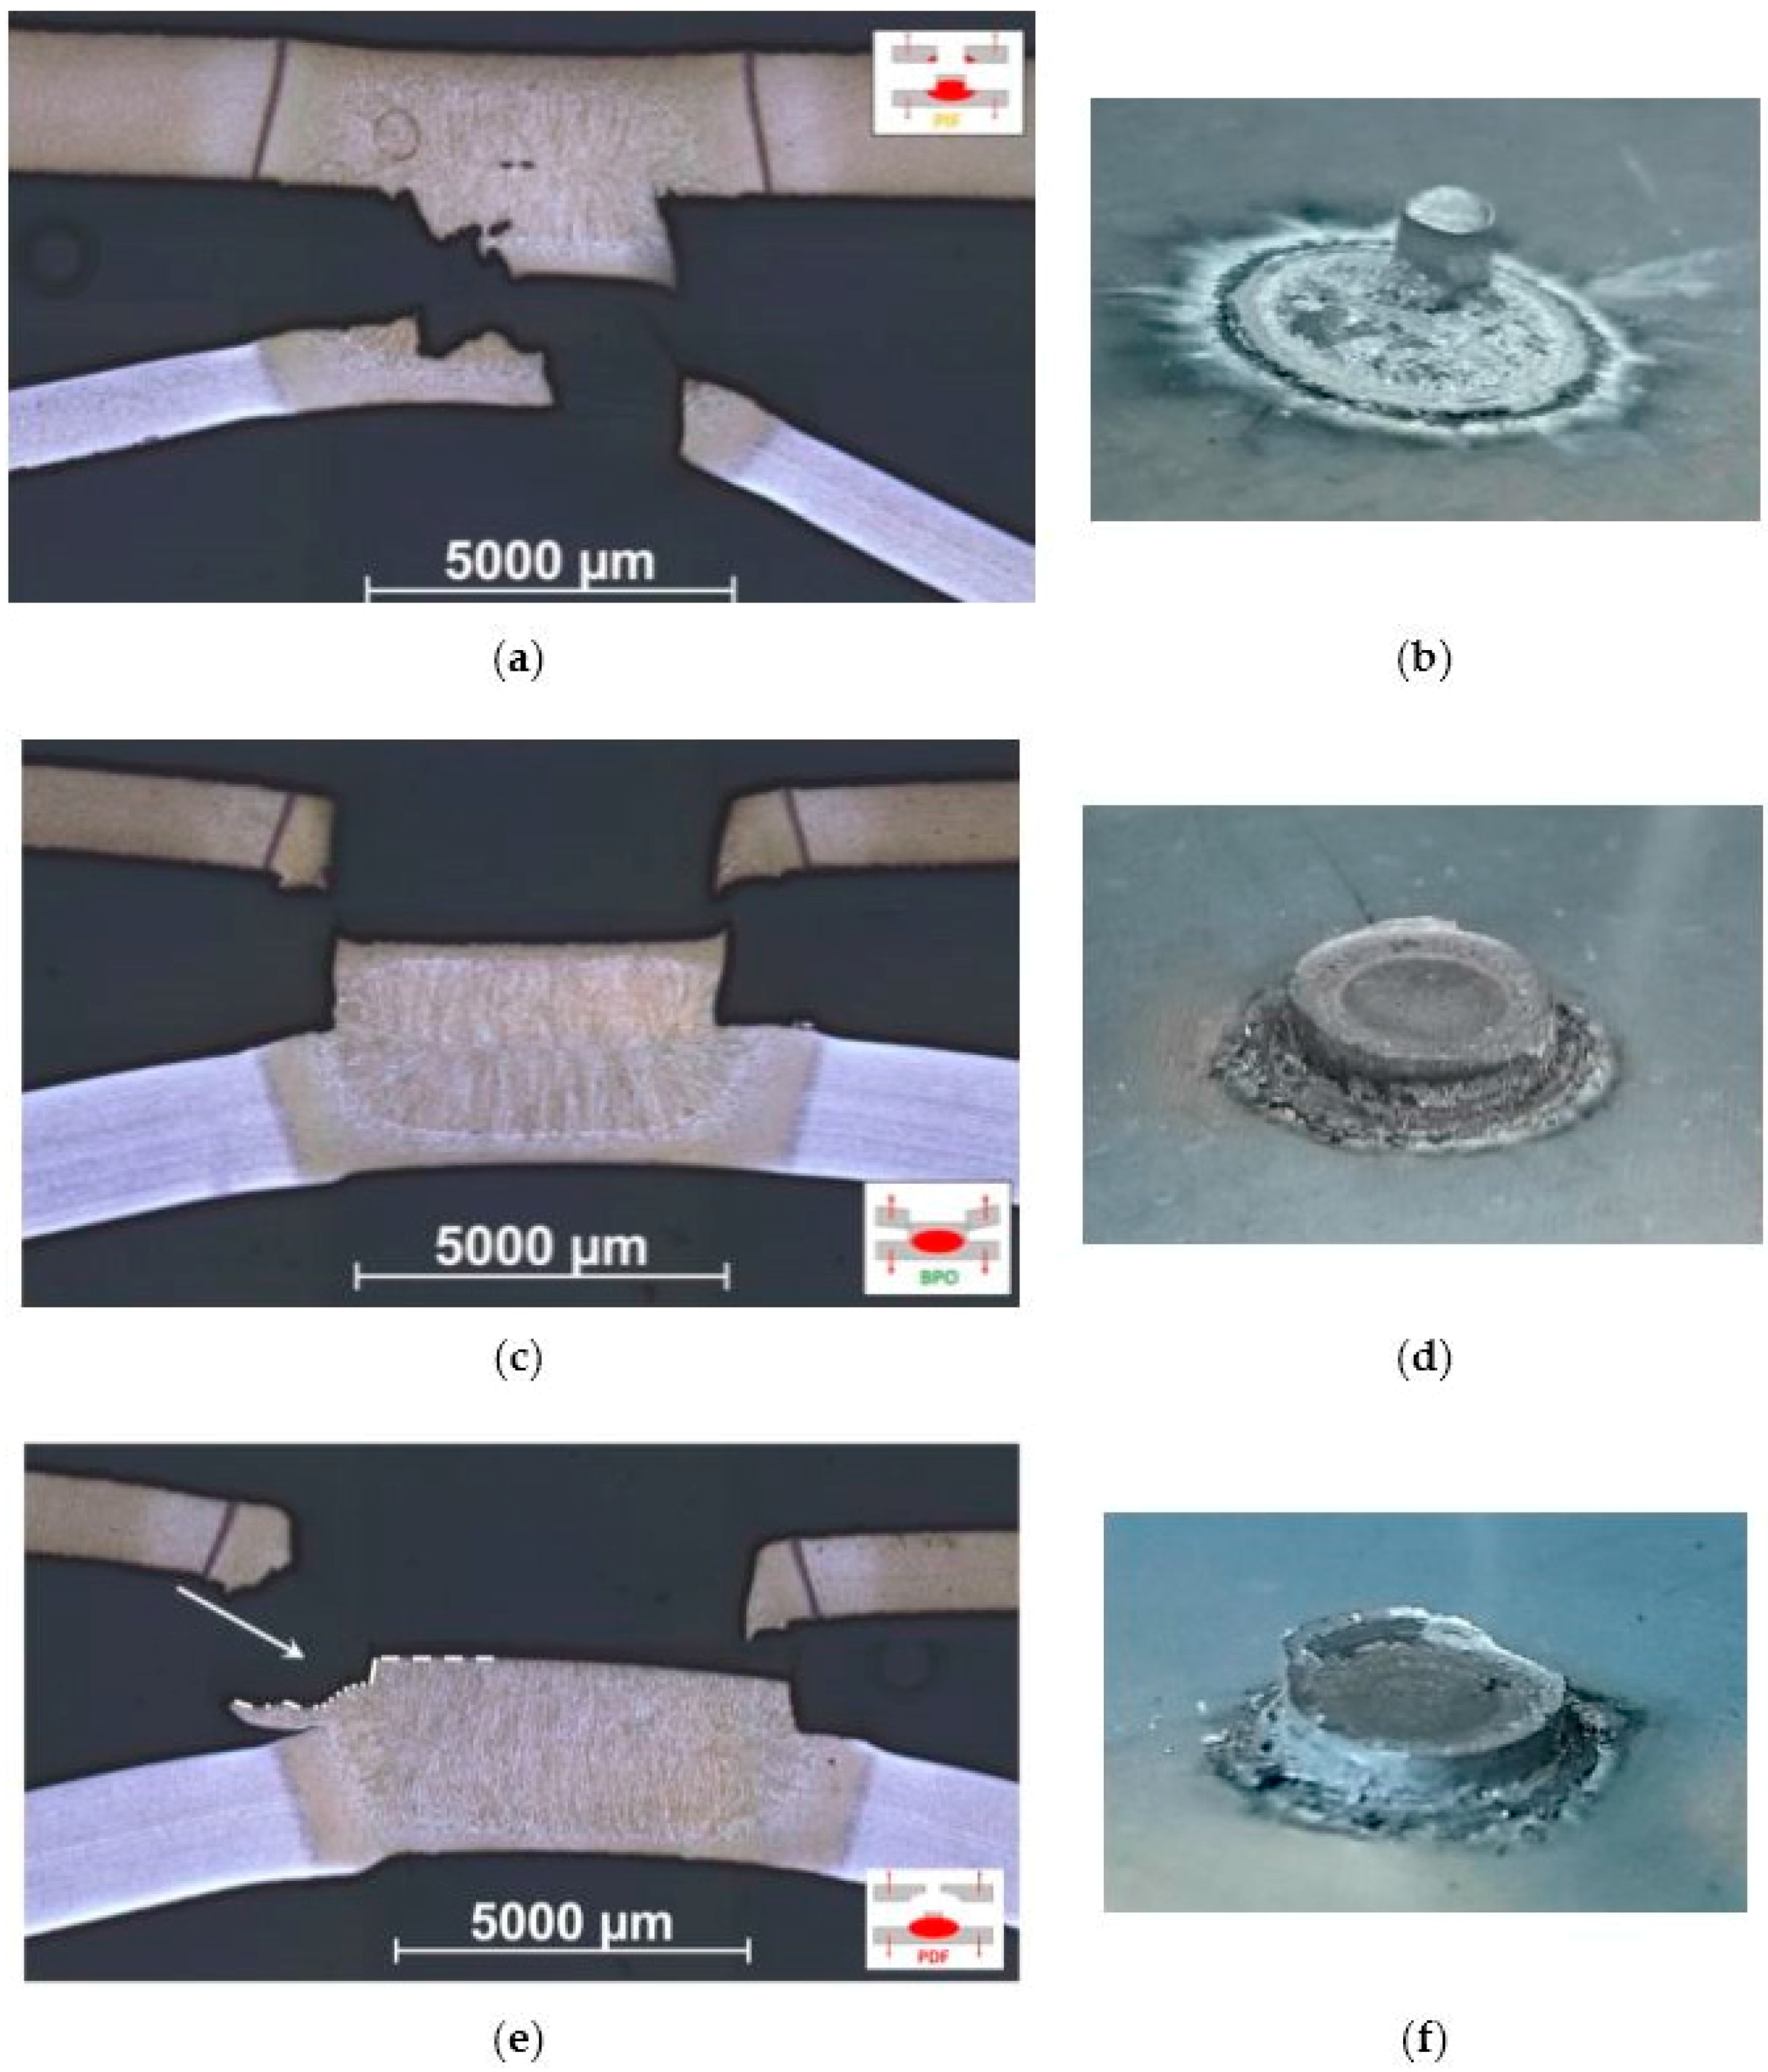
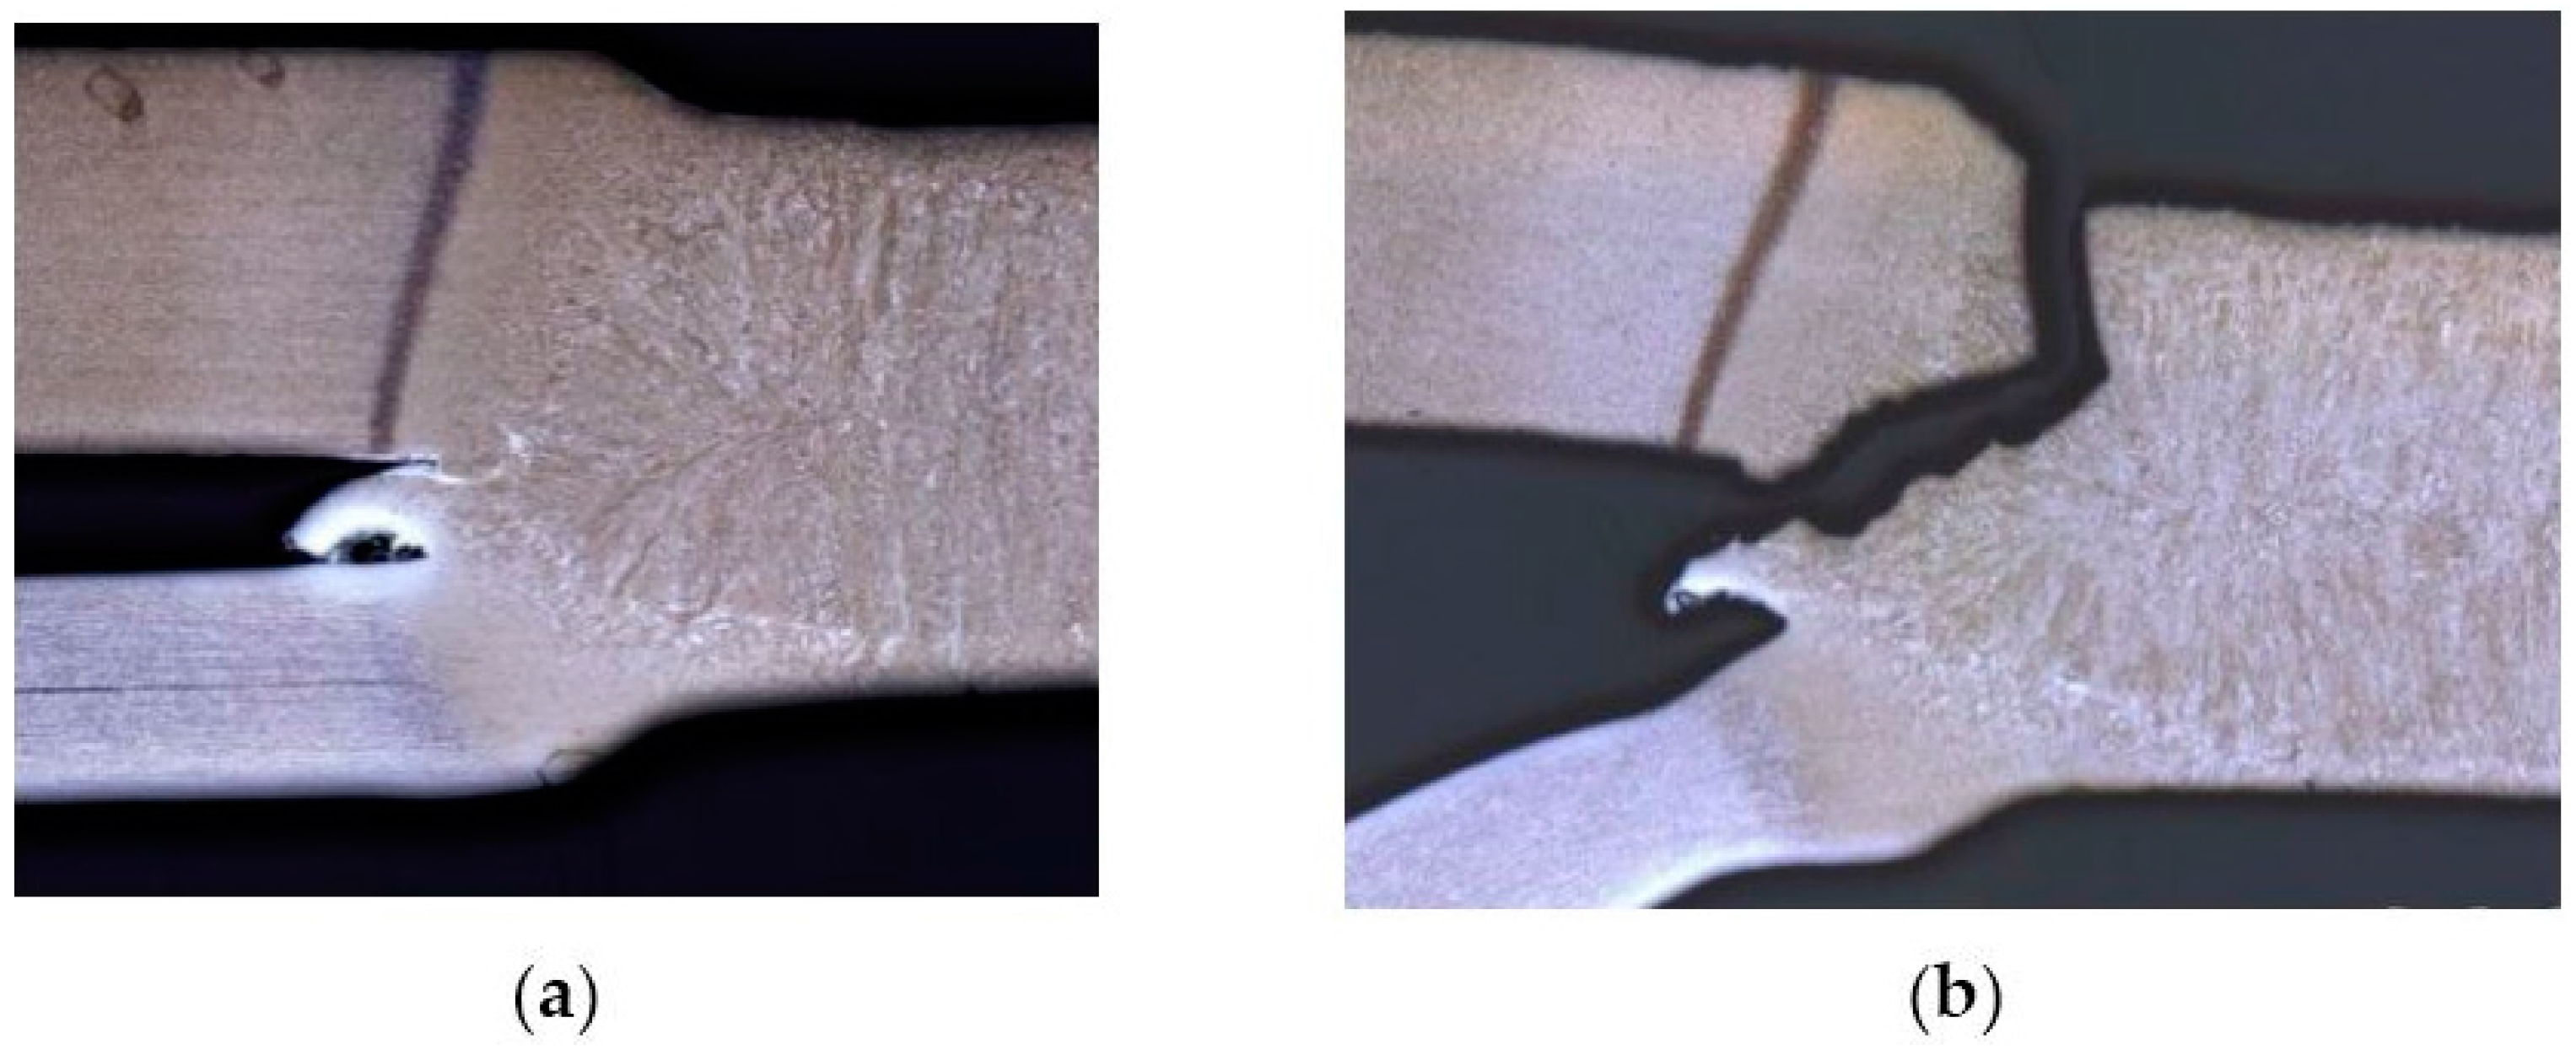
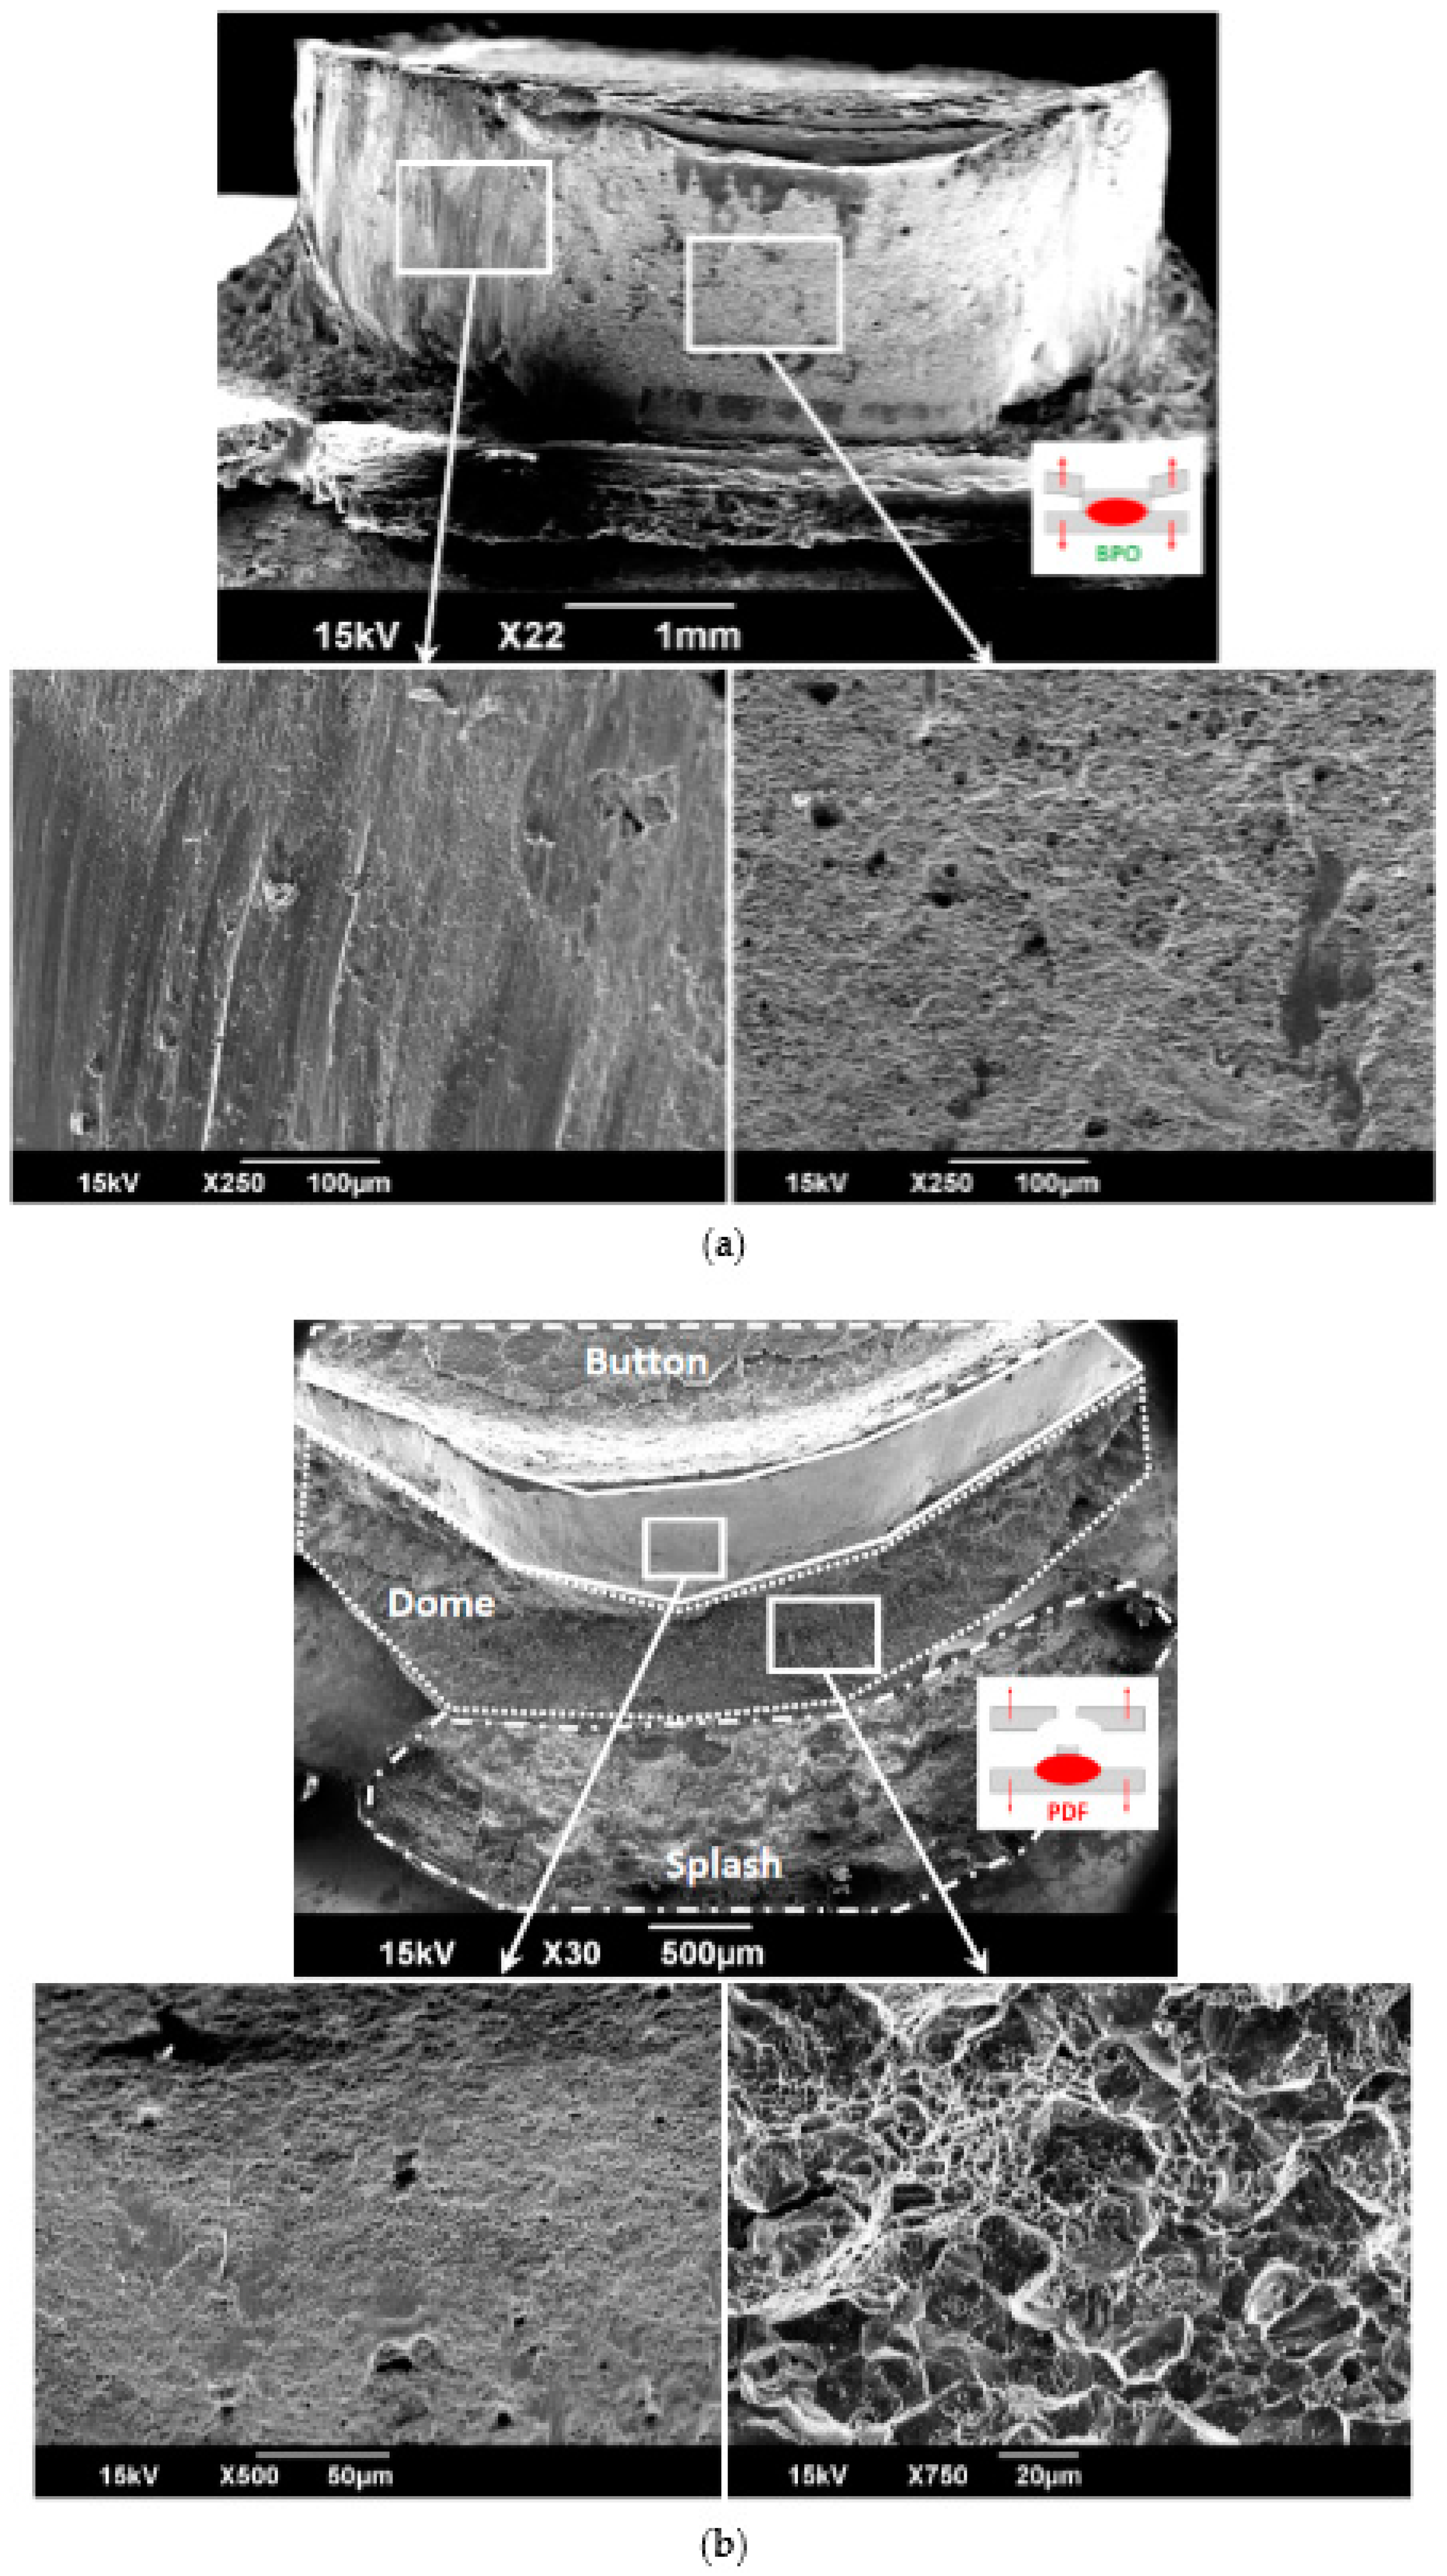
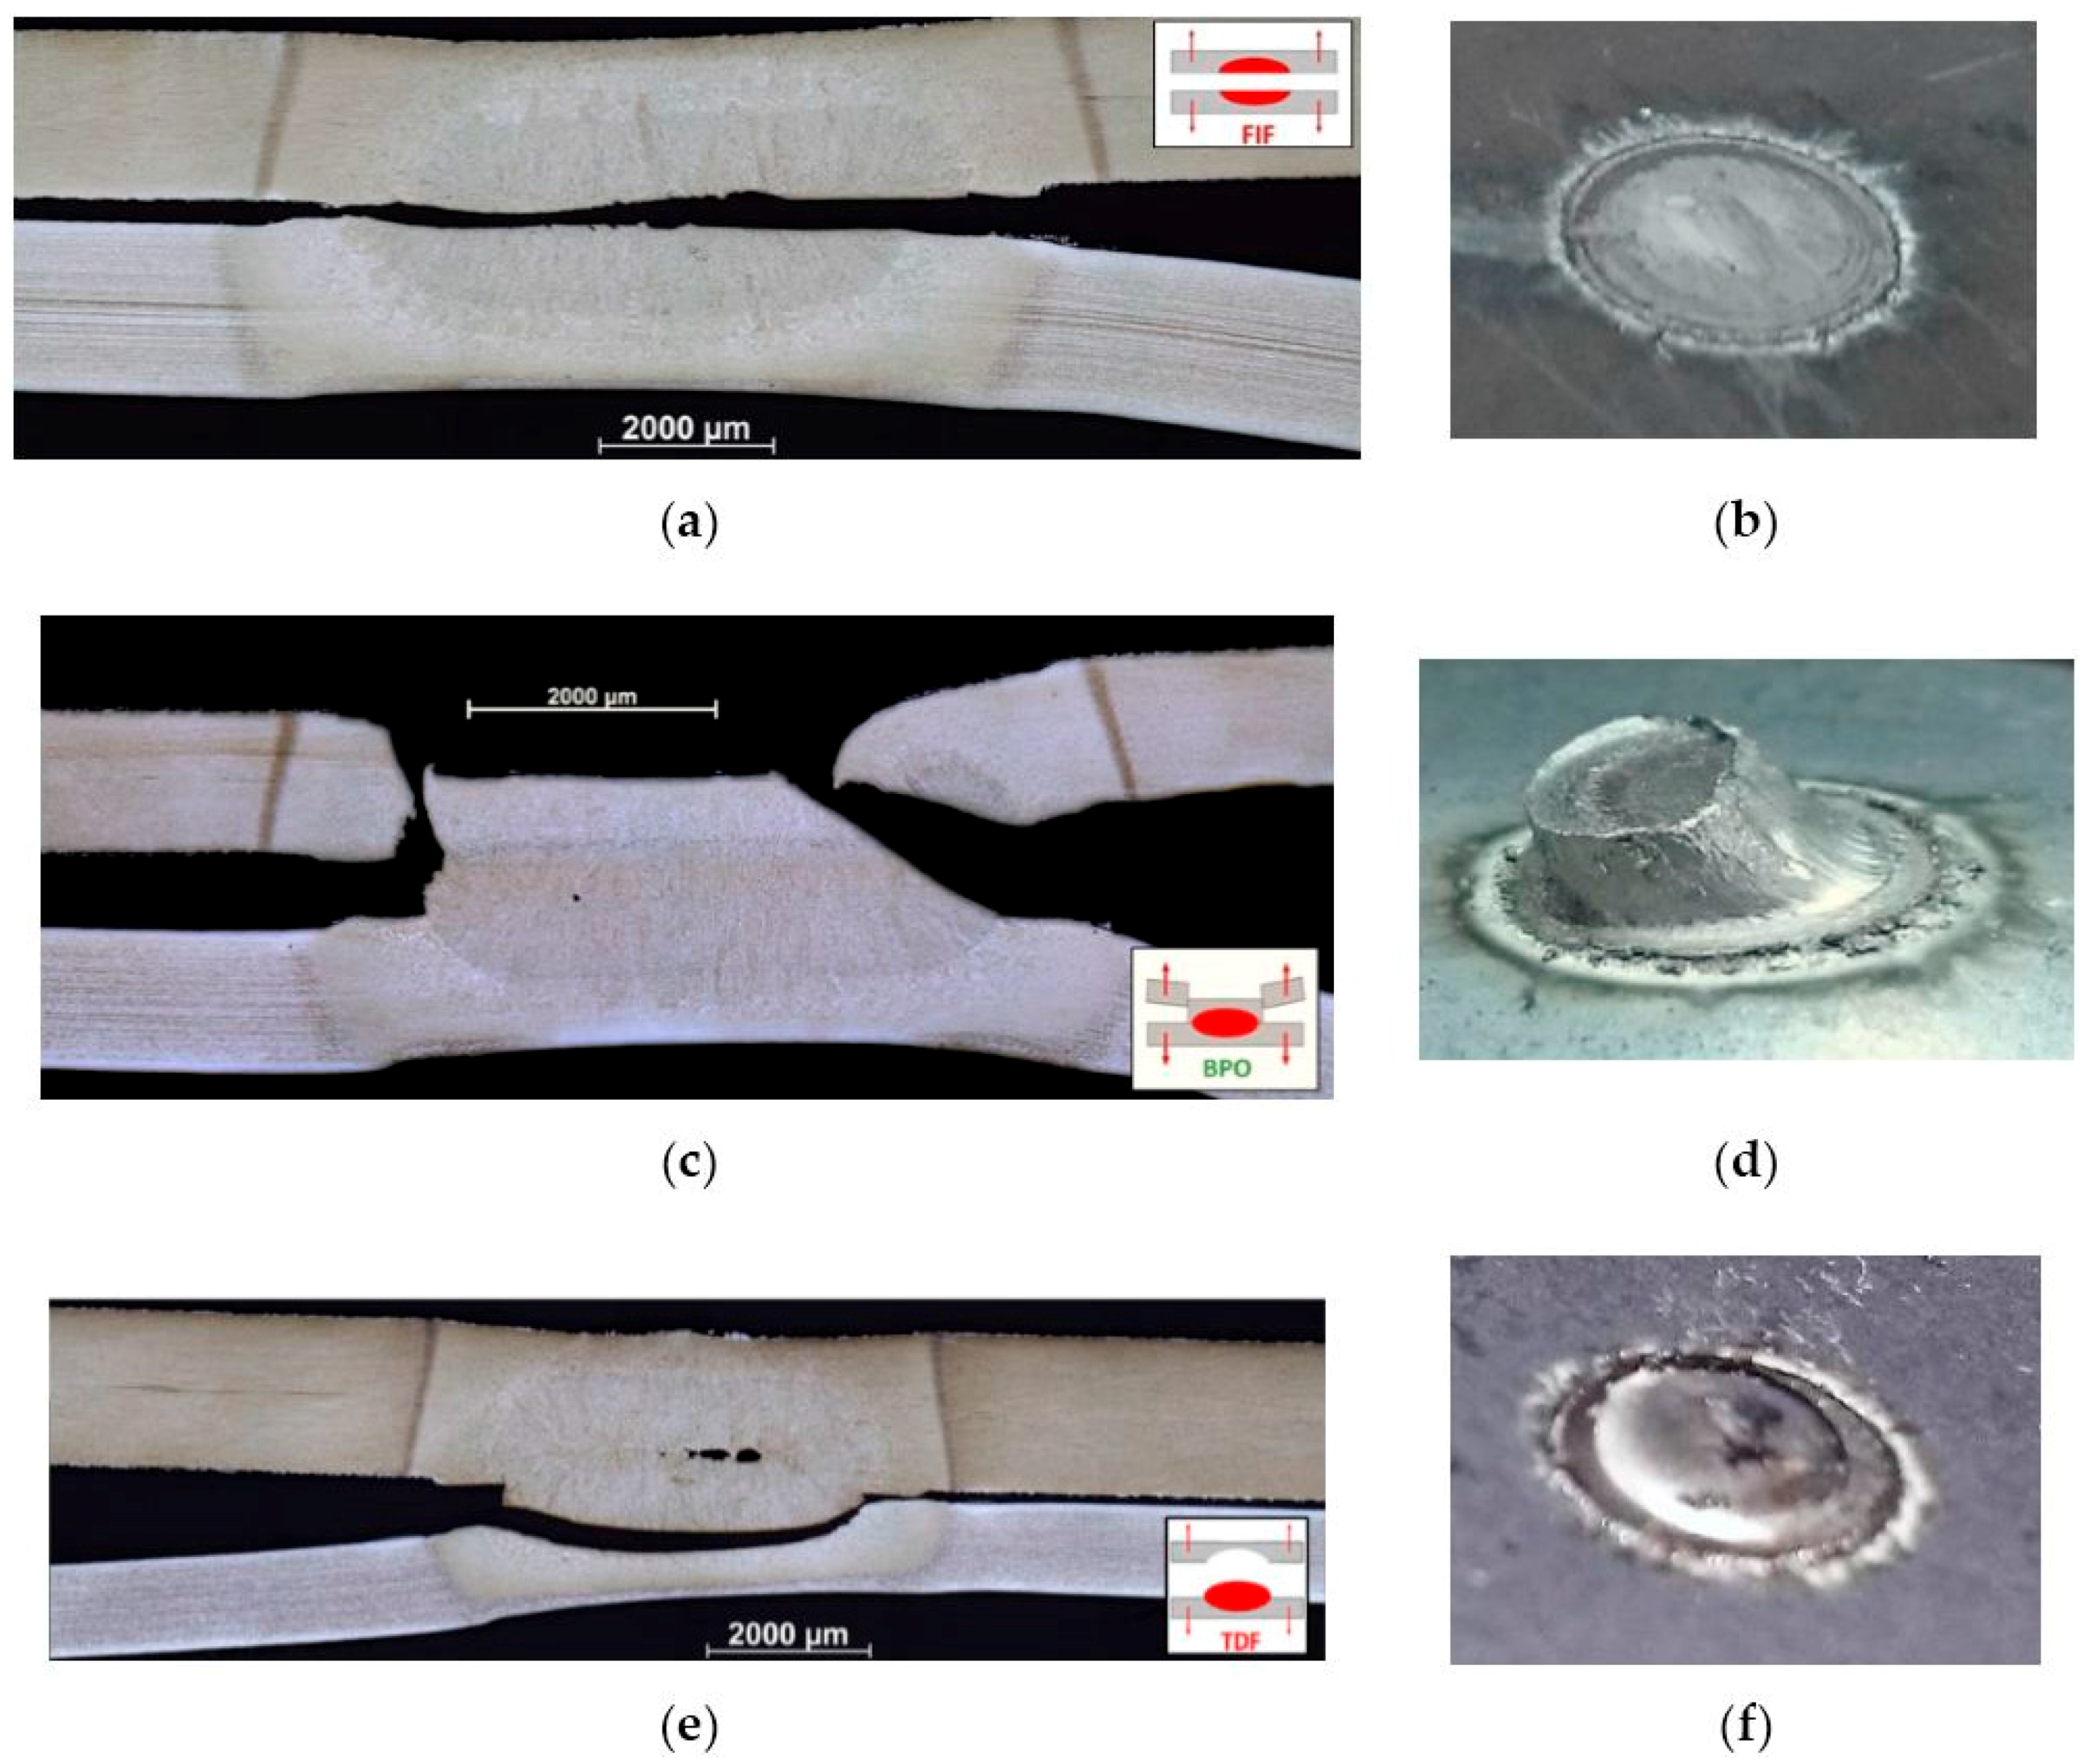
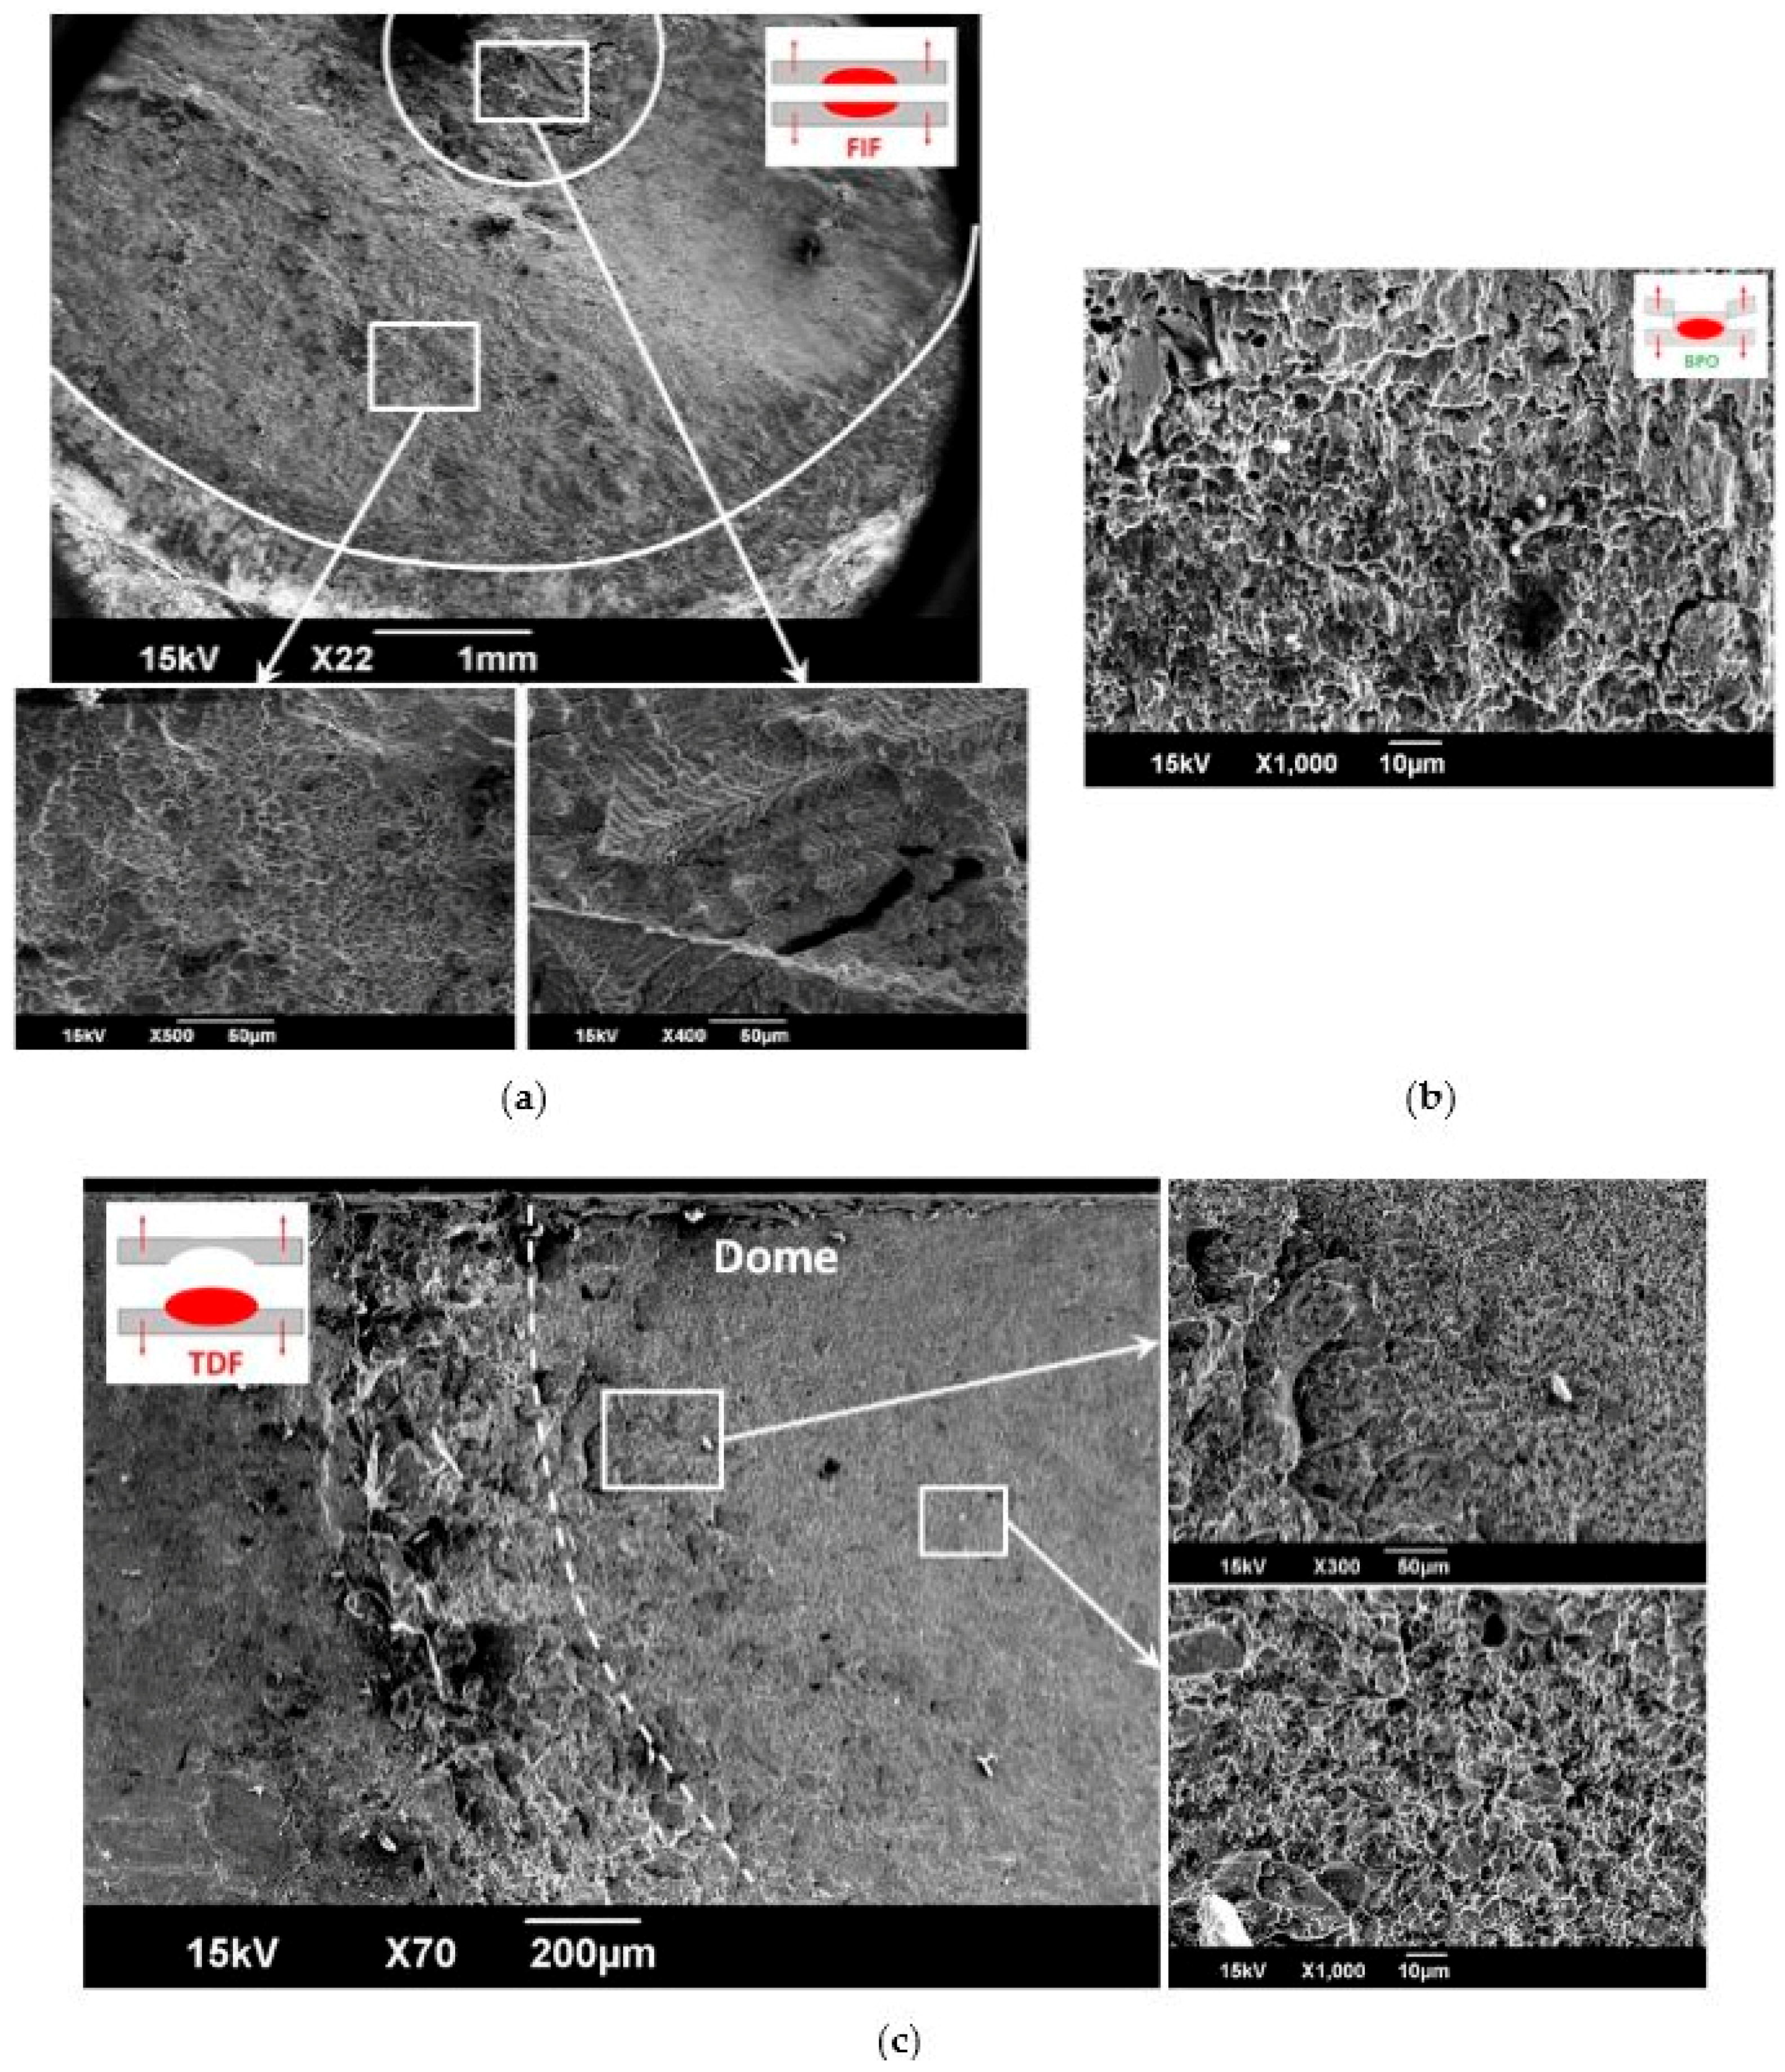
3.2.1. Failure Modes

Failure modes obtained after cross tension tests are compiled in Table 3 for the four configurations, with a mention on the failure side (Usibor or DP600). A majority of Button Pull-Out (BPO) and Partial Interfacial Failure (PIF) occurred. Failure occurred in the Coarse Grain HAZ (CGHAZ) of Usibor and in the weld nugget, except for the DC configuration (2 mm Usibor-1.2 mm DP600) where failure was on the DP600 side for low and middle intensity ranges. One can note the global tendency of PIF to BPO failure mode transition from low to high welding current, as often observed with increasing weld diameters. The observed failure modes are presented in Figure 6 in more details, with a macroscopic visual aspect of the broken weld and the corresponding metallographic cross section highlighting the failure zone.
A remarkable feature is the initiation of a Partial Dome Failure at the upper end of the welding range in parallel to BPO. In fact, initiation of expulsion produces a particular geometry at the notch tip, where a small amount of liquid metal (splash) could escape from the nugget and promotes Partial Dome Failure. The latter occurs usually at an angle of about 30° to the faying surface. This is illustrated in more details in Figure 7, where the initial dome crack eventually forks up into a button. This phenomenon seems to drive the failure zone transition from the DP side to the Usibor in the DC configuration close to the upper end of the welding range.
Fractures surfaces of failed spot welds were then observed in a SEM as presented in Figure 8. In the case of Button Pull-Out (BPO), the lateral button surface was observed (Figure 8a). Two types of fracture surfaces were identified in that case:
  • A zone full of small cavities due to debonding of the inclusions in the material (right zone).
  • A zone exhibiting shear (left zone). The “pull-out” movement of the upper sheet in the final stage of fracture (vertical tangential motion of the fractured sheet with respect to the weld nugget) is indeed expected to produce such evidence of shearing.
In the case of Partial Dome Failure (PDF), the partial dome is highlighted by the white dotted line area and the button by the white solid one in Figure 8b. As discussed above, the presence of a small weld metal splash promoted the partial dome. The latter was observed for an angular range of about 30° around the weld nugget in that particular case. While the Button zone fracture surface in Figure 8b is close to the one detailed in Figure 8a, the partial dome fracture surface presents some evidence of brittle failure.

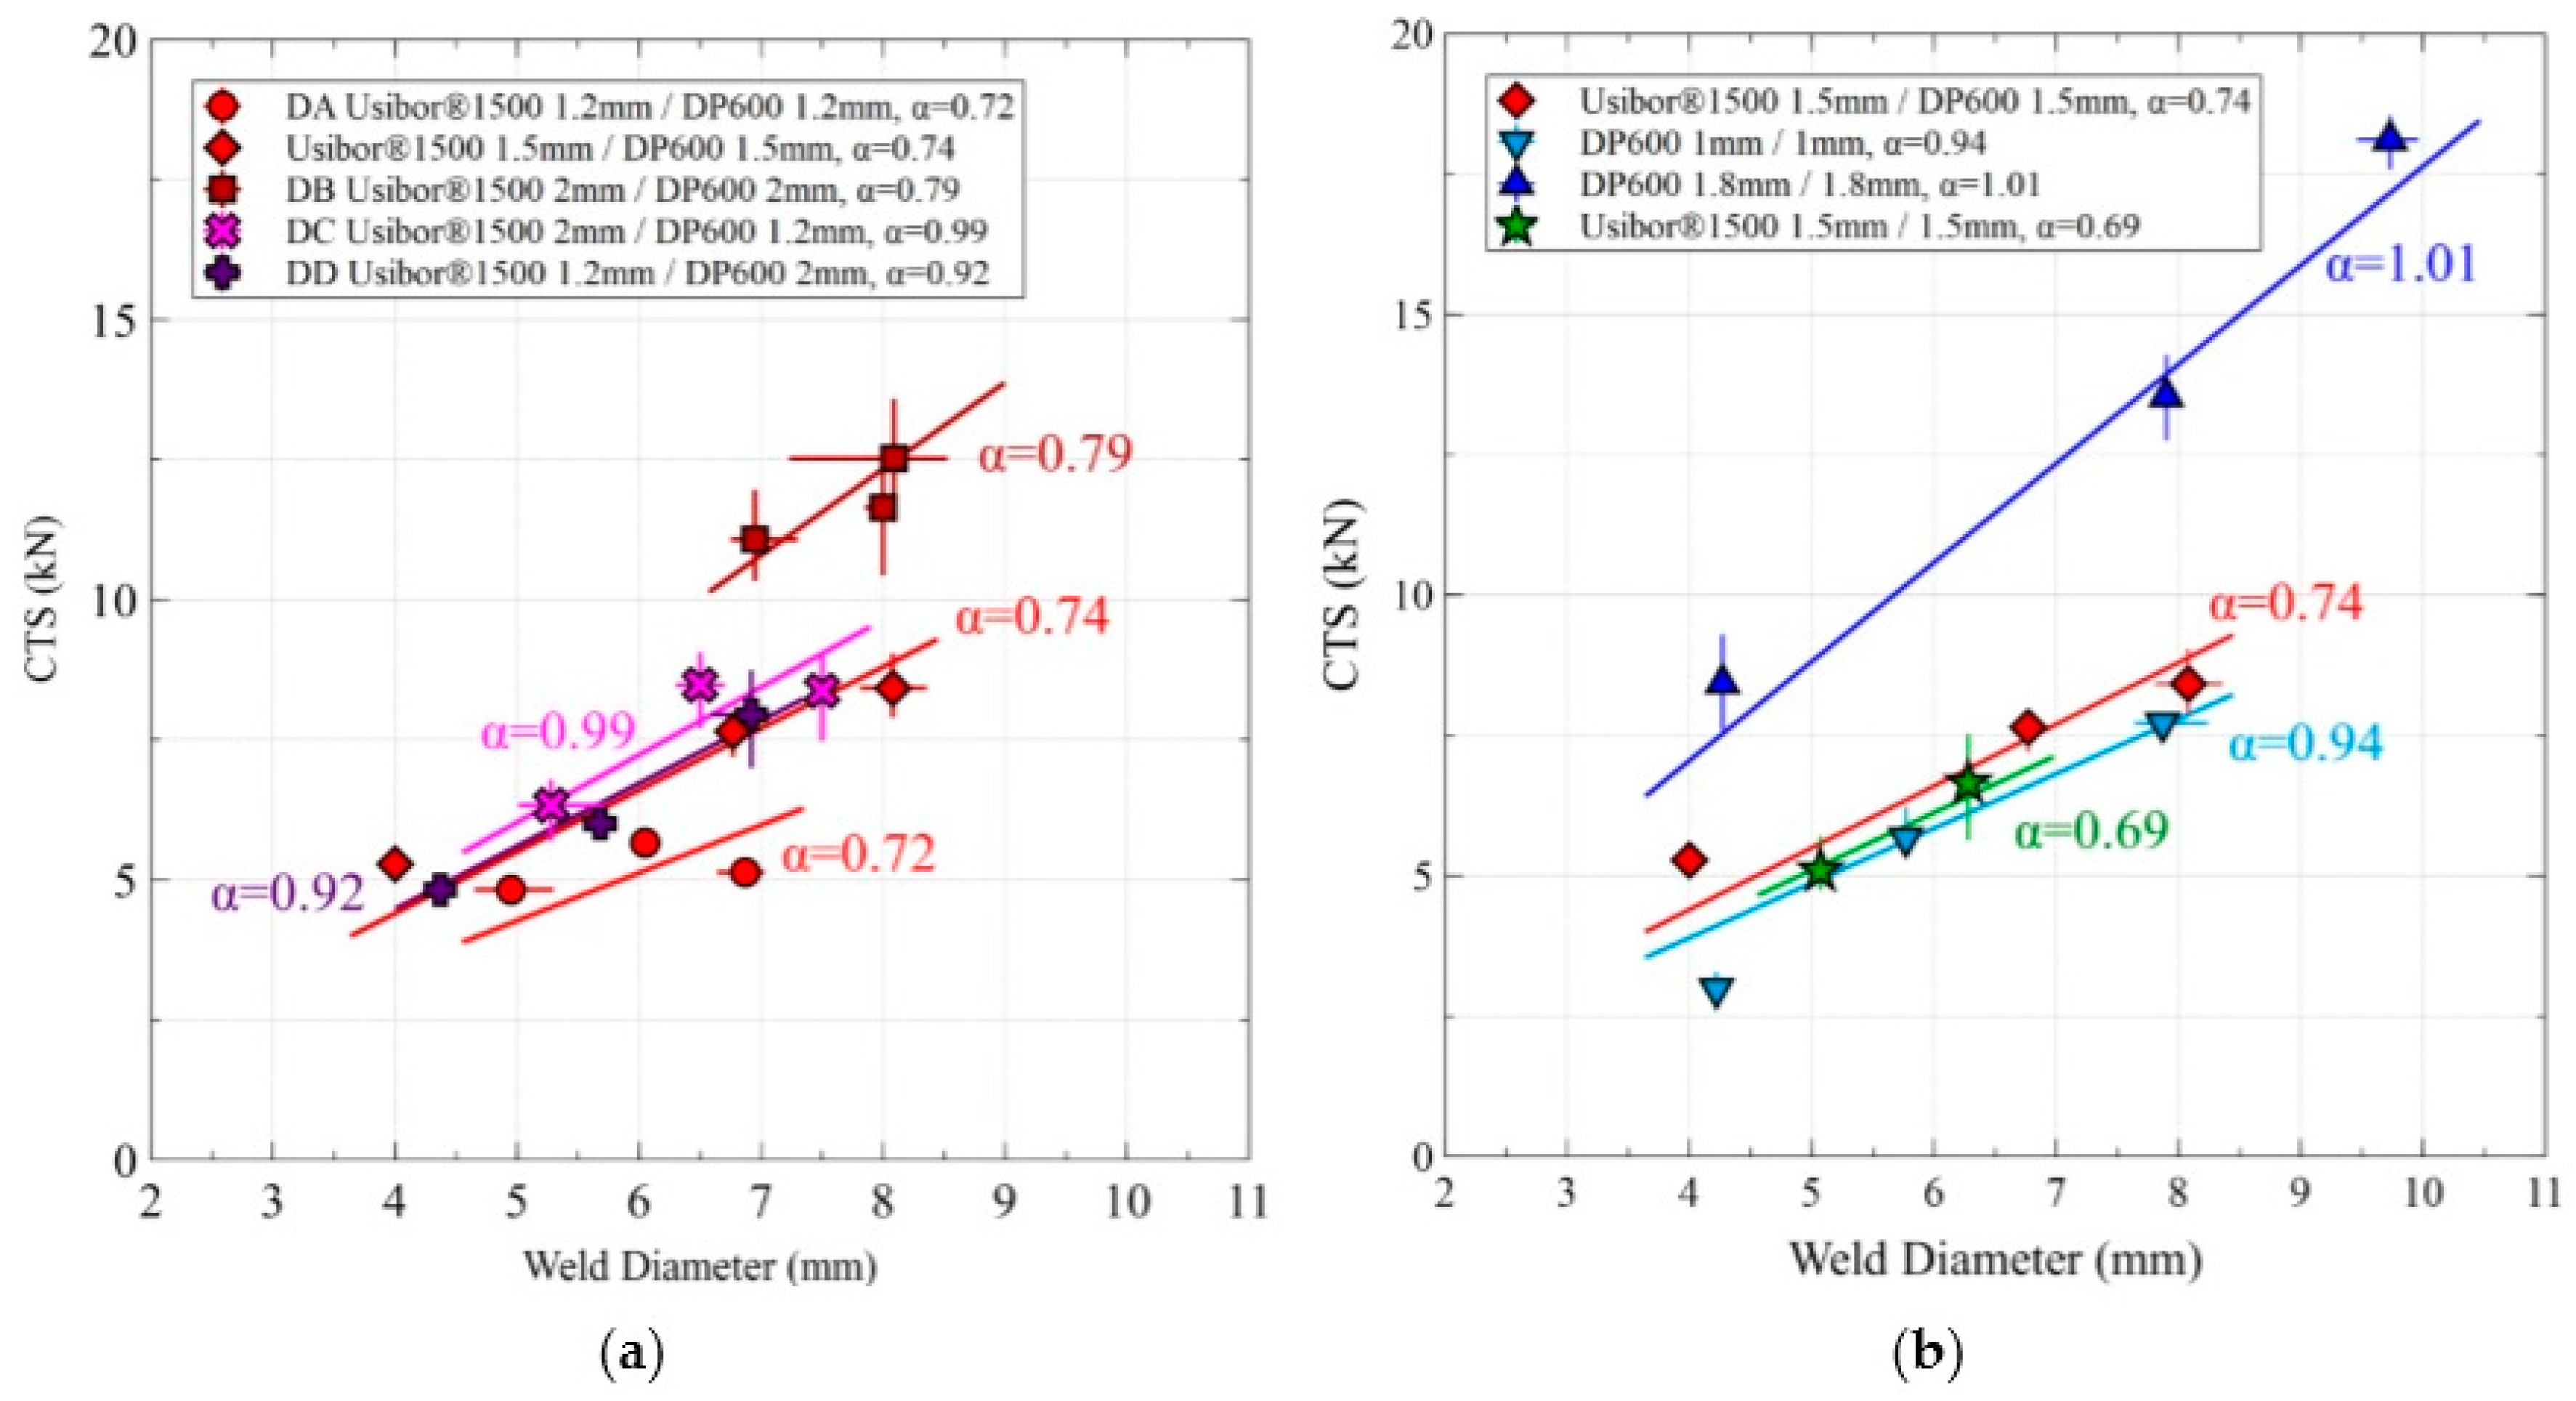
3.2.2. Load Bearing Capacities

The failure loads of spot welds measured during the cross tension tests are given in Table 4. They are plotted as a function of the measured weld diameters for the four studied configurations in Figure 9a. Four additional configuration results derived from internal ArcelorMittal Data are superimposed in Figure 9b. These configurations are:
  • Heterogeneous welding of Usibor®1500 1.5 mm with DP600 1.5 mm
  • Homogeneous welding of DP600 1 mm
  • Homogeneous welding of DP600 1.8 mm
  • Homogeneous welding of Usibor®1500 1.5 mm
A common parameter to evaluate the performance of a RSW assembly is the ratio α of the failure load normalized by the weld dimensions [30]:
α = CTS/(dw × t)
where CTS is the cross tension failure load (kN), dw is the weld nugget diameter and t is the sheet thickness. In the cases of dissimilar sheet thicknesses (DC and DD configurations), α is calculated with the smallest sheet thickness in accordance with the ISO standard [2], where the welding process parameters are also driven by the thinnest sheet.
Figure 9 illustrates the increase in failure load with increasing sheet thickness in the homogeneous thickness configurations. This was indeed expected based on Chao [9] or Pouranvari [13] studies for example. Note that this trend is verified for the homogeneous steel grade configurations, but also for the heterogeneous ones.
Observing the heterogeneous thickness configurations (DC and DD) in Figure 9a, one can note that the corresponding α performance parameters (respectively, 0.99 kN/mm² and 0.92 kN/mm²) are almost as high as the best ones obtained in the case of DP600 homogeneous welding (0.94–1.01 kN/mm², Figure 9b) and definitely better than the one of Usibor homogeneous welding (0.69 kN/mm²). Similar positive effect of heterogeneous welding was already observed for example in Biro et al. [30]. Note that changing the homogeneous Usibor 1.5 mm configuration into a heterogeneous Usibor 1.5 mm/DP600 1.5 mm configuration, Figure 9b, also produces a slight increase in α performance parameter (from 0.69 to 0.74 kN/mm²). In other words, DP600 improved the spot weld performance of Usibor.
Partial Dome Failures (PDF) were observed for three of the four configurations (DA, DC and DD) for the high welding current intensity. Observing these particular points, it appears that the corresponding loads are under the spot weld performance curves (α slope). This indicates that the occurrence of limited expulsion tends to reduce the weld performance for a given weld diameter. Better understanding the subsequent dome failure mechanism remains an important challenge as it affects the failure load significantly.

3.3. Tensile Shear Tests

3.3.1. Failure Modes

The failure modes obtained in tensile shear in the four configurations are compiled in Table 5 and illustrated in Figure 10. Mainly Full Interfacial Failure (FIF, Figure 10a,b, low welding currents) and Button Pull-Out (BPO, Figure 10c,d, higher welding currents) are observed, as expected from the literature. It is interesting to note that failure occurred in the Usibor Coarse Grain HAZ most of the times, when not at the faying surface. The DC configuration (thick Usibor sheet on top of a thin DP600 one) constitutes however an exception to that rule, with a failure occurrence rather on the DP side and a transition from Total Dome Failure (DP600-weld nugget interface, Figure 10e,f) to Button Pull-Out with increasing weld diameter.
The effect of the sheets thickness is observed by comparing DA and DB (homogeneous) configurations. A higher sheet thickness promotes Full Interfacial Failure (FIF) for small welds (low welding current). Concerning the DC configuration and the occurrence of TDF instead of FIF for low welding current, a closer look at Figure 4d) shows that the faying surface between the notch tips is not far from being aligned with the DP600-weld nugget interface. This is geometrically favorable to the occurrence of Dome Failure.
SEM investigations of fractures surfaces for the three failure modes are shown in Figure 11. The nugget zone of the Full Interfacial Failure mode presents a ductile aspect with sheared dimples (Figure 11a). Note that a few cavities with apparent dendrites can also be seen close to the nugget center in this case.
The buttons obtained in tensile shear exhibit a particular aspect as shown in Figure 10c,d, where one side of the button is at close to 45° to the faying surface. The fracture surface in that case is also presenting evidence of ductile shear (Figure 11b). Dome fracture surfaces in Figure 11c) exhibit a transition from a mixed mode domain (200 µm layer close to the notch root) to a mainly ductile mechanism with elongated dimples along the dome.

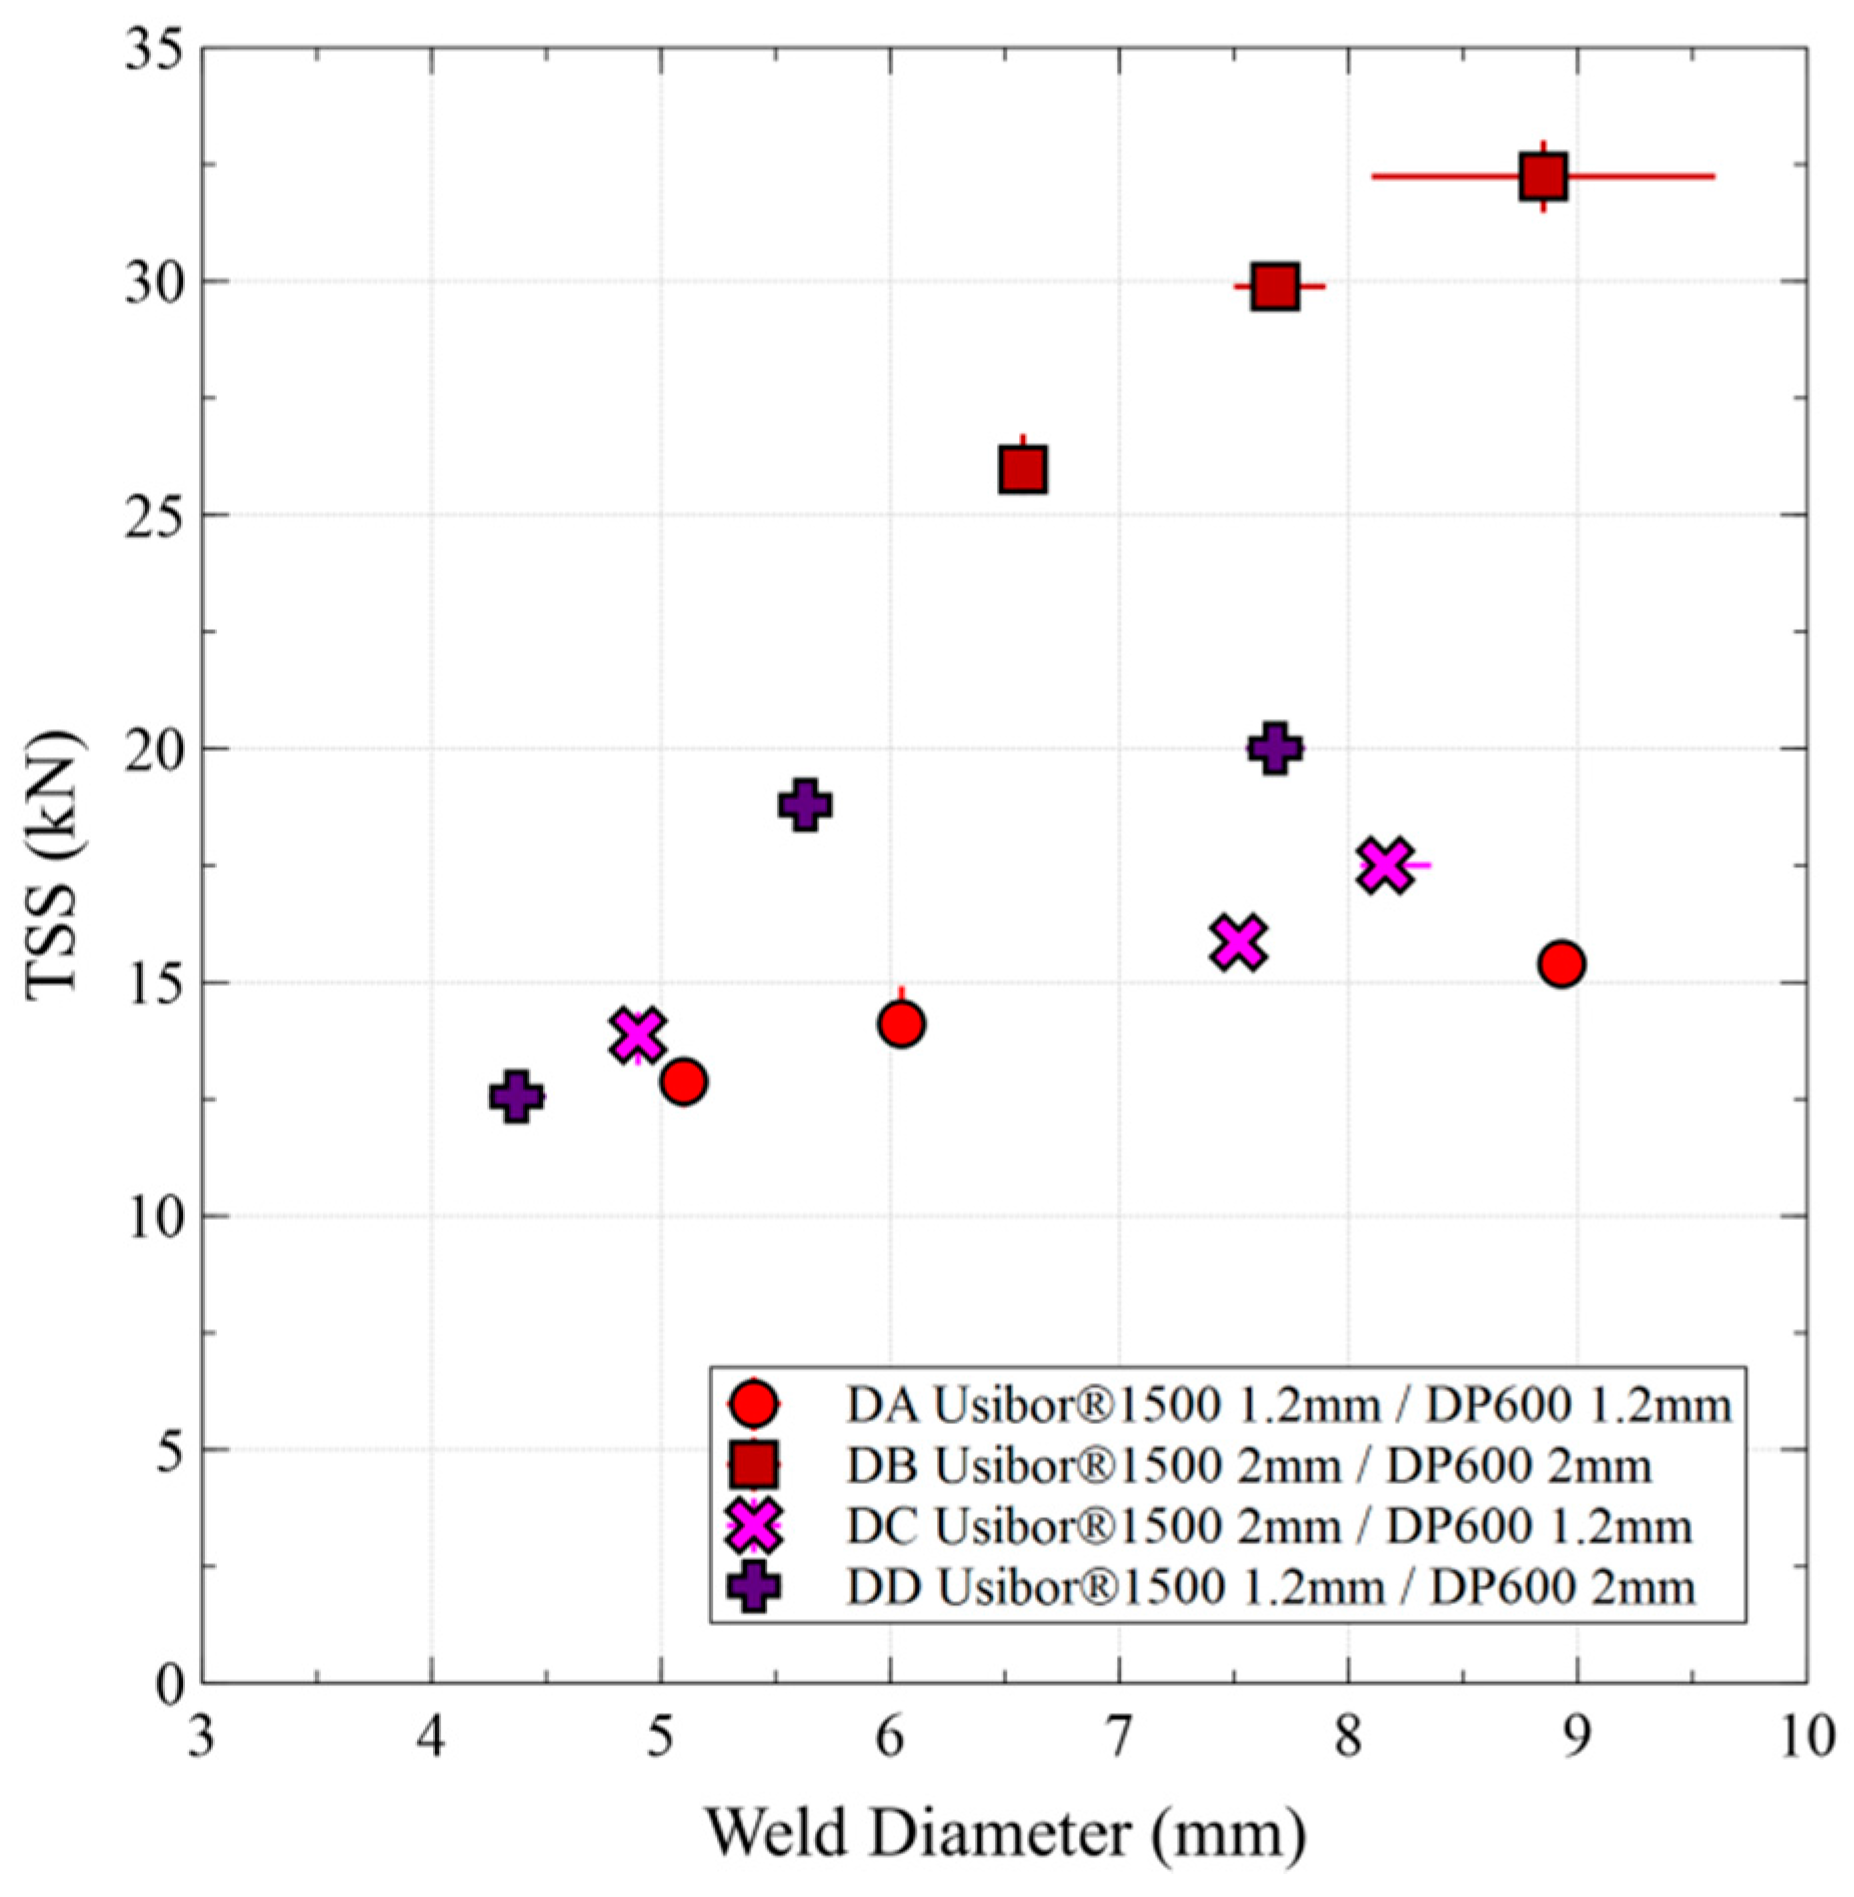
3.3.2. Load Bearing Capacities

Spot weld failure loads in tensile shear are presented in Table 6 for the different configurations and plotted in Figure 12 as a function of the weld diameter.
For a given 9 mm weld diameter, the DB failure load is more than twice bigger than in the DA case. As opposed to the cross tension case where the heterogeneous DC configuration presented more strength than the DD one, the DD configuration performs better in tensile shear. Moreover, DA and DC configurations present almost the same levels of failure loads. In other words, increasing the Usibor sheet thickness from 1.2 to 2.0 mm did not affect the failure load (but shifted failure on the DP side), while thickening rather the DP600 sheet (DD configuration) produced a significant increase in failure load.

4. Discussion

4.1. Liquid Metal Splash Influence on Cross Tension Performance

In the experimental procedure, a prior characterization of the welding range was done according to the ISO 18278-2 standard of RSW. This allowed identifying a maximum welding current before the appearance of significant expulsion, for each configuration. Metallographic inspection, as in Figure 4c,f, illustrates, however, that such upper end definition of the welding range does not prevent limited weld metal splash at the notch tip. This may be due to a slightly inhomogeneous distribution of the electrode force around the spot weld. Section 3.2 illustrated above that this promoted the occurrence of (partial) dome failure in cross tension and was correlated with a decrease in failure load, in spite of a higher weld diameter.
Figure 13 highlights the example of the DA configuration at the upper end of the welding range. It illustrates that considering the plug diameter instead of the full weld diameter helps retrieving an almost linear correlation between the failure load in cross tension and the diameter, as often observed in the literature [7,9]. This is as if the metal splash acted as an easily opening pre-crack reducing the apparent diameter of the weld. However, this decrease in failure load is not observed in tensile shear, where the tangential loading mode of the faying surface makes it less sensitive to such irregularities of the notch tip.

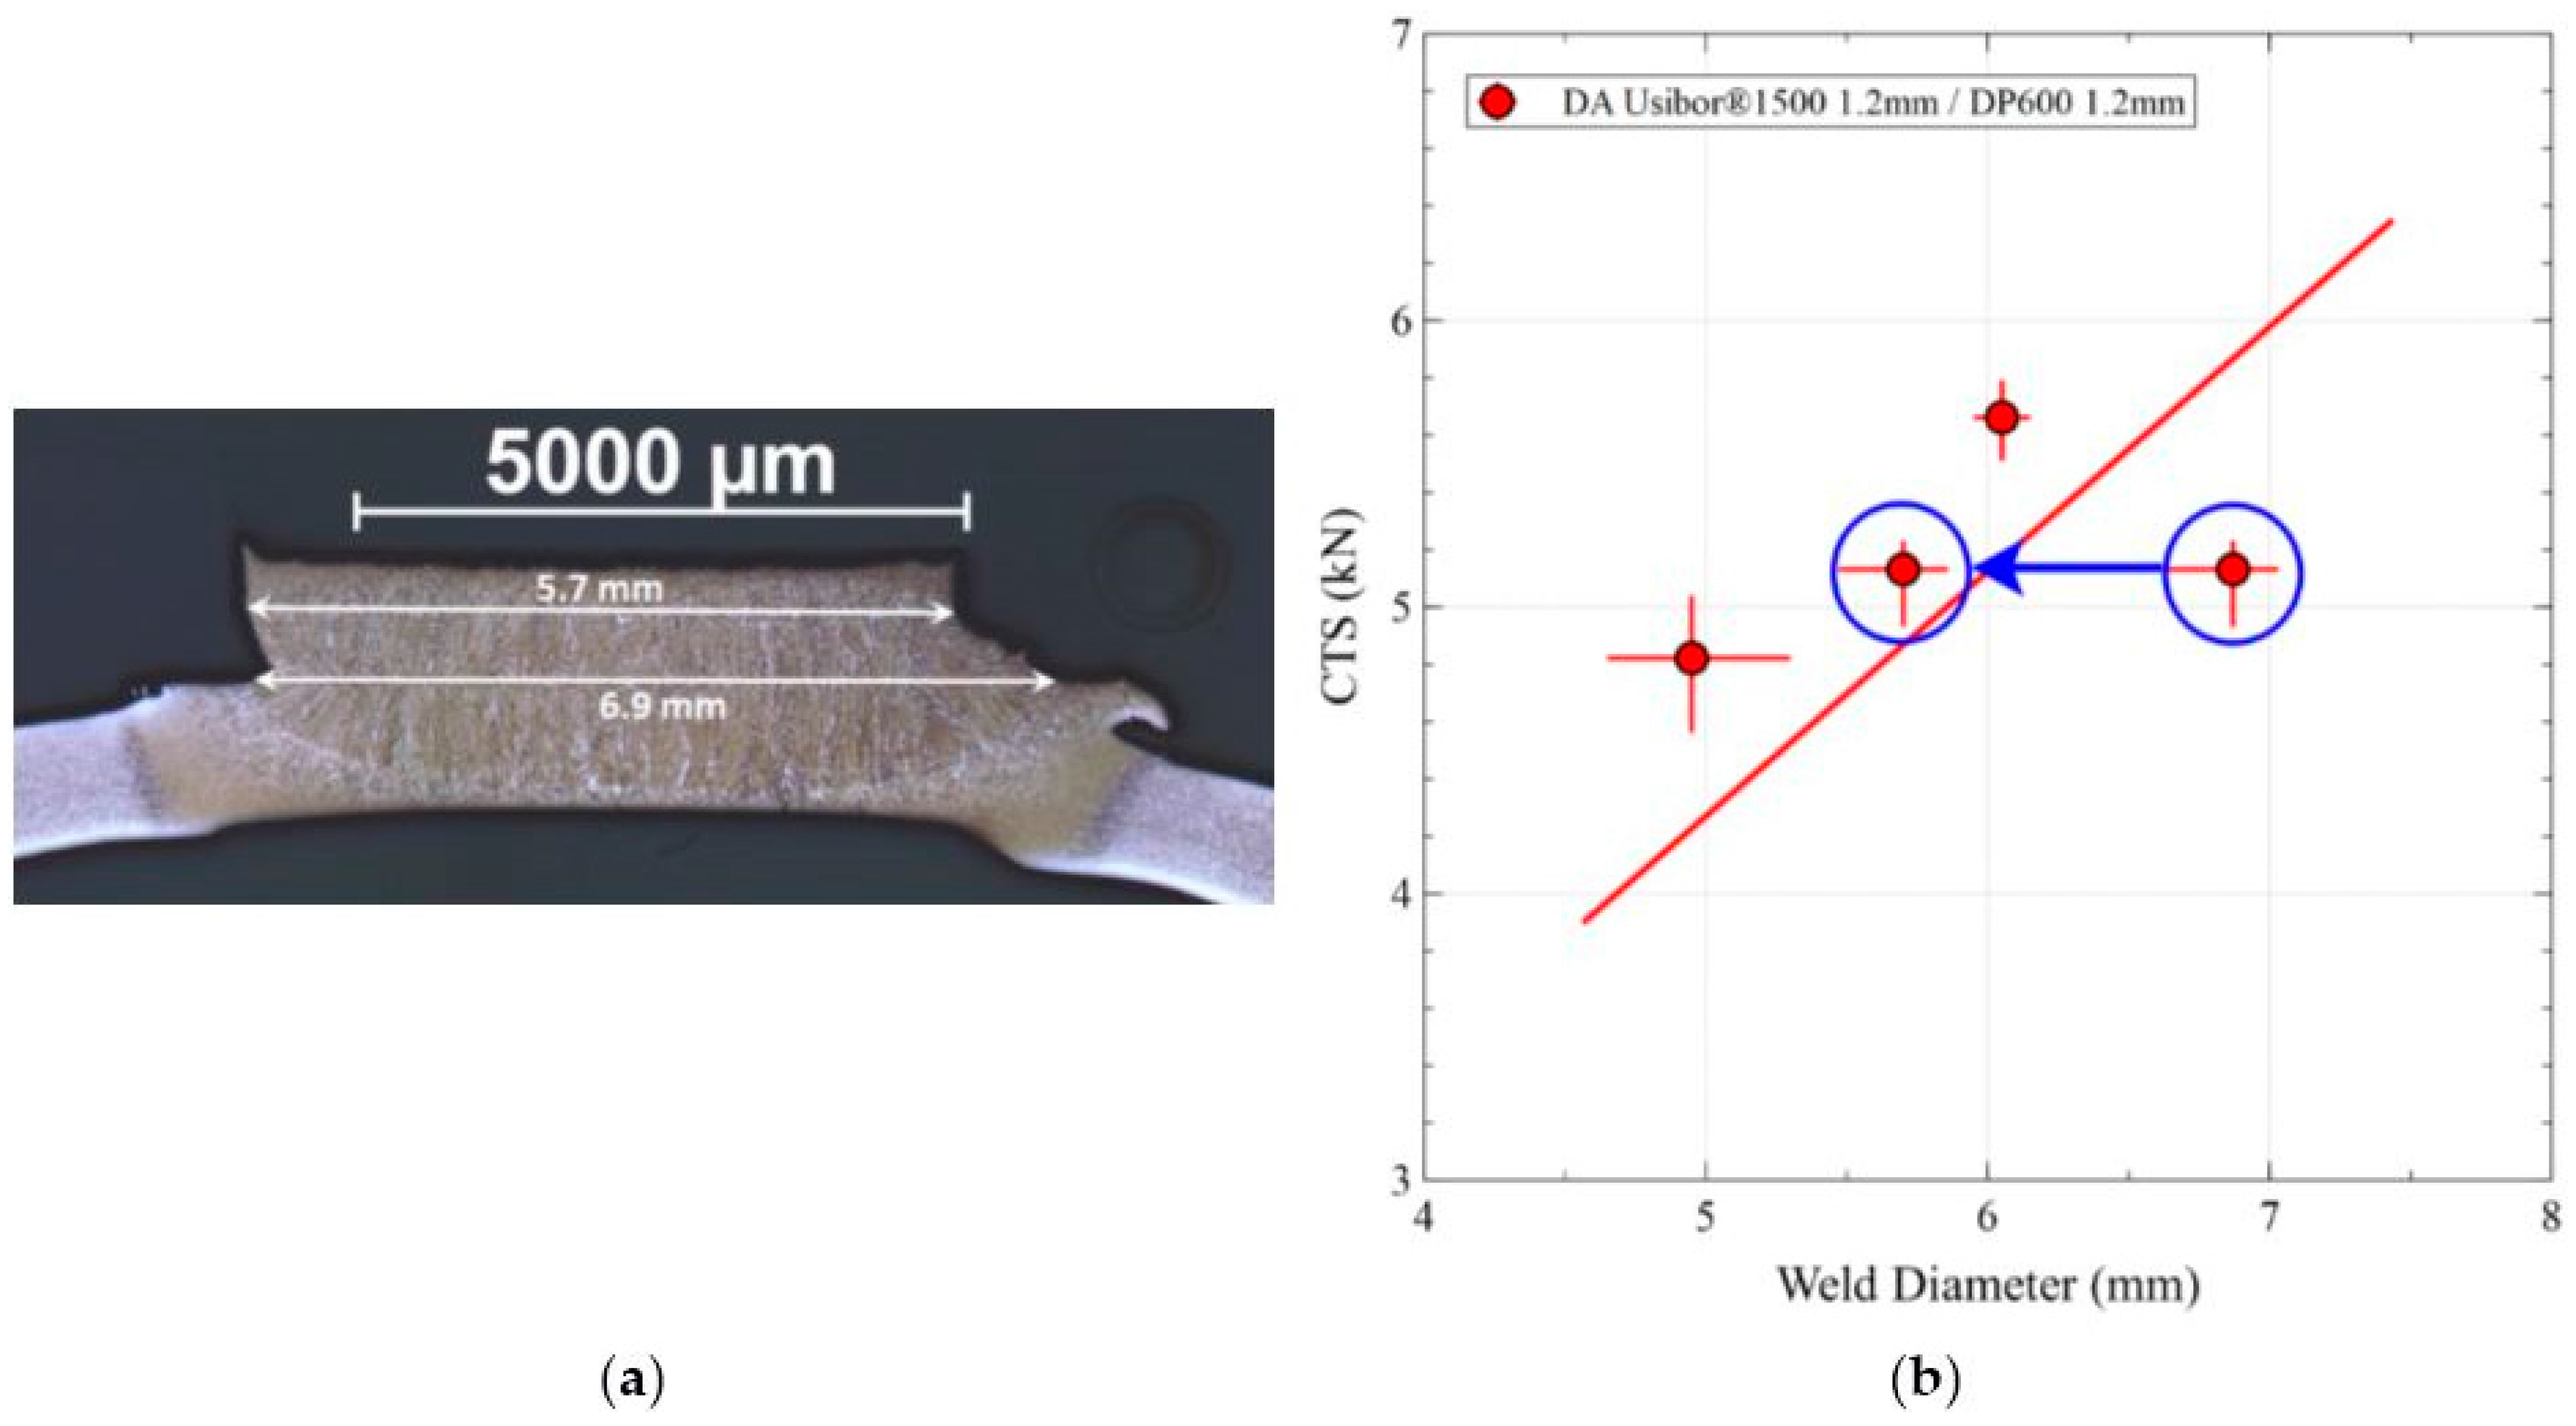
4.2. Positive Deviation of Cross Tension Failure Load with Dissimilar Thickness

Section 3.2 illustrated above the positive effect of dissimilar thickness welding on the cross tension performance parameter α, that can be seen as the failure load normalized by the sheet thickness and the weld diameter. Dissimilar thickness configurations (DC and DD) present indeed higher α than the three iso-thickness configurations (DA, DB and 1.5 mm/1.5 mm). Such effect is also seen in the experimental results of Biro et al. [30], concerning mostly a DP980 steel in that case.
Several phenomena can be proposed to contribute to the positive deviation. First, chemical dilution in the weld nugget affects hardenability and hardness in the case of dissimilar welding with different steel grades. This was clearly observed in Section 3.1 where the weld nugget hardness strongly differs from the Usibor and DP600 HAZ. It is itself significantly affected by the thickness ratio of the two sheets influencing the final composition of the weld nugget and its hardness (470 HV for DC, 419 HV for DD). Second, increasing the sheet thickness is likely to reduce the cooling rates during the process and consequently the types of microstructures obtained in the weld nugget and HAZ, as detailed in Dancette et al. [32]. In the present study, increasing the sheet thickness from 1.2 mm (DA configuration) to 2.0 mm (DB configuration) produces a slight decrease of average weld nugget hardness from 429 to 413 HV. However, the link from microstructure and hardness to damage behavior and the resulting failure mode and failure load of spot welds remains very complex. As an example, the harder (and potentially more brittle) DC weld nugget is in fact presenting a slightly higher α performance parameter in cross tension than the softer DD one (0.99 vs. 0.92 kN/mm2 respectively).
Beyond microstructure types and hardnesses, simple geometrical considerations are also likely to affect the weld behavior. First, the position of the notch tip with respect to the weld nugget height is affected by dissimilar thickness welding as illustrated in Figure 3, where the nugget center tends to shift towards the thicker sheet. Assuming that the former solidification plane presents a low toughness and since it is no more aligned with the notch tips in dissimilar thickness configurations, this may contribute to the better performance of the latter in cross tension, as also suggested in Biro et al. [30]. Another possible effect may arise from the notch tip radius and orientation with respect to weld nugget-HAZ interface, which is affected by dissimilar thickness welding and may have consequences on the initiation of crack propagation from the notch tip.
These different chemical, microstructural and geometrical features of heterogeneous spot welds are strongly interrelated and make it difficult to observe experimentally unambiguous trends in spot welds mechanical behavior with a given parameter. One perspective here is the development of finite element models (e.g., Dancette et al. [33,34]) that allow investigating separately the influence of the numerous influencing parameters, from the local constitutive behavior to geometrical effects and their consequences on stress concentration or varying boundary conditions.

4.3. Dissimilar Thickness Effect in Tensile Shear

Contrary to cross tension, there is no global obvious and significant positive effect of dissimilar thickness on the tensile shear failure load with respect to the homogeneous configurations. However, all welds present a strong dependence of the failure load to the weld diameter and sheet thickness. These results are consistent with the conclusions of Marashi [29] and Pouranvari [31] who observed that nugget diameter and the weld fusion penetration are the two main controlling factors of Tensile Shear strength for a given sheet configuration.
One factor often mentioned to influence the tensile shear strength of dissimilar spot welds is the Ultimate Tensile Strength (UTS) of the thinnest sheet base metal [29]. The present study reinforces the trend following which a higher base metal UTS in the thinnest sheet increases the tensile shear failure load: for a given weld diameter, DD welds (thin Usibor1500 sheet) present a higher failure load than DC welds (thin DP600 sheet), despite the fact that final fracture is not taking place in the base metal. Consequently, one way of increasing the tensile shear failure load of dissimilar spot welds consists in increasing the thickness of the lower grade sheet. This is illustrated by the comparison of DA (iso-thickness, 1.2 mm) and DD configurations (thick 2.0 mm DP600 sheet on a thin 1.2 mm Usibor one): DD welds present a higher failure load than the corresponding DA welds at the same weld diameter. A consequence of the DD configuration is the lower weld rotation during loading due to lower bending deformation in this configuration.

5. Conclusions

Dissimilar resistance spot welding of two common Advanced High Strength Steels, a martensitic Usibor and a dual-phase DP600, was investigated under cross tension and tensile shear. Four thickness configurations were studied, two similar and two dissimilar. The following conclusions can be highlighted:
  • Positive deviation of the cross tension strength is observed in heterogeneous assemblies with dissimilar thicknesses.
  • Such positive deviation is not as obvious in tensile shear. Namely, increasing the sheet thickness of the highest grade steel (Usibor in the present study) was ineffective in enhancing the tensile shear strength.
  • Limited weld metal expulsion (splash) at the upper end of the welding range affects the cross tension behavior but has no significant effect on the tensile shear performance.
  • Limited weld metal expulsion favors the occurrence of Partial Dome Failure in cross tension, where the crack first propagates close to the weld nugget boundary then forks up to form a button.
  • Total Dome Failures, following the weld nugget-HAZ interface, were observed for low welding current in tensile shear in the DC configuration. This is in contrast to the usual Full Interfacial Failure often occurring for small welds in tensile shear.
  • The failure load of heterogeneous AHSS spot welds increases with the nugget size and the sheet thickness regardless of the failure mode, as long no splash defects are encountered.

Acknowledgments

The authors acknowledge the support of ANRT (Association Nationale de la Recherche et de la Technologie) for funding this work.

Author Contributions

T.H., S.D., D.F. and T.D. conceived and designed the experiments; T.H. performed the experiments and analyzed the data; and T.H., S.D., D.F. and T.D. wrote the paper.

Conflicts of Interest

The authors declare no conflict of interest. The founding sponsors had no role in the design of the study; in the collection, analyses, or interpretation of data; in the writing of the manuscript, and in the decision to publish the results.

Abbreviations

The following abbreviations are used in this manuscript:
AHSS
Advanced High Strength Steel
RSW
Resistance Spot Welding
HAZ
Heat Affected Zone
FZ
Fusion Zone
CGHAZ
Coarse Grain Heat Affected Zone
CTS
Cross Tension failure load
TSS
Tensile Shear failure load
BPO
Button Pull-Out
PIF
Partial Interfacial Failure
FIF
Full Interfacial Failure
PDF
Partial Dome Failure
TDF
Total Dome Failure
UTS
Ultimate Tensile Strength

References

  1. American Welding Society (AWS) D8 Committee on Automotive Welding. Specification for Automotive Weld Quality-Resistance Spot Welding of Steel, 1st ed.; American Welding Society: Miami, FL, USA, 2007. [Google Scholar]
  2. Resistance Welding-Weldability-Part 2: Alternative Procedures for the Assessment of Sheet Steels for Spot Welding; ISO Copyright Office: Geneva, Switzerland, 2004.
  3. Specimen Dimensions and Procedure for Cross Tension Testing Resistance Spot and Embossed Projection Welds; ISO Copyright Office: Geneva, Switzerland, 2001.
  4. Specimen Dimensions and Procedure for Shear Testing Resistance Spot, Seam and Embossed Projection Welds; ISO Copyright Office: Geneva, Switzerland, 2002.
  5. Sun, X.; Stephens, E.V.; Khaleel, M.A. Effects of fusion zone size and failure modes of Advanced High Strength Steel spot welds. In Proceedings of the Sheet Metal Welding Conference XII, Livonia, MI, USA, 10–12 May 2006.
  6. Sakuma, Y.; Oikawa, H. Factors to determine static strengths of spot weld for High Strength Steel sheets and developments of High Strength Steel sheets with strong and stable welding characteristics. Nippon Steel Tech. Rep. 2003, 88, 33–38. [Google Scholar]
  7. Pouranvari, M.; Asgari, H.; Mosavizadch, S.; Marashi, P.; Goodarzi, M. Effect of weld nugget size on overload failure mode of resistance spot welds. Sci. Technol. Weld. Join. 2007, 12, 217–225. [Google Scholar] [CrossRef]
  8. Hernandez, V.H.B.; Kuntz, M.L.; Khan, M.I.; Zhou, Y. Influence of microstructure and weld size on the mechanical behavior of dissimilar AHSS resistance spot welds. Sci. Technol. Weld. Join. 2008, 13, 769–776. [Google Scholar] [CrossRef]
  9. Chao, Y.J. Failure mode of spot welds: Interfacial versus pullout. Sci. Technol. Weld. Join. 2003, 8, 133–137. [Google Scholar]
  10. Khan, M.I.; Kuntz, M.L.; Zhou, Y. Effects of weld microstructure on static and impact performance of resistance spot welded joints in advanced high strength steels. Sci. Technol. Weld. Join. 2008, 13, 49–59. [Google Scholar] [CrossRef]
  11. Pouranvari, M.; Marashi, S.P.H. Similar and dissimilar RSW of low carbon and austenitic stainless steels: Effect of weld microstructure and hardness profile on failure mode. Mater. Sci. Technol. 2009, 25, 1411–1416. [Google Scholar] [CrossRef]
  12. Alizadeh-Sh, M.; Marashi, S.P.H.; Pouranvari, M. Microstructure-properties relationships in martensitic stainless steel resistance spot welds. Sci. Technol. Weld. Join. 2014, 19, 595–602. [Google Scholar] [CrossRef]
  13. Pouranvari, M.; Marashi, S.P.H.; Mousavizadeh, S.M. Failure mode transition and mechanical properties of similar and dissimilar resistance spot welds of DP600 and low carbon steels. Sci. Technol. Weld. Join. 2010, 15, 625–631. [Google Scholar] [CrossRef]
  14. Peterson, W.; Orth, F. Fracture transition behavior of spot welds in Advanced High-Strength Steels. In Proceedings of the Sheet Metal Welding Conference XII, Livonia, MI, USA, 10–12 May 2006.
  15. Safanama, D.S.; Marashi, S.P.H.; Pouranvari, M. Similar and dissimilar resistance spot welding of martensitic advanced high strength steel and low carbon steel: Metallurgical characteristics and failure mode transition. Sci. Technol. Weld. Join. 2012, 17, 288–294. [Google Scholar] [CrossRef]
  16. Abadi, M.M.H.; Pouranvari, M. Failure-Mode Transition in Resistance Spot Welded DP780. Mater. Technol. 2014, 48, 67–71. [Google Scholar]
  17. Pouranvari, M.; Marashi, S.P.H. Failure mode transition in AHSS resistance spot welds. Part I. Controlling factors and Part II: Experimental investigation and model validation. Mater. Sci. Eng. A 2011, 528, 8337–8343. [Google Scholar] [CrossRef]
  18. Jong, Y.S.; Lee, Y.K.; Kim, D.C.; Kang, M.J.; Hwang, I.S.; Lee, W.B. Microstructural evolution and mechanical properties of resistance spot welded ultra-high strength steel containing boron. Mater. Trans. 2011, 52, 1330–1333. [Google Scholar] [CrossRef]
  19. Bouzekri, M.; Dancette, S.; Dupuy, T.; Lens, A.; Oultit, B.N.; Massardier, V.; FabrEgue, D.; Klocker, H. An investigation of failure types in high-strength steel resistance spot welds. Weld. World 2010, 54, 3–14. [Google Scholar] [CrossRef]
  20. Choi, H.S.; Kim, B.M.; Park, G.H.; Lim, W.S. Optimization of resistance spot weld condition for single lap joint of hot stamped 22MnB5 by taking heating temperature and heating time into consideration. Trans. Korean Soc. Mech. Eng. 2010, 34, 1367–1375. [Google Scholar] [CrossRef]
  21. Pouranvari, M.; Marashi, S.P.H. On failure mode of resistance spot welded DP980 advanced high strength steel. Can. Metall. Q. Can. J. Metall. Mater. Sci. 2012, 51, 447–455. [Google Scholar] [CrossRef]
  22. Spena, P.R.; de Maddis, M.; Lombardi, F. Mechanical Strength and Fracture of Resistance Spot Welded Advanced High Strength Steels. Proced. Eng. 2015, 108, 450–456. [Google Scholar] [CrossRef]
  23. Dancette, S.; Massardier-Jourdan, V.; Merlin, J.; Fabrègue, D.; Dupuy, T. Investigations on the mechanical behavior of advanced high strength steels resistance spot welds in cross tension and tensile shear. Adv. Mater. Res. Trans. Tech. Publ. 2010, 89, 130–135. [Google Scholar] [CrossRef]
  24. Dancette, S.; Fabrègue, D.; Massardier, V.; Merlin, J.; Dupuy, T.; Bouzekri, M. Experimental and modeling investigation of the failure resistance of Advanced High Strength Steels spot welds. Eng. Fract. Mech. 2011, 78, 2259–2272. [Google Scholar] [CrossRef]
  25. Dancette, S.; Fabrègue, D.; Massardier, V.; Merlin, J.; Dupuy, T.; Bouzekri, M. Investigation of the Tensile Shear fracture of Advanced High Strength Steel spot welds. Eng. Fail. Anal. 2012, 25, 112–122. [Google Scholar] [CrossRef]
  26. Khan, M.S.; Bhole, S.D.; Chen, D.L.; Biro, E.; Boudreau, G.; van Deventer, J. Welding behavior, microstructure and mechanical properties of dissimilar resistance spot welds between galvannealed HSLA350 and DP600 steels. Sci. Technol. Weld. Join. 2009, 14, 616–625. [Google Scholar] [CrossRef]
  27. Choi, H.S.; Park, G.H.; Lim, W.S.; Kim, B.M. Evaluation of weldability for resistance spot welded single-lap joint between GA780DP and hot-stamped 22MnB5 steel sheets. J. Mech. Sci. Technol. 2011, 25, 1543–1550. [Google Scholar] [CrossRef]
  28. Spena, P.R.; de Maddis, M.; Lombardi, F.; Rossini, M. Dissimilar Resistance Spot Welding of Q&P and TWIP Steel Sheets. Mater. Manuf. Process. 2016, 31, 291–299. [Google Scholar]
  29. Marashi, S.P.H.; Pouranvari, M.; Salehi, M.; Abedi, A.; Kaviani, S. Overload failure behavior of dissimilar thickness resistance spot welds during tensile shear test. Mater. Sci. Technol. 2010, 26, 1220–1225. [Google Scholar] [CrossRef]
  30. Biro, E.; Cretteur, L.; Dupuy, T. Higher than expected strengths from dissimilar Configuration advanced high strength steel spot welds. In Proceedings of the Sheet Metal Welding Conference XV, Livonia, MI, USA, 2–5 October 2012.
  31. Pouranvari, M.; Marashi, P. Resistance Spot Welding of Unequal Thickness Low Carbon Steel Sheets. Adv. Mater. Res. 2010, 83, 1205–1211. [Google Scholar] [CrossRef]
  32. Dancette, S.; Massardier, V.; Fabrègue, D.; Merlin, J.; Dupuy, T.; Bouzekri, M. HAZ microstructures and local mechanical properties of high strength steels resistance spot welds. ISIJ Int. 2011, 51, 99–107. [Google Scholar] [CrossRef]
  33. Dancette, S.; Fabrègue, D.; Estevez, R.; Massardier, V.; Dupuy, T.; Bouzekri, M. A finite element model for the prediction of Advanced High Strength Steel spot welds fracture. Eng. Fract. Mech. 2012, 87, 48–61. [Google Scholar] [CrossRef]
  34. Dancette, S. Comportement mécanique des soudures par points: mécanismes et stratégies de prédiction dans le cas des tôles en acier pour automobile. Ph.D. Thesis, Université de Lyon, Lyon, France, May 2009. [Google Scholar]
Figure 1. Usual destructive mechanical tests to characterize spot weld strength: (a) Cross Tension test; and (b) Tensile Shear test.
Metals 06 00111 g001
Figure 2. Base metal microstructures: (a) Usibor®1500; and (b) DP600.
Metals 06 00111 g002
Figure 3. Spot weld failure modes: Button Pull-Out, Partial Interfacial Failure, Full Interfacial Failure, Partial Dome Failure, and Total Dome Failure.
Metals 06 00111 g003
Figure 4. Spot weld metallographic cross sections for DB and DD configurations, as defined in Table 2, at the three positions in the welding range (Usibor is always the upper sheet): (a) DB lower end; (b) DB middle position; (c) DB upper end; (d) DD lower end; (e) DD middle position; and (f) DD upper end.
Metals 06 00111 g004
Figure 5. Spot weld hardness profiles for DB (Usibor 2 mm-DP600 2 mm) and DC (Usibor 2 mm-DP600 1.2 mm) configurations: (a) DB hardness profile; (b) DC hardness profile; (c) DB metallographic cross-section; and (d) DC metallographic cross-section.
Metals 06 00111 g005
Figure 6. Main failure modes encountered during Cross Tension tests (metallographic cross section and visual aspect): (a,b): PIF; (c,d) BPO; and (e,f) BPO + PDF.
Metals 06 00111 g006
Figure 7. Beginning of expulsion in the DC configuration at the upper end of the welding range promoting partial dome failure: metallographic cross section before (a) and after (b) the cross tension test.
Metals 06 00111 g007
Figure 8. Scanning Electron Microscopy (SEM) fracture surfaces in cross tension: (a) Button Pull-Out; and (b) Partial Dome Failure.
Metals 06 00111 g008
Figure 9. Cross tension failure load (CTS) as a function of weld diameter and welding assembly: (a) Usibor and DP600 heterogeneous welding configurations; and (b) homogeneous welding configurations compared with the dissimilar 1.5 mm Usibor/1.5 mm DP600. α in kN/mm2.
Metals 06 00111 g009
Figure 10. Main failure modes during the tensile shear tests (metallographic cross section and visual aspect): (a,b) Full Interfacial Failure (FIF); (c,d) Button Pull-Out (BPO); and (e,f) Total Dome Failure (TDF).
Metals 06 00111 g010
Figure 11. SEM fracture surfaces in tensile shear: (a) Full Interfacial Failure; (b) Button Pull-Out; and (c) Total Dome Failure.
Metals 06 00111 g011
Figure 12. Tensile shear failure load (TSS) as a function of weld diameter.
Metals 06 00111 g012
Figure 13. DA configuration spot weld: (a) Metallographic cross-section at the upper end of the welding range after cross tension, highlighting two possible measures of diameter (plug or weld). (b) DA failure loads as a function of diameter, with a possible horizontal shift of the upper end spot welds when considering the effective plug diameter instead of the full weld diameter.
Metals 06 00111 g013
Table 1. Steel grades and chemical composition (wt. %).
GradeThickness (mm)CMnSiB
DP6001.20.0881.8700.150-
DP60020.0851.8850.241-
Usibor®15001.20.2211.1840.2560.003
Usibor®150020.2181.1490.2660.003
Table 2. Heterogeneous welding configurations depending on sheet thickness.
ConfigurationUsibor®1500 Sheet Thickness (mm)DP600 Sheet Thickness (mm)
DA1.21.2
DB22
DC21.2
DD1.22
Table 3. Cross tension failure modes.
ConfigurationsLow Intensity RangeMiddle Intensity RangeHigh Intensity Range
DA: Usibor 1.2 mm/DP600 1.2 mmUsibor Failure (PIF)Usibor Failure (BPO)Usibor Failure (BPO + PDF)
DB: Usibor 2 mm/DP600 2 mmUsibor Failure (PIF)Usibor Failure (PIF)Usibor Failure (BPO)
DC: Usibor 2 mm/DP600 1.2 mmDP600 Failure (PIF)DP600 Failure (BPO)Usibor Failure (BPO + PDF)
DD: Usibor 1.2 mm/DP600 2 mmUsibor Failure (BPO)Usibor Failure (BPO)Usibor Failure (BPO + PDF)
Table 4. Cross tension failure loads (kN, average of three tests).
ConfigurationsLow Intensity RangeMiddle Intensity RangeHigh Intensity Range
DA: Usibor 1.2 mm/DP600 1.2 mm4.82 ± 0.265.66 ± 0.155.13 ± 0.20
DB: Usibor 2 mm/DP600 2 mm11.08 ± 0.8811.64 ± 1.2013.05 ± 1.14
DC: Usibor 2 mm/DP600 1.2 mm6.33 ± 0.648.47 ± 0.778.37 ± 0.89
DD: Usibor 1.2 mm/DP600 2 mm4.82 ± 0.116.00 ± 0.097.94 ± 0.94
Table 5. Tensile shear failure modes.
ConfigurationsLow Intensity RangeMiddle Intensity RangeHigh Intensity Range
DA: Usibor 1.2 mm/DP600 1.2 mmUsibor Failure (BPO)Usibor Failure (BPO)Usibor Failure (BPO)
DB: Usibor 2 mm/DP600 2 mmFIFUsibor Failure (BPO)Usibor Failure (BPO)
DC: Usibor 2mm/DP600 1.2 mmDP600 Failure (TDF)DP600 Failure (BPO + lateral PDF)DP600 Failure (BPO)
DD: Usibor 1.2 mm/DP600 2 mmFIFFIFUsibor Failure (BPO)
Table 6. Tensile shear failure loads (kN, average of three tests).
ConfigurationsLow Intensity RangeMiddle Intensity RangeHigh Intensity Range
DA: Usibor 1.2 mm/DP600 1.2 mm12.87 ± 0.5514.11 ± 0.8115.39 ± 0.05
DB: Usibor 2 mm/DP600 2 mm25.95 ± 0.7629.89 ± 0.3133.13 ± 0.77
DC: Usibor 2 mm/DP600 1.2 mm13.87 ± 0.6415.85 ± 0.1217.50 ± 0.05
DD: Usibor 1.2 mm/DP600 2 mm12.55 ± 0.0918.79 ± 0.3120.00 ± 0.03

