Effect of Grain Size on Grain Boundary Segregation Thermodynamics of Phosphorus in Interstitial-Free and 2.25Cr-1Mo Steels

1
Shenzhen Key Laboratory of Advanced Materials, Shenzhen Graduate School, Harbin Institute of Technology, Shenzhen 518055, China
2
Central Iron and Steel Research Institute, Beijing 100081, China
*
Authors to whom correspondence should be addressed.
Metals 2017, 7(11), 470; https://doi.org/10.3390/met7110470
Submission received: 27 September 2017
/
Revised: 23 October 2017
/
Accepted: 31 October 2017
/
Published: 2 November 2017
(This article belongs to the Special Issue Physical Metallurgy of High Performance Steels)
Abstract
:Several grain sizes were obtained by heat treatment at different temperatures for interstitial-free (IF) and 2.25Cr-1Mo steels. Samples of the steels with different grain sizes were aged at 600 and 680 °C for IF steel and 520 and 560 °C for 2.25Cr-1Mo steel for sufficient time to achieve their equilibrium grain boundary segregation. The grain boundary concentrations of phosphorus were examined using Auger electron spectroscopy. At the same aging temperature, the boundary segregation of phosphorus increased with increasing grain size. The effect of grain size on equilibrium grain boundary segregation thermodynamics was analyzed based on the information of both grain size and phosphorus boundary concentration. The segregation enthalpy increased with increasing grain size and simultaneously the segregation entropy became less negative. Moreover, the segregation entropy (∆S) and enthalpy (∆H) of phosphorus in both IF and 2.25Cr-1Mo steels exhibited a unified linear relationship, being expressed as ∆S = 0.85∆H − 38.06, although it segregated to different types of grain boundaries (ferrite grain boundaries in IF steel and prior austenite grain boundaries in 2.25Cr-1Mo steel). With the aid of the acquired thermodynamic parameters and grain boundary segregation theories, the equilibrium segregation concentrations at different aging temperatures were modeled under different grain sizes for both steels.
1. Introduction
It is well known that [1,2] grain boundary segregation of impurity elements is the main cause of non-hardening embrittlement in low-alloy steels. The vast majority of technologically useful materials are composed of an aggregate of small crystals. These crystals, or grains, are separated from one another by a network of interfaces, or grain boundaries. The grain boundary is a narrow zone of weakness. Once impurity elements segregate to the grain boundaries in these materials, failure would occur catastrophically by fracture along some grain boundaries. Therefore, the grain boundary segregation of solute or impurity elements in the alloys has attracted extensive attention in the research community. Based on the thermodynamic adsorption theory, Mclean [3] firstly proposed the theory of equilibrium grain boundary segregation in binary systems and the thermodynamics of equilibrium segregation can be expressed as
where Ceq is the equilibrium grain boundary concentration of solute (atomic fraction), Cb is the concentration of solute in the matrix (atomic fraction), ΔG is the free energy of segregation of solute (J), R is the gas constant (J·K−1·mol−1), and T is the absolute temperature (K). As can be seen from Equation (1), equilibrium segregation is a thermodynamic process and different temperatures correspond to different equilibrium segregation concentration. The free energy of segregation (ΔG) is defined as the decrease in the free energy of the system caused by grain boundary segregation. It is thus a positive value. The higher the ΔG, the larger the driving force of segregation is. ΔG is given by
where ∆H is the segregation enthalpy and ∆S is the segregation entropy. ∆H is the decrease in the enthalpy of the system induced by grain boundary segregation. It is normally a positive value as the internal energy of the system decreases when solute atoms migrate from the matrix to the boundary. Similarly, ∆S is the decrease in the entropy of the system caused by grain boundary segregation. It is normally a negative value as the entropy of the system increases when solute atoms migrate from the matrix to the boundary. Apparently, the driving force of segregation is closely related to these two thermodynamic parameters.
ΔG = ΔH − TΔS
Moreover, Seah [1] and Guttmann [2] proposed that, in a ternary system, the grain boundary segregation of two solute elements probably had a site competition interaction. Thus, the thermodynamics of segregation need to consider the interaction effect and are given by
where (M = metal element; I = impurity element) represent the equilibrium boundary concentration of solute i in the ternary system, concentration of solute i in the ternary system bulk, free energy of segregation of solute i in the ternary system, free energy of segregation of solute i in the binary system, and interaction coefficient of elements M and I in the ternary system, respectively. Hence, whether the interaction effect of M and I is weak or strong can be reflected by the interaction coefficient αMI.
Equilibrium grain boundary segregation of solute in various alloy systems has been extensively investigated all over the world. Lejcek et al. [4,5,6,7,8] gathered numbers of experimental results from the literatures and analyzed in detail the thermodynamics of grain boundary segregation of several solute/impurity elements. A key discovery of their work is that a linear relationship between segregation entropies and enthalpies of solute atoms exists in multiple alloy systems. However, their analyses were based on the data in the literature and thus the thermodynamic parameters come from different alloy systems with different grain sizes. This means that the grain size effect on segregation was not considered in their analyses. Since the equilibrium segregation level is usually different at different grain sizes, even in the same alloy system, the thermodynamic parameters of segregation would be different. Accordingly, it is better to consider the grain size effect when analyzing the segregation thermodynamics of solute in an alloy system.
Low-alloy steels are widely used in industry. Individual needs of their performance are met by adding different alloy elements during metallurgical processes [9]. For example, the high strength of interstitial-free (IF) steel can be obtained through adding phosphorus for its solid solution strengthening effect, and meanwhile the low-temperature brittleness of the steel is distinctly caused [10]. Moreover, 2.25Cr-1Mo steel, usually used in pressure vessels, enhances its heat and pressure resistant properties mainly by Cr and Mo, and phosphorus is a major embrittling impurity element in the steel [11,12]. Hence, the grain boundary segregation of phosphorus can enhance the brittleness of both IF and 2.25Cr-1Mo steels and much attention must be paid in engineering practice. The aim of the present work is to explore in detail the effect of grain size on the grain boundary segregation thermodynamics of phosphorus in an IF steel and a 2.25Cr-1Mo steel by virtue of Auger electron spectroscopy along with grain boundary segregation theories.
2. Materials and Methods
The experimental IF and 2.25Cr-1Mo steels were prepared by vacuum induction melting. The chemical compositions of the steels are shown in Table 1 for the IF steel and Table 2 for the 2.25Cr-1Mo steel. After melting, the steel ingot (50 kg) was hot rolled into a plate 6 mm thick for the IF steel and 16 mm thick for the 2.25Cr-1Mo steel. The samples with a size of 5 mm × 15 mm × 40 mm were machined from the hot rolled plates for subsequent experiments.
Since the microstructure in the IF steel is usually ferrite at room temperature, different grain sizes are hard to be obtained by simple austenitizing heat treatment. Nevertheless, they may be achieved by heating at a temperature in the ferrite region and then cooling with different procedures or changing the cooling rate from the austenite to ferrite region. Thus, the IF steel samples underwent different heat treatment procedures: (1) heating at 800 °C for 2 h, followed by water cooling; (2) heating at 900 °C for 0.5 h, followed by furnace cooling to room temperature; (3) austenitizing at 960 °C for 30 min, followed by furnace cooling down to 880 °C, holding there for 1 h and then further furnace cooling to room temperature; and (4) austenitizing at 960 °C for 30 min, followed by water quenching. Finally, all samples were aged at 800 °C for 2 h to make the microstructure equilibrized at this temperature. With the above procedures, the samples would have different grain sizes. The grain sizes in different samples were determined by the linear intercept method with metallographic observations.
The samples of 2.25Cr-1Mo steel with different grain sizes were obtained through austenitization at different temperatures. To obtain different grain sizes, they were austenitized at: (1) 960 °C; (2) 1050 °C; (3) 1100 °C; and (4) 1150 °C for 30 min, respectively, and then oil quenched to room temperature. They were subsequently heated at 650 °C for 2 h to equilibrize the microstructure. The grain sizes were also determined by the linear intercept method.
Next, the IF steel samples were aged at 680 °C for 3 h and 600 °C for 25 h, respectively, and the 2.25Cr-1Mo steel samples were aged at 560 °C for 100 h and 520 °C for 500 h, respectively, so that the grain boundary segregation could reach equilibrium at each temperature [10,13]. The aged samples were machined into Auger specimens with a size 3.68 mm in diameter and 31.7 mm in length, and each one had a sharp notch. The Auger specimens were cooled down to liquid nitrogen temperature and then impacted to gain intergranular fracture surfaces for subsequent Auger grain boundary microanalysis. More than 20 grain boundary facets were measured for each sample, and the mean value of the data points obtained was taken as the measured result. The Auger spectra were recorded as dN(E)/dE in which the height of the characteristic peak of an element is proportional to its concentration. The boundary concentration of element i (Ci in atomic fraction) can be calculated by [14]
where Hi and Si are the characteristic peak height and sensitivity factor of element i, respectively. The denominator represents the sum of peak height-to-sensitivity factor ratios for all elements present in the AES (Auger electron spectroscopy) spectra. The Auger sensitivity factors can be found in Ref. [14]. In the calculations, the carbon and oxygen peaks in the spectra were not taken into account in the analysis because they could have an apparent contribution from contamination from the residual atmosphere in the AES system [15,16].
However, Equation (6) does not consider the depth distribution of the concentration near the grain boundary, implying that the boundary concentration obtained by Equation (6) is not the true boundary concentration [13,17,18]. As it is known, Auger electrons originating from about two to three atomic layers below the specimen surface contribute to the AES spectra [14] and the grain boundary is about two to three atomic layers thick [3]. Assuming that the specimen is fractured at the middle of the grain boundary, one can imagine that the grain boundary volume analyzed may just occupy about half the total analyzed volume. Since the AES result is an average over the analyzed specimen volume including both the boundary and the matrix, the actual boundary concentration should be much larger than that calculated from Equation (6). With the assumption that there is not a concentration gradient within the boundary and the concentration (Cg), the true boundary concentration could be corrected as
where Cg, Ci, and Cb denote the true boundary concentration, boundary concentration calculated by Equation (6), and bulk concentration, respectively. All the concentrations are in units of atomic fraction.
In addition, electron backscatter diffraction (EBSD) was used to analyze the variation of grain boundary character distribution (GBCD) with the grain size so as to obtain some information on the effect of grain size on the GBCD and in turn on the effect of grain size on the grain boundary segregation thermodynamics. Since the microstructure in the 2.25Cr-1Mo steel is too complicated, it is difficult to evaluate the prior-austenite grain boundary character distribution. Therefore, the EBSD measurements were only performed for the IF steel. Two specimens of the IF steel with minimum and maximum grain sizes (48 and 225 µm) were first mechanically polished and then electro-polished in a solution of 5% perchloric acid and 95% alcohol for 75 s under a voltage of 18 V, followed by EBSD measurements. The GBCD was obtained through analyzing the EBSD data with the software of orientation imaging microscopy (OIM) while Brandon’s criterion [19] was used to classify the coincidence site lattice (CSL) grain boundary.
3. Results and Discussion
Figure 1 shows the grain morphologies in the samples for both steels. Obviously, four different grain sizes have been achieved for each steel. The determined grain sizes are 48, 72, 129 and 225 μm for the IF steel, and 55, 91, 120 and 179 μm for the 2.25Cr-1Mo steel. Figure 2 represents the scanning electron fractographs of the AES specimens with the largest and smallest grain sizes for both steels, indicating that all the specimens exhibit apparent intergranular fracture with smooth facets and thus they are well suitable for AES grain boundary analysis. It can be envisaged that the other AES specimens would also exhibit apparent intergranular fracture, being suitable for AES grain boundary analysis as they possess intermediate grain sizes.
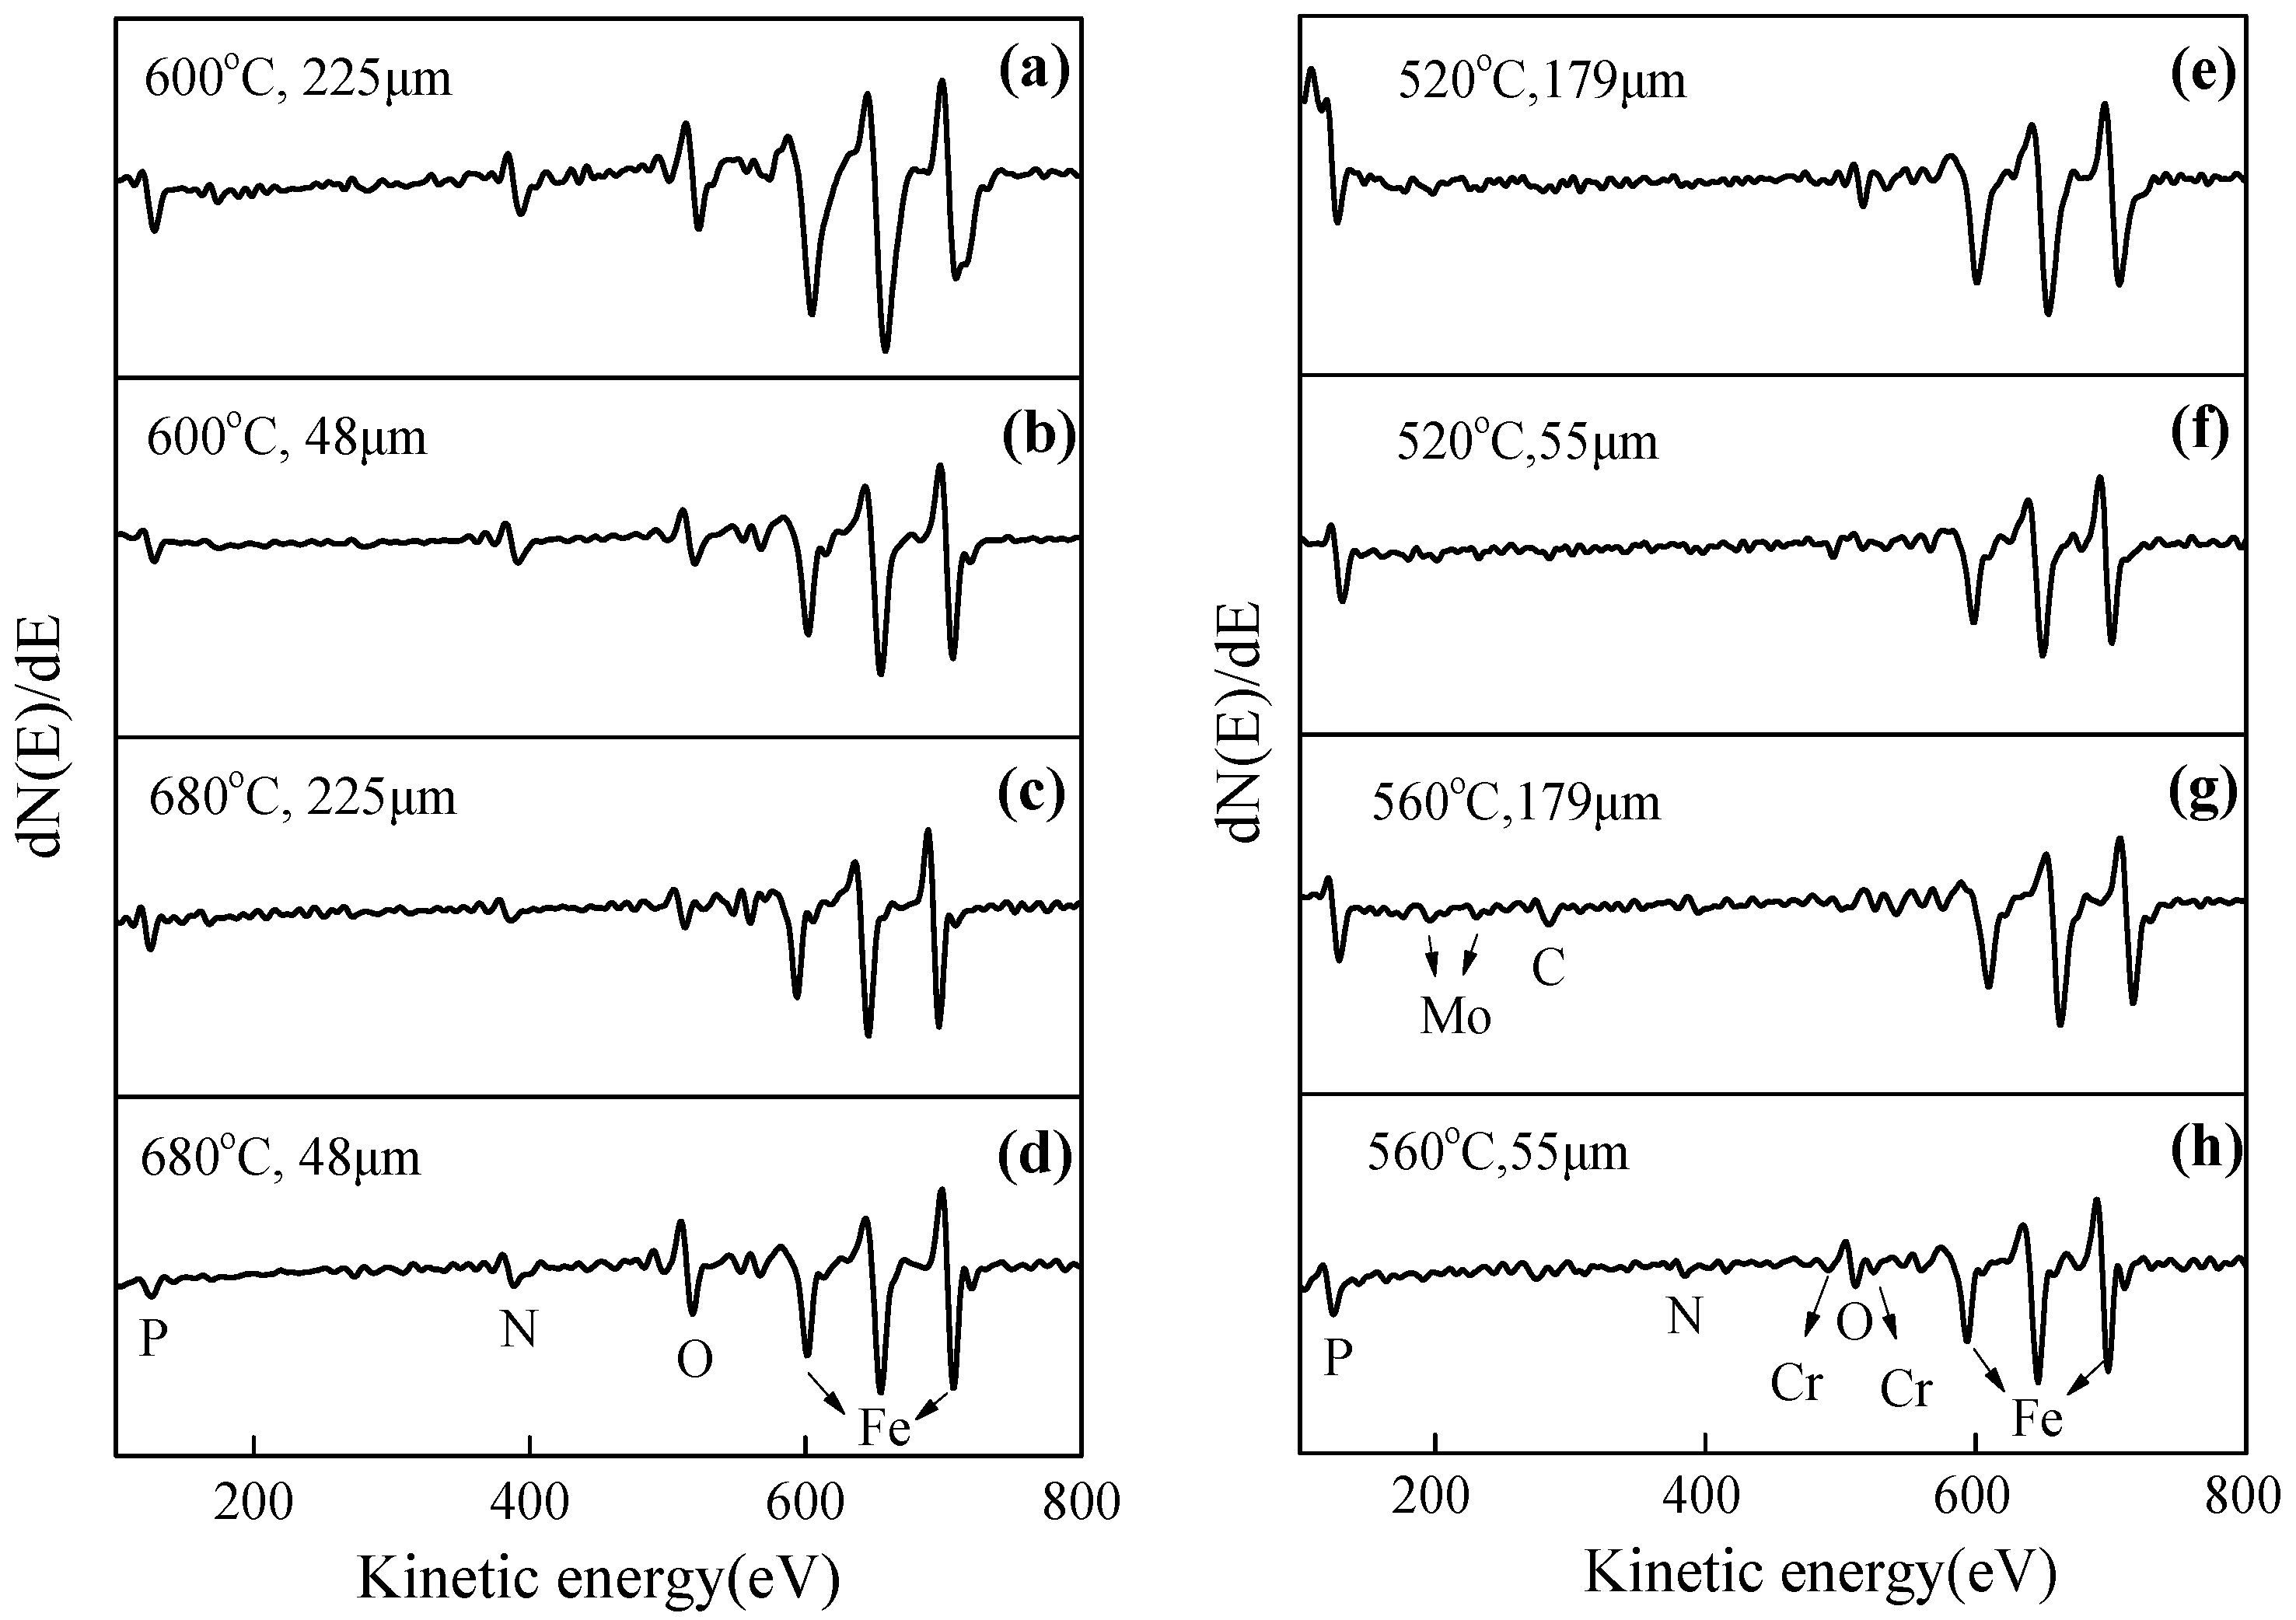
Figure 3 shows the AES spectra of both IF and 2.25Cr-1Mo steel specimens with the largest and smallest grain sizes, aged at different temperatures. As can be seen, there exist Auger peaks of Fe, P, N, and O in the spectra of IF steel. The existence of phosphorus peak indicates that phosphorus has apparently segregated at grain boundaries. Meanwhile, the nitrogen peak is mainly caused by liquid nitrogen during cooling procedure and the oxygen peak is due to environmental contamination. Hence, phosphorus is a main segregation element in the IF steel. In addition, the Auger peak height of phosphorus in the IF steel increases apparently with increasing grain size, illustrating that the grain size has an evident effect on the segregation level. Compared with the IF steel, there are some extra Auger peaks for the 2.25Cr-1Mo steel, which are the peaks of Cr, Mo and C. However, these extra Auger peaks are much lower than that of phosphorus. Therefore, the main segregation element in the 2.25Cr-1Mo steel is also phosphorus. Besides, referring to the literature [13], the adjacent Auger peaks of Cr and O are too close to separate and the segregation interaction between Mo and P is very weak. Consequently, the grain boundary segregation of P in the 2.25Cr-1Mo steel could be regarded as the segregation in a Fe-P binary system. In other words, the interaction factor αMI for Mo and Cr is very small and is negligible. Nevertheless, Mo and Cr should be taken into account in the analysis of AES spectra.
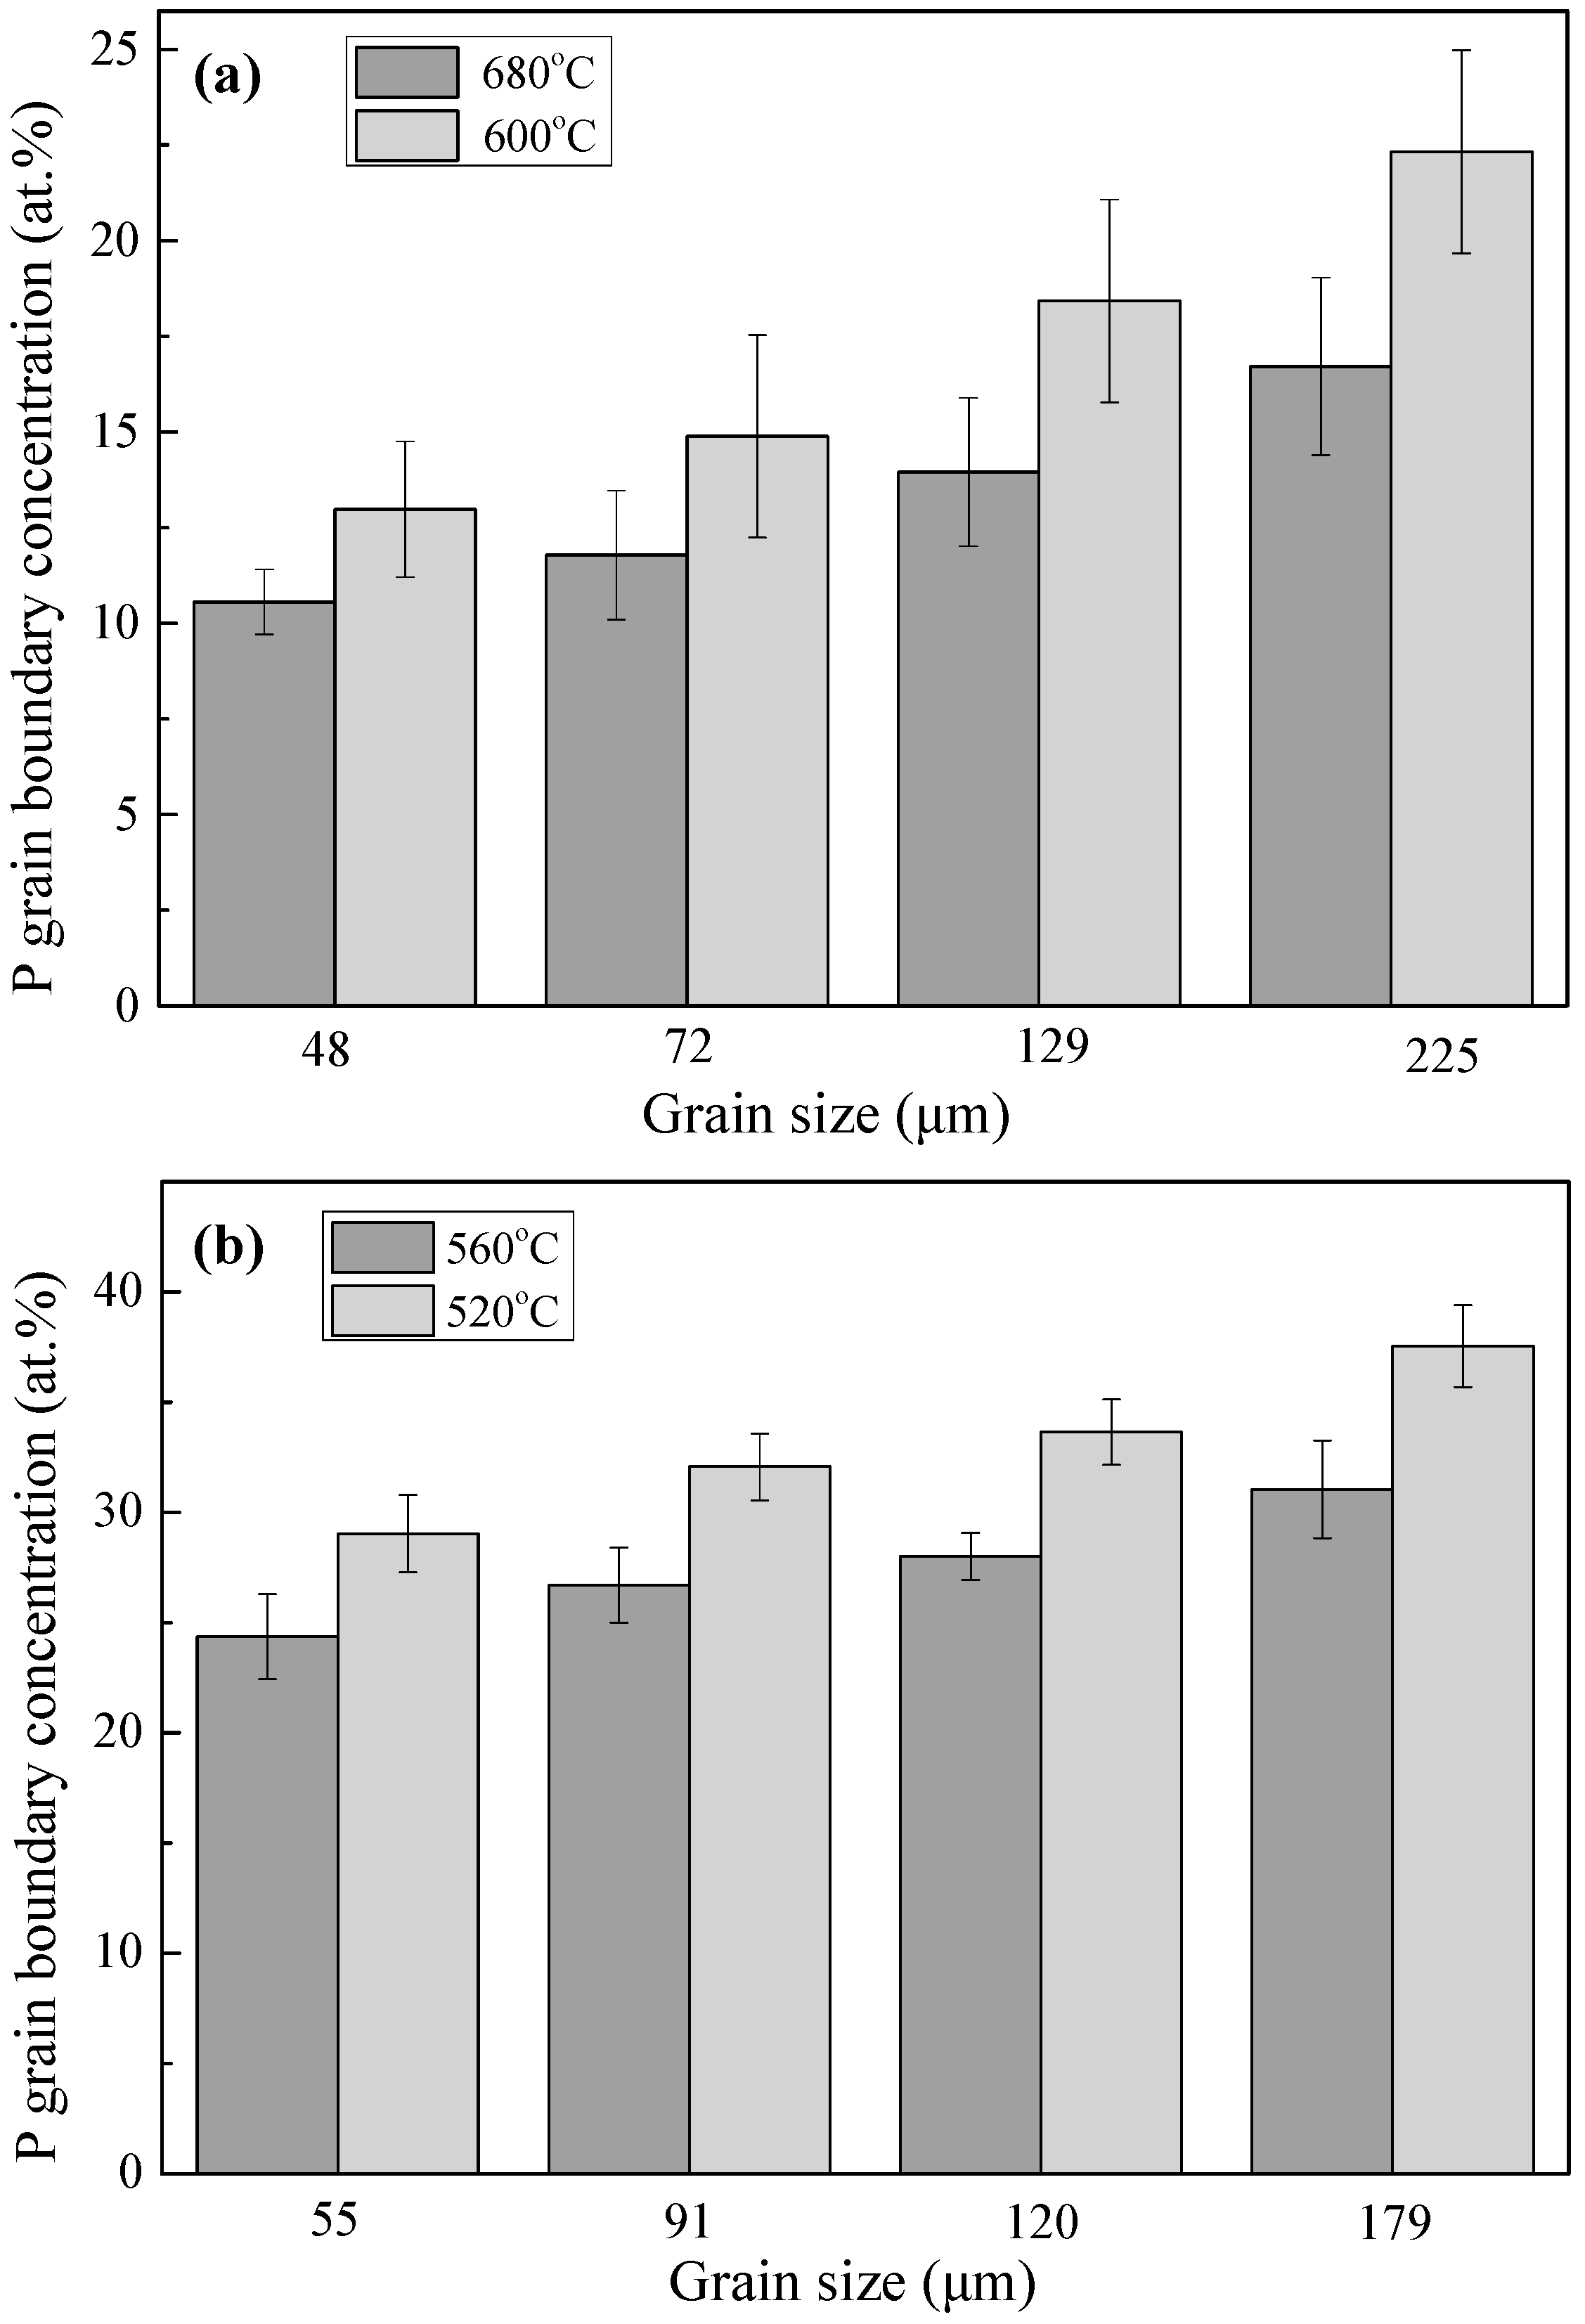
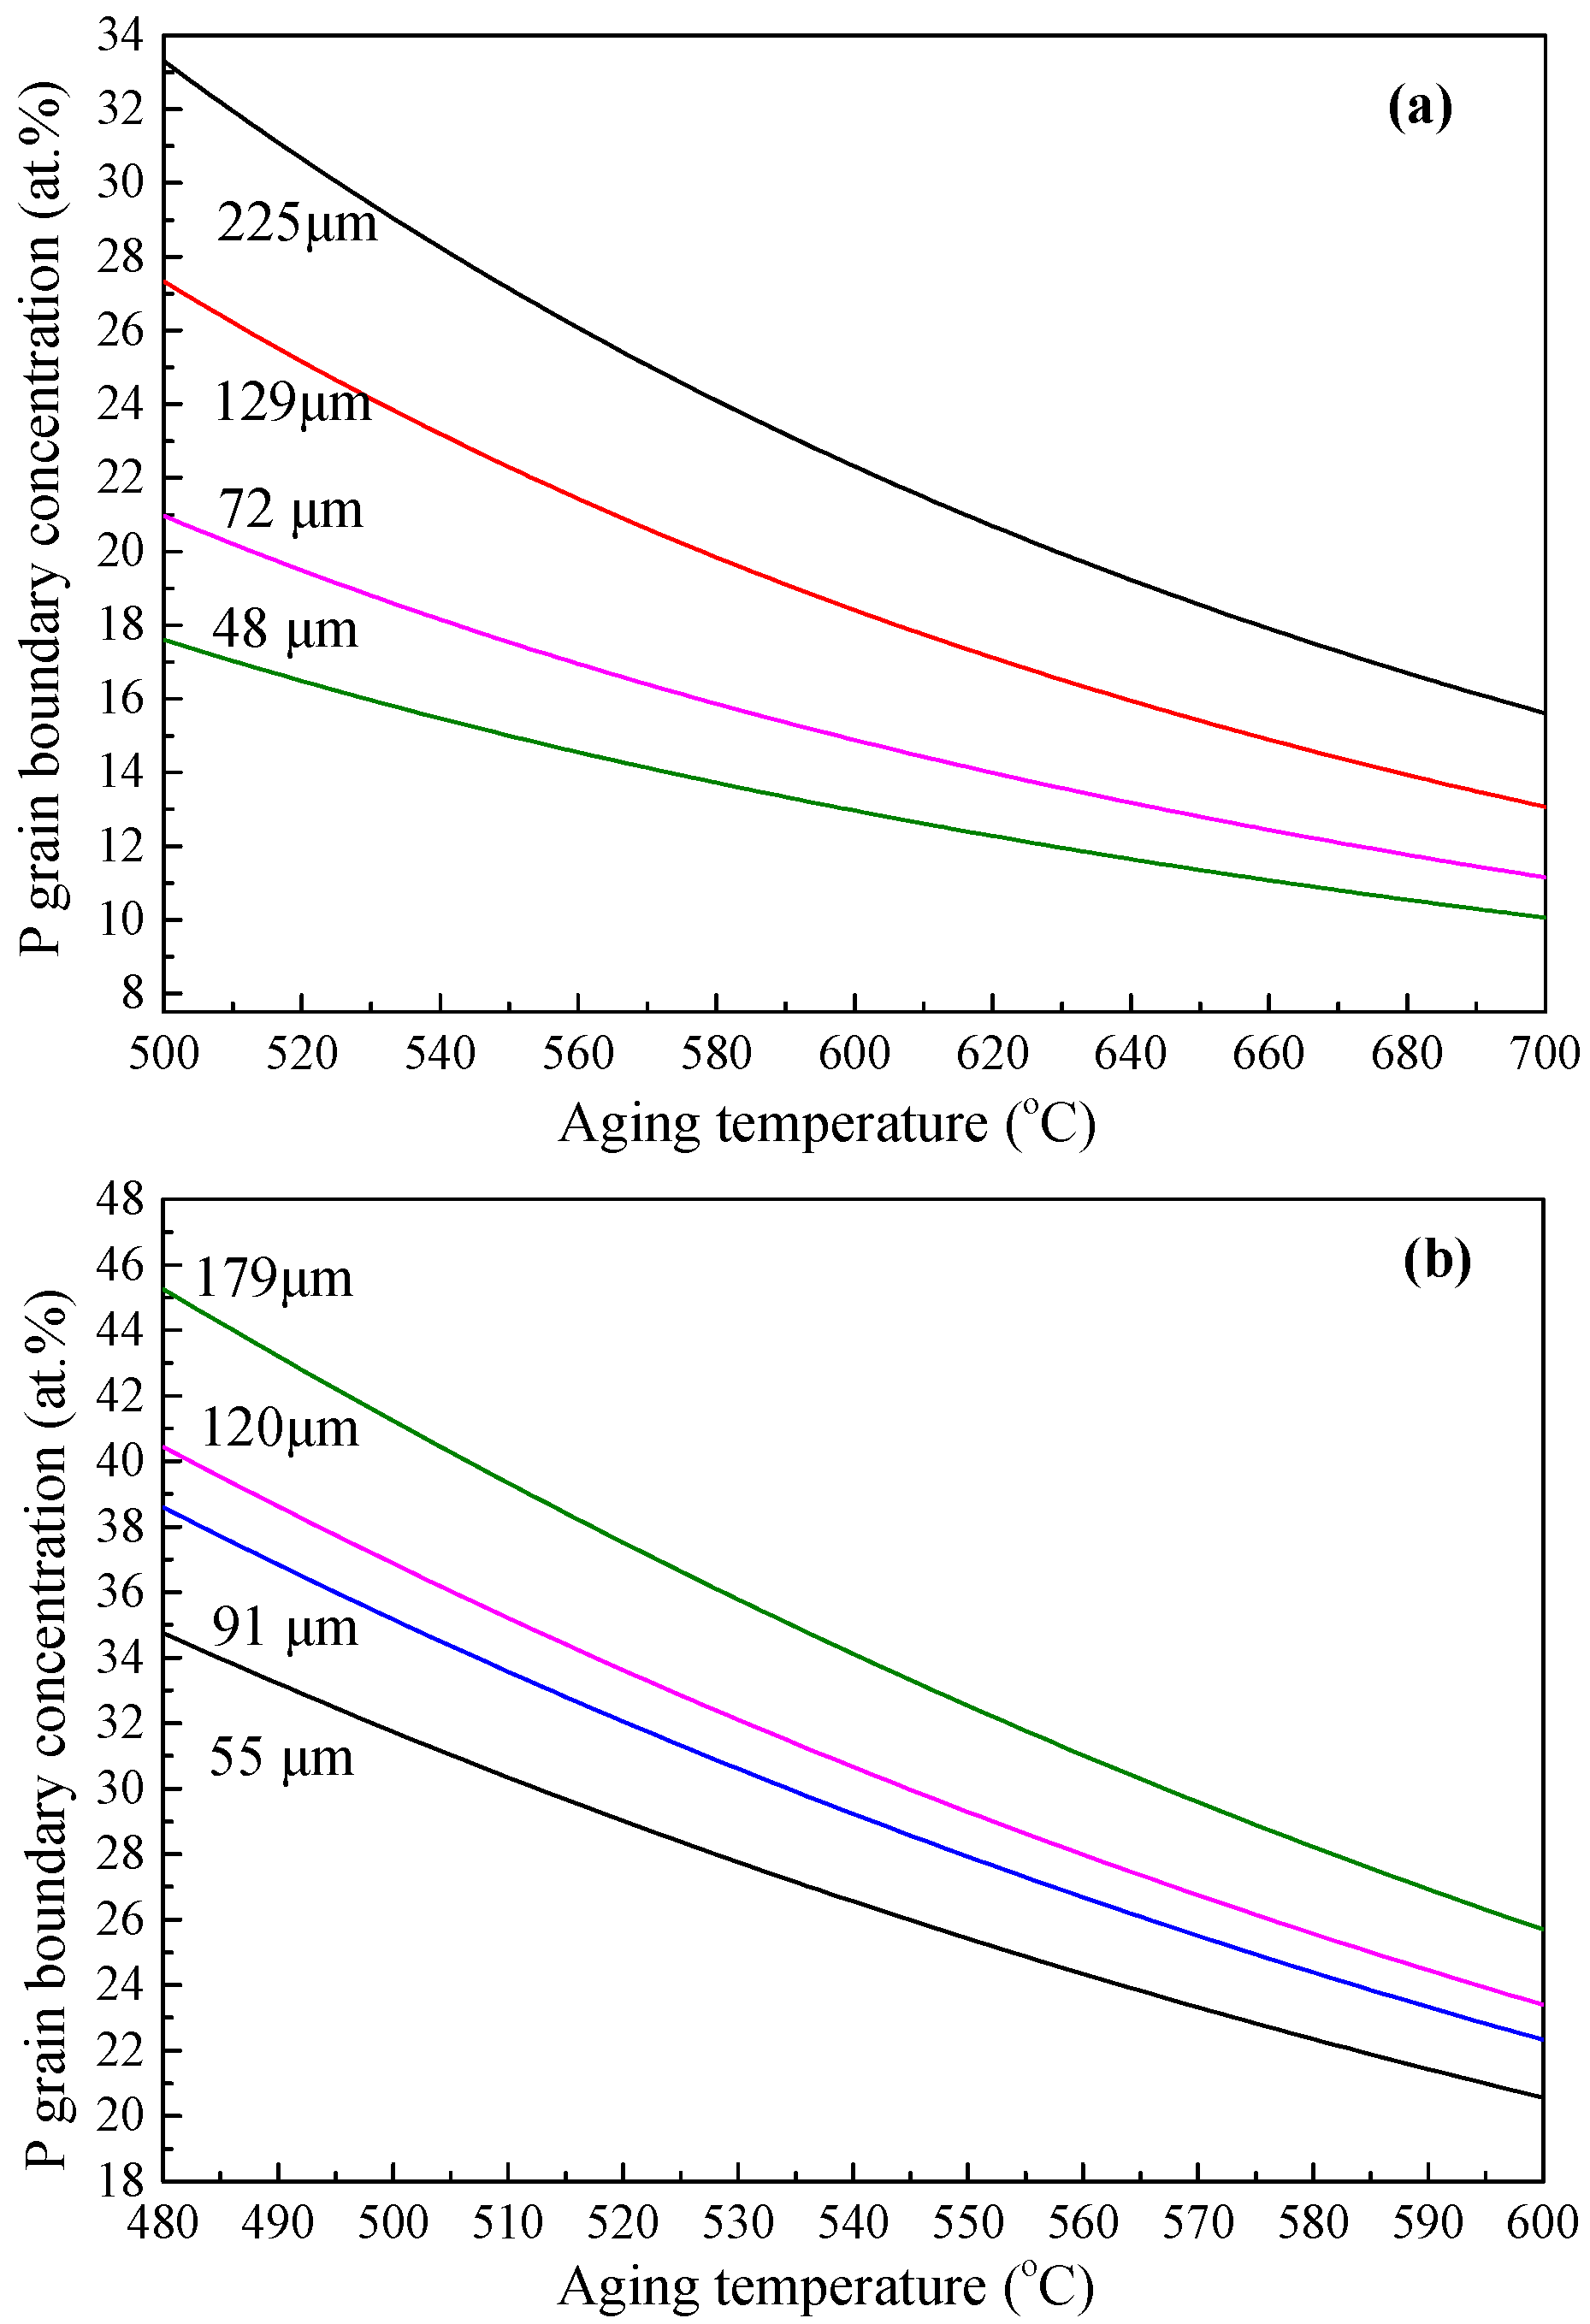
Figure 4 represents the equilibrium grain boundary concentrations of phosphorus in the aged IF and 2.25Cr-1Mo steel samples with different grain sizes. Obviously, the segregation concentration of phosphorus in both steels is lower at a higher aging temperature. It is well known that the lattice mismatch induced by the solid solution in the matrix is much higher than that caused by solute atoms at boundaries. The decrease in the free energy of the system due to segregation is the driving force for grain boundary segregation, i.e., it is the free energy of segregation. On the other hand, the rapid thermal motion of atoms always tries to promote the uniformity of the whole system. Therefore, a higher temperature will lead to a reduction of driving force and an increase of resistance for segregation because the solubility of solute in the bulk and the activity of atoms both increase with increasing temperature. In addition, the segregation concentrations in both steels increase apparently with increasing grain size at the same aging temperature. Although the volume of grain boundaries in an alloy system decreases with increasing grain size, the variation of segregation with grain size could not be attributed to the change in boundary volume. This is because the total grain boundary volume (VGB) in a polycrystalline material with a grain size of several tens of micrometers is much smaller than the matrix volume (VM), i.e., VGB << VM. Hence, the matrix has sufficient solute atoms for segregation [18]. In the present case, the grain size is more than 40 μm and thus the variation of segregation with grain size should not be associated with the change in boundary volume. Consequently, the decrease of segregation with increasing grain size demonstrated in Figure 4 should arise from some other factors, which will be discussed later. In addition, it is also seen in Figure 4 that the effect of grain size on the segregation is more significant at a lower aging temperature. This accords well with Ishida’s analysis [20].
However, the above experimental phenomenon should only be observed in the case that the grain size is not too large. If the grains are ultra-coarse in an alloy system, it would be hard to find grain boundaries and the bulk is dominant in the whole system. Under these circumstances, the exiguous grain boundaries only have limited positions for accepting the foreigner atoms coming from the bulk. Consequently, the grain boundaries are always in the saturated state so that the equilibrium segregation concentration always keeps constant when the aging temperature or grain size fluctuates up and down within a proper range. This means the influence of aging temperature and grain size on the equilibrium segregation concentration turns to be invalid when the grain size is very large.
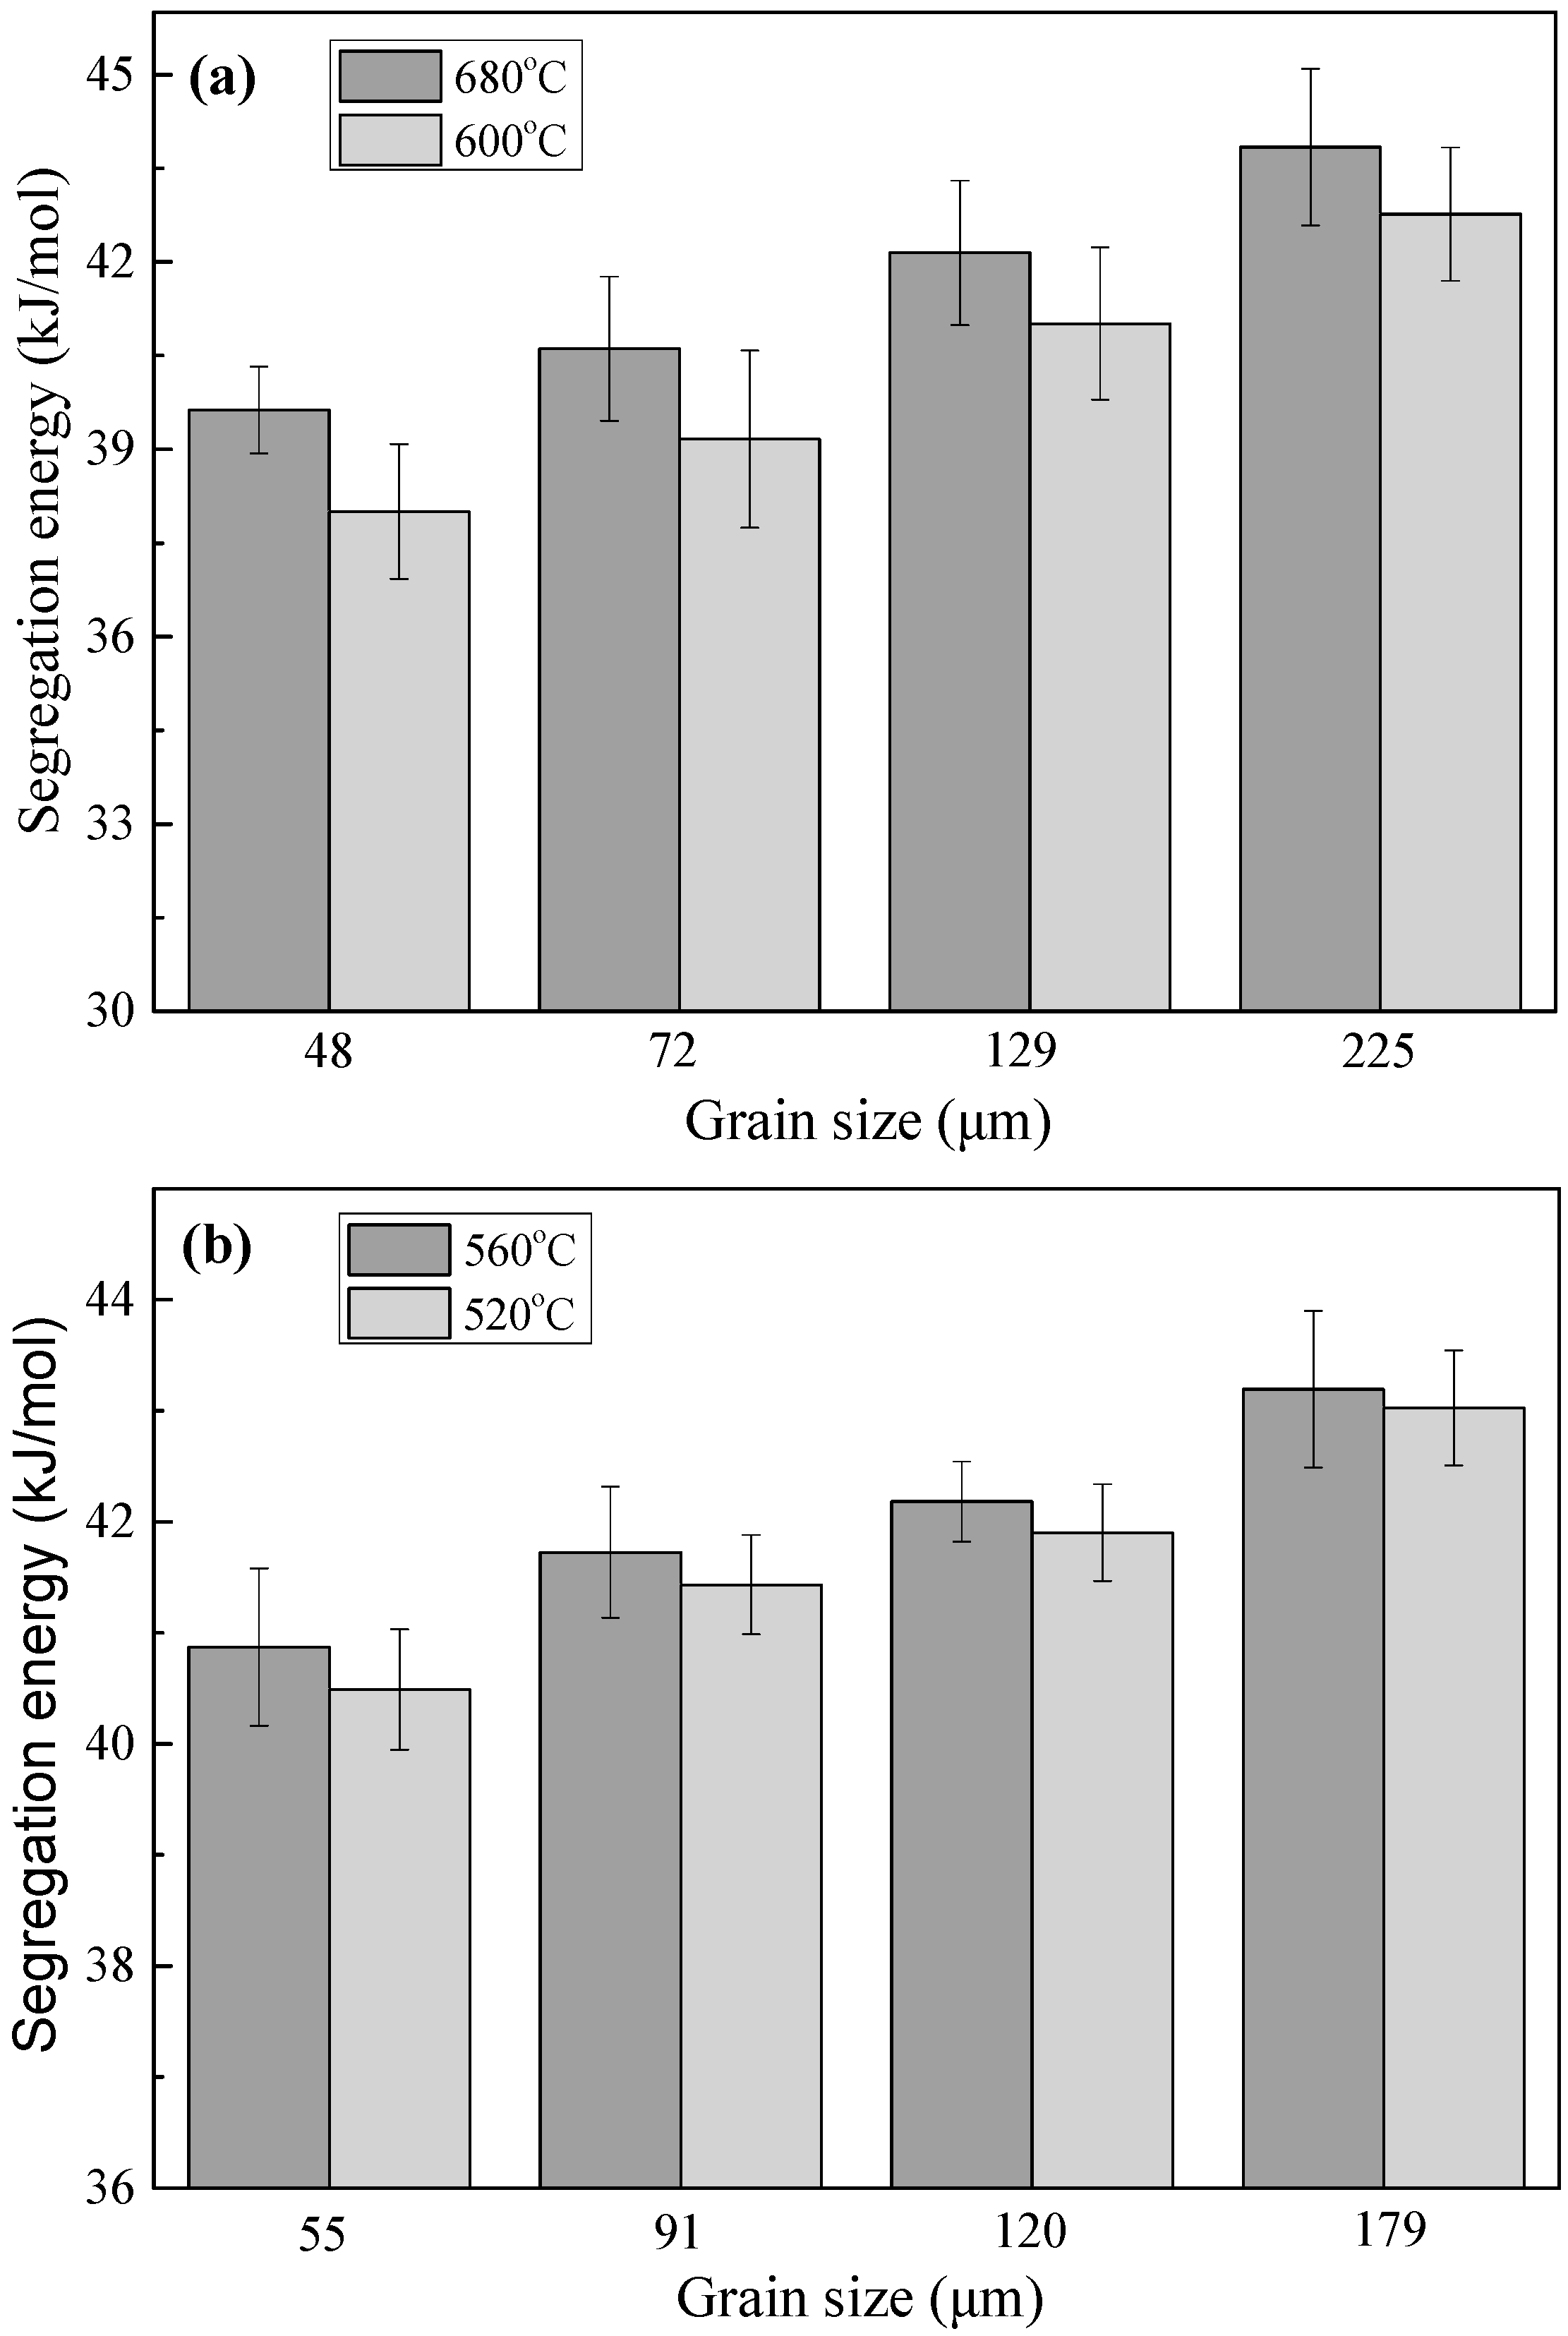
The free energies of segregation of phosphorus calculated by Equation (1) are shown in Figure 5 for both steels. Clearly, the free energy of segregation increases evidently with increasing grain size at the same aging temperature. For the IF steel, when the grain size increases from 48 to 225 μm the free energy of segregation increases from to 42.8 kJ/mol at the aging temperature of 600 °C and from 39.6 to 43.8 kJ/mol at the aging temperature of 680 °C. For the 2.25Cr-1Mo steel, when the grain size augments from 55 to 179 μm, the free energy of segregation rises from 40.5 to 43.0 kJ/mol at the aging temperature of 520 °C and from 40.9 to 43.2 kJ/mol at the aging temperature of 560 °C. It has been reported that the free energy of segregation depends on the boundary characteristics and bulk composition and mainly varies in the range of 33 to 56 kJ/mol for phosphorus in Fe-based alloys [4,21,22]. Apparently, the present results agree well with the literature. Several studies [12,13,23] have reported that the free energy of grain boundary segregation almost remains constant at different aging temperatures.
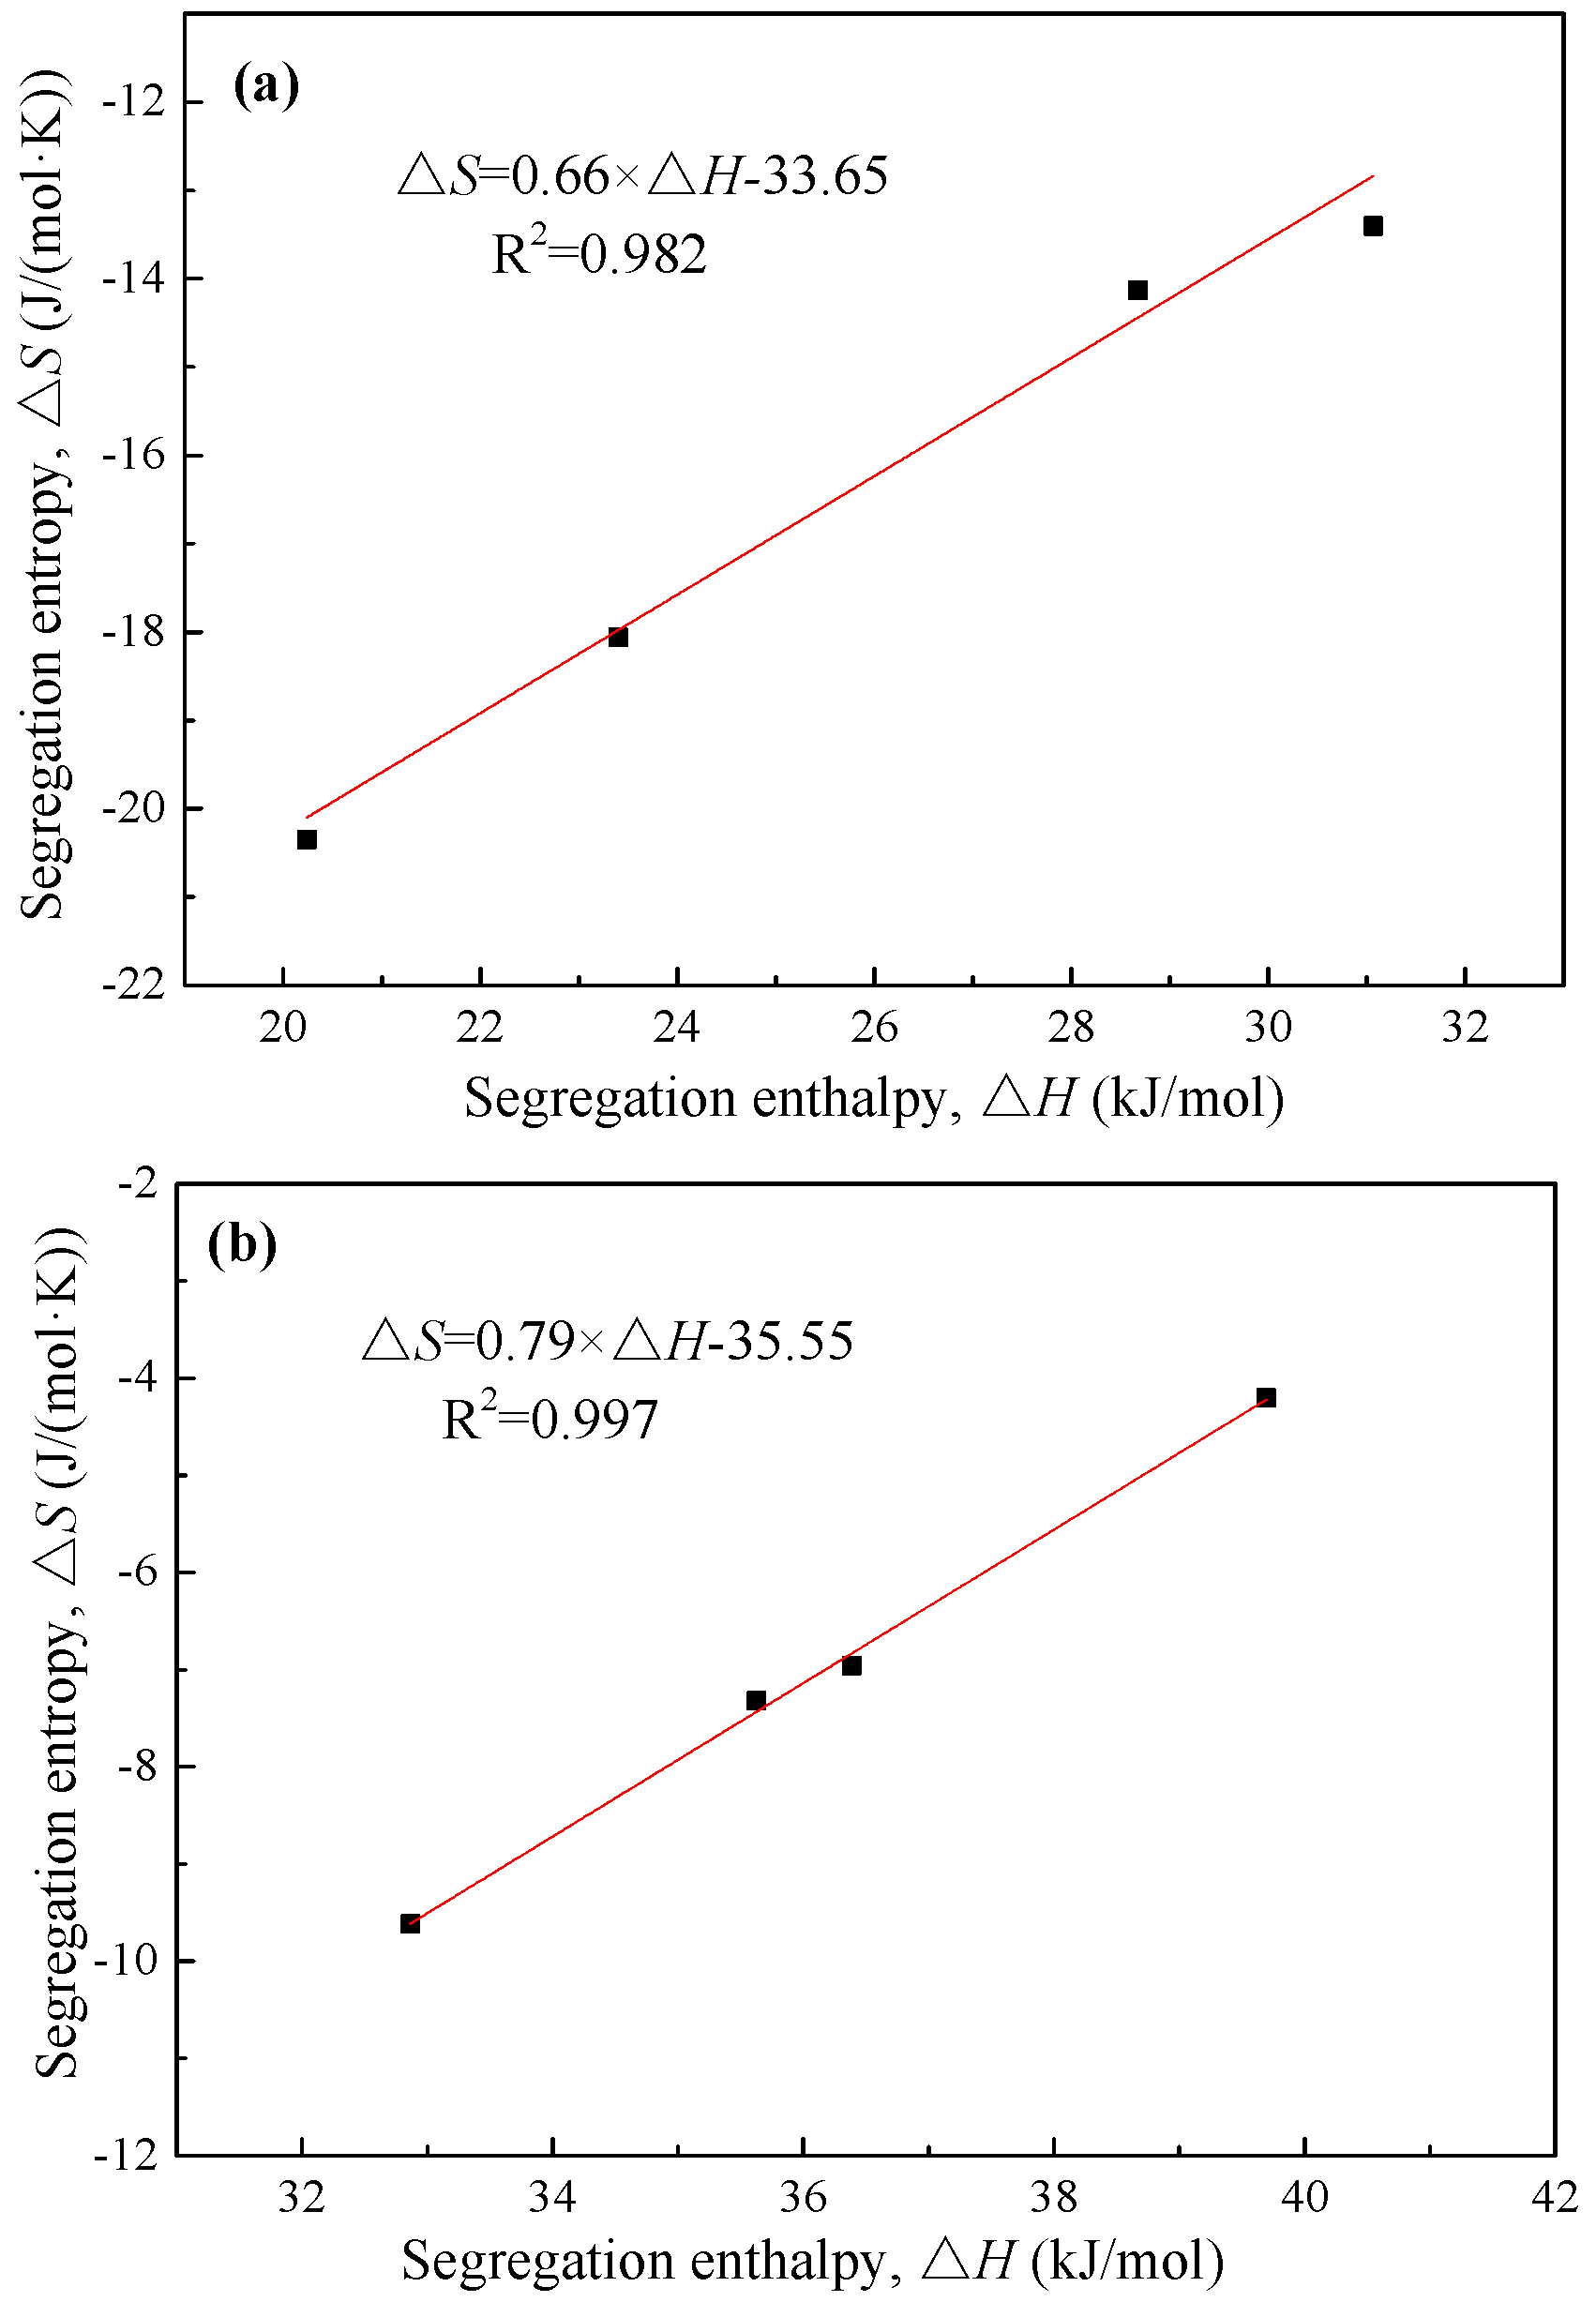
Based on the values of free energies of segregation shown in Figure 5, the segregation entropies and enthalpies can be obtained with the use of Equation (2). The obtained values of segregation entropies and enthalpies are listed in Table 3. It is seen that the entropies are negative and the enthalpies are positive. As described in the Introduction Section, the free energy of segregation in Equation (1) represents the decrease in the free energy of the system induced by grain boundary segregation. This is why the segregation entropies are negative and the segregation enthalpies are positive. The segregation enthalpy increases gradually with increasing grain size for both steels while the segregation entropy becomes less negative. Based on the data in Table 3, the segregation entropy is plotted in Figure 6 as a function of the segregation enthalpy. As can be seen clearly, the two thermodynamic parameters have a linear relationship for both steels. The relationship is expressed as:
∆S = 0.66∆H − 33.65 for the IF steel
∆S = 0.79∆H − 35.55 for the 2.25Cr-1Mo steel
Apparently, the slopes and intercepts of Equations (8) and (9) are close to each other, although the segregation of phosphorus is at different types of grain boundaries (ferrite grain boundaries in IF steel and prior austenite grain boundaries in 2.25Cr-1Mo steel). It is expected that, if all data points for both steels were plotted together, there should be a linear relationship between the segregation entropy and enthalpy. Figure 7 shows the segregation entropy as a function of the segregation enthalpy for both steels. Obviously, these two thermodynamic parameters have a linear relationship with an R-square value of 0.979. The closer to zero is the segregation entropy, the higher the segregation enthalpy is. The unified linear relationship between the segregation entropy and enthalpy can be expressed as:
∆S = 0.85∆H − 38.06 for both IF and 2.25Cr-1Mo steels
Lejček et al. [6,7,8,24] analyzed the grain boundary segregation data from many Fe-based alloy systems. The involved segregating impurity elements mainly include phosphorus, sulfur, tin, silicon, antimony and so on. Their analysis demonstrates that the segregation entropy can be linearly correlated with the segregation enthalpy. The relationship is expressed as
where τ is the compensation temperature at which the free energy of segregation is independent of grain boundary structure, and σ is the segregation entropy when the segregation enthalpy is zero. Obviously, our results are consistent with this relationship. It is worth mentioning that the present linear relations, Equations (8)~(10), are established based on the data for a specific impurity element phosphorus from two specific steel systems with different grain sizes, and therefore they could be more useful in engineering practice. A study by Chen et al. [23] indicates that the free energy of segregation of phosphorus in a Ti-stabilized IF steel has a fixed value at different aging temperatures. The obtained entropy is very small and negligible, and the enthalpy is about 44.8 kJ/mol. According to Equation (10), when the entropy is closer to zero the enthalpy can be estimated as 44.78 kJ/mol. Hence these two values are very close to each other. Besides, a research by Wu et al. [13] demonstrates that the segregation entropy of phosphorus is around zero and the segregation enthalpy is confirmed as a constant value of 38 kJ/mol in a 2.25Cr-1Mo steel. Based on Equation (10), the enthalpy can be obtained as 44.78 kJ/mol. The difference between their results and the present results could be due to the difference in composition and microstructure between these two Cr-Mo steels [16,20]. The carbon content is 0.082 wt. % in their case but it is 0.11 wt. % in our case. This difference would make a contribution to the difference between tempered microstructures of these two 2.25Cr-1Mo steels.
It is well known that the enthalpy (H) is determined by the internal energy (U), pressure (P) and volume (V) of the system, which is expressed as
H = U + PV
Since P and V are almost fixed in the present case, H is mainly determined by U. Therefore, the segregation enthalpy is mainly determined by the decrease in the internal energy of the system. This decrease of internal energy should mainly be contributed from the decrease in elastic strain energy when solute atoms segregate at the grain boundary. Since the grain boundary region is irregular and porous, the elastic strain energy caused by a solute atom when staying in the grain boundary region will be lower than that when staying in the grain interior [21]. Hence, a decrease in internal energy can be brought about by grain boundary segregation of solute atoms, leading to a decrease in enthalpy. The value of segregation enthalpy is related to the grain boundary energy or structure. The regions of high-energy random high-angle grain boundaries are relatively more irregular and porous, and thus the elastic strain energy induced by a solute atom when staying in these regions should be relatively lower. This means that the decrease in the enthalpy of the system caused by solute grain boundary segregation, i.e., the segregation enthalpy, will be relatively larger. However, the regions of low-energy low-angle or special (coincidence site lattice) grain boundaries are relatively less irregular and porous, and hence the elastic strain energy caused by a solute atom when staying in these regions should be relatively higher but it is still lower than that caused in the grain interior. Consequently, the decrease in the enthalpy of the system induced by solute grain boundary segregation or the segregation enthalpy will be relatively smaller.
Similarly, the value of segregation entropy is also related to the grain boundary energy or structure. For the high-energy random high-angle grain boundaries whose structureis relatively more irregular and porous [25], the increase in the entropy of the system caused by solute atoms when staying in these boundary regions will be relatively smaller, i.e., the segregation entropy is less negative. Nevertheless, for the low-energy low-angle or special grain boundaries whose structure is relatively less irregular and porous, the increase in the entropy of the system caused by solute atoms when staying in these boundary regions will be relatively larger, i.e., the segregation entropy is more negative. From the experimental data listed in Table 3, it is anticipated that the grain boundaries with a larger grain size should possess less numbers of low-energy boundaries, making the segregation enthalpy higher and the segregation entropy less negative.
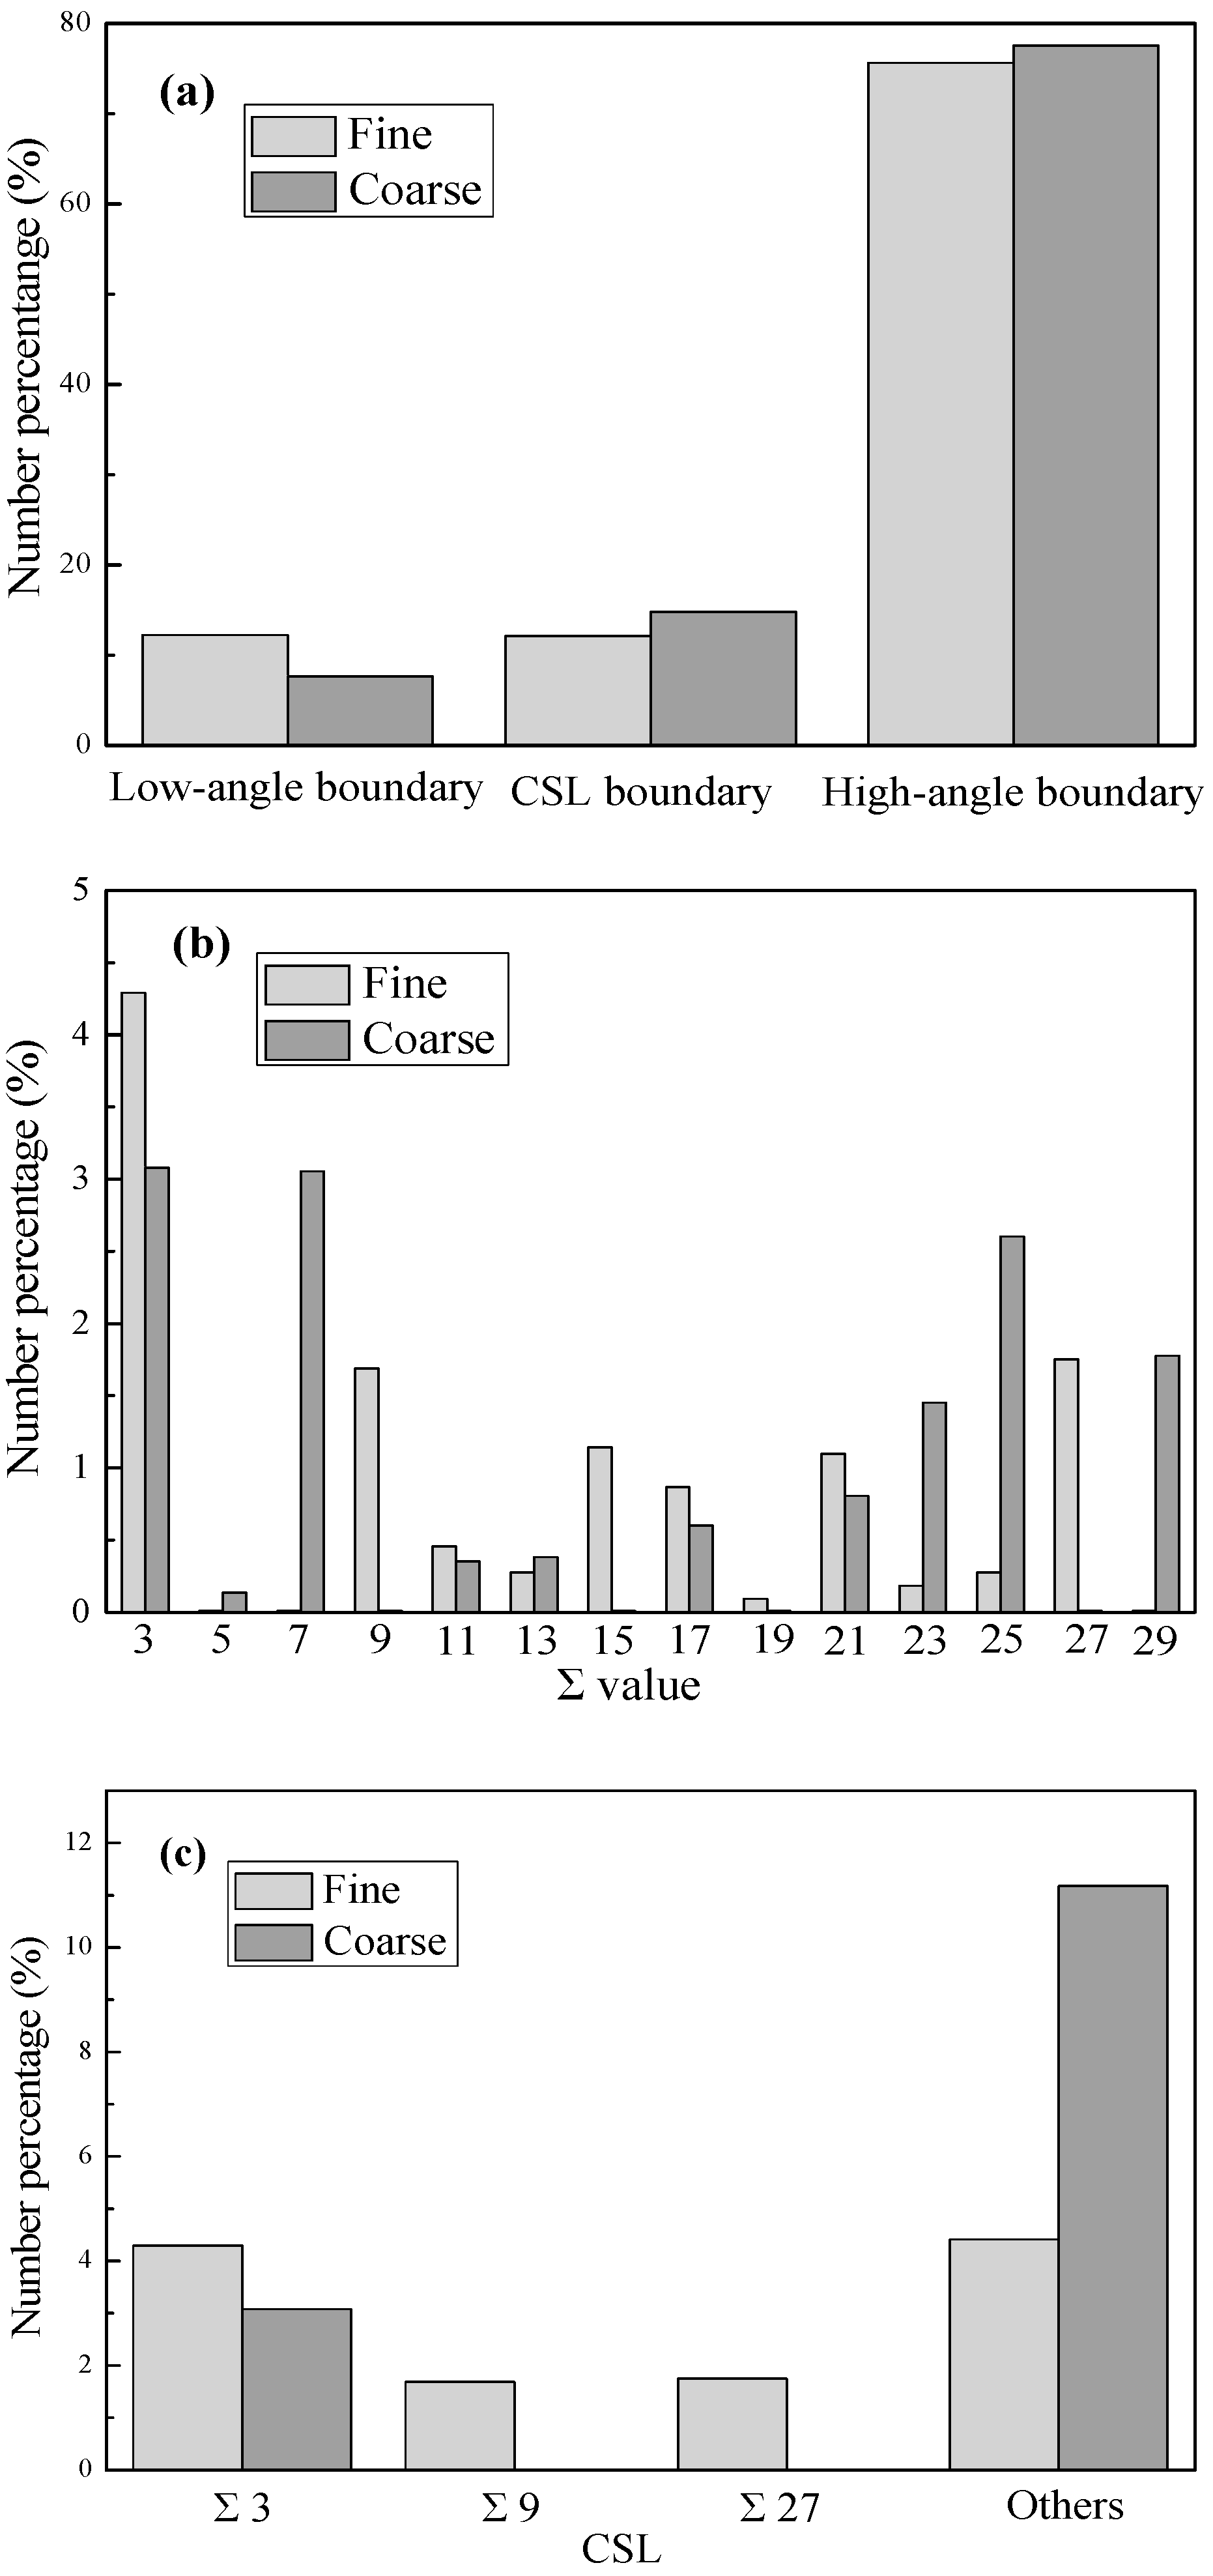
Figure 8 shows the grain boundary character distribution (GBCD) and coincidence site lattice (CSL) boundary distribution for the IF steel with the grain sizes of 48 and 225 μm, respectively. As can be seen in Figure 8a, the specimen with fine grains has more low-angle grain boundaries, fewer CSL (Σ ≤ 29) grain boundaries, and somewhat more high-angle random grain boundaries than the one with coarse grains. Further investigation, as shown in Figure 8b, reveals that the CSL grain boundary distribution exhibits a changing trend from low Σ values to high Σ values when the grain size is increased. Figure 8c shows the statistics in the fractions of Σ3n boundaries and others in the CSL grain boundary distribution. Compared with the coarse-grained specimen, the fine-grained one has more Σ3n (Σ3, Σ9, and Σ27) boundaries and fewer other CSL boundaries. It has been reported in some previous studies [26,27,28] that the low-angle and low Σ CSL grain boundaries have more orderly arrangement of atoms than the high-angle random grain boundary, and thus they have lower grain boundary energy and larger resistant force for the grain boundary segregation of foreign atoms. In addition, the Σ3n grain boundaries are special in all CSL boundaries. Considering that the Σ3 boundary is the lowest CSL boundary, it is the most orderly one among all the CSL boundaries. Moreover, other Σ3n (n > 1) boundaries can be created by the interaction of Σ3 boundaries. For instance, one Σ9 boundary can be produced by the combination of two Σ3 boundaries [24,28,29,30]. In other words, the fraction of Σ3 boundaries plays an important role in promoting the grain boundary cohesion and mitigating the grain boundary segregation of impurity atoms. Consequently, the decrease of low-energy low-angle and Σ3n CSL boundaries with increasing grain size could be mainly responsible for the present experimental phenomena, i.e., the segregation enthalpy increases with increasing grain size and meanwhile the segregation entropy becomes less negative.
Based on the obtained thermodynamic parameters along with Equation (1), the equilibrium segregation concentrations of phosphorus in the present IF and 2.25Cr-1Mo steels with different grain sizes have been predicted at various aging temperatures. The results are represented in Figure 9. Obviously, for each grain size, there is an individual segregation curve. At a fixed grain size, the segregation level decreases with increasing aging temperature, and at a fixed aging temperature it increases with increasing grain size. Evidently, the grain size has an apparent effect on the grain boundary segregation. Hence, not only the aging temperature but also the grain size should be considered when modeling equilibrium grain boundary segregation in a system. Besides, since the grain boundary segregation of phosphorus has a significant effect on the ductile-to-brittle transition temperature (DBTT) of some low-alloy steels [10,12,22], the grain size could influence the DBTT of the steels through the following mechanisms. The grain size affects the steel toughness by itself and by its effect on the grain boundary segregation of impurity atoms.
4. Conclusions
The grain boundary segregation of phosphorus in IF and 2.25Cr-1Mo steels with different grain sizes is analyzed through AES measurements. The equilibrium boundary concentration of phosphorus increases with increasing grain size. Based on the segregation data, the segregation thermodynamic parameters are obtained and demonstrate that the segregation enthalpy has a positive correlation with the grain size, i.e., its value increases with increasing grain size. However, the segregation entropy becomes less negative even close to zero with increasing grain size. In addition, the segregation entropy (∆S) of phosphorus exhibits a unified linear relationship with its segregation enthalpy (∆H): ∆S = 0.85∆H − 38.06, for both IF and 2.25Cr-1Mo steels, although it is segregated to different types of grain boundaries (ferrite grain boundaries in IF steel and prior austenite grain boundaries in 2.25Cr-1Mo steel). Owing to the above fact, the grain size should be considered when studying the grain boundary segregation thermodynamics.
Acknowledgments
This work was supported by the Science and Technology Foundation of Shenzhen (Grant No. JCYJ20170307150808594) and the National Natural Science Foundation of China (Grant No. 51071060).
Author Contributions
Y.Z. carried out most of the experiments and wrote the paper; S.S. contributed to the design of experiments and the analysis of results; and H.S. and K.W. contributed to the AES measurements.
Conflicts of Interest
The authors declare no conflict of interest.
References
- Seah, M.P. Grain boundary segregation and the T-t dependence of temper brittleness. Acta Metall. 1977, 25, 345–357. [Google Scholar] [CrossRef]
- Guttmann, M. Equilibrium segregation in a ternary solution: A model for temper embrittlement. Surf. Sci. 1975, 53, 213–227. [Google Scholar] [CrossRef]
- Mclean, D. Grain Boundaries in Metals. Maradudin Phys. Today 1957, 11, 105–128. [Google Scholar] [CrossRef]
- Lejček, P.; Šandera, P.; Horníková, J.; Řehák, P.; Pokluda, J. Grain boundary segregation of elements of groups 14 and 15 and its consequences for intergranular cohesion of ferritic iron. J. Mater. Sci. 2017, 52, 5822–5834. [Google Scholar] [CrossRef]
- Lejček, P. Effect of solute interaction on interfacial segregation and grain boundary embrittlement in binary alloys. J. Mater. Sci. 2013, 48, 2574–2580. [Google Scholar] [CrossRef]
- Lejček, P.; Hofmann, P.S. Prediction of enthalpy and entropy of grain boundary segregation. Surf. Interface Anal. 2002, 33, 203–210. [Google Scholar] [CrossRef]
- Lejček, P.; Hofmann, P.S. On the relationship between entropy and enthalpy of grain boundary segregation. Interface Sci. 2001, 9, 221–230. [Google Scholar] [CrossRef]
- Lejček, P. Role of entropy in anistropy of grain boundary segregation. Surf. Interface Anal. 1999, 26, 800–805. [Google Scholar] [CrossRef]
- Zhang, C.; Vyver, S.V.D.; Hu, X.; Lu, P. Fatigue crack growth behavior in weld-repaired high-strength low-alloy steel. Eng. Fract. Mech. 2011, 78, 1862–1875. [Google Scholar] [CrossRef]
- Song, S.H.; Zhao, Y.; Si, H. Non-equilibrium phosphorus grain boundary segregation and its effect on embrittlement in a niobium-stabilized interstitial-free steel. Mater. Lett. 2015, 140, 20–22. [Google Scholar] [CrossRef]
- Song, S.H.; Wu, J.; Weng, L.Q.; Xi, T.H. Phosphorus grain boundary segregation under an intermediate applied tensile stress in a Cr–Mo low alloy steel. Mater. Sci. Eng. A 2009, 520, 97–100. [Google Scholar] [CrossRef]
- Song, S.H.; Zhuang, H.; Wu, J.; Weng, L.Q.; Yuan, Z.X.; Xi, T.H. Dependence of ductile-to-brittle transition temperature on phosphorus grain boundary segregation for a 2.25Cr1Mo steel. Mater. Sci. Eng. A 2008, 486, 433–438. [Google Scholar] [CrossRef]
- Wu, J.; Song, S.H.; Weng, L.Q.; Xi, T.H.; Yuan, Z.X. An Auger electron spectroscopy study of phosphorus and molybdenum grain boundary segregation in a 2.25Cr1Mo steel. Mater. Charact. 2008, 59, 261–265. [Google Scholar] [CrossRef]
- Davis, L.E.; McDonald, M.C.; Palmberg, P.W.; Riach, G.E.; Weber, R.E. Handbook of Auger Electron Spectroscopy, 2nd ed.; Physical Electronics Division, Perkin-Elmer Corporation: Eden Prairie, MN, USA, 1976. [Google Scholar]
- Tuominen, S.M.; Clough, S.P. Grain boundary segregation of sulfur and nitrogen in sintered molybdenum. Metall. Mater. Trans. A 1979, 10, 127–129. [Google Scholar] [CrossRef]
- Janovec, J.; Grman, D.; Perháčová, J.; Lejček, P.; Patscheider, J.; Ševc, P. Thermodynamics of phosphorus grain boundary segregation in polycrystalline low-alloy steels. Surf. Interface Anal. 2000, 30, 354–358. [Google Scholar] [CrossRef]
- Song, S.H.; Wu, J.; Wang, D.Y.; Weng, L.Q.; Zheng, L. Stress-induced non-equilibrium grain boundary segregation of phosphorus in a Cr-Mo low alloy steel. Mater. Sci. Eng. A 2006, 430, 320–325. [Google Scholar] [CrossRef]
- Ševc, P.; Janovec, J.; Koutník, M.; Výrostková, A. Equilibrium grain boundary segregation of phosphorus in 2.6Cr-0.7Mo-0.3V steels. Acta Metall. Mater. 1995, 43, 251–258. [Google Scholar] [CrossRef]
- Brandon, D. The structure of high-angle grain boundaries. Acta Metall. 1966, 14, 1479–1484. [Google Scholar] [CrossRef]
- Ishida, K. Effect of grain size on grain boundary segregation. J. Alloys Compd. 1996, 235, 244–249. [Google Scholar] [CrossRef]
- Lejček, P. Grain Boundary Segregation in Metals; Springer: Berlin, Germany, 2010. [Google Scholar]
- Ševc, P.; Janovec, J. On kinetics of phosphorus segregation in Cr-Mo-V low alloy steel. Scr. Metall. Mater. 1994, 31, 1673–1678. [Google Scholar] [CrossRef]
- Chen, X.M.; Song, S.H.; Weng, L.Q.; Liu, S.J.; Wang, K. Relation of ductile-to-brittle transition temperature to phosphorus grain boundary segregation for a Ti-stabilized interstitial free steel. Mater. Sci. Eng. A 2011, 528, 8299–8304. [Google Scholar] [CrossRef]
- Ševc, P.; Janovec, J.; Lejček, P.; Záhumenský, P.; Blach, J. Thermodynamics of phosphorus grain boundary segregation in 17Cr12Ni austenitic steel. Scr. Mater. 2002, 46, 7–12. [Google Scholar] [CrossRef]
- Dincer, I.; Cengel, Y.A. Energy, Entropy and Exergy Concepts and Their Roles in Thermal Engineering. Entropy 2001, 3, 116–149. [Google Scholar] [CrossRef]
- Feng, W.; Yang, S.; Yan, Y. Dependence of grain boundary character distribution on the initial grain size of 304 austenitic stainless steel. Philos. Mag. 2017, 97, 1057–1070. [Google Scholar] [CrossRef]
- Shi, P.; Hu, R.; Zhang, T. Grain boundary character distribution and its effect on corrosion of Ni-23Cr-16Mo superalloy. Mater. Sci. Technol. 2017, 33, 84–91. [Google Scholar] [CrossRef]
- Song, S.H.; Zhao, Y.; Cui, Y.H.; Sun, J.Y.; Si, H.; Li, J.Q. Effect of grain boundary character distribution and grain boundary phosphorus segregation on the brittleness of an interstitial-free steel. Mater. Lett. 2016, 182, 328–331. [Google Scholar] [CrossRef]
- Rohrer, G.S.; Randle, V.; Kim, C.S.; Yan, H. Changes in the five-parameter grain boundary character distribution in α-brass brought about by iterative thermomechanical processing. Acta Mater. 2006, 54, 4489–4502. [Google Scholar] [CrossRef]
- Lim, L.C.; Raj, R. On the distribution of Σ for grain boundaries in polycrystalline nickel prepared by strainannealing technique. Acta Metall. 1984, 32, 1177–1181. [Google Scholar] [CrossRef]
Figure 1.
Grain sizes of the samples for both IF and 2.25Cr-1Mo steels (IF steel: (a) 48 µm; (b) 72 µm; (c) 129 µm; and (d) 225 µm; and 2.25Cr-1Mo steel: (e) 55 µm; (f) 91 µm; (g) 120 µm; and (h) 179 µm).
Figure 1.
Grain sizes of the samples for both IF and 2.25Cr-1Mo steels (IF steel: (a) 48 µm; (b) 72 µm; (c) 129 µm; and (d) 225 µm; and 2.25Cr-1Mo steel: (e) 55 µm; (f) 91 µm; (g) 120 µm; and (h) 179 µm).
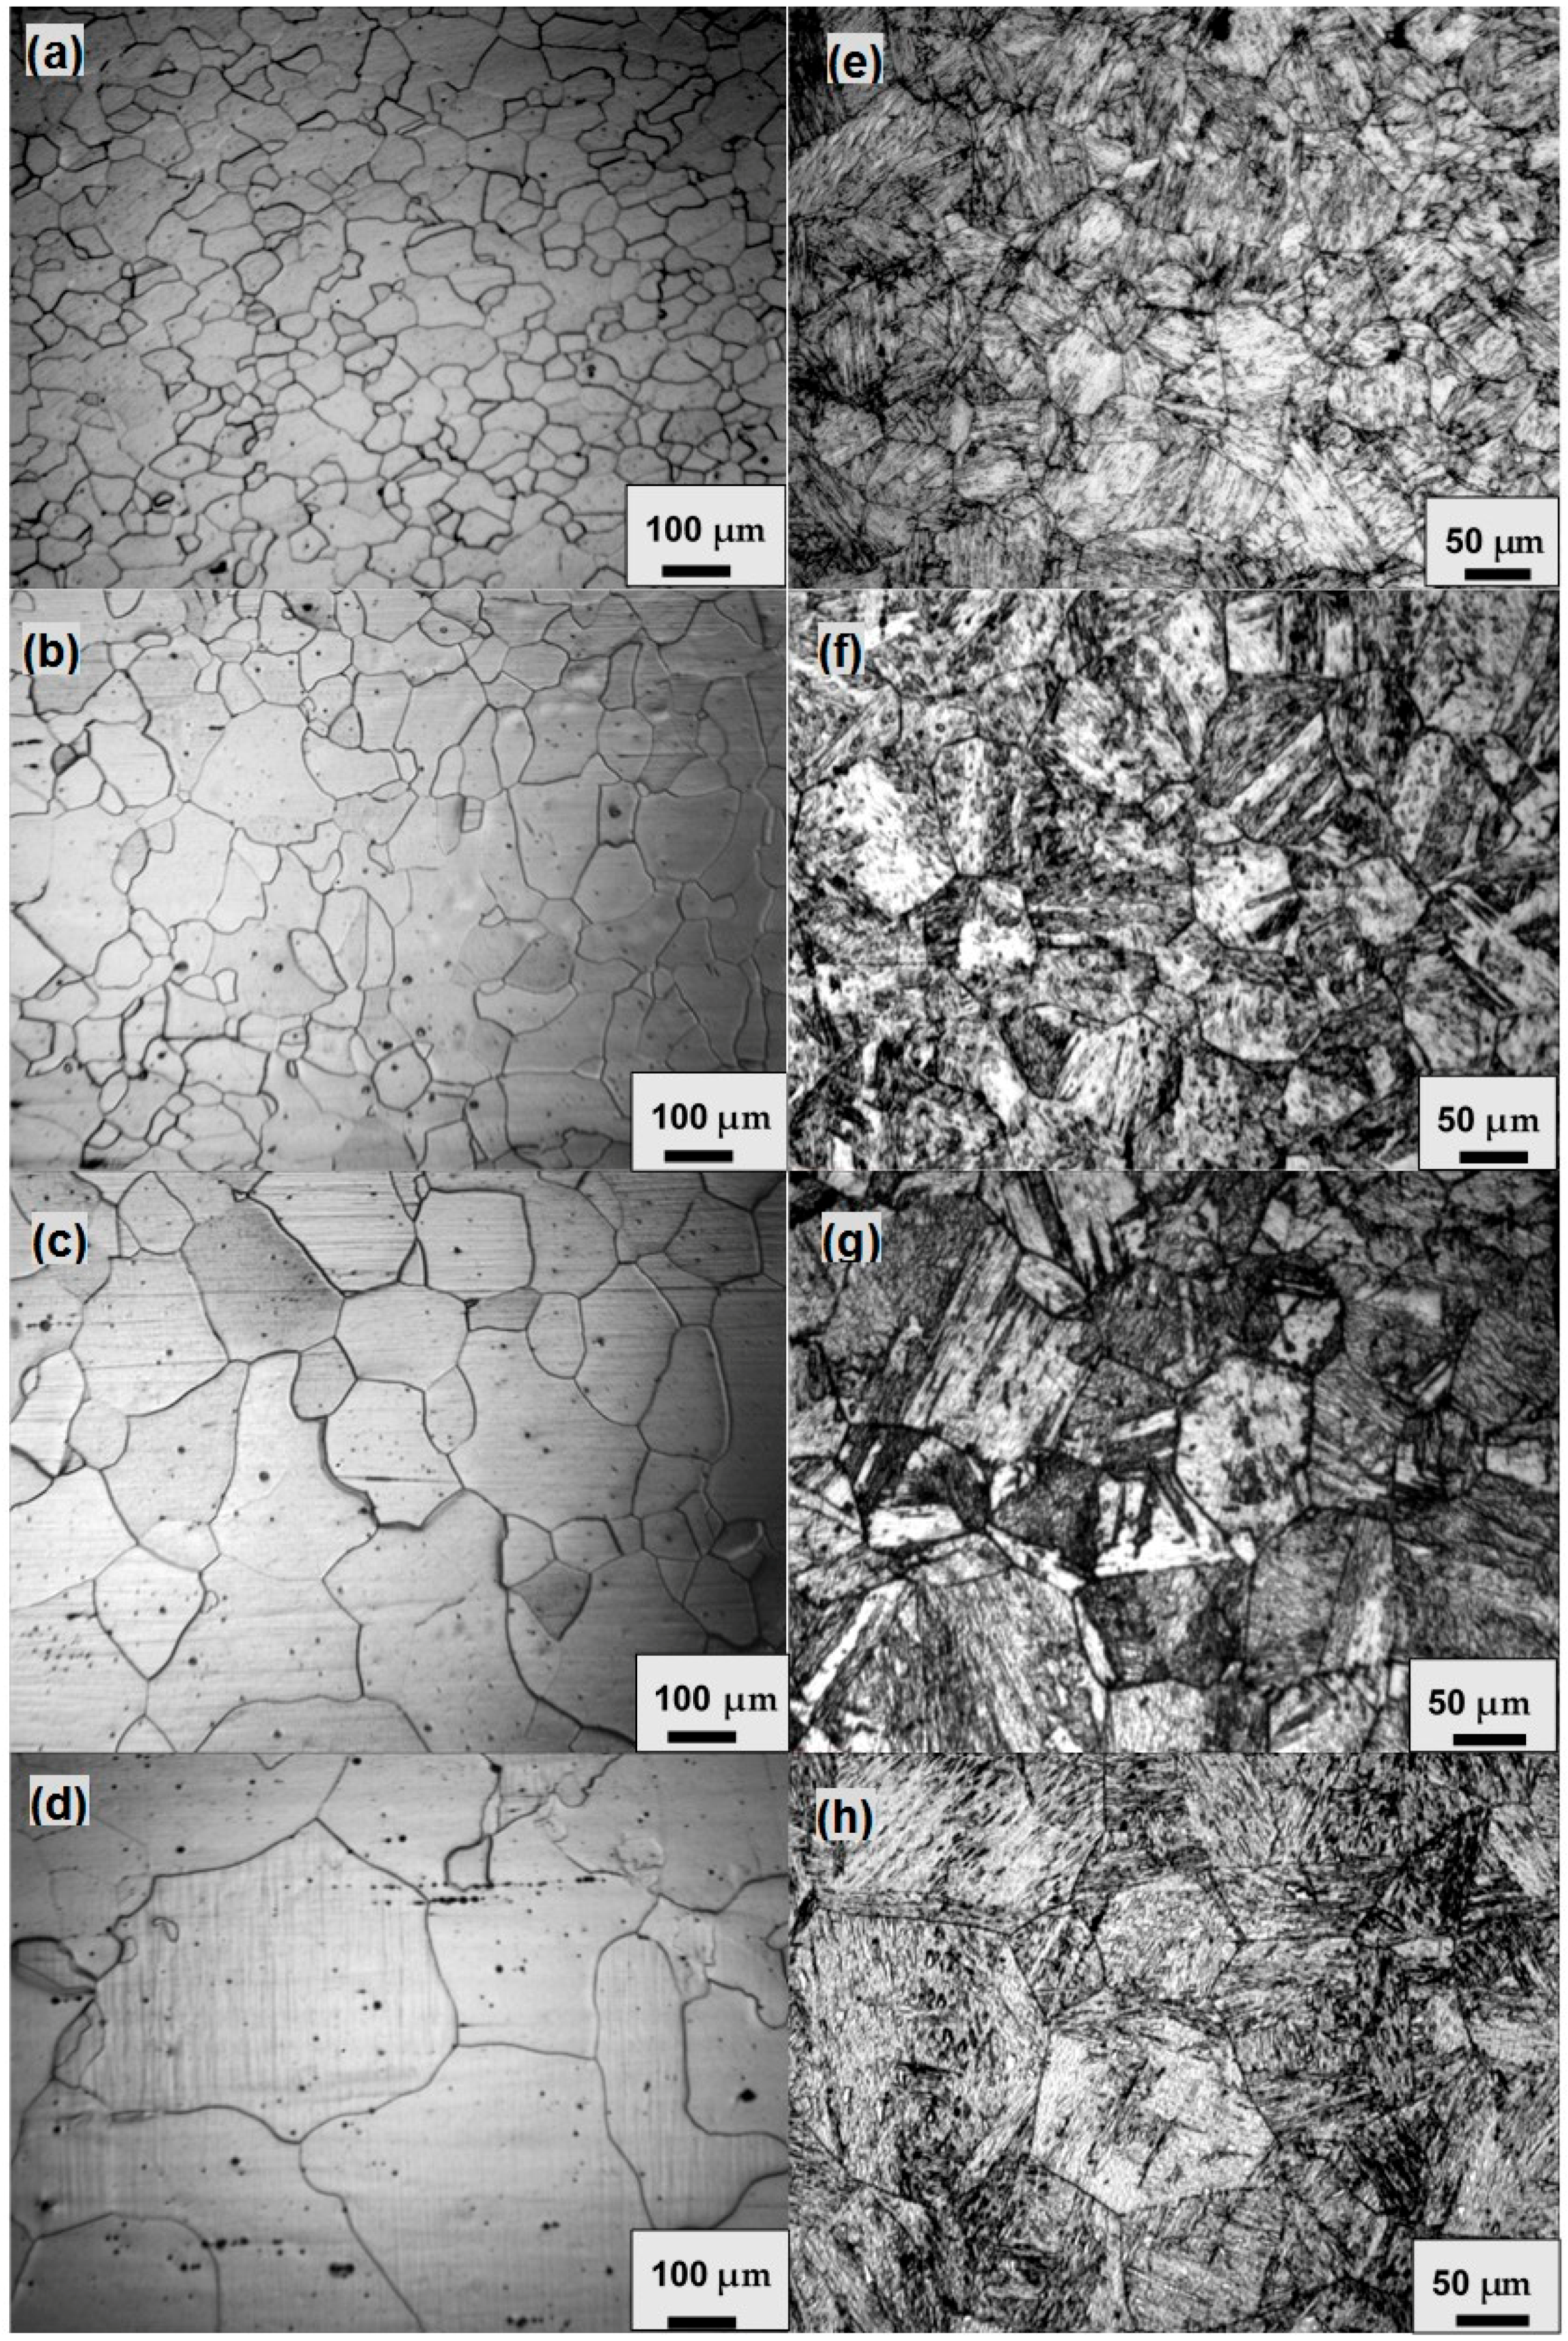
Figure 2.
Scanning electron fractographs of the AES (Auger electron spectroscopy) specimens with the largest and smallest grain sizes for both IF and 2.25Cr-1Mo steel (IF steel: (a) aged at 600 °C/largest grain size; (b) aged at 600 °C/smallest grain size; (c) aged at 680 °C/largest grain size; and (d) aged at 680 °C/smallest grain size; and 2.25Cr-1Mo steel: (e) aged at 520 °C/largest grain size; (f) aged at 520 °C/smallest grain size; (g) aged at 560 °C/largest grain size; and (h) aged at 560 °C/smallest grain size).
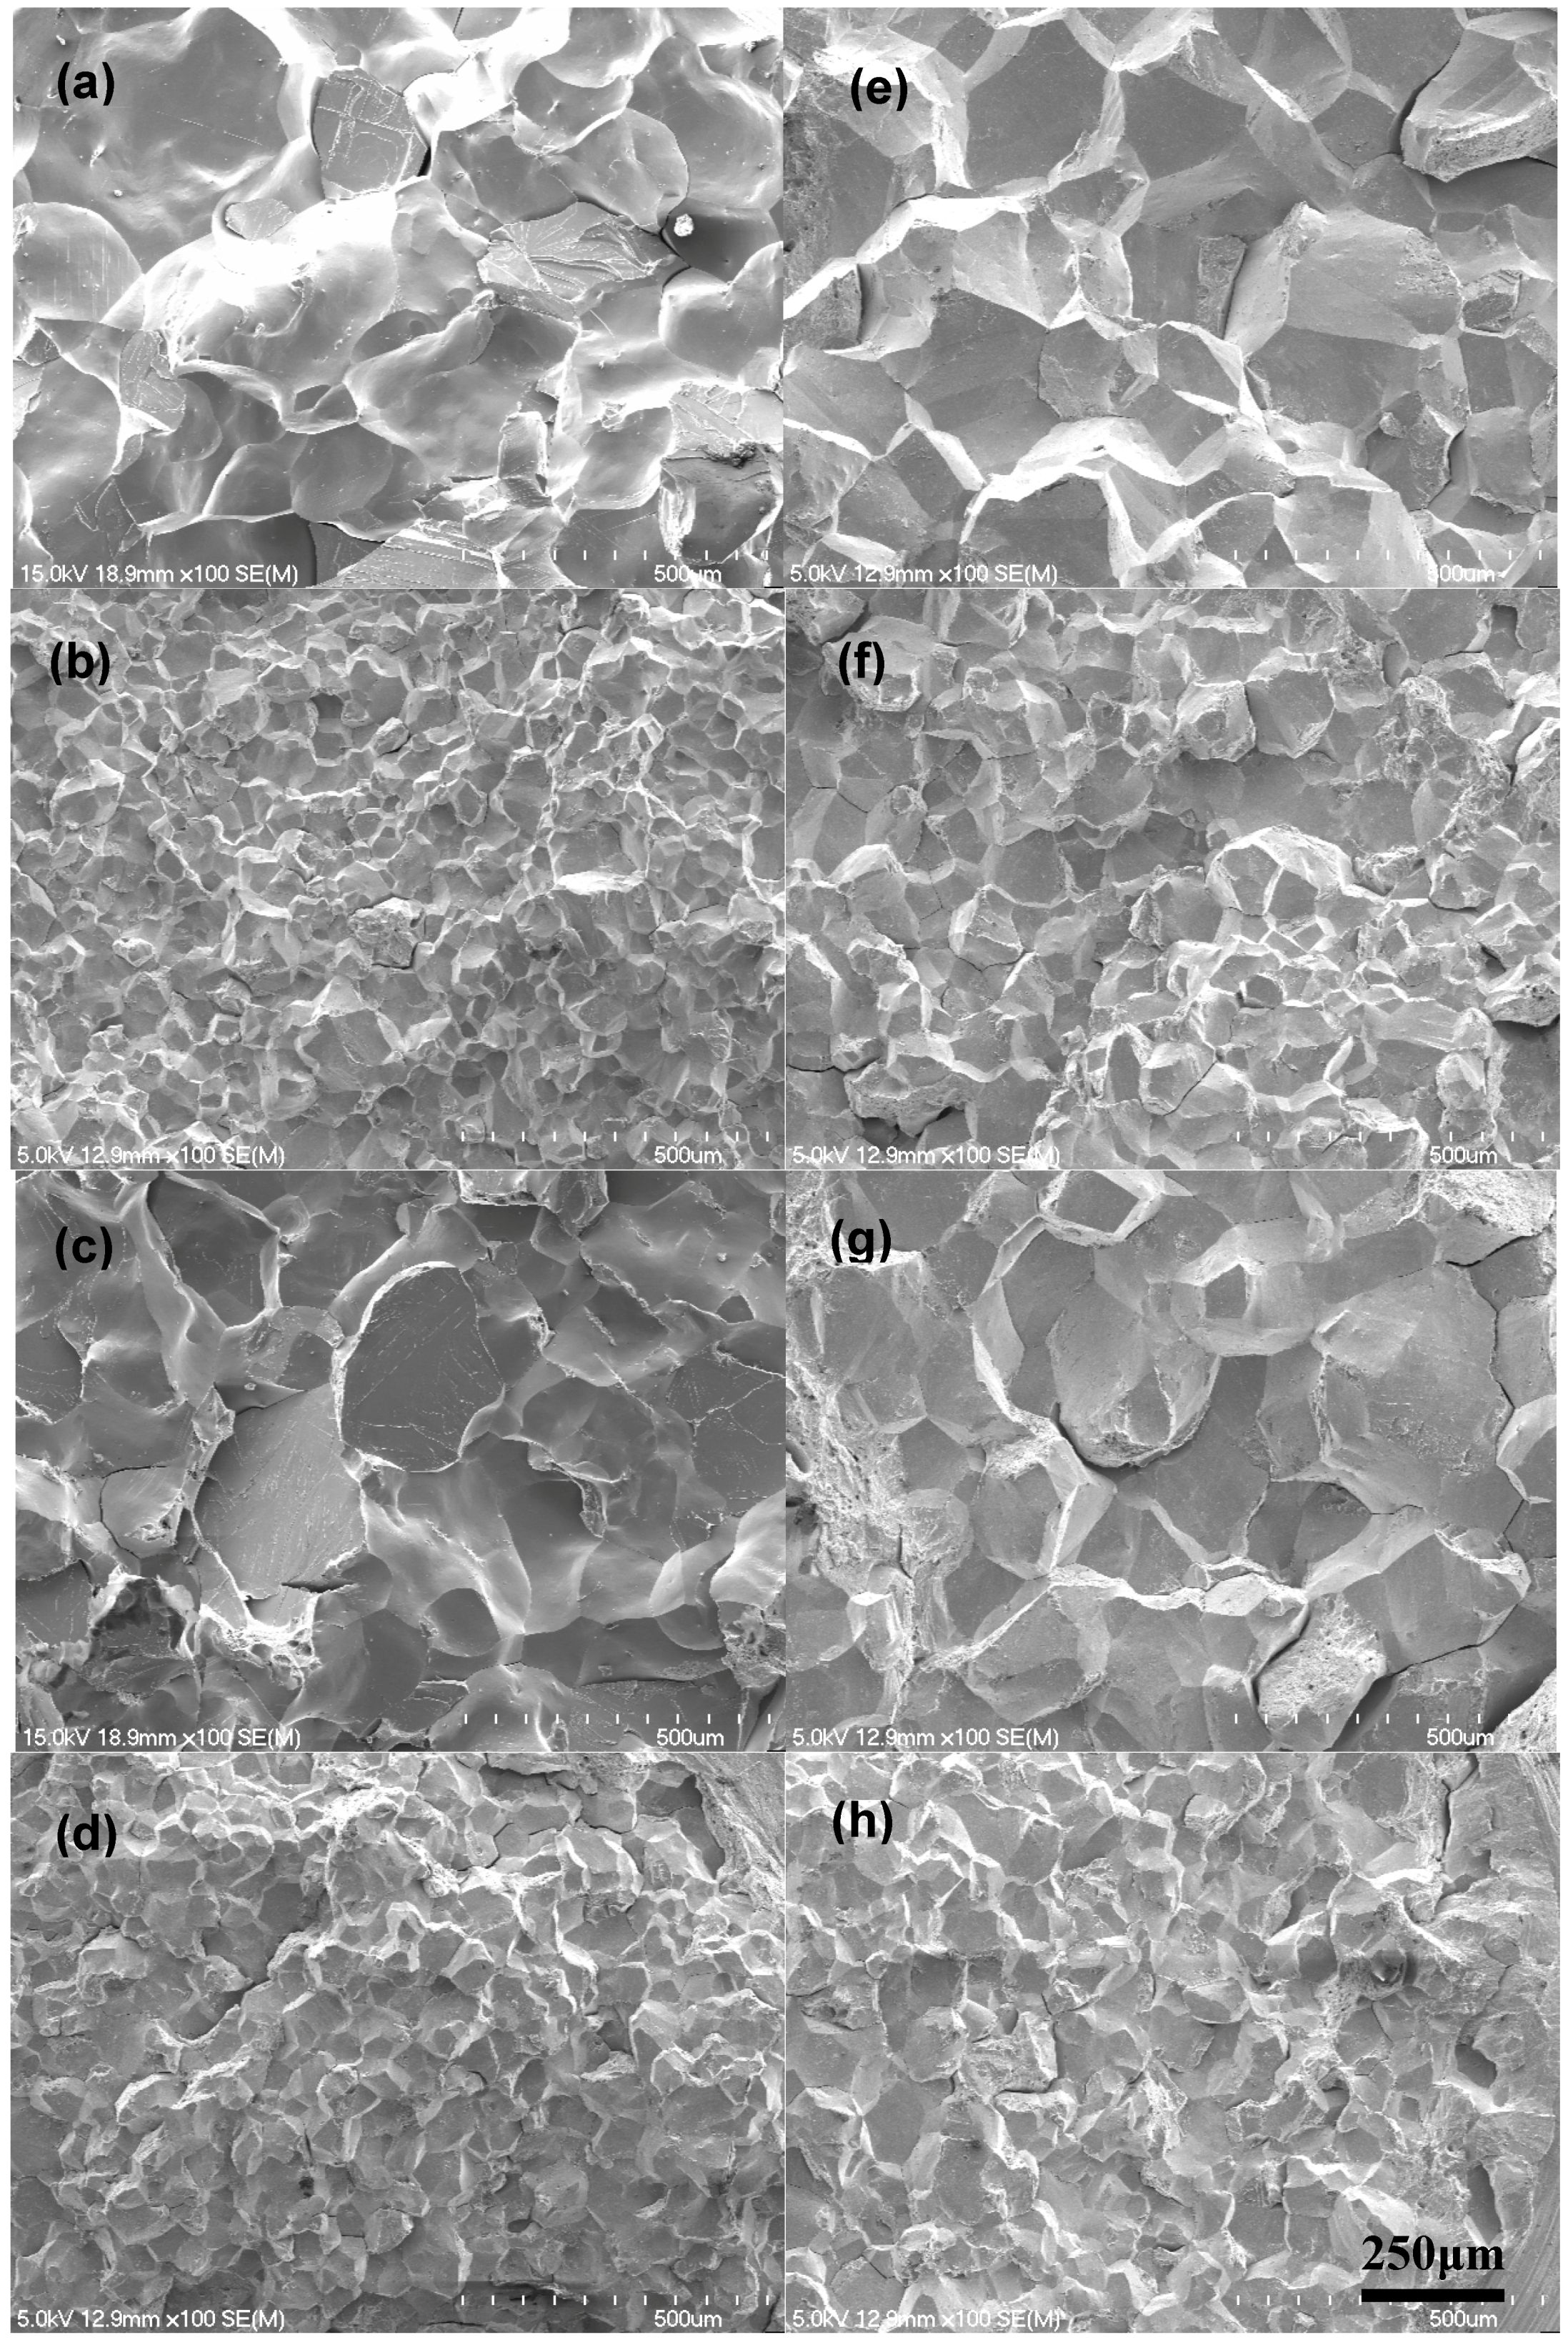
Figure 3.
AES spectra of the specimens with different grain sizes for both IF and 2.25Cr-1Mo steels, aged at different temperatures (IF steel (a–d); and 2.25Cr-1Mo steel (e–h)).
Figure 3.
AES spectra of the specimens with different grain sizes for both IF and 2.25Cr-1Mo steels, aged at different temperatures (IF steel (a–d); and 2.25Cr-1Mo steel (e–h)).

Figure 4.
Segregation concentrations of phosphorus in: (a) IF; and (b) 2.25Cr1-Mo steels with different grain sizes (error bars represent the 95% confidence interval).
Figure 4.
Segregation concentrations of phosphorus in: (a) IF; and (b) 2.25Cr1-Mo steels with different grain sizes (error bars represent the 95% confidence interval).

Figure 5.
Free energies of segregation of phosphorus for: (a) IF steel; and (b) 2.25Cr1-Mo steel with different grain sizes (error bars represent the 95% confidence interval).
Figure 5.
Free energies of segregation of phosphorus for: (a) IF steel; and (b) 2.25Cr1-Mo steel with different grain sizes (error bars represent the 95% confidence interval).

Figure 6.
Relationship between phosphorus segregation entropy and enthalpy for: (a) IF steel; and (b) 2.25Cr-1Mo steel.
Figure 6.
Relationship between phosphorus segregation entropy and enthalpy for: (a) IF steel; and (b) 2.25Cr-1Mo steel.

Figure 7.
Unified relationship between phosphorus segregation entropy and enthalpy for both IF and 2.25Cr-1Mo steels.
Figure 7.
Unified relationship between phosphorus segregation entropy and enthalpy for both IF and 2.25Cr-1Mo steels.
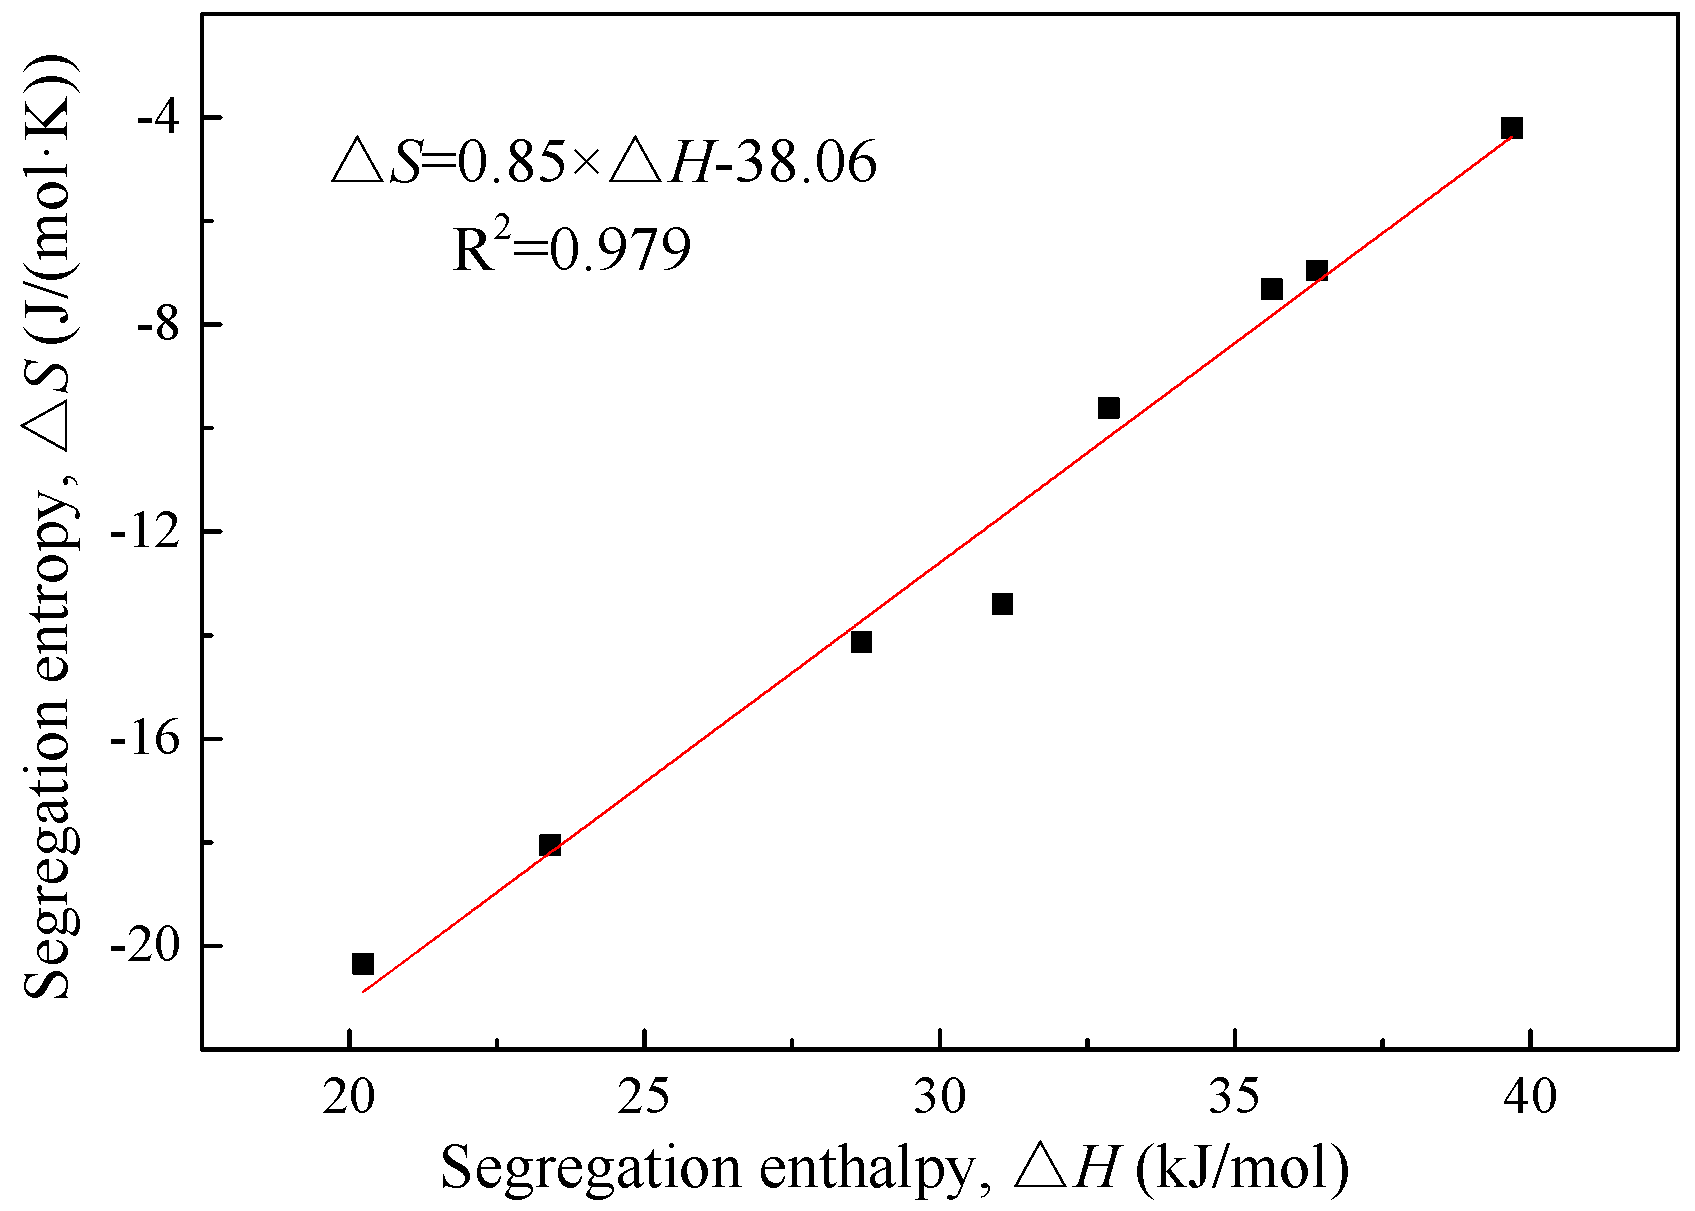
Figure 8.
(a) Grain boundary character distribution; and (b,c) CSL grain boundary distribution in the IF steel specimens with the grain sizes of 48 and 225 µm, respectively.
Figure 8.
(a) Grain boundary character distribution; and (b,c) CSL grain boundary distribution in the IF steel specimens with the grain sizes of 48 and 225 µm, respectively.

Figure 9.
Predictions of equilibrium grain boundary segregation concentrations under different grain sizes: (a) IF steel; and (b) 2.25Cr-1Mo steel.
Figure 9.
Predictions of equilibrium grain boundary segregation concentrations under different grain sizes: (a) IF steel; and (b) 2.25Cr-1Mo steel.


Table 1.
Chemical Composition of IF steel.
| C | N | S | P | Nb | Mn | Si | Cr | Ti | |
|---|---|---|---|---|---|---|---|---|---|
| wt. % | 0.0017 | 0.0018 | 0.002 | 0.044 | 0.036 | 0.35 | 0.064 | 0.0021 | 0.002 |
| at. % | 0.0079 | 0.0072 | 0.0035 | 0.0793 | 0.0216 | 0.3554 | 0.1271 | 0.00225 | 0.0023 |
Table 2.
Chemical Composition of 2.25Cr-1Mo steel.
| C | Si | Mn | Cr | Mo | P | S | Fe | |
|---|---|---|---|---|---|---|---|---|
| wt. % | 0.11 | 0.2 | 0.51 | 2.32 | 1.1 | 0.049 | 0.007 | Bal. |
| at. % | 0.511 | 0.399 | 0.518 | 2.489 | 0.64 | 0.088 | 0.012 | Bal. |
Table 3.
Phosphorus segregation enthalpies and entropies in IF and 2.25Cr-1Mo steels with different grain sizes.
Table 3.
Phosphorus segregation enthalpies and entropies in IF and 2.25Cr-1Mo steels with different grain sizes.
| IF | Grain size (µm) | 48 | 72 | 129 | 225 |
| ∆S (J/mol·K) | −20.4 | −18.1 | −14.1 | −13.4 | |
| ∆H (kJ/mol) | 20.2 | 23.4 | 28.7 | 31.1 | |
| 2.25Cr-1Mo | Grain size (µm) | 55 | 91 | 120 | 179 |
| ∆S (J/mol·K) | −9.6 | −7.3 | −7.0 | −4.2 | |
| ∆H (kJ/mol) | 32.9 | 35.6 | 36.4 | 39.7 |
© 2017 by the authors. Licensee MDPI, Basel, Switzerland. This article is an open access article distributed under the terms and conditions of the Creative Commons Attribution (CC BY) license (http://creativecommons.org/licenses/by/4.0/).
Share and Cite
MDPI and ACS Style
Zhao, Y.; Song, S.; Si, H.; Wang, K. Effect of Grain Size on Grain Boundary Segregation Thermodynamics of Phosphorus in Interstitial-Free and 2.25Cr-1Mo Steels. Metals 2017, 7, 470. https://doi.org/10.3390/met7110470
AMA Style
Zhao Y, Song S, Si H, Wang K. Effect of Grain Size on Grain Boundary Segregation Thermodynamics of Phosphorus in Interstitial-Free and 2.25Cr-1Mo Steels. Metals. 2017; 7(11):470. https://doi.org/10.3390/met7110470
Chicago/Turabian StyleZhao, Yu, Shenhua Song, Hong Si, and Kai Wang. 2017. "Effect of Grain Size on Grain Boundary Segregation Thermodynamics of Phosphorus in Interstitial-Free and 2.25Cr-1Mo Steels" Metals 7, no. 11: 470. https://doi.org/10.3390/met7110470
Note that from the first issue of 2016, this journal uses article numbers instead of page numbers. See further details here.