Article

An Investigation of the Micro-Electrical Discharge Machining of Nickel-Titanium Shape Memory Alloy Using Grey Relations Coupled with Principal Component Analysis

by
Mustufa Haider Abidi
1,*,
Abdulrahman M. Al-Ahmari
1,2,
Arshad Noor Siddiquee
3,
Syed Hammad Mian
1,
Muneer Khan Mohammed
1 and
Mohammed Sarvar Rasheed
4
1
Princess Fatima Alnijiris Research Chair for Advanced Manufacturing Technology (FARCAMT Chair), Advanced Manufacturing Institute, King Saud University, Riyadh 11421, Saudi Arabia
2
Industrial Engineering Department, College of Engineering, King Saud University, Riyadh 11421, Saudi Arabia
3
Department of Mechanical Engineering, Jamia Millia Islamia (A Central University), New Delhi 110025, India
4
Academics Department, Baynounah Institute of Science and Technology, Adveti, Madinat Zayed 57788, UAE
*
Author to whom correspondence should be addressed.
Metals 2017, 7(11), 486; https://doi.org/10.3390/met7110486
Submission received: 27 September 2017 / Revised: 26 October 2017 / Accepted: 5 November 2017 / Published: 9 November 2017
(This article belongs to the Special Issue Machining and Finishing of Nickel and Titanium Alloys)

Abstract

:
Shape memory alloys (SMAs) are advanced engineering materials which possess shape memory effects and super-elastic properties. Their high strength, high wear-resistance, pseudo plasticity, etc., makes the machining of Ni-Ti based SMAs difficult using traditional techniques. Among all non-conventional processes, micro-electric discharge machining (micro-EDM) is considered one of the leading processes for micro-machining, owing to its high aspect ratio and capability to machine hard-to-cut materials with good surface finish.The selection of the most appropriate input parameter combination to provide the optimum values for various responses is very important in micro-EDM. This article demonstrates the methodology for optimizing multiple quality characteristics (overcut, taper angle and surface roughness) to enhance the quality of micro-holes in Ni-Ti based alloy, using the Grey–Taguchi method. A Taguchi-based grey relational analysis coupled with principal component analysis (Grey-PCA) methodology was implemented to investigate the effect of three important micro-EDM process parameters, namely capacitance, voltage and electrode material.The analysis of the individual responses established the importance of multi-response optimization. The main effects plots for the micro-EDM parameters and Analysis of Variance (ANOVA) indicate that every parameter does not produce same effect on individual responses, and also that the percent contribution of each parameter to individual response is highly varied. As a result, multi-response optimization was implemented using Grey-PCA. Further, this study revealed that the electrode material had the strongest effect on the multi-response parameter, followed by the voltage and capacitance. The main effects plot for the Grey-PCA shows that the micro-EDM parameters “capacitance” at level-2 (i.e., 475 pF), “discharge voltage” at level-1 (i.e., 80 V) and the “electrode material” Cu provided the best multi-response.

1. Introduction

The advent of miniaturization in addition to perpetual consumer demands and competitive markets are driving companies to extensively consider new methods of manufacturing. Moreover, the universal adoption of artificial intelligence, information and communication technologies as well as the requirements for product compactness, portability, flexibility have necessitated the development of innovative and new paradigms in the production industries. As a result of miniaturization, micro-machining applications have increased substantially in recent times. In fact, a large number of sectors which thrive on miniaturization involve predominantly automation-enabled electromechanical system products. The majority of products involving micro-machining can be associated with the automotive industries (diesel engine injection nozzles, typically with micro-jet holes of diameter < 300 µm, depth > 1 mm with a number of holes > 4), semiconductor devices, biotechnology products, medical tools etc. [1]. Its applications have flourished with the realization of the benefits of micro-machined features. For example, micro-nozzles in injectors directly affect the performance of diesel engines in terms of combustion, noise, emissions and reliability. Additionally, miniaturization has resulted in better atomization, penetration, and spatial distribution of injected fuel in high pressure diesel engines [2]. There are numerous applications such as valves, industrial torch tips and a large number of products in the medical, aerospace industries, etc., where micro-features are crucial.
Aspects such as the dimensional accuracy of micro-features, their surface finish, profile, etc., are critical to the overall functioning of the respective product. Indeed, different micro-machining approaches each with inherent benefits and limitations can be pointed out. As a consequence of the size effect and slender tools in the case of mechanical micro-machining, the machining forces are very high, which leads to frequent tool breakage, burr formation, surface cracks, etc. [3]. Similarly, laser-based micro-machining results in a poor surface profile and inferior surface integrity. Among several alternatives, electric discharge machining (EDM) has emerged as a reliable process for miniature and micro-machining applications owing to its numerous benefits [4,5]. Furthermore, the EDM process can be utilized independently of the hardness of the workpiece material, since no mechanical action of the cutting tool or the abrasive tool is involved in the process [6]. As a result of the latest enhancements and accomplishments in the EDM process, micro-machining—which was earlier regarded as unfeasible or impractical—has now become achievable [7]. On account of its abundant benefits, different special purpose variants based on EDM principles can be listed, such as micro-EDM, aerospace EDM, medical EDM, semi-conductor EDM, etc. Micro-EDM, on account of its low discharge energy and high frequency, can successfully achieve the desired accuracy and surface finish, as compared to conventional EDM. The effective and efficient operation of micro-EDM depends on the appropriate selection of process parameters and their range [8]. The spark gap in the case of conventional EDM is primarily chosen depending on the material removal rate (MRR) and the desired surface finish. In the case of micro-EDM, the spark gap is kept very small to achieve the desired accuracy and limit the electrode wear rate (EWR). The performance of micro-EDM depends on many factors, including the dielectric used, pulse current, pulse profile (e.g., shape, length, etc.), frequency, etc. [9]. The EWR can be minimized with the use of lesser spark energy. Still, it is a matter of serious concern when a combination of micro and macro-features need to be produced (often required in generating complex 3D micro-profiles) in micro-EDM. This can be attributed to differential EWR in micro and macro features, which deteriorate the electrode profile. The drilling of a blind hole using an electrode with a constant wear rate often results in a smaller diameter than required [10]. Actually, as a result of the constant wear rate, the electrode diameter reduces continuously with increasing depth, thus producing an inaccurate hole. Even though a narrow spark gap in micro-EDM results in higher accuracy and lower EWR, it hinders the process of debris removal. Subsequently, the higher concentration of debris between the electrode and the workpiece along with continued feed provides inaccurate geometry as well as poor surface integrity [11].
Machining at the micro level itself is a complicated process that requires precision and accuracy to obtain good quality. If the micro-machining is done on difficult-to-machine material, the task becomes more exacting. Ni-Ti based shape memory alloys (SMA) are one such difficult-to-machine material with applications in numerous fields (automobile actuators, biomedical, aerospace, micro-electromechancial systems, etc.) [12,13]. These alloys possess the unique properties of pseudo-elasticity, bio-compatibility, corrosion resistance and shape memory effect. These properties make them an excellent material for various applications, yet these properties also hinder their machining characteristics. While Ni-Ti-based materials are hard to machine, the shape memory effect complicates the machining issue. Furthermore, during the conventional machining of micro-sized shapes, the slender tool is required and the machining forces are high due to the size effect. Thus, non-traditional methods such as micro-EDM are the best alternative for machining micro-shapes on SMAs. Even for micro-EDM, the selection of the range of parameters and the optimal solution is a challenge, as during machining the electrode itself undergoes erosion, undermining the accuracy in cases where the erosion is beyond acceptable limits. Therefore, it is important to find an appropriate combination of input machining parameters for machining SMAs. Hsieh et al. [14] studied the machining characteristics of Ti-Ni-X SMA during wire electro-discharge machining. Laser-based micromachining of Ni-Ti-based SMA was explored to study the single and multishot ablation threshold fluence and the incubation coefficient effect on the quality of microfeatures [15]. The optimization of the process parameters of the high speed milling of Ni-Ti-based SMA was conducted [16]. It was revealed that to obtain low machining forces, a burr size of 15 m/min cutting speed is optimal. Rasheed et al. [8] investigated the effect of the process parameters of micro-EDM on hole quality while drilling micro-holes in Ni-Ti SMA. Jahan et al. [17] compared the surface characteristics of Ni-Ti-based SMA with Ti-6Al-4V, when machined by the micro-EDM process. It was discovered that Ni-Ti-based SMA possessed a comparatively smoother surface finish.
The accomplishment of the desired dimensional accuracy, profile, surface finish, MRR, EWR, etc., in micro-machining such as micro-drilling and micro-milling is a daunting task. It depends on the appropriate selection of process parameters, their range, etc. The task becomes more complex with the presence of more than one response and the requirement of their simultaneous control within a closed range of acceptability limits. Notably, each process parameter has a variable and contradictory effect on each response. It means an optimization tool which can identify the most suitable combination of process parameters is crucial for the superlative performance of the micro-EDM process. Multi-performance-characteristic (MPC) optimization is one such tool that can achieve acceptable micro-machined quality. Generally, there exist a large number of MPC optimization techniques, with each technique possessing its own merits and demerits. A particular MPC technique may be ideal for some applications, but the same technique may produce inaccurate results for another application. Therefore, the selection of the appropriate MPC tool for a given application is very important to achieve the desired results in micro-EDM. This issue has been convincingly addressed by [18]. They demonstrated that the application of Taguchi-based grey relational analysis (GRA) compounded with principal component analysis (PCA) in precise machining. This approach was all about synchronization between the robustness of Taguchi’s experiment design, the conversion of characteristic response data into comparable normalized sequences without affecting its inherent essence through GRA and the coupling of normalized-multiple-responses by applying an inherent weighting of each response that is statistically derived through the inherent process characteristics by employing PCA. As compared to a general MPC optimization technique, which is subjective in nature and depend upon expert opinion, Taguchi-based Grey-PCA is quantitative in nature. The analysis of responses and subsequent statistical processing brings out the weighting estimates through the inherent nature of the process. Similarly, Chiang [19] optimized the process parameters of the injection-molded thermoplastic part using a fuzzy GRA technique. GRA was also used by Chiang and Chang [20] in the multi-response optimization (removal rate and surface roughness) of wire-EDM process parameters for Al2O3 particle-reinforced composite. Moreover, Palanikumar et al. [21] employed GRA and Lin [22] applied the Taguchi-based GRA for the multi-response optimization of turning process parameters. There have been numerous investigations in the literature, where single and multi-response optimizations were carried out. However, the multi-response optimization of process parameters for the micro-machining of Ni-Ti-based SMA using micro-EDM process is close to negligible in the literature. Therefore, this study is conducted to make some progress in the field.
The objective of this study is the improvement of the quality of micro-machining in Ni-Ti based alloy using micro-EDM. A methodology for optimizing the multiple quality characteristics, namely overcut, taper angle and surface roughness has been developed. In this work, a Taguchi-based grey relational analysis coupled with principal component analysis (Grey PCA) was implemented to investigate the effect of three important micro-EDM process parameters, namely capacitance, voltage and electrode material.
2. Materials and Methods

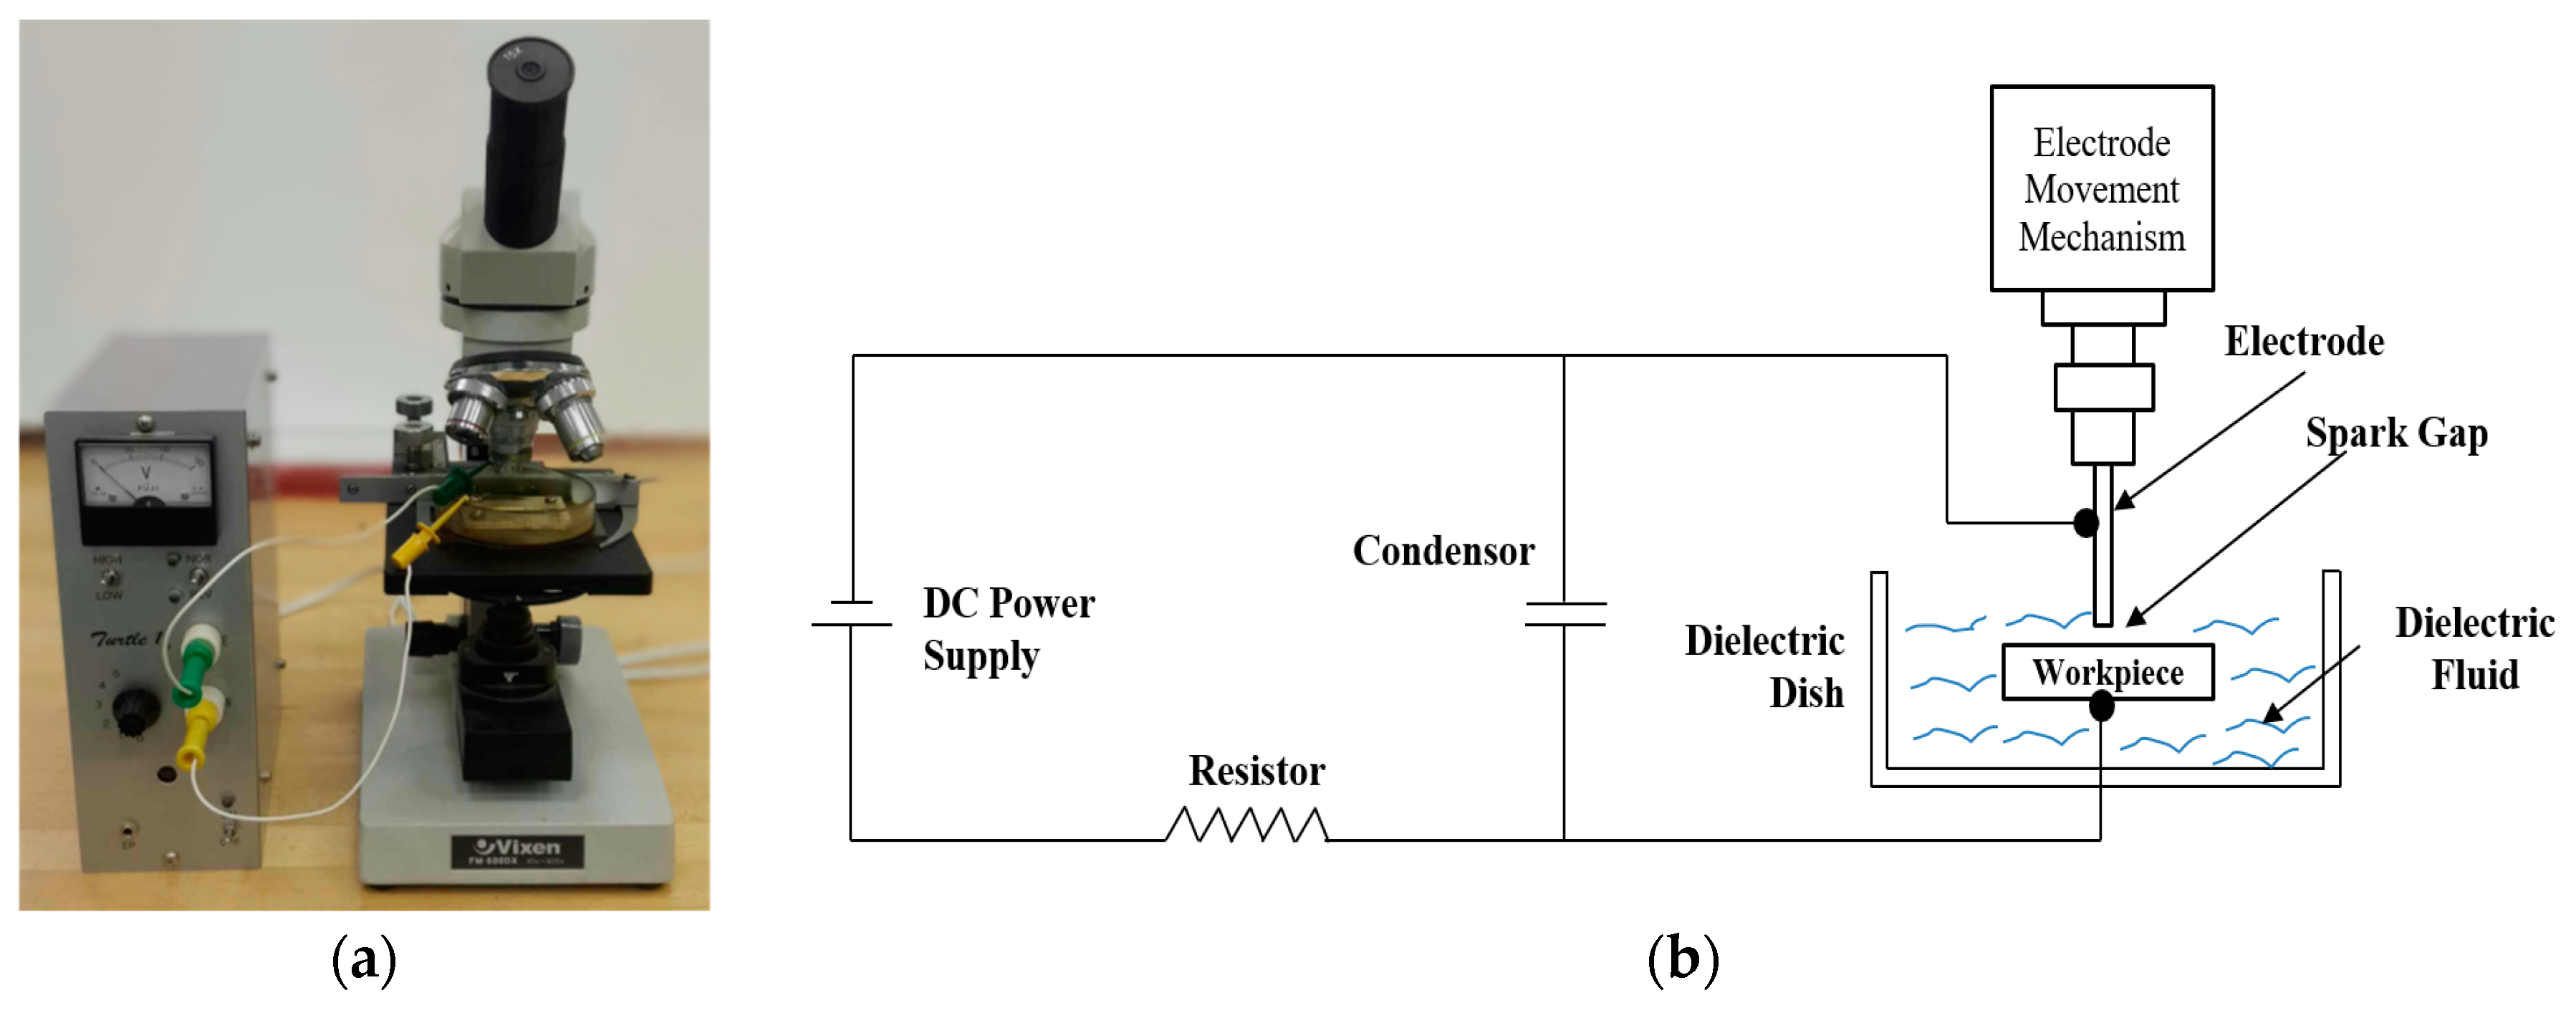
A resistor capacitor (RC) circuit-based micro-EDM (Masuzawa, Tokyo, Japan) is shown in Figure 1a, with kerosene oil was used as the dielectric for performing the experiments. A tabletop type micro-EDM was attached with an optical microscope, which facilitated inline observations of the region being machined and enabled the assessment of a micro-hole without removing the work piece from the setup.
The general organization of the RC-type, generator-cut, process energy source (PES) circuitry of micro-EDMs is schematically shown in Figure 1b. The PES is capable of generating pulse frequencies ranging from a few tens of nanoseconds to a few micro-seconds, and can operate in the voltage range between 45 to 120 V.
SMA have many advantages and applications. However, it is considered as difficult to cut material by conventional machining, especially when micro-level manufacturing is required. That is why Ni-Ti-based SMA is used in this study. The specimen was cut into a rectangular plate of 3 mm × 1.5 mm × 0.5 mm. Properties of the specimen material (as provided by supplier) are given in Table 1.
Tungsten and brass electrodes with 100 micrometers in diameter were used. The tool’s material properties (as provided by supplier) are provided in Table 2. Kerosene was used as the dielectric fluid because it is easily available and cost effective, however many other types of dielectrics are available in the market.
Three process parameters, namely capacitance, discharge voltage and electrode materials were chosen. The latter is a categorical parameter, whereas the remaining two are numeric parameters. Two levels of all three parameters were chosen as shown in Table 3.
To systematically investigate the effect of selected process parameters on individual and multiple responses, Taguchi’s L8 orthogonal array—as shown in Table 4—was used to perform experimental investigations. Three replicates were considered and the average of the measured responses was considered for the analysis of the results.

2.1. Responses

Since the wear behavior of the electrodes of selected materials is different, this may result in characteristics of the drilled micro hole. Consequently, three responses, namely, overcut, taper angle and surface roughness were selected to record, analyze and investigate the effect of input process parameters. The response parameters provided in Table 4 are the average of three replicate responses. The dimensions of the holes were measured using a scanning electron microscope ((SEM), JEOL, Tokyo, Japan).
The overcut of micro-hole is an important accuracy aspect of a micro-hole. It was estimated by the difference between the average diameter of a micro-hole after machining and the diameter of a tool by using Equation (1).
O v e r c u t = ( D a D ) 2
where Da is the average diameter of micro-hole produced and can in turn be estimated as below:
D a = ( D t + D b ) 2
where, Dt is the top diameter of the micro-hole produced, and Db is the bottom diameter of the micro-hole produced. D is the tool diameter.
The taper (represented by angle α) in the drilled hole is a typical characteristic of holes machined by micro-EDM. It was measured as the difference between the diameter at the entry and exit of a micro-hole as given in Equation (2).
α = t a n 1 ( D t D b 2 h )
where α is the taper angle, and h is the thickness of the workpiece.
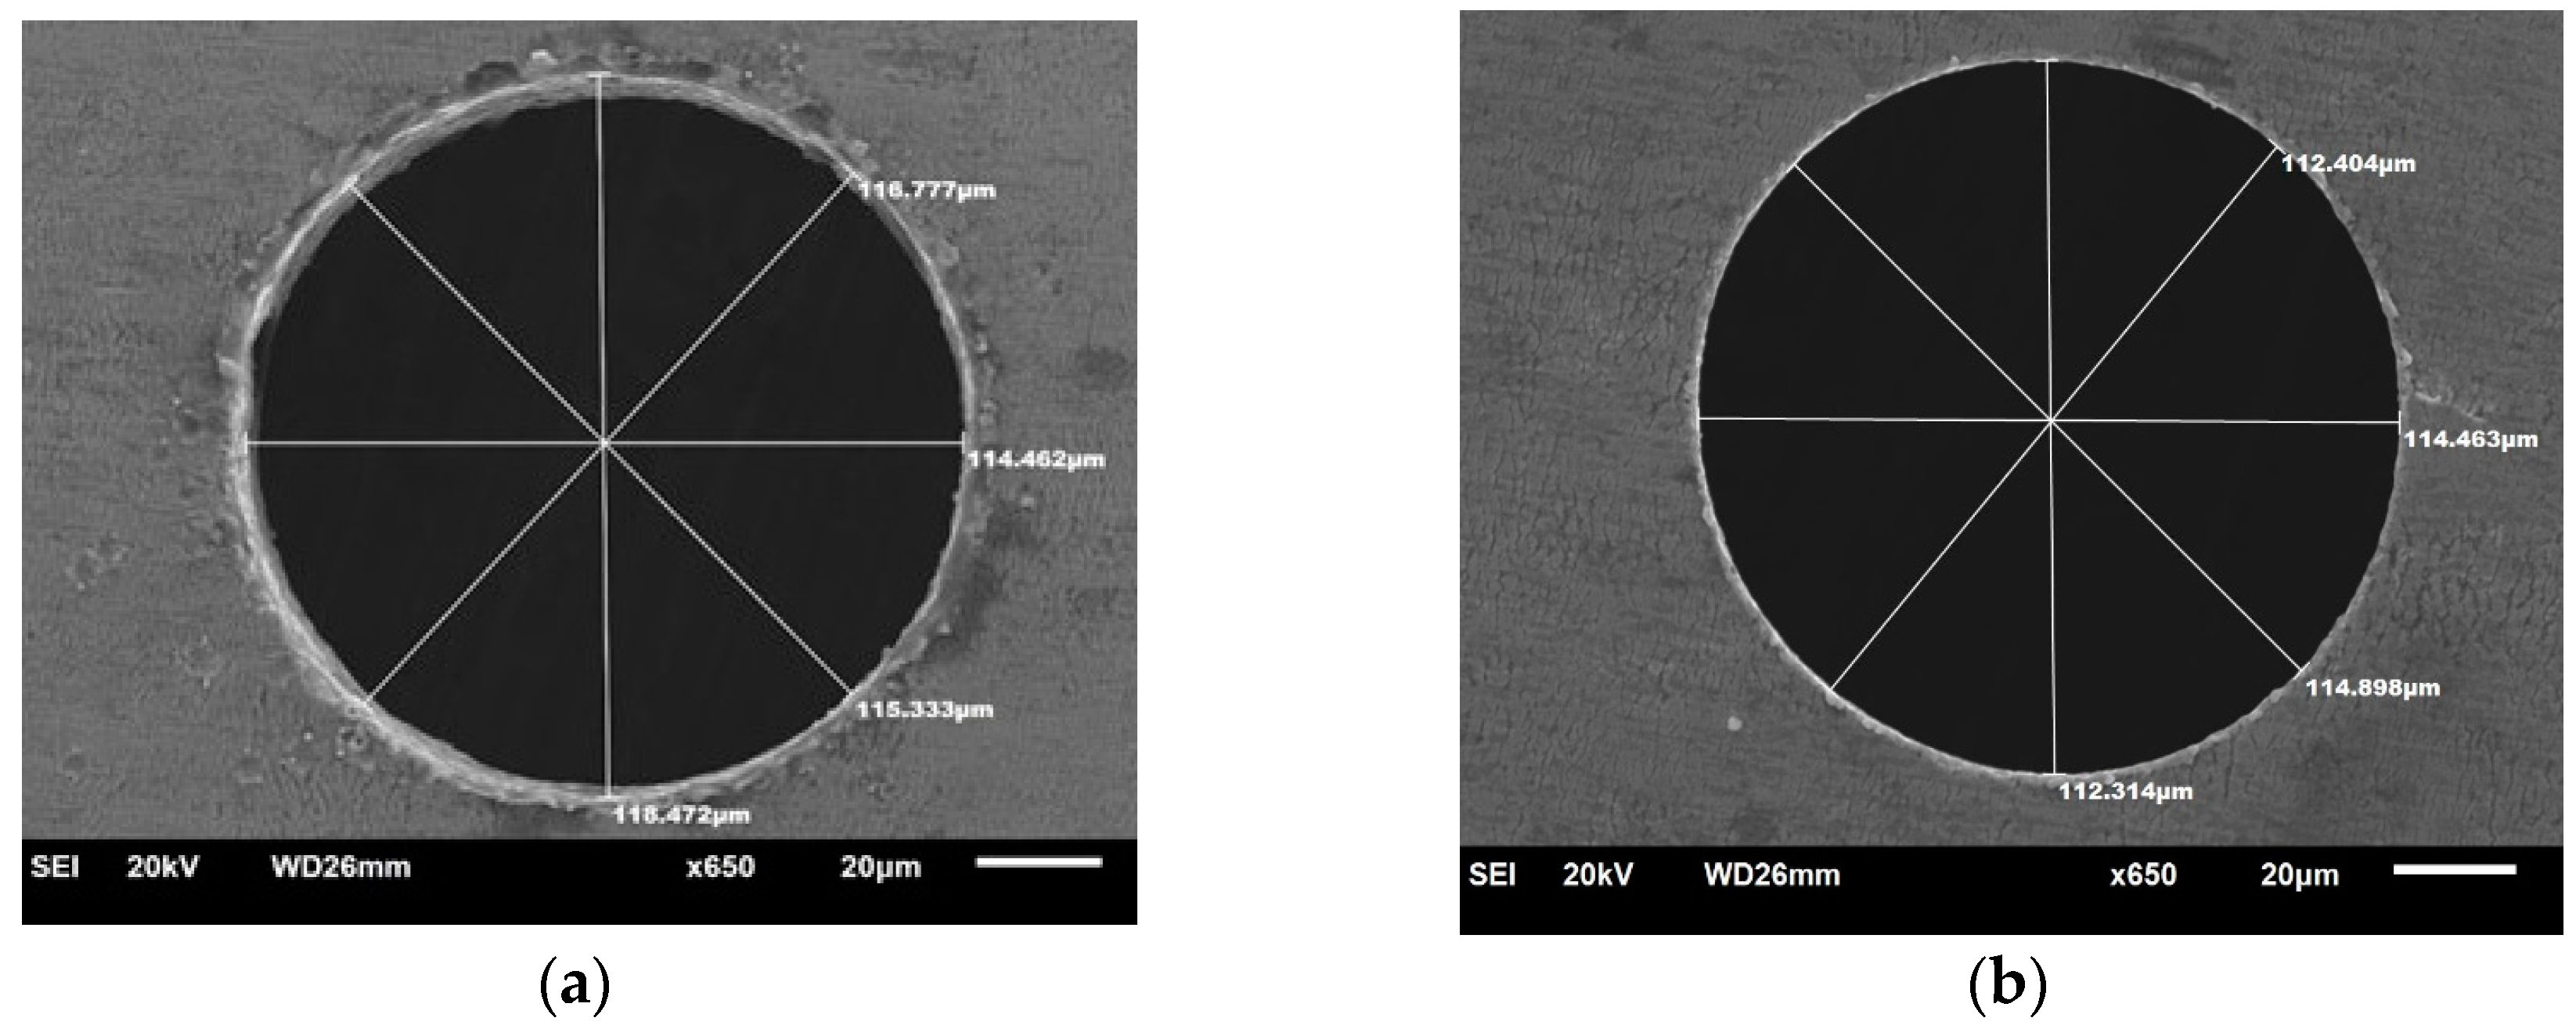
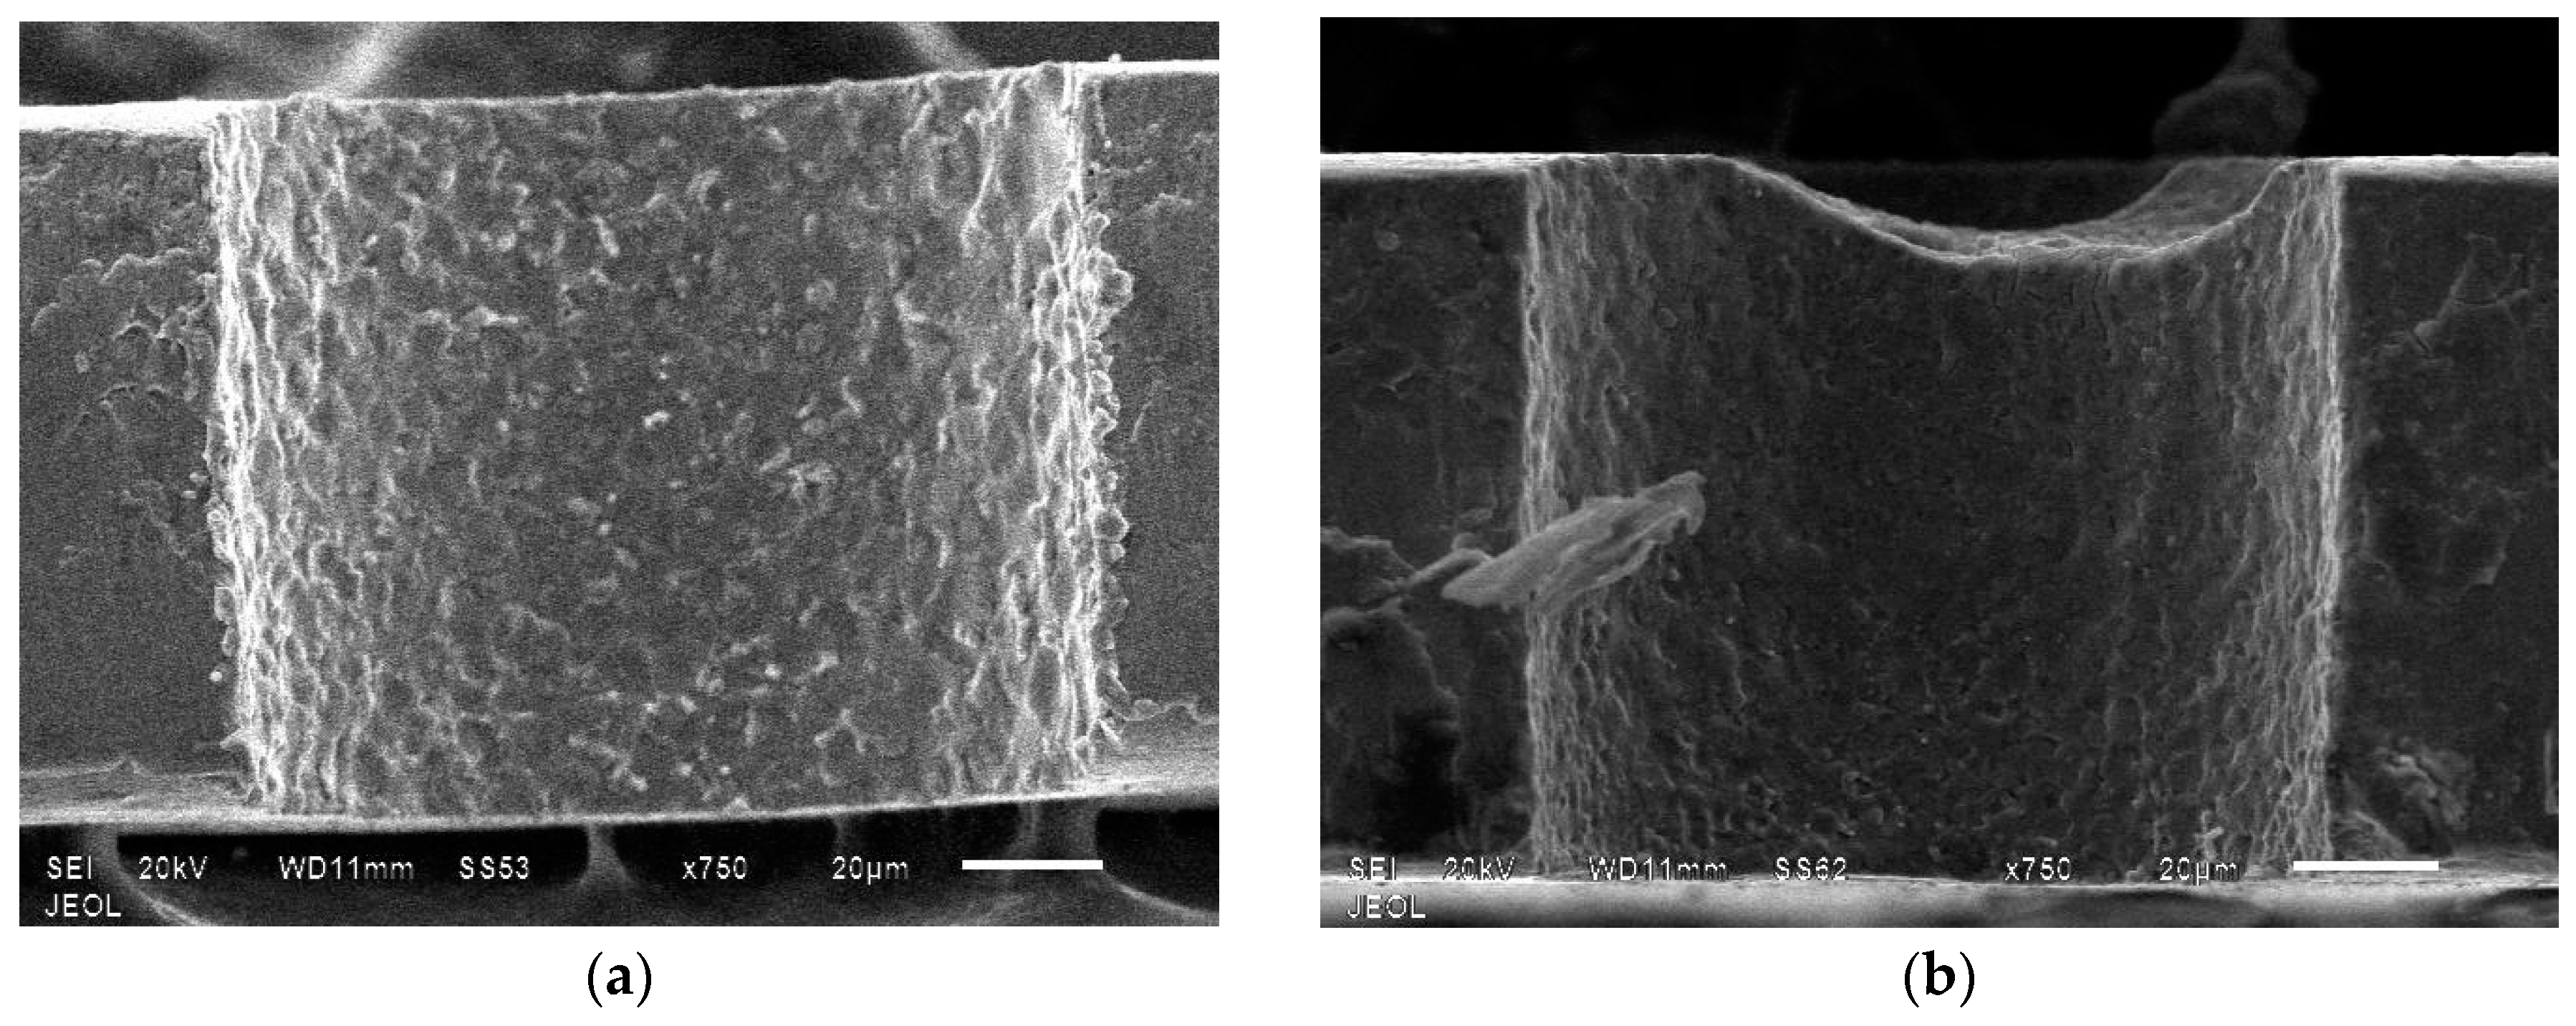
Surface roughness, which greatly influences the in-service performance of a machined component is important to all machining processes, conventional or non-conventional, and hence, in micro-EDM as well. In the present study, the average surface roughness (Ra) was measured by Talysurf CCI-6000 (Taylor Hobson, Leicester, UK) and through SEM. In order to measure the wall surface roughness, holes were drilled at the edges of the plate such that only a portion of the hole is drilled at the edge as shown in the Figure 2. Figure 2 compares the surface roughness of holes drilled with non-optimized parameters and optimized parameters.
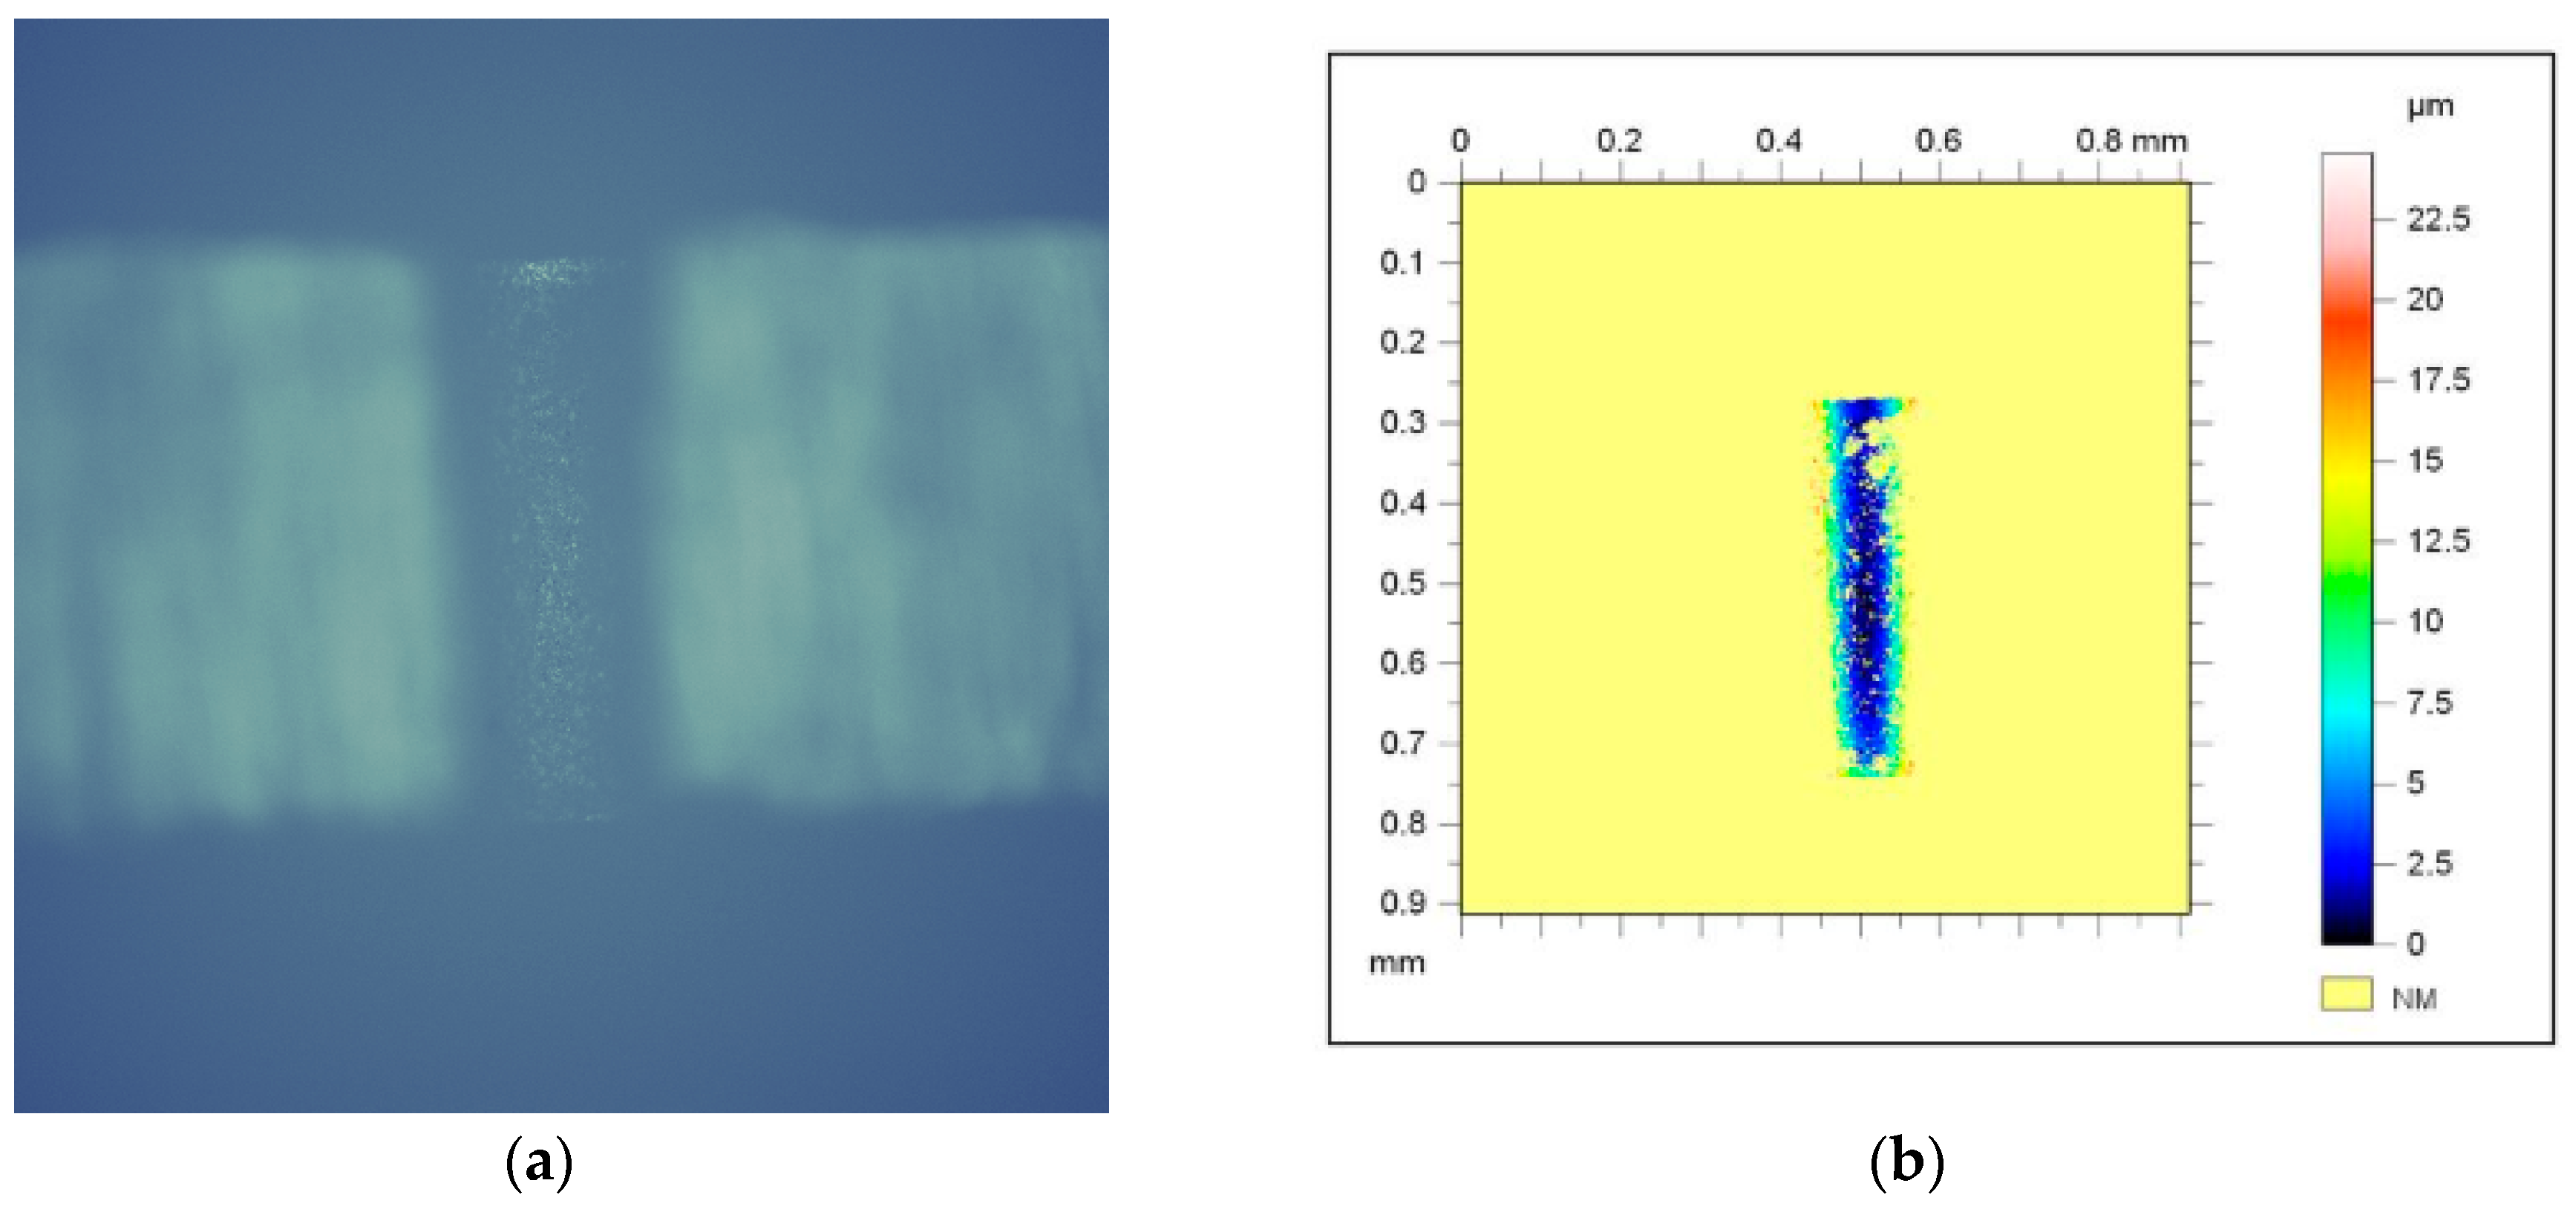
This portion of the hole was then measured using Talysurf CCI-6000 as shown in Figure 3. The captured data is then processed using talymap software (Taylor Hobson, version gold, Leicester, UK) for the surface roughness analysis.

3. Analysis of Results

The three measured response parameters, namely overcut, taper and surface roughness were analyzed to arrive at meaningful conclusions. The response data as given in Table 4 were systematically processed to analyze individual and multi-response characteristics. The stepwise processing to analyze the result is presented in the following text.

3.1. Estimation of Signal-to-Noise Ratio (S/N Ratio)

In the Taguchi method, the measured response is analyzed to obtain a targeted value through a parameter “signal-to-noise ratio or S/N ratio”, where “signal” represents the desirable (mean) value of the output characteristic and the term “noise” represents the undesirable value (standard deviation, or S.D.) for the output characteristic. Taguchi uses the S/N ratio (ratio of mean to S.D.) to measure quality characteristics deviating from the desired value. The S/N ratio Ψ is defined as per Equation (3):
Ψ = −10·log(M.S.D)
where, M.S.D. is the mean-square deviation for the output characteristic.
The Taguchi method prescribes three categories of quality characteristics, i.e., the lower-the-better, the higher-the-better, and the more nominal-the better. To obtain optimal micro-machining response, lower-the-better quality characteristic for all the three responses were considered. Mean-square deviation for lower-the-better quality characteristic can be expressed as per the Equation (4):
M . S . D = 1 m i = 1 m S i 2
where, m is the number of tests and Si is the value of the individual responses as given in Table 4 for the ith experiment.
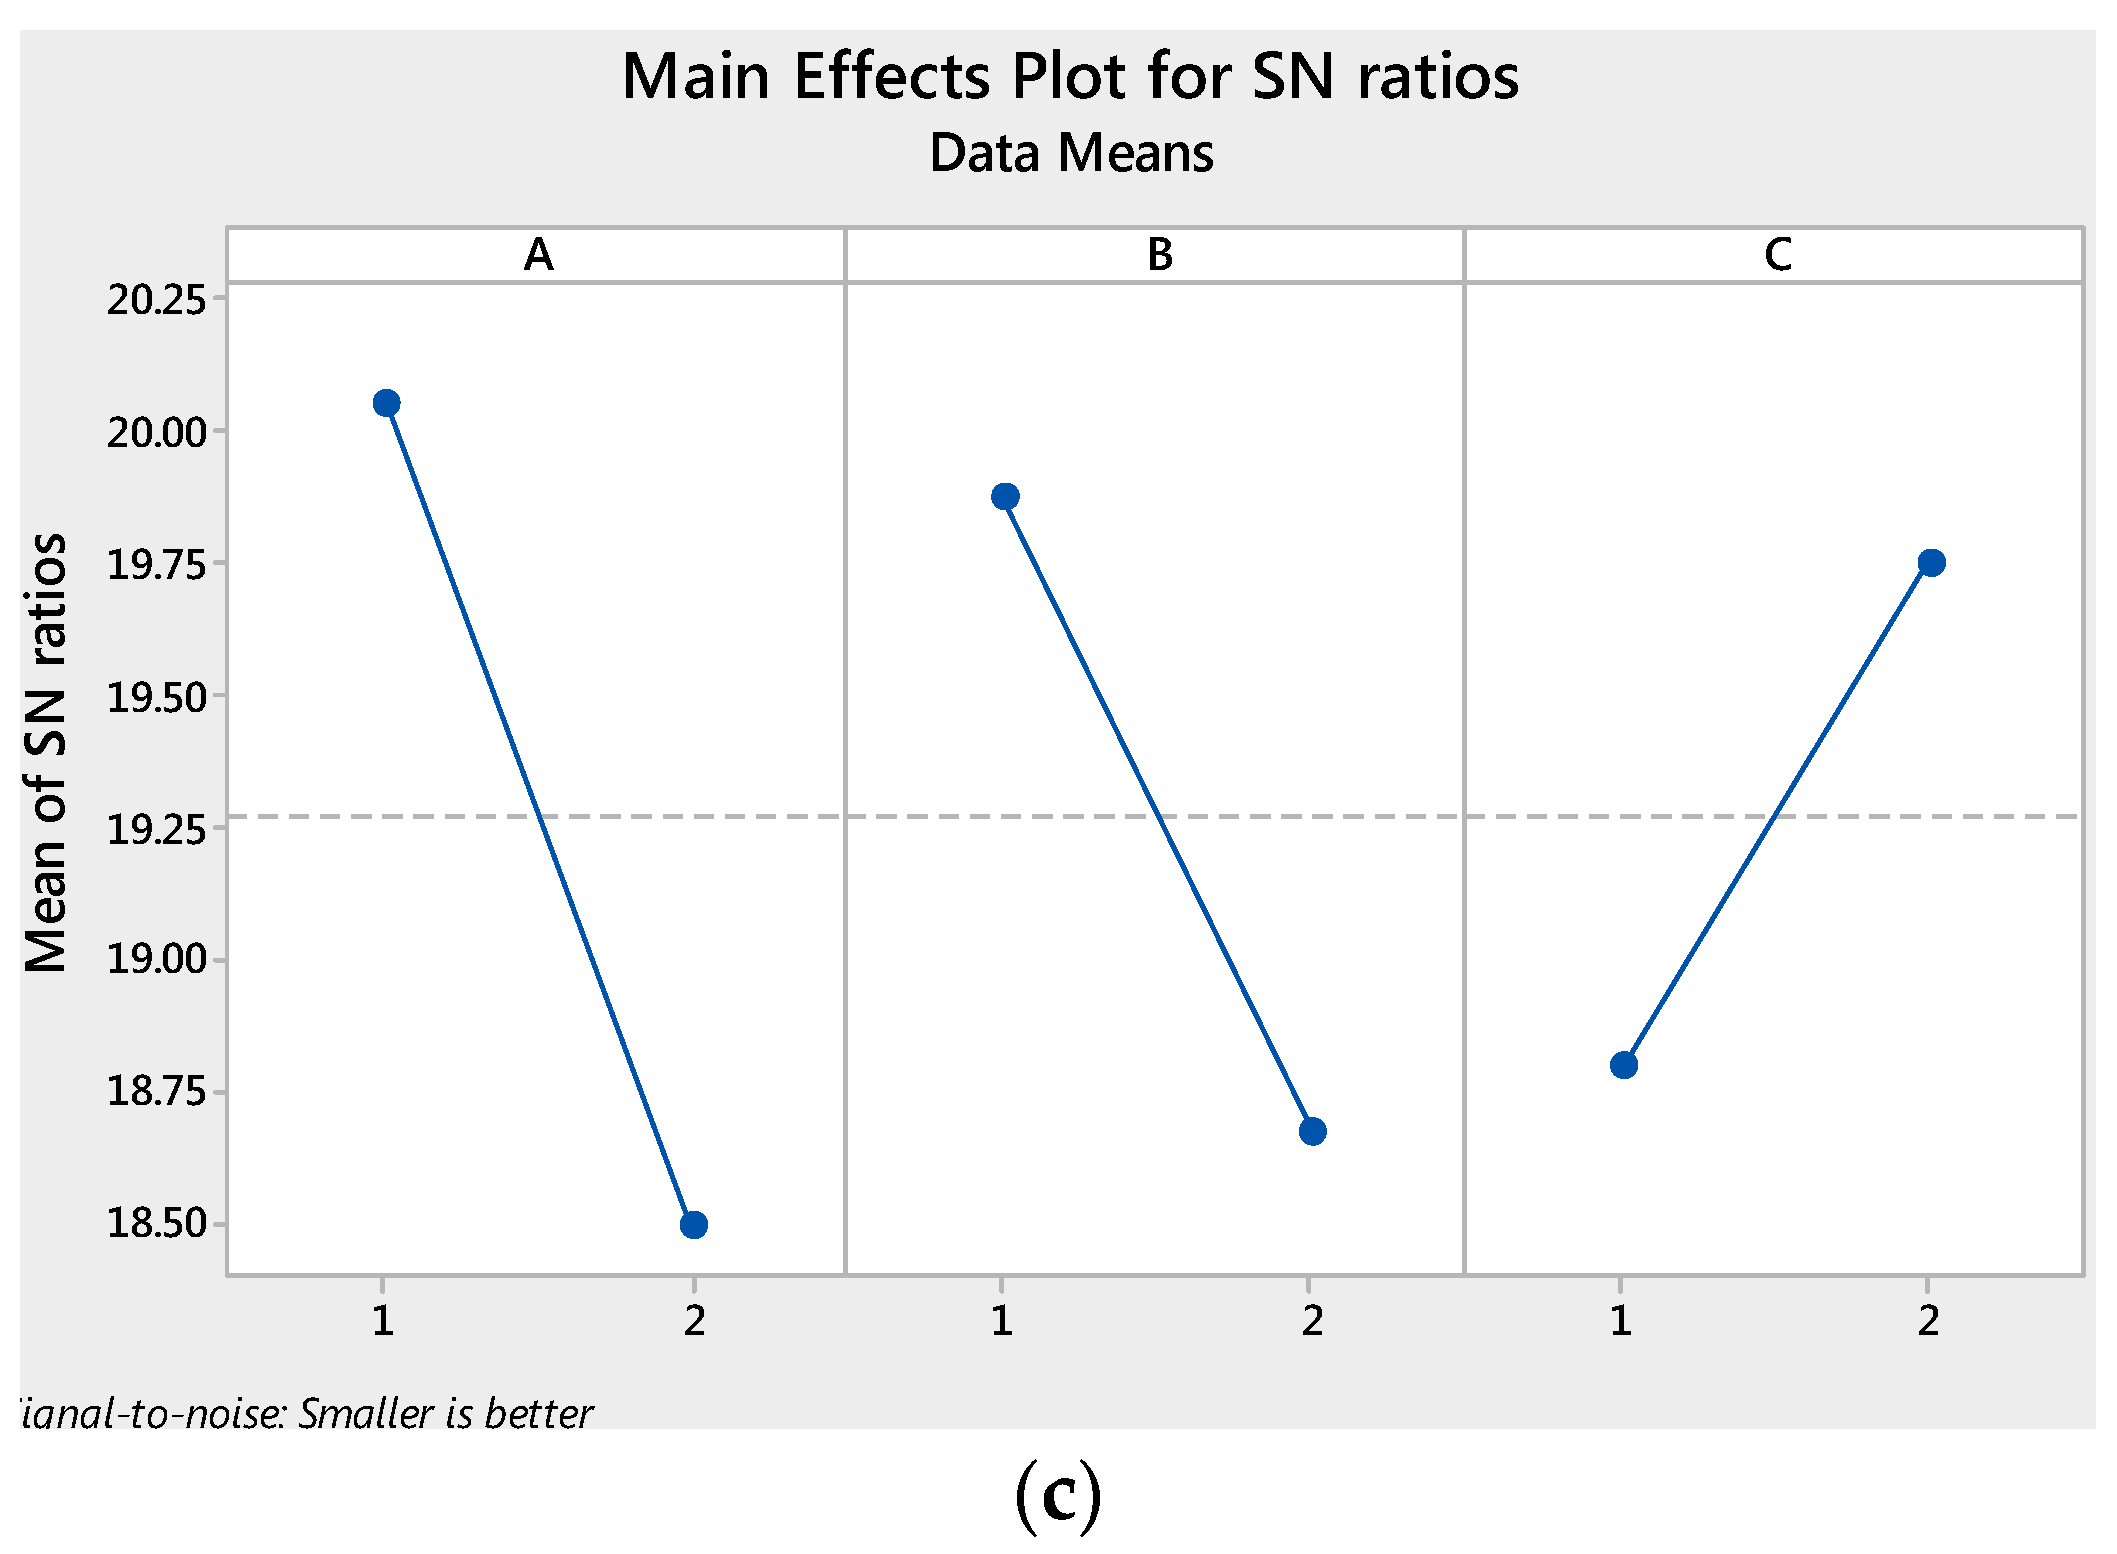
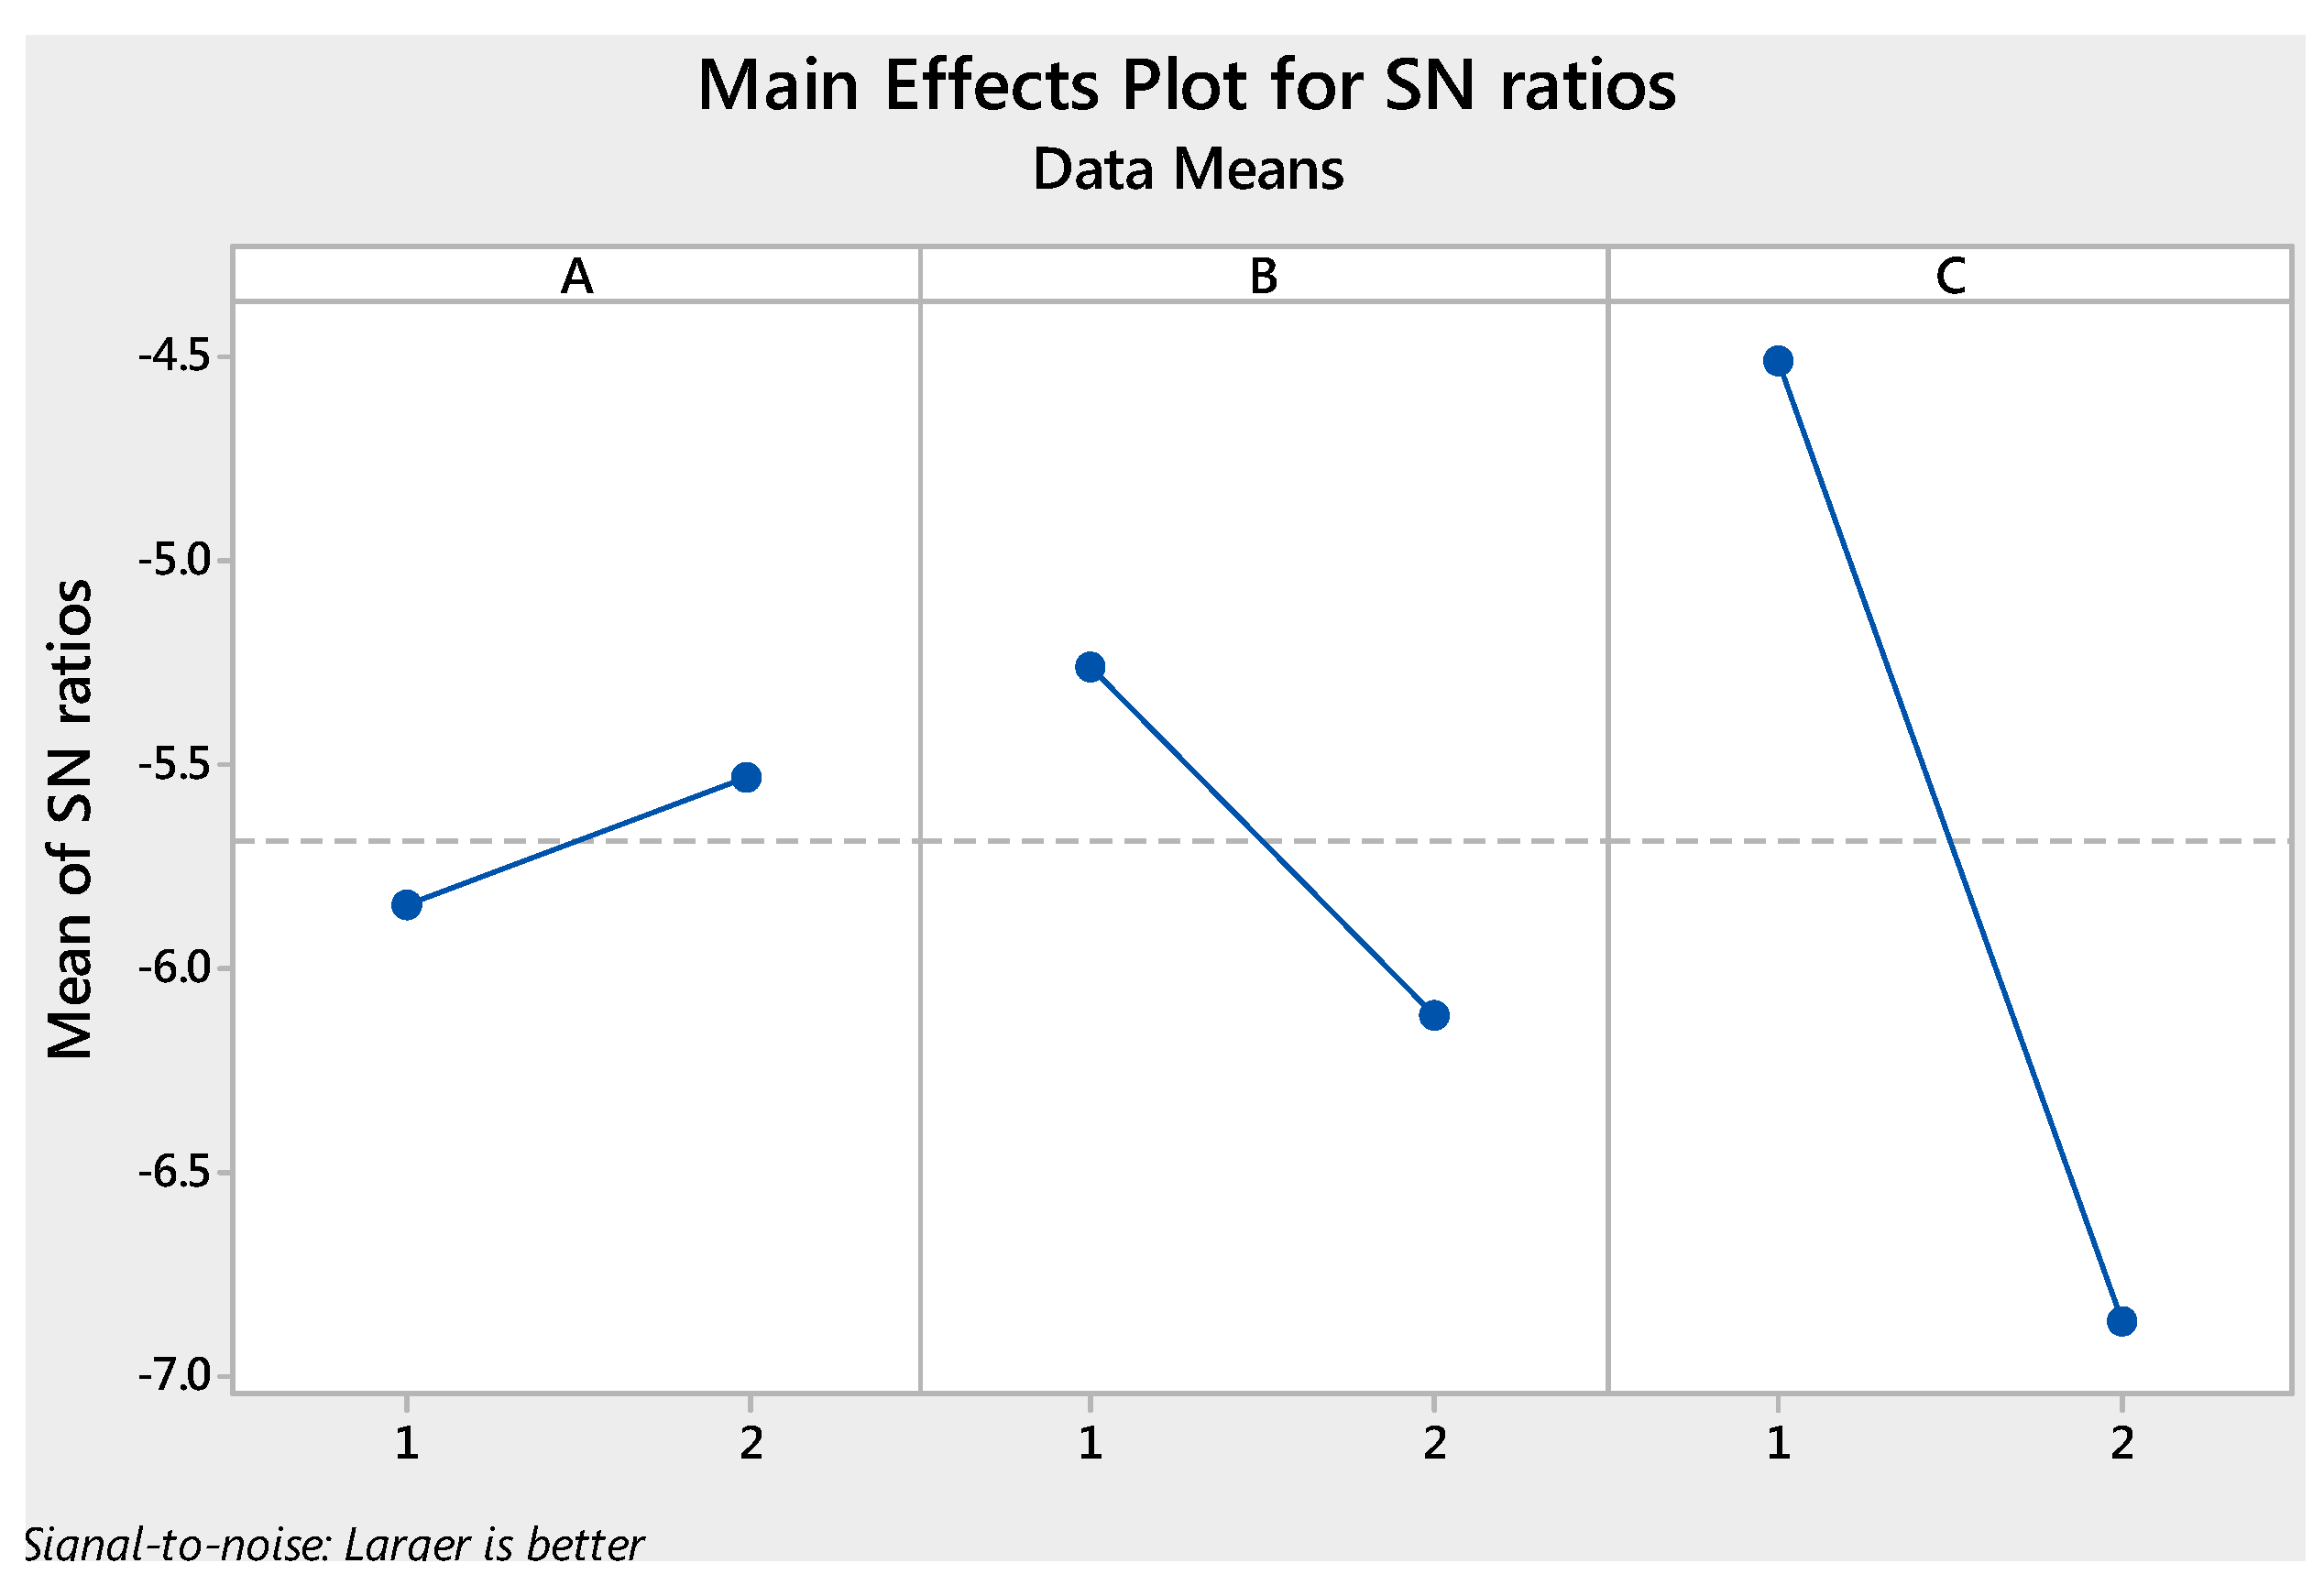
The data was analysed for S/N ratios using MiniTAB software. Table 5 shows the S/N ratios of all three response parameters. As per standard procedure, the level-wise mean of the S/N ratio is plotted to analyze the main effect. A combination of the levels of parameters giving highest value of S/N ratio gives the optimum setting.
The main effect plots for the three chosen responses, i.e., overcut, taper angle, and surface roughness are shown in Figure 4a–c respectively. It shows that the effect of all the process parameters on the three responses is different. The optimum setting for overcut was determined as A1B1C2; for taper angle, it was A2B1C2; and for roughness it was A1B1C2. The results of the analysis of variance performed at a confidence level of 95% showed that the factors A, B and C had a varied contribution to every individual response. For overcut, the contribution of A, B and C is 6%, 8%, and 76%, respectively; for taper angle, the contribution of A and C is 77% and 8.3%, respectively, while that of B is very small. However, the contribution of the interactions A × B and A × C was 3.9% and 1.4%, respectively. The contribution of A, B and C to roughness is 50.7%, 29.8% and 18.7%, respectively. These results provide some meaningful revelations as the two electrode materials are exotically different in terms of mechanical properties and consequently of wear behavior. It is clear that the contribution of capacitance is very large for taper angle and surface roughness, since the capacitance represents the total energy discharged in the electrode gap for an RC-based PES. At a high discharge energy, higher capacitance causes increased roughness. Moreover, at a higher discharge energy, the erosion rate of the brass electrode is considerably higher as compared to the tungsten electrode. This can be attributed to the lower melting point of the brass (930 °C) electrode in contrast to the tungsten (3370 °C) electrode, which possess a higher melting point. In fact, the difference in thermal conductivities of the two (119 and 180 W/m·K) electrodes is not very large. The higher erosion rate eventually results in a greater taper angle in the case of holes drilled with brass tools.
The analysis of individual single responses as evident from the main effect plots and the results of the analysis of variance given in the preceding paragraphs suggests that a final decision on the optimized process parameter setting cannot be obtained at this stage. This is because the effect of the parameters and their contributions to each response are very different. Consequently, multi-response optimization becomes very important. In multi-response analysis the S/N ratio data are further processed to consolidate all the three responses into a single multi-response parameter through Grey-PCA.

3.2. Grey Relational Analysis

A Taguchi-method-based, grey-relational, multi-performance optimization of micro-EDM maximizes machining quality as evaluated by overcut, taper angle and surface roughness. The absolute values of the S/N ratios of individual responses are varied and cannot be compared. Grey relational analysis generates [23] the linear normalization of S/N ratios in order to convert incomparable data into a comparable sequence in the range between zero and unity. The normalized S/N ratio xij for the ith performance characteristic in the jth experiment can be expressed as in Equation (5) [18]:
x i j = η i j min j η i j max j η i j min j η i j
According to GRA, the normalized S/N ratios of every response are converted between zero and one using Equation (5). The normalized values of the S/N ratios of all the responses are given in Table 6. This is further processed into the “Grey Relational Coefficient (GRC): ξij”, which for the ith performance characteristic in the jth experiment can be expressed as per Equation (6).
ξ i j = min i min j | x i o x i j | + ξ max i max j | x i o x i j | | x i o x i j | + ξ max i max j | x i o x i j |
where x i o is the normalized S/N ratio for ith response parameter and ξ is the distinguishing coefficient, which is defined in the range 0 ≤ ξ ≤ 1 and is usually taken as 0.5 [18].
The S/N ratios of each response parameter as converted into GRC (using Equation (6)) are still unique for individual responses, and can be transformed into a single, multi-response parameter. The GRCs for all the three responses are generated from the normalized sequence and the same is given in Table 6. All calculations for the Grey-PCA were done mathematically using Equations (5)–(11).
The GRCs (i.e., ξij) of individual responses are clubbed, in next step, into a single multi-response parameter by applying weightings to each GRC and subsequently adding them. The task of finding the weighting factors for the GRCs of the individual responses is performed through principal component analysis (PCA).

3.3. Principal Component Analysis

Pearson [24] initially proposed the PCA method and later Hotelling [25] developed this method into a useful statistical tool for analysis. The main essence of this method is that it is based on statistical technique and free from subjective judgment and preserves as much original information as possible. Various data processing steps involved with the PCA simplify a large number of correlated variables into fewer uncorrelated and independent principal components. Eventually, PCA evolved as a powerful analytical tool for the optimization of multi-response parameters [18]. The various steps involved in PCA are described in the following text [26]:
Step-1: For an experiment scheme of m number of experiments (in the present case it is eight) and n number of the response parameters (in present case it is three), the array of GRC: x, of each response parameter can be represented as in Equation (7):
x i ( j ) ,   i = 1 ,   2 , , m ;   j = 1 ,   2 , , n ; X = [ x 1 ( 1 ) x 1 ( 2 ) x 1 ( n ) x 2 ( 1 ) x 2 ( 2 ) x 2 ( n ) x m ( 1 ) x m ( 2 ) x m ( n ) ]
As a first step to PCA, the GRC array is processed to generate correlation coefficients (CCs). The CC array (Rji) is generated from the array of the GRC as per Equation (8). The CC array so generated is given in Table 7.
R j l = ( C o v ( x i ( j ) , x i ( l ) ) σ ( x i ) ( j ) × σ ( x i ) ( l ) ) , j = 1 , 2 , 3 , , n ; l = 1 , 2 , 3 , , n
where, in Cov (xi(j), xi(l)) is the covariance of sequences xi(j) and xi(l); σ ( x i ) ( j ) is the standard deviation of sequence xi(j); σ ( x i ) ( l ) is the standard deviation of sequence xi(l).
Step-2: The covariance array developed in Step-1 and as given Table 7 is further processed to find eigenvalues and eigenvectors. The eigenvalues and eigenvectors are determined from the CC array as per Equation (9):
( R λ k I m ) V i k = 0
where, R is the correlation matrix λ k , k = 1 n λ k = n ,   k = 1 , 2 , ,   n are eigenvalues; V i k = [ a k 1 ,   a k 2 ,   a k n ] T are eigenvectors corresponding to the eigenvalue λ k . The eigenvectors for principal components are given in Table 8.
Step-3: The eigenvectors, or principal components, determined in Step-2 are used to find a weighting to be multiplied with the GRC (i.e., ξij) of each response parameter. The uncorrelated principal component Ymk is formulated as per Equation (10):
Y m k = i = 1 n x m ( i ) V i k
where Ym1 is called the first principal component, Ym2 is called the second principal component and so on. The principal components estimated using Equation (10) are aligned in descending order with respect to variance, and therefore the first principal component i.e., Ym1 accounts for most variance in the GRC data. The square of the constituents of the principal component i.e., loading (denoted as wi) gives a weighting to the GRC of the corresponding response variable. The weightings or contributions of each response parameter to the multi-response parameter so calculated is given in Table 9.
The multiplication of weighting with the respective GRC (i.e., ξij) of each experiment integrates all three GRCs from each experiment into a single index known as grey relational grade (GRG). The overall evaluation of the multi-response parameter is based on the GRG denoted as γj. The GRGs so calculated are shown in Table 10.
γ j = i = 1 n w i ξ i j
where γj is the GRG for jth experiment, the weighting factor for the ith performance characteristic, and n is the number of performance characteristics. From a set of m experiments, in present case eight, the experiment with largest GRG gives the best multi-response parameter i.e., the experiment with largest GRG gives the process parameter setting which will give the optimized multi-response parameter.
These contributions (i.e., w1, w2 and w3) listed in Table 10 for three individual responses, namely overcut, taper angle and surface roughness, are indicated as 0.393199, 0.141748, and 0.465052 (giving a contribution of a single response i.e., overcut, taper angle and surface roughness on the multi-response as 39.23%, 14.28% and 46.5%, respectively). According to the performed experiment design, it can be clearly observed from Table 10 that the micro-EDM process parameter settings of experiment number six has the highest grey relation grade. Thus, the sixth experiment provides the best multi-response parameter among the eight experiments.
In accordance with the Taguchi method, the level-wise mean of the grey relation grade for each micro-EDM process parameter was calculated and is shown Table 11. It was calculated by taking the average of those values of GRG with the same levels of every process parameter. In this way, the average GRG for process parameter A at Level-1, process parameter A at Level-2, process parameter B at Level-1, process parameter B at Level-2 and so on are estimated. Figure 5 shows the mean values of GRG at different levels of each micro-EDM process parameter. The dashed line in this figure represents the magnitude of the total mean of the GRGs.
Evidently, the larger the value of GRG, the better the multiple-response parameter. As per response Table 11, A2, B1 and C1 provide the largest values of GRG for factors A, B and C, respectively. Therefore, A2, B1 and C1 are the condition for the optimal parameter combination of the micro-EDM process, i.e., capacitance at 455 pF, voltage 80 V and brass electrode. The mean of the GRG plot shown in Figure 5 also clearly represents the response of the micro-EDM process parameters on GRG. The level-wise GRG plot also depicts the variation in the multi-response when the process parameters change from level one to level three. When the values of the last column of Table 11 are compared, it is evident that the difference between the maximum and minimum values of GRG for factor C are the largest, followed by factors B and A. This specifies that the electrode material has the strongest effect on the multi-response parameter, followed by voltage and capacitance. This is especially true for the selected factors, which were varied in the selected range.
Figure 6 depicts the image obtained by scanning electron microscope (SEM) of the drilled hole on Ni-Ti SMA using the unoptimized parameters and optimized parameters. The optimized parameters showed good circularity, less overcut, and good surface finish.

4. Conclusions

A proper combination of input parameters is essential in micro-EDM in order to obtain the optimum values of different responses. As a consequence, this article has established a methodology for optimizing multiple attributes (overcut, taper angle and surface roughness) to improve the quality of micro-holes in Ni-Ti based alloy, using the Grey–Taguchi method. The following conclusions can be drawn from this investigation.
  • A Taguchi-based, grey-relational analysis coupled with principal component analysis (Grey PCA) methodology was implemented to investigate the effect of three important micro-EDM process parameters, including capacitance, voltage and electrode material.
  • The optimal combination of process parameter settings for individual responses revealed that for each response there was a different process parameter setting, thus, optimizing one response may perturb the other responses.
  • Hence, the analysis of individual single responses established the importance of multi-response optimization. It was evident from the main effects plot and ANOVA that the effect of the parameters and their contributions to each response was different. As a result, multi-response optimization became very important, where the S/N ratio data were further processed to consolidate all the three responses into a single multi-response parameter through Grey-PCA.
  • Three response parameters, i.e., overcut, taper angle and surface roughness, were combined into a single multi-response parameter called “grey relational grade or GRG” to arrive at the optimal input process parameter setting. As a result, the optimization of complicated multiple-performance characteristics can be simplified extensively through this approach.
  • The optimal combination of the micro-EDM process parameters obtained from the proposed method were A1B2C1, which resulted in the simultaneous optimization of all the three responses.
  • The proposed methodology provided a greatly simplified optimization design of micro-EDM process parameters with multi-response parameters.
  • Further, this study revealed that the electrode material had the strongest effect on the multi-response parameter, followed by the voltage and capacitance.
Responses such as residual stresses, micro-structural changes and the formation of recast layers will be studied in the machining of Ni-Ti shape memory alloy using micro-EDM. The authors also aim to improve the machining of shape memory alloys using vibration-assisted micro-EDM (i.e., through hybridization) in a future project.

Acknowledgments

The authors are grateful to the Deanship of Scientific Research, King Saud University for funding through Vice Deanship of Scientific Research Chairs.

Author Contributions

Mustufa Haider Abidi and Syed Hammad Mian wrote the paper, Abdulrahman Al-Ahmari designed the experiment, Arshad Noor Siddiquee analyzed the data, Muneer Khan Mohammed and Mohammed Sarvar Rasheed performed the experiments.

Conflicts of Interest

The authors declare no conflict of interest.

References

  1. Raju, L.; Hiremath, S.S. A state-of-the-art review on micro electro-discharge machining. Procedia Technol. 2016, 25, 1281–1288. [Google Scholar] [CrossRef]
  2. Chiou, A.-H.; Tsao, C.-C.; Hsu, C.-Y. A study of the machining characteristics of micro edm milling and its improvement by electrode coating. Int. J. Adv. Manuf. Technol. 2015, 78, 1857–1864. [Google Scholar] [CrossRef]
  3. Dong, S.; Wang, Z.; Wang, Y.; Liu, H. An experimental investigation of enhancement surface quality of micro-holes for be-cu alloys using micro-edm with multi-diameter electrode and different dielectrics. Procedia CIRP 2016, 42, 257–262. [Google Scholar] [CrossRef]
  4. Kunieda, M. Challenges to miniaturization in micro-edm. In Proceedings of the Annual Meeting, Portland, OR, USA, 19–24 October 2008. [Google Scholar]
  5. Kunieda, M. Electrical discharge machining processes. In Handbook of Manufacturing Engineering and Technology; Nee, A.Y.C., Ed.; Springer: London, UK, 2015. [Google Scholar]
  6. Sanchez, J.A.; López de Lacalle, L.N.; Lamikiz, A. A computer-aided system for the optimization of the accuracy of the wire electro-discharge machining process. Int. J. Comput. Integr. Manuf. 2004, 17, 413–420. [Google Scholar] [CrossRef]
  7. Kunieda, M.; Lauwers, B.; Rajurkar, K.P.; Schumacher, B.M. Advancing edm through fundamental insight into the process. CIRP Ann. 2005, 54, 64–87. [Google Scholar] [CrossRef]
  8. Rasheed, M.S.; Abidi, M.H.; El-Tamimi, A.M.; Al-Ahmari, A.M. Investigation of micro-edm input parameters on various outputs in machining ni-ti shape memory alloy using full factorial design. Adv. Mater. Res. 2013, 816–817, 173–179. [Google Scholar] [CrossRef]
  9. Pham, D.T.; Dimov, S.S.; Bigot, S.; Ivanov, A.; Popov, K. Micro-edm-recent developments and research issues. J. Mater. Process. Technol. 2004, 149, 50–57. [Google Scholar] [CrossRef]
  10. Jahan, M.P.; Wong, Y.S.; Rahman, M. A study on the fine-finish die-sinking micro-edm of tungsten carbide using different electrode materials. J. Mater. Process. Technol. 2009, 209, 3956–3967. [Google Scholar] [CrossRef]
  11. Liew, P.J.; Yan, J.; Kuriyagawa, T. Fabrication of deep micro-holes in reaction-bonded sic by ultrasonic cavitation assisted micro-edm. Int. J. Mach. Tools Manuf. 2014, 76, 13–20. [Google Scholar] [CrossRef]
  12. Sharma, N.; Raj, T.; Jangra, K. Applications of nickel-titanium alloy. J. Eng. Technol. 2015, 5, 1–7. [Google Scholar] [CrossRef]
  13. Zainal, M.; Sahlan, S.; Ali, M. Micromachined shape-memory-alloy microactuators and their application in biomedical devices. Micromachines 2015, 6, 879–901. [Google Scholar] [CrossRef]
  14. Hsieh, S.F.; Chen, S.L.; Lin, H.C.; Lin, M.H.; Chiou, S.Y. The machining characteristics and shape recovery ability of Ti-Ni-X (X = Zr, Cr) ternary shape memory alloys using the wire electro-discharge machining. Int. J. Mach. Tools Manuf. 2009, 49, 509–514. [Google Scholar] [CrossRef]
  15. Uppal, N.; Shiakolas, P.S. Micromachining characteristics of niti based shape memory alloy using femtosecond laser. J. Manuf. Sci. Eng. 2008, 130, 031117. [Google Scholar] [CrossRef]
  16. Kuppuswamy, R.; Yui, A. High-speed micromachining characteristics for the niti shape memory alloys. Int. J. Adv. Manuf. Technol. 2015, 93, 11–21. [Google Scholar] [CrossRef]
  17. Jahan, M.P.; Kakavand, P.; Alavi, F. A comparative study on micro-electro-discharge-machined surface characteristics of Ni-Ti and Ti-6Al-4V with respect to biocompatibility. Procedia Manuf. 2017, 10, 232–242. [Google Scholar] [CrossRef]
  18. Siddiquee, A.N.; Khan, Z.A.; Mallick, Z. Grey relational analysis coupled with principal component analysis for optimisation design of the process parameters in in-feed centreless cylindrical grinding. Int. J. Adv. Manuf. Technol. 2010, 46, 983–992. [Google Scholar] [CrossRef]
  19. Chiang, K.-T. The optimal process conditions of an injection-molded thermoplastic part with a thin shell feature using grey-fuzzy logic: A case study on machining the pc/abs cell phone shell. Mater. Des. 2007, 28, 1851–1860. [Google Scholar] [CrossRef]
  20. Chiang, K.-T.; Chang, F.-P. Optimization of the wedm process of particle-reinforced material with multiple performance characteristics using grey relational analysis. J. Mater. Process. Technol. 2006, 180, 96–101. [Google Scholar] [CrossRef]
  21. Palanikumar, K.; Karunamoorthy, L.; Karthikeyan, R. Multiple performance optimization of machining parameters on the machining of gfrp composites using carbide (K10) tool. Mater. Manuf. Process. 2006, 21, 846–852. [Google Scholar] [CrossRef]
  22. Lin, C.L. Use of the taguchi method and grey relational analysis to optimize turning operations with multiple performance characteristics. Mater. Manuf. Process. 2004, 19, 209–220. [Google Scholar] [CrossRef]
  23. Ju-Long, D. Control problems of grey systems. Syst. Control Lett. 1982, 1, 288–294. [Google Scholar] [CrossRef]
  24. Pearson, K. Liii. On lines and planes of closest fit to systems of points in space. Philos. Mag. 1901, 2, 559–572. [Google Scholar] [CrossRef]
  25. Hotelling, H. Analysis of a complex of statistical variables into principal components. J. Educ. Psychol. 1933, 24, 417–441. [Google Scholar] [CrossRef]
  26. Fung, C.-P.; Kang, P.-C. Multi-response optimization in friction properties of pbt composites using taguchi method and principle component analysis. J. Mater. Process. Technol. 2005, 170, 602–610. [Google Scholar] [CrossRef]
Figure 1. (a) Tabletop type micro-electric discharge machining (micro-EDM) used in the investigation; (b) resistor capacitor (RC) circuit of the power source.
Metals 07 00486 g001
Figure 2. Scanning electron microscope (SEM) image of hole cut at edge to measure surface roughness: (a) using unoptimized parameters; (b) using optimized parameters.
Metals 07 00486 g002
Figure 3. Surface roughness measurement using Talysurf CCI-6000, (a) Optical View; (b) Surface Roughness Analysis.
Metals 07 00486 g003
Figure 4. Main effect plots: (a) for overcut; (b) for taper angle; (c) for surface roughness.
Metals 07 00486 g004aMetals 07 00486 g004b
Figure 5. Level-wise response of the Grey relational grade.
Metals 07 00486 g005
Figure 6. SEM image of hole drilled on Ni-Ti SMA: (a) using unoptimized parameters; (b) using optimized parameters.
Metals 07 00486 g006
Table 1. Specimen material properties.
Work Piece MaterialNi-Ti SMA
CompositionNi: 55.8%, Ti: 44.2%, C < 0.02%
Density (kg/m3)6500
Melting Point (°C)1310
Electrical Resistivity (µΩ·m)820
Modulus of Elasticity (Mpa)41–75 × 103
Coefficient of Thermal Expansion (/°C)11 × 10−6
Ultimate Tensile Strength (Mpa)1070
Total Elongation (%)10
Table 2. Properties of tool materials.
Tool MaterialTungsten (Super FSK)Brass (C2680)
CompositionW > 99.99%Cu:64–68%, Pb: < 0.05%, Zn: 36–32%
Density (kg/m3)19,3008400
Melting Point (°C)3370930
Coefficient of Thermal Expansion (/°C)4.6 × 10−618.7 × 10⁻⁶
Thermal Conductivity (W/m·K)180119
Table 3. Process parameters and range of parameters.
ParametersSymbolTypeUnitsLevel-1Level-2
CapacitanceANumericpF155475
Discharge VoltageBNumericV80100
Electrode MaterialCCategorical-BrassTungsten
Table 4. Experiment scheme and responses.
Experiment No.Process ParametersResponses
Capacitance (A)Discharge Voltage (B)Electrode Material (C)Overcut (µm)Taper Angle (o)Surface Roughness (Ra in µm)
11117.84631.85040.0986
21125.80221.36250.0882
31219.19841.75790.1106
41226.79861.96580.1013
52118.47981.11400.1157
62126.74080.94990.1053
72219.31441.14040.1378
82227.06280.77890.1194
Standard Deviation1.2650.4440.015
Table 5. Signal to Noise (S/N) ratios for the lower-the-better characteristics of all three responses.
Experiment No.Process ParametersSignal to Noise (S/N) Ratios for Individual Responses
ABCOvercutTaper AngleSurface Roughness
1111−17.8933−5.3453020.1223
2112−15.2719−2.6866821.0847
3121−19.2742−4.9000019.1267
4122−16.6483−5.8707419.8875
5211−18.5677−0.9378518.7328
6212−16.97960.4459919.5536
7221−19.3831−1.1411517.2182
8222−16.57432.1696318.4631
Table 6. Normalized sequences of S/N ratios and Grey relation coefficients.
Experiment No.Normalized SequencesGrey Relation Coefficients
Overcut (X)Taper Angle (Y)Surface Roughness (Z)For XFor YFor Z
10.58200.90280.20810.46210.35640.7061
20.00000.49170.00000.46210.35640.7061
30.96700.82490.45050.34080.37740.5260
40.28371.00000.26260.63800.33330.6556
50.76240.28230.55350.39600.63910.4746
60.26720.14410.34340.65170.77630.5928
71.00000.30451.00000.33330.62150.3333
80.35890.00000.62830.58211.00000.4432
Table 7. Array of covariance sequences derived from Grey relation coefficients.
Experiment No.Covariance Sequences
X-XX-YX-ZY-YY-ZZ-Z
111.588613.971212.703416.843615.315213.9255
211.588613.971212.703416.843615.315213.9255
312.429014.395013.790916.671915.972315.3021
410.421913.323812.210017.033715.609914.3050
512.042513.261113.753314.603115.145115.7072
610.333811.843412.360313.573414.165814.7841
712.481913.563314.501114.738415.757416.8469
810.785911.365013.119211.975313.823715.9574
Table 8. Eigenvectors for principal components.
Response ParameterEigenvector
First Principal ComponentSecond Principal ComponentThird Principal Component
Overcut (X)0.627056−0.1512540.764149
Taper angle (Y)0.376495−0.799933−0.467287
Surface roughness (Z)0.6819470.580714−0.444656
Table 9. Contribution of individual response to multi-response parameters.
Individual Response ParameterContribution and Weightage to Multi-Response Parameter
WeightageContribution
Overcut0.39319939.32%
Taper angle0.14174814.28%
Surface roughness0.46505246.50%
Table 10. Contribution of individual response to multi-response parameters.
Experiment No.Grey Relational GradeOrder or Rank
10.5606154
20.5606155
30.4321487
40.6030192
50.4670476
60.6419731
70.3741778
80.5767293
Table 11. Response table for signal-to-noise ratios and Grey relational grade.
SymbolParameterLevel-1Level-2Max-Min.
ACapacitance−5.849−5.5300.318
BVoltage−5.265−6.1140.849
CElectrode Material−4.513−6.8662.354