Effects of Phase Evolution on Mechanical Properties of Laser-Welded Ferritic Fe-Al-Mn-C Steel


1
Welding and Joining Research Group, Korea Institute of Industrial Technology, 7-47, Songdodong, Yeonsugu, Incheon 21999, Korea
2
Materials Science and Engineering Department, Seoul National University, Seoul 08826, Korea
*
Author to whom correspondence should be addressed.
Metals 2017, 7(12), 523; https://doi.org/10.3390/met7120523
Submission received: 30 September 2017
/
Revised: 22 November 2017
/
Accepted: 22 November 2017
/
Published: 24 November 2017
(This article belongs to the Special Issue Medium-Mn Steels, a Promising Type of the 3rd Generation Steels)
Abstract
:In the present study, the evolution of microstructure in laser-welded joints of ferrite-based dual-phase Fe-Al-Mn-C steel sheets was analyzed and its effect on the mechanical properties of the joints was investigated. Laser welding was performed using different powers and welding speeds to attain different heat inputs. Electron backscatter diffraction (EBSD) examinations and hardness measurements were used to characterize the microstructure of the welds. The tensile properties were found to depend on the heat input, but joint strength exceeding that of the base metal (BM) were obtained at low heat inputs. However, the fracture location shifted from the base metal to the heat-affected zone (HAZ) as the heat input was increased. The HAZ consisted of a mixture of austenite, ferrite and martensite, and its width increased with increasing the heat input. It was supposed that the incompatibility between the ferrite, austenite and martensite phases led to early void formation and fracturing of the phase interfaces in the wide HAZ.
1. Introduction
Diverse types of high-strength and high-performance steels have been proposed with the aim of reducing the weight of automobile bodies. As a result, highly deformable high-strength steels such as transformation-induced-plasticity (TRIP) steels and twinning-induced-plasticity (TWIP) steels have been developed [1,2,3,4,5,6,7,8]. Recently, a ferrite-based lightweight steel, namely, Fe-Al-Mn-C steel, which exhibits transformation-induced hardening during deformation, was announced [9,10,11,12].
Ferrite-based lightweight steel contains the alloying elements Mn, Al, and C. These elements expand the lattice of the steel while reducing its density by virtue of their low atomic masses [6]. Mn and C promote the formation of an austenitic phase because they act as austenite stabilizers. On the other hand, Al, a ferrite stabilizer, helps to form a duplex structure at high temperatures, consisting of ferrite and austenite phases, and promotes the precipitation of the κ-carbides (Fe,Mn)3-Al-C and the formation of a perovskite structure during cooling [7,13,14,15]. Seol et al. [13] found direct evidence for the precipitation of κ-carbides and could confirm the structure and chemical composition of the steel using transmission electron microscopy and atomic probe tomography [13]. Fine and coarse κ-carbide particles are known to enhance the yield and tensile strengths of austenite-based lightweight steels, owing to their precipitation of hardening [16,17,18,19]. However, ferrite-based steels show poor mechanical properties during hot- and cold-rolling [20,21,22].
Stress- or strain-induced transformations lead to additional plasticity. The critical behavior of multiphase steels depends on the mechanical stability and properties of each phase [23,24,25,26]. During deformation, the softer phase yields first and, after the appropriate degree of work hardening, a suitable amount of stress is transferred to the harder regions. Thus, the distribution of the plastic strain is irregular. Ryu et al. [27] examined the deformation behavior of a Fe-5.8 wt % Mn-3.1 wt % Al-0.47 wt % Si-0.12 wt % C alloy. They reported that preferential straining occurred in the coarse ferrite matrix during tensile deformation. Seo et al. [9] investigated the deformation behavior of a Fe-3.5 wt % Mn-5.9 wt % Al-0.4 wt % C alloy and found that most of the deformation was accommodated by the ferrite phase, while the clustered austenite particles underwent a strain-induced martensitic transformation. This also resulted in the buildup of strain along the ferrite/austenite interphase boundaries. Further, fracture was initiated either by the formation of voids in the ferrite grains surrounded by the clustered austenite particles, or the cracking of the hard-phase particles.
Laser welding is a low-heat-input assembly process used in automotive manufacturing wherein the joint is formed by melting with a high-density laser beam and the subsequent solidification. The process is performed at high speed under low-heat-input conditions, such that the thermal history of the welds can be changed rapidly. The cooling is very rapid in the laser welding process, in contrast to conventional arc welding [28]. Thus, a fully martensitic microstructure readily evolves in the fusion zone (FZ) of the advanced high-strength steels used in automotive applications.
The weldabilities of TRIP steels has already been investigated. Jung et al. [29] evaluated the spot welding of a ferrite-based steel containing 0.3–0.4 wt % C and 3.5–5.6 wt % Al. They found that the fusion zone consisted of δ-ferrite with a dendrite-like morphology and martensite. They also reported that the microstructure and hardness distribution of the welds depended on the amount of heat input. To enable a prediction of the effect of the heat input on the microstructure and mechanical properties of joints in a 0.35 wt % C-3.5 wt % Mn-5.8 wt % Al lightweight steel, Sohn et al. [10] evaluated the effect of the annealing temperature on the microstructural evolution and tensile properties of the steel. Choi et al. [30] performed simulations of the kinetics and controlled solidification of similar steels while Park et al. [31] proposed a tempering approach as a means of understanding the effects of heat treatments on such steels.
In the present study, we investigated the laser welding characteristics of a ferrite-based lightweight Fe-0.35 wt % C-3.5 wt % Mn-5.8 wt % Al steel. We performed laser welding on sheets of the steel using a disk laser, and analyzed the effects of the resulting morphological changes on the mechanical strength and fracture mode of the welds. In particular, since the structural complexity of welds affects their mechanical properties, we focused on the heat-affected zone (HAZ), owing to its morphological complexity. During the tensile tests, the fracture location shifted from the base metal (BM) to the HAZ with an increase in the heat input. To elucidate the reason for the failure occurring in the HAZ, the failure surface was analyzed, and the morphological evolution of the welds was examined.
2. Experimental Procedure
The chemical composition of the steel sheets used in the present study, which had a thickness of 1.0 mm, is given in Table 1. The main alloying elements were Mn, Al, and C, and the steel consisted of ferrite and austenite phases [10]. Bead-on-plate welding was performed using a Yb:YAG laser. The beam was delivered through an optical fiber with a diameter of 200 µm and an optics system with a focal length of 450 mm. The measured beam diameter at the focal position was 0.6 mm. The laser beam was irradiated perpendicularly on the specimen, and no shielding gas was used. The laser power (P) and welding speed (WS) were chosen to ensure a full penetration bead. The welding conditions are listed in Table 2.
The welded specimens were polished and etched in a 5% nital solution, and the microstructures along the planes transverse and normal to the sheet surface were observed using optical microscopy (Olympus, Shinjuku, Tokyo, Japan) and a field-emission scanning electron microscopy (FE-SEM). Electron backscatter diffraction (JEOL, Akishima, Tokyo, Japan) analysis was performed using a FE-SEM (FEI company, Hillsboro, OR, USA) system. The EBSD specimens were mechanically polished and then electropolished at room temperature in a solution of 10% perchloric acid and ethanol at an operating voltage of 24 V. The critical misorientation angle was set to 10° for grain identification. The data were interpreted using orientation imaging microscopy analysis software.
The tensile test specimens were obtained from the bead-on-plate welded specimens. The tensile test specimens were machined based on the ASTM E8 standards and had a gage length of 50 mm and a gage width of 12.5 mm. To evaluate the local tensile behavior of the weld zone, the digital image correlation (DIC) technique was used in the local strain fields. DIC is a non-contact optical technique that can be used for analyzing full-field two-dimensional or three-dimensional surface deformation. To assess the local strain behavior, a DIC system connected to the tensile testing machine was used. The DIC specimens had a gage length of 25 mm and gage width of 6 mm. The Vickers hardness values of the full weldments were measured under a load of 0.98 N with a hold time of 10 s. The measurements were performed both before and after the tensile tests. The mechanical properties of the microstructural constituent were measured by nanoindentation.
3. Results and Discussion
3.1. Tensile Properties of Laser Welds
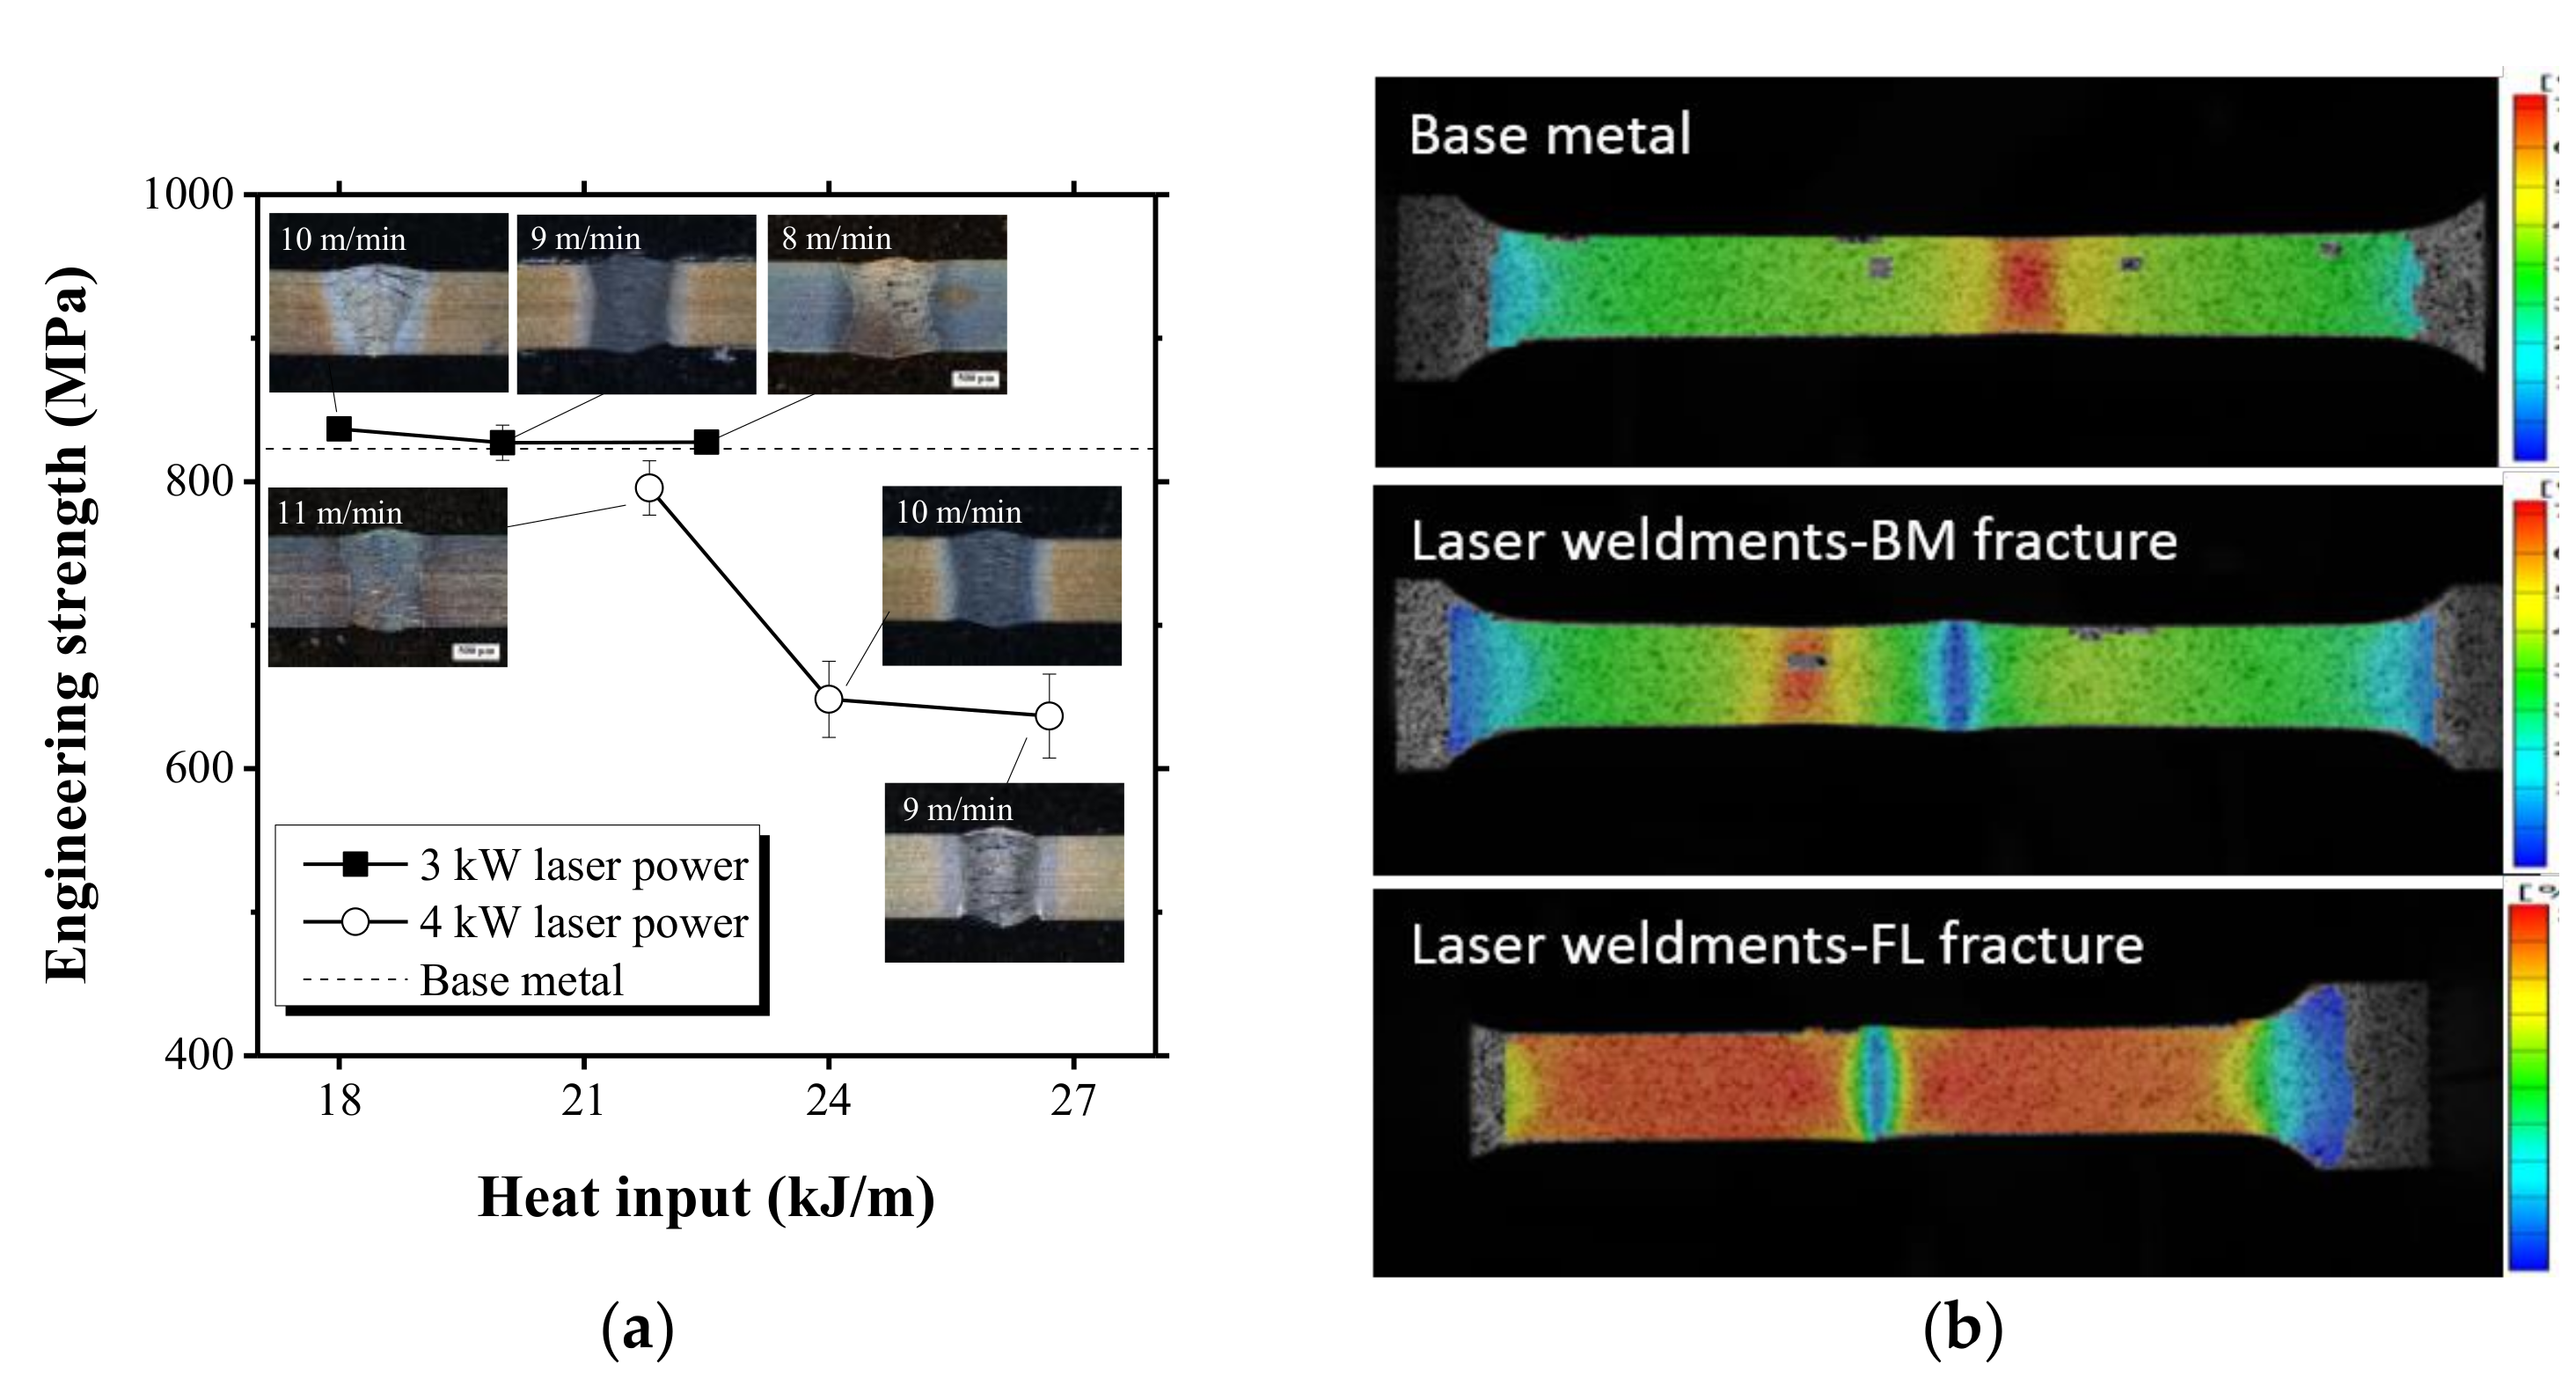
Figure 1a shows the results of the tensile tests performed on the welds formed using a range of laser powers and welding speeds. Three specimens were prepared for each condition and the tensile strength of three samples of each specimen was measured. To allow for a comparison of the strengths of the samples before and after welding, the strength of the BM is indicated in Figure 1a by a dotted line. The strengths of the specimens subjected to heat inputs of less than 22.5 kJ/m were similar to that of the BM. For those specimens subjected to a heat input in excess of 22.5 kJ/m, the strengths were at least 25% lower than that of the BM. Figure 1b shows the principal strain map images of deformed specimens immediately before the start of the fracture. The fusion zone was not stretched during the tensile test. Necking occurred, followed by rupturing of the base metal in the case of the specimen subjected to a heat input of less than 22.5 kJ/m. However, the necking phenomenon was not observed in the DIC results of the specimen fabricated using a higher heat input. This is described in greater detail in Figure 8. All the specimens ruptured at the fusion line.
Figure 2 shows cross-sectional images of a specimen that fractured in the HAZ. The images were obtained along the transverse and normal directions, respectively. In Figure 2b,c, the white dashed line indicates the fusion line. In the sample shown in Figure 2b,c, the sectional image was obtained along the normal direction, and the crack initiated in the HAZ and propagated through the coarse ferrite matrix.
In the present study, we performed laser welding on sheets of a ferrite-based lightweight steel containing high concentrations of Mn, Al, and C. Further, the steel consisted of dual phases with different mechanical properties and underwent work hardening during deformation [9,32]. Therefore, there could be three reasons for the fracturing that occurred in the HAZ. The first is stress concentration due to the presence of precipitates such as carbides, and a secondary phase. As mentioned previously, in steels with a high Mn content, precipitates (κ-carbides) form at the grain boundaries, resulting in brittle fractures. Second, failure can occur when the substrate cannot accommodate the deformation that occurs during a tensile test. As stated, each of the phases would exhibit a different deformation resistance and work-hardening mechanism. In particular, the phase distribution of the welds would be complex and non-homogeneous as a result of the rapid heating and cooling. This means that the phases constituting the welds would elongate differently during the tensile test. The BM initially consisted of austenite and ferrite phases, which can be transformed into each other based on the thermal history. Therefore, the incompatibility of the phases may also be a reason for the fracture which occurred in the HAZ. Third, softening caused by grain growth or, hardening resulting from phase transformation can occur during welding.
3.2. Confirmation of Segregation of Carbides and Secondary Phase at Failure Surface
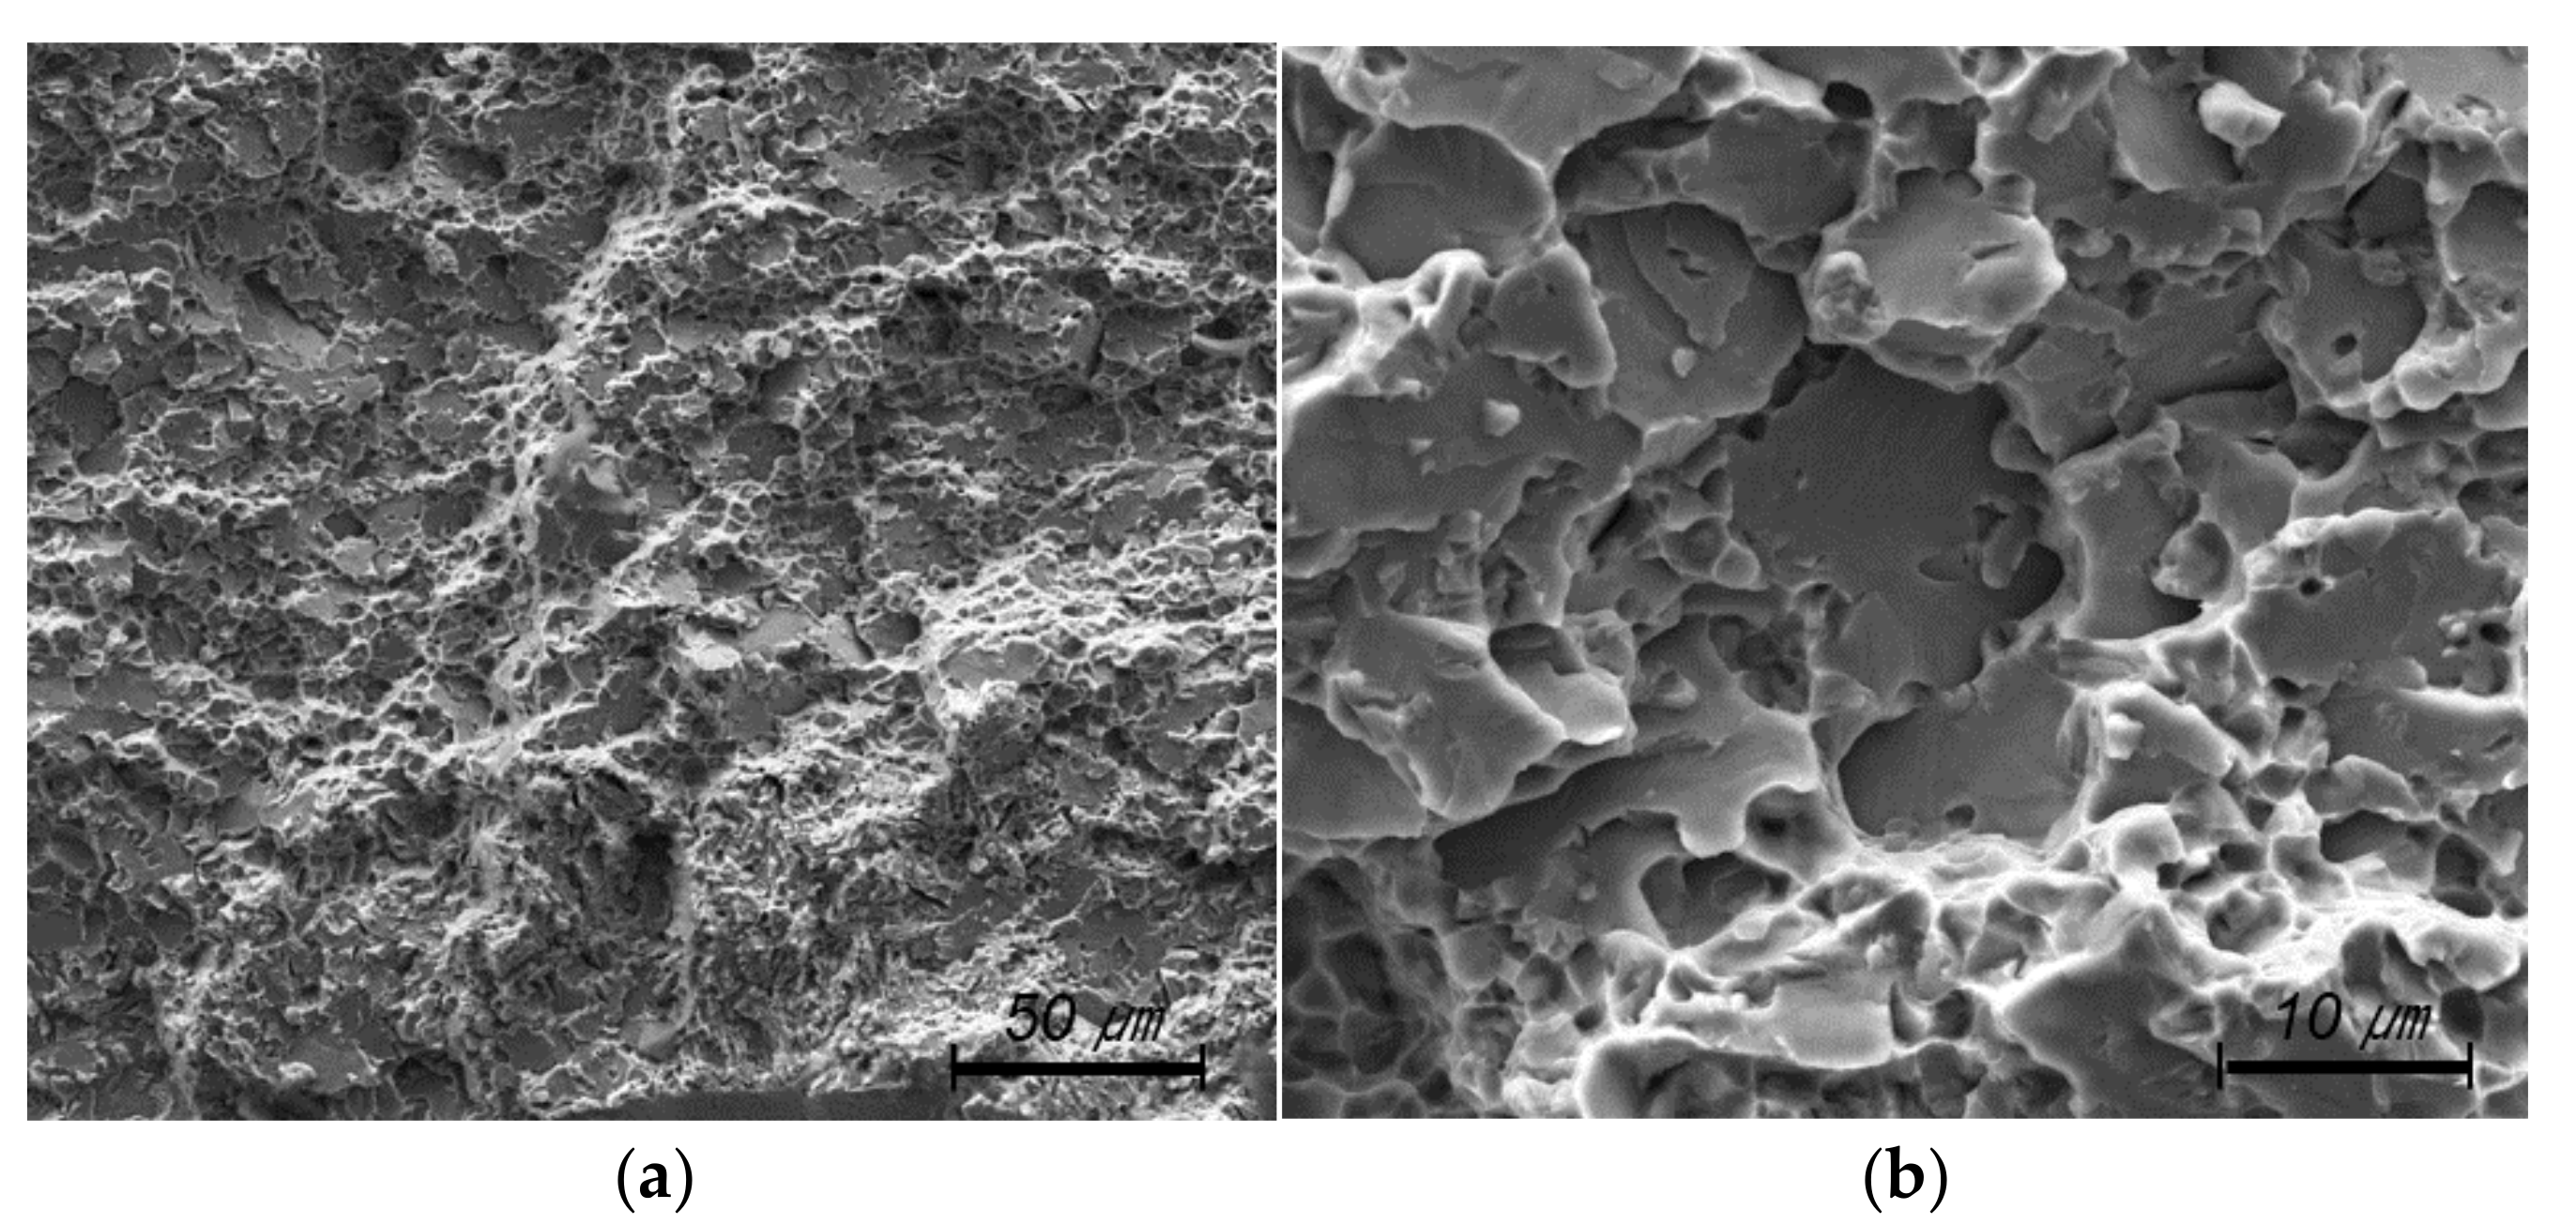
Figure 3 shows the results of SEM observations of the fracture surface of the HAZ failure specimen. The specimen exhibits a typical brittle fracture surface. While cleavage can be seen, no dimples are present. To confirm whether carbide or secondary phase particles were formed on the surface, the fracture surface was analyzed using an electron probe microanalyzer. However, the results did not indicate the presence of carbide or secondary phase particles at the surface.
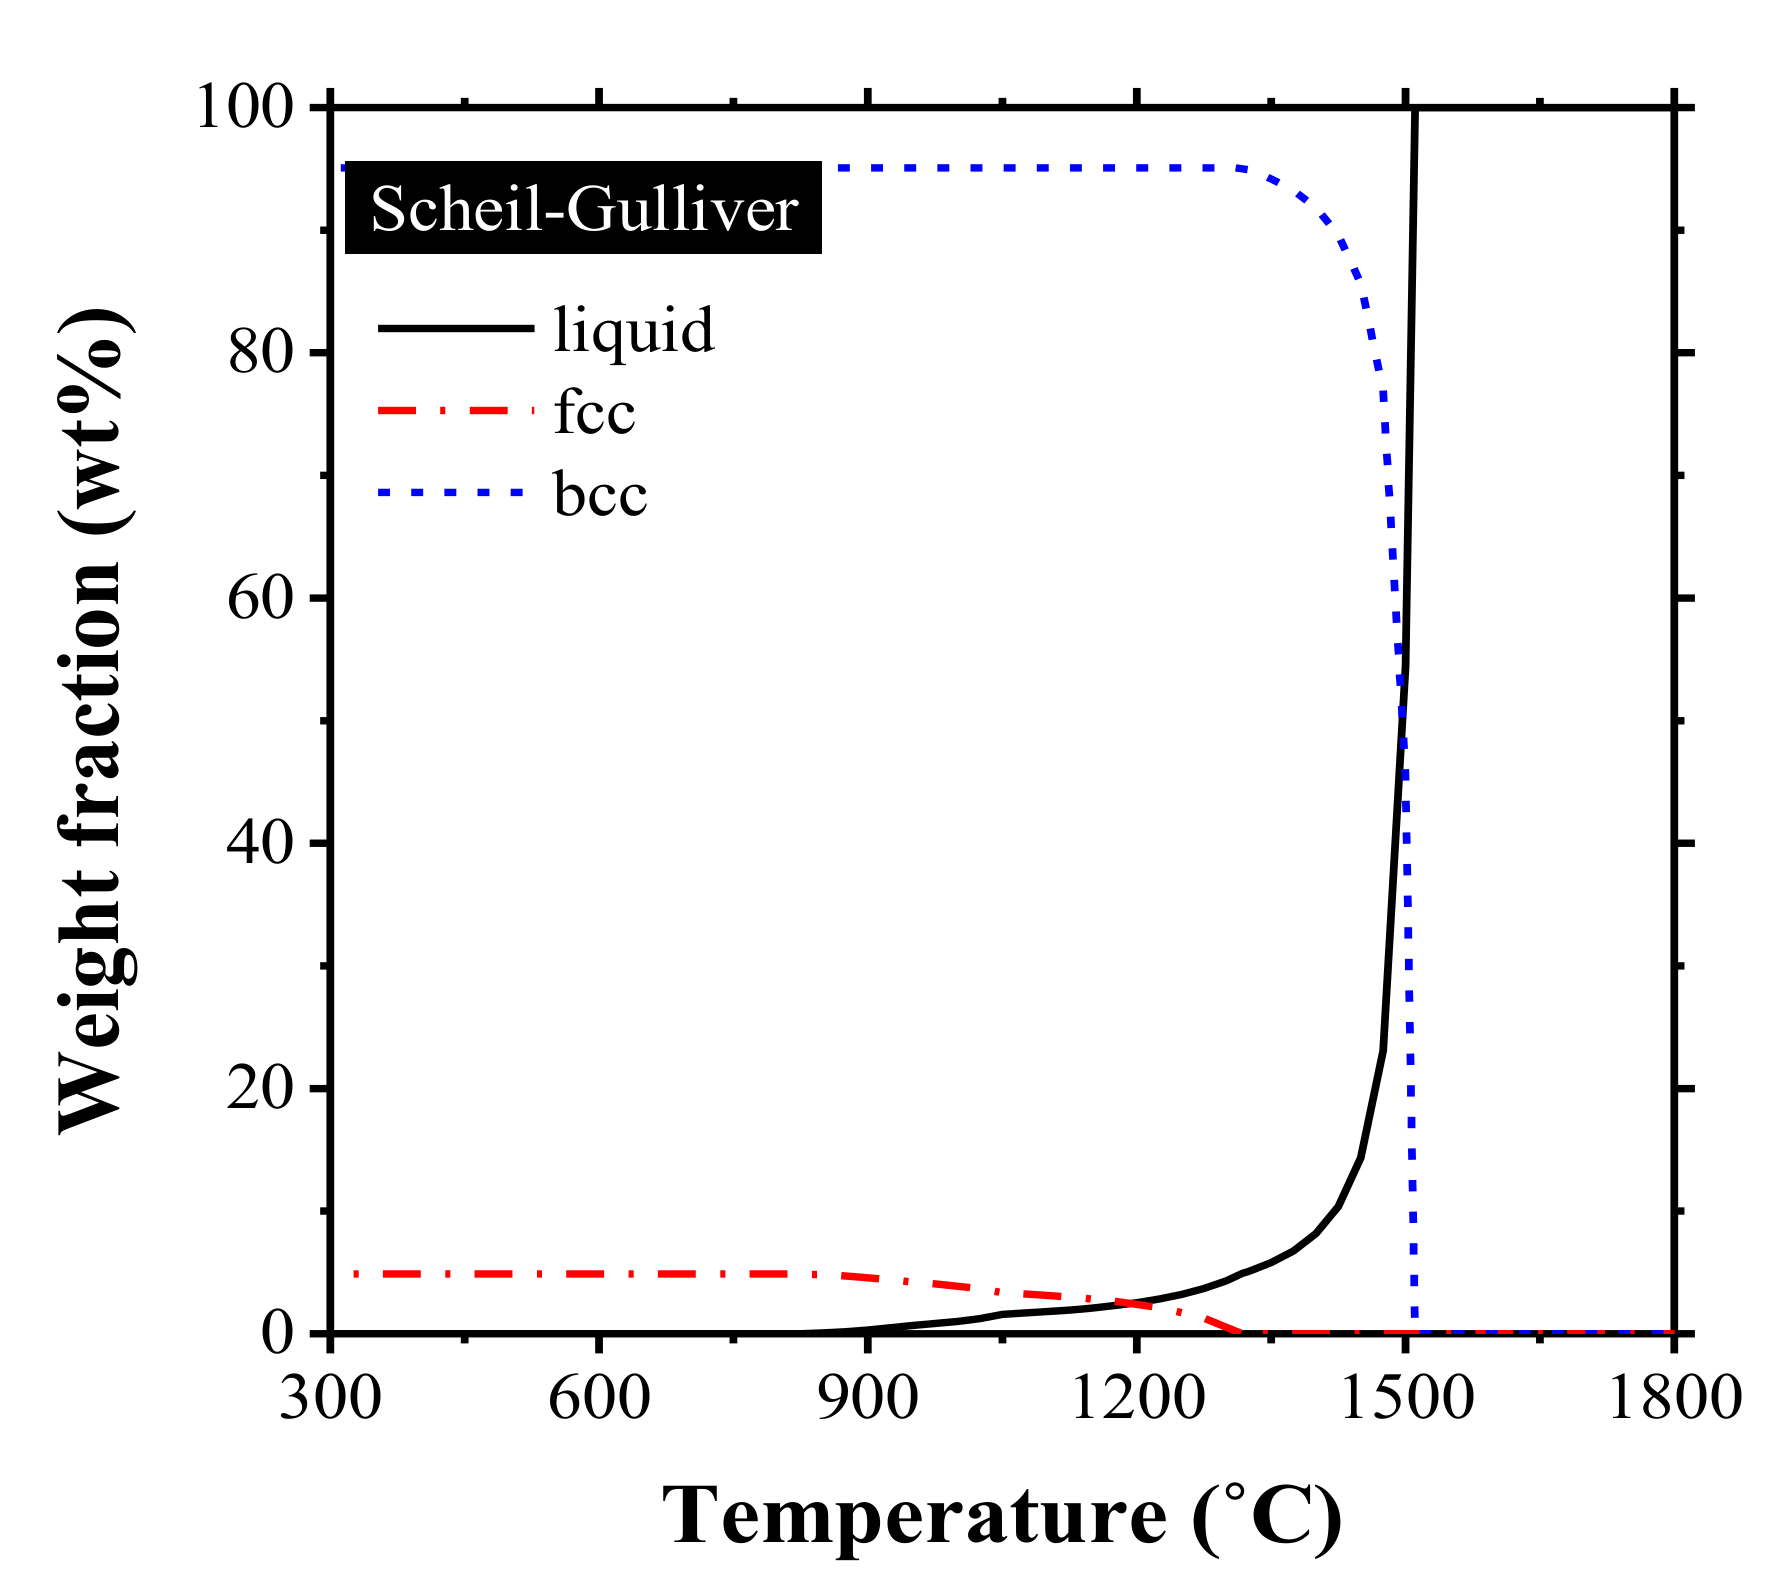
The fraction of the phases formed during the cooling process was determined by thermodynamic calculations. The commercial FactSAGE™ 7.0 software (FactSage, Montreal, QC, Canada) was used for the calculations. To simulate the cooling process, simulations were performed under the Scheil–Gulliver [33,34] condition, as shown in Figure 4. The results showed that κ-carbides were not formed and that this was the case even at low temperatures. These results were in good agreement with those obtained experimentally. Thus, strength degradation based on the formation of precipitates can be excluded as a probable reason for the fracturing which occurred in the HAZ.
3.3. Effect of Microstructure and Its Incompatibility on Fracture Behavior
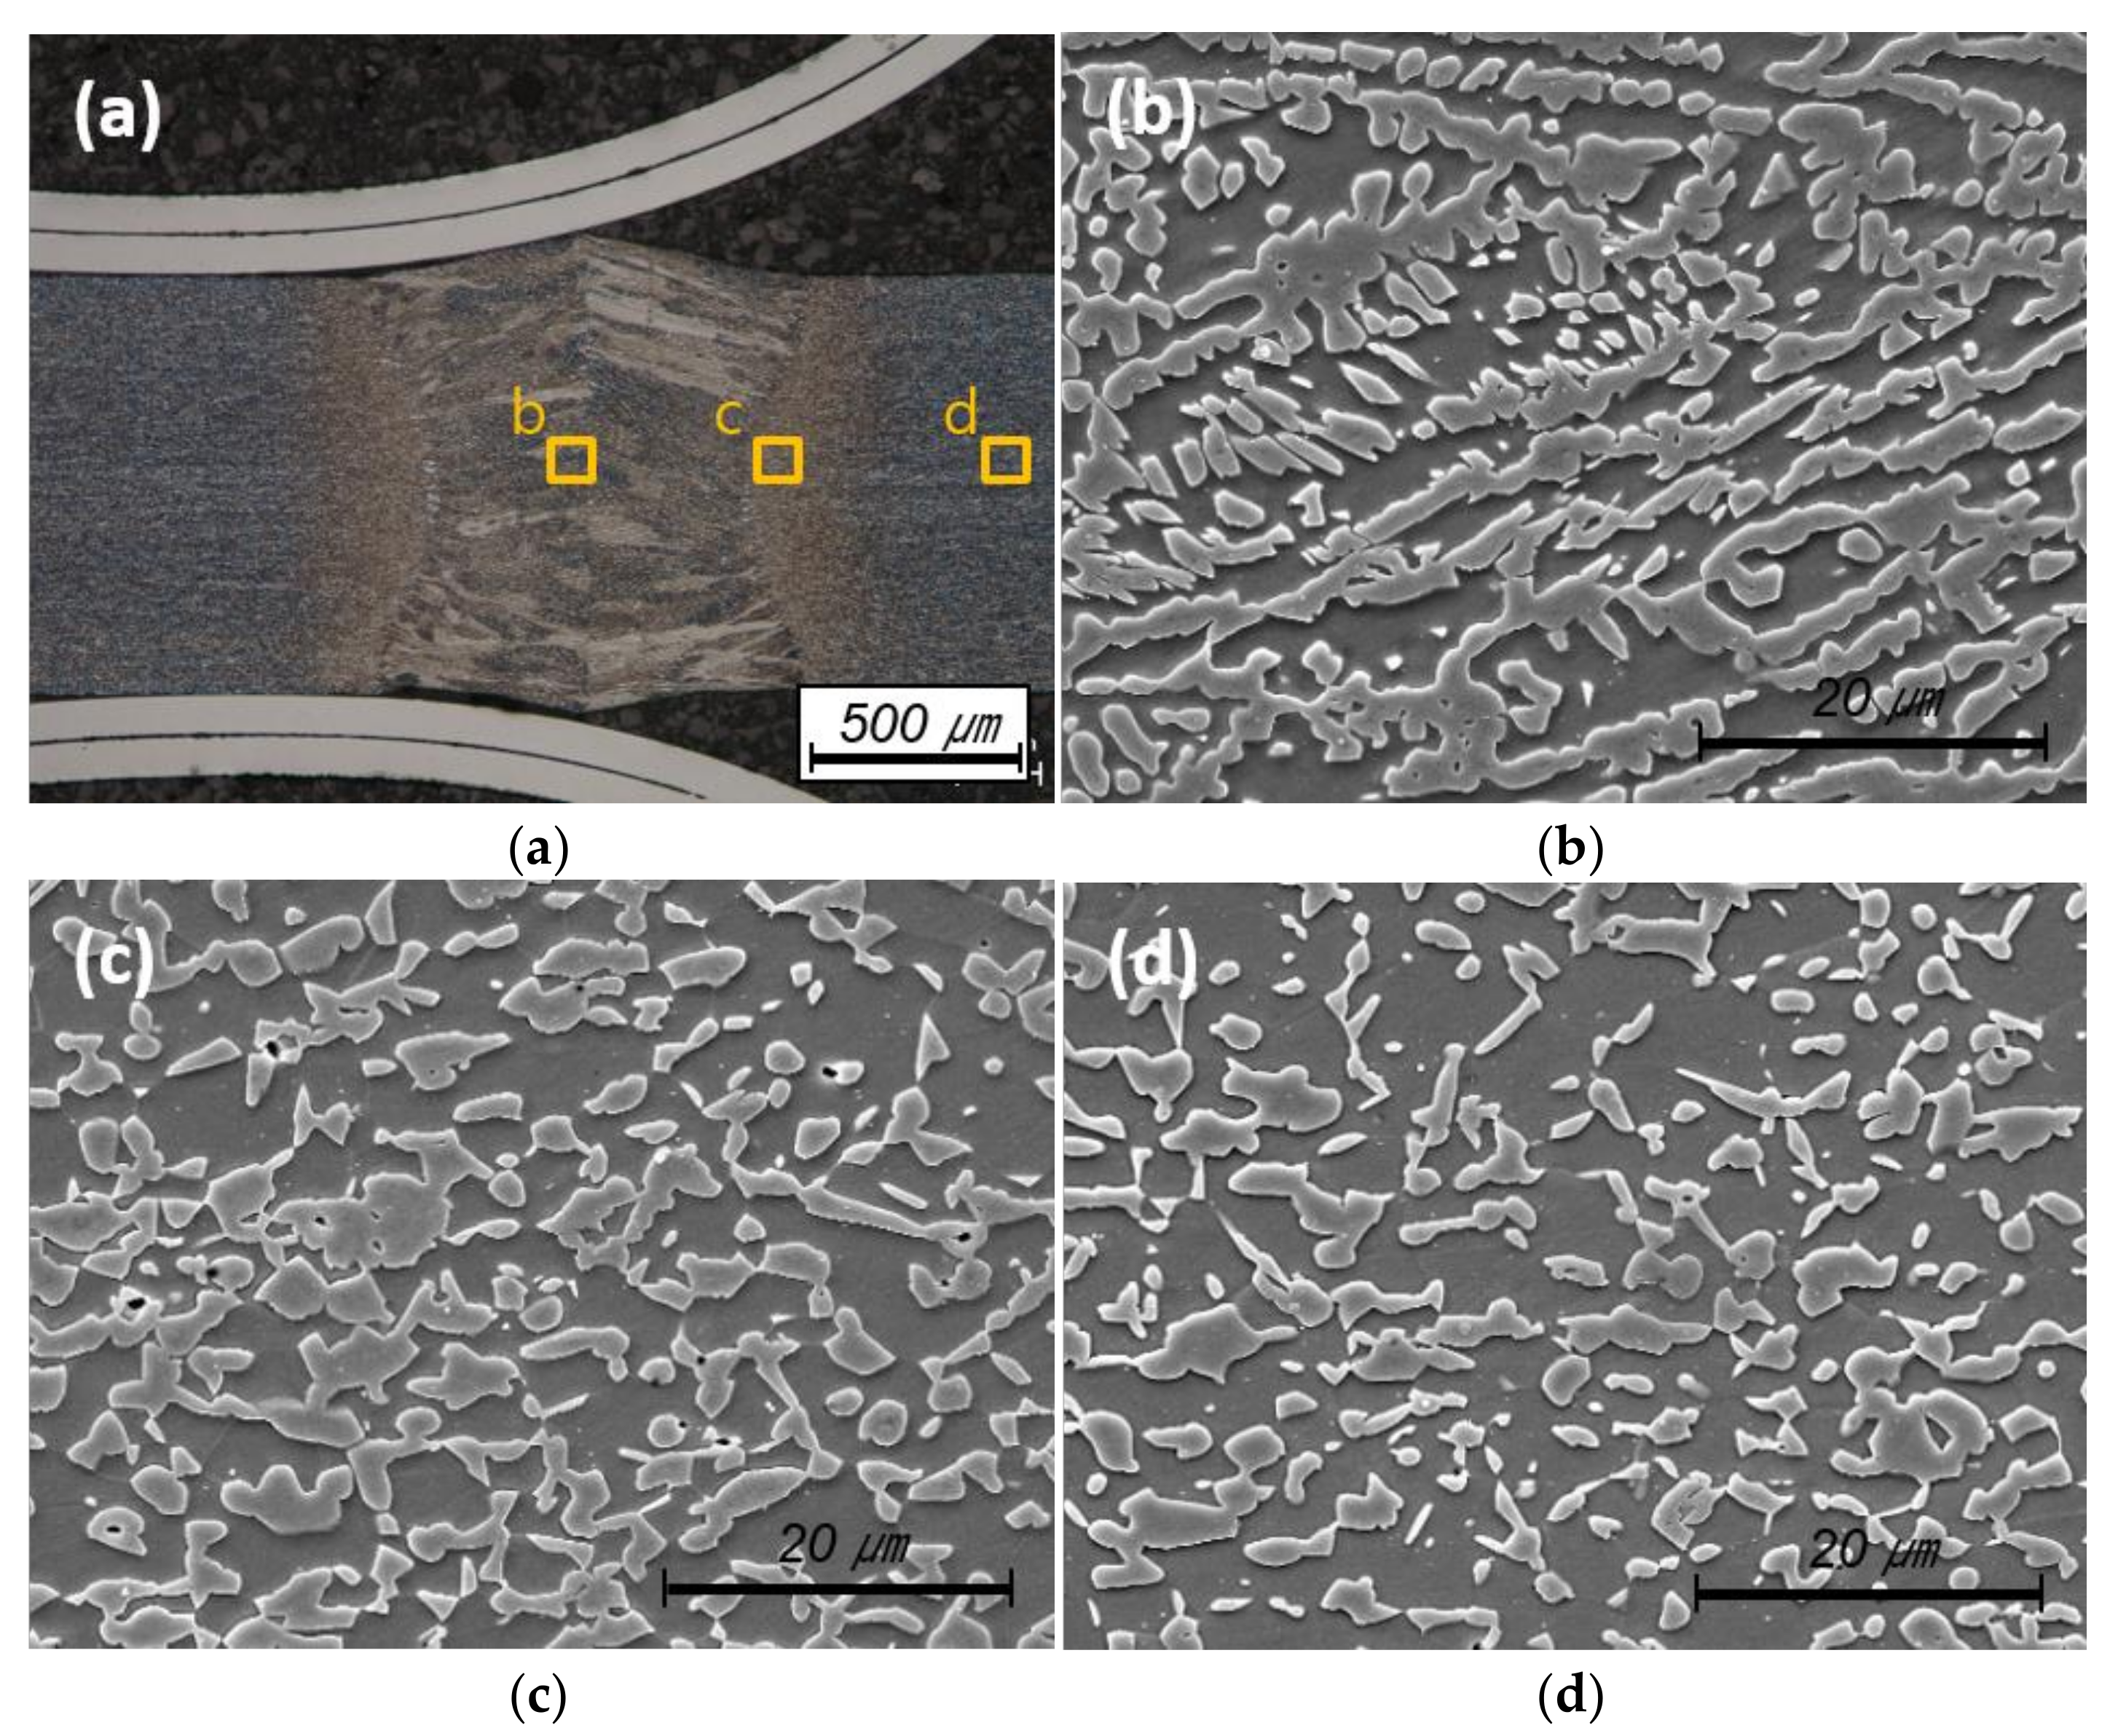
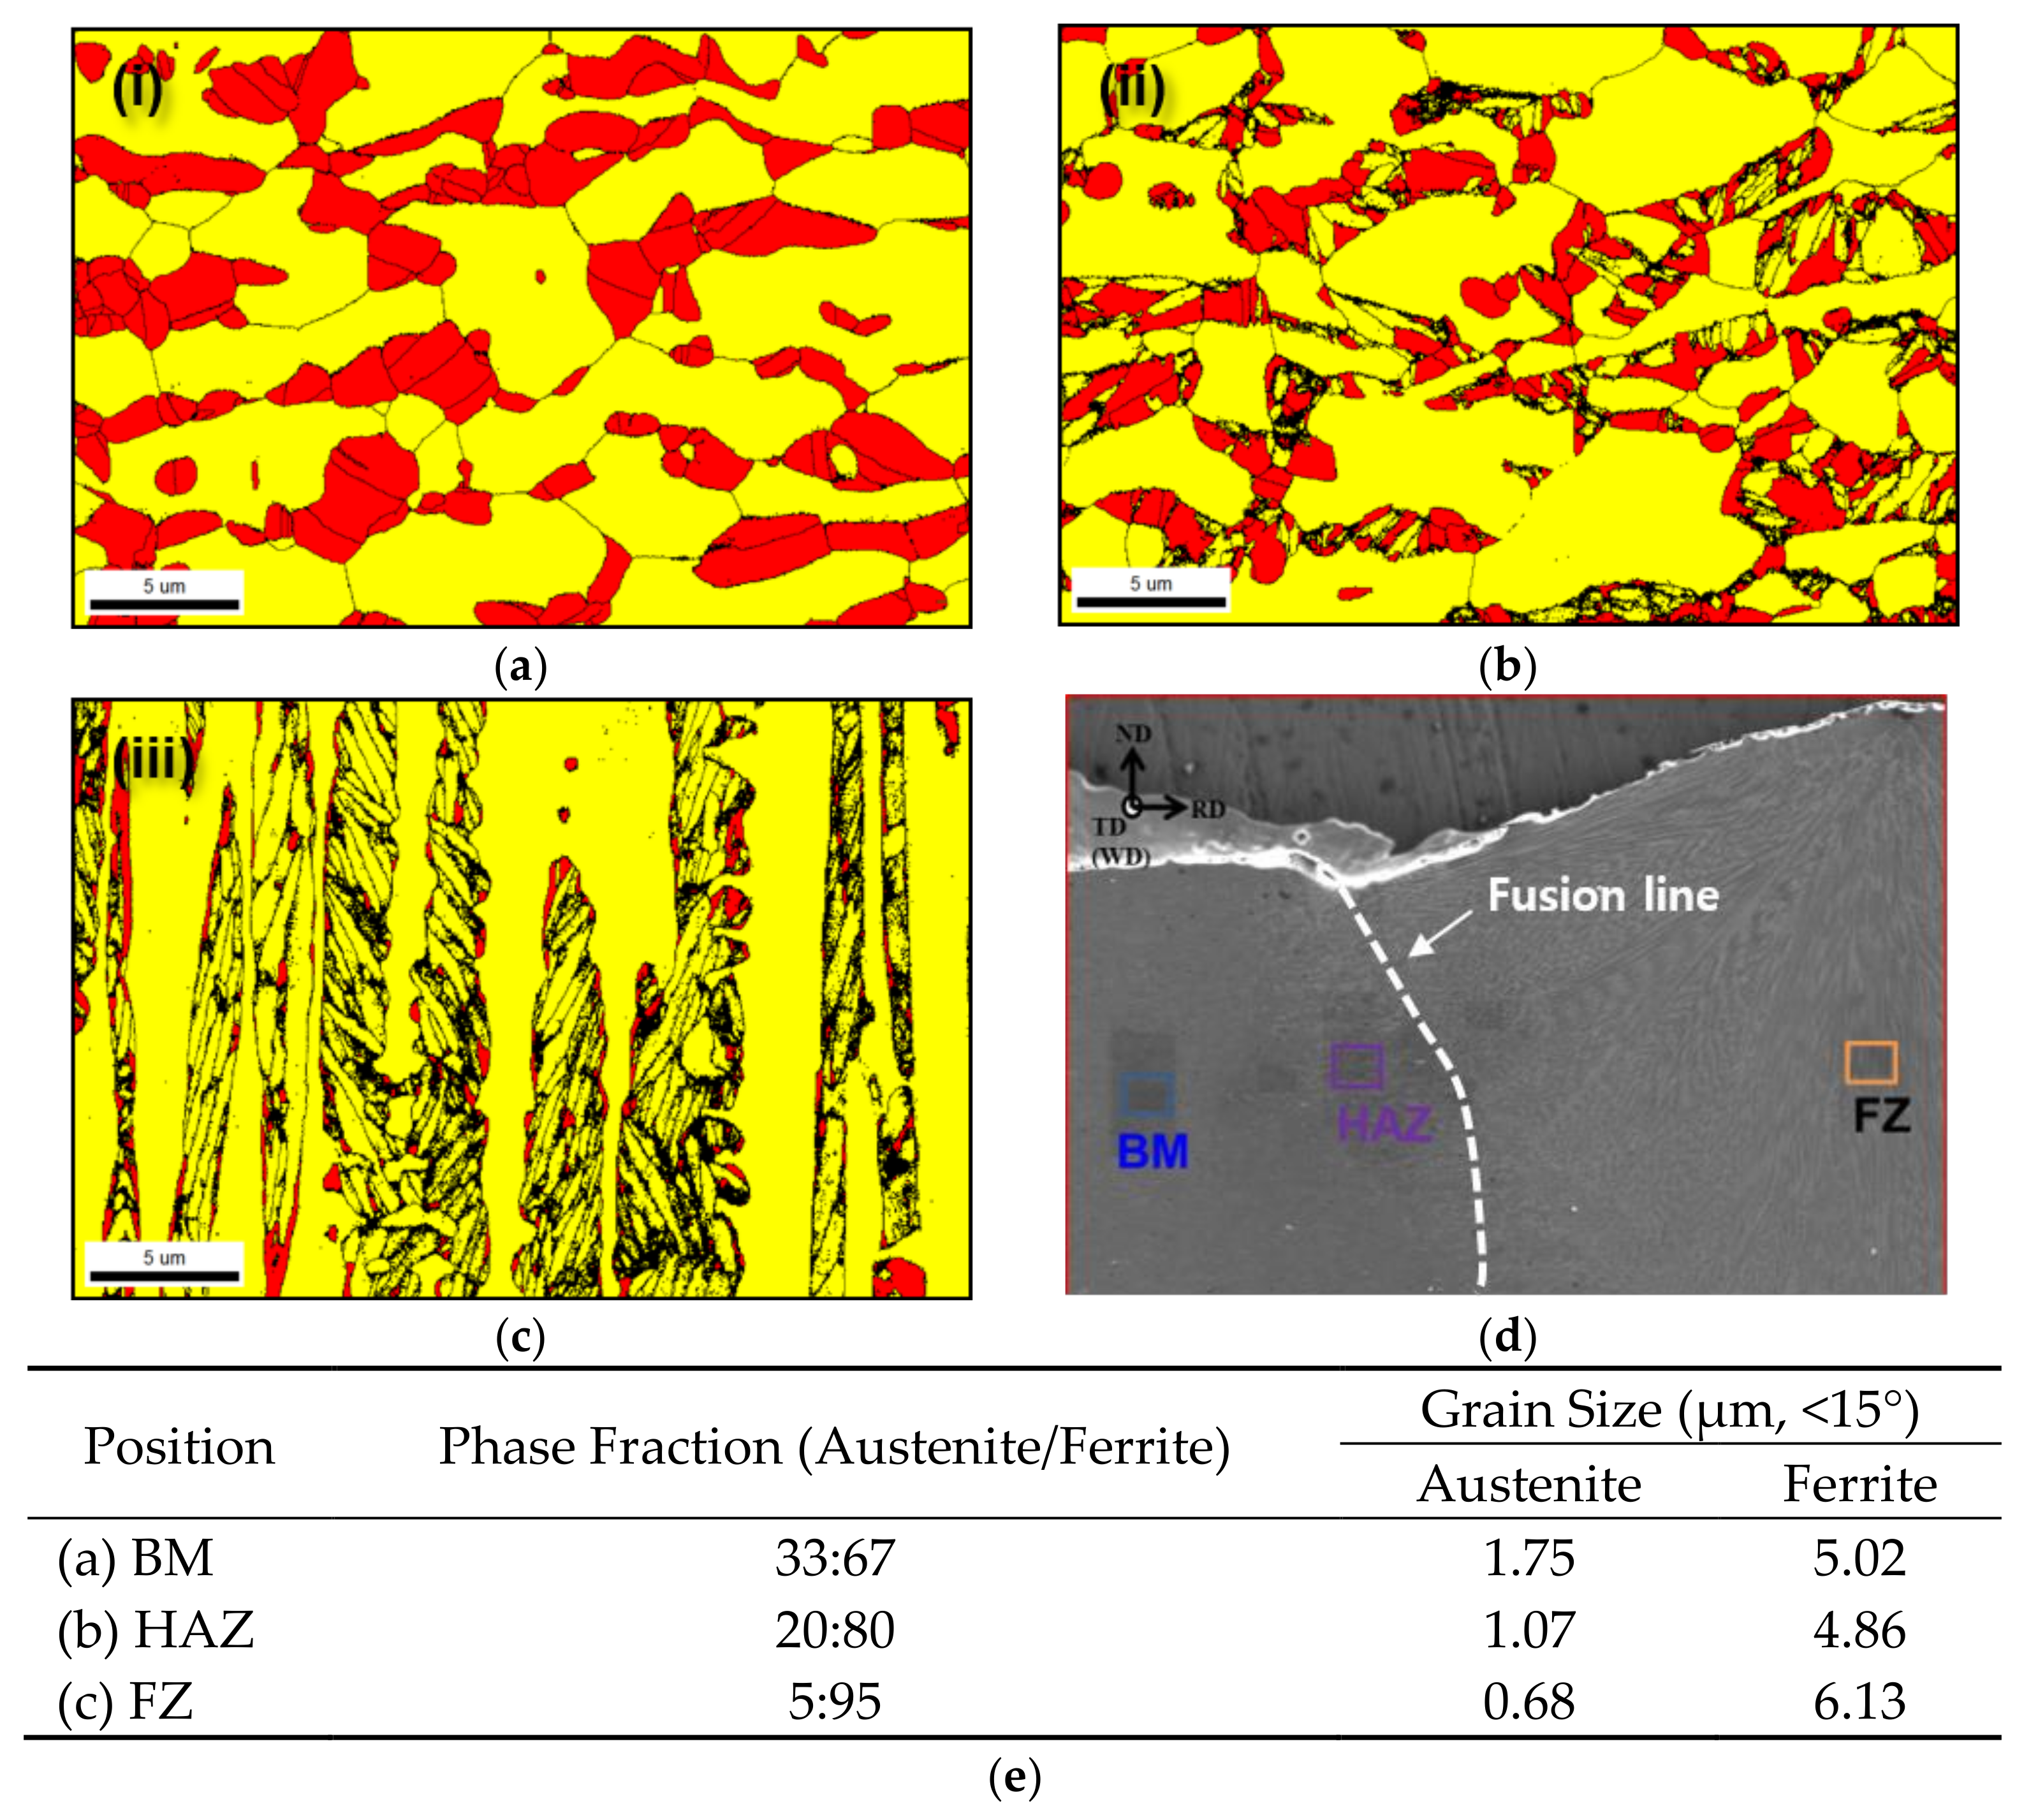
For a misfit to exist between the different phases of the material being welded, the phases must continue to exist in the welds. Figure 5 shows typical examples of the microstructures of the weldments. The welds can be divided into three parts, as shown in Figure 5a: namely, the FZ, HAZ, and BM. In the FZ, a dendritic structure was formed at the center of the welds (see Figure 5b). Further, the grain size of the matrix of the HAZ (see Figure 5c) was smaller than that of the BM.
The ferrite to austenite fraction ratio in the FZ was approximately 5:95, and the interpreted average grain size of the austenite phase was 0.68 µm while that of the ferrite phase was 6.13 µm. Columnar dendrites were formed along the central line and austenite grains were dispersed next to the dendrite arms. The interdendritic region had a lath-type microstructure, as shown in Figure 6d.
Figure 7 shows the local Vickers hardness values of the FZ. Both the lath-type ferrite and plate-type ferrite were indexed as the same ferrite in the EBSD analysis results. However, the local hardness values indicated that the lath-type and plate-type ferrite phases had different mechanical properties. The interdendritic region consisted of martensite. Since the cooling rate in the laser welding process was very high, it is likely that non-diffusion transformation had occurred. Thus, it can be concluded that contact ferrite/martensite and austenite/martensite interfaces were formed. Further, based on the EBSD analysis results, the phase was indexed as being a ferrite phase, for which the hardness was very high (greater than 550 Hv). Thus, it can be concluded that contact ferrite/martensite and austenite/martensite interfaces were formed.
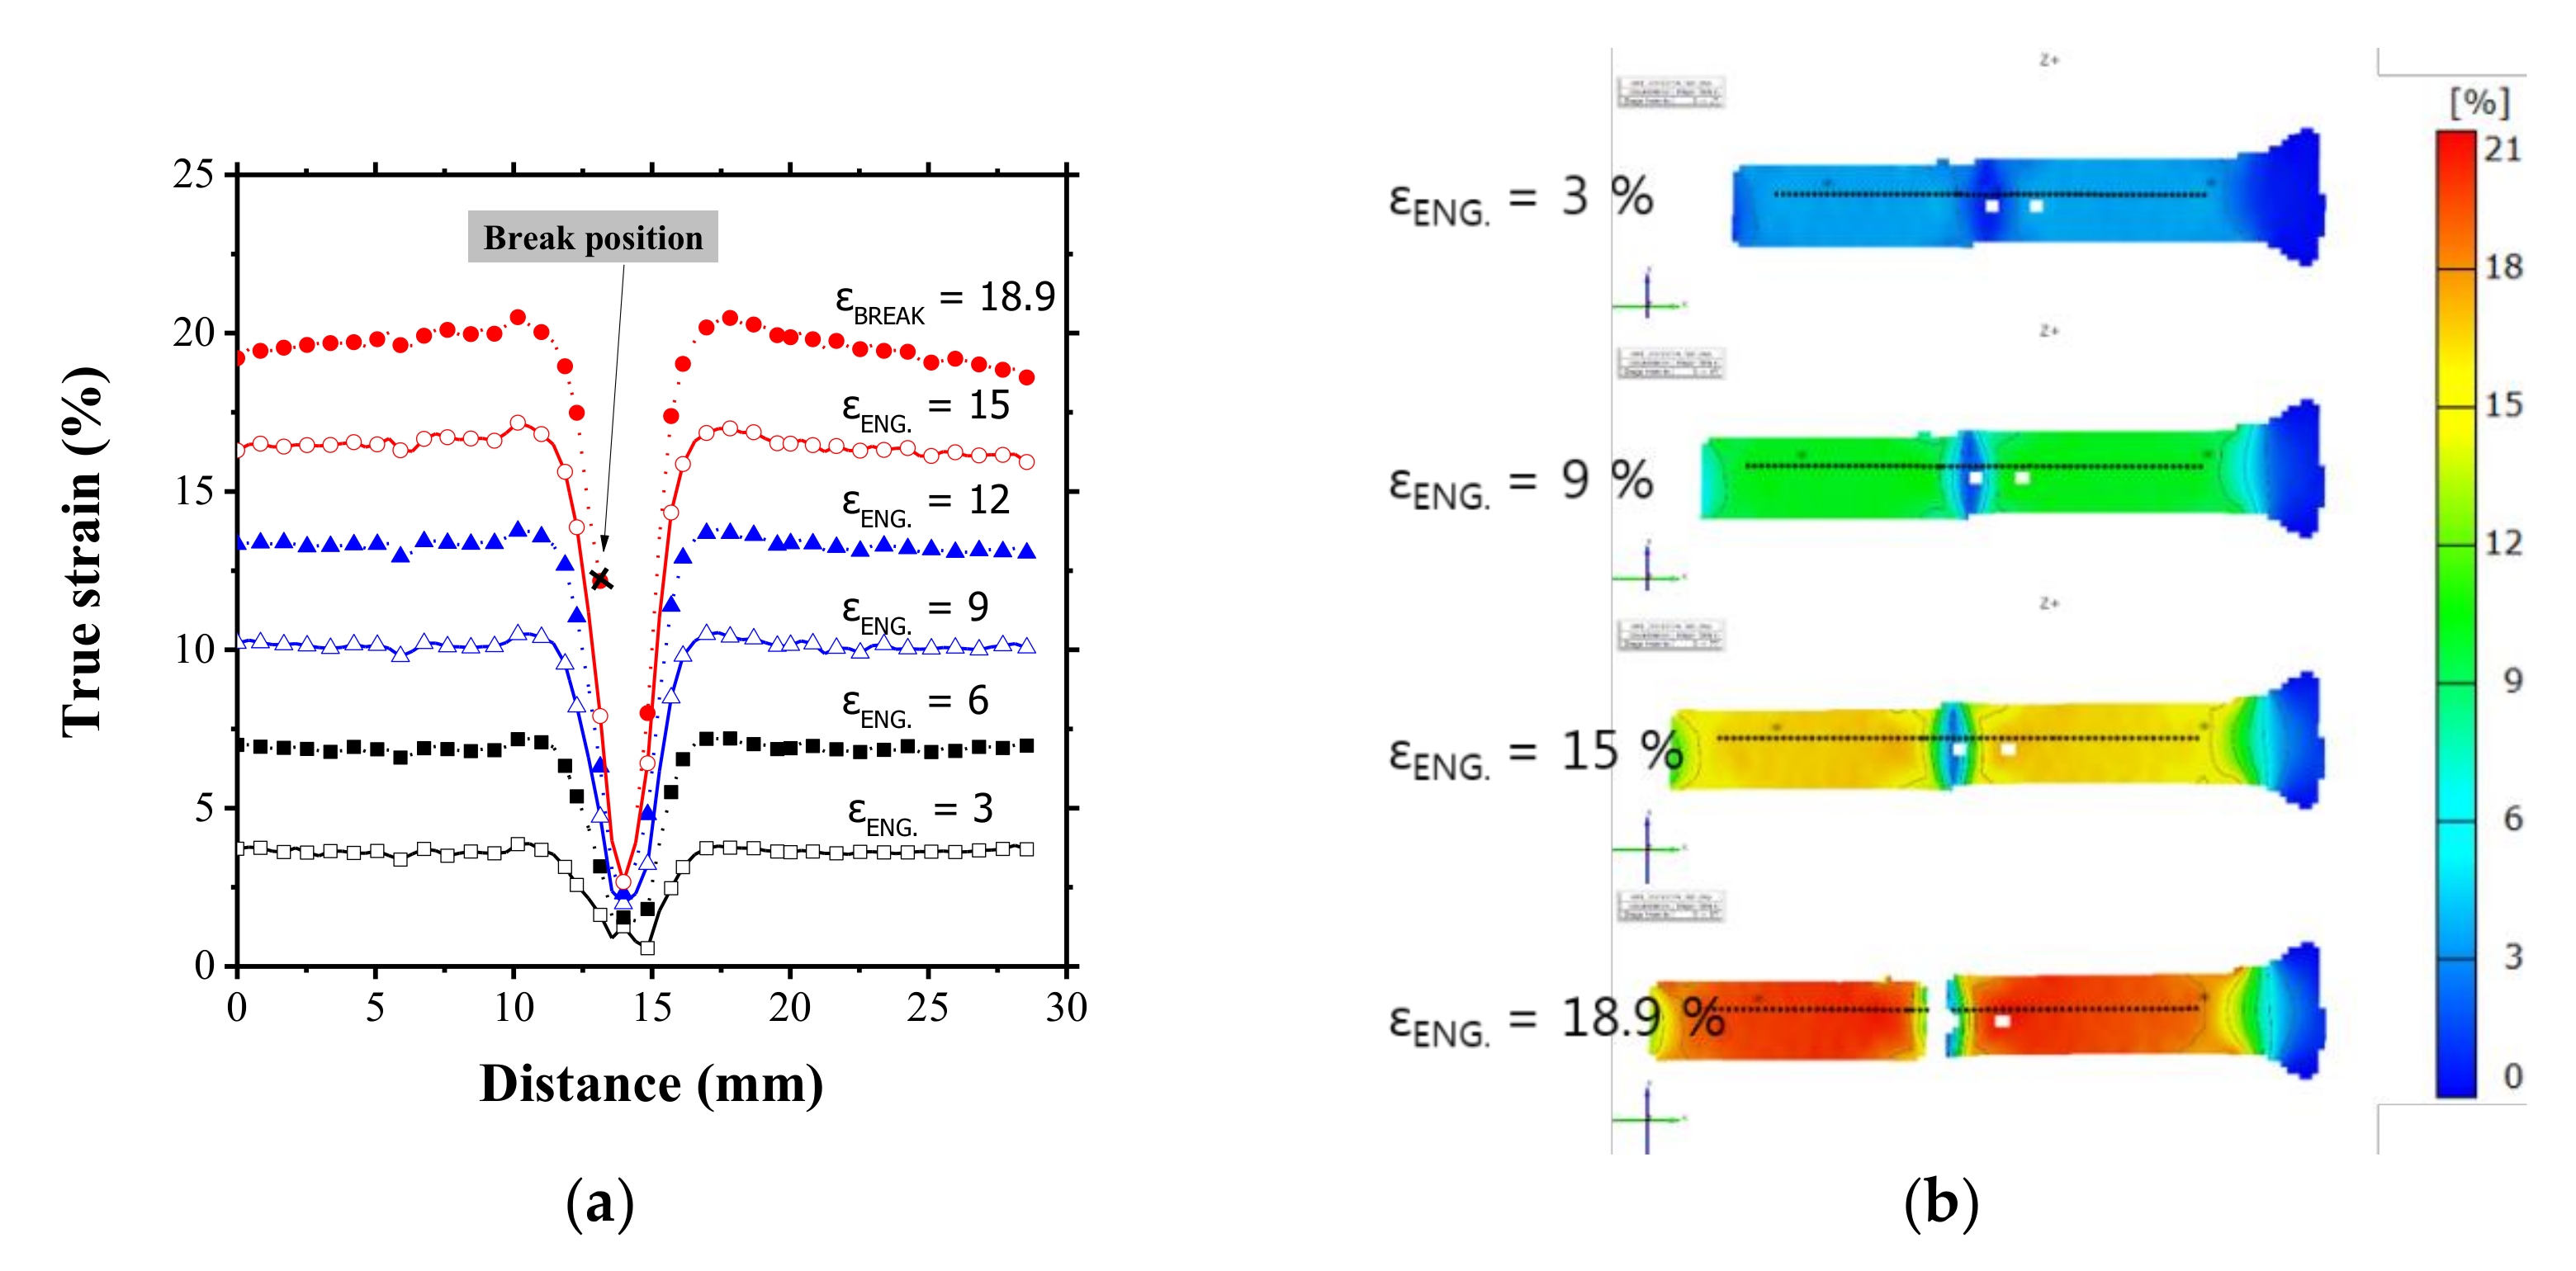
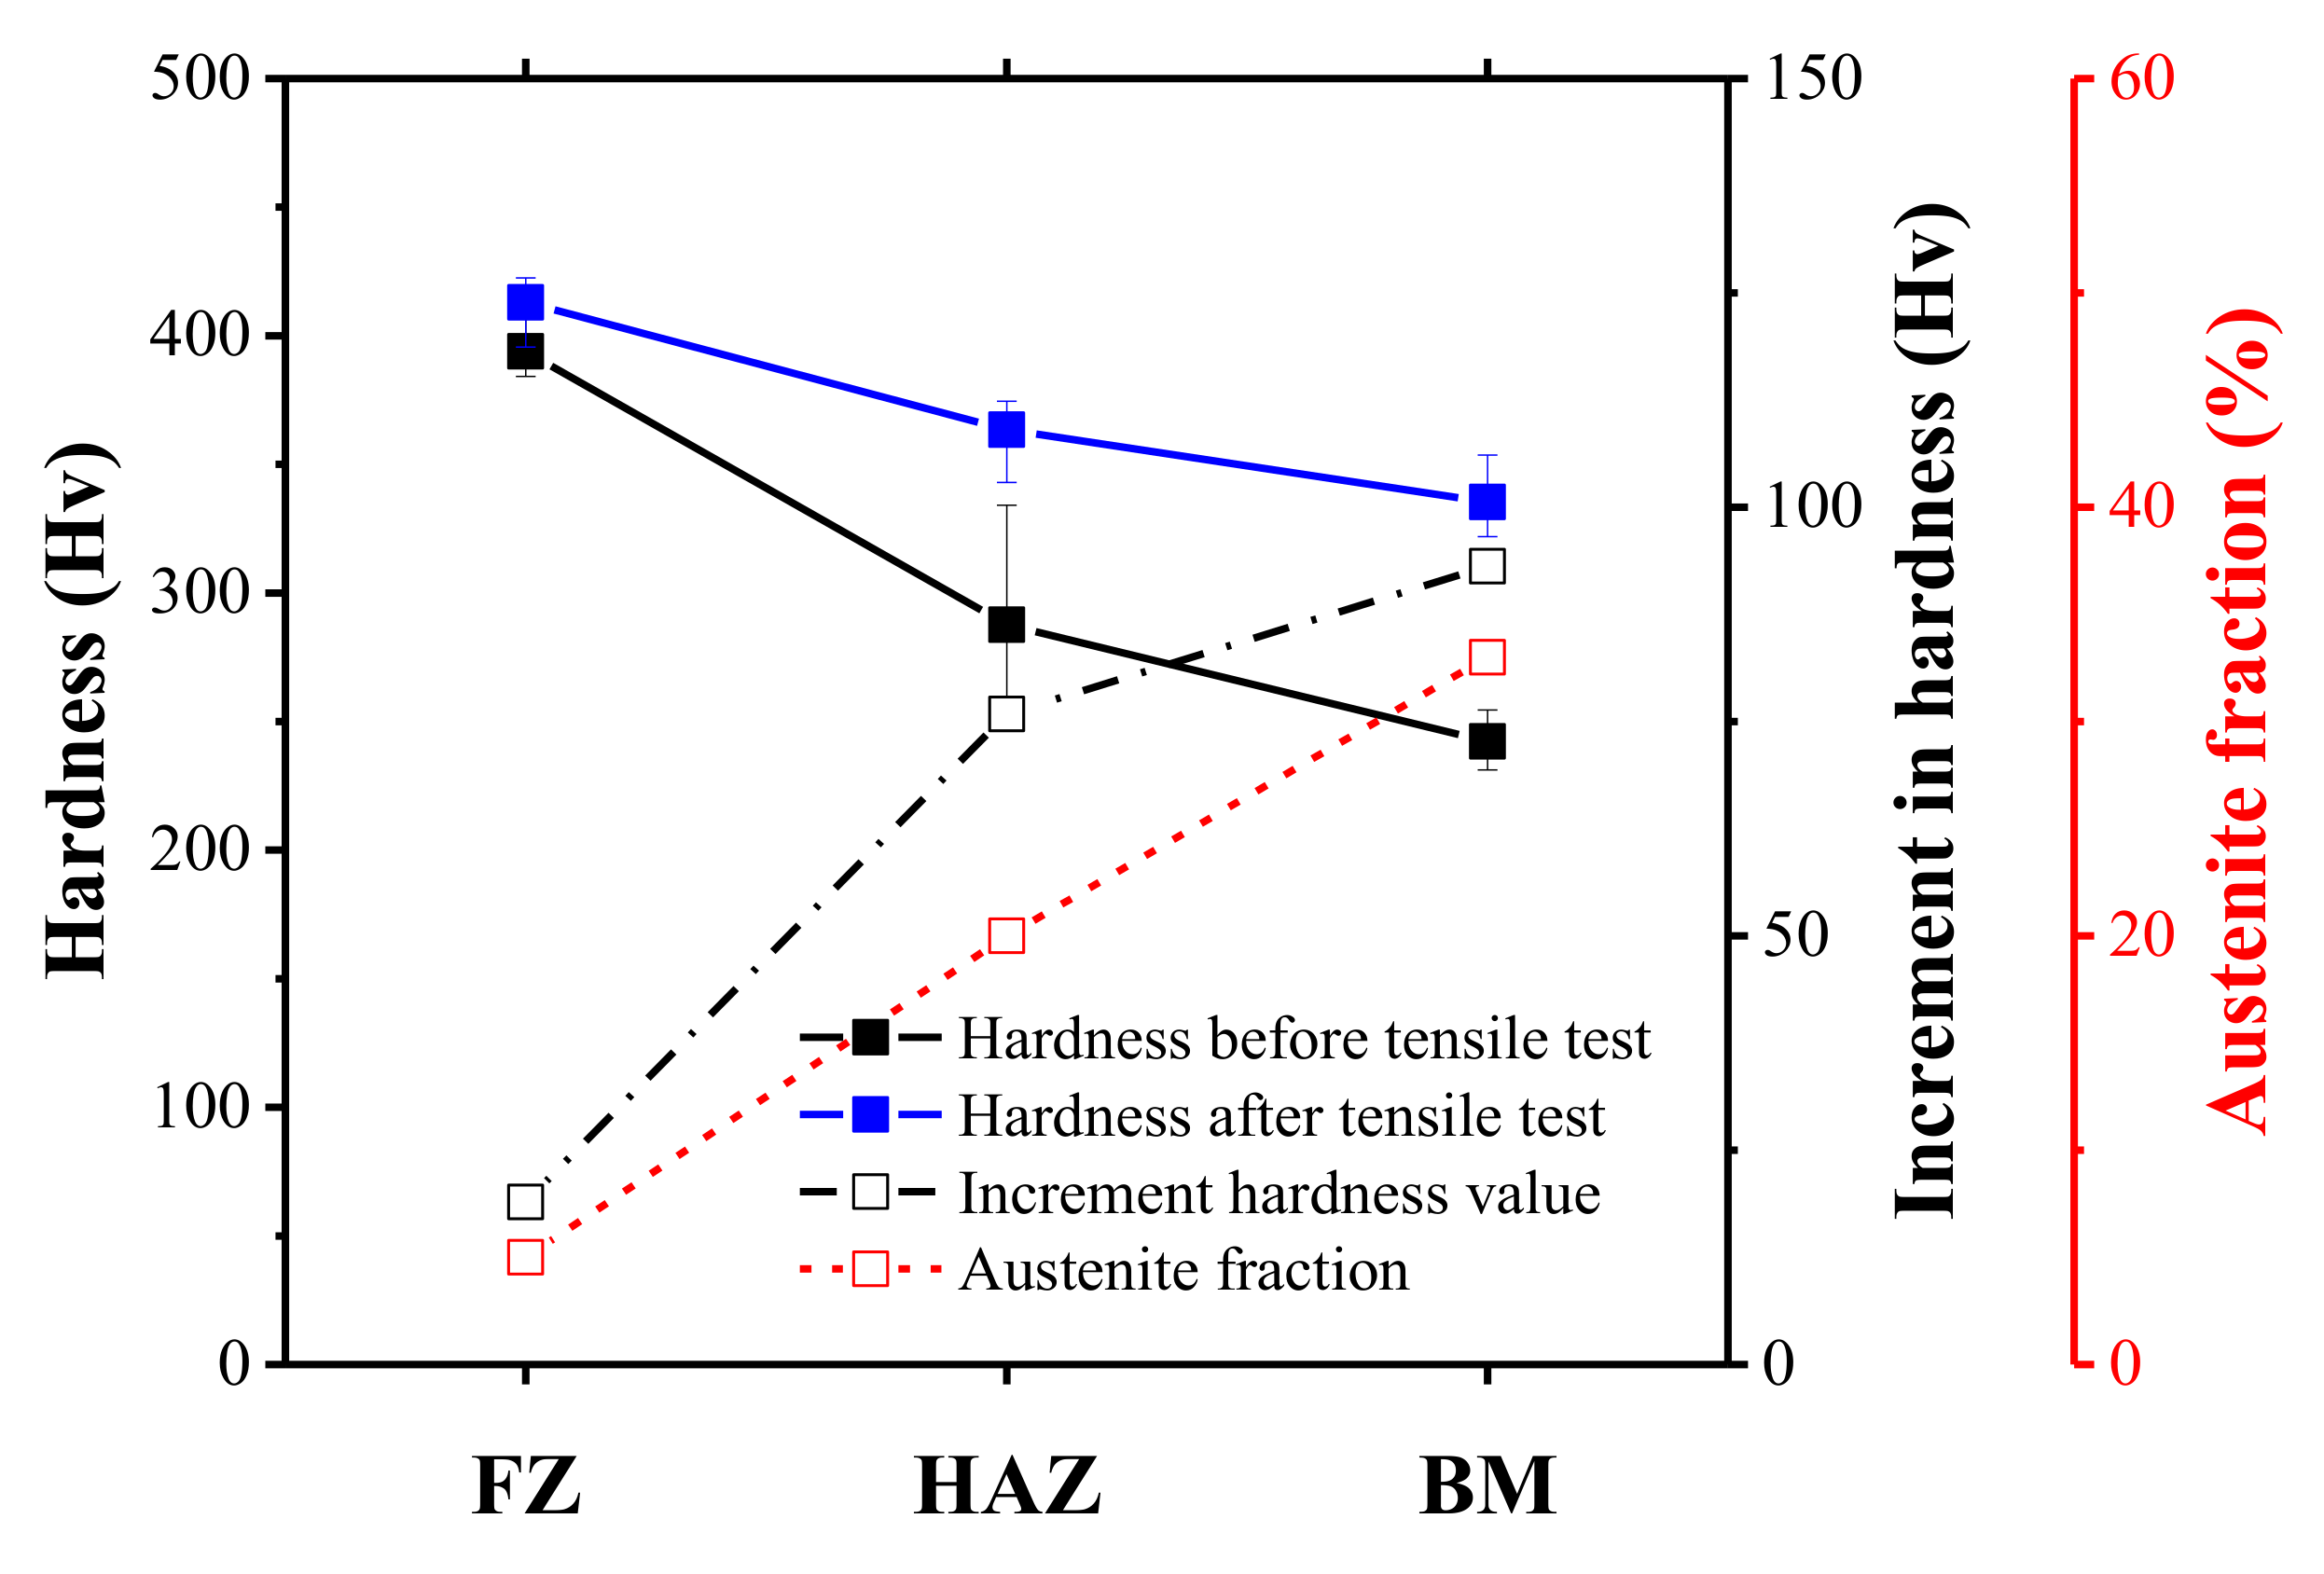
The local strain was confirmed via DIC analysis, as shown in Figure 8. The FZ was not completely deformed, since it contained a high fraction of martensite. The local strain can be predicted based on the changes in the hardness, since the relationship between the stress and hardness is linear. Figure 9 shows the average hardness values and the differences in the values before and after the tensile test. The hardness of the BM and HAZ increased markedly after the tensile test, as these zones contained a large amount of austenite and ferrite, and a small amount of martensite. This indicated that an extreme deformation had occurred in these regions, which was in keeping with the results shown in Figure 8.
The results of previous studies suggest that failure must occur in the BM regardless of the amount of heat input, because the BM is the most deformed and softened region as per the DIC strain maps and hardness profiles. However, in the present study, failure occurred in the HAZ when the heat-input was high. This was caused by the difference in the constituent phases of the two zones. The BM consisted of ferrite and austenite phases while the HAZ consisted of ferrite, austenite, and martensite phases. An incoherent interface, especially martensite–austenite and martensite–ferrite types, can experience voids even in the case of small deformations, as shown in Figure 10a. Subsequently, the point defects connect to each other and propagate to form a crack. Thus, the incompatibility between the phases was the primary reason for failures in the HAZ.
3.4. Effect of Heat Input on Mechanical Properties
Phase transformation is highly dependent on the amount of heat input, and these phenomena in turn determine the properties of the welded joints. Han et al. [35] examined the laser weldability of thin high strength steel sheets using a high-energy density beam and high welding speeds of 4–10 m/min. They found that the maximum hardness of the FZ did not vary with the welding speed, and it was similar to that of the water-quenched specimen. Zhou et al. [36] performed laser welding on dual phase steel. In the experiments, a Nd:YAG laser and diode laser were used as a high-energy density beam and a low-energy density beam, respectively. The maximum amount of HAZ softening was proportional to both the martensite volume fraction in BM and the heat input. However, the maximum HAZ softening did not vary with the heat input for the cases with a high-energy density beam.
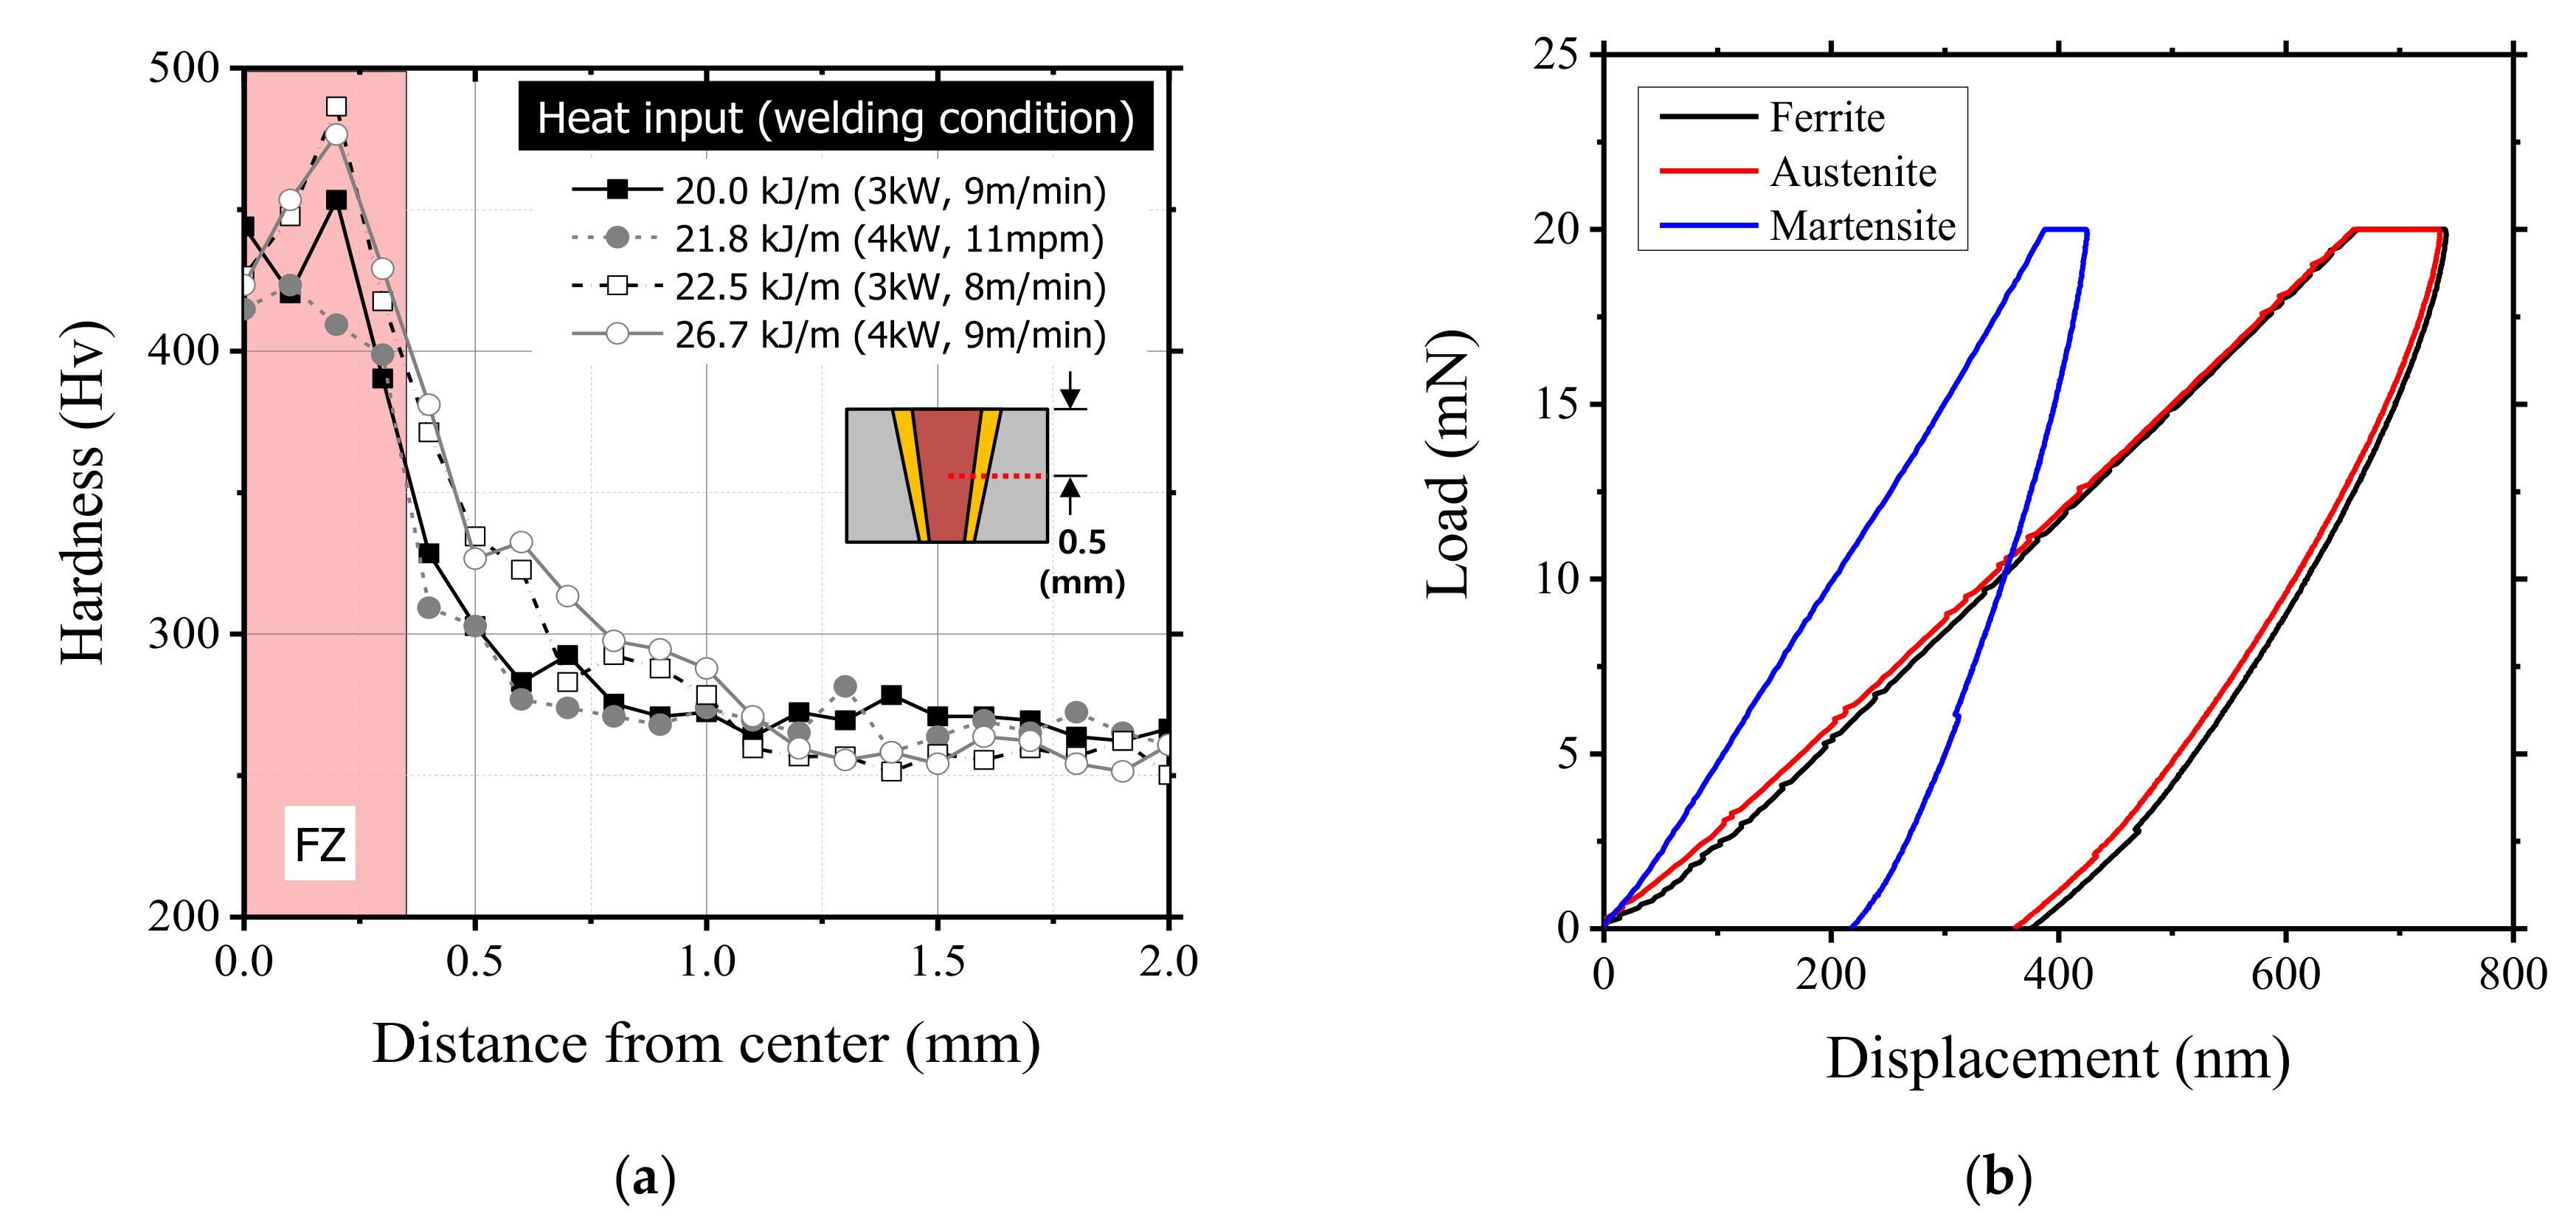
Figure 11a shows the hardness profile of specimens before the tensile test. The width of the HAZ increased with the increase in heat input and the HAZ softening was not observed in the range of heat inputs used in the experiments. As a result, wider and harder HAZ was formed in the case of high heat input conditions.
According to the rule of mixture, H = HmVm + HfVf + HaVa, the hardness of the HAZ can be estimated by multiplying each of phase ratio by the representative value [37,38,39]. Hm, Hf and Ha refer to the Vickers hardness of the martensite, ferrite, and austenite, respectively. Vm, Vf and Va indicate the volume fraction of martensite, ferrite, and austenite. The hardness of each of phases is presented in Figure 11b using a nanoindentation. Austenite and ferrite exhibited a similar load-displacement curve, but the martensite phase deformed less than other two phases. Since the hardness of austenite and ferrite is similar, the fraction of the martensite phase was dominant to the hardness.
From the hardness results in Figure 11a, it seems that the proportion of martensite in the HAZ and FZ increased with increasing the heat input. This could increase the incompatibility between the phases and result in decreased joint strength.
4. Conclusions
In the present study, laser welding was performed on sheets of a ferrite-based Fe-Al-Mn-C lightweight steel, using a range of laser powers and welding speeds, in order to evaluate its laser weldability. The failure location shifted from the BM to the HAZ with increases to the heat input. To elucidate the reason for the fracturing of the HAZ, the mechanical properties and morphological evolution of the welds were analyzed. The key conclusions of the study can be summarized as follows:
- (1)
- Typical brittle fracture surfaces were observed. Further, while cleavage was seen, dimples were not. The experimental results indicated that carbide or secondary phase particles were not present on the failure surface. The phases formed were also determined through simulations performed using commercial thermodynamic software. The simulation results were in good agreement with those obtained experimentally.
- (2)
- The HAZ and FZ were composed of ferrite, austenite, and martensite phases. Thus, contact ferrite/martensite and austenite/martensite interfaces with a high degree of incompatibility were formed. Incompatibility between the phases can induce voids even in the case of small deformations. These defects subsequently connect to each other and propagate to form a crack. Thus, incompatibility between the phases was the primary reason that failure occurred in the HAZ.
Acknowledgments
This study was supported by a grant from the Ministry of Trade, Industry and Energy, Republic of Korea. Heung Nam Han was supported by the National Research Foundation of Korea (NRF) grant funded by the Ministry of Science, ICT & Future Planning (MSIP) (No. NRF-2015R1A5A1037627).
Author Contributions
Minjung Kang Zou performed most of experiments and wrote this manuscript. Young-Min Kim helped analyze the precipitation segregation using FactSage software, and gave some constructive suggestions. Heung Nam Han and Cheolhee Kim participated in the discussion on the results and guided the writing of the article.
Conflicts of Interest
The authors declare no conflicts of interest.
References
- Bouquerel, J.; Verbeken, K.; De Cooman, B. Microstructure-based model for the static mechanical behaviour of multiphase steels. Acta Mater. 2006, 54, 1443–1456. [Google Scholar] [CrossRef]
- Lim, N.; Park, H.; Kim, S.; Park, C. Effects of aluminum on the microstructure and phase transformation of TRIP steels. Met. Mater. Int. 2012, 18, 647–654. [Google Scholar] [CrossRef]
- Bouaziz, O.; Allain, S.; Scott, C.; Cugy, P.; Barbier, D. High manganese austenitic twinning induced plasticity steels: A review of the microstructure properties relationships. Curr. Opin. Solid State Mater. Sci. 2011, 15, 141–168. [Google Scholar] [CrossRef]
- Vercammen, S.; Blanpain, B.; De Cooman, B.; Wollants, P. Cold rolling behaviour of an austenitic Fe–30Mn–3Al–3Si TWIP-steel: The importance of deformation twinning. Acta Mater. 2004, 52, 2005–2012. [Google Scholar] [CrossRef]
- Kim, H.; Suh, D.-W.; Kim, N.J. Fe–Al–Mn–C lightweight structural alloys: A review on the microstructures and mechanical properties. Sci. Technol. Adv. Mater. 2013, 14, 014205. [Google Scholar] [CrossRef] [PubMed]
- Suh, D.-W.; Kim, N.J. Low-density steels. Scr. Mater. 2013, 68, 337–338. [Google Scholar] [CrossRef]
- Lee, H.-J.; Sohn, S.S.; Lee, S.; Kwak, J.-H.; Lee, B.-J. Thermodynamic analysis of the effect of C, Mn and Al on microstructural evolution of lightweight steels. Scr. Mater. 2013, 68, 339–342. [Google Scholar] [CrossRef]
- Mujica, L.; Weber, S.; Pinto, H.; Thomy, C.; Vollertsen, F. Microstructure and mechanical properties of laser-welded joints of TWIP and TRIP steels. Mater. Sci. Eng. A 2010, 527, 2071–2078. [Google Scholar] [CrossRef]
- Seo, C.-H.; Kwon, K.H.; Choi, K.; Kim, K.-H.; Kwak, J.H.; Lee, S.; Kim, N.J. Deformation behavior of ferrite-austenite duplex lightweight Fe–Mn–Al–C steel. Scr. Mater. 2015, 66, 519–522. [Google Scholar] [CrossRef]
- Sohn, S.S.; Lee, B.-J.; Lee, S.; Kim, N.J.; Kwak, J.H. Effect of annealing temperature on microstructural modification and tensile properties in 0.35C–3.5Mn–5.8Al lightweight steel. Acta Mater. 2013, 61, 5050–5066. [Google Scholar] [CrossRef]
- Rana, R.; Liu, C.; Ray, R. Evolution of microstructure and mechanical properties during thermomechanical processing of a low-density multiphase steel for automotive application. Acta Mater. 2014, 75, 227–245. [Google Scholar] [CrossRef]
- Zuazo, I.; Hallstedt, B.; Lindahl, B.; Selleby, M.; Soler, M.; Etienne, A.; Perlade, A.; Hasenpouth, D.; Massardier-Jourdan, V.; Cazottes, S. Low-density steels: Complex metallurgy for automotive applications. JOM 2014, 66, 1747–1758. [Google Scholar] [CrossRef]
- Seol, J.B.; Raabe, D.; Choi, P.; Park, H.-S.; Kwak, J.-H.; Park, C.G. Direct evidence for the formation of ordered carbides in a ferrite-based low-density Fe–Mn–Al–C alloy studied by transmission electron microscopy and atom probe tomography. Scr. Mater. 2013, 68, 348–353. [Google Scholar] [CrossRef]
- Moon, J.; Park, S.-J.; Jang, J.H.; Lee, T.-H.; Lee, C.-H.; Hong, H.-U.; Suh, D.-W.; Kim, S.H.; Han, H.N.; Lee, B.H. Atomistic investigations of κ-carbide precipitation in austenitic Fe–Mn–Al–C lightweight steels and the effect of Mo addition. Scr. Mater. 2017, 127, 97–101. [Google Scholar] [CrossRef]
- Park, S.-J.; Heo, Y.-U.; Choi, Y.H.; Lee, K.; Han, H.N.; Suh, D.-W. Effect of second phase on the deformation and fracture behavior of multiphase low-density steels. JOM 2014, 66, 1837–1844. [Google Scholar] [CrossRef]
- Choi, K.; Seo, C.-H.; Lee, H.; Kim, S.; Kwak, J.H.; Chin, K.G.; Park, K.-T.; Kim, N.J. Effect of aging on the microstructure and deformation behavior of austenite base lightweight Fe–28Mn–9Al–0.8C steel. Scr. Mater. 2010, 63, 1028–1031. [Google Scholar] [CrossRef]
- Frommeyer, G.; Brüx, U. Microstructures and mechanical properties of high-strength Fe–Mn–Al–C light-weight triplex steels. Steel Res. Int. 2006, 77, 627–633. [Google Scholar] [CrossRef]
- Lu, W.; Zhang, X.; Qin, R. Κ-carbide hardening in a low-density high-Al high-Mn multiphase steel. Mater. Lett. 2015, 138, 96–99. [Google Scholar] [CrossRef]
- Sutou, Y.; Kamiya, N.; Umino, R.; Ohnuma, I.; Ishida, K. High-strength Fe–20Mn–Al–C-based alloys with low density. ISIJ Int. 2010, 50, 893–899. [Google Scholar] [CrossRef]
- Han, S.Y.; Shin, S.Y.; Lee, S.; Kim, N.J.; Kwak, J.-H.; Chin, K.-G. Effect of carbon content on cracking phenomenon occurring during cold rolling of three light-weight steel plates. Metall. Mater. Trans. A 2011, 42, 138–146. [Google Scholar] [CrossRef]
- Lee, S.; Jeong, J.; Lee, Y.-K. Precipitation and dissolution behavior of κ-carbide during continuous heating in Fe–9.3Mn–5.6Al–0.16C lightweight steel. J. Alloys Compd. 2015, 648, 149–153. [Google Scholar] [CrossRef]
- Shin, S.Y.; Lee, H.; Han, S.Y.; Seo, C.-H.; Choi, K.; Lee, S.; Kim, N.J.; Kwak, J.-H.; Chin, K.-G. Correlation of microstructure and cracking phenomenon occurring during hot rolling of lightweight steel plates. Metall. Mater. Trans. A 2009, 41, 138–148. [Google Scholar] [CrossRef]
- Gutierrez-Urrutia, I.; Raabe, D. Multistage strain hardening through dislocation substructure and twinning in a high strength and ductile weight-reduced Fe–Mn–Al–C steel. Acta Mater. 2012, 60, 5791–5802. [Google Scholar] [CrossRef]
- Park, K.-T. Tensile deformation of low-density Fe–Mn–Al–C austenitic steels at ambient temperature. Scr. Mater. 2013, 68, 375–379. [Google Scholar] [CrossRef]
- Han, H.N.; Lee, C.G.; Suh, D.-W.; Kim, S.-J. A microstructure-based analysis for transformation induced plasticity and mechanically induced martensitic transformation. Mater. Sci. Eng. A 2008, 485, 224–233. [Google Scholar] [CrossRef]
- Choi, J.Y.; Lee, J.; Lee, K.; Koh, J.-Y.; Cho, J.-H.; Han, H.N.; Park, K.-T. Effects of the strain rate on the tensile properties of a trip-aided duplex stainless steel. Mater. Sci. Eng. A 2016, 666, 280–287. [Google Scholar] [CrossRef]
- Ryu, J.H.; Kim, D.-I.; Kim, H.S.; Bhadeshia, H.; Suh, D.-W. Strain partitioning and mechanical stability of retained austenite. Scr. Mater. 2010, 63, 297–299. [Google Scholar] [CrossRef]
- Doong, J.-L.; Wu, C.-S.; Hwang, J.-R. Infrared temperature sensing of laser welding. Int. J. Mach. Tools Manuf. 1991, 31, 607–616. [Google Scholar] [CrossRef]
- Jung, G.S.; Lee, K.Y.; Bhadeshia, H.K.D.H.; Suh, D.-W. Spot weldability of TRIP assisted steels with high carbon and aluminium contents. Sci. Technol. Weld. Join. 2012, 17, 92–98. [Google Scholar] [CrossRef]
- Choi, Y.J.; Suh, D.W.; Bhadeshia, H.K.D.H. Retention of δ-ferrite in aluminium-alloyed TRIP-assisted steels. Proc. R. Soc. A Math. Phys. Eng. Sci. 2012, 468, 2904–2914. [Google Scholar] [CrossRef]
- Park, H.-S.; Seol, J.-B.; Lim, N.-S.; Kim, S.-I.; Park, C.-G. Study of the decomposition behavior of retained austenite and the partitioning of alloying elements during tempering in cmnsial trip steels. Mater. Des. 2015, 82, 173–180. [Google Scholar] [CrossRef]
- Suh, D.W.; Ryu, J.H.; Joo, M.S.; Yang, H.S.; Lee, K.; Bhadeshia, H.K.D.H. Medium-alloy manganese-rich transformation-induced plasticity steels. Metall. Mater. Trans. A 2012, 44, 286–293. [Google Scholar] [CrossRef]
- Gulliver, G. The quantitative effect of rapid cooling upon the constitution of binary alloys. J. Jpn. Inst. Met. Mater. 1913, 9, 120–157. [Google Scholar]
- Scheil, E. Remarks on stratification. J. Metall. 1942, 34, 70–72. [Google Scholar]
- Han, T.-K.; Park, B.-G.; Kang, C.-Y. Hardening characteristics of CO2 laser welds in advanced high strength steel. Met. Mater. Int. 2012, 18, 473–479. [Google Scholar] [CrossRef]
- Xia, M.; Biro, E.; Tian, Z.; Zhou, Y.N. Effects of heat input and martensite on HAZ softening in laser welding of dual phase steels. ISIJ Int. 2008, 48, 809–814. [Google Scholar] [CrossRef]
- Song, Y.; Hua, L.; Chu, D.; Lan, J. Characterization of the inhomogeneous constitutive properties of laser welding beams by the micro-Vickers hardness test and the rule of mixture. Mater. Des. 2012, 37, 19–27. [Google Scholar] [CrossRef]
- Ion, J.; Easterling, K.E.; Ashby, M. A second report on diagrams of microstructure and hardness for heat-affected zones in welds. Acta Metall. 1984, 32, 1949–1955, 1957–1962. [Google Scholar] [CrossRef]
- Bang, K.; Kim, W. Estimation and prediction of HAZ softening in thermomechanically controlled-rolled and accelerated-cooled steel. Weld. J. 2002, 81, 174S–179S. [Google Scholar]
Figure 1.
(a) Measured engineering tensile strengths; and (b) strain maps from digital image correlation (DIC) measurements at different failure locations. Laser welds that ruptured at base metal were produced using a laser power of 3 kW and welding speed of 8 m/min, while specimens that fractured at the fusion line were produced using a laser power of 4 kW and welding speed of 10 m/min.

Figure 2.
Micrographs of fracture section along the (a) transverse (magnification of 1000×) and (b) normal directions after the tensile test (magnification of 1000×), and (c) a normal direction view of the contents of the white-bordered box in (b) (magnification of 3000×). Specimen was prepared using a laser power of 4 kW and a welding speed of 10 m/min. FZ is the fusion zone; HAZ is the heat-affected zone.
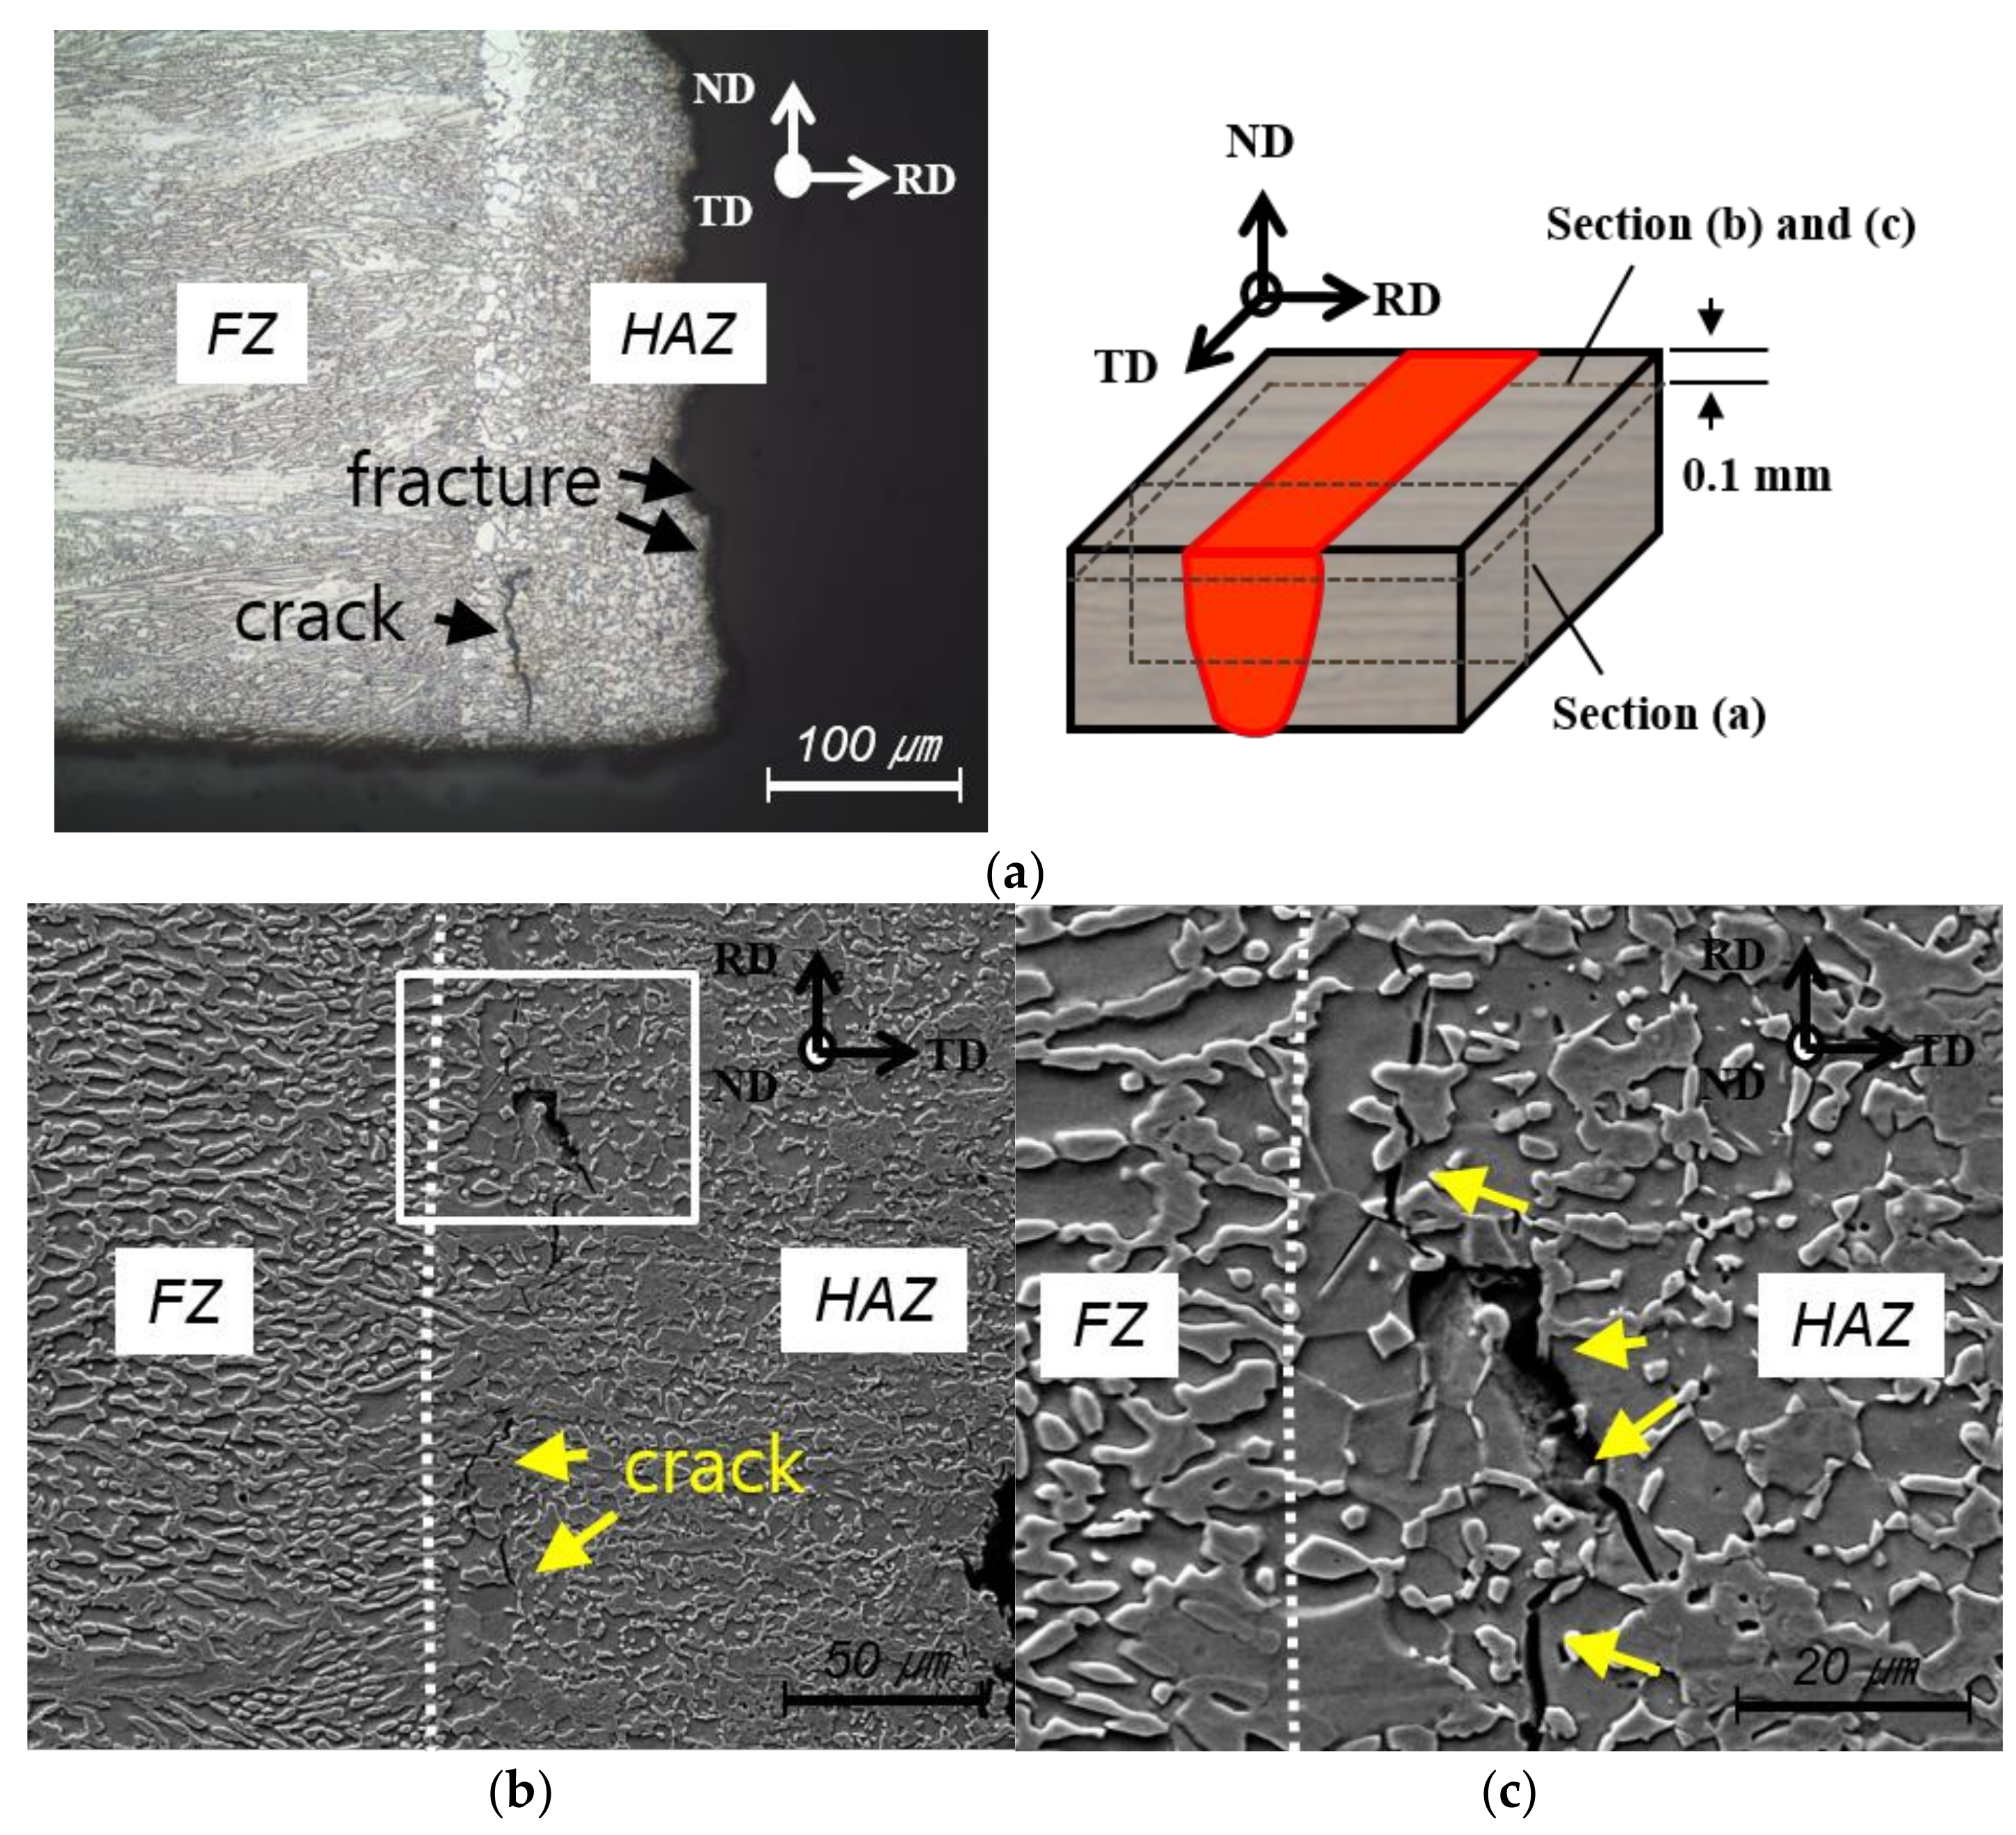
Figure 3.
SEM images of specimen that ruptured at the HAZ. Specimen was prepared using a laser power of 4 kW and a welding speed of 10 m/min using a 450-mm focusing optic system: magnification is (a) 1000× and (b) 5000×.
Figure 3.
SEM images of specimen that ruptured at the HAZ. Specimen was prepared using a laser power of 4 kW and a welding speed of 10 m/min using a 450-mm focusing optic system: magnification is (a) 1000× and (b) 5000×.

Figure 4.
Results of thermodynamic calculations performed using FactSAGE™ 7.0 for phase formation during solidification under the Scheil–Gulliver condition.
Figure 4.
Results of thermodynamic calculations performed using FactSAGE™ 7.0 for phase formation during solidification under the Scheil–Gulliver condition.

Figure 5.
Sectional images of laser welds formed at a laser power of 3 kW and a welding speed of 8 m/min at a 0-mm focal position using a 450-mm focusing optic system ((a) macrosection, (b) fusion zone, (c) heat-affected zone, (d) base metal).
Figure 5.
Sectional images of laser welds formed at a laser power of 3 kW and a welding speed of 8 m/min at a 0-mm focal position using a 450-mm focusing optic system ((a) macrosection, (b) fusion zone, (c) heat-affected zone, (d) base metal).

Figure 6.
EBSD phase maps of laser-welded medium-Mn-content steel (■ BCC; ■ FCC; misorientation angle > 10°): (a) base metal; (b) heat-affected zone; (c) fusion zone; (d) definition of welds and Electron backscatter diffraction (EBSD) measuring points; (e) Measured phase fraction and average grain size of each region. Laser welds were fabricated at a laser power of 3 kW and a welding speed of 8 m/min using a 450-mm focusing optic system.

Figure 7.
Local Vickers hardness in fusion zone of laser welds formed using a laser power of 3 kW and a welding speed of 8 m/min at a 0 mm focal position using a 450-mm focusing optic system: (a) the hardness of the dendrite arm and dendrite arm spacing region and (b) optical images of measurement points.
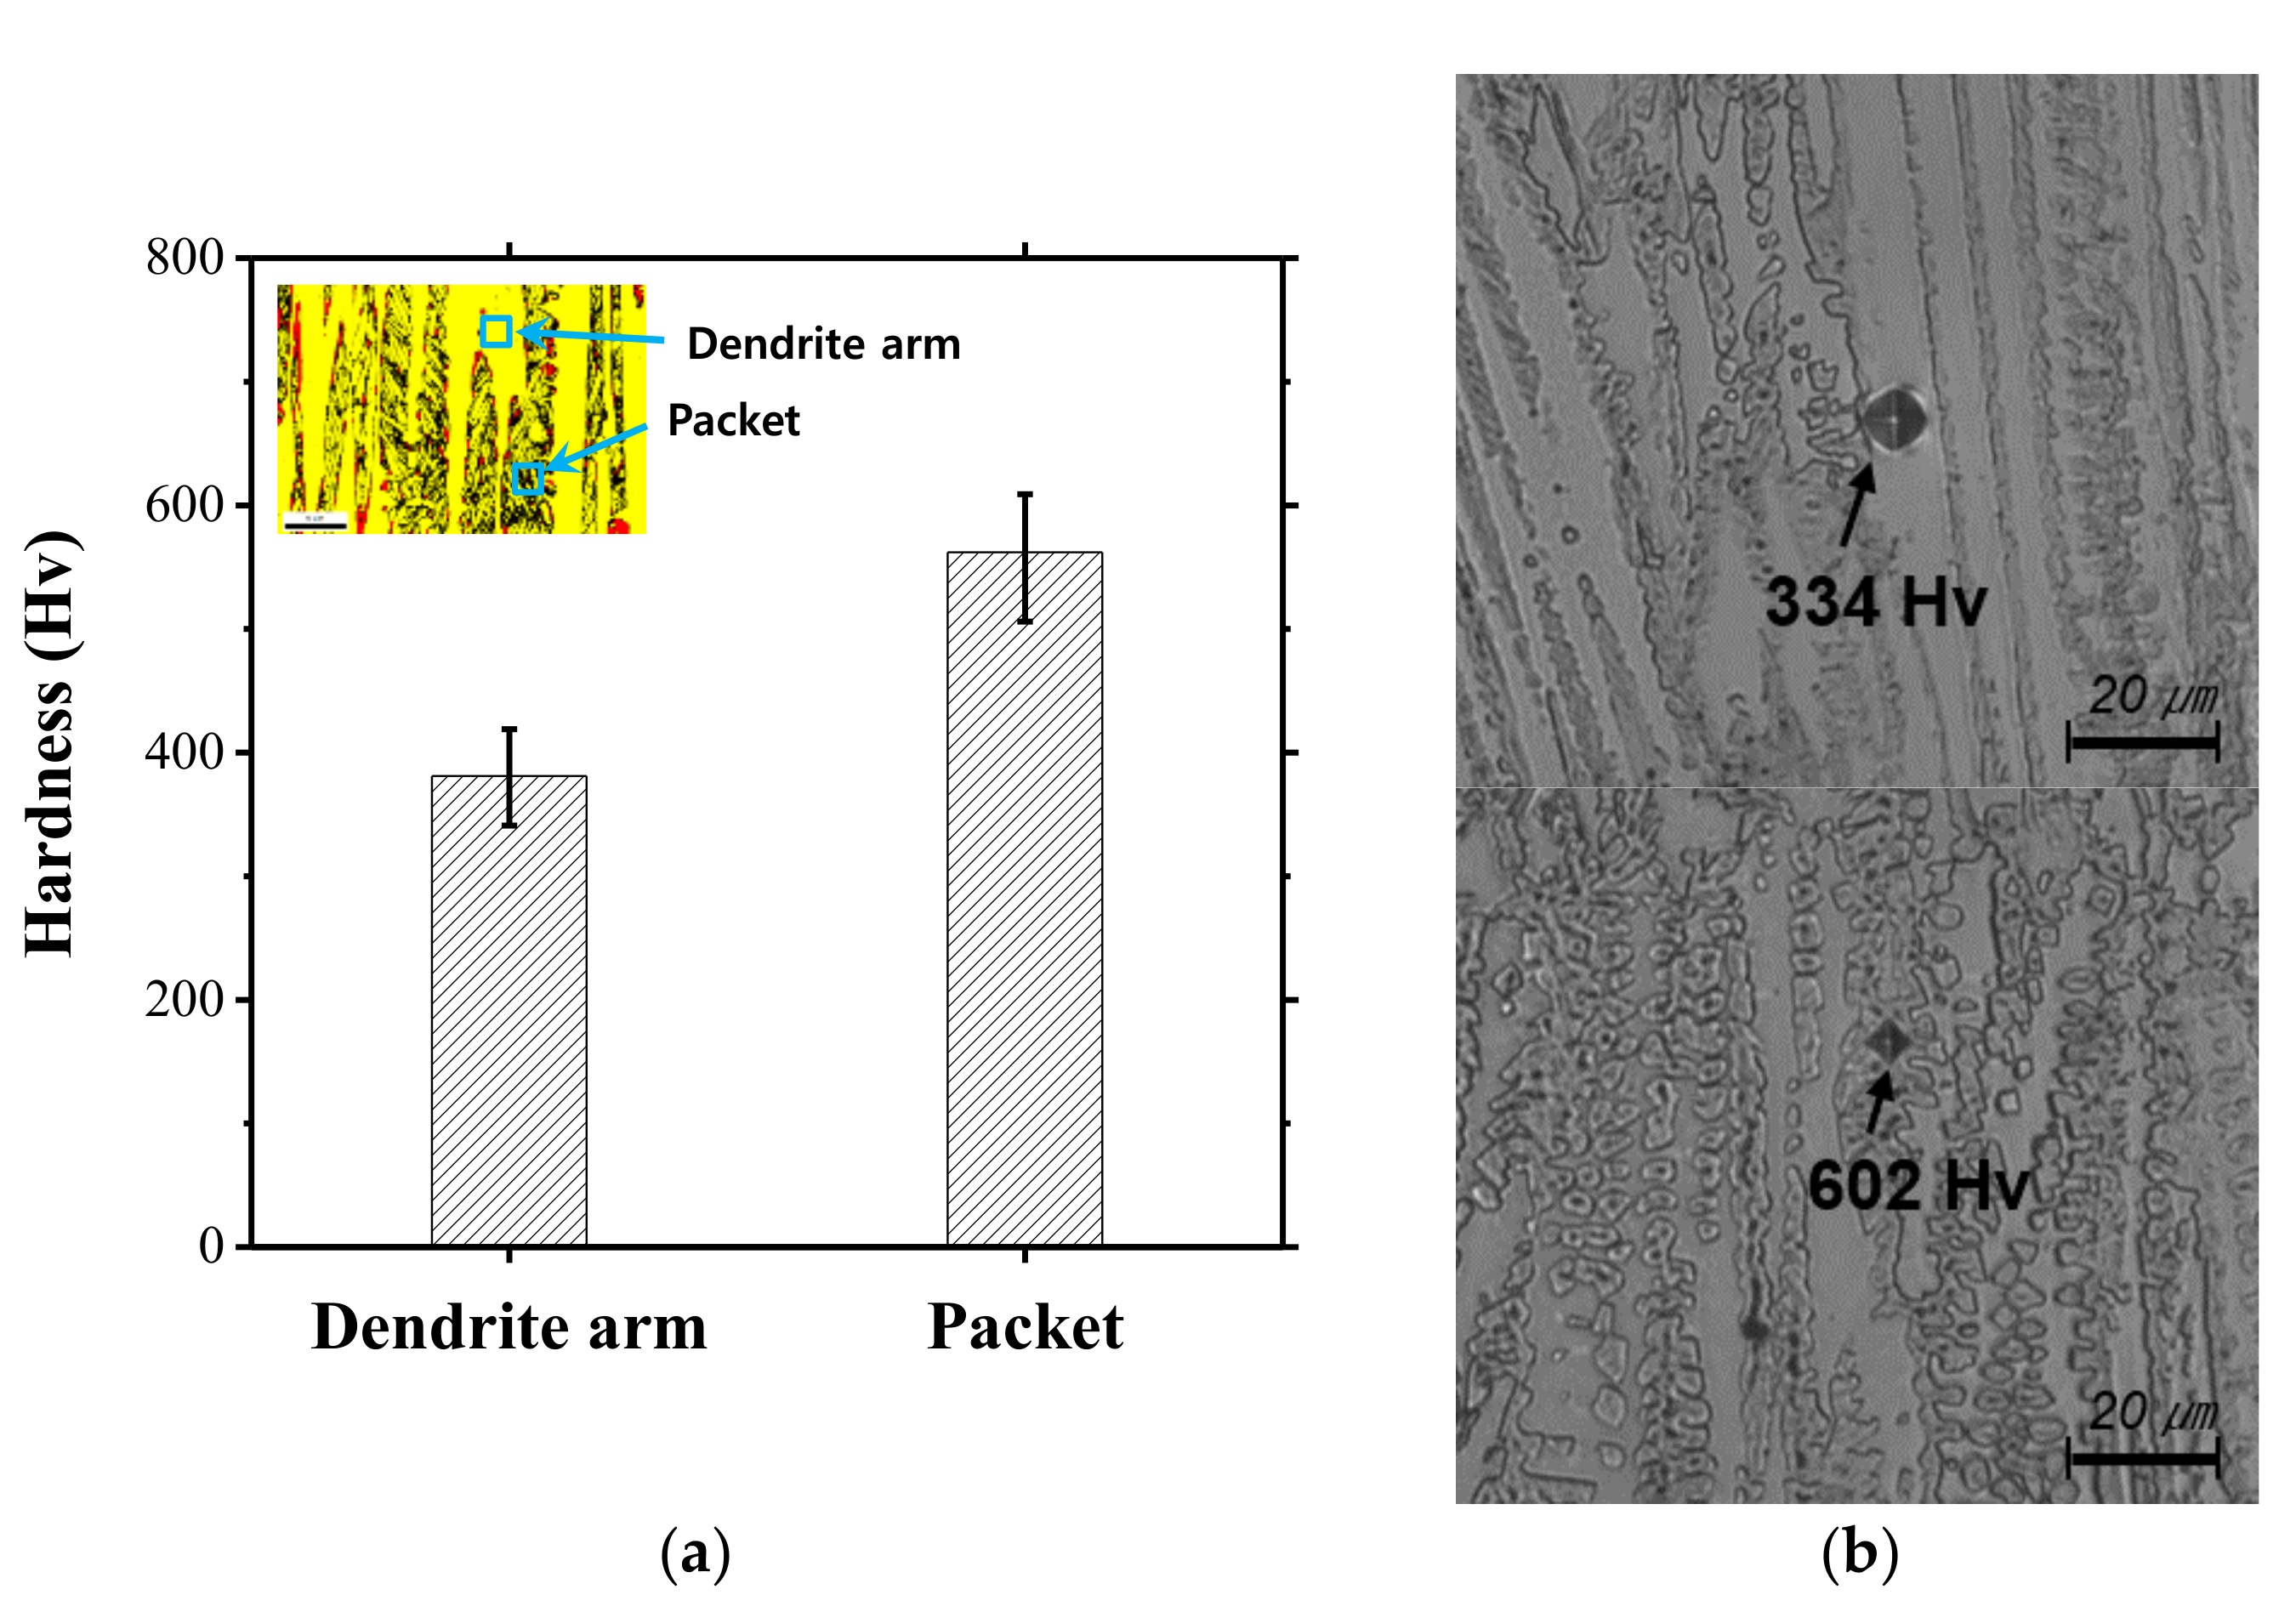
Figure 8.
(a) Local true strain calculated using DIC program and (b) measurement positions and map of true strain, which depends on engineering strain (ɛENG) from 3% to 18.9%. Specimen was prepared using a laser power of 4 kW and a welding speed of 10 m/min at a 0 mm focal position.
Figure 8.
(a) Local true strain calculated using DIC program and (b) measurement positions and map of true strain, which depends on engineering strain (ɛENG) from 3% to 18.9%. Specimen was prepared using a laser power of 4 kW and a welding speed of 10 m/min at a 0 mm focal position.

Figure 9.
Hardness values measured before and after the tensile test, and the austenite fraction in the welds. Specimen was prepared using a laser power of 4 kW and a welding speed of 11 m/min.
Figure 9.
Hardness values measured before and after the tensile test, and the austenite fraction in the welds. Specimen was prepared using a laser power of 4 kW and a welding speed of 11 m/min.

Figure 10.
SEM observations of HAZ of 10% of the elongated tensile specimen: (a) formation of voids at interface between phases and (b) propagation of nucleated voids to ferrite matrix. Specimen was prepared using a laser power of 4 kW and a welding speed of 10 m/min.
Figure 10.
SEM observations of HAZ of 10% of the elongated tensile specimen: (a) formation of voids at interface between phases and (b) propagation of nucleated voids to ferrite matrix. Specimen was prepared using a laser power of 4 kW and a welding speed of 10 m/min.
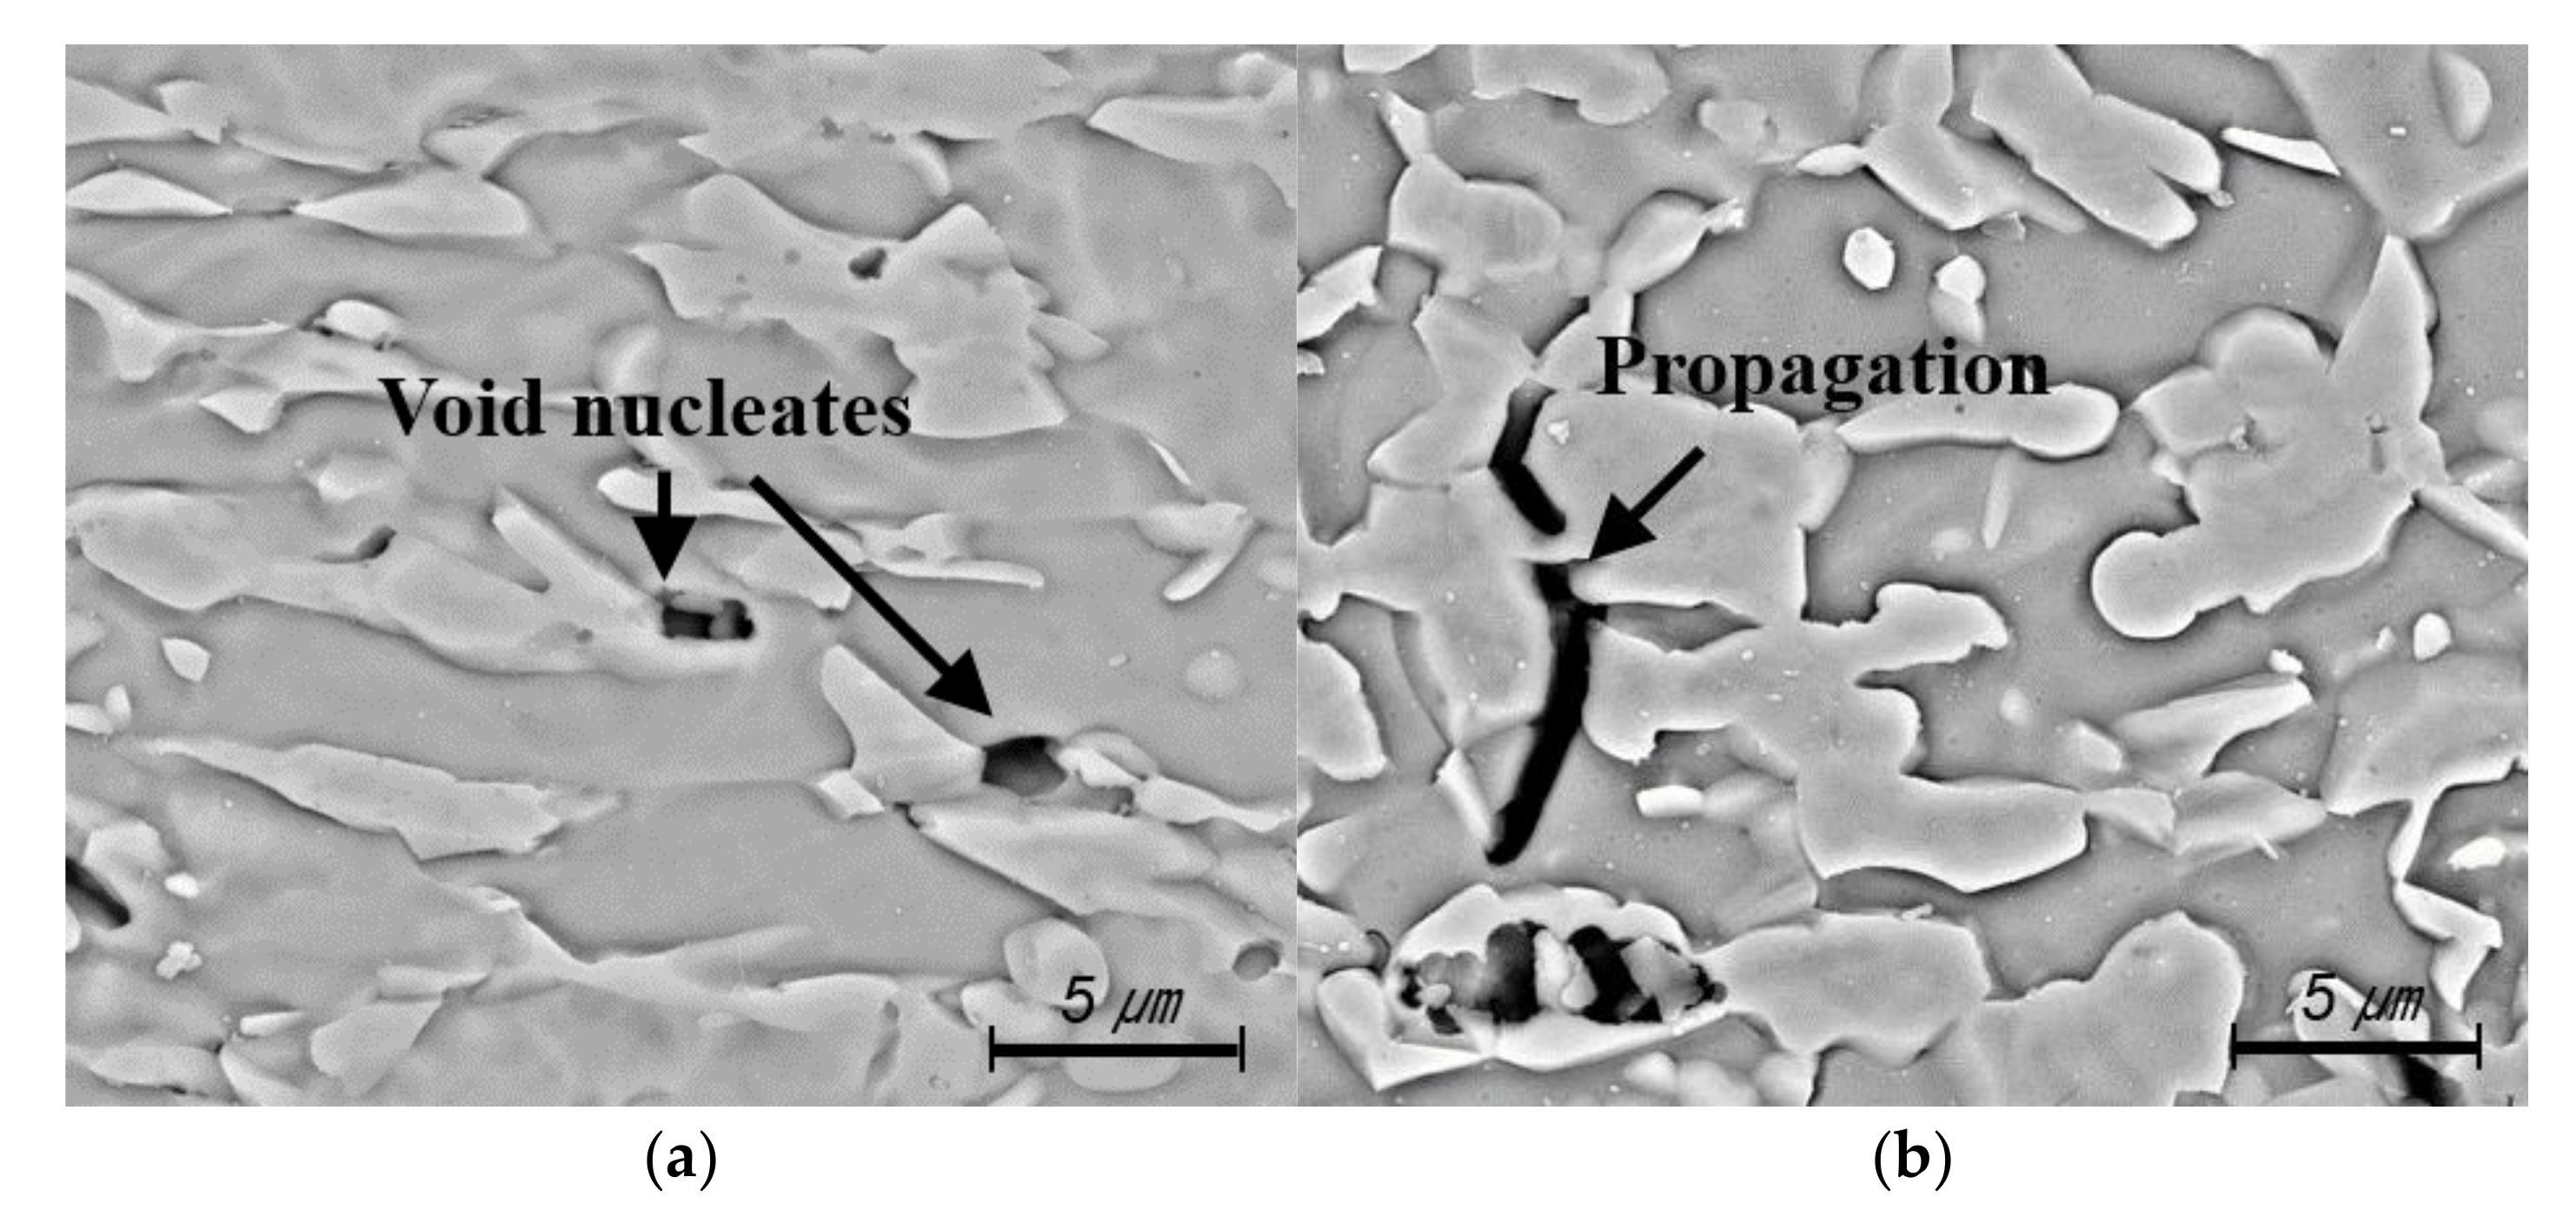
Figure 11.
(a) Hardness profile of the welded specimen of the various heat input conditions at the middle of the thickness. Specimen was prepared using a laser power of 4 kW with a welding speed of 9 to 11 m/min; (b) load-displacement curves of all constituent phase.
Figure 11.
(a) Hardness profile of the welded specimen of the various heat input conditions at the middle of the thickness. Specimen was prepared using a laser power of 4 kW with a welding speed of 9 to 11 m/min; (b) load-displacement curves of all constituent phase.

Table 1.
Chemical composition and mechanical properties of base material.
| Chemical Composition (wt %) | Mechanical Properties | ||||||
|---|---|---|---|---|---|---|---|
| C | Mn | Al | Si | Fe | Yield Strength (MPa) | Tensile Strength (MPa) | Elongation (%) |
| 0.3 | 3.7 | 5.2 | 0.11 | Bal. | 506 | 824 | 43 |
Table 2.
Laser welding conditions.
| No. | Laser Power, P (kW) | Welding Speed, WS (m/min) | Heat Input, H (kJ/m) |
|---|---|---|---|
| 1 | 3 | 8 | 22.5 |
| 2 | 9 | 20.0 | |
| 3 | 10 | 18.0 | |
| 4 | 4 | 9 | 26.7 |
| 5 | 10 | 24.0 | |
| 6 | 11 | 21.8 |
© 2017 by the authors. Licensee MDPI, Basel, Switzerland. This article is an open access article distributed under the terms and conditions of the Creative Commons Attribution (CC BY) license (http://creativecommons.org/licenses/by/4.0/).
Share and Cite
MDPI and ACS Style
Kang, M.; Kim, Y.-M.; Han, H.N.; Kim, C. Effects of Phase Evolution on Mechanical Properties of Laser-Welded Ferritic Fe-Al-Mn-C Steel. Metals 2017, 7, 523. https://doi.org/10.3390/met7120523
AMA Style
Kang M, Kim Y-M, Han HN, Kim C. Effects of Phase Evolution on Mechanical Properties of Laser-Welded Ferritic Fe-Al-Mn-C Steel. Metals. 2017; 7(12):523. https://doi.org/10.3390/met7120523
Chicago/Turabian StyleKang, Minjung, Young-Min Kim, Heung Nam Han, and Cheolhee Kim. 2017. "Effects of Phase Evolution on Mechanical Properties of Laser-Welded Ferritic Fe-Al-Mn-C Steel" Metals 7, no. 12: 523. https://doi.org/10.3390/met7120523
Note that from the first issue of 2016, this journal uses article numbers instead of page numbers. See further details here.