Deformation Behavior of Al0.25CoCrFeNi High-Entropy Alloy after Recrystallization


Laboratory of Applied Physics and Mechanics of Advanced Materials, College of Materials Science and Engineering, Taiyuan University of Technology, Taiyuan 030024, China
*
Author to whom correspondence should be addressed.
Metals 2017, 7(4), 111; https://doi.org/10.3390/met7040111
Submission received: 27 December 2016
/
Revised: 12 March 2017
/
Accepted: 21 March 2017
/
Published: 24 March 2017
(This article belongs to the Special Issue High-Entropy Alloys (HEAs))
Abstract
:Cold rolling with subsequent annealing can be used to produce the recrystallized structure in high entropy alloys (HEAs). The Al0.25CoCrFeNi HEAs rolled to different final thickness (230, 400, 540, 800, 1000, 1500 μm) are prepared to investigate their microstructure evolutions and mechanical behaviors after annealing. Only the single face-centered cubic phase was obtained after cold rolling and recrystallization annealing at 1100 °C for 10 h. The average recrystallized grain size in this alloy after annealing ranges from 92 μm to 136 μm. The annealed thin sheets show obviously size effects on the flow stress and formability. The yield strength and tensile strength decrease as t/d (thickness/average grain diameter) ratio decreases until the t/d approaches 2.23. In addition, the stretchability (formability) decreases with the decrease of the t/d ratio especially when the t/d ratio is lower than about 6. According to the present results, yield strength can be expressed as a function of the t/d ratio.
1. Introduction
High-entropy alloys (HEAs) are a brand-new alloy system, which abandons traditional alloy design concepts and mixes multiple principle elements in an equimolar or near-equimolar ratio to form a simple solid solution [1,2]. Attributed to the high mixing configurational entropy, HEAs always remain as stable crystal structures, such as body-centered cubic (BCC) [3], face-centered cubic (FCC) [4,5], or hexagonal close-packed (HCP) [6], rather than complex intermetallic phases [5,7,8]. The definition and rules governing the phase formation in HEAs are a matter of great interest and debate at present [9,10]. However, the structure of HEA solid solutions are significantly different from those of Hume–Rothery terminal solid solutions, and this offers many potential applications, including tools, molds, and mechanical parts [11]. Despite those advances in studying microstructure and mechanical properties of mm-sized HEAs [12,13,14], systematic investigations into the mechanical behavior of annealed HEAs [15,16], especially at small scales, is lacking [17]. Praveeno et al. [18] observed the phase transformation from BCC to sigma in CoFeNi-Cr HEAs after annealing at 500–600 °C. Wu [19] studied the phase stability and recovery, recrystallization, and grain growth of the FeNiCoCrMn HEAs after rolling and annealing. Wang et al. [20] studied size effects on the microstructures and mechanical properties of AlCoCrFeNi HEAs. They found that both the strength and plasticity are enhanced significantly as the specimen size was decreased. The yield (ultimate) strength of rod specimens with 2 mm in diameter was 1425 MPa (2920 MPa), which was 1.13 (1.60) times than that in the 10 mm condition. Raghavan et al. [21] reported size effects in a single crystalline equiatomic FeCrCoMnNi HEA, and the dependence of the yield strength on the micropillar diameter follows a power law with an exponent of −0.32. No detailed studies have been focused on the size effect of annealed HEAs.
HEAs with high strength and ductility could alleviate some of these concerns by reducing weight and improving stretchability (formability). Due to the trend of miniaturization on electrical devices and medical devices [22], the need for microscale parts is increasing at a tremendous rate [23]. According to Yole Développement’s research [24], in the years from 2013 to 2018, the market of MEMS/MST (Micro-System Technology) will grow at 12–13% per year, from US$11 billion in 2012 to US$22.5 billion in 2018, for upwards of 23.5 billion MEMS/MST products. Therefore, micro-manufacturing technologies have drawn much attention from both industrial practice and academic research in the metal-forming field [25]. However, when the size of the samples become very small, to a critical thickness, the mechanical properties and damage behaviors of the materials will have obvious size effects [26,27,28]. The flow stress decreased with the thickness of samples decreasing from several millimeters to one hundred micrometers [25,29,30].
In this study, the deformation behaviors of heavily cold-rolled Al0.25CoCrFeNi HEAs after heat treatments were investigated. It is helpful to understand the size effects on the mechanical behavior of thin-sheet HEAs to obtain an accurate constitutive model at the micro-scales.
2. Experiments
The alloys with a nominal composition of Al0.25CoCrFeNi (in at %) were synthesized by copper-mold suction-casting in a Ti-gettered high-purity argon atmosphere. To achieve homogeneous distribution of elements, the ingots were remelted at least four times, and then were suction-casted into a rectangular mold (85 × 10 × 2 mm). The purity of each of the raw materials was at least 99.9 wt %.
The plates were subsequently cold rolled along the longitudinal direction at room temperature to obtain different thicknesses (230, 400, 540, 800, 1000, 1500 μm). The plates were subjected to a homogenization treatment at 1100 °C for 10 h to obtain a fully-recrystallized microstructure. The plates were cooled down to room temperature in a common heat treatment furnace. A set of specific ratios of material thicknesses and average grain diameters were measured.
The phase of annealed Al0.25CoCrFeNi plates were identified using X-ray diffraction. Grain images were captured using an optical microscope (OM, 4XC, Shanghai, China) and ZEISS SUPRA 55 scanning electron microscope (SEM, Tescan, Brno, Czech Republic) equipped with energy dispersive X-ray spectrometry (EDS, Tescan, Brno, Czech Republic). The OM images were imported into Image-Pro Plus software (Media Cybernetics, Annapolis, MD, USA) to measure the grain size. To ensure the accuracy of the results, there were at least 200 grains were measured. Electron backscattered diffraction (EBSD) was carried out using a JEOL JSM-7100F scanning electron microscope (SEM, JEOL, Tokyo, Japan) operated at 30 kV and a sample tilt of 70°. The obtained EBSD patterns were indexed by using FCC copper as the base crystal structure, and were analyzed using the commercially available HKL Channel 5 (Oxford Instruments, High Wycombe, UK). The samples for EBSD and SEM were prepared using standard electropolishing techniques (electrolyte: 75% acetic acid + 25% perchloric acid). ASTM-E112 standard [31] was used to determine the average grain diameters, also called grain sizes, and they were analyzed from the free surface (along top surface of sheets not the thickness). Analysis of the free surface was required in order to achieve a particular standard deviation in accordance to ASTM standards. Uniaxial tensile experiments were carried out on samples using an Instron 5969 materials testing machine (Instron, Boston, MA, USA) at room temperature at a strain rate of 5 × 10⁻⁴ s−1 along the longitudinal direction (gauge length and width of the tensile specimens were 10 and 2 mm, respectively). For each batch, there were more than five samples used for the tensile experiments.
3. Results and Discussion
3.1. Phase and Microstructure after Heat Treatment
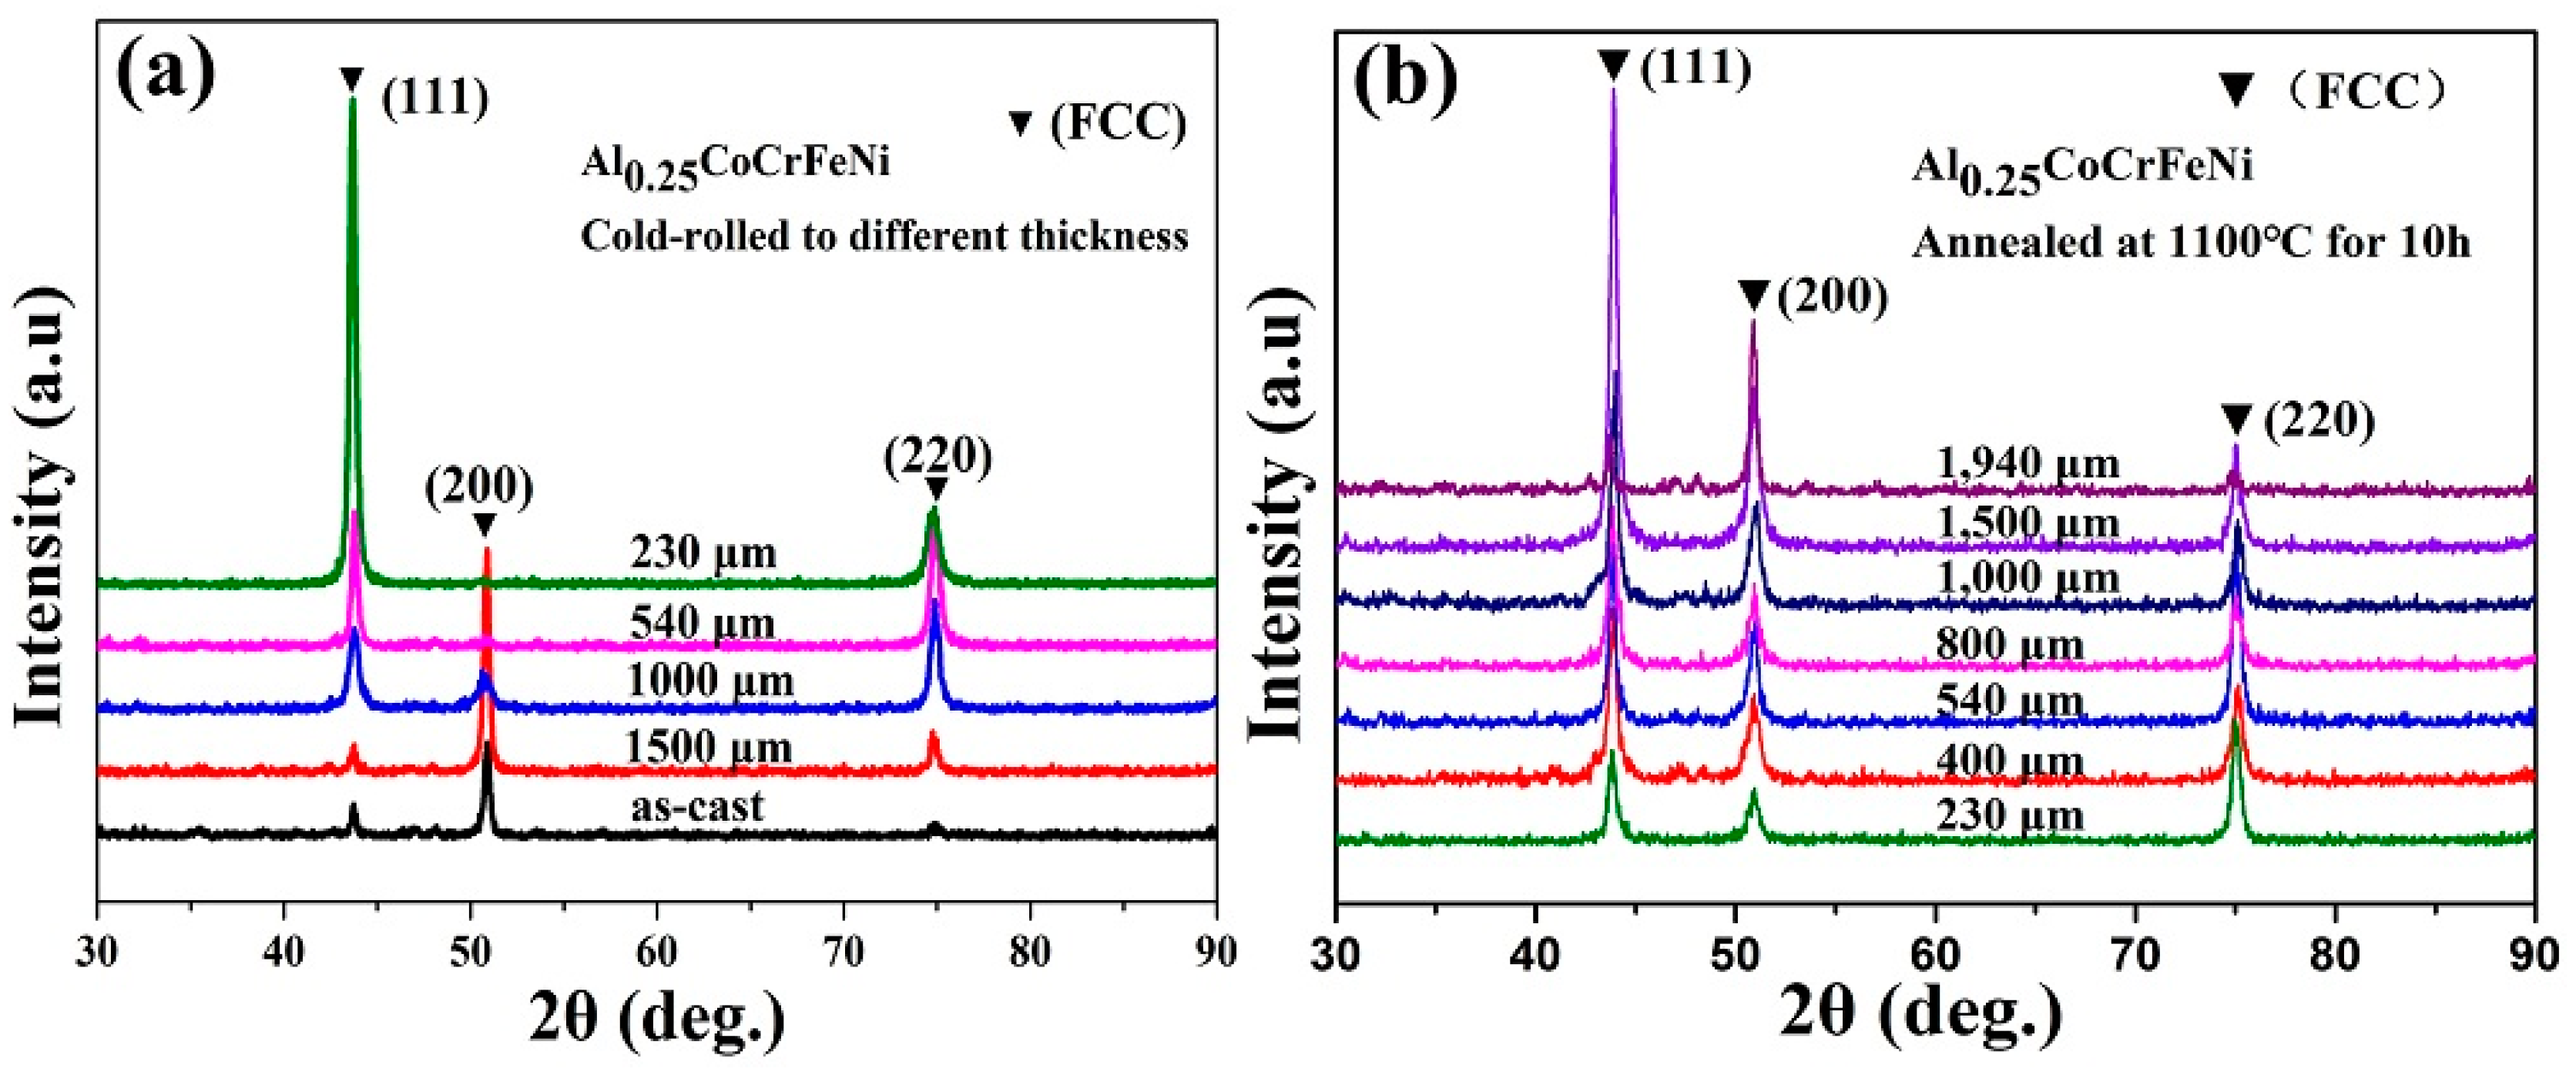
Figure 1a presents the X-ray diffraction (XRD) patterns of the alloy in the as-cast and cold-rolled conditions. Only simple FCC phase was detected in all conditions, suggesting that the alloy has good structural stability against severe plastic deformation. Figure 1b shows the XRD patterns of Al0.25CoCrFeNi HEAs with different thicknesses, which clearly illustrate the formation of a single FCC phase, and no ordered BCC (B2) phase or Cr-enriched sigma phase were detected. The diffraction peaks in the XRD patterns between (111) and (200) Bragg peaks may be the tetragonal phase peaks or the miscellaneous peaks considering the uncertainty of the measurement. Additional SEM-BSE and TEM (results not shown) investigations were also performed to prove a single FCC phase in the annealed HEAs. And the 230 μm-thickness sample did not show the weak diffraction peaks. The Cr-enriched sigma phases have been detected in other HEAs such as CoCrFeNi [18], Co0.5CrFeMn1.5Ni [32], CoCr2FeNi HEAs [32] and CoCrFeMnNi [33]. It is noted that the formation of B2 phase takes place at both 700 and 900 °C for 72 h in Al0.3CoCrFeNi HEAs [12]. It is likely that no clustering should occur at the homogenization temperature (1100 °C) in both as-cast and deformed Al0.25CoCrFeNi HEAs [34], which have been illustrated by the calculated isopleth of AlxCoCrFeNi HEAs with x = 0–2 [35]. So strong-α fiber (<110>//ND) component texture was developed after heat treatment in the deformed HEAs with less stacking faults [36]. It could be confirmed by the XRD patterns that the peak intensity ratio, I220/I200, varies remarkably during annealing.
Figure 2a shows a typical OM map of cold-rolled HEAs with a thickness of 400 μm. The presence of numerous deformed bands and shear bands can be easily identified, marked by arrows in Figure 2a, which leads to extensive fragmentation of the grains. The EBSD inverse pole figure (Figure 2b) for the specimen annealed at 1100 °C with the thickness of 400 μm reveals the development of an equiaxed microstructure. The grains became equiaxed due to recrystallization, and dislocations are rarely observed in Figure 2b. It can be clearly seen that the grain sizes of the sheets were about 100 μm approaching to the average grain size (92.1 μm) in Figure 3b and Figure 4a. The texture of the <100> and <111> along the rolling direction of the annealed Al0.25CoCrFeNi HEA sheets was confirmed by the EBSD orientation data, as shown in Figure 2b. The α-{110} type texture was developed after annealing in the deformed HEAs corresponding to the XRD patterns in Figure 1. The distribution of the grain boundary misorientation angle for the annealed HEAs is shown in Figure 2c, and the fraction of the high angle grain boundary was higher than that of the low angle grain boundary, indicating the recrystallization of the deformed HEAs after annealing.
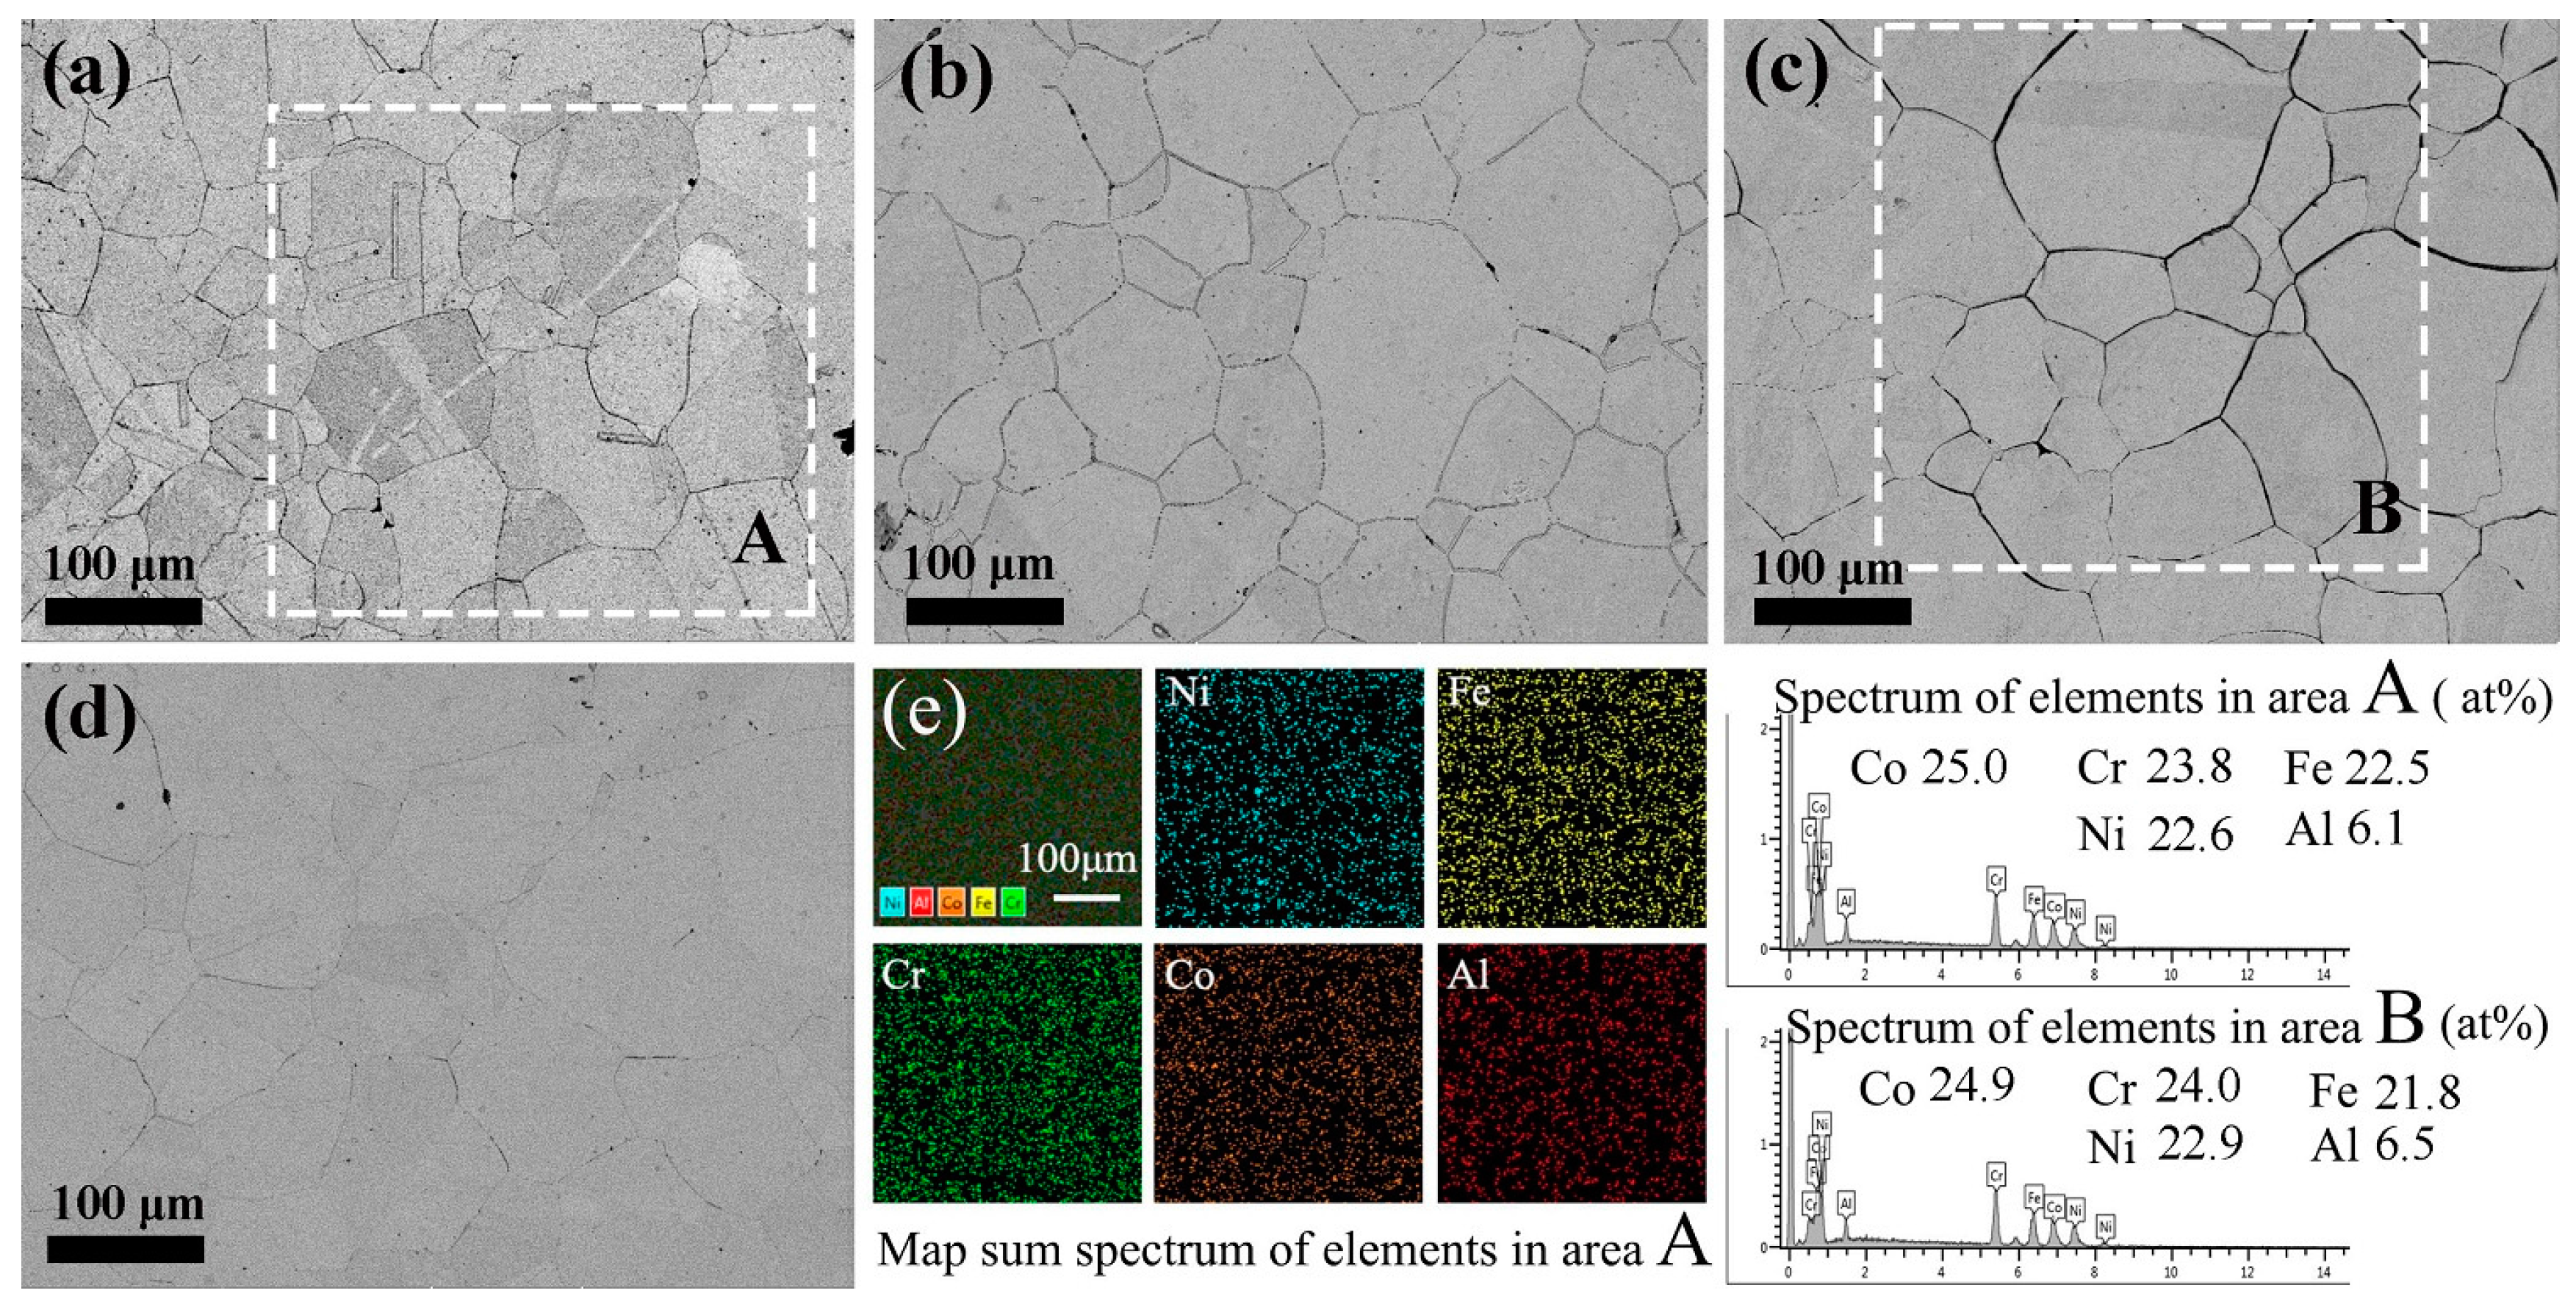
Backscattered electron (BSE) images of HEAs annealed at 1100 °C for 10 h after cold rolling to 400, 800, 1000, and 1500 μm in thickness are displayed in Figure 3a–d, respectively. All images show an equiaxed grain microstructure after recrystallization. Only the single FCC phase is observed, and no B2 phase or sigma phase is found. Pickering first reported the formation of two types of Cr-rich precipitate (M23C6 and the σ phase) in a coarse-grained CrMnFeCoNi following prolonged exposures at 700 °C with BSE images [37]. EDS performed under the BSE mode shows all elements are homogeneously distributed in area A, as shown in Figure 3e. Compared to the nominal composition, it seems that elemental segregation is not obvious by considering the uncertainty of the measurement in areas A and B. Interestingly, annealing for 10 h at 1100 °C produces a slight coarsening (compared with Figure 3a,d), and the average grain size in Figure 3b–d did not show significant differences, which can be confirmed by the SEM images in Figure 3.
3.2. Size Effects in Thin-Sheet HEAs
The feature size is the thickness of the specimens, which affects the mechanical behavior only by supposing that the grain sizes in the specimens are the same. Grain sizes affect the plastic flows, which are realized by grain slipping, rotating, and deformation. Traditionally, the grain-size dependent of the flow stress is modeled using the Hall–Petch relation:
where σ0 is the flow stress, while grain size is infinity; k reflects the influence of the grain boundary on deformation; and d is the grain size. However, with decreasing the thickness of HEA sheets, the flow’s stress decreases, because the grains located at the free surface deforms more easily than those inside.
Considering both the feature size and grain size, the size-dependent flow stress-strain equation can be written as:
where l, t, and d are the elongation, thickness, and grain size of samples, respectively. In this study, only the grain size and thickness influences are considered. Therefore, the size dependent flow stress-strain model can be written as:
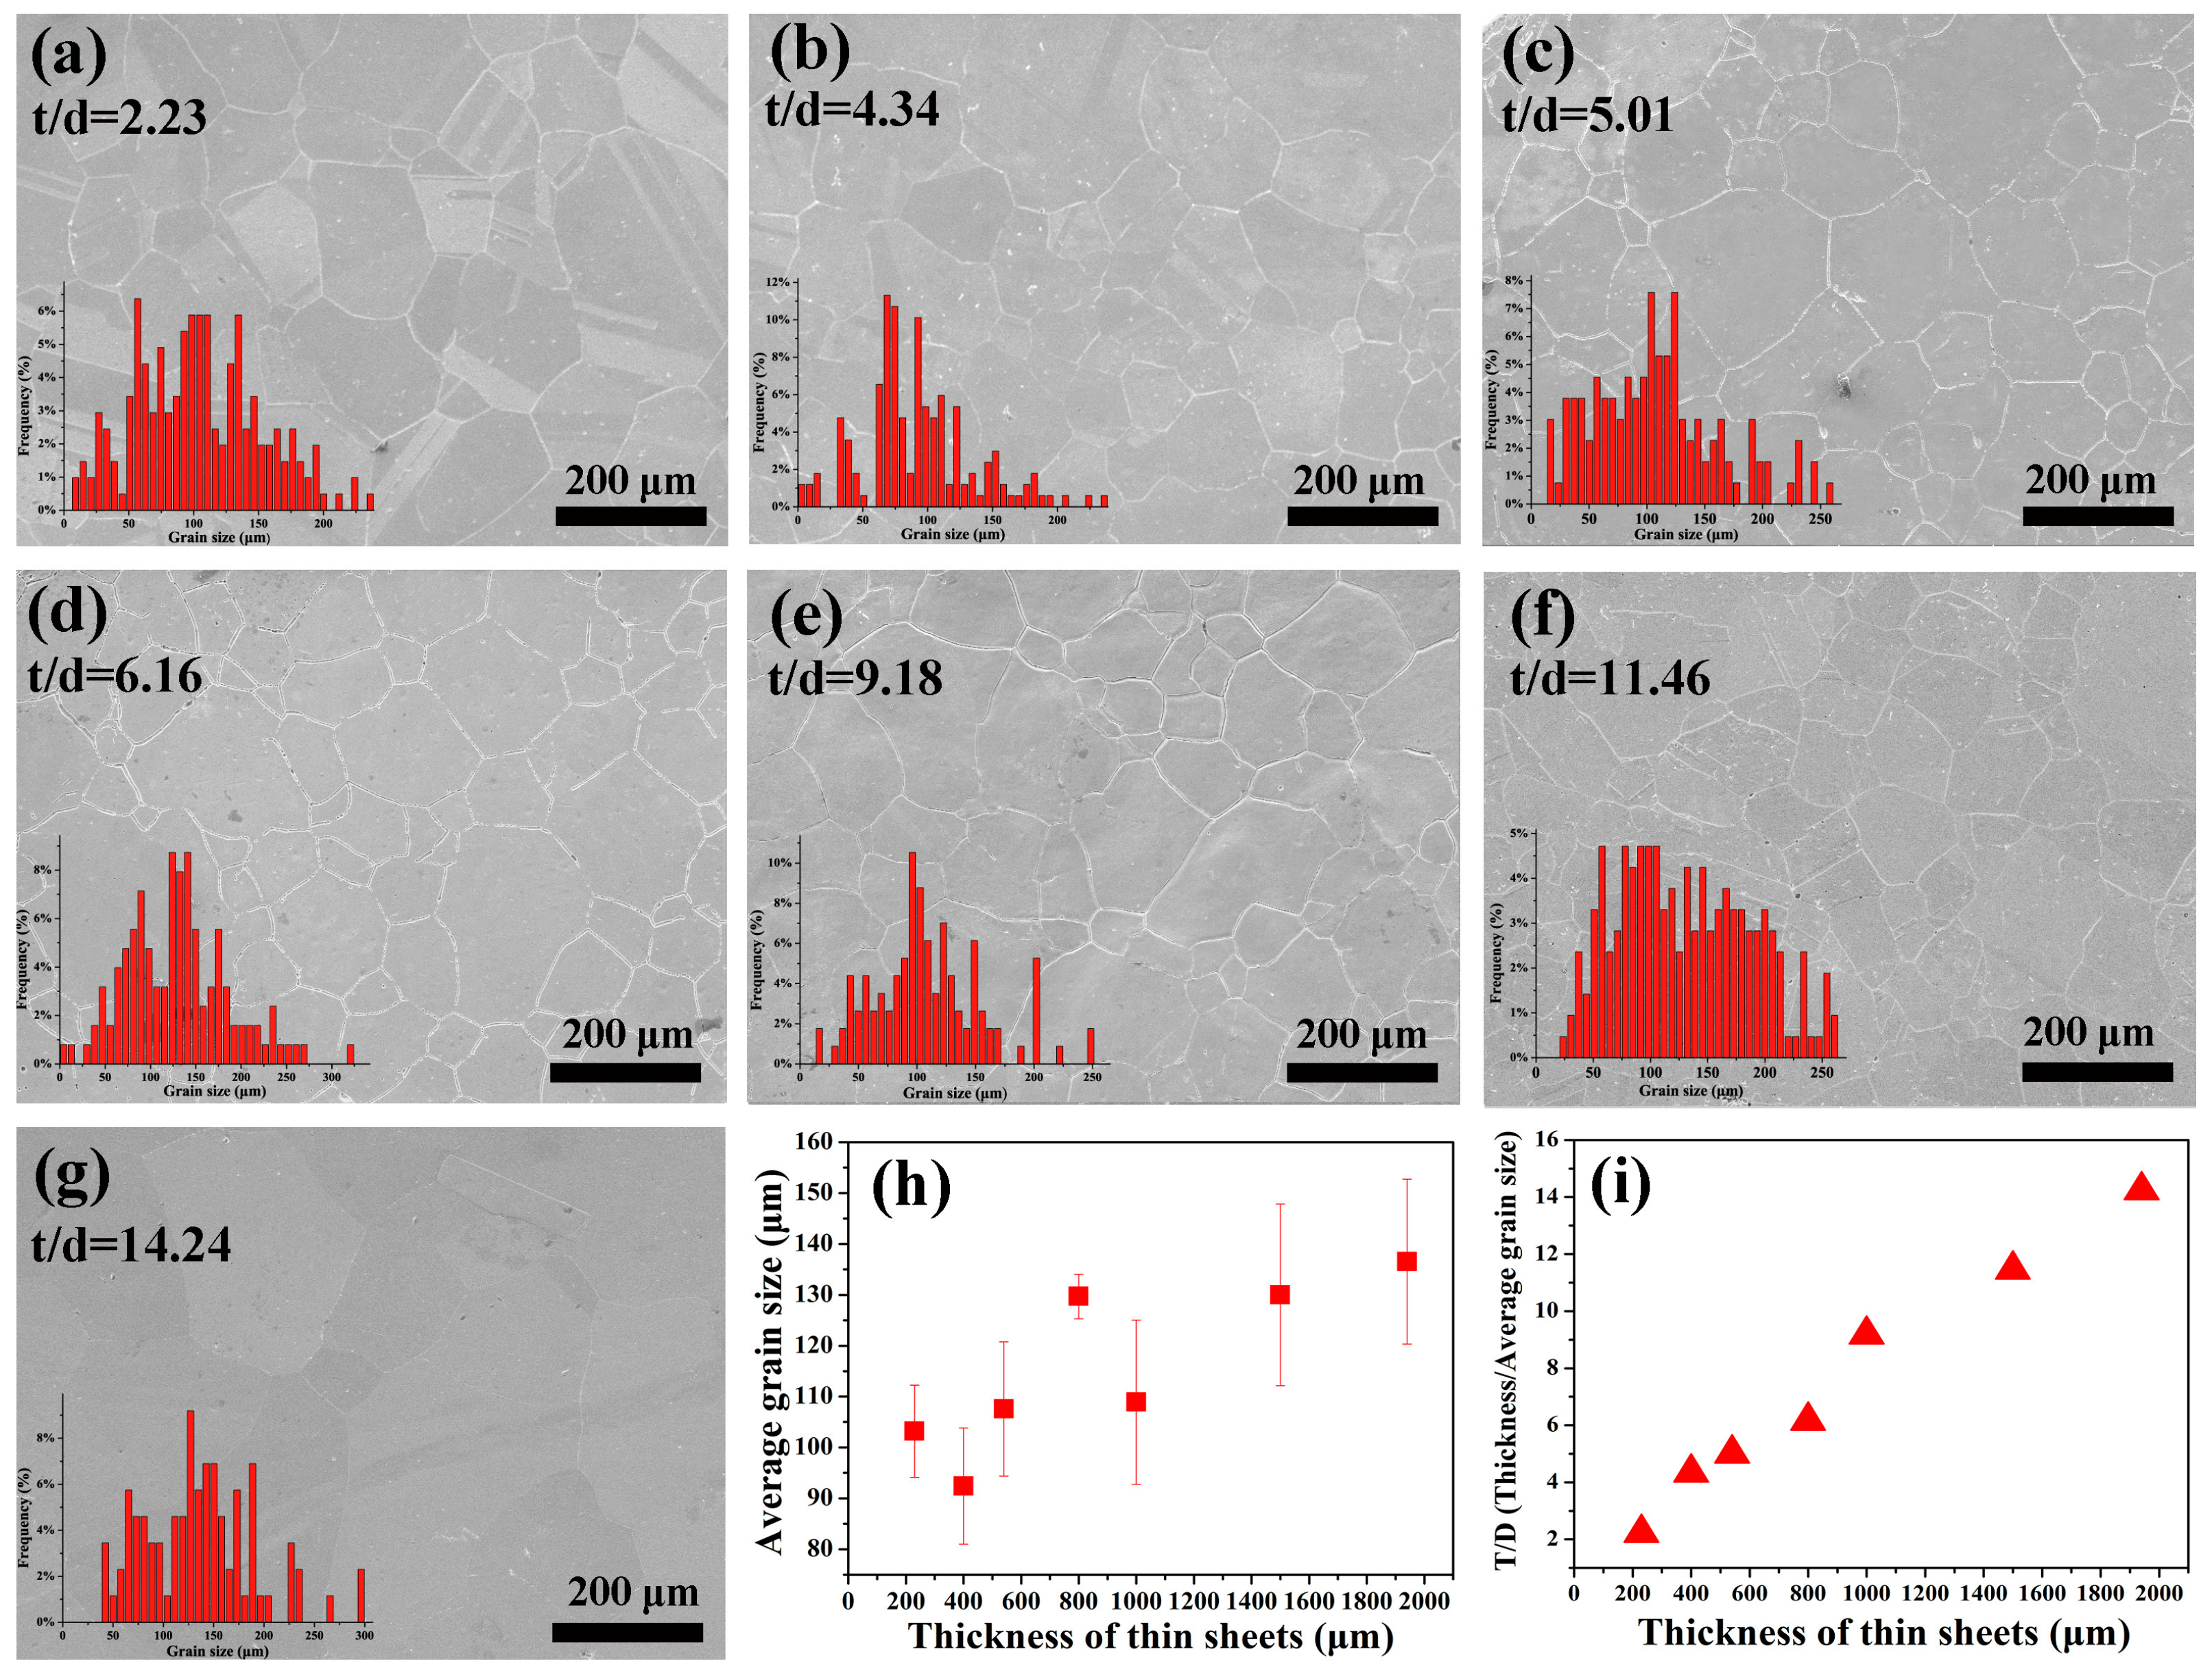
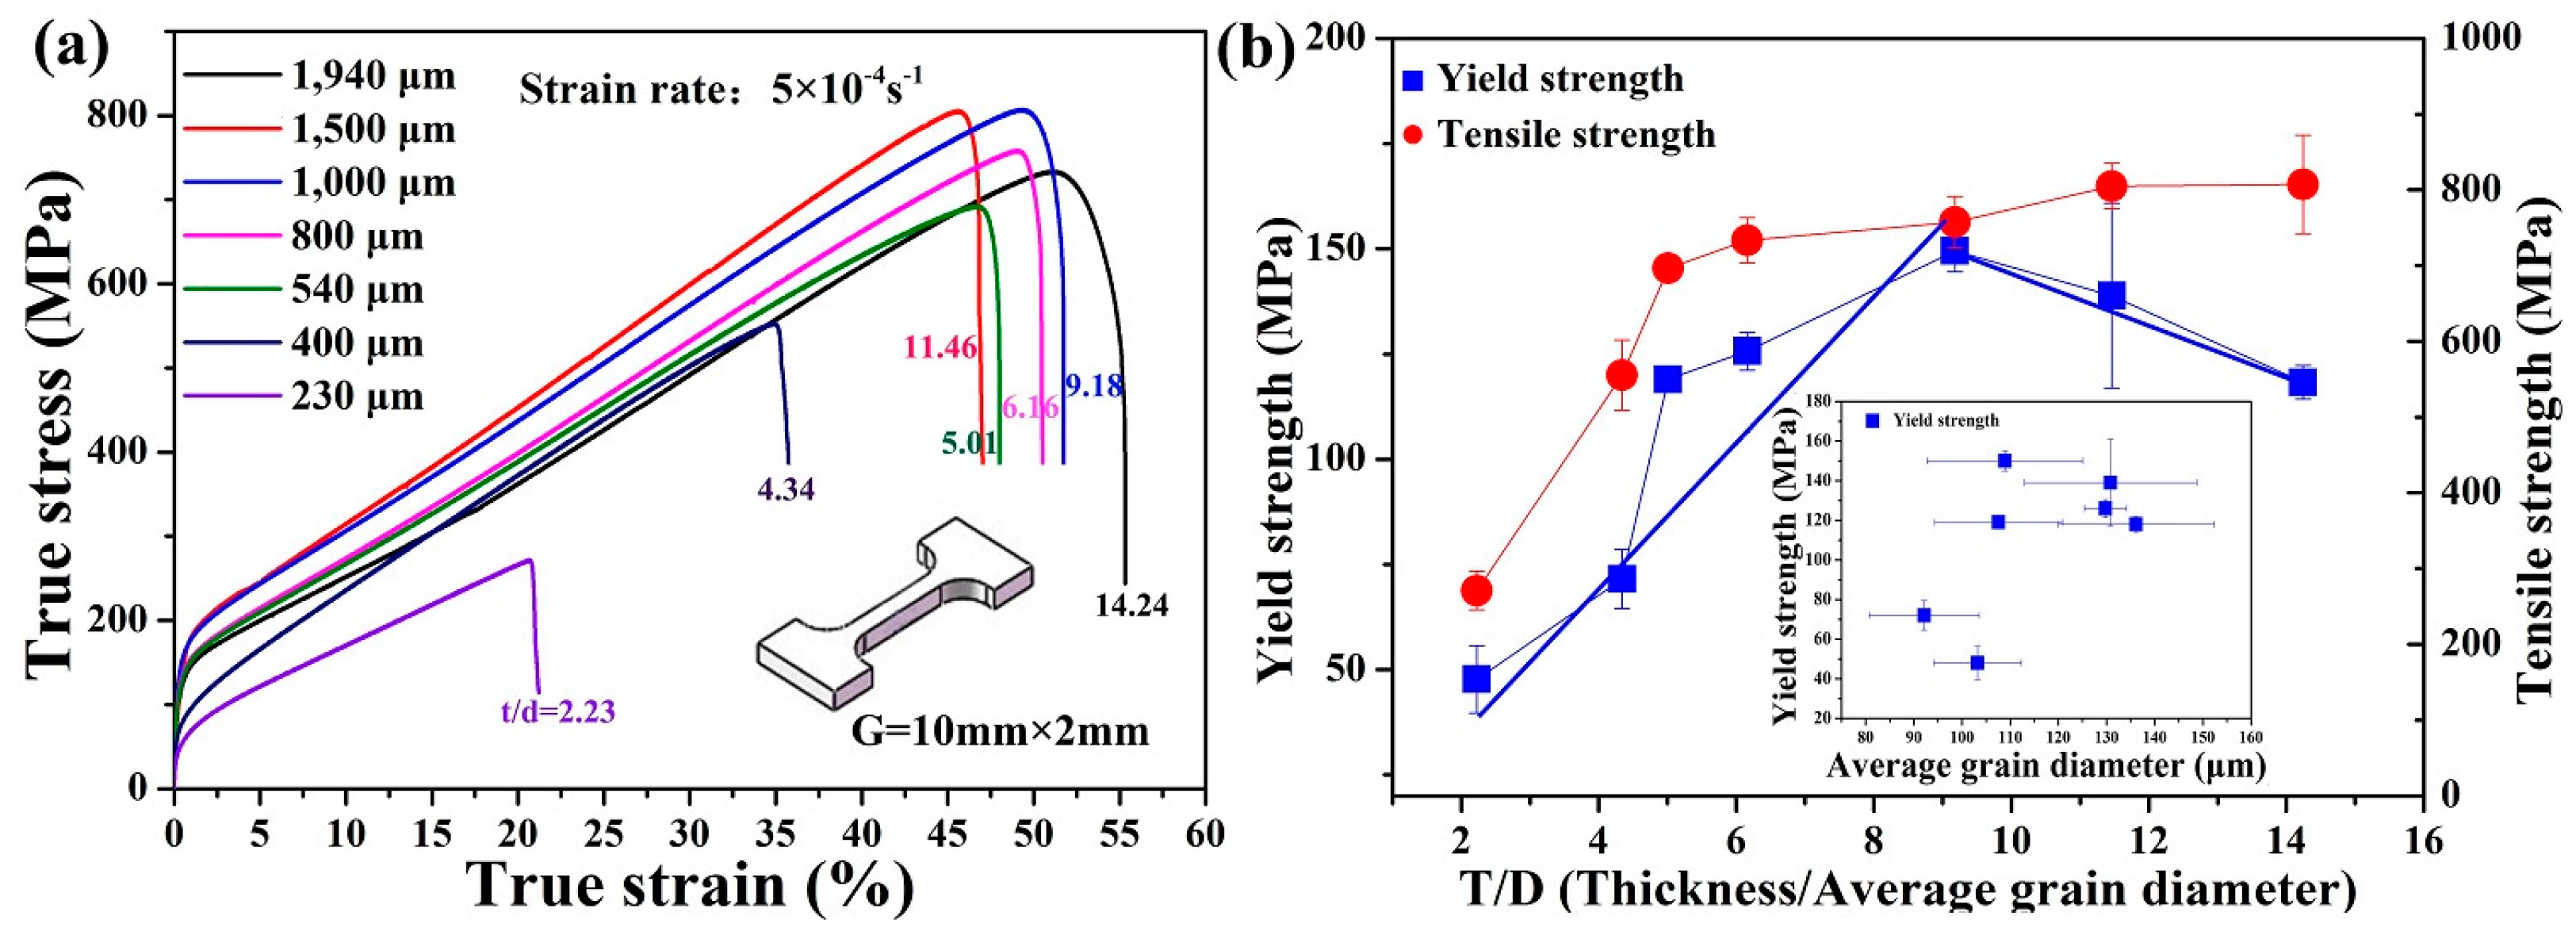
Figure 4a–g gives the frequency of average grain diameters with different thicknesses, and t/d represents the ratio of the specimen thickness and the average grain diameter. The inset in Figure 4a–g shows corresponding microstructures of Al0.25CoCrFeNi HEAs captured from the free surfaces. Figure 5a shows the true stress-strain curves with various thickness. Table 1 gives the results of tensile tests. It is obvious that the yield strength and tensile strength increase with increasing the sheet thickness, while the average grain size shows small changes. The yield strengths for all of the samples are lower than those of both hot-isostatic pressing coarse-grained Al0.1CoCrFeNi HEAs (160 MPa) [16] and single-crystal Al0.3CoCrFeNi HEAs (185 MPa) [38]. The yield strength and tensile strength decreases strongly with decreasing t/d ratio from 9.18 to 2.28 and, in contrast, once the t/d ratio is beyond about 10, the yield strength and tensile strength increase obviously with decreasing the grain size. Gau et al. [27] had studied the t/d ratio less than or close to 10 for microforming, and the size effects had to be considered during product design and manufacturing process design.
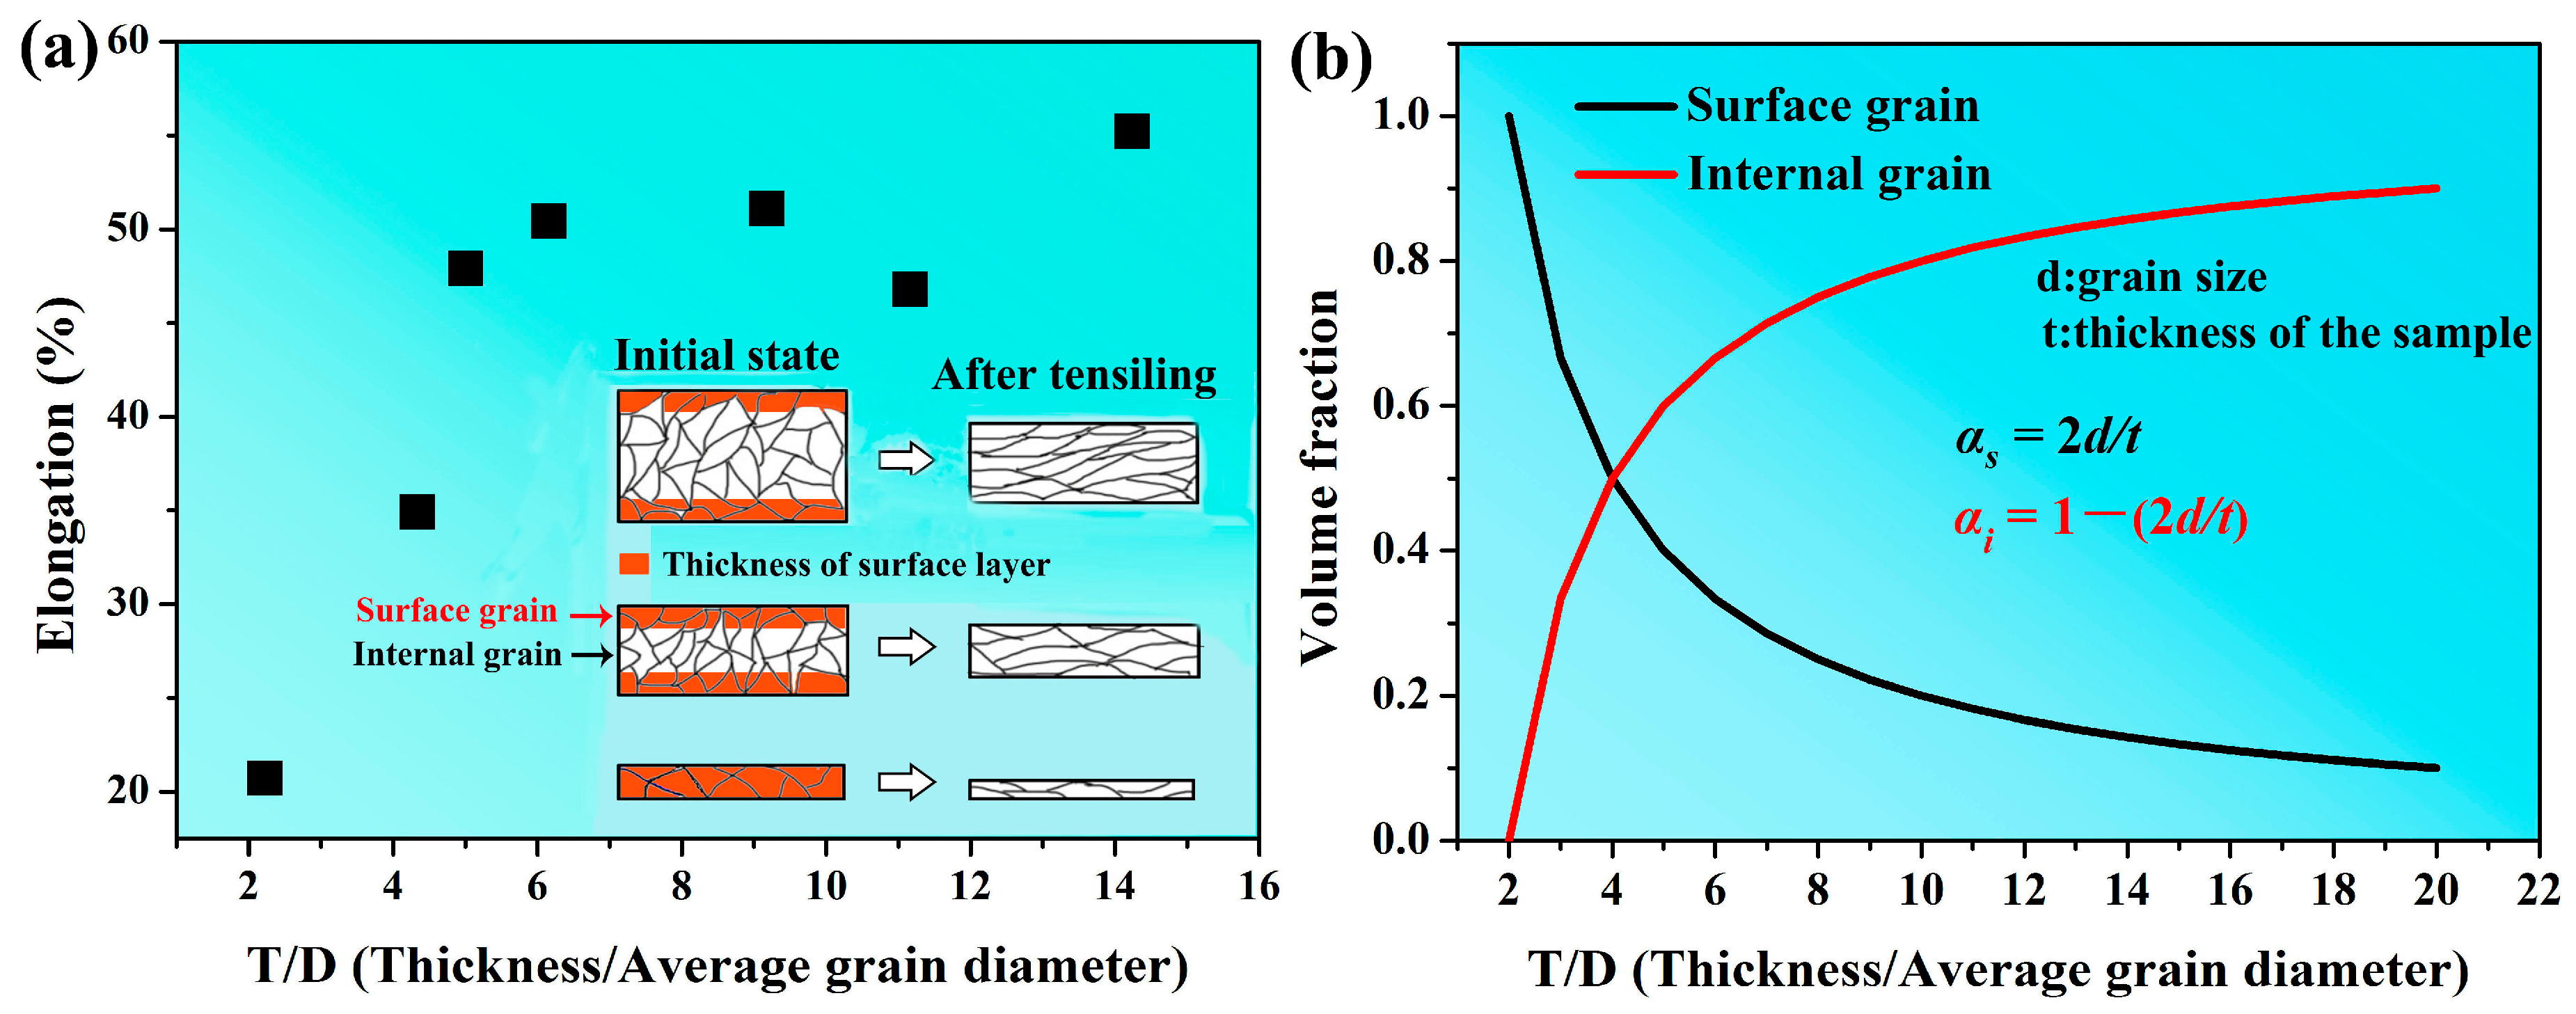
From Figure 5b, it is believed that both yield strength and the tensile strength have a linear relationship with the t/d, when the t/d is less than about 10. With increasing miniaturization, the flow stress varies with influence by the size effects, which could be explained by a surface model [39]. As shown in Figure 6, the grains located at the free surface are less restricted than the grains located inside of the materials. Surface grains, thus, do not affect the mechanical properties significantly. The volume fraction of surface grains (αs), however, increases with the decreasing number of grains along the thickness direction, resulting in the decrease of the flow stress. The present study only introduces a linear curve to describe the flow process before yielding. In the elastic deformation stage, the elastic modulus can be treated as the same value because the material’s flow behavior is not influenced by the specimen thickness. An approach to the quantification of the grain size and thickness of the samples to the yield strength is to assume that their contributions have a power-law form and can be superimposed as follows:
This consists of two parts. One is the size-effect independent part of the yield strength, σ0, and the other is the size-effect dependent part: (). The first one is from the grain boundaries (d: grain size), and the second contribution is from the surface grains (t/d: thickness relative to grain size). The first two terms in Equation (4) together form a well-known Hall–Petch relation, in which, commonly, m = 0.5 [40,41]. The classical theoretical arguments for the value of this exponent are based on dislocation source activation by pile-ups at the boundaries or work hardening by dislocations emitted from the grain boundaries [42]. The yield strength did show a strong relationship with t/d from Figure 5b. It is important to study the effects of t/d ratio on the yield strength. Generally, the yield strength can be modeled as follows:
Denis et al. investigated the yield strength of thin copper films on Kapton, and found that the yield strength depended strongly on the film thickness and could be fitted by [43]. Venkatraman and Bravman first separated the effects of the grain size and film thickness by electrolytically thinning Al films on Si substrates. It is found that n = 1 for the thickness effect, m = 1 may have been a more plausible exponent, although they used the HP analysis (m = 0.5) for the grain size effect [44]. Here, is defined as a constant. If n = −1, two straight fitting lines were fitted in Figure 5b, and the equations were fitted as follows:
The yield strengths for each specimen and k for different t/d are presented in Table 1 and Table 2, respectively. The size-effect independent part of the yield strength is defined as follows:
Here, σ0 = 110 MPa, , , and the size-effect dependent part of the yield strength function can be modeled as follows:
In this model, k is a coefficient. For 2.23 < t/d < 9.18, the t/d ratio dominates the yield strength. For 9.18 < t/d < 14.24, the values of k become positive, indicating that the size effect becomes weakened gradually. The traditional coefficient in Hall-Petch relation could be calculated considering both k and h in this study. The size dependence occurs obviously, when the t/d ratio is less than 9.18. The size-effect decreases, when the t/d ratio is larger than 9.18, and the size effect can be ignored, while the t/d ratio is larger than 15 [45]. The fraction of surface grains (thickness of surface layer as show in Figure 6a) increases with decreasing t/d, as shown in Figure 6b, and the free surface has less constraint and lower flow stress. Since dislocation tangles only occur near the three-fold node of grain boundaries, a few dislocations are heterogeneously distributed inside the grains at the surface layer [46]. Chan et al. [28] investigated the interaction of the grain effect and specimen sizes, and found that the flow stress decreased linearly with the decrease of t/d. The results predicted the relationship between the strength and t/d ratio based on the Hall-Petch relation and surface layer model.
It is known that the true strain, εu, corresponding to the ultimate strength, is equal to the strain-hardening exponent, n, and the strain-hardening exponent is an indicator of stretchability in metal sheet forming. As shown in Figure 6a, εu decreases with the decrease of t/d ratio regardless of thickness, thus, εu is a function of the t/d ratio. Due to this, the stretchability, or n value, is also a function of t/d. The ultimate elongation shows pronounced dependence on the ratio of t/d only when t/d is smaller than about 6. When the ratio of t/d is beyond about 6, the elongation shows a weak relationship with increasing t/d. The share of surface grains increases, resulting from decreasing the size of the specimen with an invariant microstructure, which leads to lower elongations. The reason may be that more grains coordinate with each other during the plastic deformation process with the increasing t/d ratio restraining the growth of cracks.
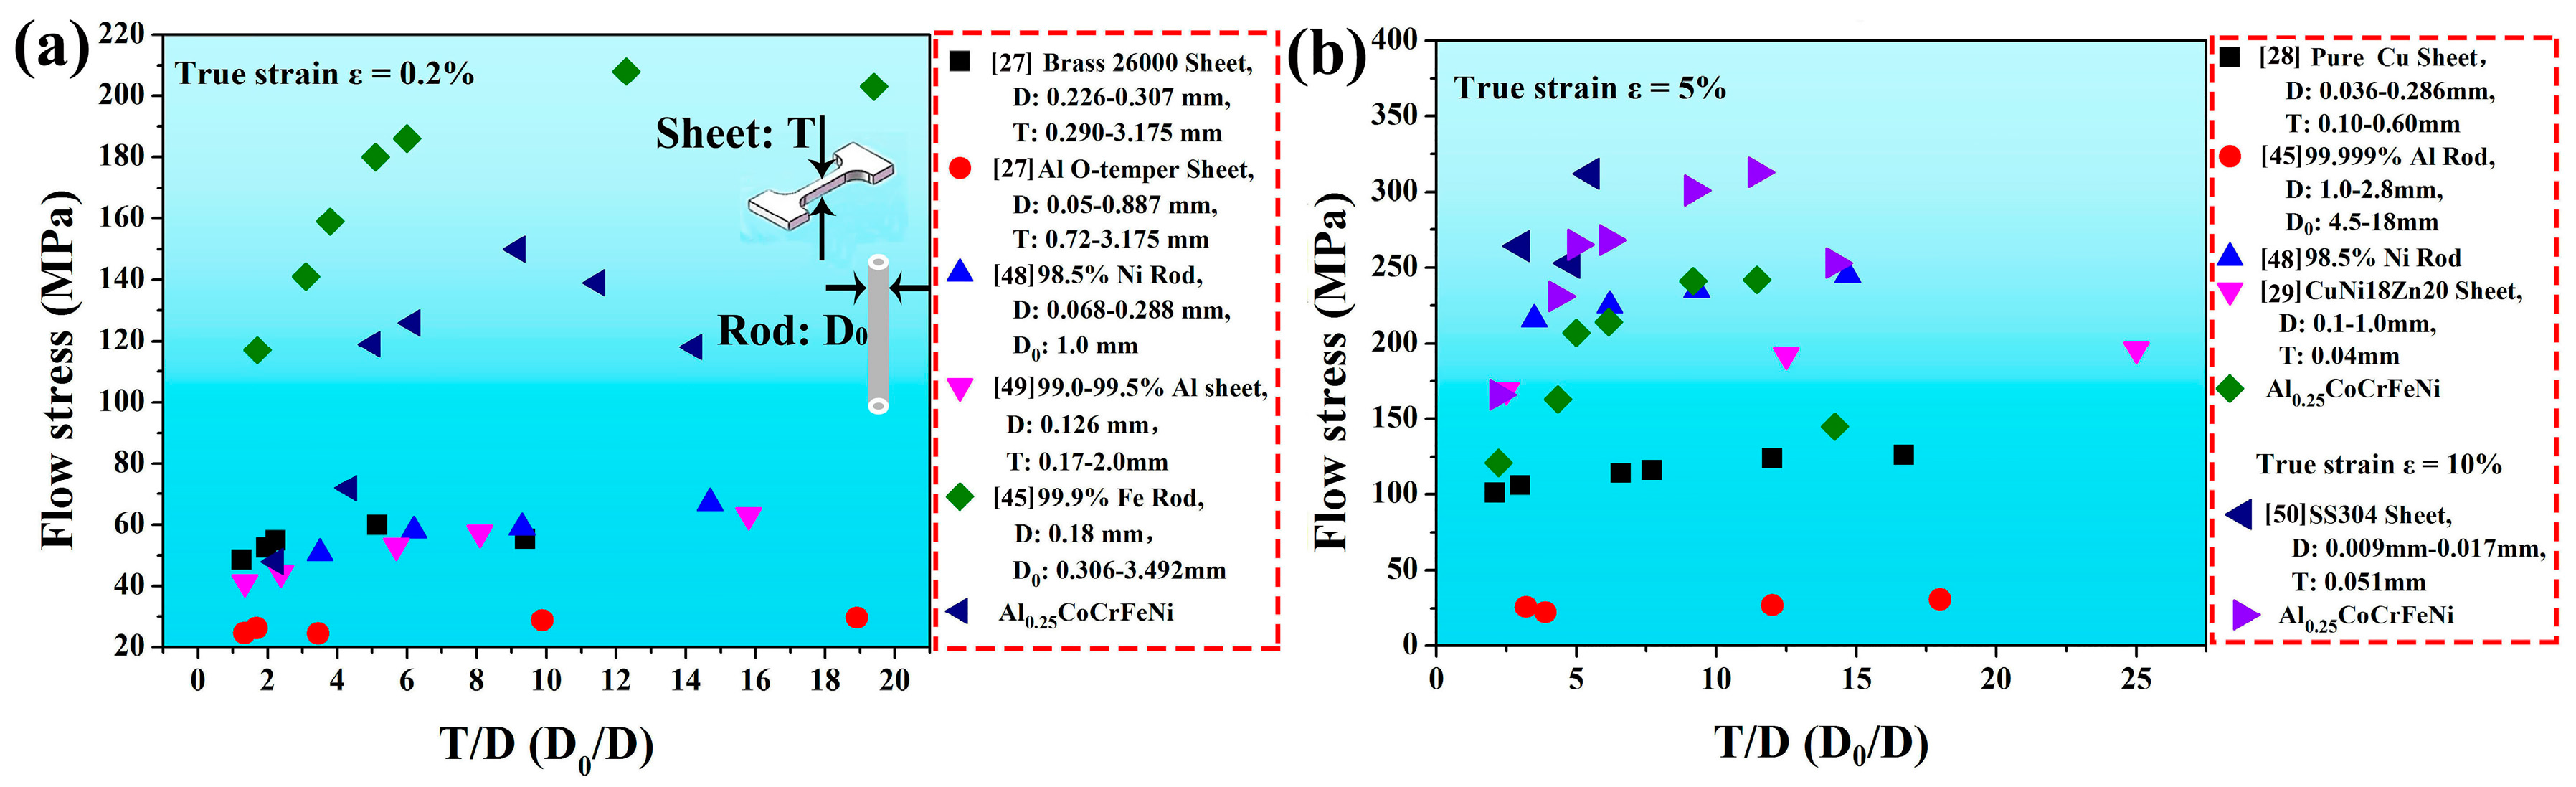
Figure 7a shows that the yield strengths of several pure metals with a single FCC phase and Al0.25CoCrFeNi HEA increase with the increasing t/d ratio. Size effects exist in all of the above materials especially when t/d is less than about 10. At a t/d ratio of 9.18, the yield strength of Al0.25CoCrFeNi thin-sheet HEA is 150 MPa, which is 1.67 times higher than as-cast Al0.25CoCrFe1.25Ni1.25 HEAs [47]. In contrast, previous studies show that all of the yield strength of brass 26,000, aluminum 1100 O-temper [27], 98.5% nickel [48], and 99.0–99.5% aluminum [49] are lower than the present HEAs. The strain-hardening ability of Al0.25CoCrFeNi HEAs is greater than that of 99.9% iron despite the relatively low yield strength [45]. The flow stress of Al0.25CoCrFeNi HEAs in Figure 7b is very close to 304 stainless steel when the true strain is 10%, indicating that the present HEAs have large work-hardening capability [50]. The weak flow strength of pure Al rods in Figure 7b is due to the low D0/D (D0: the diameter of rod specimen), despite the diameter being about 18 mm. The size effect must be taken into account on flow stresses.
4. Conclusions
In summary, the phase of Al0.25CoCrFeNi HEAs after heat treatment was identified by BSE and XRD. Size effects in HEA sheet forming were investigated, and sheets with different thicknesses show different mechanical properties, which should be considered in die and punch designs. The following conclusions can be made:
- Cold-rolled Al0.25CoCrFeNi HEAs remain in a single FCC phase and obtain recrystallization microstructures after annealing at 1100 °C for 10 h.
- This model: can be easily implemented in single FCC phase Al0.25CoCrFeNi HEA to efficiently simulate the yield strength of very thin sheets.
- For 2.23 < t/d < 9.18, the size effect has to be considered, and both the yielding strength and ultimate strength decrease with the decrease of the t/d ratio.
- The stretchability (formability) for microforming worsens as the t/d ratio decreases, especially when the t/d ratio is lower than about 6.
Acknowledgments
The authors would like to acknowledge the financial support of the Youth Natural Science Foundation of Shanxi Province, China (No. 2015021005), and the financial support from State Key Lab of Advanced Metals and Materials (Nos. 2015-Z07 and 2016-ZD03).
Author Contributions
The statistical analysis was undertaken by J.H. and J.Q. The EBSD analysis of the alloys was performed by M.Z. and H.Y. The paper was written by J.H. and J.Q.
Conflicts of Interest
The authors declare no conflict of interest.
References
- Cantor, B.; Chang, I.T.H.; Knight, P.; Vincent, A.J.B. Microstructural development in equiatomic multicomponent alloys. Mater. Sci. Eng. 2004, 375–377, 213–218. [Google Scholar] [CrossRef]
- Yeh, J.W.; Chen, S.K.; Jin, S.J.; Gan, J.Y.; Chen, T.S.; Shun, T.T. Nanostructured high entropy alloy with multiple principal element. Adv. Eng. Mater. 2004, 6, 299–303. [Google Scholar] [CrossRef]
- Yao, H.W.; Qiao, J.W.; Gao, M.C.; Hawk, J.A.; Ma, S.G.; Zhou, H.F.; Zhang, Y. Nb Tav-(Ti,W) refractory high-entropy alloys: Experiments and modeling. Mater. Sci. Eng. 2016, 674, 203–211. [Google Scholar] [CrossRef]
- Senkov, O.N.; Miller, J.D.; Miracle, D.B.; Woodward, C. Accelerated exploration of multi-principal element alloys with solid solution phases. Nat. Commun. 2015, 6, 6529. [Google Scholar] [CrossRef] [PubMed]
- Guo, S.; Liu, C.T. Phase stability in high entropy alloys: Formation of solid-solution phase or amorphous phase. Prog. Nat. Sci.: Mater. Int. 2011, 21, 433–446. [Google Scholar] [CrossRef]
- Zhao, Y.J.; Qiao, J.W.; Ma, S.G.; Gao, M.C.; Yang, H.J.; Chen, M.W.; Zhang, Y. A hexagonal close-packed high-entropy alloy: The effect of entropy. Mater. Des. 2016, 96, 10–15. [Google Scholar] [CrossRef]
- Zhang, Y.; Zhou, Y.J.; Lin, J.P.; Chen, G.L.; Liaw, P.K. Solid-solution phase formation rules for multi-component alloys. Adv. Eng. Mater. 2008, 10, 534–538. [Google Scholar] [CrossRef]
- Senkov, O.N.; Miracle, D.B. A new thermodynamic parameter to predict formation of solid solution or intermetallic phases in high entropy alloys. J. Alloys Compd. 2016, 658, 603–607. [Google Scholar] [CrossRef]
- Lu, Z.P.; Wang, H.; Chen, M.W.; Baker, I.; Yeh, J.W.; Liu, C.T.; Nieh, T.G. An assessment on the future development of high-entropy alloys: Summary from a recent workshop. Intermetallics 2015, 66, 67–76. [Google Scholar] [CrossRef]
- King, D.J.M.; Middleburgh, S.C.; McGregor, A.G.; Cortie, M.B. Predicting the formation and stability of single phase high-entropy alloys. Acta Mater. 2016, 104, 172–179. [Google Scholar] [CrossRef]
- Tong, C.J.; Chen, Y.L.; Chen, S.K.; Yeh, J.W.; Shun, T.T.; Tsau, C.H.; Lin, S.J. Microstructure characterization of AlxCoCrCuFeNi high-entropy alloy system with multiprincipal elements. Metall. Mater. Trans. A 2005, 36, 881–893. [Google Scholar] [CrossRef]
- Shun, T.T.; Du, Y.C. Microstructure and tensile behaviors of fcc Al0.3CoCrFeNi high entropy alloy. J. Alloys Compd. 2009, 479, 157–160. [Google Scholar] [CrossRef]
- Li, D.; Zhang, Y. The ultrahigh charpy impact toughness of forged AlxCoCrFeNi high entropy alloys at room and cryogenic temperatures. Intermetallics 2016, 70, 24–28. [Google Scholar] [CrossRef]
- Li, D.; Li, C.; Feng, T.; Zhang, Y.; Sha, G.; Lewandowski, J.J.; Liaw, P.K.; Zhang, Y. High-entropy Al0.3CoCrFeNi alloy fibers with high tensile strength and ductility at ambient and cryogenic temperatures. Acta Mater. 2017, 123, 285–294. [Google Scholar] [CrossRef]
- Tang, Q.H.; Huang, Y.; Huang, Y.Y.; Liao, X.Z.; Langdon, T.G.; Dai, P.Q. Hardening of an Al0.3CoCrFeNi high entropy alloy via high-pressure torsion and thermal annealing. Mater. Lett. 2015, 151, 126–129. [Google Scholar] [CrossRef]
- Komarasamy, M.; Kumar, N.; Mishra, R.S.; Liaw, P.K. Anomalies in the deformation mechanism and kinetics of coarse-grained high entropy alloy. Mater. Sci. Eng. 2016, 654, 256–263. [Google Scholar] [CrossRef]
- Zou, Y.; Maiti, S.; Steurer, W.; Spolenak, R. Size-dependent plasticity in an Nb25Mo25Ta25W25 refractory high-entropy alloy. Acta Mater. 2014, 65, 85–97. [Google Scholar] [CrossRef]
- Praveen, S.; Murty, B.S.; Kottada, R.S. Phase evolution and densification behavior of nanocrystalline multicomponent high entropy alloys during spark plasma sintering. JOM 2013, 65, 1797–1804. [Google Scholar] [CrossRef]
- Wu, Z.; Bei, H.; Otto, F.; Pharr, G.M.; George, E.P. Recovery, recrystallization, grain growth and phase stability of a family of fcc-structured multi-component equiatomic solid solution alloys. Intermetallics 2014, 46, 131–140. [Google Scholar] [CrossRef]
- Wang, F.J.; Zhang, Y.; Chen, G.L.; Davies, H.A. Cooling rate and size effect on the microstructure and mechanical properties of AlCoCrFeNi high entropy alloy. J. Eng. Mater. Technol. 2009, 131, 034501. [Google Scholar] [CrossRef]
- Raghavan, R.; Kirchlechner, C.; Jaya, B.N.; Feuerbacher, M.; Dehm, G. Mechanical size effects in a single crystalline equiatomic fecrcomnni high entropy alloy. Scr. Mater. 2017, 129, 52–55. [Google Scholar] [CrossRef]
- Fu, M.W.; Yong, M.S.; Tong, K.K.; Danno, A. Design solution evaluation for metal forming product development. Int. J. Adv. Manuf. Technol. 2007, 38, 249–257. [Google Scholar] [CrossRef]
- Vollertsen, F.; Biermann, D.; Hansen, H.N.; Jawahir, I.S.; Kuzman, K. Size effects in manufacturing of metallic components. CIRP Ann.-Manuf. Technol. 2009, 58, 566–587. [Google Scholar] [CrossRef]
- Status of the Mems Industry 2013. Available online: http://www.prweb.com/releases/2013/9/prweb11160611.htm (accessed on 24 March 2017).
- Geiger, M.; Vollertsen, F.; Kals, R. Fundamentals on the manufacturing of sheet metal microparts. CIRP Ann. Manuf. Technol. 1996, 45, 277–282. [Google Scholar] [CrossRef]
- Vollertsen, F.; Hu, Z.; Niehoff, H.S.; Theiler, C. State of the art in micro forming and investigations into micro deep drawing. J. Mater. Process. Technol. 2004, 151, 70–79. [Google Scholar] [CrossRef]
- Gau, J.T.; Principe, C.; Wang, J. An experimental study on size effects on flow stress and formability of aluminm and brass for microforming. J. Mater. Process. Technol. 2007, 184, 42–46. [Google Scholar] [CrossRef]
- Chan, W.L.; Fu, M.W. Experimental studies and numerical modeling of the specimen and grain size effects on the flow stress of sheet metal in microforming. Mater. Sci. Eng. 2011, 528, 7674–7683. [Google Scholar] [CrossRef]
- Kals, T.A.; Eckstein, R. Miniaturization in sheet metal working. J. Mater. Process. Technol. 2000, 103, 95–101. [Google Scholar] [CrossRef]
- Michel, J.F.; Picart, P. Size effects on the constitutive behaviour for brass in sheet metal forming. J. Mater. Process. Technol. 2003, 141, 439–446. [Google Scholar] [CrossRef]
- American Society for Testing and Materials. Annual Book of ASTM Standards: Metallography; Nondestructive Testing; ASTM: New York, NY, USA, 1985; pp. 115–148. [Google Scholar]
- Tsai, M.H.; Tsai, K.Y.; Tsai, C.W.; Lee, C.; Juan, C.C.; Yeh, J.W. Criterion for sigma phase formation in Cr- and V-containing high-entropy alloys. Mater. Res. Lett. 2013, 1, 207–212. [Google Scholar] [CrossRef]
- Stepanov, N.D.; Shaysultanov, D.G.; Ozerov, M.S.; Zherebtsov, S.V.; Salishchev, G.A. Second phase formation in the CoCrFeNiMn high entropy alloy after recrystallization annealing. Mater. Lett. 2016, 185, 1–4. [Google Scholar] [CrossRef]
- Kao, Y.-F.; Chen, T.-J.; Chen, S.-K.; Yeh, J.-W. Microstructure and mechanical property of as-cast, homogenized, and -deformed AlxCoCrFeNi (0 ≤ x ≤ 2) high-entropy alloys. J. Alloys Compd. 2009, 488, 57–64. [Google Scholar] [CrossRef]
- Gao, M.C. Design of High-Entropy Alloys. In High-Entropy Alloys: Fundamentals and Applications; Gao, M.C., Yeh, J.W., Liaw, P.K., Zhang, Y., Eds.; Springer: Cham, Switzerland, 2016. [Google Scholar]
- Bhattacharjee, P.P.; Sathiaraj, G.D.; Zaid, M.; Gatti, J.R.; Lee, C.; Tsai, C.W.; Yeh, J.W. Microstructure and texture evolution during annealing of equiatomic CoCrFeMnNi high-entropy alloy. J. Alloys Compd. 2014, 587, 544–552. [Google Scholar] [CrossRef]
- Pickering, E.J.; Muñoz-Moreno, R.; Stone, H.J.; Jones, N.G. Precipitation in the equiatomic high-entropy alloy CrMnFeCoNi. Scr. Mater. 2016, 113, 106–109. [Google Scholar] [CrossRef]
- Ma, S.G.; Zhang, S.F.; Qiao, J.W.; Wang, Z.H.; Gao, M.C.; Jiao, Z.M.; Yang, H.J.; Zhang, Y. Superior high tensile elongation of a single-crystal CoCrFeNiAl0.3 high-entropy alloy by bridgman solidification. Intermetallics 2014, 54, 104–109. [Google Scholar] [CrossRef]
- Engel, U. Tribology in microforming. Wear 2006, 260, 265–273. [Google Scholar] [CrossRef]
- Hall, E.O. The deformation and ageing of mild steel: III discussion of results. Proc. Phys. Soc. 1951, 64, 747. [Google Scholar] [CrossRef]
- Petch, N.J. The cleavage strength of polycrystals. J. Iron Steel Inst. 1953, 174, 22–28. [Google Scholar]
- Braunovic, M. The petch relation and grain boundary hardening. Can. Metall. Q. 2013, 13, 211–214. [Google Scholar] [CrossRef]
- Yu, D.Y.W. The yield strength of thin copper films on kapton. J. Appl. Phys. 2004, 95, 2991. [Google Scholar] [CrossRef]
- Venkatraman, R.; Bravman, J.C. Separation of film thickness and grain boundary strengthening effects in Al thin films on Si. J. Mater. Res. 2011, 7, 2040–2048. [Google Scholar] [CrossRef]
- Hansen, N. The effect of grain size and strain on the tensile flow stress of aluminium at room temperature. Acta Metall. Mater. 1977, 25, 863–869. [Google Scholar] [CrossRef]
- Messne, A.; Engel, U.; Kals, R.; Vollertsen, F. Size effect in the fe-simulation of micro-forming processes. J. Mater. Process. Technol. 1994, 45, 371–376. [Google Scholar] [CrossRef]
- Wang, Z.; Gao, M.C.; Ma, S.G.; Yang, H.J.; Wang, Z.H.; Ziomek-Moroz, M.; Qiao, J.W. Effect of cold rolling on the microstructure and mechanical properties of Al0.25CoCrFe1.25Ni1.25 high-entropy alloy. Mater. Sci. Eng. 2015, 645, 163–169. [Google Scholar] [CrossRef]
- Wang, C.; Wang, C.; Xu, J.; Zhang, P.; Shan, D.; Guo, B.; Wang, Z. Tensile deformation behaviors of pure nickel fine wire with a few grains across diameter. Trans. Nonferr. Met. Soc. China 2016, 26, 1765–1774. [Google Scholar] [CrossRef]
- Raulea, L.V.; Goijaerrs, A.M.; Govear, L.E.; Baaijens, F.P.T. Size effects in the processing of thin metal sheets. J. Mater. Process. Technol. 2001, 115, 44–48. [Google Scholar] [CrossRef]
- Mahabunphachai, S.; Koç, M. Investigation of size effects on material behavior of thin sheet metals using hydraulic bulge testing at micro/meso-scales. Int. J. Mach. Tools Manuf. 2008, 48, 1014–1029. [Google Scholar] [CrossRef]
Figure 1.
XRD patterns of HEA plates with various thickness: (a) after cold rolling; and (b) after annealing at 1100 °C for 10 h.
Figure 1.
XRD patterns of HEA plates with various thickness: (a) after cold rolling; and (b) after annealing at 1100 °C for 10 h.

Figure 2.
(a) OM image of the cold-rolled HEAs (with a thickness of 400 μm); (b) EBSD color-coded grain orientation maps, where the colors indicate the crystal orientations parallel to the deformation direction displayed in the stereographic triangle (top right of (b)); and (c) the distribution of grain boundary misorientation angles for the annealed HEAs.
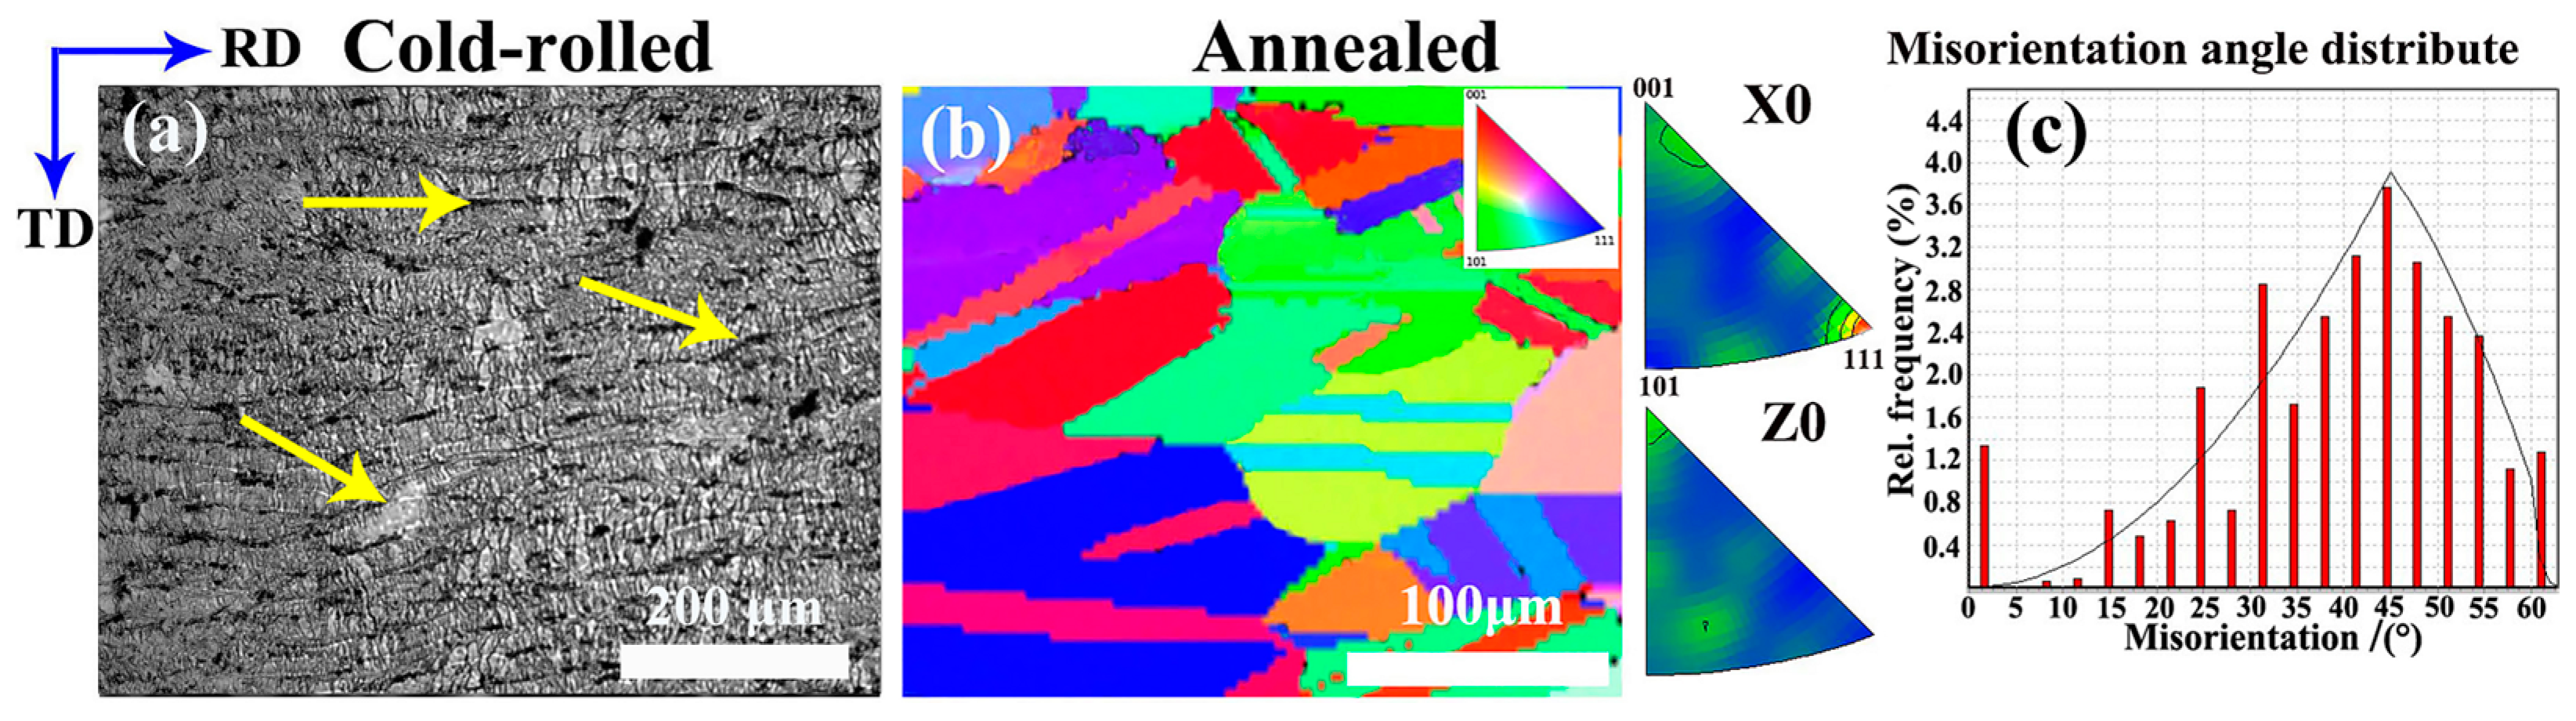
Figure 3.
BSE images of various thicknesses Al0.25CoCrFeNi HEAs annealed for 10 h at 1100 °C: (a) 400 μm; (b) 800 μm; (c) 1000 μm; (d) 1500 μm; and (e) shows the spectrum of the elements in area A.
Figure 3.
BSE images of various thicknesses Al0.25CoCrFeNi HEAs annealed for 10 h at 1100 °C: (a) 400 μm; (b) 800 μm; (c) 1000 μm; (d) 1500 μm; and (e) shows the spectrum of the elements in area A.

Figure 4.
SEM images with various thickness: (a) 230 μm; (b) 400 μm; (c) 540 μm; (d) 800 μm; (e) 1000 μm; (f) 1500 μm; (g) 1940 μm; and (h,i) show the plot of average diameters and T/D with the thickness of thin sheets, respectively (the inset shows the grain size–frequency column plots).
Figure 4.
SEM images with various thickness: (a) 230 μm; (b) 400 μm; (c) 540 μm; (d) 800 μm; (e) 1000 μm; (f) 1500 μm; (g) 1940 μm; and (h,i) show the plot of average diameters and T/D with the thickness of thin sheets, respectively (the inset shows the grain size–frequency column plots).

Figure 5.
(a) True stress-strain curves of various thickness plates (the inset showing the tensile test sample.); and (b) yield strength and tensile strength with T/D (the insert showing the yield strength curves with average grain diameter).
Figure 5.
(a) True stress-strain curves of various thickness plates (the inset showing the tensile test sample.); and (b) yield strength and tensile strength with T/D (the insert showing the yield strength curves with average grain diameter).

Figure 6.
Elongation curves (a) and volume fraction (b) with T/D (the insert showing the model of sample through tensile test).
Figure 6.
Elongation curves (a) and volume fraction (b) with T/D (the insert showing the model of sample through tensile test).

Figure 7.
Comparison in the flow stress of traditional metals and Al0.25CoCrFeNi with respect to true strain 0.2% (a) and 5% (b).
Figure 7.
Comparison in the flow stress of traditional metals and Al0.25CoCrFeNi with respect to true strain 0.2% (a) and 5% (b).


Table 1.
Experimental results of tensile tests.
| Thickness/μm | Diameter/μm | T/D (t/d) | σy/MPa | σt/MPa | εu/% |
|---|---|---|---|---|---|
| 230 | 103.22 ± 9.08 | 2.23 | 48 ± 8.5 | 271 ± 25.6 | 20.7 ± 1.4 |
| 400 | 92.14 ± 11.41 | 4.34 | 72 ± 7.4 | 556 ± 46.0 | 34.9 ± 1.0 |
| 540 | 107.58 ± 13.26 | 5.01 | 119 ± 0.7 | 697 ± 8.7 | 47.9 ± 1.7 |
| 800 | 129.77 ± 4.38 | 6.16 | 126 ± 4.5 | 734 ± 30.0 | 50.4 ± 0.9 |
| 1000 | 108.92 ± 17.85 | 9.18 | 150 ± 5.0 | 758 ± 34.0 | 51.1 ± 1.3 |
| 1500 | 130.83 ± 16.13 | 11.46 | 139 ± 22.7 | 805 ± 30.9 | 46.8 ± 1.74 |
| 1940 | 136.15 ± 16.20 | 14.24 | 118 ± 4.0 | 807 ± 75.5 | 55.2 ± 0.9 |
Note: εu is the true strain corresponding to the ultimate strength.
Table 2.
k for different t/d.
| T/D (t/d) | 2.23 | 4.34 | 5.01 | 6.16 | 9.18 | 9.18 | 11.46 | 14.24 |
|---|---|---|---|---|---|---|---|---|
| k | −904.8 | −855.5 | −923.9 | −1015.5 | −929.6 | 1135.6 | 1158.3 | 1036.0 |
© 2017 by the authors. Licensee MDPI, Basel, Switzerland. This article is an open access article distributed under the terms and conditions of the Creative Commons Attribution (CC BY) license (http://creativecommons.org/licenses/by/4.0/).
Share and Cite
MDPI and ACS Style
Hou, J.; Zhang, M.; Yang, H.; Qiao, J. Deformation Behavior of Al0.25CoCrFeNi High-Entropy Alloy after Recrystallization. Metals 2017, 7, 111. https://doi.org/10.3390/met7040111
AMA Style
Hou J, Zhang M, Yang H, Qiao J. Deformation Behavior of Al0.25CoCrFeNi High-Entropy Alloy after Recrystallization. Metals. 2017; 7(4):111. https://doi.org/10.3390/met7040111
Chicago/Turabian StyleHou, Jinxiong, Min Zhang, Huijun Yang, and Junwei Qiao. 2017. "Deformation Behavior of Al0.25CoCrFeNi High-Entropy Alloy after Recrystallization" Metals 7, no. 4: 111. https://doi.org/10.3390/met7040111
Note that from the first issue of 2016, this journal uses article numbers instead of page numbers. See further details here.