High-Cycle Microscopic Severe Corrosion Fatigue Behavior and Life Prediction of 25CrMo Steel Used in Railway Axles


1
Department of Engineering Mechanics, Applied Mechanics Laboratory, Tsinghua University, Beijing 100084, China
2
State Key Laboratory of Traction Power, Southwest Jiaotong University, Chengdu 610031, China
*
Author to whom correspondence should be addressed.
Metals 2017, 7(4), 134; https://doi.org/10.3390/met7040134
Submission received: 18 January 2017
/
Revised: 28 March 2017
/
Accepted: 7 April 2017
/
Published: 11 April 2017
(This article belongs to the Special Issue Fatigue Damage)
Abstract
:The effects of environmental media on the corrosion fatigue fracture behavior of 25CrMo steel were investigated. The media include air, and 3.5 wt % and 5.0 wt % NaCl solutions. Experimental results indicate that the media induces the initiation of corrosion fatigue cracks at multiple sites. The multi-cracking sites cause changes in the crack growth directions, the crack growth rate during the coupling action of the media, and the stress amplitude. The coupling effects are important for engineering applications and research. The probability and predictions of the corrosion fatigue characteristic life can be estimated using the three-parameter Weibull distribution function.
1. Introduction
CrMo steels, including low- and high-alloy chromium steels, are structural steels that are used in key components and parts of critical engineering structures such as gears and axles. In particular, 25CrMo steel has been used for high-speed axles because low-alloy chromium steels have the high strength and good ductility suitable for the high speed gears and axle components in engineering or transport applications. The mechanical requirements for components such as railway speeds axles are stricter because of their high-speed rotations and long service lives [1,2,3,4]. The literature has reported on the corrosion-fatigue [2], super-long life regime of railway axle steel [3,4] and fatigue properties of railway axles so far in the context of results of full-scale specimens [5]. The traditional fatigue strength design is based on a fatigue limit of materials of approximately 107 cycles or more for samples that do not fracture [6,7,8]. However, many engineering components (such as railway axles and vehicle wheels) are subjected to both environmental media and stress levels [2,9,10]. Therefore, there is always a discrepancy between traditional design and practical application. Accidents involving engineering components are not completely understood. In the past decades, a number of researchers studied the fatigue crack initiation and failure mechanisms [11,12] for very-high-cycle fatigue (VHCF) using fatigue life prediction methods [7,13] to avoid such accidents. For example, Li and Akid proposed a corrosion fatigue model including the stages of pitting and the pit-to-crack transition in order to predict the fatigue life of a structural material and the model showed good agreement with the experimental data at lower stress levels but predicted more conservative lifetimes as the stress increases [14]. Then, Beretta et al. modified Murtaza and Akid’s model in order to obtain the description of corrosion–fatigue crack growth data thus allowing us to obtain a conservative prediction of the S-N diagram subjected to artificial rainwater. These works confirmed or verified that the present study is very important, especially the reliability analysis of corrosion fatigue data of high speed railway axle [2]. Pyttel et al. [15] determined that the surface fatigue strength during high cycle fatigue (105–107) (HCF) and the volume fatigue strength during VHCF (>107) should be studied in detail and presented a design or prediction processes for the entire fatigue life of metals. However, Pyttel et al. [15] also discussed the existence of a fatigue limit for metals. Miller et al. [6] also discussed the fatigue limit and methods for overcoming it. Therefore, some high strength CrMo steels with both good HCF performance and good corrosion fatigue performance [8,16,17] have been reported recently. Sakai et al. [18] and Huang et al. [19] previously reported on the HCF or VHCF issues of high carbon chromium bearing steel and low alloy chromium steel, respectively. Akita et al. [20] determined the effects of sensitization on the corrosion fatigue behavior of type 304 stainless steel annealed in nitrogen gas. The interest in the application of low-alloy CrMo steels to railways [1] along with other modified methods and effect factors [21,22] have led to substantial research efforts focused on the fatigue, corrosive fatigue, high-temperature fatigue and enhanced fatigue resistance in the past decade. Nevertheless, these results indicated that the fatigue behavior of some low-alloy CrMo steels in different environmental media was not sufficient for the intended applications. Additionally, some corrosive fatigue fracture mechanisms are unclear. For example, the probabilistic fatigue S-N curves for different media are based on the quantification of scattered fatigue data which require a certain number of specimens tested at various stress amplitudes [23]. The two-parameter (2-P) Weibull distribution-based modeling was preferred for the statistical analysis [24]. In this paper, we investigate the corrosion fatigue behavior of 25CrMo steel over 5 × 10⁵–5 × 10⁷ cycles in air and over 105–2 × 10⁶ cycles in 3.5 wt % NaCl and 5.0 wt % NaCl aqueous solutions. For some of the scatter corrosion fatigue data, we use three-parameter (3-P) Weibull plots and the characteristic life of corrosion fatigue is predicted using detail fatigue rating (DFR). In addition, the microscopic fracture behavior is determined based on observations of the cross-sections of the fracture surfaces.
2. Materials and Experimental Method
2.1. Material or Specimen
25CrMo railway axle steel was prepared by vacuum inductive melting an ingot with a chemical composition (wt %) of 1.130 Cr, 0.600 Mn, 0.260 C, 0.240 Si, 0.210 Mo, 0.160 Cu, 0.150 Ni, 0.041 V, 0.007 P, and a balance of Fe. The room temperature mechanical properties of the 25CrMo steel used in this study are listed in Table 1.
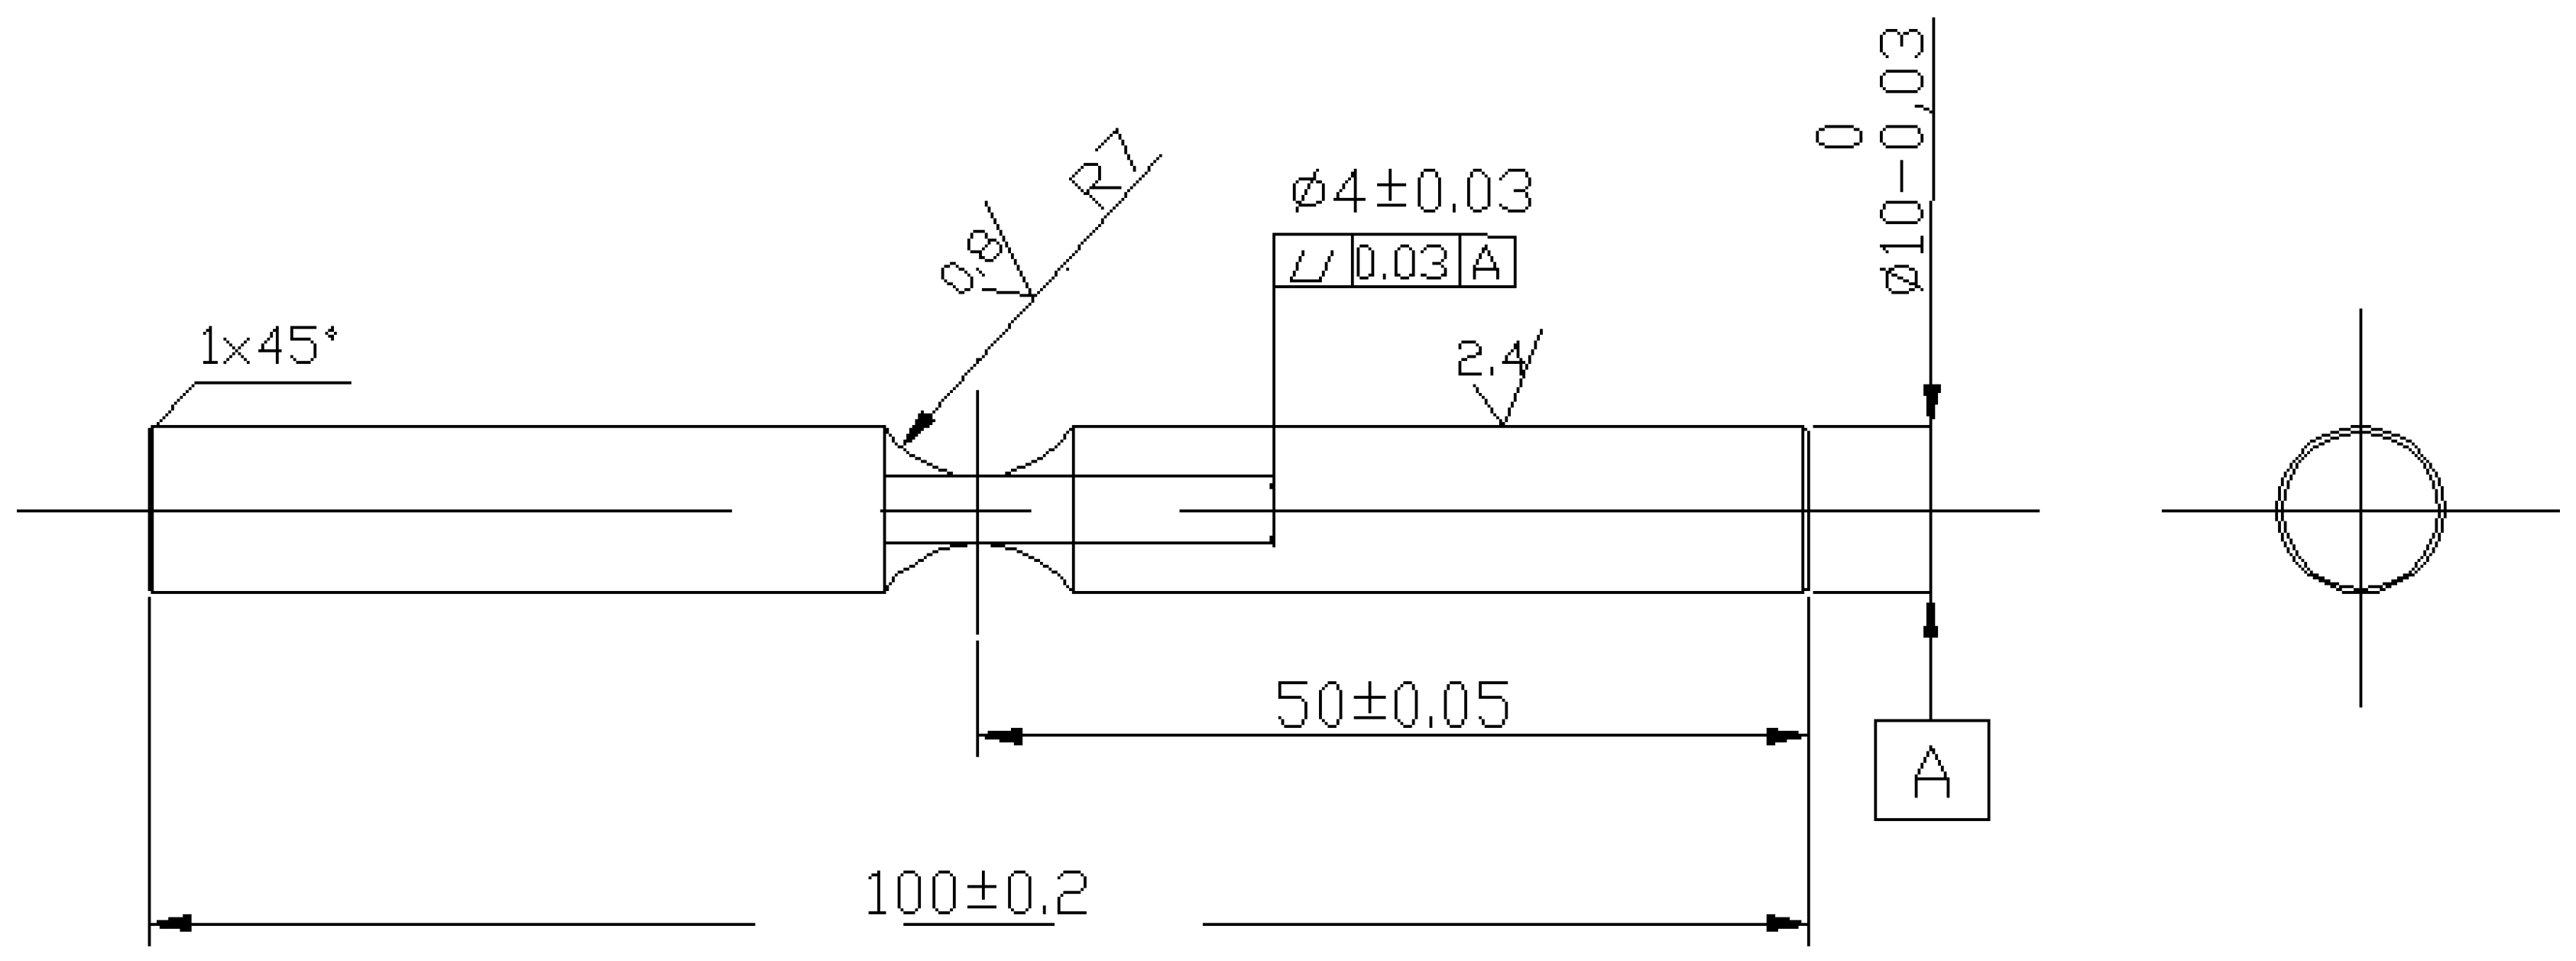
The sample for the rotating bending fatigue tests in the environmental media shown in Figure 1 was designed with a circular center notch to control the stress concentration factor. The radius of the notch is 7 mm, and the minimum diameter is 4 mm [25,26,27]. All environmental fatigue test samples were machined from the surface layer of the railway axle by turning and grinding to the required dimensions and then abraded using abrasive paper to achieve a surface roughness of approximately Ra = 0.6 to 0.8 µm prior to the environmental fatigue testing.
2.2. Mechanical Testing
The rotation bending environmental fatigue testing system used to investigate the high-cycle corrosion fatigue behavior of 25CrMo steel is shown in Figure 2a–c. Figure 2c shows the different corrosion media (air, the 3.5 wt % and 5.0 wt % NaCl aqueous solutions). To estimate the effective corrosive fatigue life 3–10 samples were tested at every stress level in the S-N curves. The applied stress amplitude is estimated as follows:
where d is the diameter of the gauge section (i.e., 4 mm), g is the acceleration due to gravity (9.8 m/s2), α is the stress concentration factor (1.08), L is the distance from the gauge section end at which the load is applied (40.5 mm for a standard sample) and W is the applied load (kgf). All rotation bending fatigue tests were controlled by the load at a stress ratio R= −1. All rotation bending fatigue tests were controlled by the load at a stress ratio R = −1 and a rotating rate of about 3300 r/min (rotating frequency 55 Hz) according to ASTM E468-90.24 [28]. The fatigue test was stopped manually when the number of cycles exceeded 5 × 10⁷ in air or the number of cycles exceeded 2 × 10⁶ in 3.5 wt % NaCl and 5.0 wt % NaCl aqueous solutions. The corrosive liquid is dispensed by the corrosive fatigue system at a rate of 1.6 mL/min [26]. The pH values of the 3.5 wt % and 5.0 wt % NaCl aqueous solutions are 7.47 and 7.24, respectively.
2.3. Three-Parameter Weibull Distribution Function
Weibull analysis is a statistical method [21,24]. To further confirm the reliability of the corrosion fatigue data for the aforementioned testing conditions, a probabilistic analysis method was proposed using the 3-P Weibull distribution model, in which the failure probability function is expressed as follows:
where , , and are the shape, scale, and location parameters, respectively, in this model and is the failure probability of the corrosion fatigue data for 25CrMo steel up to a given value of , the number of cycles to failure.
When the number of test specimens, n, is less than 20 (n = 10 for stress levels of 233.3 MPa and 273.0 MPa) the function F can be estimated as follows [29]:
The values of m, b and c in Equation (2) can be estimated using Equation (3).
The equation , in which are the number of cycles to failure and the expected value of the number of cycles to failure under the same applied load and corrosive media, respectively, should be a minimum. Thus:
and the estimated location parameter, , in the 3-P Weibull distribution model can be determined.
The following is assumed:
Therefore, a linear equation can be obtained as follows:
The corresponding correlation coefficient () for the linear regression is as follows:
In this statistical analysis, the mean value or expected value, , (or ) and the standard deviation, , can also be expressed as follows [23,30]:
In addition, to estimate the reliability level of the statistical distribution function for these experimental data, the reliability index, (), of the probability distribution function was used. In general, the higher the β = E(x)/S(x) value is, the smaller the degree of scatter for fatigue data is.
All of the aforementioned parameters in the Weibull distribution model were estimated using in-house procedure, which is developed by our team using Microsoft visual C++. In addition, to compare the reliability level of the number of cycles to failure at stress levels of 233.3 MPa and 273.0 MPa, all of the estimated parameters in the 3-P Weibull distribution function are listed in Table 2, in which the number of samples to failure is n = 10.
3. Results
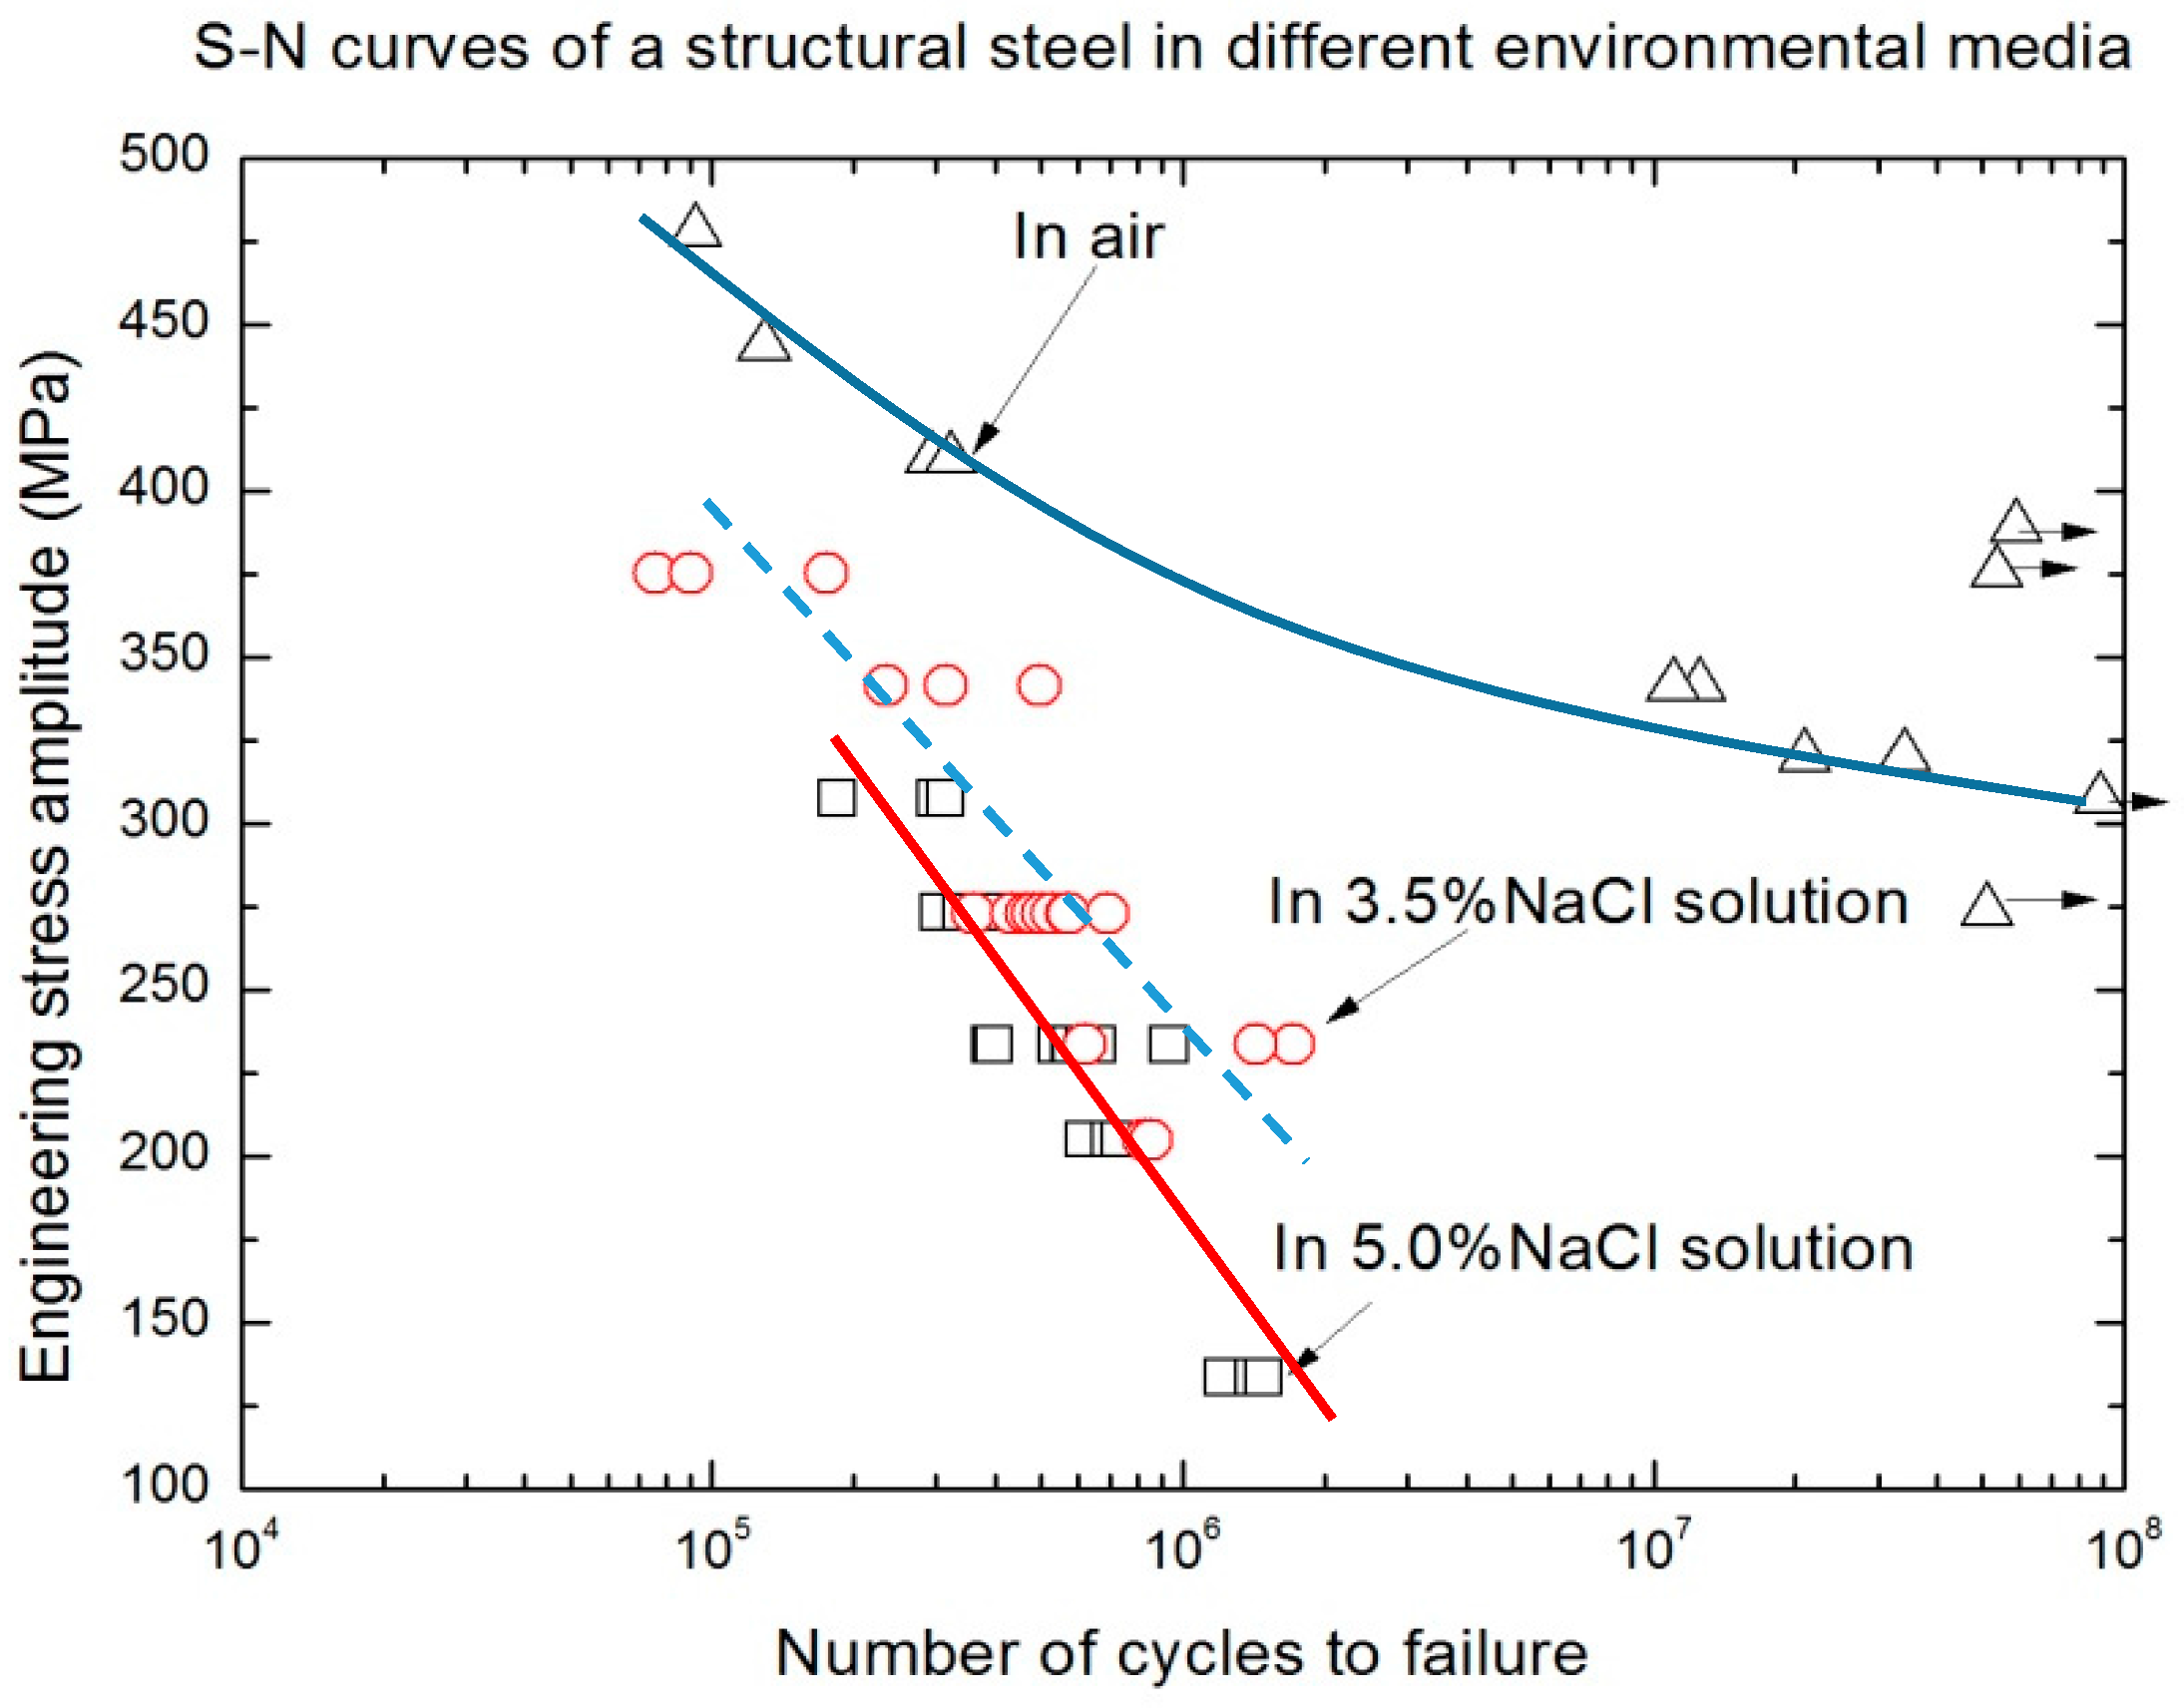
All fatigue data for the different environmental media are plotted in Figure 3. The S-N curves indicate that the effects of the environmental media on the fatigue fracture of 25CrMo steel are different. Based on the S-N curves, a fatigue limit of 25CrMo steel in the corrosive media was not reached. The differences in the corrosion fatigue behavior for the different test conditions are evident in the decreased gradient of the S-N curves. The S-N curves of 25CrMo steel in the corrosive media can be fitted using the following flow functions (the S-N curve for the 25CrMo in air is difficult to fit):
The scope of Nf of the S-N curve for the samples tested in the 5.0 wt % NaCl aqueous solution changes from 105 to 106, which is lower than that of S-N curves for the samples tested in air or a 3.5 wt % NaCl aqueous solution. For this range of number of cycles to failure, the difference between the number of cycles to failure for the two solutions is not significant (1.09 × 10⁻⁴ vs. 1.32 × 10⁻⁴) considering the variability of the fatigue data. Thus, the corrosion fatigue mechanisms for 25CrMo steel in a 3.5 wt % and a 5.0 wt % NaCl aqueous solutions should be similar. However, when the number of cycles to failure is greater than 5 × 10⁵, the corrosion fatigue life of 25CrMo steel in a 5.0 wt % NaCl aqueous solution decreased. That is, the environmental effect on the HCF fracture of this steel becomes increasingly important. Therefore, the environmental fatigue fracture of 25CrMo steel for 5 × 10⁵ to 5 × 10⁶ cycles warrants further investigation. The environmental effect on the fatigue fracture of 25CrMo axle steel not only depends on the formation of corrosive pits and solution exposure time but also depends on the local deformation of the metal (stress level). The former involves the transformation of corrosion pits to stress corrosion cracks and the latter involves a electrochemical process (anodic dissolution) and hydrogen embrittlement due to the cyclic deformation on the surface [26,31,32,33]. In addition, there is some scatter in the corrosive fatigue data, including the fatigue data for the samples tested in air, as shown in Figure 3. The scatter characteristics of the fatigue fracture data for the samples tested in air are more apparent, especially for Nf > 107. Therefore, for the complex environmental fatigue fracture mechanism of 25CrMo steel in aqueous solutions with varying concentrations of NaCl, reliability analysis of the S-N curves is necessary. Multiple samples were tested in the 3.5 wt % NaCl and 5.0 wt % NaCl aqueous solutions at the average stress levels shown in Table 3. Even if the stress ratio (R = −1) in the rotating fatigue test is different from the stress ratio (R = 0.06) in a push-pull electro-hydraulic servo, the estimated corrosion fatigue life at any stress level based on the typical environmental fatigue data can be determined for the region between 104 and 106 cycles to failure with the aid of detail fatigue rating (DFR) [34]. Although the fatigue fracture data have different decentralizations, the scatter of corrosion fatigue data (from 3.942 × 10⁵ to 9.386 × 10⁵) in the 5.0 wt % NaCl aqueous solution is greater than the scatter (from 3.588 × 10⁵ to 6.911 × 10⁵) for the 3.5 wt % NaCl aqueous solution. This may be because the stress level of the former (233.3 MPa) is lower than that of the latter (273.0 MPa). The reasons for this scatter and the mechanisms for environmental fatigue under the same testing condition are also validated by the microscopic analysis discussed in the next section.
4. Discussion
4.1. Fractography Analysis
In addition to the statistical analysis described above, observations of the fracture surfaces can also be used to characterize the scatter of the corrosion fatigue fracture for the same loading condition. For example, the fatigue fracture analyses use the scatter case under a stress level of 233.3 MPa as shown in Figure 3. The cross-sections of the fracture surfaces after different numbers of cycles are shown in Figure 4, Figure 5 and Figure 6. Since the scatter in the data exists at other stress levels, the corrosion fatigue fracture characteristics are similar to those for the case mentioned above.
Figure 4 shows the corrosion fatigue fracture characteristics of 25CrMo steel in a 5.0 wt % NaCl aqueous solution (Nf = 3.942 × 10⁵). The two different fracture regions (regions A and C) can be divided into a corrosion fatigue crack initiation and propagation region (A) and a static fracture or instantaneous fracture region (C), as shown in Figure 4a. The former (A) is a relatively smooth region and the latter (C) is a relatively rough region at the macroscopic scale, as shown in Figure 4a. Region B, shown in Figure 4a, is the closest interface region between the corrosion fatigue crack propagation region and the static fracture region. The fatigue fracture morphology of region A includes many more fatigue crack propagation vestiges that have the typical concave-convex fatigue behavior shown in Figure 4b. This is because the 25CrMo steel has good ductility (the elongation is approximately 21.2%, as shown in Table 1) so that the concave-convex vestiges are visible in the fatigue crack propagation region. Additionally, the surface crack propagation length (the circumference is approximately 3a) is approximately three times the inside fatigue crack propagation length (a) in region A, as shown in Figure 4a. The ratio between the inside fatigue crack propagation length and the surface fatigue crack propagation is approximately 0.3–0.5 for steels with good ductility. At the closest interface between the fatigue crack propagation region and the static fracture region, the concave-convex vestiges gradually disappear and the multi-secondary-cracks form, as shown in Figure 4c. Some plastic dimples are present at the closest interface between the fatigue crack propagation region and the static fracture region as shown in Figure 4c,d. The plastic dimples formed at the closest crack tips due to the higher stress concentrations. The maximum open displacement of these secondary cracks is approximately 3–4 µm as shown in Figure 4e,f. This suggests that the fracture toughness (KIC) is relatively higher, but the corrosion fatigue strength of this steel in a 5.0 wt % NaCl aqueous solution is relatively low, as shown in Figure 3. This is because the secondary cracks rarely appear in the regions affected by corrosion in which the corrosive solution accelerates the hydrogen embrittlement at the fatigue crack tip.
Figure 5 and Figure 6 show the other fracture characteristics for samples with Nf = 6.590 × 10⁵ and Nf = 9.386 × 10⁵ under the testing conditions of σ = 233.3 MPa in a 5.0 wt % NaCl aqueous solution, respectively. There are two different fatigue fracture characteristics due to the differences in the number of cycles to failure. That is, there are the different corrosion fatigue crack initiation sites and relationships between the corrosion fatigue crack propagation directions and paths. This is because there are different multi-cracking sites at the free surfaces of the round samples. The different crack growth directions from the surface to the inside of a circle cause the slip sidesteps and the different crack propagation paths, as shown in Figure 5a–d and Figure 6a. The fatigue secondary cracks are present in the regions close to the fatigue crack propagation areas (A and B), as shown in Figure 6b,c. At the same time, the multi-cracks and the plastic dimples are also present in the static fracture region, as shown in Figure 6d.
To further describe the reason for the differences in the corrosion fatigue life for the 25CrMo steel samples tested under the same conditions, the proportional differences between the corrosion fatigue crack propagation area and the static fracture area are illustrated in Figure 7. These area fractions are 37.36% (Figure 7a), 38.12% (Figure 7b), and 55.22% (Figure 7c). Thus, a larger crack propagation area results in a longer fatigue life. Due to the multi-crack initiation sites on the free surface of the round samples, the fatigue crack propagation length (a) for multi-crack initiation sites is less than that for single fatigue crack initiation sites. This is because the fatigue fracture life depends primarily on the inside crack propagation length (a) in the environmental fatigue condition. A greater inside crack propagation length indicates a stronger stress-corrosion coupling effect [26,31,32,33,35]. Therefore, the probability of the corrosion solution acting on the surface crack at the multi-crack initiation sites is lower than it acting on the single crack initiation sites. Thus, the inside crack propagation length (a) after Nf = 6.590 × 10⁵ or Nf = 9.386 × 10⁵ (Figure 7b or Figure 7c) is much smaller than that after Nf = 3.942 × 10⁵ (Figure 7a). This is because the hydrogen atoms formed by the cathode partial reaction embrittle the material when the surface fatigue crack length is much greater, which results in a shorter fatigue life. Wittke et al. [33] described the interaction between strain and corrosive media, suggesting that the active straining at the crack tip during fatigue crack propagation can enhance the corrosion reactivity at the metal surface by increasing the area fraction and electrochemical reactivity of the fresh metal surfaces. This suggests that the effect of corrosion on fatigue damage inside the crack tip is greater than that at the crack tip surface after the corrosion liquid infiltrates into the inside of the newly-fractured metal surface. Therefore, the corrosion fatigue life is not completely dependent on the corrosion time, but depends primarily on the coupling effects of the electrochemical reaction and the plastic deformation. Subsequently, considering the effects of a stress gradient on the fatigue fracture process, if the inside crack length is greater for the rotating bending fatigue tests, the bending fracture of the sample occurs more easily, as shown in Figure 7a. Therefore, the reasons discussed above will result in the differences in the corrosion fatigue life for the same testing condition. Improving the surface quality of the sample and avoiding stress concentrations or heterogeneous defects on the surface can help decrease these differences.
4.2. Fatigue Life Prediction and Reliability Analysis
Since the corrosion fatigue data have a degree of scattering, the Weibull distribution is the most appropriate statistical analysis tool. Based on the statistical distribution parameters in Table 2, can the fatigue lives for the same material be predicted for other stress levels? To answer this question, we carefully analyzed each parameter in Table 2. The values of the shape parameter (m) and reliability index, β, at 273.0 MPa in a 3.5 wt % NaCl aqueous solution are greater than the values at 233.3 MPa in a 5.0 wt % NaCl aqueous solution. This means that the scatter of the former (m = 3.44, β = 3.11) is lower than that of the latter (m = 2.08, β = 1.98). Another important parameter in this reliability analysis is the scale parameter, b, which reflects the characteristic corrosion fatigue life. The two distributions of the characteristic lives are Nf = 5.47 × 10⁵ and Nf = 6.51 × 10⁵, which are slightly greater than the average values (Nf = 5.095 × 10⁵ and Nf = 5.938 × 10⁵, respectively). When n is less than ten, the difference becomes greater between the characteristic life and the arithmetic mean values of the fatigue lives. Therefore, using the characteristic life value () of corrosion fatigue data is better than using the arithmetic mean value in the statistical analysis of the small sample number. Most S-N curves for the samples were tested under the same environmental condition but at different stress levels have approximately the same shape parameter (m). Therefore, other characteristic lives () at additional stress levels for small sample numbers (such as n = 3) in the same S-N curve can be estimated based on the m parameter for the large sample numbers (such as n = 10). The estimation method is as follows [34,36]:
where n is the sample number, Nfi is the number of cycle to failure in the ith fatigue test, and m is the shape parameter in the Weibull distribution function. For example, the relationship between the experimental data and all characteristic lives () at different stress levels determined using Equation (12) is shown in Figure 8. According to the aforementioned estimation method (Equation (12)) [36], the predication of additional characteristic fatigue lives () at different stresses is possible if the shape parameter (m) is known. In Figure 8, the characteristic corrosion fatigue data (labeled with ●) is in good agreement with the experimental data (labeled with ○). Therefore, this estimation method based on the statistical distribution is simple and effective. That is, we can estimate the characteristic life by using the shape parameter (m) for the experimental data with the same testing condition to eliminate the invalid data. In addition, as a key parameter in reliability design, Sakin [37] obtained the fatigue life distribution diagrams for glass-fiber reinforced polyester composites by using a two-parameter Weibull distribution function, from which the reliability percentage (%) corresponding to any life (cycle) or stress amplitude could be found easily. At the same time, Sivapragash et al. [38] systematically analyzed the fatigue life prediction of ZE41A magnesium alloys using the Weibull distribution and obtained a probability distribution based on the failure of the material. However, reports of corrosion fatigue data of 25CrMo steel based on the 3-P Weibull distribution analysis are rare.
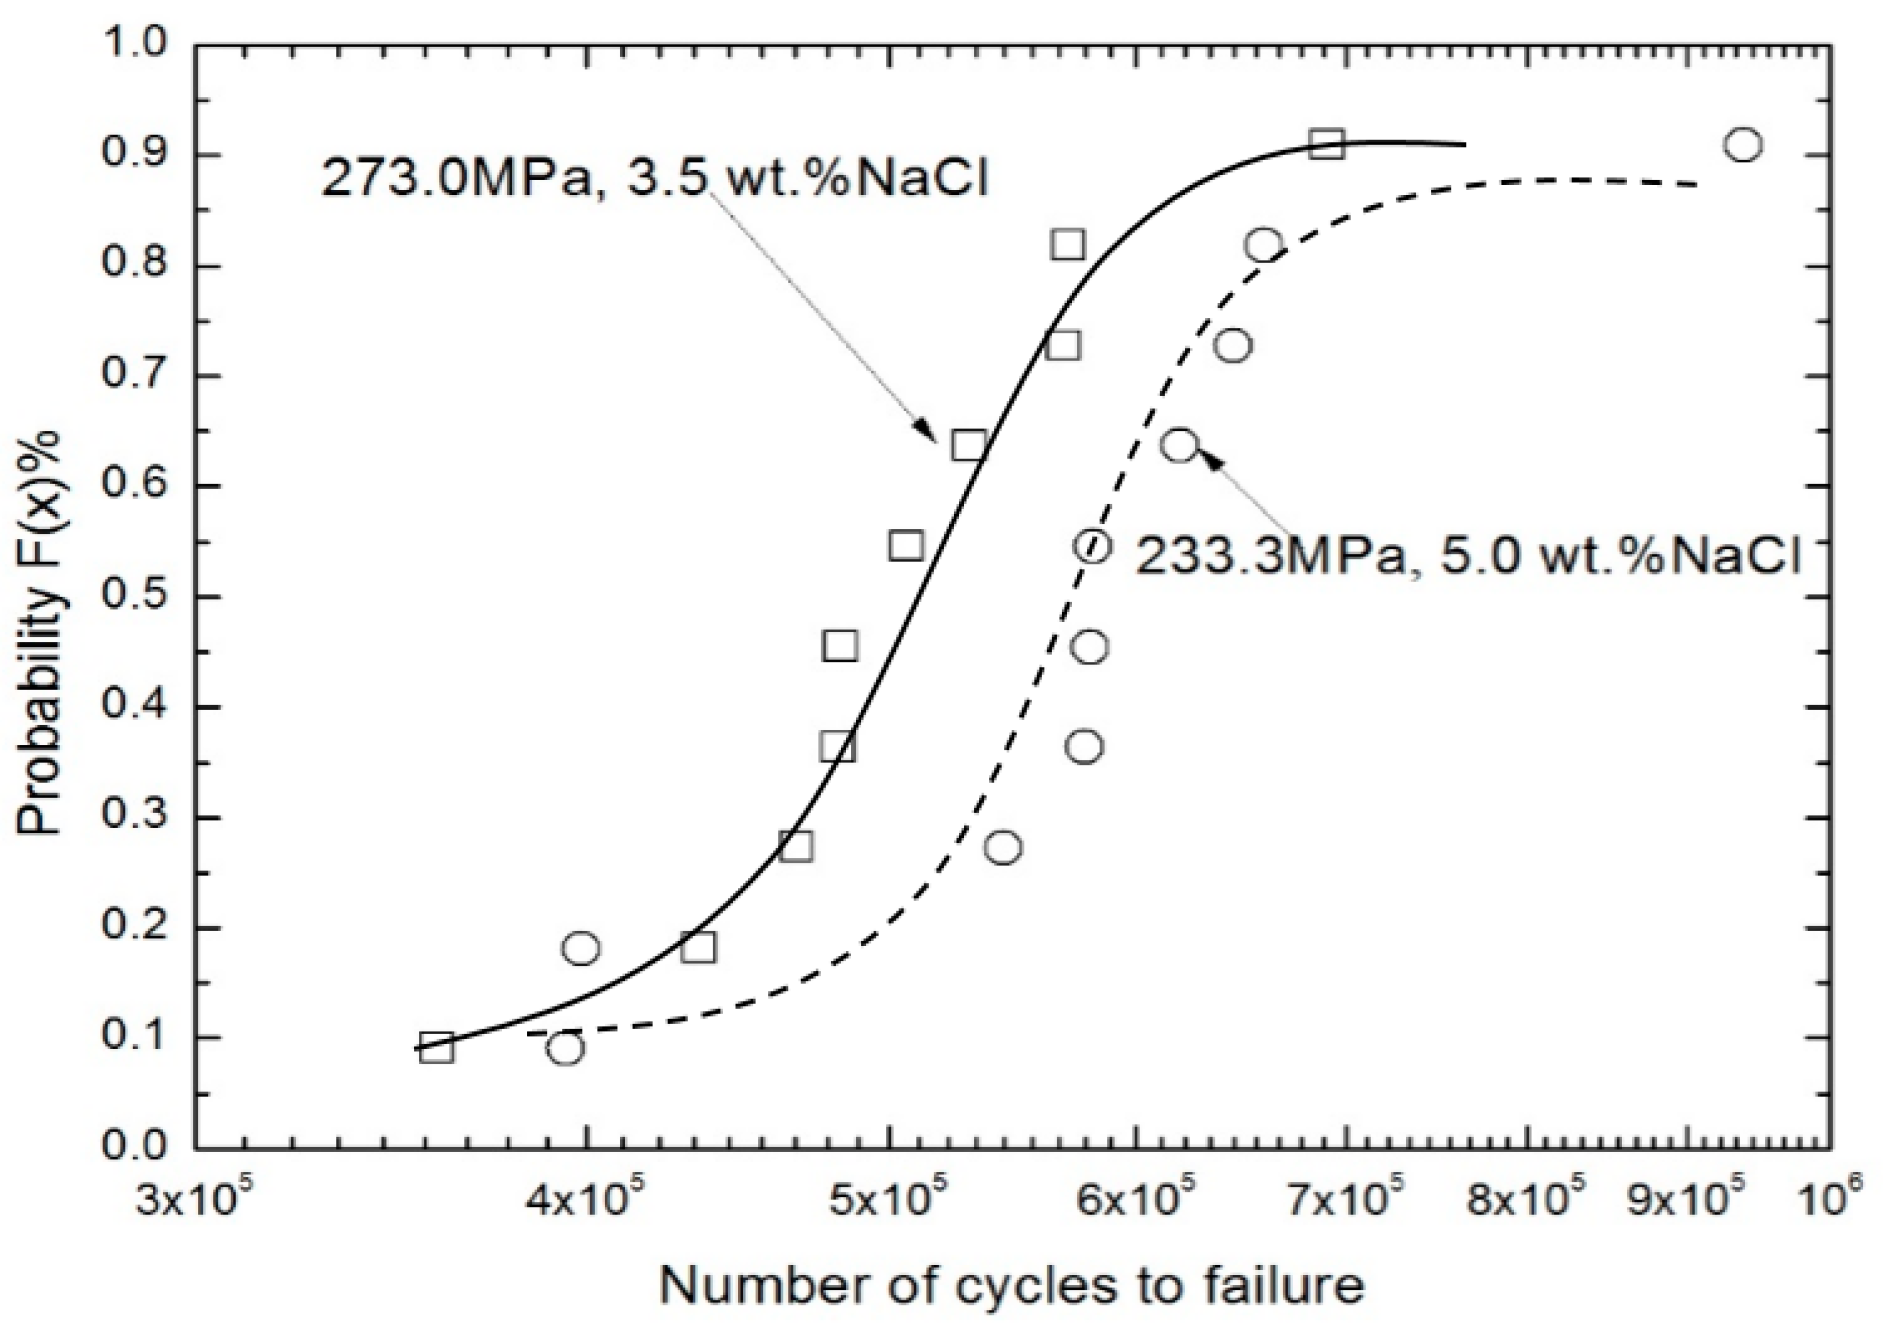
Figure 9 gives the failure probability for corrosion fatigue of 25CrMo axle steel for two typical corrosion cases. The estimated curves shown in Figure 9 indicate that the relationship between the failure probability value of the corrosion fatigue fracture and Nf suggests that the service life of 25CrMo axle steel can be calculated for the different environmental conditions. This will assist with the design of safe structures or materials. For example, when the number of cycles to failure is 5 × 10⁵, the probability values for corrosion fatigue fracture are 55% at 273.0 MPa, in a 3.5 wt % NaCl aqueous solution and 25% at 233.3 MPa, in a 5.0 wt % NaCl aqueous solution. Additionally, the failure probability of 25CrMo axle steel is not sensitive to the change in the number of cycles to failure in either the low or the high failure probability region, as shown in Figure 9. The critical value of the cyclic number is different for the changes in both the environmental condition and the stress level because the plateau values are different for each curve.
5. Conclusions
Through detailed corrosion fatigue tests, the fatigue fracture characteristics, reliability analysis, and characteristic life cycle predictions for a typical 25CrMo axle steel in three different environmental media were determined. The main conclusions are as follows:
- The experimental results indicate that, the higher the number of cycles to failure, the stronger the effect of the corrosive media on the fatigue damage. In this HCF regime, the corrosion fatigue behavior of 25CrMo steel is not completely dependent on the corrosion time (exposure time). It is also dependent on the coupling action of the electrochemical reaction and the plastic deformation. When the number of cycles to failure is greater than 106, the corrosion fatigue data must be analyzed using a statistical analysis, such as the Weibull distribution model.
- For the same environmental media and applied load, the amount of scatter in the corrosion fatigue data is caused primarily by the number of fatigue crack initiation sites and the direction of the fatigue crack propagation in the early stage. A lower number of fatigue crack initiation sites indicates a shorter fatigue crack initiation life, and a faster corrosion fatigue crack growth rate indicates that the total life of the sample is shorter. Improving the surface quality of the sample by reducing the surface defects or the stress concentration sites helps reduce the dispersion in the corrosion fatigue data.
- The corrosion fatigue fracture characteristics indicate that there are fatigue crack propagation vestiges in the crack propagation regions, the second cracks, the plastic dimples, and the slip sidesteps near the interface region between the fatigue crack propagation region and the static fracture region.
- The results of the 3-P Weibull distribution analysis indicate that the corrosion fatigue data are more reliable as the value of the shape parameter (m) increases. At the same time, the characteristic corrosion fatigue life at any stress level for a small sample tested under the same environmental condition can be estimated simply and effectively using Equation (12).
Acknowledgments
The present research is supported by the Natural Science Foundation of China (Nos. 11272173, 11572170), the Foundation of the State Key Laboratory of Traction Power Southwest Jiaotong University (No. TPL1503), China, and the Nantong Key Laboratory of New Materials Industrial Technology, and the Science and Technology and Research and Development Application Project of Sichuan Province (2017JY0216).
Author Contributions
Yanling Wang finished the fatigue experiments and microstructure observation and wrote part of the paper. Xishu Wang wrote the paper and completed the data analysis. Shengchuan Wu provided all materials for fatigue tests and checked a manuscript. Huihui Yang finished the fracture analysis of paper. Zhihao Zhang participated in a part experiment.
Conflicts of Interest
The authors declare no conflict of interest.
Nomenclature
| a | crack length |
| b | scale parameter in Weibull distribution function |
| predication value of characteristic life | |
| c | location parameter in Weibull distribution function |
| α | the stress concentration factor (1.08) |
| d, L | the geometry size, respectively |
| g | the acceleration of gravity (9.8 m/s2) |
| F(x) | Weibull distribution function |
| m | shape parameter in Weibull distribution function |
| n | experimental number of corrosion fatigue life |
| Ρ′ | corresponding correlation coefficient |
| E(x) | expected value of statistics |
| S(x) | standard deviation value |
| β | reliability index |
| Nf | number of cycles to failure |
| σ | stress amplitude (MPa) |
| R | stress ratio |
References
- Zhang, Y.T.; Bian, S.; Han, W.X. Effect of Mn on hardenability of 25CrMo axle steel by an improved end-quench test. China Foundry 2012, 9, 318–321. [Google Scholar]
- Beretta, S.; Carboni, M.; Fiore, G.; Conte, A.L. Corrosion-fatigue of A1N railway axle steel exposed to rainwater. Int. J. Fatigue 2010, 32, 952–961. [Google Scholar] [CrossRef]
- Zhao, Y.X.; Yang, B.; Feng, M.F.; Wang, H. Probabilistic fatigue S-N curves including the super-long life regime of a railway axle steel. Int. J. Fatigue 2009, 31, 1550–1558. [Google Scholar] [CrossRef]
- Zhao, Y.X. A fatigue reliability analysis method including super long life regime. Int. J. Fatigue 2012, 35, 79–90. [Google Scholar] [CrossRef]
- Cervello, S. Fatigue properties of railway axles: New results of full-scale specimens from Euraxles project. Int. J. Fatigue 2016, 861, 2–12. [Google Scholar] [CrossRef]
- Miller, K.J.; O’Donnell, W.J. The fatigue limit and its elimination. Fatigue Fract. Eng. Mater. Struct. 1999, 22, 545–557. [Google Scholar] [CrossRef]
- Wang, Q.Y.; Berard, J.Y.; Dubarre, A.; Baudry, G.; Rathery, S.; Bathias, C. Gigacycle fatigue of ferrous alloys. Fatigue Fract. Eng. Mater. Struct. 1999, 22, 667–672. [Google Scholar] [CrossRef]
- Li, S.X.; Zhang, P.Y.; Yu, S.R. Experimental study on very high cycle fatigue of martensitic steel of 2Cr13 under corrosive environment. Fatigue Fract. Eng. Mater. Struct. 2014, 37, 1146–1152. [Google Scholar] [CrossRef]
- Kang, D.H.; Kim, S.H.; Lee, C.H. Corrosion fatigue behaviors of HSB800 and its HAZs in air and seawater environments. Mater. Sci. Eng. A Struct. Mater. Prop. Microstruct. Process. 2013, 559, 751–758. [Google Scholar] [CrossRef]
- Jones, R.H.; Simonen, E.P. Early stages in the development of stress-corrosion cracks. Mater. Sci. Eng. A Struct. Mater. Prop. Microstruct. Process. 1994, 176, 211–218. [Google Scholar] [CrossRef]
- Lai, C.L.; Tsay, L.W.; Chen, C. Effect of microstructure on hydrogen embrittlement of various stainless steels. Mater. Sci. Eng. A Struct. Mater. Prop. Microstruct. Process. 2013, 584, 14–20. [Google Scholar] [CrossRef]
- Bayraktar, E.; Garcias, I.M.; Bathias, C. Failure mechanisms of automotive alloys in very high cycle fatigue range. Int. J. Fatigue 2006, 28, 1590–1602. [Google Scholar] [CrossRef]
- Poting, S.; Zenner, H. Parameter C lifetime calculation for the high cycle regime. Fatigue Fract. Eng. Mater. Struct. 2002, 25, 877–885. [Google Scholar] [CrossRef]
- Li, S.X.; Akid, R. Corrosion fatigue life prediction of a steel shaft material in seawater. Eng. Fail. Anal. 2013, 34, 324–334. [Google Scholar] [CrossRef]
- Pyttel, B.; Schwerdt, D.; Berger, C. Very high cycle fatigue—Is there a fatigue limit? Int. J. Fatigue 2011, 33, 49–58. [Google Scholar] [CrossRef]
- Qian, G.A.; Zhou, C.G.; Hong, Y.S. Experimental and theoretical investigation of environmental media on very-high-cycle fatigue behavior for a structural steel. Acta Mater. 2011, 59, 1321–1327. [Google Scholar] [CrossRef]
- Guo, Q.; Guo, X. Research on high-cycle fatigue behavior of FV520B stainless steel based on intrinsic dissipation. Mater. Des. 2016, 90, 248–255. [Google Scholar] [CrossRef]
- Sakai, T.; Lian, B.; Takeda, M.; Shiozawa, K.; Oguma, N.; Ochi, Y.; Nakajima, M.; Nakamura, T. Statistical duplex S-N characteristics of high carbon chromium bearing steel in rotating bending in very high cycle regime. Int. J. Fatigue 2010, 32, 497–504. [Google Scholar] [CrossRef]
- Huang, Z.Y.; Wagner, D.; Wang, Q.Y.; Bathias, C. Effect of carburizing treatment on the “fish eye” crack growth for a low alloyed chromium steel in very high cycle fatigue. Mater. Sci. Eng. A Struct. Mater. Prop. Microstruct. Process. 2013, 559, 790–797. [Google Scholar] [CrossRef]
- Akita, M.; Uematsu, Y.; Kakiuchi, T.; Nakajima, M.; Tsuchiyama, T.; Bai, Y.; Isono, K. Effect of sensitization on corrosion fatigue behavior of type 304 stainless steel annealed in nitrogen gas. Mater. Sci. Eng. A Struct. Mater. Prop. Microstruct. Process. 2015, 640, 33–41. [Google Scholar] [CrossRef]
- Mohammad, M.; Abdullah, S.; Jamaludin, N.; Innayatullah, O. Predicting the fatigue life of the SAE 1045 steel using an empirical Weibull-based model associated to acoustic emission parameters. Mater. Des. 2014, 54, 1039–1048. [Google Scholar] [CrossRef]
- Ebara, R.C. Corrosion fatigue crack initiation in 12% chromium stainless steel. Mater. Sci. Eng. A Struct. Mater. Prop. Microstruct. Process. 2007, 468, 109–113. [Google Scholar] [CrossRef]
- Zhao, Y.X.; Liu, H.B. Weibull modeling of the probabilistic S-N curves for rolling contact fatigue. Int. J. Fatigue 2014, 66, 47–54. [Google Scholar] [CrossRef]
- Weibull, W. A statistical distribution function of wide applicability. J. Appl. Mech. Trans. ASME 1951, 18, 293–297. [Google Scholar]
- Wang, X.S.; Guo, X.W.; Li, X.D.; Ge, D.Y. Improvement on the fatigue performance of 2024-T4 alloy by synergistic coating technology. Materials 2014, 7, 3533–3546. [Google Scholar] [CrossRef]
- Wang, X.S.; Li, X.D.; Yang, H.H.; Kawagoishi, N.; Pan, P. Environment-induced fatigue cracking behavior of aluminum alloys and modification methods. Corros. Rev. 2015, 33, 119–137. [Google Scholar] [CrossRef]
- Yang, H.H.; Wang, Y.L.; Wang, X.S.; Pan, P.; Jia, D.W. Synergistic effect of corrosion environment and stress on the fatigue damage behavior of Al alloys. Fatigue Fract. Eng. Mater. Struct. 2016, 39, 1309–1316. [Google Scholar] [CrossRef]
- ASTM. Standard Practice for Presentation of Constant Amplitude Fatigue Test Results for Metallic Materials Annual Book of ASTM Standards (2004) USA; ASTM E468-90; ASTM: West Conshohocken, PA, USA, 2004. [Google Scholar]
- Zheng, R.Y.; Yan, J.S. New estimation method of three-parameter Weibull distribution. J. Mech. Strength 2002, 24, 599–601. (In Chinese) [Google Scholar]
- Lu, Z.J.; Zhang, S.L.; Liu, X.F.; Liu, C.H. Some problems of Weibull distribution. Qual. Reliab. 2007, 32, 9–13. [Google Scholar]
- Cooper, K.R.; Kelly, R.G. Crack tip chemistry and electrochemistry of environmental cracks in AA 7075. Corros. Sci. 2007, 49, 2636–2662. [Google Scholar] [CrossRef]
- Li, X.D.; Wang, X.S.; Ren, H.H.; Chen, Y.L.; Mu, Z.T. Effect of prior corrosion state on the fatigue small cracking behavior of 6151-T6 aluminum alloy. Corros. Sci. 2012, 55, 26–33. [Google Scholar] [CrossRef]
- Wittke, P.; Klein, M.; Walther, F. Chemical-Mechanical Characterization of the Creep-Resistant Mg-Al-Ca Alloy DieMag422 Containing Barium-Quasistatic and Cyclic Deformation Behavior in Different Defined Corrosion Conditions. Mater. Test. 2014, 56, 16–23. [Google Scholar] [CrossRef]
- Goranson, U.G. Elements of structural integrity assurance. Int. J. Fatigue 1994, 16, 43–65. [Google Scholar] [CrossRef]
- Dhinakaran, S.; Prakash, R.V. Effect of low cyclic frequency on fatigue crack growth behavior of Mn-Ni-Cr steel in air and 3.5% NaCl solution. Mater. Sci. Eng. A Struct. Mater. Prop. Microstruct. Process. 2014, 609, 204–208. [Google Scholar] [CrossRef]
- Huang, X.; Liu, J.Z.; Ma, S.J.; Hu, B.R. Sensitivity analysis of the parameters in detail fatigue rating equation. Acta Aeronaut. ET Astronaut. Sin. 2012, 33, 863–870. (In Chinese) [Google Scholar]
- Sakin, R.; Ay, İ. Statistical analysis of bending fatigue life data using Weibull distribution in glass-fiber reinforced polyester composites. Mater. Des. 2008, 29, 1170–1181. [Google Scholar] [CrossRef]
- Sivapragash, M.; Lakshminarayanan, P.R.; Karthikeyan, R.; Raghukandan, K.; Hanumantha, M. Fatigue life prediction of ZE41A magnesium alloy using Weibull distribution. Mater. Des. 2008, 29, 1549–1553. [Google Scholar] [CrossRef]
Figure 1.
Sketch of the specimens indicating shape and size. The dimensions are in mm.

Figure 2.
Fatigue testing loading modes for air or NaCl solutions. (a,b) Mechanical loading only; (c) mechanical loading in corrosive media.
Figure 2.
Fatigue testing loading modes for air or NaCl solutions. (a,b) Mechanical loading only; (c) mechanical loading in corrosive media.
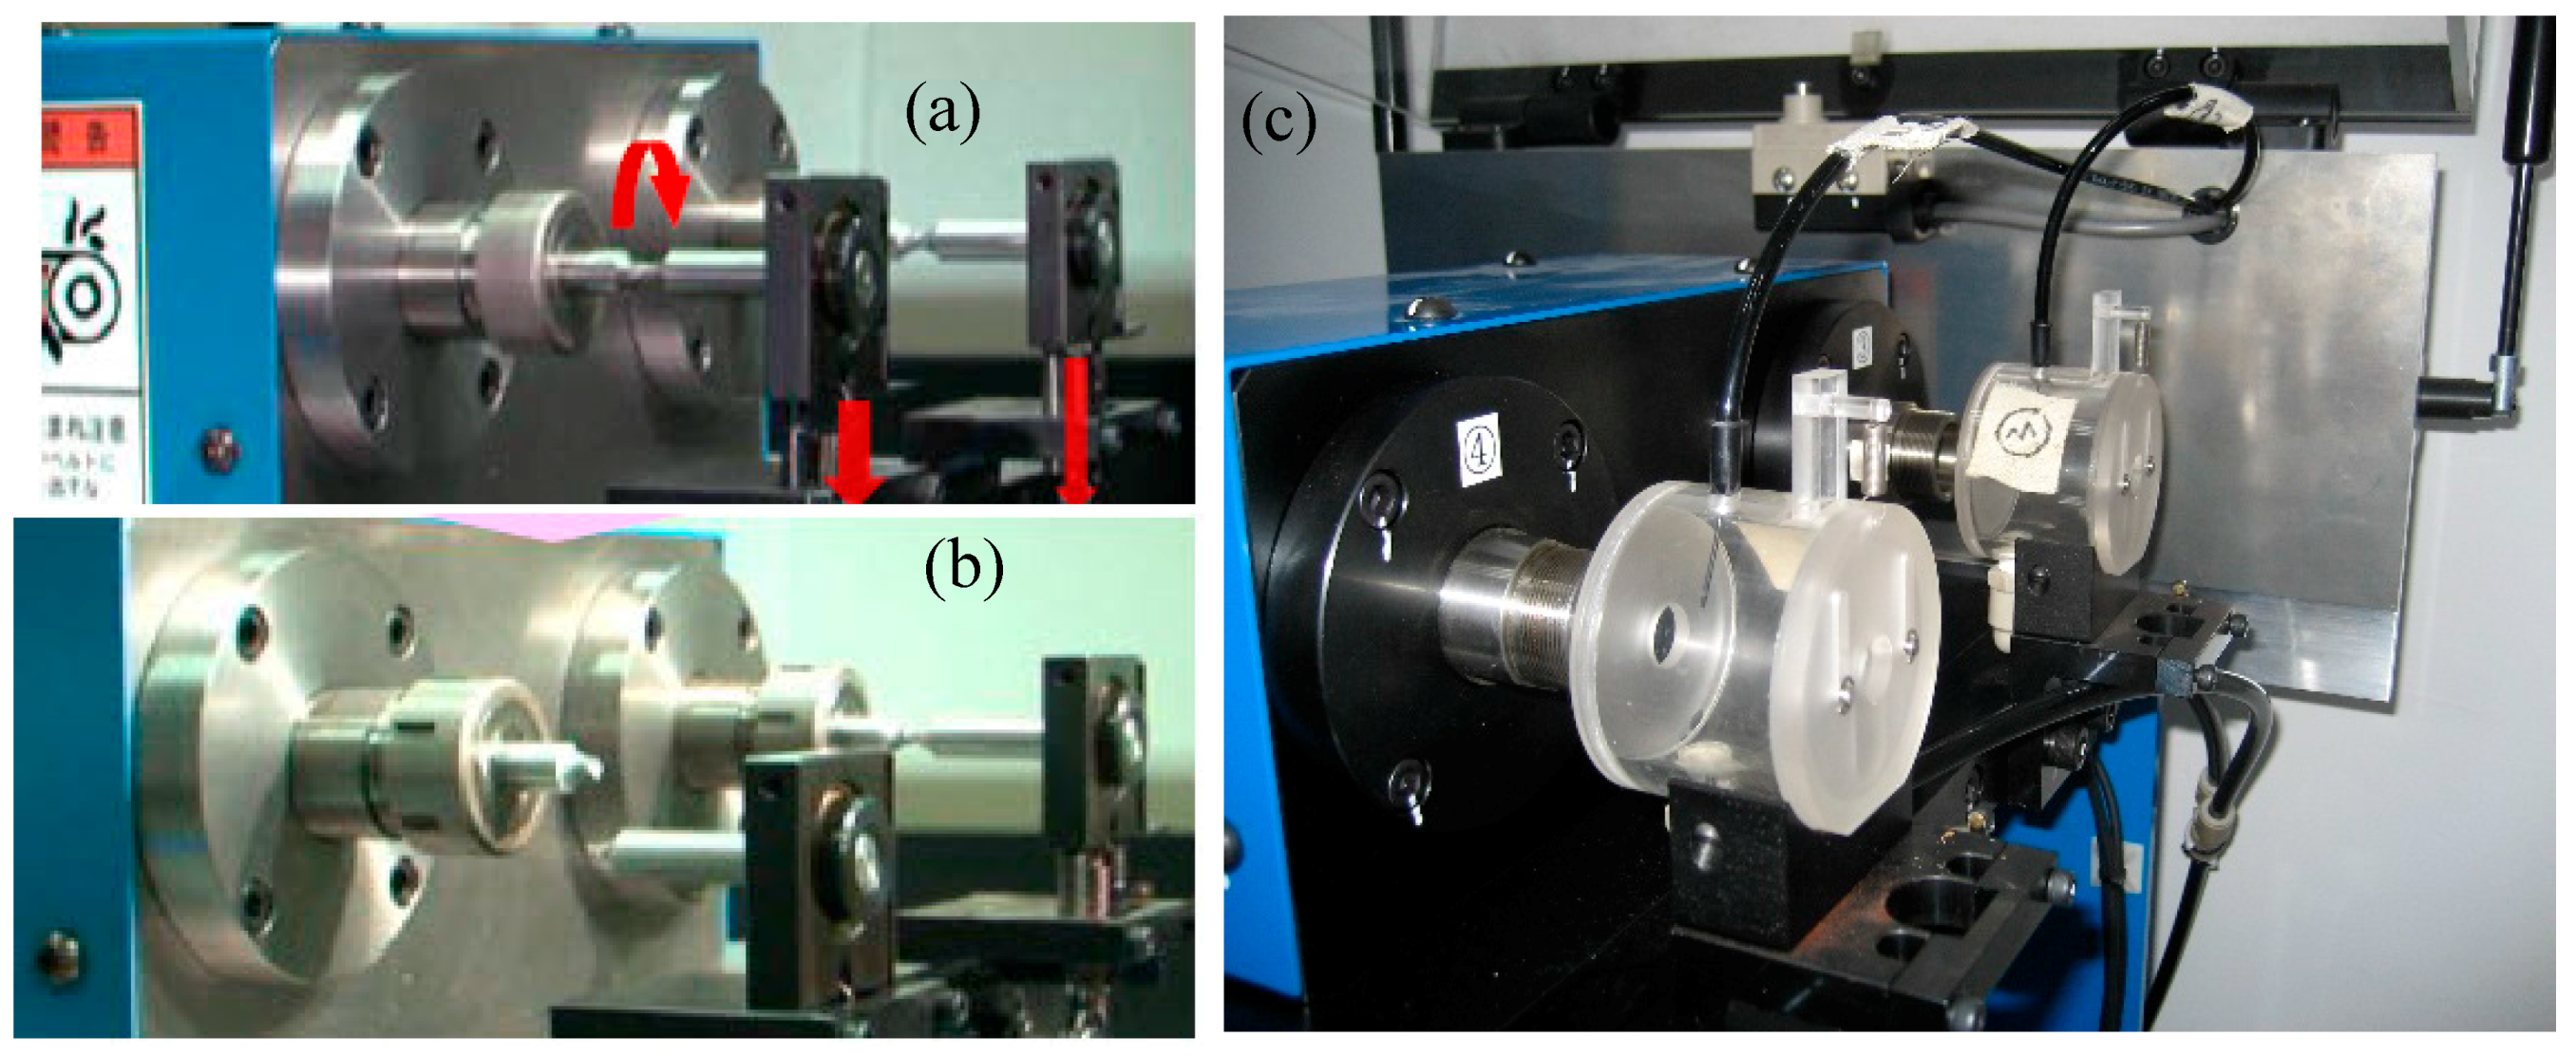
Figure 3.
S-N curves for 25CrMo steel tested under different environmental conditions.

Figure 4.
Typical fracture characteristics for Nf = 3.942 × 10⁵, σ = 233.3 MPa in a 5.0 wt % NaCl solution. (a) Macro-scale view of the fracture surface; (b) region labeled A; (c) region labeled B; (d) region labeled C; (e,f) crack patterns in the static fracture regions.
Figure 4.
Typical fracture characteristics for Nf = 3.942 × 10⁵, σ = 233.3 MPa in a 5.0 wt % NaCl solution. (a) Macro-scale view of the fracture surface; (b) region labeled A; (c) region labeled B; (d) region labeled C; (e,f) crack patterns in the static fracture regions.
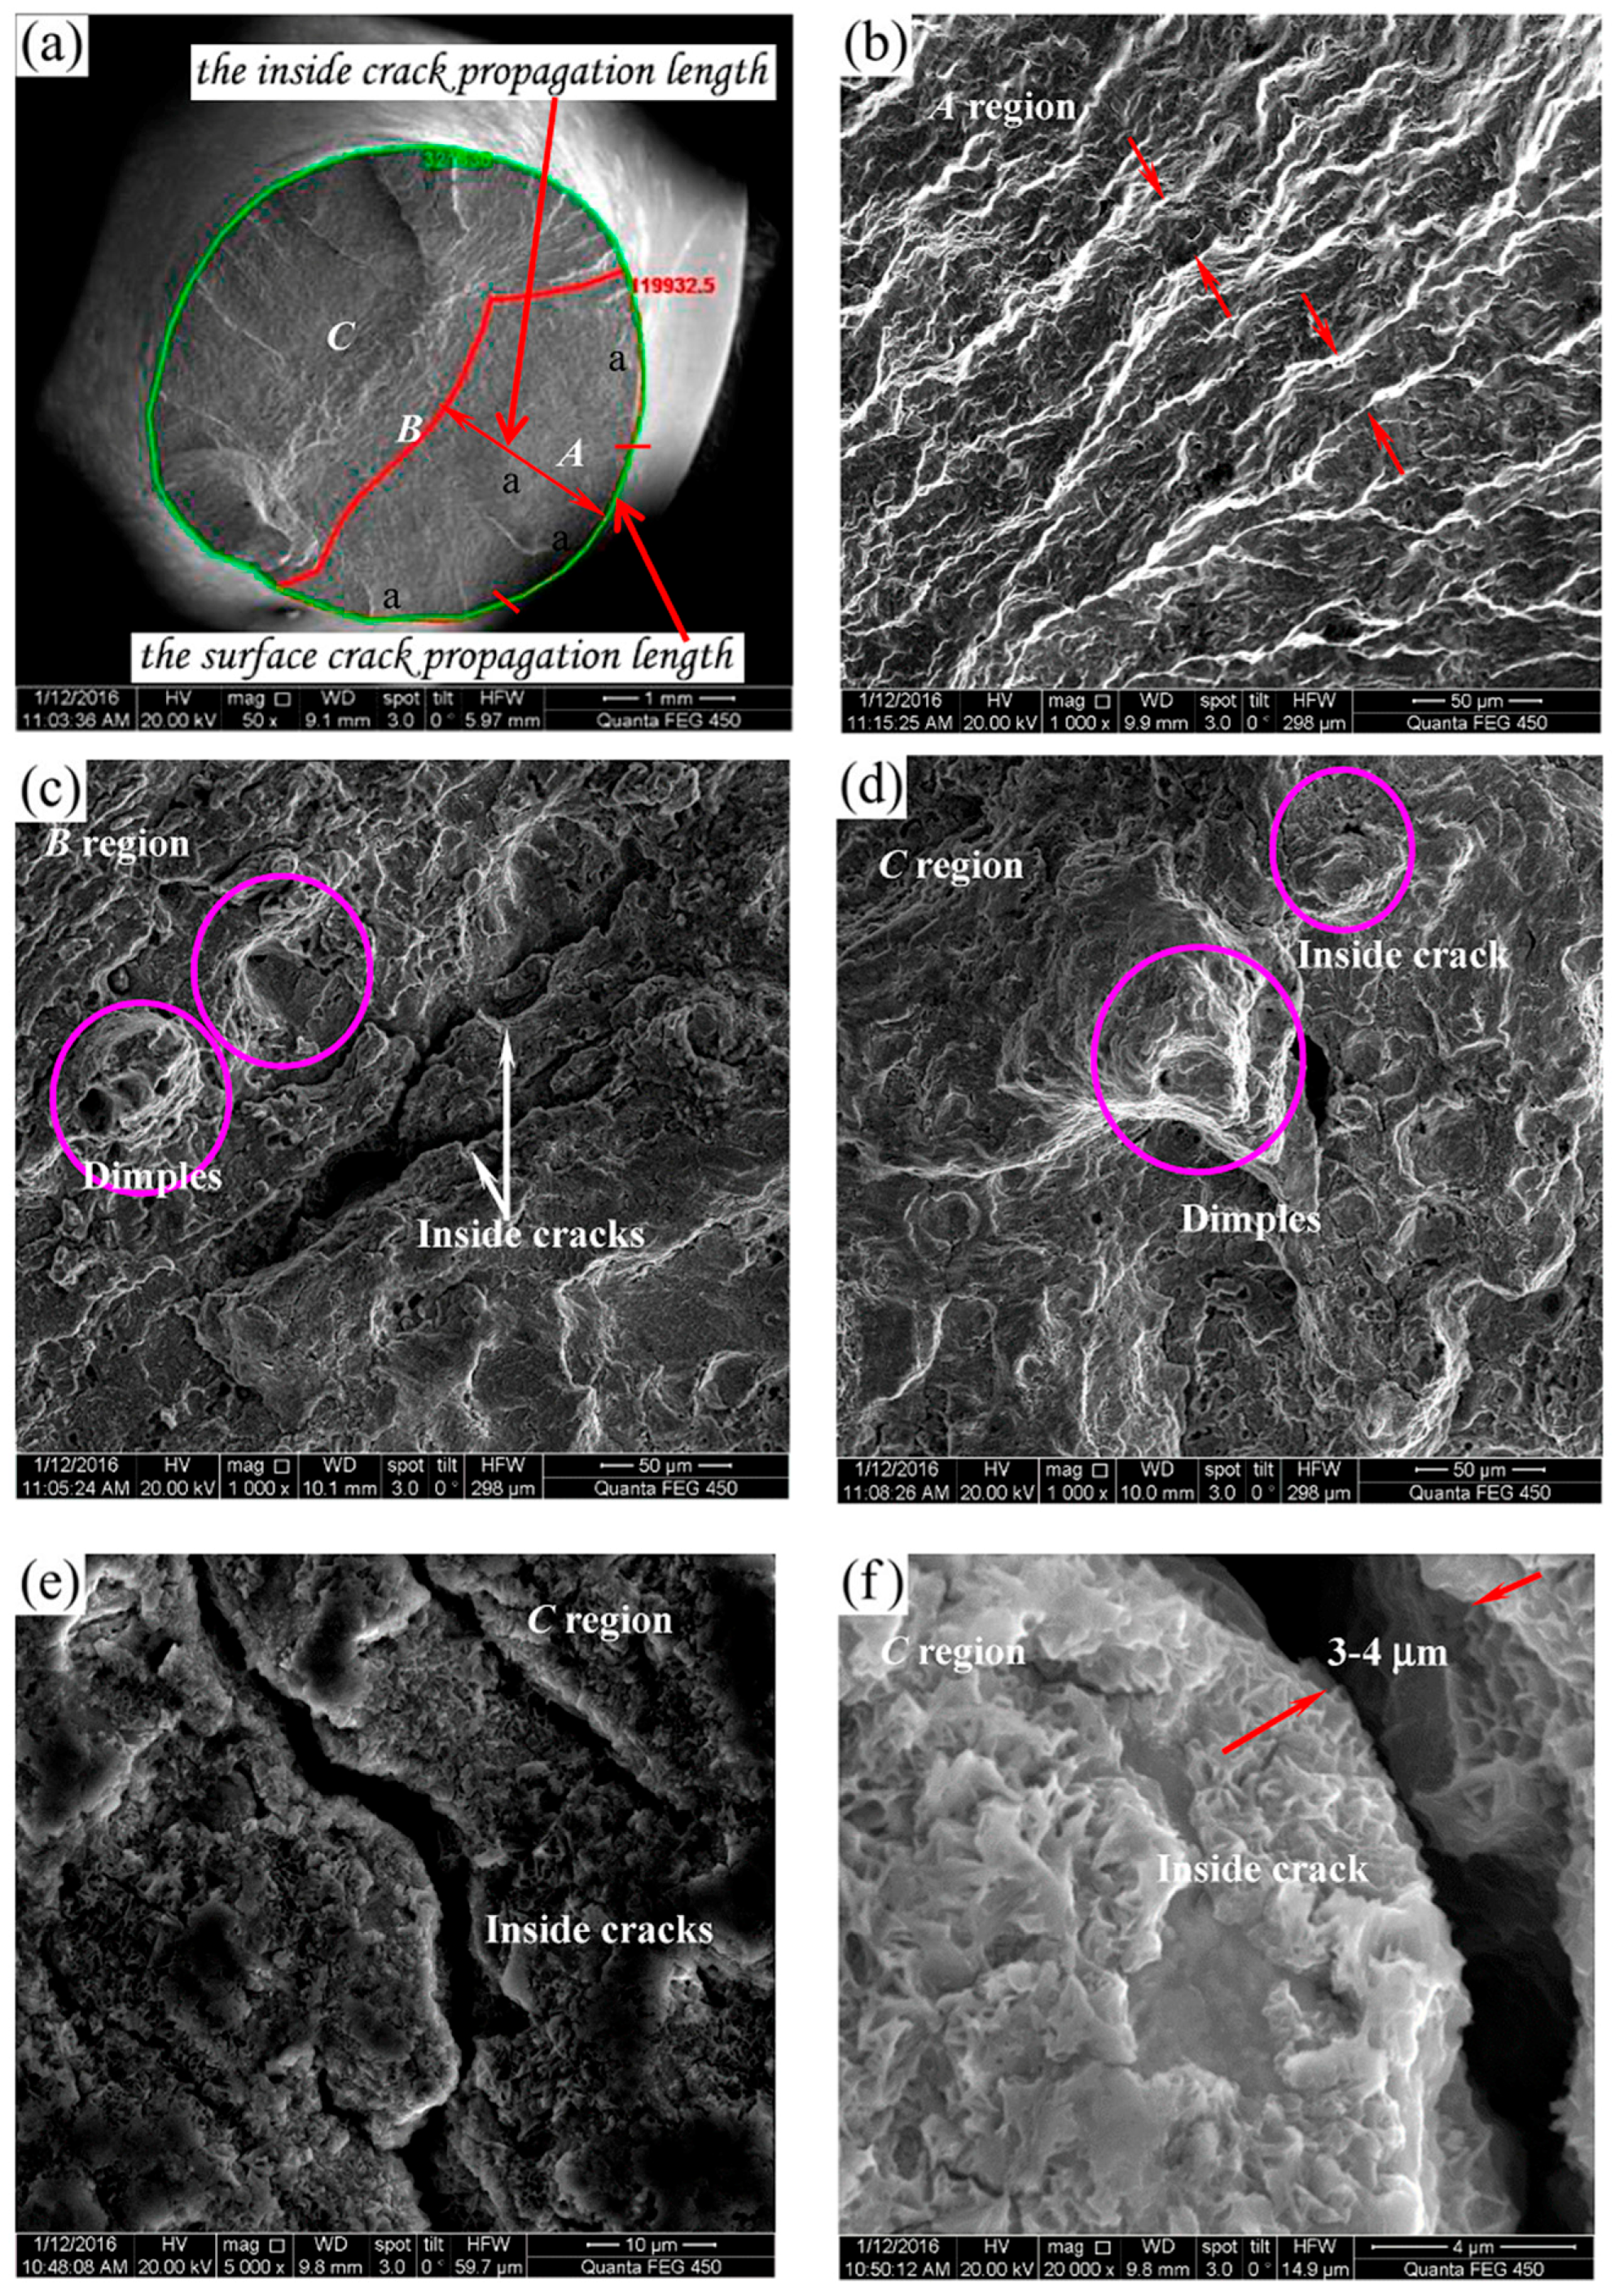
Figure 5.
Typical fracture characteristics for Nf = 6.590 × 10⁵, σ = 233.3 MPa in a 5.0 wt % NaCl solution. (a) Macro-scale view of the fracture surface; (b) region labeled A; (c) region labeled B; (d) region labeled C.
Figure 5.
Typical fracture characteristics for Nf = 6.590 × 10⁵, σ = 233.3 MPa in a 5.0 wt % NaCl solution. (a) Macro-scale view of the fracture surface; (b) region labeled A; (c) region labeled B; (d) region labeled C.
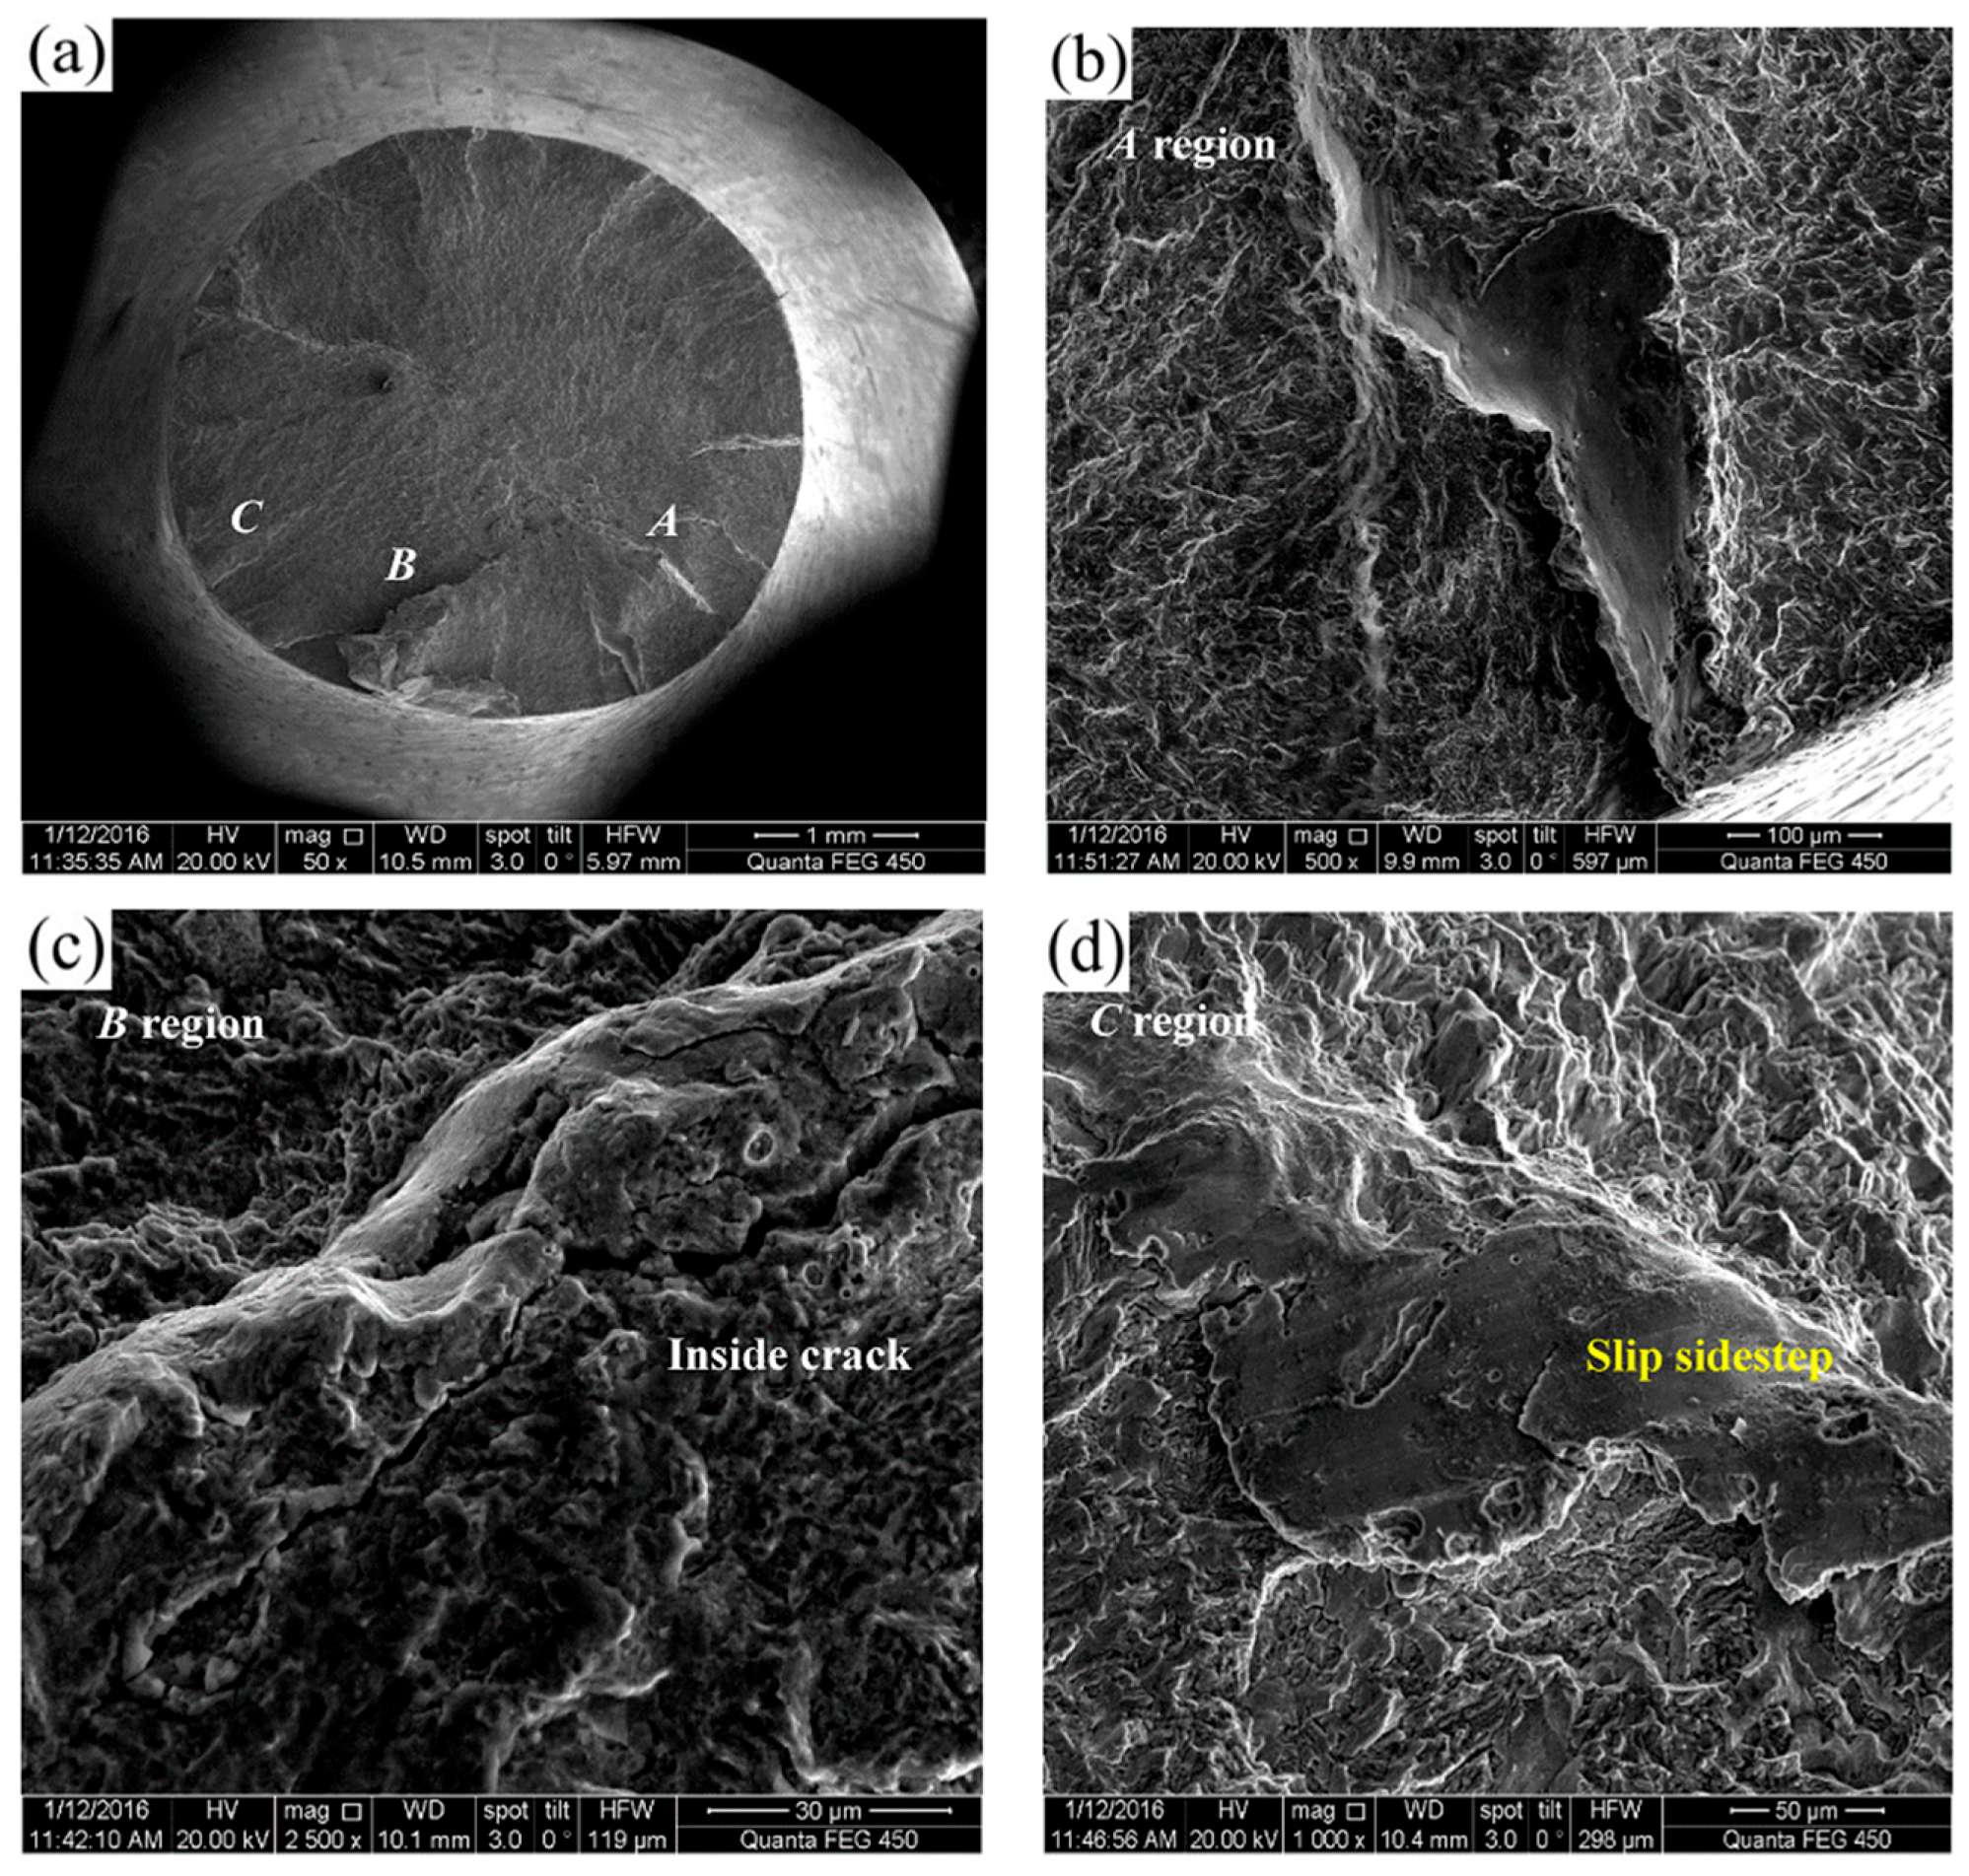
Figure 6.
Typical fracture characteristics for Nf = 9.386 × 10⁵, σ = 233.3 MPa in a 5.0 wt % NaCl solution. (a) Macro-scale view of the fracture surface; (b) region labeled A; (c) region labeled B; (d) region labeled C.
Figure 6.
Typical fracture characteristics for Nf = 9.386 × 10⁵, σ = 233.3 MPa in a 5.0 wt % NaCl solution. (a) Macro-scale view of the fracture surface; (b) region labeled A; (c) region labeled B; (d) region labeled C.
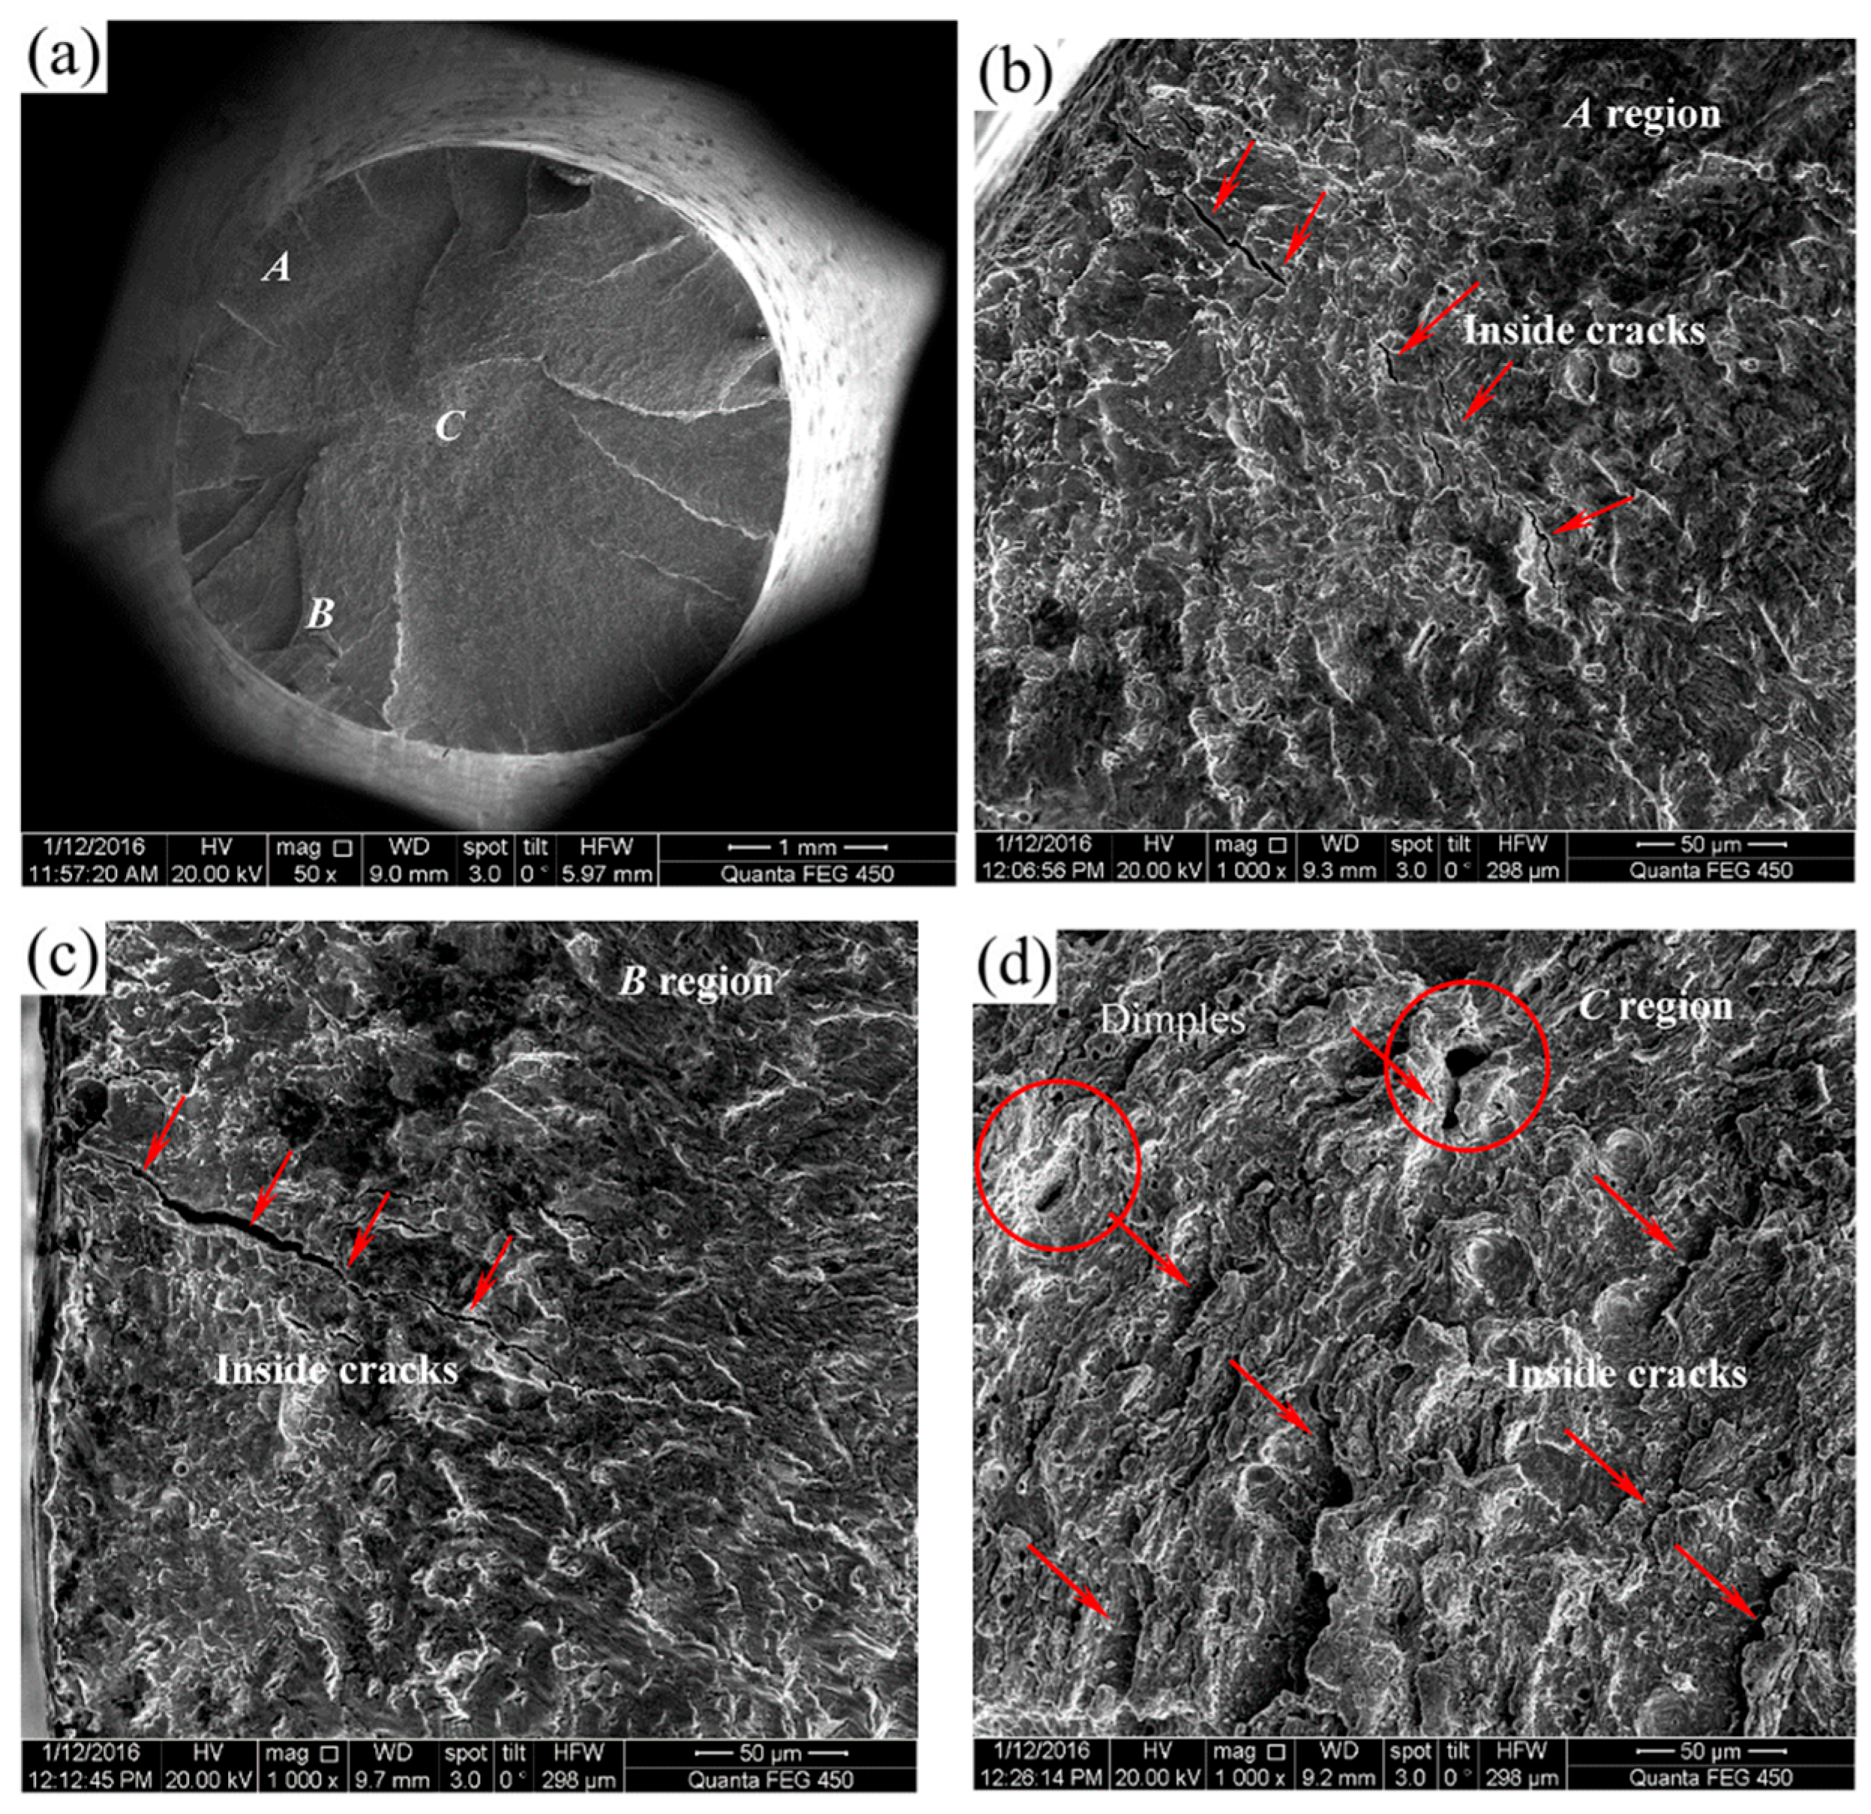
Figure 7.
Typical fracture analysis of 25CrMo steel in the same testing condition (233.3 MPa, 5.0 wt % NaCl). Macro-scale fracture surface characteristics for (a) Nf = 3.942 × 10⁵; (b) Nf = 6.590 × 10⁵; (c) Nf = 9.386 × 10⁵.
Figure 7.
Typical fracture analysis of 25CrMo steel in the same testing condition (233.3 MPa, 5.0 wt % NaCl). Macro-scale fracture surface characteristics for (a) Nf = 3.942 × 10⁵; (b) Nf = 6.590 × 10⁵; (c) Nf = 9.386 × 10⁵.
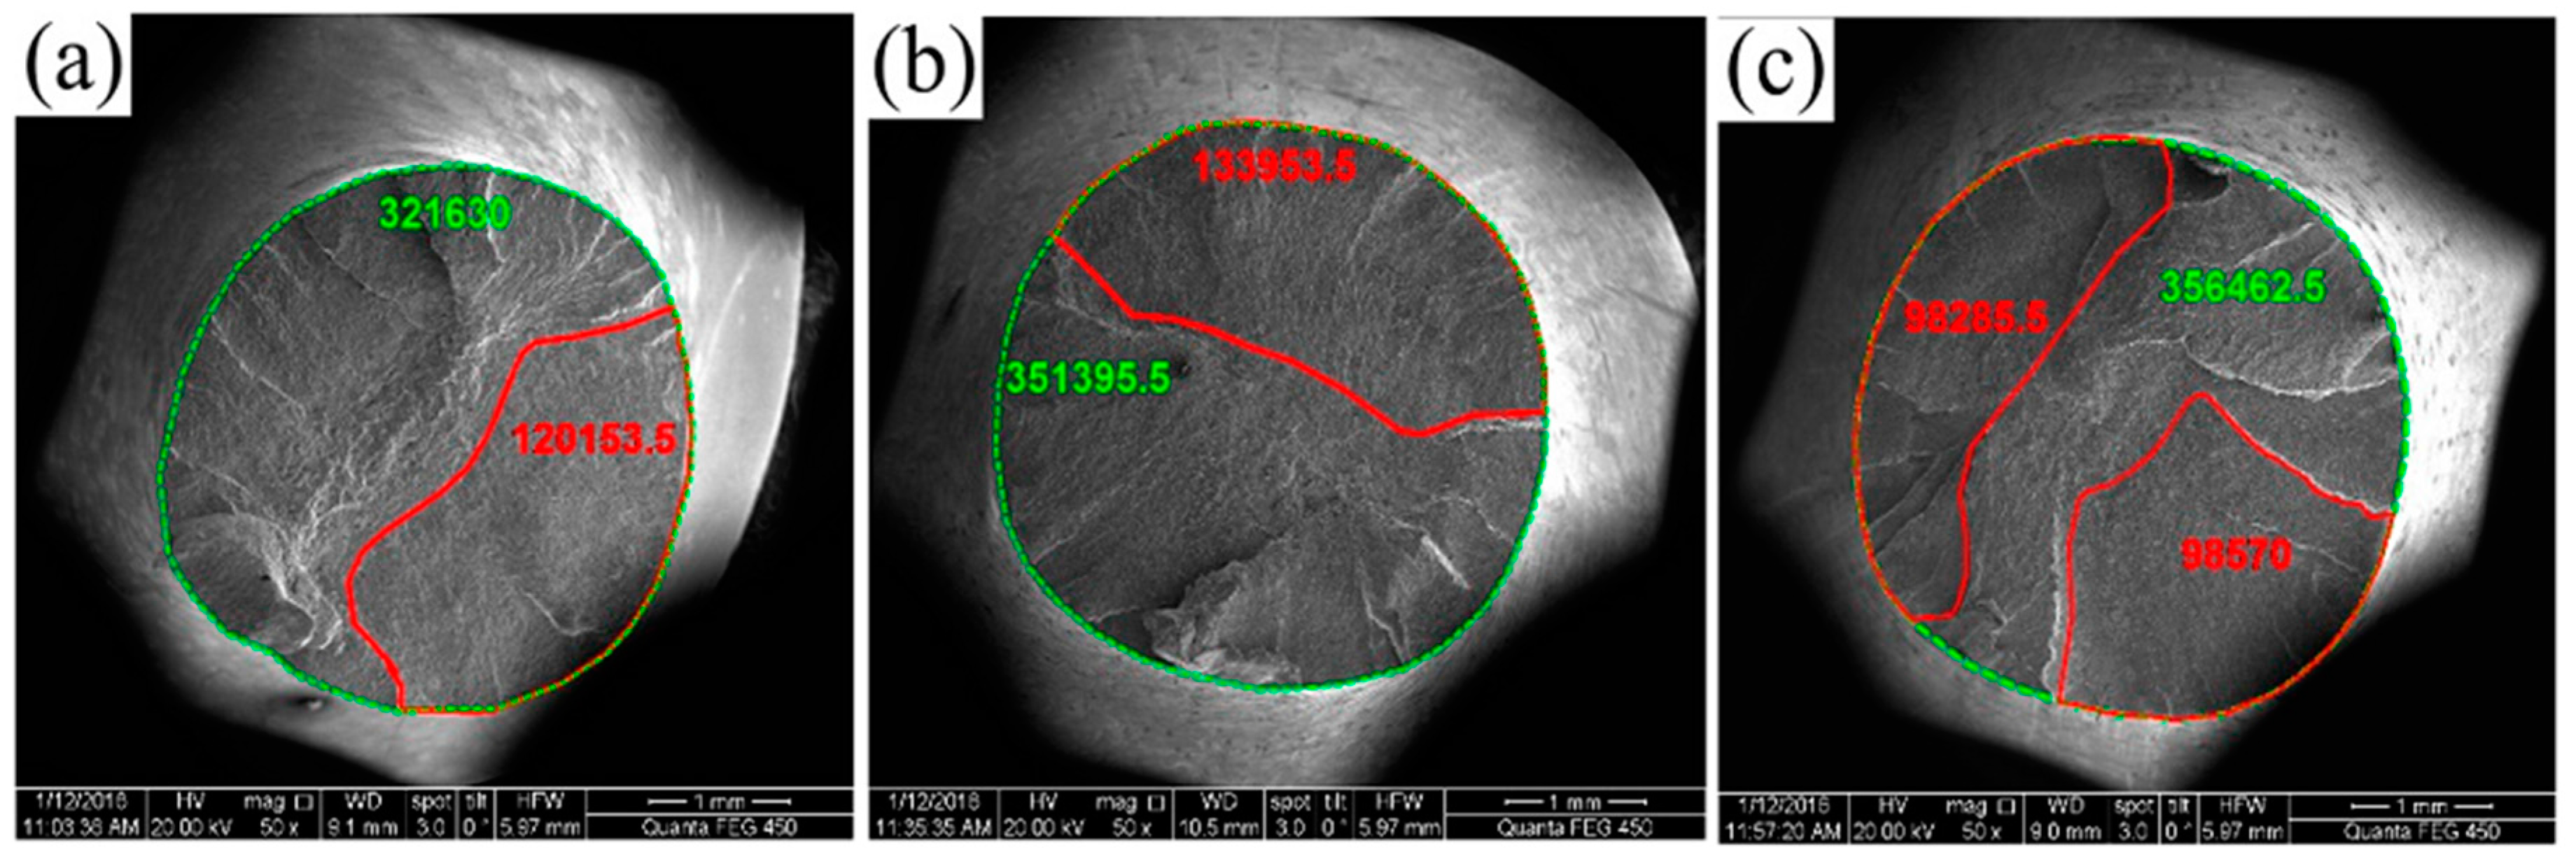
Figure 8.
Experimental data and estimated value of the corrosion fatigue life for different stresses in a 3.5 wt % NaCl solution. The solid circles are the predicted values for 25CrMo steel in a 3.5 wt % NaCl solution, and the open circles are the experimental values for 25CrMo steel in a 3.5 wt % NaCl solution. The dotted line was the liner fit of the black solid circles.
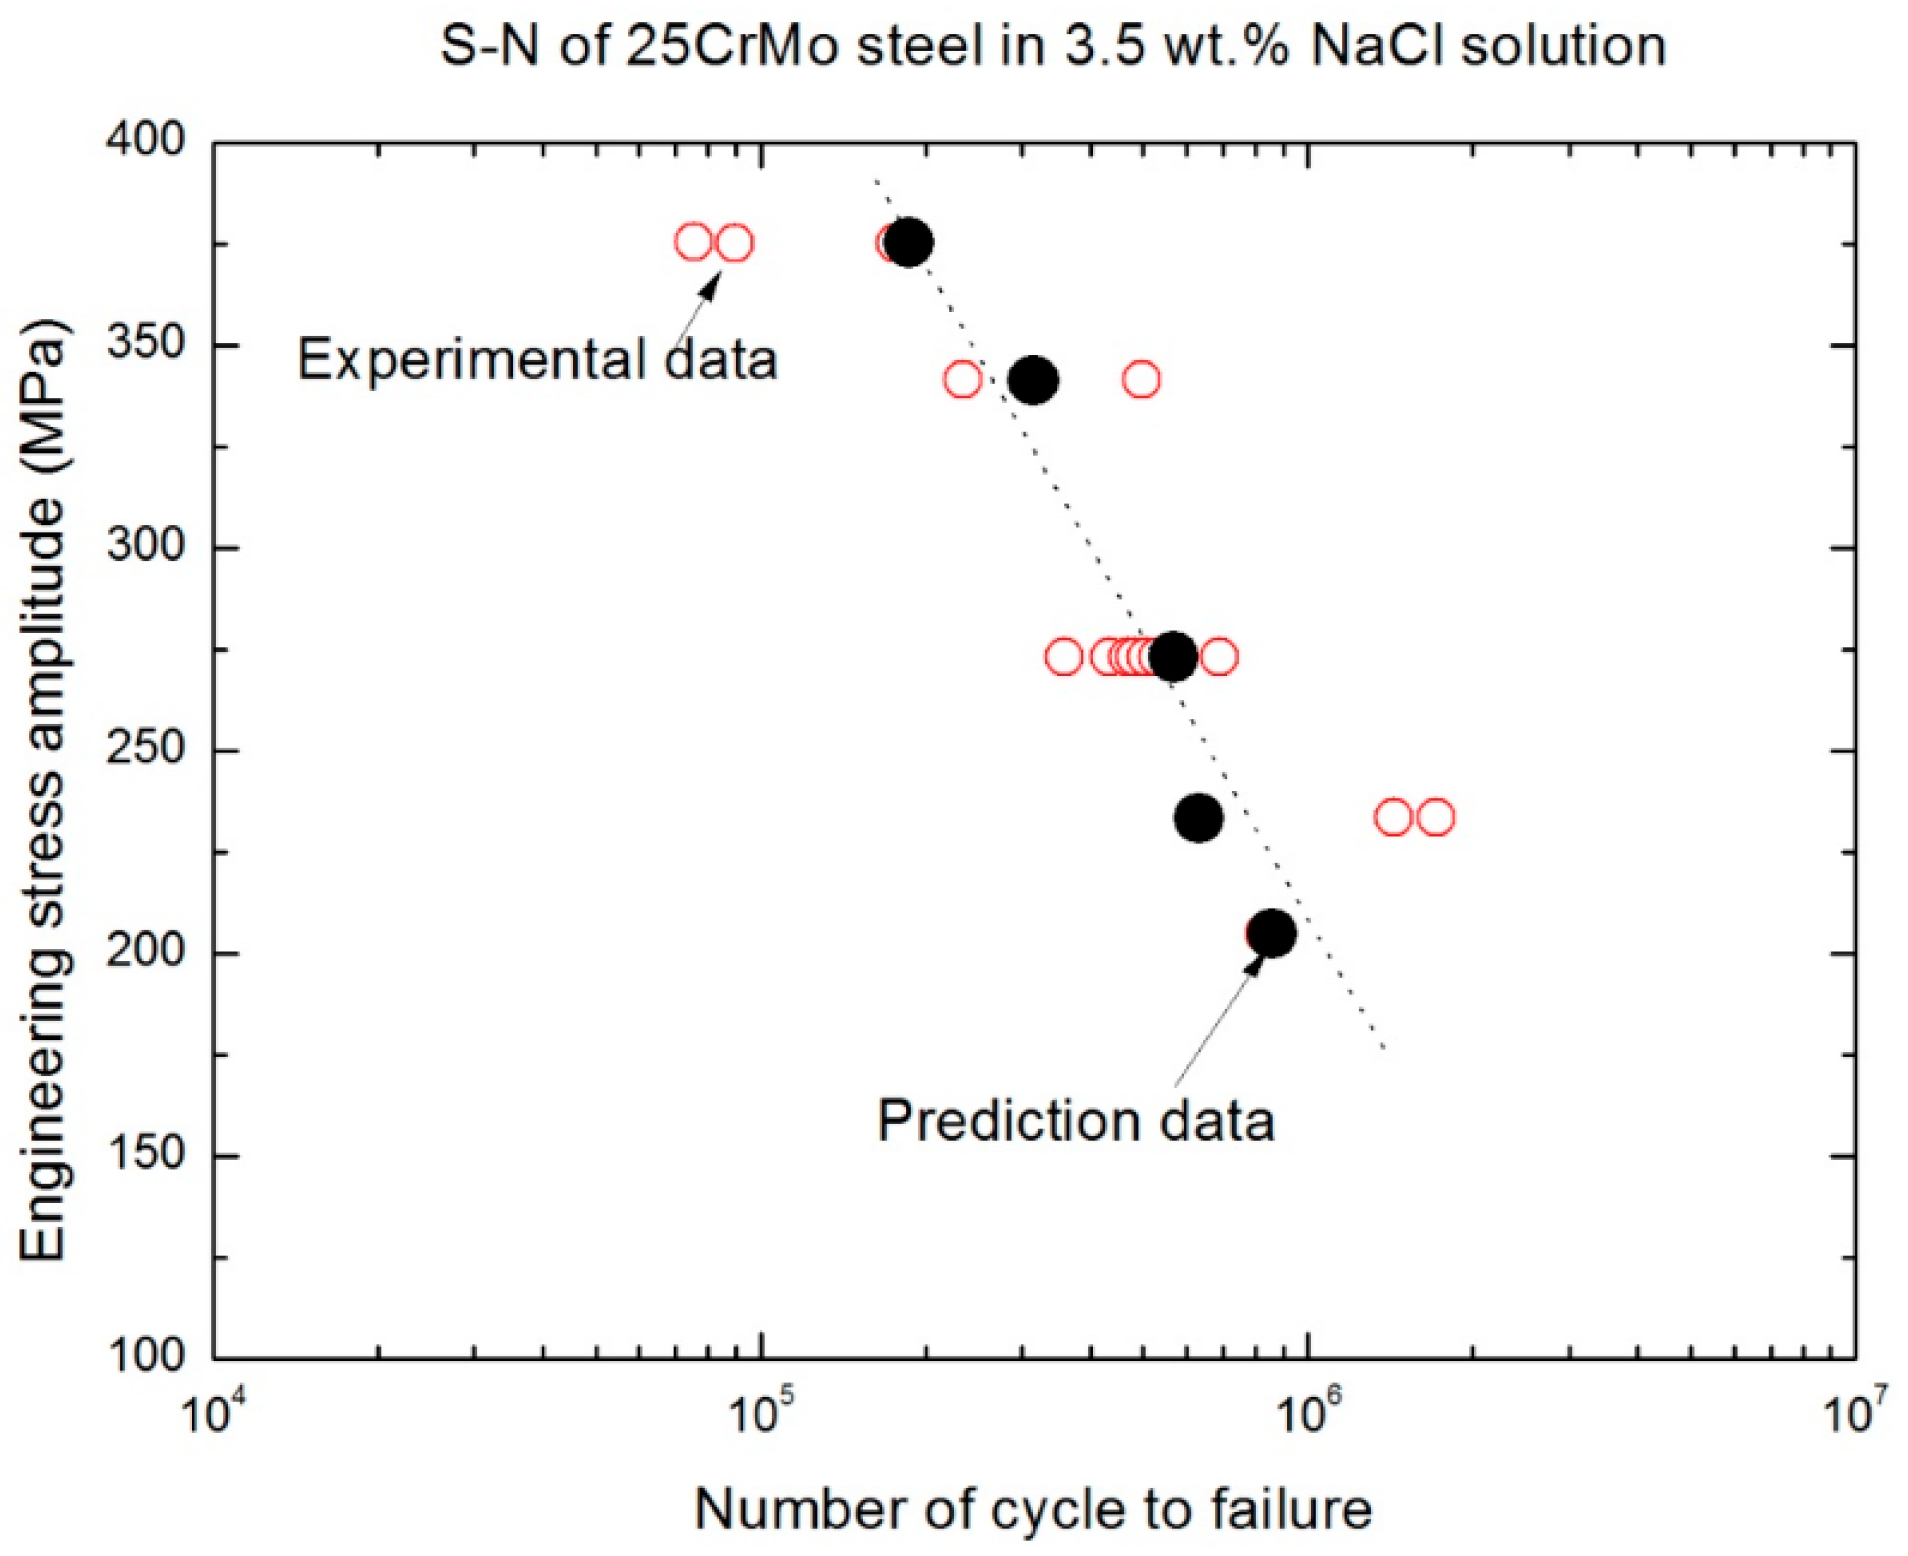
Figure 9.
F(x) vs. Nf for 25CrMo steel under different testing conditions. The circles represent the failure probability at 233.3 MPa in a 5.0 wt % NaCl solution, and the squares represent the failure probability at 273.0 MPa in a 3.5 wt % NaCl solution.
Figure 9.
F(x) vs. Nf for 25CrMo steel under different testing conditions. The circles represent the failure probability at 233.3 MPa in a 5.0 wt % NaCl solution, and the squares represent the failure probability at 273.0 MPa in a 3.5 wt % NaCl solution.

Table 1.
Mechanical properties of 25CrMo steel at room temperature.
| Material | Ultimate Tensile Strength | Offset Yield Strength | Elongation | Young’s Modulus |
|---|---|---|---|---|
| 25CrMo steel | 678 MPa | 520 MPa | 21.2% | 205 GPa |
Table 2.
Reliability parameters of fatigue fracture life under different environmental conditions.
| Condition | m | b (×105) | (×105) | c (×105) | Ρ′ | E(x) (×105) | S(x) (×105) | β |
|---|---|---|---|---|---|---|---|---|
| 273.0 MPa 3.5 wt % NaCl | 3.44 | 5.47 | 5.10 | 1.81 | 0.96 | 4.92 | 1.58 | 3.11 |
| 233.3 MPa 5.0 wt % NaCl | 2.08 | 6.51 | 6.00 | 2.42 | 0.84 | 5.77 | 2.91 | 1.98 |
β: Reliability index (). A higher value of β indicates a higher reliability.
Table 3.
Repeated fatigue testing data for 25CrMo steel under different environmental conditions.
| Testing Conditions | No. 1 ×10⁵ | No. 2 ×10⁵ | No. 3 ×10⁵ | No. 4 ×10⁵ | No. 5 ×10⁵ | No. 6 ×10⁵ | No. 7 ×10⁵ | No. 8 ×10⁵ | No. 9 ×10⁵ | No. 10 ×105 |
|---|---|---|---|---|---|---|---|---|---|---|
| 273.0 MPa 3.5 wt % NaCl | 3.588 | 4.351 | 4.676 | 4.819 | 4.830 | 5.068 | 5.310 | 5.690 | 5.711 | 6.911 |
| 233.3 MPa 5.0 wt % NaCl | 3.942 | 3.987 | 5.440 | 5.779 | 5.799 | 5.811 | 6.200 | 6.446 | 6.590 | 9.386 |
© 2017 by the authors. Licensee MDPI, Basel, Switzerland. This article is an open access article distributed under the terms and conditions of the Creative Commons Attribution (CC BY) license (http://creativecommons.org/licenses/by/4.0/).
Share and Cite
MDPI and ACS Style
Wang, Y.-L.; Wang, X.-S.; Wu, S.-C.; Yang, H.-H.; Zhang, Z.-H. High-Cycle Microscopic Severe Corrosion Fatigue Behavior and Life Prediction of 25CrMo Steel Used in Railway Axles. Metals 2017, 7, 134. https://doi.org/10.3390/met7040134
AMA Style
Wang Y-L, Wang X-S, Wu S-C, Yang H-H, Zhang Z-H. High-Cycle Microscopic Severe Corrosion Fatigue Behavior and Life Prediction of 25CrMo Steel Used in Railway Axles. Metals. 2017; 7(4):134. https://doi.org/10.3390/met7040134
Chicago/Turabian StyleWang, Yan-Ling, Xi-Shu Wang, Sheng-Chuan Wu, Hui-Hui Yang, and Zhi-Hao Zhang. 2017. "High-Cycle Microscopic Severe Corrosion Fatigue Behavior and Life Prediction of 25CrMo Steel Used in Railway Axles" Metals 7, no. 4: 134. https://doi.org/10.3390/met7040134
Note that from the first issue of 2016, this journal uses article numbers instead of page numbers. See further details here.