
The Influence of Deoxidation Practice on the As-Cast Grain Size of Austenitic Manganese Steels
by
 , and
, and
Dimitrios Siafakas
1,*, 
Taishi Matsushita
1,
Åsa Lauenstein
2,
Johan Ekengård
3 and
Anders E. W. Jarfors
1 1
Department of Materials and Manufacturing, School of Engineering, Jönköping University, 551 11 Jönköping, Sweden
2
Swerea SWECAST AB, 553 22 Jönköping, Sweden
3
Sandvik SRP, 233 81 Svedala, Sweden
*
Author to whom correspondence should be addressed.
Metals 2017, 7(6), 186; https://doi.org/10.3390/met7060186
Submission received: 12 April 2017
/
Revised: 8 May 2017
/
Accepted: 22 May 2017
/
Published: 24 May 2017
Abstract
:The effect of in-situ precipitating particles on the grain size of Al-Ti-treated and untreated Hadfield steel cast in a pilot scale environment was studied. Hadfield steel was melted in an induction furnace and cast in Y-Block samples. Light Optical Microscopy (LOM) and the intercept method were utilized for the grain size measurements. Additionally, Thermo-Calc Software TCFE7 Steels/Fe-alloys database version 7 was used for thermodynamic equilibrium calculations of the mole fraction of particles. The planar disregistry values between the austenite and the precipitating particles were calculated. It was observed that increasing oxide content in samples with low Ti(CN) content resulted in a finer microstructure, while increasing the Ti(CN) content under similar oxide content levels led to a coarser microstructure. The potency of each type of particle to nucleate austenitic grains was determined. Spinel (MnAl2O4, MgAl2O4) particles were characterized as the most potent, followed by olivine (Mn2SiO4), corundum (Al2O3, TiO2), and finally Ti(CN), the least potent particle.
Keywords:
Hadfield steel; grain size; austenite; deoxidation; particles; aluminum; titanium; oxides; titanium nitrides1. Introduction
It is well established within the scientific community that refining the microstructure of a metallic material most often results in a significant improvement of the mechanical properties of the material, such as yield strength, toughness, hardness, and wear resistance.
Alongside traditional methods such as casting temperature and controlling the cooling rate of the casting, techniques such as inoculation and precise composition selection are widely accepted among researchers as effective ways of controlling grain growth in metallic materials during solidification. Inoculation is a practice where particles or alloying elements are added into the melt with the aim of modifying a forming phase to a finer microstructure or of providing an adequate number of nucleation sites for grains to nucleate and grow [1].
It has been proven that in δ-iron, amongst other materials, the choice of a potent inoculant can be based on the disregistry, a value that shows the degree of the crystallographic mismatch between an inoculant substrate and the matrix phase [2]. Bramfitt [2] calculated the disregistry of several nitrides and carbides by formulating Equation (1) [2] and showed that particles with lower disregistry are more potent substrates for nucleating δ-iron.
where (hkl)s is a low-index plane of the substrate, [uvw]s is a low-index direction in (hkl)s, (hkl)n is a low-index plane in the nucleated solid, [uvw]n is a low-index direction in (hkl)n, d[uvw]n is the interatomic spacing along [uvw]n, d[uvw]s is the interatomic spacing along [uvw]s, and θ is the angle between [uvw]n and [uvw]s directions.
Even though the disregistry can provide valuable information about the potency of a substrate to nucleate a matrix phase, it cannot fully explain the mechanisms of grain nucleation and growth by itself. St. John et al. [3], in an attempt to better explain grain nucleation and growth in light metal alloys, showed that not only substrate particle potency but also particle number density and size, solute concentration in the solid-liquid interface, and solute diffusivity play a significant role in the final average grain size (AGS) of the material and eventually formulated the following model [3] (the interdependence theory) to predict the AGS:
where ρ is the number density of nucleant particles, f is the fraction of particles that are activated as nuclei, b1 is a fitting factor, ΔTn is the undercooling required for nucleation, and Q is the growth restriction factor (GRF) [3].
where mli is the liquidus slope for element i, k is the equilibrium partition ratio of element i, and c0i is the solute content in the alloy melt of element i. Equation (3) considers no interaction between the alloying elements and solidus and liquidus lines as linear. Equation (2) reveals a linear relationship between the inverse of Q and the grain size. Change on the slope b1 while keeping the particle density constant indicates a change in the nucleation potency of the particles. On the other hand, change on the intercept shows the effect of increasing or decreasing the number of available particles of the same type.
Even though austenitic steels are widely used in the component casting industry, research on the refinement of the microstructure through inoculation is very limited due to the difficulties of incorporating proper inoculation processes on an industrial level.
Haakonsen et al. [4] studied the possibility of inoculating austenitic manganese steels with a cerium-based refiner. The addition of the refiner resulted in the formation of CeO2, CeAlO3, and Ce2O2S particles. A decrease in the columnar zone size and the equiaxed grain size was observed when a critical number of 157 cerium-based particles per mm2 was reached. Though, the fact that the average grain size of the cerium-treated material is higher than that of the untreated reference material is not fully explained.
In another study performed by Lekakh et al. [5], it was observed that a sequential addition of Ca, and Al-Mg followed by Ti, produced a finer microstructure in stainless austenitic steels when compared to other sequential addition combinations of the same elements. The aim behind the most successful deoxidation practice was to create a higher density number of spinel particles for TiN to precipitate on and thus a higher density number and smaller size of TiN particles for austenite to precipitate on.
Microstructure refinement has been widely investigated for materials such as δ-iron alloys and aluminum- and magnesium-based alloys, as well as for cast iron, but little relevant work is available for austenitic steels, including Hadfield steel. This work attempts to close this gap by investigating the effect of in-situ-formed particles and alloying elements on the as-cast grain size of Hadfield steel. The characteristics and growth mechanisms of particles precipitated in-situ in Al-Ti-treated Hadfield steels have been discussed elsewhere [6,7].
2. Materials and Methods
2.1. Material
The material under investigation is a Hadfield steel with a target composition according to the American Society of Testing and Materials (ASTM) A128/A128M standard (Table 1) [8]. Hadfield steel melts were produced utilizing raw material and calculated amounts of high-carbon FeMn, medium-carbon FeMn, high-carbon FeCr and FeSi. Deoxidation was performed with additions of 0.1 wt % aluminum and 0.15 wt % Ti in the form of FeTi.
2.2. Melting and Casting Process
A 250 kW Inductotherm VIP POWER-TRAK-R steel/iron melting induction furnace (Inductotherm Europe Ltd., Droitwich, UK) with a maximum capacity of 350 kg was used to heat 250 kg of low alloyed rough steel and Hadfield steel scrap up to 1600 °C with a heating rate of 700 °C/h. When the material was fully melted the alloying elements were added and left to homogenize in order to achieve the desired steel composition. The melting practice and amount of material were chosen as such to simulate the production conditions of small- to medium-sized foundries.
Sampling was performed directly from the furnace using common Y-block test molds manufactured with furan sand according to the SIS 112132 standard [9]. Due to size and mold material, Y-block samples are ideal to simulate final product casting conditions. The addition of FeTi and Al was done either directly in the furnace or the mold during casting. The casting temperature was 1515 ± 25 °C.
2.3. Material Characterization
The samples were then prepared for further analysis by cutting, mounting, grinding, polishing, and finally etching with 5% solution of Nital. Chemical analysis was performed with an AMETEK Nordic AB SPECTROLAB Optical Emission Spectrograph (OES) (Ametek Nordic AB, Vällingby, Sweden). The dissolved oxygen content in the melt was measured using a Heraeus AB Celox apparatus. Light optical microscopy (LOM) (Heraeus AB, Lidingö, Sweden) was utilized for the acquisition of images of the microstructure of the material. The grain size measurements were performed with the intercept method according to the ASTM standard E112-13 [10]. The intercept method uses a series of equal length lines with different directions that are drawn on the OES micrograph to determine the grain size. The points where the lines intercept with the grain boundaries are counted, and the grain size is calculated as a function of the total number of intercepts, the length of the lines and the micrograph scale. In this work, the minimum number of intercepts counted was 400 in 5 different areas of the surface of each sample. The nominal compositions of each analyzed sample are presented in Table 2. It is observed that the yield of Ti and Al is low when compared to the initial amounts of additions. The deoxidation by-products such as Ti(CN) and aluminum oxides have the tendency to float to the surface slag or the furnace lining instead of remaining in the bulk molten metal. The process is also promoted by the strong electromagnetic stirring in the induction furnace and thus the yield of Al and Ti in the final samples is lower than the initial additions [11]. A JEOL JSM-7001F thermal field emission Scanning Electron Microscope (SEM) with Energy-Dispersive Spectroscopy (EDS) capability (JEOL Ltd., Tokyo, Japan) was utilized for the characterization of the particles.
2.4. Thermodynamic Equilibrium Calculations
Thermo-Calc Software TCFE7 Steels/Fe-alloys database version 7 [12] (Thermo-Calc Software AB, Solna, Sweden, 2002) was utilized to calculate the mole fraction of all the precipitating phases in the material. The final composition of each sample was input in the single point equilibrium module of the software and the calculation was performed for the liquidus temperature (1380 °C).
3. Results and Discussion
3.1. Grain Size and Microstructure
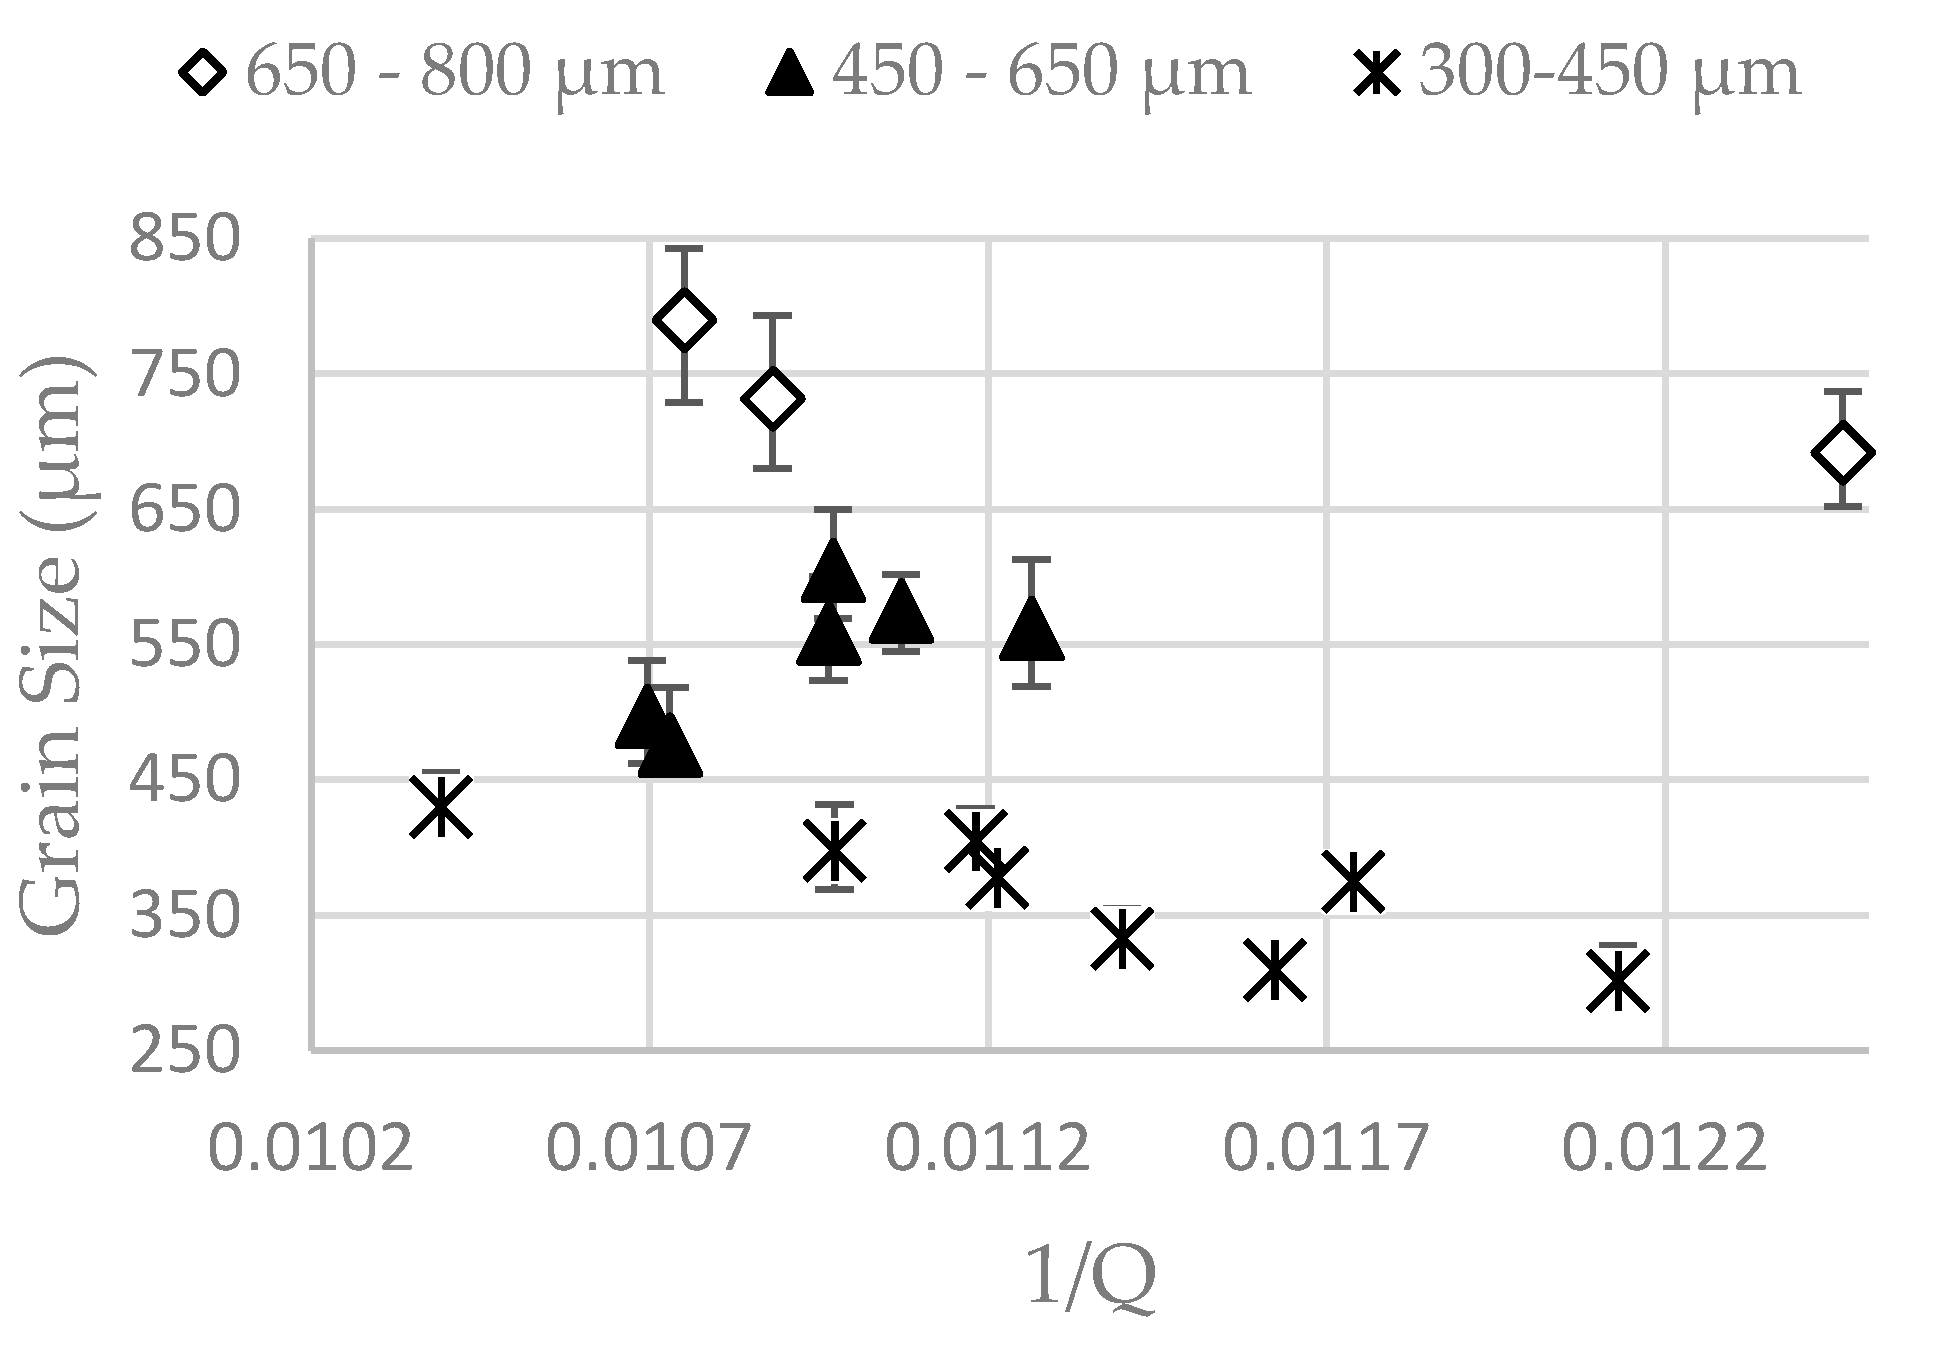
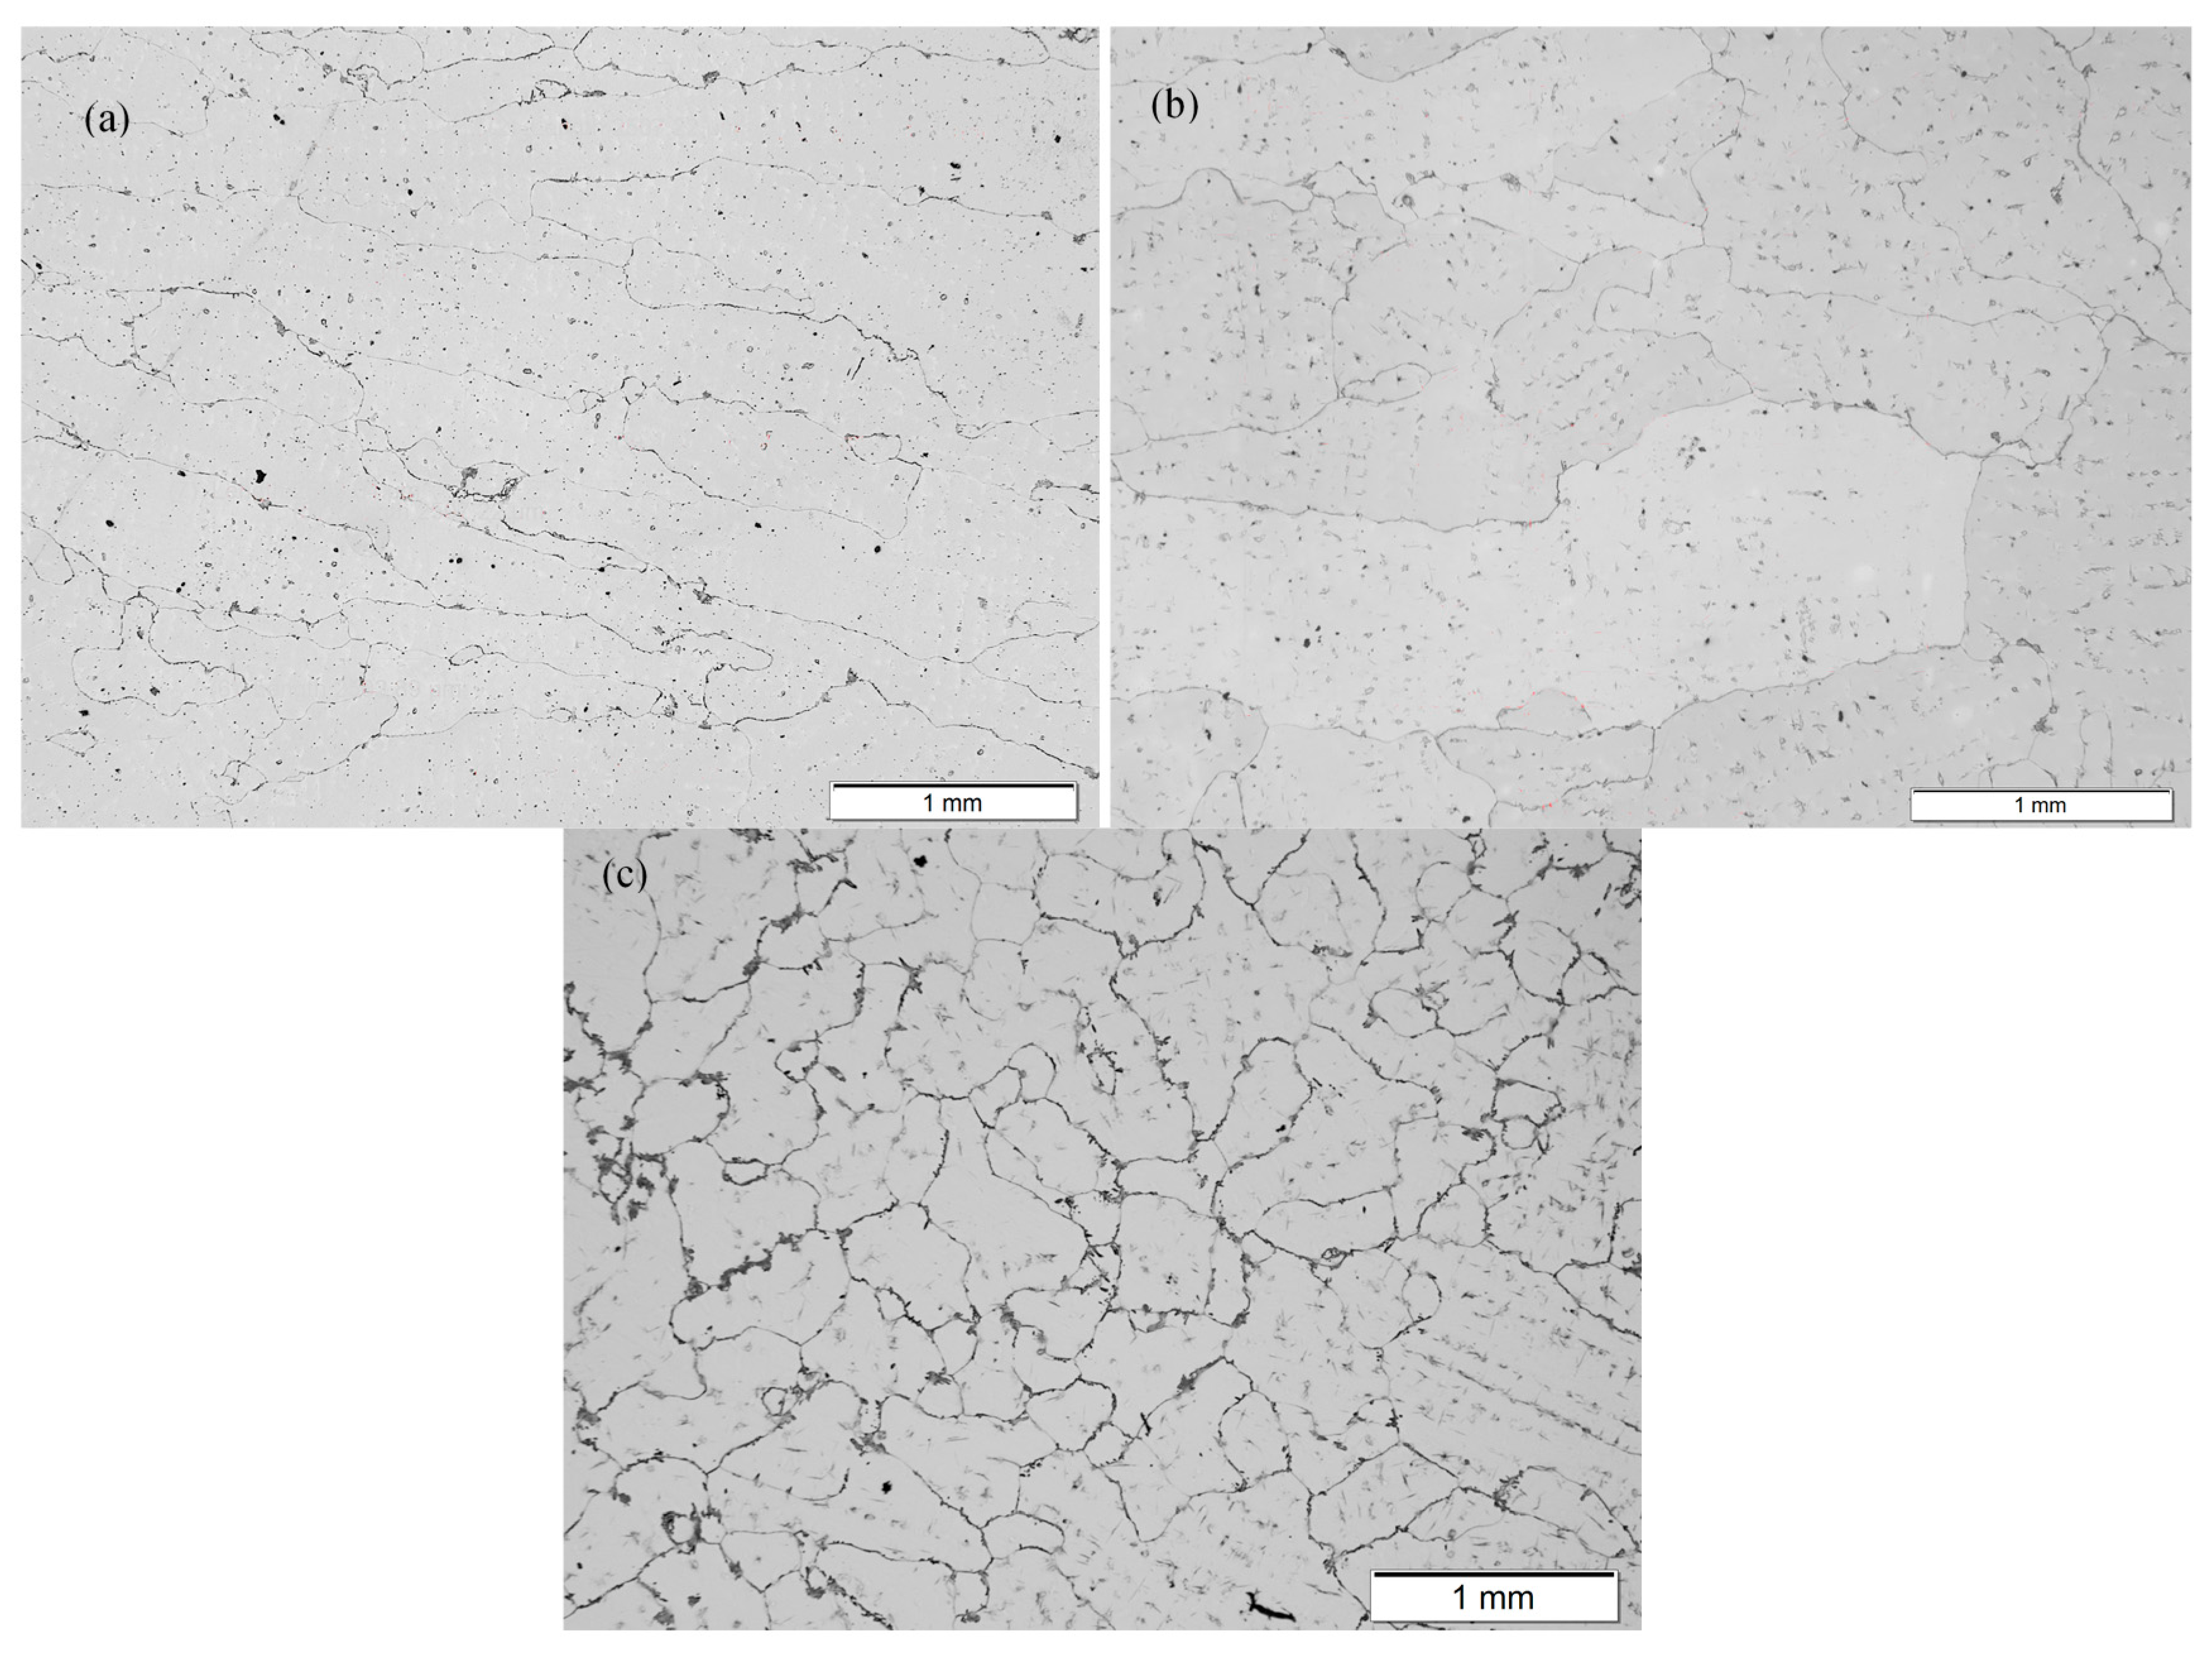
Figure 1 shows the relationship between 1/Q and the average grain size of Samples S1 to S17. The inverse of Q was calculated with the help of Equation (3) and the composition of each sample. According to Figure 1, the samples can be divided into three distinct groups based on grain size: Group A (650–800 μm), Group B (450–650 μm), and Group C (300–450 μm). The typical microstructure of each group is shown in Figure 2 where a gradual transition from fully columnar grains to fully equiaxed grains is observed. The average grain size of Samples S1 to S17 alongside the calculated values of 1/Q and mole fractions of the Ti(CN) and oxide phases are summarized in Table 3.
St. John et al. [3] established with the interdependence theory that both the composition of the alloy in terms of GRF and the particle density in terms of particle number and size are important variables that influence grain nucleation and growth. In this case, the compositional variation between the samples is small, the second term, , in Equation (2) can be assumed the same for all samples, and no connection between GRF and grain size can be established. The intercept in Equation (2) relates to the particle density, and a vertical transition from a higher intercept (higher grain size group) to a lower intercept (lower grain size group) indicates an increase in the particle density. Increasing the particle density of particles that can act as nuclei and thus the number of possible nucleation sites results in a refined microstructure with a smaller columnar region and a higher ratio of equiaxed grains.
3.2. The Effect of Oxide Particles
In a previous work [6], it was determined that the main types of particles that precipitate in-situ in Al-Ti-treated steels are Ti(CN), TiNbC, MnS, and oxide particles of different types such as spinel (MnAl2O4, MgAl2O4), corundum (Al2O3, TiO2), and olivine (Mn2SiO4). According to the available inoculation theories [2,5], particles can act as nuclei only if they can survive or precipitate above the liquidus temperature of the matrix alloy; therefore, out of the above particles only, Ti(CN) and the oxide particles are possible candidates to act as nuclei for austenitic grains. SEM images illustrating the shape and size of oxide and Ti(CN) particles observed in Hadfield steel samples alongside their EDS spectrums and nominal compositions are shown in Figure 3.
The relationship between oxide particle mole fraction calculated with Thermo-Calc Software TCFE7 Steels/Fe-alloys database version 7 [12] and austenitic grain size is illustrated in Figure 4. To individually examine the effect of oxides, samples with more than 0.0006 mole fraction of Ti(CN) were excluded from the plot with the exception of Samples S16 and S17. Samples S16 and S17 were cast 45 min after the addition of Ti and Al. The deoxidation reactions are completed in a matter of a few minutes after the addition of Ti and Al [11], so 45 min is considered a long enough waiting period not only for the deoxidation reaction to complete but also for oxygen and nitrogen from the atmosphere to re-enter the melt and form new oxides without any interference from the precipitated Ti(CN) particles. Therefore, the mole fraction of Ti(CN) can be assumed as zero.
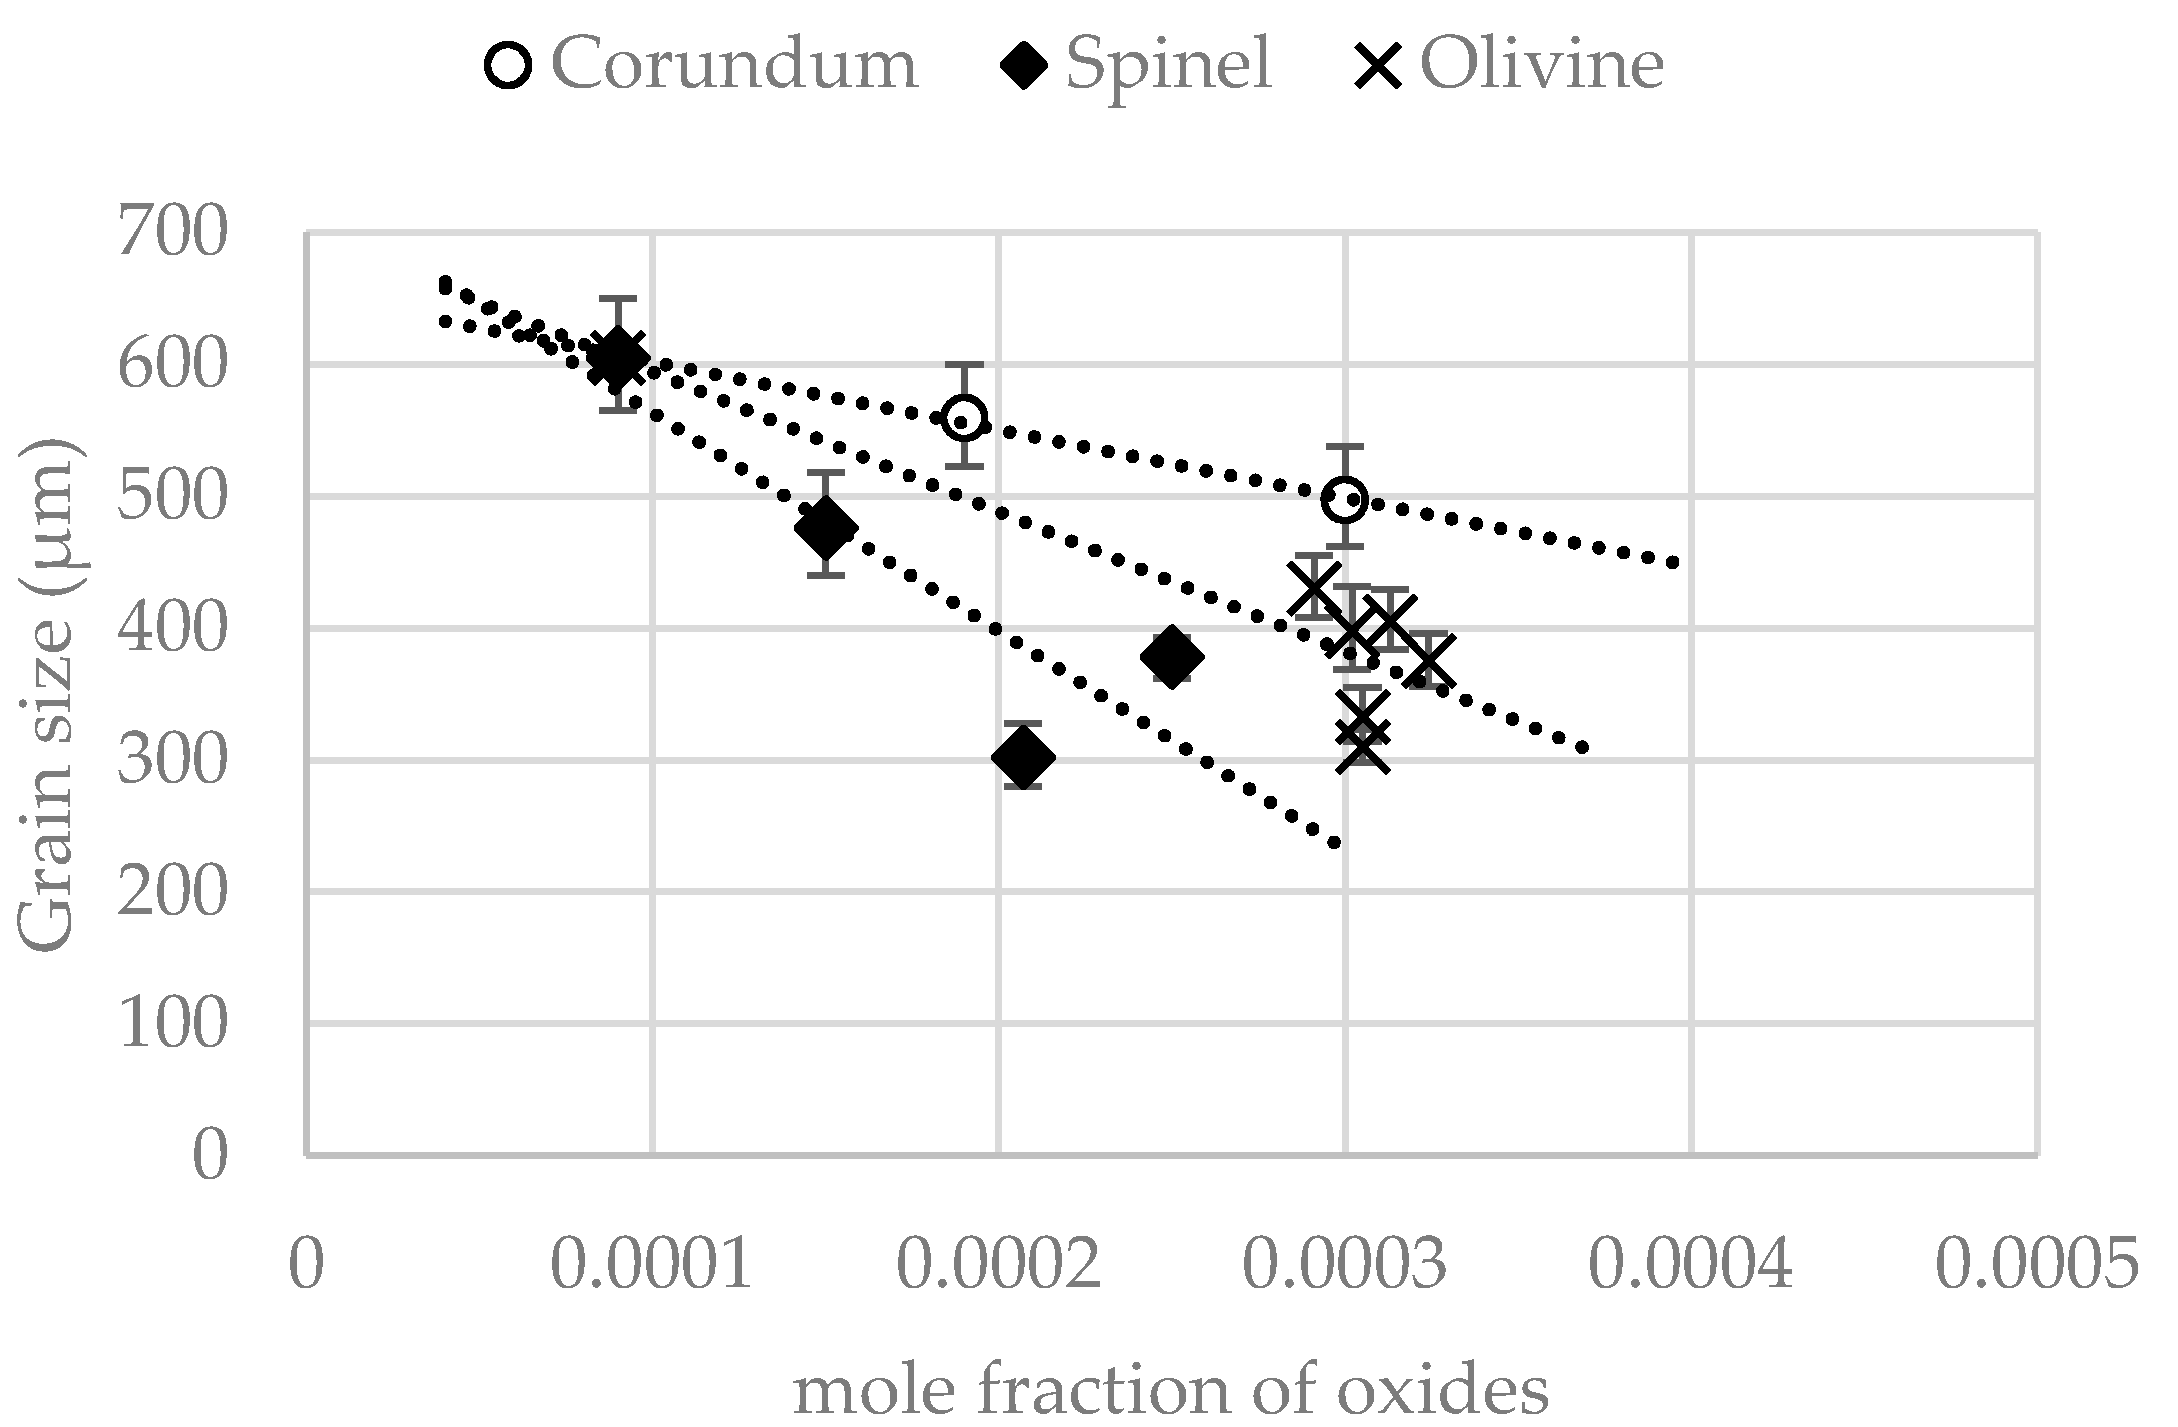
It was observed for all three types of oxides that an increasing mole fraction resulted in decreasing austenitic grain size. Sample S15 can be considered in this case as a reference sample with a total mole fraction of oxides of only 0.00009. Samples that contained mainly corundum oxides presented a gradual decrease in grain size from 605 μm in the reference sample to 497 μm in Sample S8 with a 0.0003 corundum mole fraction. Samples with olivine-based oxides presented an average grain size of 375 μm at 0.00027 mole fraction of olivine. Samples with mainly spinel-based oxides presented grain size as low as 305 μm with a total oxide mole fraction of only 0.000207 in Sample S17. The slope of the trendlines for each type of oxide reveals the effect of particle density on the austenitic grain size and the intercept shows the potency of each type of oxide.
Particle density is directly connected with the total amount of a precipitating phase in terms of volume fraction and area fraction if it is assumed that the phases precipitate as fine particles that are evenly dispersed in the volume of the matrix material. It was recently established [6,7] that Ti(CN), MnS, and TiNbC in Hadfield steel precipitate as fine particles of sizes between 1 and 2 μm, with good dispersion in the matrix material. Thus, increasing area fraction of a phase can relate to increased particle density. It was also shown that experimental values of the total surface fraction of these phases correlated well with the volume fraction and mole fraction of the same phases acquired by thermodynamic calculations using Thermo-Calc Software TCFE7 Steels/Fe-alloys database version 7. On the other hand, experimental methods such as scanning electron microscopy automated particle analysis (SEM/APA) and optical emission spectrometry with pulse discrimination analysis (OES/PDA) presented low reliability in accurately detecting oxide particles. In the case of SEM/APA, oxide particles either had sizes below the smallest detectable size by the microscope or were engulfed in other particles and thus not detected as a separate phase. Optical emission spectrometry with pulse discrimination analysis (OES/PDA) is a method optimized to detect oxide particles in low-alloyed steels but presented low accuracy for high-alloyed steels such as Hadfield steel. Considering the above, in this work, it is assumed that the correlation between experimental area fraction and calculated volume fraction/mole fraction for Ti(CN), MnS, and TiNbC is also extended to the oxide phases.
As already discussed, the disregistry between the austenite and the oxide and Ti(CN) phases can be a good metric of the potency of a particle to nucleate austenitic grains. Table 4 illustrates the disregistry between austenite and the different types of particles. The disregistry was calculated utilizing Equation (1) and the lattice parameters, listed in Table 4. Spinel presents the lowest disregistry value followed by olivine and finally corundum, which correlates well with the trend observed in Figure 4. According to Bramffit et al. [2], nucleant agents with disregistry lower than 12% are potent and nucleant agents with disregistry higher that 12% have poor potency. This places the oxide phases as potent and Ti(CN) as non-potent nucleant agents for austenite.
3.3. The Effect of Ti(CN) Particles
Figure 5 is a comparison between the average grain size of samples containing Ti(CN) with an average mole fraction of 0.0013 against samples containing only oxide-based particles with an average mole fraction of 0.0003. Samples with Ti(CN) particles presented a grain size two orders of magnitude higher than those with only oxide-based particles. This comes in good agreement with the planar disregistry prediction where Ti(CN) is placed as the least effective nucleant agent with a disregistry value over the 12% threshold. Though the negative effect of Ti(CN) is not solely due to its lower disregistry. Figure 6 illustrates the relationship between the grain size and the mole fraction of Ti(CN) under similar total mole fraction of oxides phases. A linear increase of the grain size from 562 μm to 790 μm with an increasing mole fraction of Ti(CN) from 0.00116 to 0.0165 was observed. Additionally, the grain size in Ti(CN) free samples with similar oxide content was smaller. It is known that Ti(CN) precipitates in the melt at a temperature of 1520 °C, which is above the liquidus and below the oxide precipitation temperature (above 1600 °C depending on the type of oxide) [6]. Ti(CN) also has the tendency to precipitate and grow on the oxide particles [5,6]. The precipitation of Ti(CN) on the oxides restrained any contact of the oxide particle’s surface with the steel melt. Thus, it reduced the number of available free oxide particles that could act as nuclei for austenitic grains when the melt would have reached the liquidus temperature during casting and solidification, resulting in an overall increase in the grain size of steel.
3.4. The Effect of Deoxidation Practice
Throughout this study, it was evident that the deoxidation practice with Al and Ti had a strongly negative effect on the microstructure of Hadfield steel. Ti tended to form Ti(CN) particles that nucleate on the oxide particles, reducing the nucleation potency of the oxide particles, resulting in a microstructure up to two orders of magnitude coarser than the untreated reference material. Increasing Al additions, on the other hand, modified the oxides to oxide types with lower potency such as corundum. However, deoxidation as a practice is vital for reducing the dissolved oxygen and nitrogen content in the melt and avoiding gas related defects in the final castings. Experimental data acquired during this work, such as the irradical yield of Al and Ti in the final castings, proves that there is little control and understanding over the deoxidation process at an industrial level. Variables such as the choice of melt surface protection in the form of slags, furnace lining, timing, practice, and amount of additions are crucial and in turn determine the type and amount of inclusion that precipitate in the melt and affect the microstructure in different ways. Acquiring the knowledge needed to better control the deoxidation process could lead to the improvement of industrial production practices and materials with significantly improved mechanical properties.
4. Conclusions
In this study, the effect of in situ precipitating particles on the as-cast grain size in Al-Ti deoxidized Hadfield steel was examined. The main conclusions are summarized as follows:
- Grain size increased as the mole fraction of oxides increased.
- Amongst the oxide particles, spinel particles presented the best potency to nucleate austenitic grains, followed by olivine and finally corundum particles.
- Ti(CN) particles were not effective as nucleation agents for austenitic grains.
- Under a similar mole fraction of oxides, an increasing mole fraction of Ti(CN) resulted in an increasing grain size. Ti(CN) precipitates on oxide particles in temperatures between the liquidus temperature of steel and the precipitation temperature of oxides; thus, the availability of free oxide particles for austenitic grains to nucleate on is decreased.
- Experimental results on the potency of particles are in good agreement with planar disregistry predictions.
Acknowledgments
The authors wish to acknowledge the Knowledge Foundation for financial support of the current work under the InDeGrainS project (Dnr 20130149). The authors also acknowledge the personal with Sandvik SRP, Ralf Lisell, and Vasileios Fourlakidis with Swerea Swecast AB for support with experimental facilities and preparation.
Author Contributions
Dimitrios Siafakas, Taishi Matsushita, Åsa Lauenstein, Johan Ekengård, and Anders E. W. Jarfors conceived and designed the experiments; Dimitrios Siafakas, Åsa Lauenstein, and Johan Ekengård performed the experiments; Dimitrios Siafakas analyzed the data; Åsa Lauenstein, Johan Ekengård, and Anders E. W. Jarfors contributed reagents/materials/analysis tools; Dimitrios Siafakas wrote the paper.
Conflicts of Interest
The founding sponsors had no role in the design of the study; in the collection, analyses, or interpretation of data; in the writing of the manuscript; or in the decision to publish the results.
References
- Borse, S.; Mangulkar, Y. Review on grey cast iron inoculation. Int. J. Innov. Res. Sci. Eng. Technol. 2014, 3, 30–36. [Google Scholar]
- Bramfitt, B.L. The effect of carbide and nitride additions on heterogeneous nucleation behavior of liquid iron. Metall. Trans. 1970, 1, 1987–1995. [Google Scholar] [CrossRef]
- StJohn, D.H.; Qian, M.; Easton, M.A.; Cao, P. The interdependence theory: The relationship between grain formation and nucleant selection. Acta Mater. 2011, 59, 4907–4921. [Google Scholar] [CrossRef]
- Haakonsen, F.; Solberg, J.K.; Klevan, O.S.; van der Eijk, C. Grain refinement of austenitic manganese steels. AISTech 2011 Proc. 2011, 2, 764–771. [Google Scholar]
- Lekakh, S.N.; Ge, J.; Richards, V.; O’Malley, R.; TerBush, J.R. Optimization of melt treatment for austenitic steel grain refinement. Metall. Mater. Trans. B 2017, 48, 406–419. [Google Scholar] [CrossRef]
- Siafakas, D.; Matsushita, T.; Lauenstein, Å. Particles precipitation in Ti- and Al-deoxidized hadfield steels. Steel Res. Int. 2016, 87, 1344–1355. [Google Scholar] [CrossRef]
- Siafakas, D.; Matsushita, T.; Lauenstein, Å.; Ekerot, S.; Jarfors, A.E.W. A particle population analysis in Ti- and Al-Deoxidized Hadfield steels. Int. J. Cast Met. Res. 2017. submitted. [Google Scholar]
- ASTM A128/A128M-93. Standard Specification for Steel Castings, Austenitic Manganese; ASTM International: West Conshohocken, PA, USA, 2017. [Google Scholar]
- SIS 112132. Blank for Cast Steel Test Piece; Swedish Standards Institute (S.I.S.): Stockholm, Sweden, 1968. [Google Scholar]
- ASTM E112-13. Standard Test Methods for Determining Average Grain Size; ASTM International: West Conshohocken, PA, USA, 2013. [Google Scholar]
- Turkdogan, E.T. Deoxidation of steel. J. Iron Steel Inst. 1972, 210, 21–36. [Google Scholar]
- Andersson, J.O.H.; Höglund, T.L.; Shi, P.F. Thermo-Calc and DICTRA, computational tools for materials science. Calphad 2002, 26, 273–312. [Google Scholar] [CrossRef]
- Schneider, J.M.; Voevodin, A.; Rebholz, C.; Matthews, A.; Hogg, J.H.C.; Lewis, D.B.; Ives, M. X-Ray diffraction investigations of magnetron sputtered TiCN coatings. Surf. Coat. Technol. 1995, 74, 312–319. [Google Scholar] [CrossRef]
- Takei, H. Czochralski growth of Mn2SiO4 (tephroite) single crystal and its properties. J. Cryst. Growth 1976, 34, 125–131. [Google Scholar] [CrossRef]
- Spinel. Available online: https://www.mindat.org/min-3729.html (accessed on 3 April 2017).
- Corundum. Available online: https://www.mindat.org/min-1136.html (accessed on 3 April 2017).
Figure 1.
Grain size against the inverse of the growth restriction factor (GRF) (S1–S17).

Figure 2.
Typical grain structure for (a) Group A samples (S11, S13, S14), (b) Group B samples (S8, S9, S10, S12, S15, S16), and (c) Group C samples (S1–S7, S17).
Figure 2.
Typical grain structure for (a) Group A samples (S11, S13, S14), (b) Group B samples (S8, S9, S10, S12, S15, S16), and (c) Group C samples (S1–S7, S17).

Figure 3.
SEM images, EDS spectra, and compositions of (a) spinel, (b) olivine, (c) corundum, and (d) Ti(CN) particles.
Figure 3.
SEM images, EDS spectra, and compositions of (a) spinel, (b) olivine, (c) corundum, and (d) Ti(CN) particles.
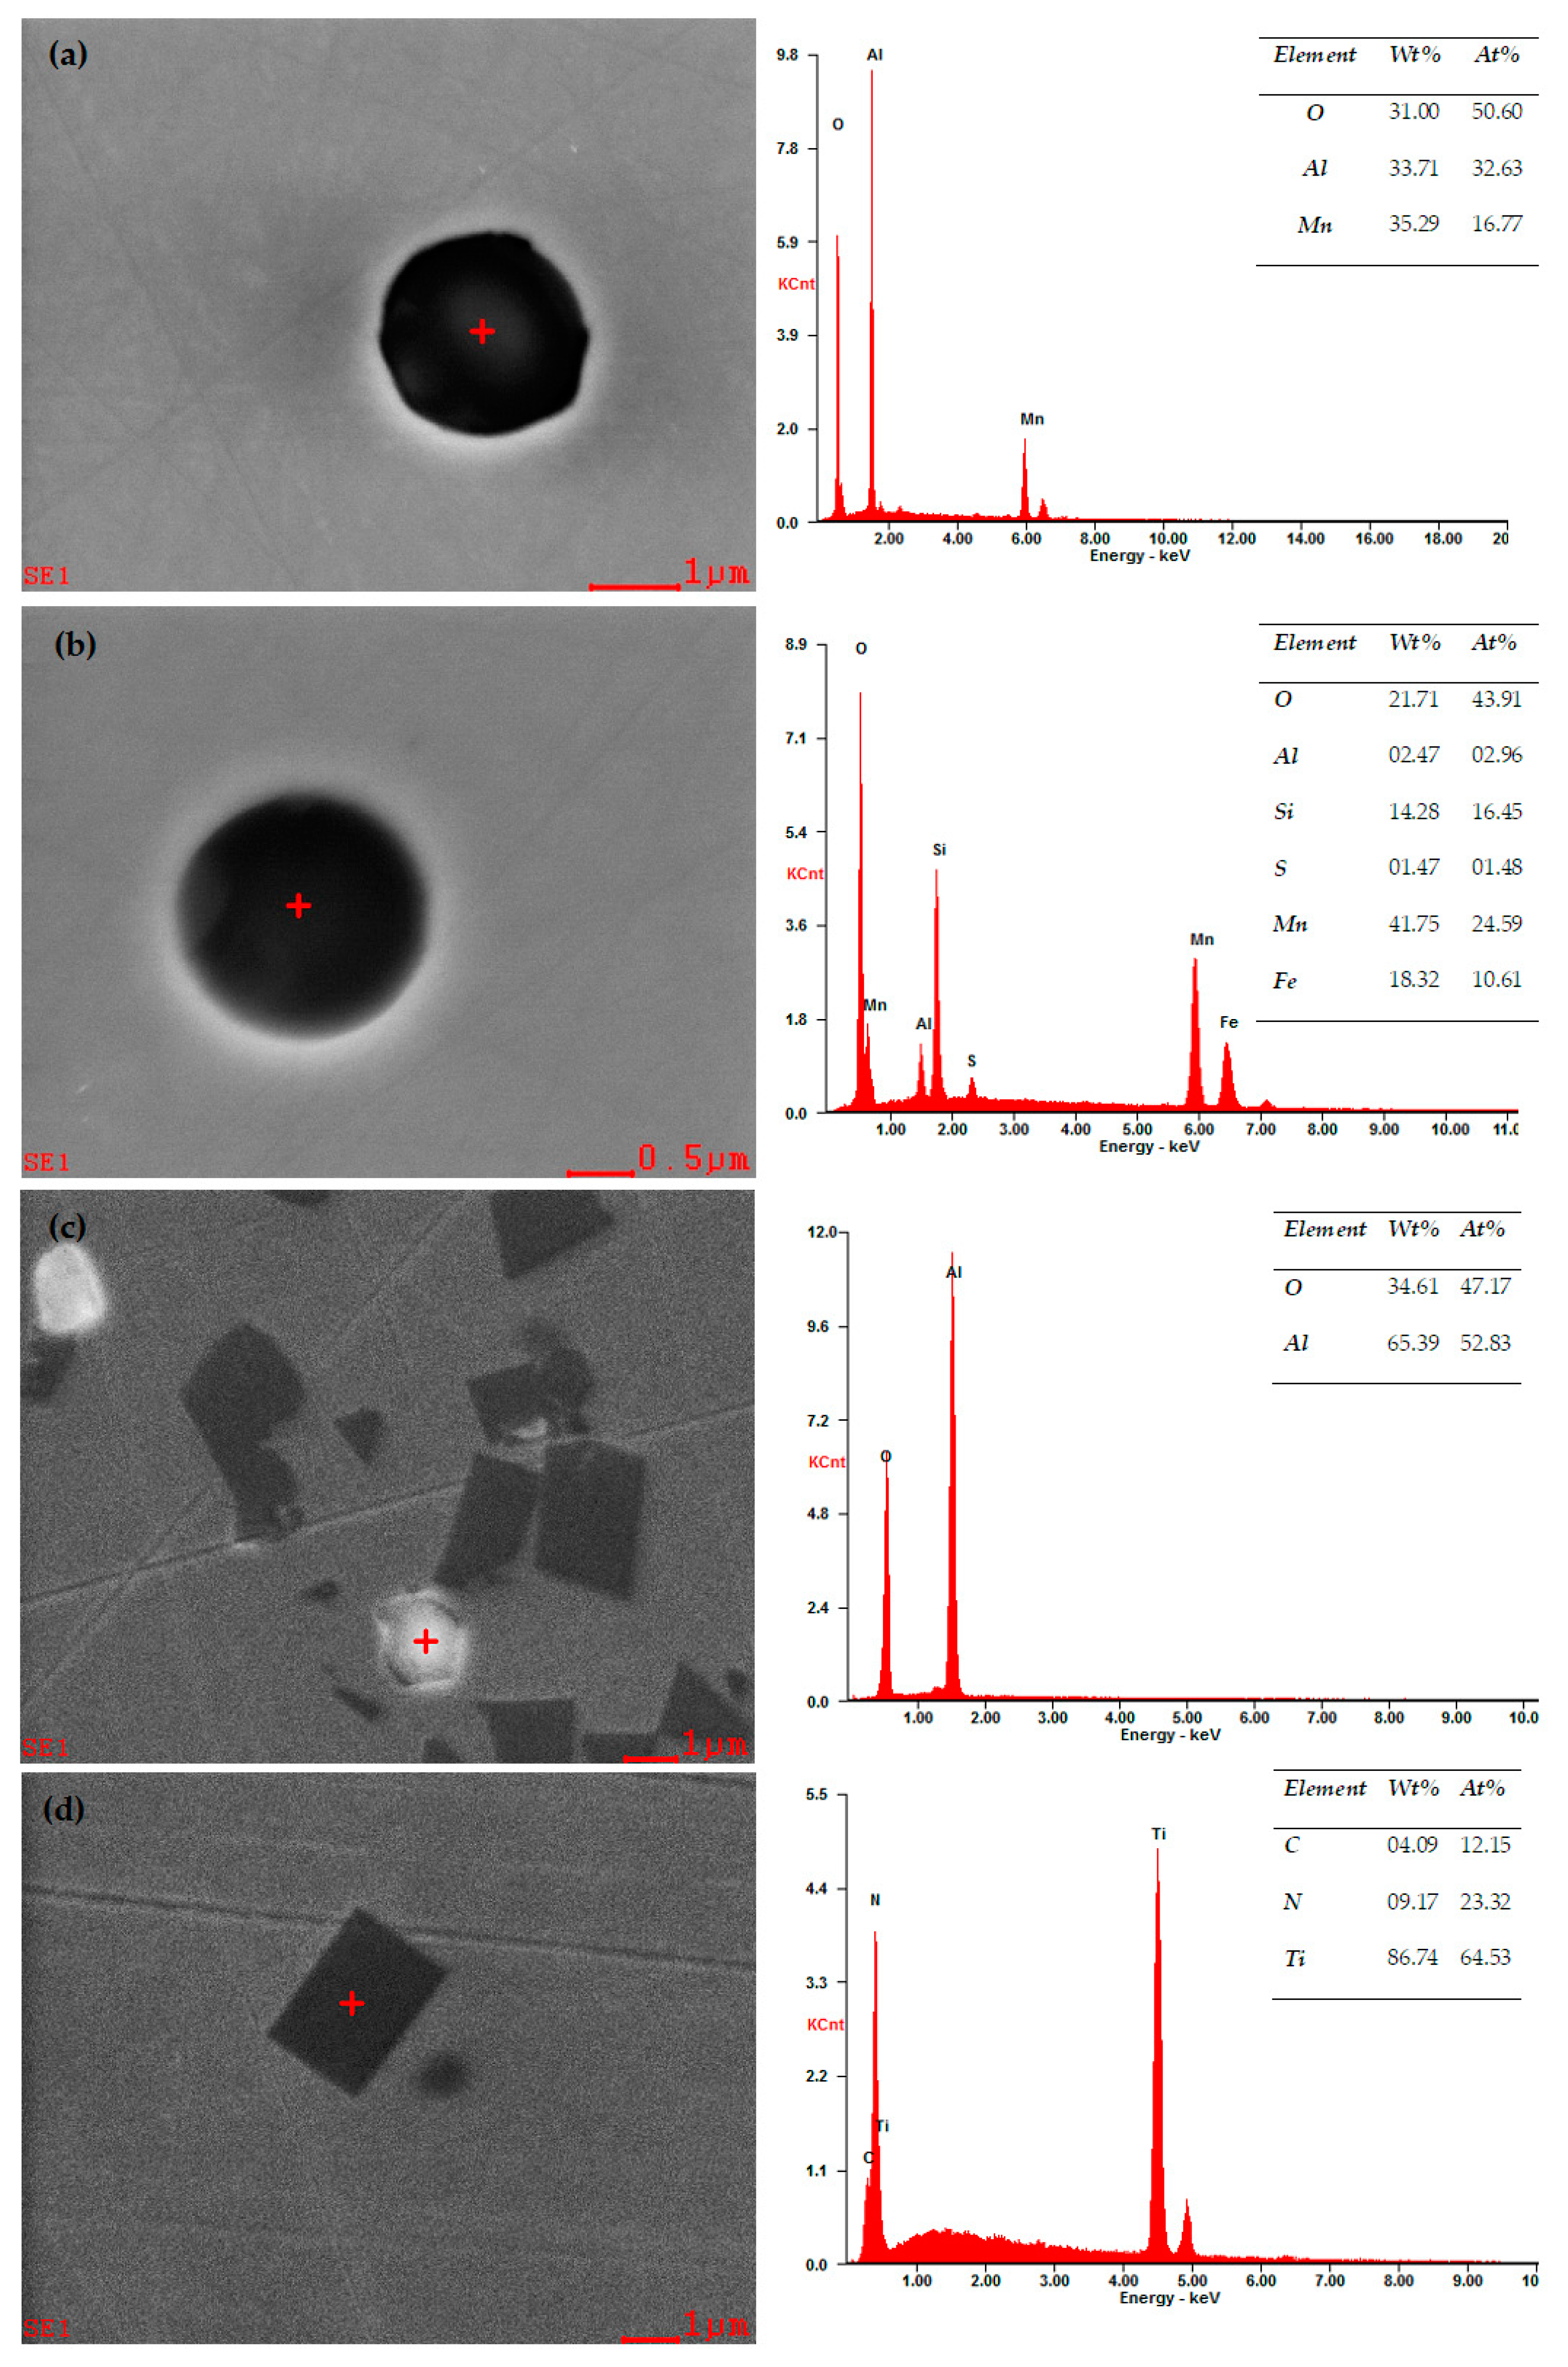
Figure 4.
Grain size against corundum (S8, S9), spinel (S1, S15, S16, S17), and olivine (S2–S7) mole fraction.
Figure 4.
Grain size against corundum (S8, S9), spinel (S1, S15, S16, S17), and olivine (S2–S7) mole fraction.

Figure 5.
Comparison of average grain size of samples (S10–S15) with Ti(CN) particles against samples (S1–S7, S17) with oxide particles.
Figure 5.
Comparison of average grain size of samples (S10–S15) with Ti(CN) particles against samples (S1–S7, S17) with oxide particles.
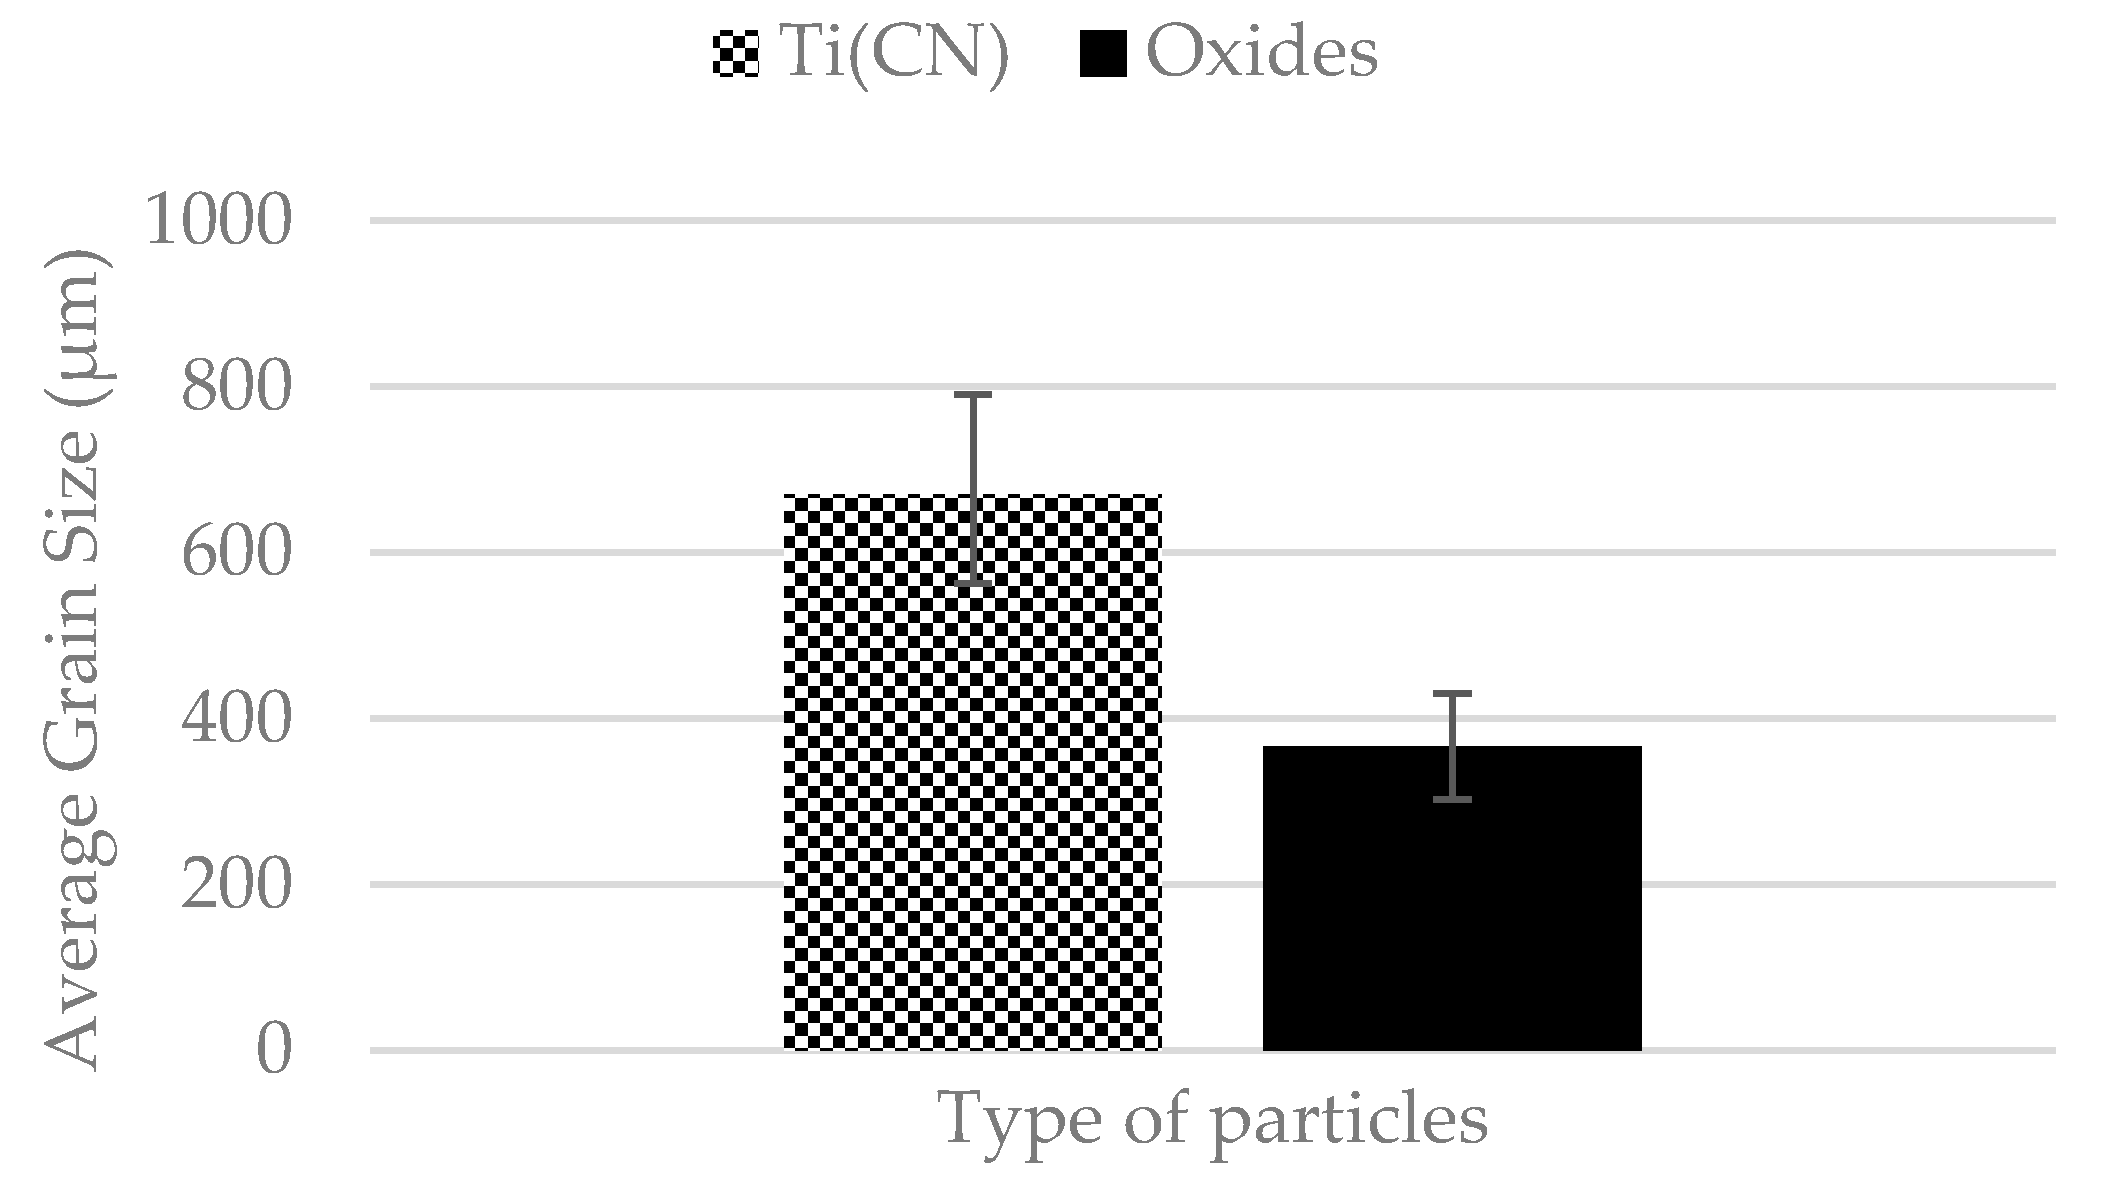
Figure 6.
Grain size against Ti(CN) mole fraction for samples (S10–S13) with similar oxide mole fraction.
Figure 6.
Grain size against Ti(CN) mole fraction for samples (S10–S13) with similar oxide mole fraction.


Table 1.
A128/A128M-93 (2012) chemical requirements.
| C wt % | Mn wt % | Si wt % | P wt % |
|---|---|---|---|
| 1.05–1.35 | 11.0 min | 1.0 max | 0.07 max |
Table 2.
Composition of samples as measured with OES.
| Composition (wt %) | C | Si | Mn | Cr | S | Al | Ti | N | O | P |
|---|---|---|---|---|---|---|---|---|---|---|
| Untreated reference material | ||||||||||
| S1 | 1.24 | 0.4 | 12 | 1.45 | 0.0006 | 0.005 | 0.01 | 0.075 | 0.0059 | 0.06 |
| S2 | 1.21 | 0.16 | 11.78 | 1.52 | 0.0006 | 0.0006 | 0.01 | 0.012 | 0.0067 | 0.04 |
| S3 | 1.21 | 0.26 | 11.78 | 1.52 | 0.0006 | 0.0006 | 0.01 | 0.012 | 0.0067 | 0.04 |
| S4 | 1.21 | 0.46 | 11.78 | 1.52 | 0.0006 | 0.0006 | 0.01 | 0.012 | 0.0067 | 0.04 |
| S5 | 1.21 | 0.66 | 11.78 | 1.52 | 0.0006 | 0.0006 | 0.01 | 0.012 | 0.0067 | 0.04 |
| S6 | 1.21 | 0.86 | 11.78 | 1.52 | 0.0006 | 0.0006 | 0.01 | 0.012 | 0.0067 | 0.04 |
| S7 | 1.21 | 1.46 | 11.78 | 1.52 | 0.0006 | 0.0006 | 0.01 | 0.012 | 0.0067 | 0.04 |
| Deoxidation by addition of 0.1 wt % Al | ||||||||||
| S8 | 1.28 | 0.45 | 13.4 | 1.15 | 0.0006 | 0.011 | 0.03 | 0.035 | 0.0056 | 0.06 |
| S9 | 1.24 | 0.54 | 12.73 | 1.29 | 0.002 | 0.013 | 0.023 | 0.03 | 0.0037 | 0.055 |
| Deoxidation by addition of 0.15 wt % Ti | ||||||||||
| S10 | 1.22 | 0.56 | 11.49 | 1.44 | 0.0006 | 0.0009 | 0.095 | 0.025 | 0.0058 | 0.039 |
| S11 | 1.06 | 0.65 | 11.33 | 1.53 | 0.002 | 0.001 | 0.12 | 0.024 | 0.0060 | 0.039 |
| Deoxidation by addition of 0.1 wt % Al and 0.15 wt % Ti | ||||||||||
| S12 | 1.26 | 0.4 | 12 | 1.45 | 0.0006 | 0.005 | 0.06 | 0.1 | 0.0058 | 0.058 |
| S13 | 1.28 | 0.49 | 12.68 | 1.33 | 0.0006 | 0.012 | 0.1 | 0.034 | 0.0046 | 0.06 |
| S14 | 1.23 | 0.47 | 14.25 | 1.36 | 0.0006 | 0.001 | 0.056 | 0.054 | 0.0035 | 0.059 |
| S15 | 1.25 | 0.5 | 12.47 | 1.37 | 0.0006 | 0.002 | 0.036 | 0.082 | 0.0030 | 0.056 |
| Deoxidation by addition of 0.1 wt % Al and 0.15 wt % Ti (45 min holding in furnace after casting) | ||||||||||
| S16 | 1.25 | 0.55 | 13.82 | 1.37 | 0.002 | 0.003 | 0.11 | 0.027 | 0.0028 | 0.063 |
| S17 | 1.08 | 0.59 | 12.65 | 1.43 | 0.0006 | 0.002 | 0.097 | 0.06 | 0.0043 | 0.056 |
Table 3.
Grain Size, 1/Q, Ti(CN) and oxides mole fraction for Samples S1–S17.
| Sample ID | GS (μm) | 1/Q | Ti(CN) Mole Fraction | Olivine Mole Fraction | Spinel Mole Fraction | Corundum Mole Fraction | Total Oxide Mole Fraction |
|---|---|---|---|---|---|---|---|
| Untreated reference material | |||||||
| S1 | 378 | 0.01121 | 0.0002 | 0 | 0.00025 | 0 | 0.000250 |
| S2 | 375 | 0.01174 | 0 | 0.00024 | 0.00003 | 0.000054 | 0.000324 |
| S3 | 310 | 0.01162 | 0 | 0.00027 | 0.000035 | 0 | 0.000305 |
| S4 | 333 | 0.01140 | 0 | 0.00027 | 0.000035 | 0 | 0.000305 |
| S5 | 405 | 0.01118 | 0 | 0.00028 | 0.000033 | 0 | 0.000313 |
| S6 | 398 | 0.01000 | 0 | 0.00027 | 0.000032 | 0 | 0.000302 |
| S7 | 430 | 0.01039 | 0 | 0.00026 | 0.000031 | 0 | 0.000291 |
| Deoxidation by 0.1 wt % Al | |||||||
| S8 | 497 | 0.01070 | 0.00038 | 0 | 0 | 0.0003 | 0.000300 |
| S9 | 559 | 0.01100 | 0.00019 | 0 | 0 | 0.00019 | 0.000190 |
| Deoxidation by 0.15 wt % Ti | |||||||
| S10 | 562 | 0.01126 | 0.00116 | 0 | 0 | 0.00029 | 0.000290 |
| S11 | 692 | 0.01246 | 0.00136 | 0 | 0 | 0.00032 | 0.000320 |
| Deoxidation by 0.1 wt % Al and 0.15 wt % Ti | |||||||
| S12 | 575 | 0.01107 | 0.00128 | 0 | 0.00011 | 0.00011 | 0.000220 |
| S13 | 790 | 0.01075 | 0.00165 | 0 | 0 | 0.00025 | 0.000250 |
| S14 | 732 | 0.01088 | 0.00103 | 0.00011 | 0.000065 | 0 | 0.000175 |
| S15 | 605 | 0.01097 | 0.00060 | 0 | 0.000090 | 0 | 0.000090 |
| Deoxidation by 0.1 wt % Al and 0.15 wt % Ti (45 min holding in furnace after casting) | |||||||
| S16 | 476 | 0.01073 | 0.00160 | 0 | 0.00015 | 0 | 0.000150 |
| S17 | 302 | 0.01213 | 0.00188 | 0.000077 | 0.00013 | 0 | 0.000207 |
© 2017 by the authors. Licensee MDPI, Basel, Switzerland. This article is an open access article distributed under the terms and conditions of the Creative Commons Attribution (CC BY) license (http://creativecommons.org/licenses/by/4.0/).
Share and Cite
MDPI and ACS Style
Siafakas, D.; Matsushita, T.; Lauenstein, Å.; Ekengård, J.; Jarfors, A.E.W. The Influence of Deoxidation Practice on the As-Cast Grain Size of Austenitic Manganese Steels. Metals 2017, 7, 186. https://doi.org/10.3390/met7060186
AMA Style
Siafakas D, Matsushita T, Lauenstein Å, Ekengård J, Jarfors AEW. The Influence of Deoxidation Practice on the As-Cast Grain Size of Austenitic Manganese Steels. Metals. 2017; 7(6):186. https://doi.org/10.3390/met7060186
Chicago/Turabian StyleSiafakas, Dimitrios, Taishi Matsushita, Åsa Lauenstein, Johan Ekengård, and Anders E. W. Jarfors. 2017. "The Influence of Deoxidation Practice on the As-Cast Grain Size of Austenitic Manganese Steels" Metals 7, no. 6: 186. https://doi.org/10.3390/met7060186
Note that from the first issue of 2016, this journal uses article numbers instead of page numbers. See further details here.