
Phase Selection during Solidification of Ni-10.95 at. % and B-3.23 at. % Si Alloy

 , and
, and
Abstract
:1. Introduction
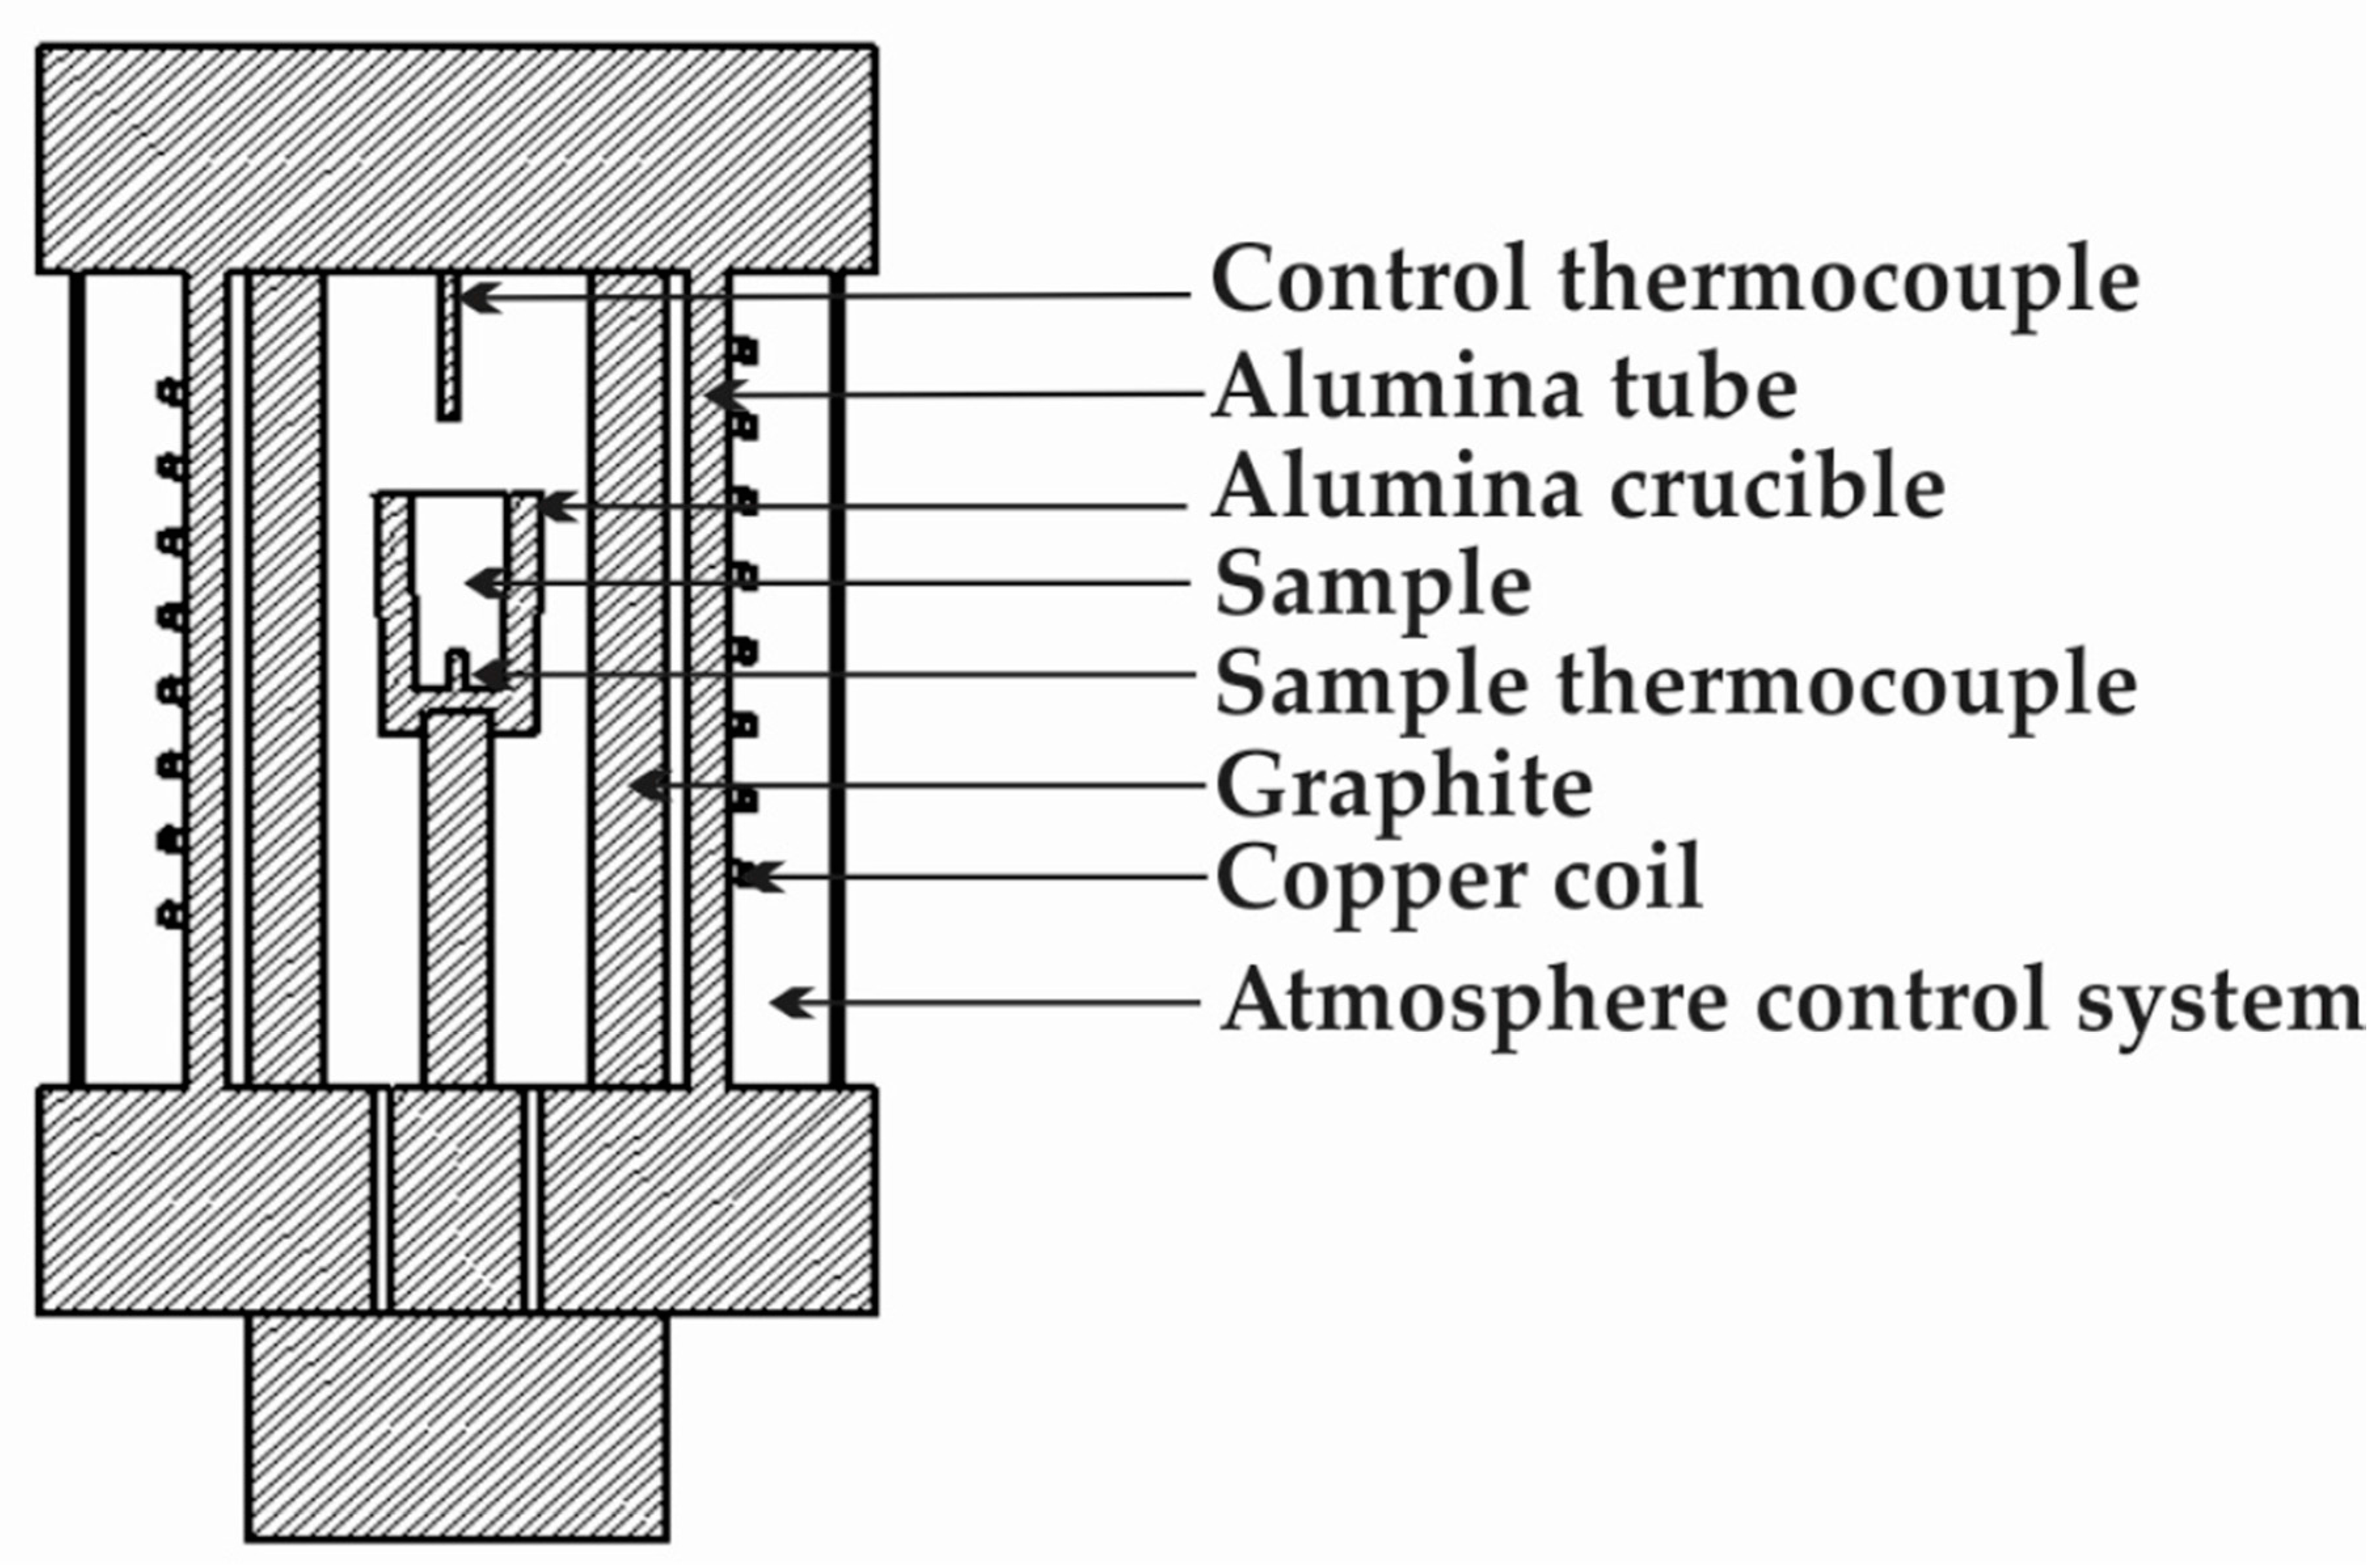
2. Materials and Methods
3. Results and Discussion
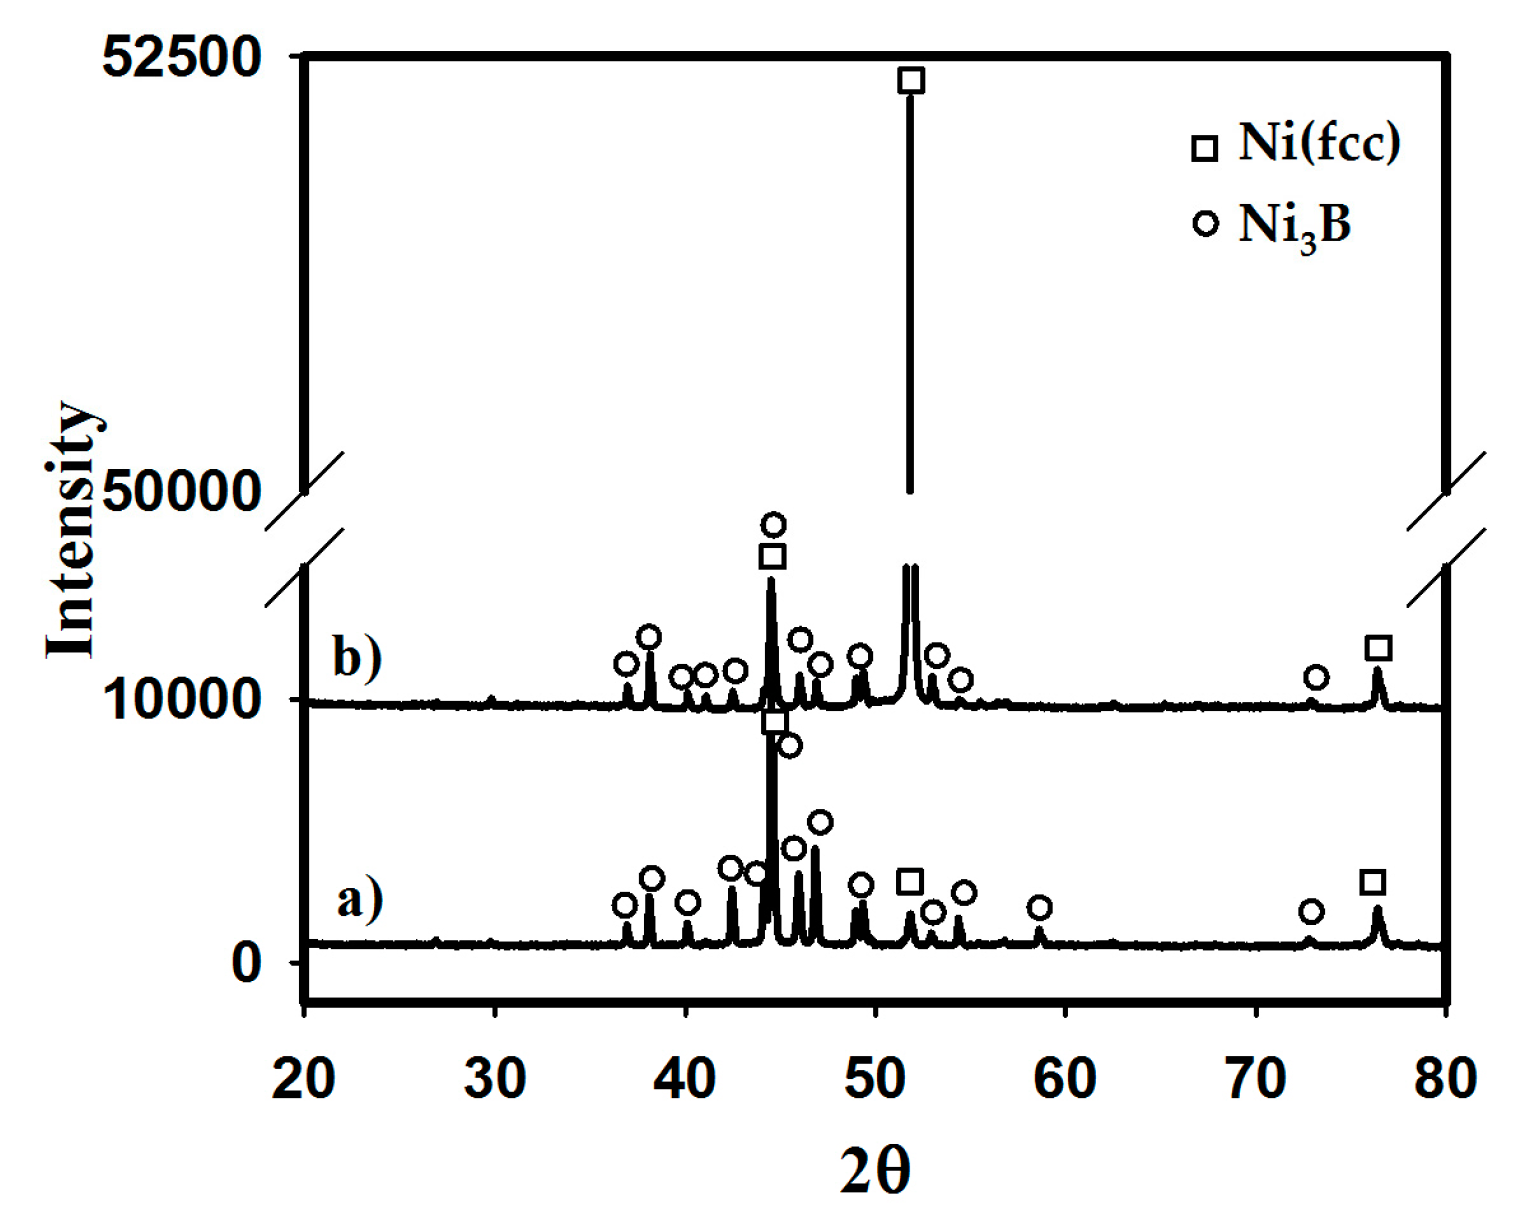
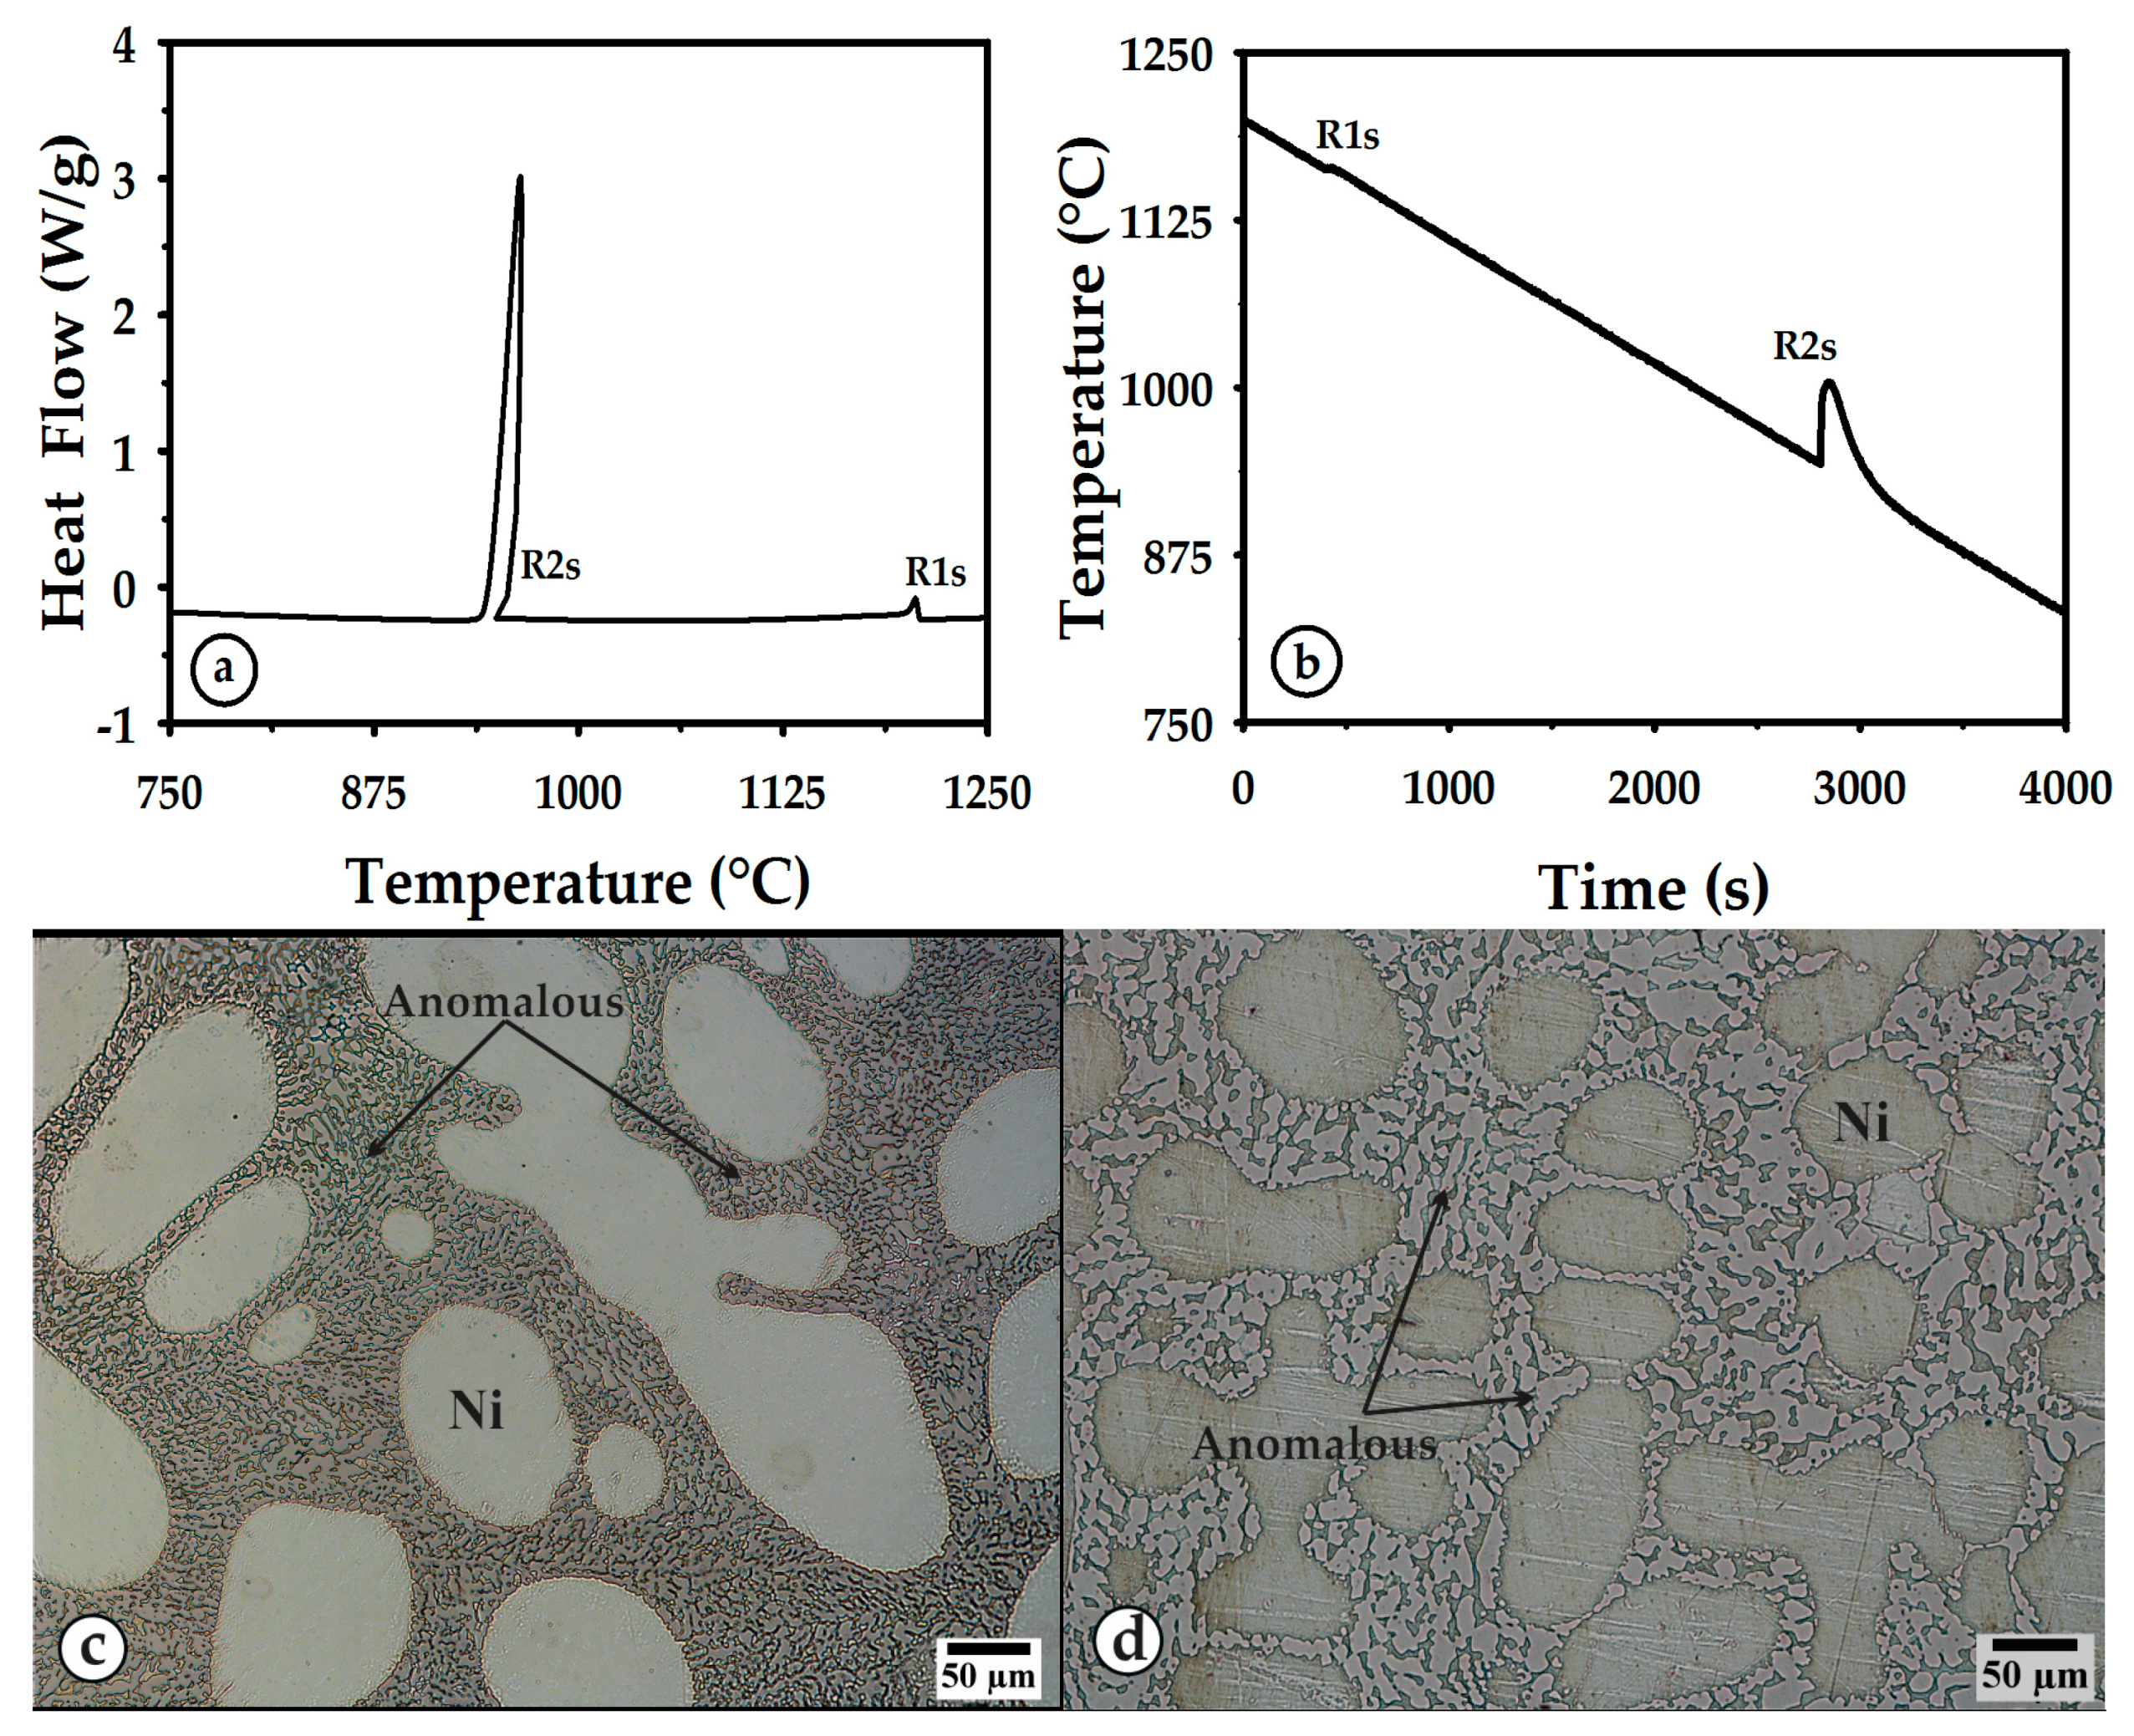
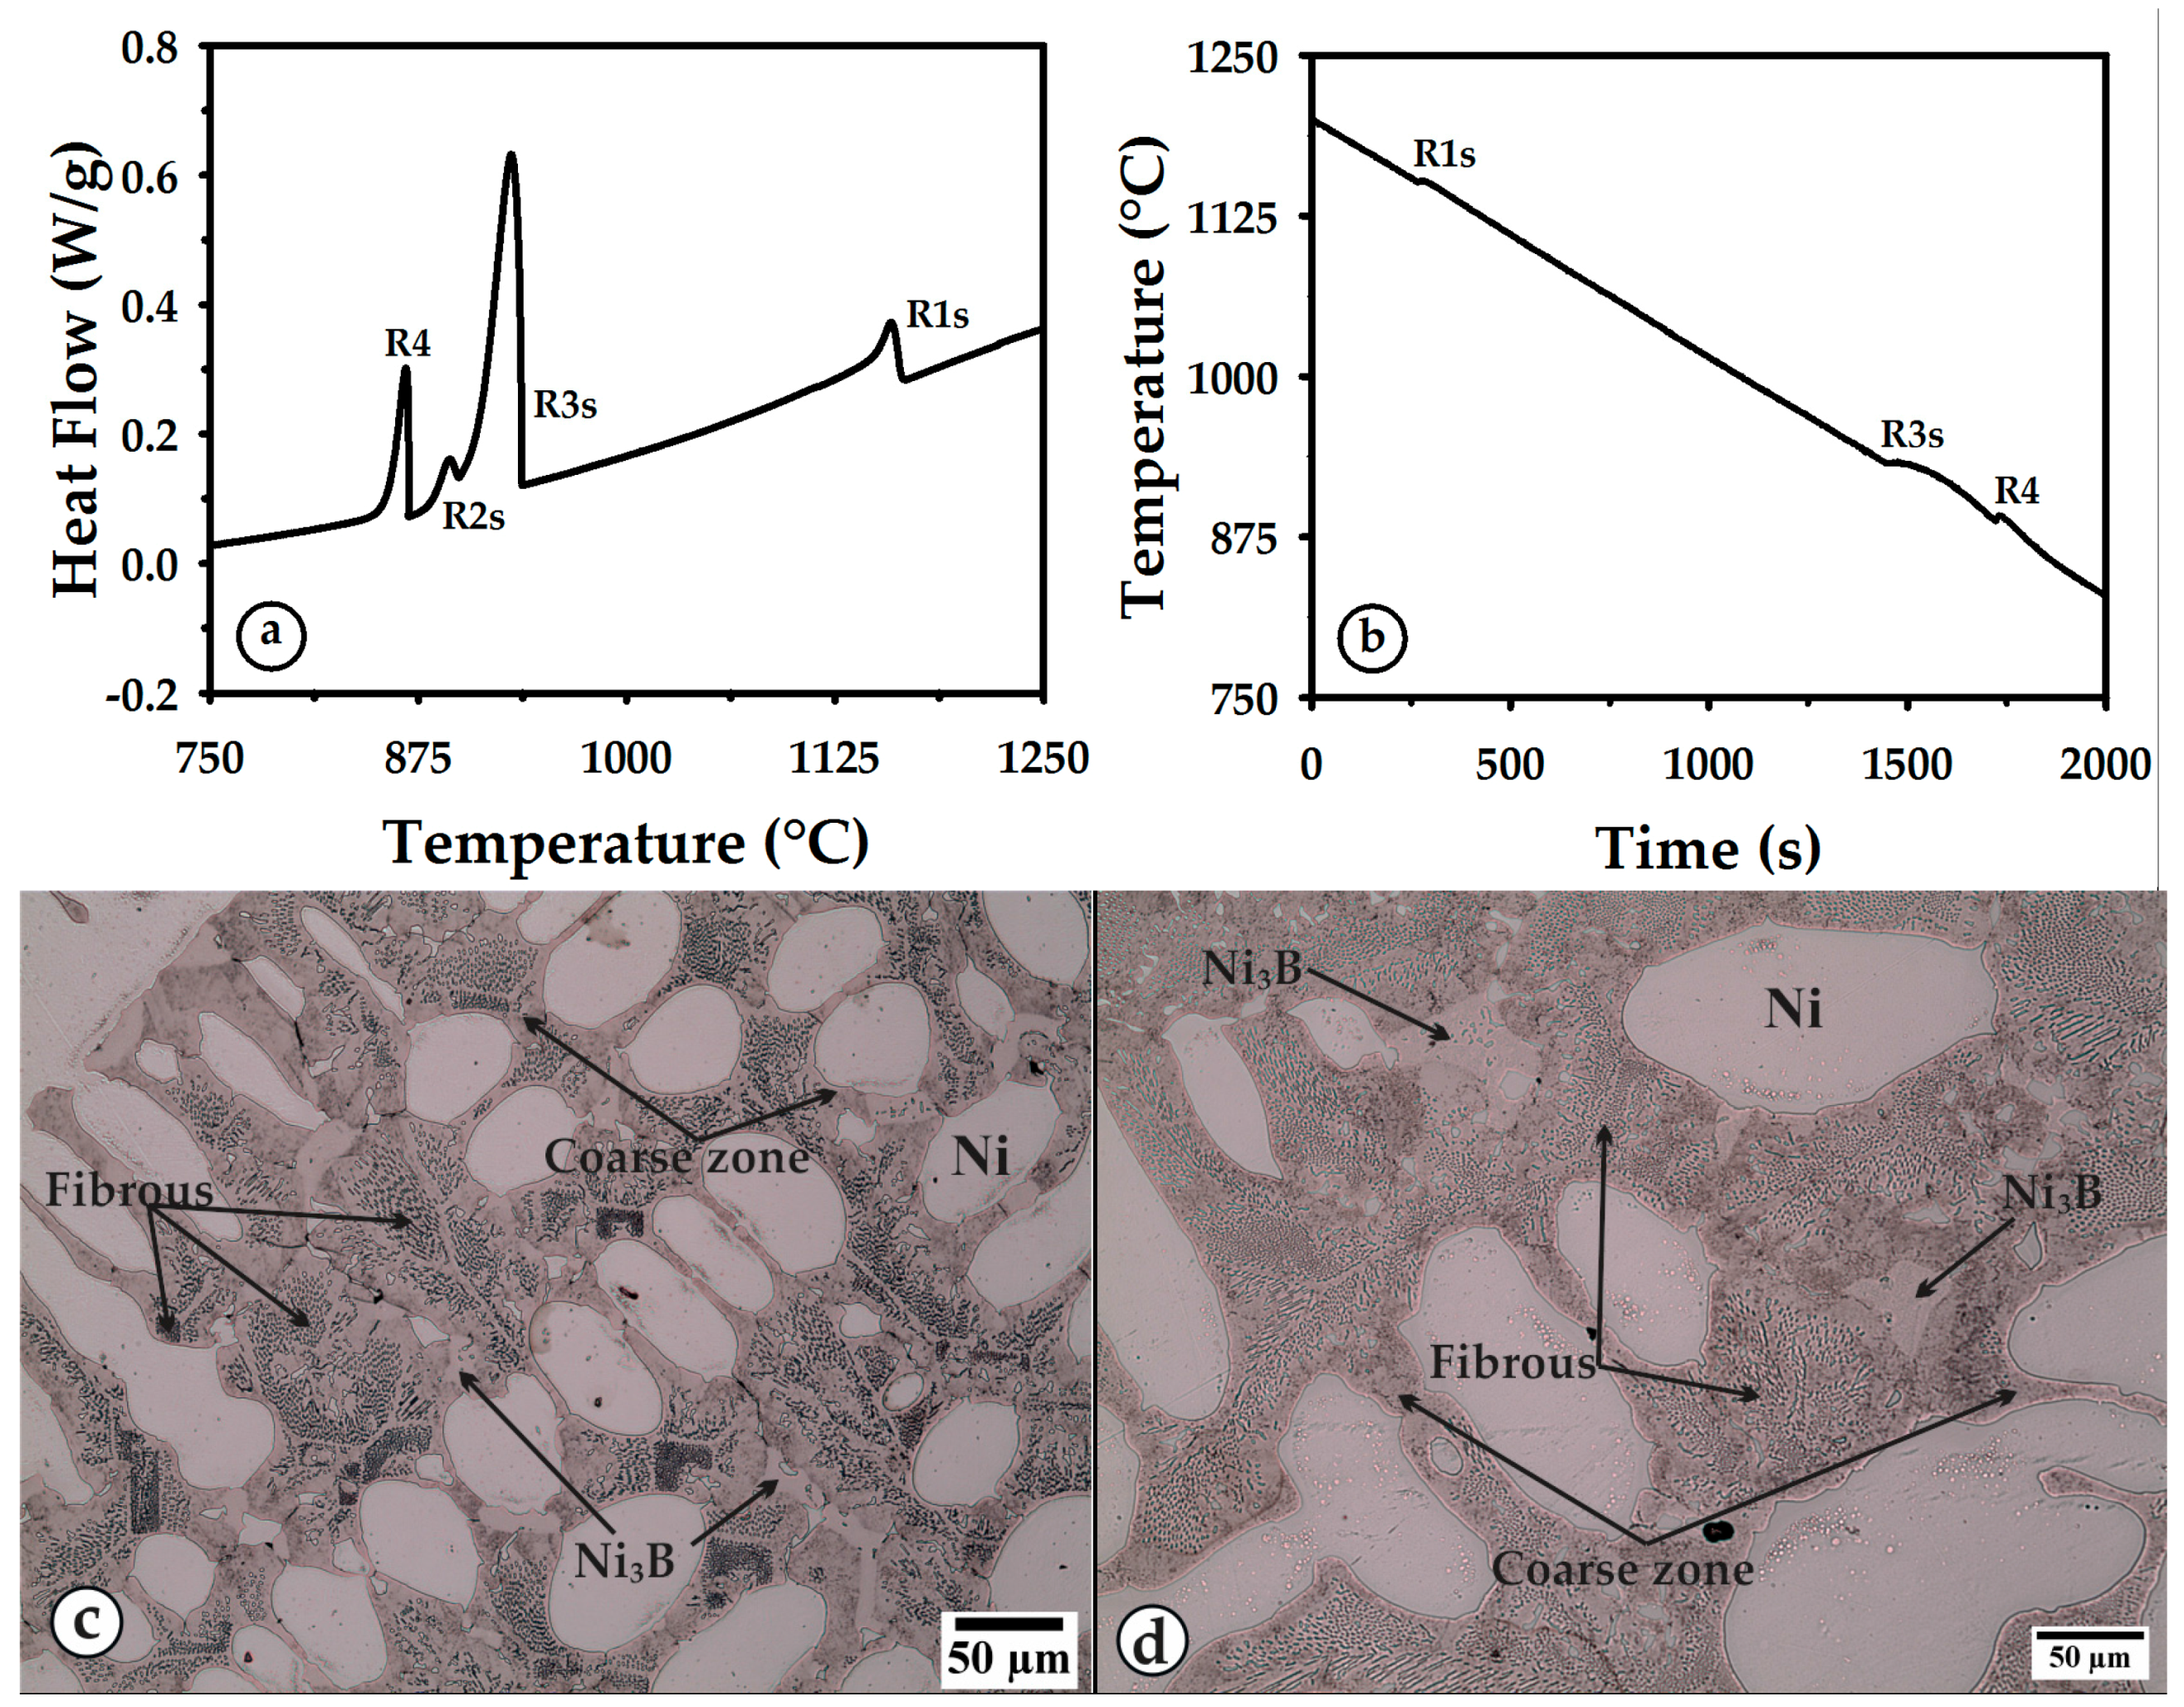
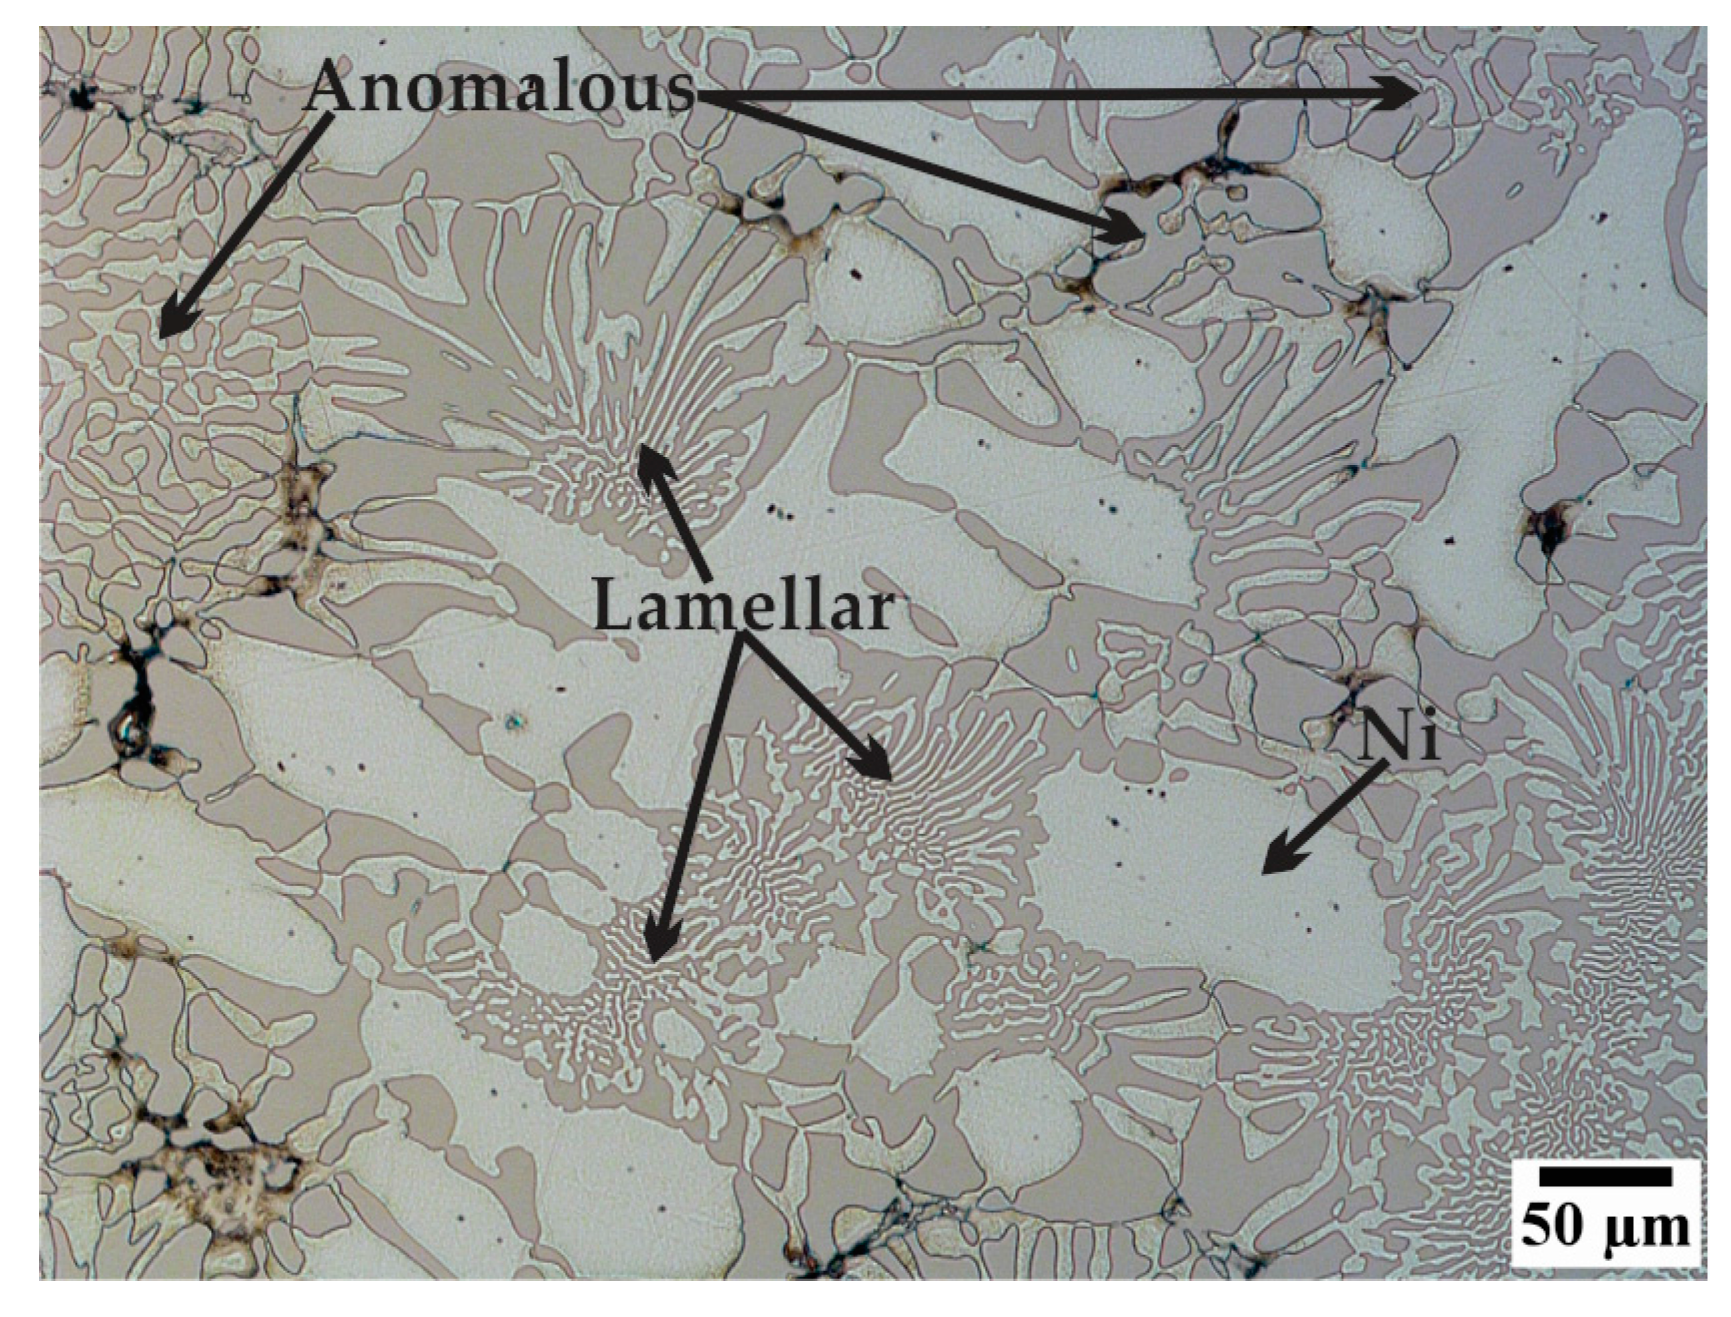
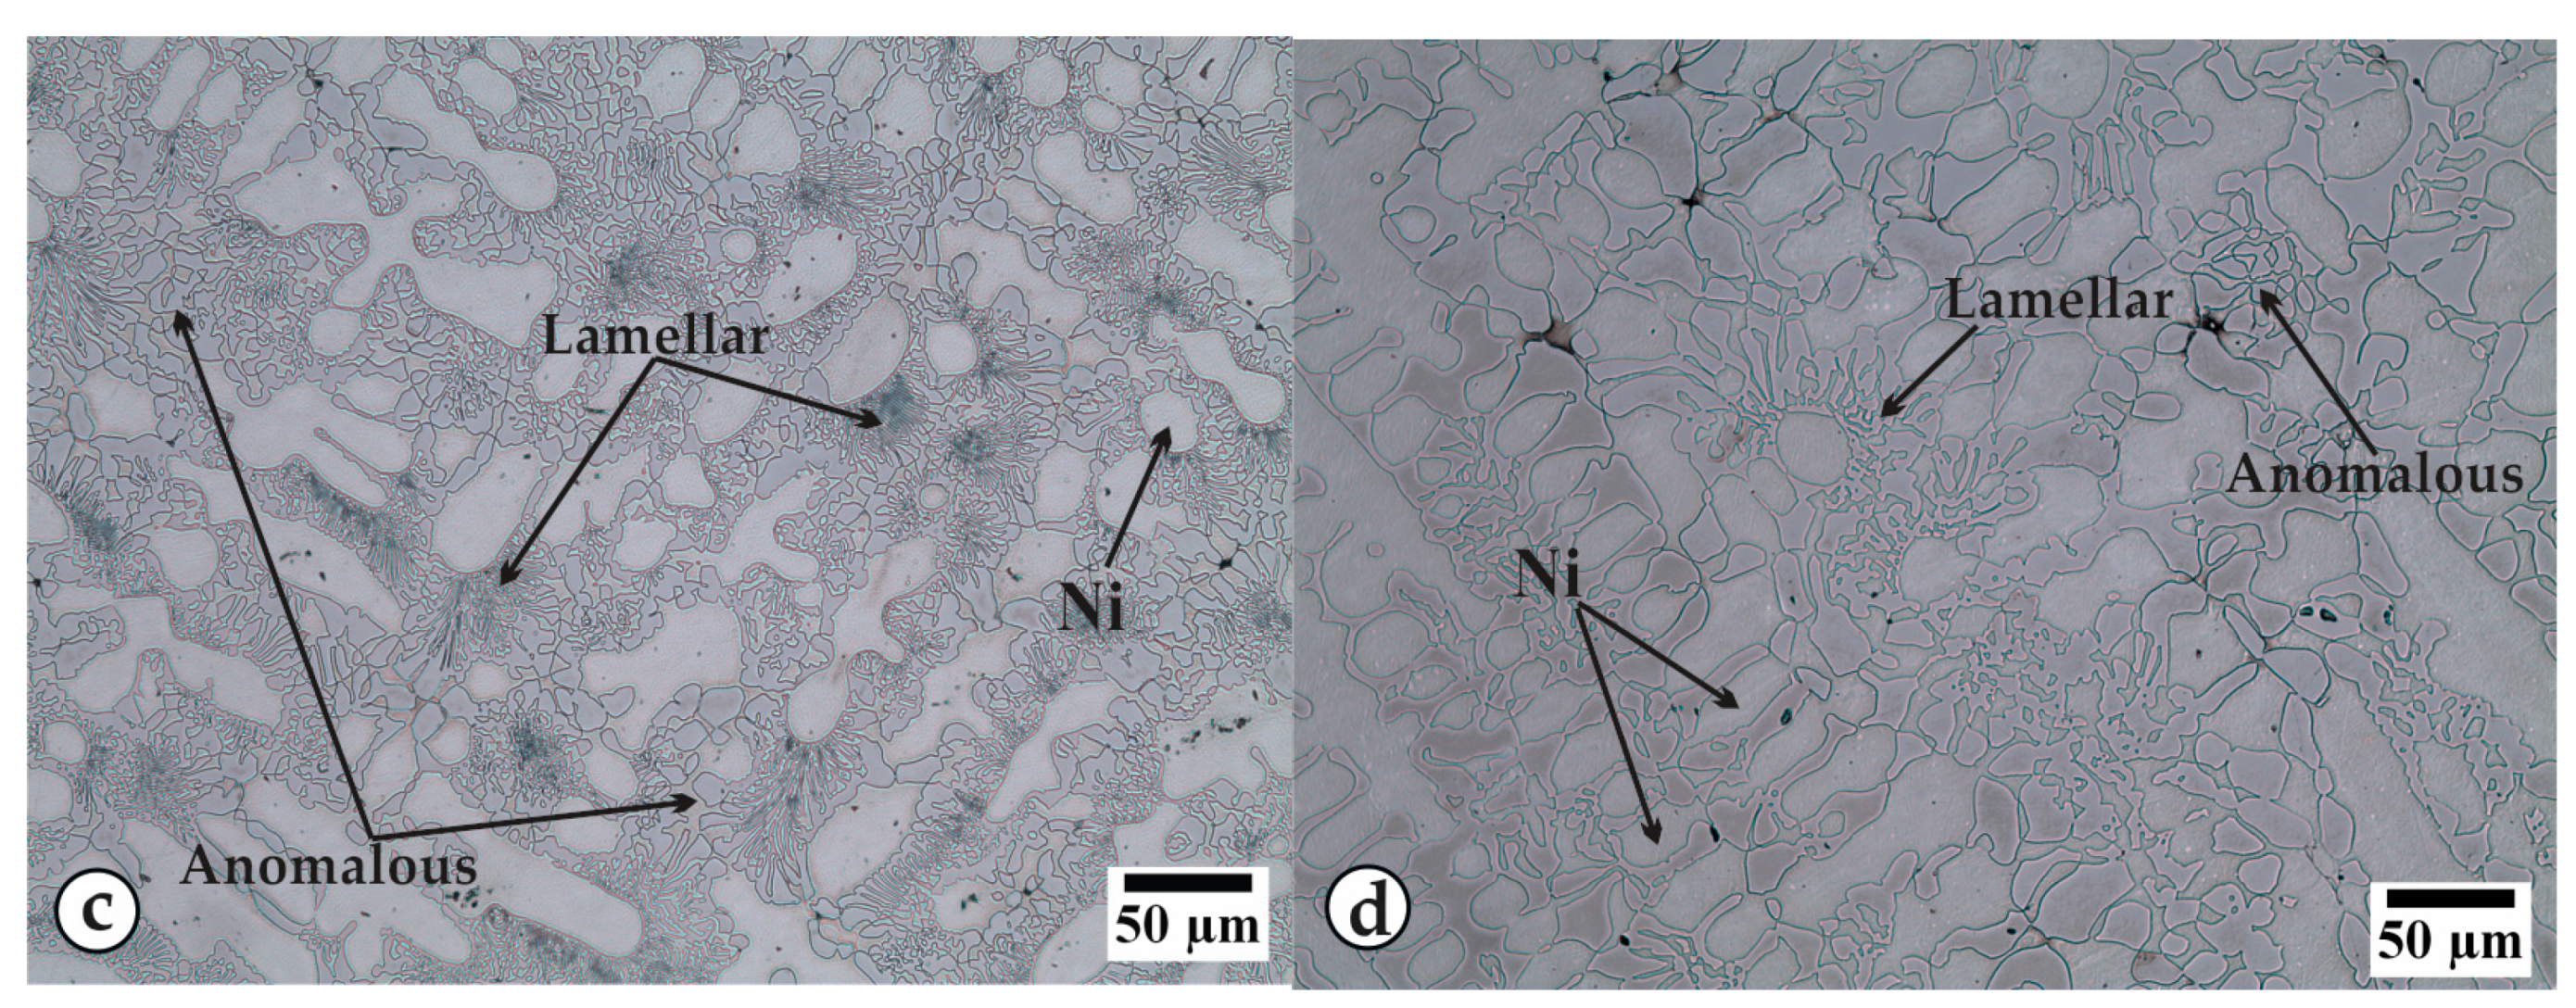
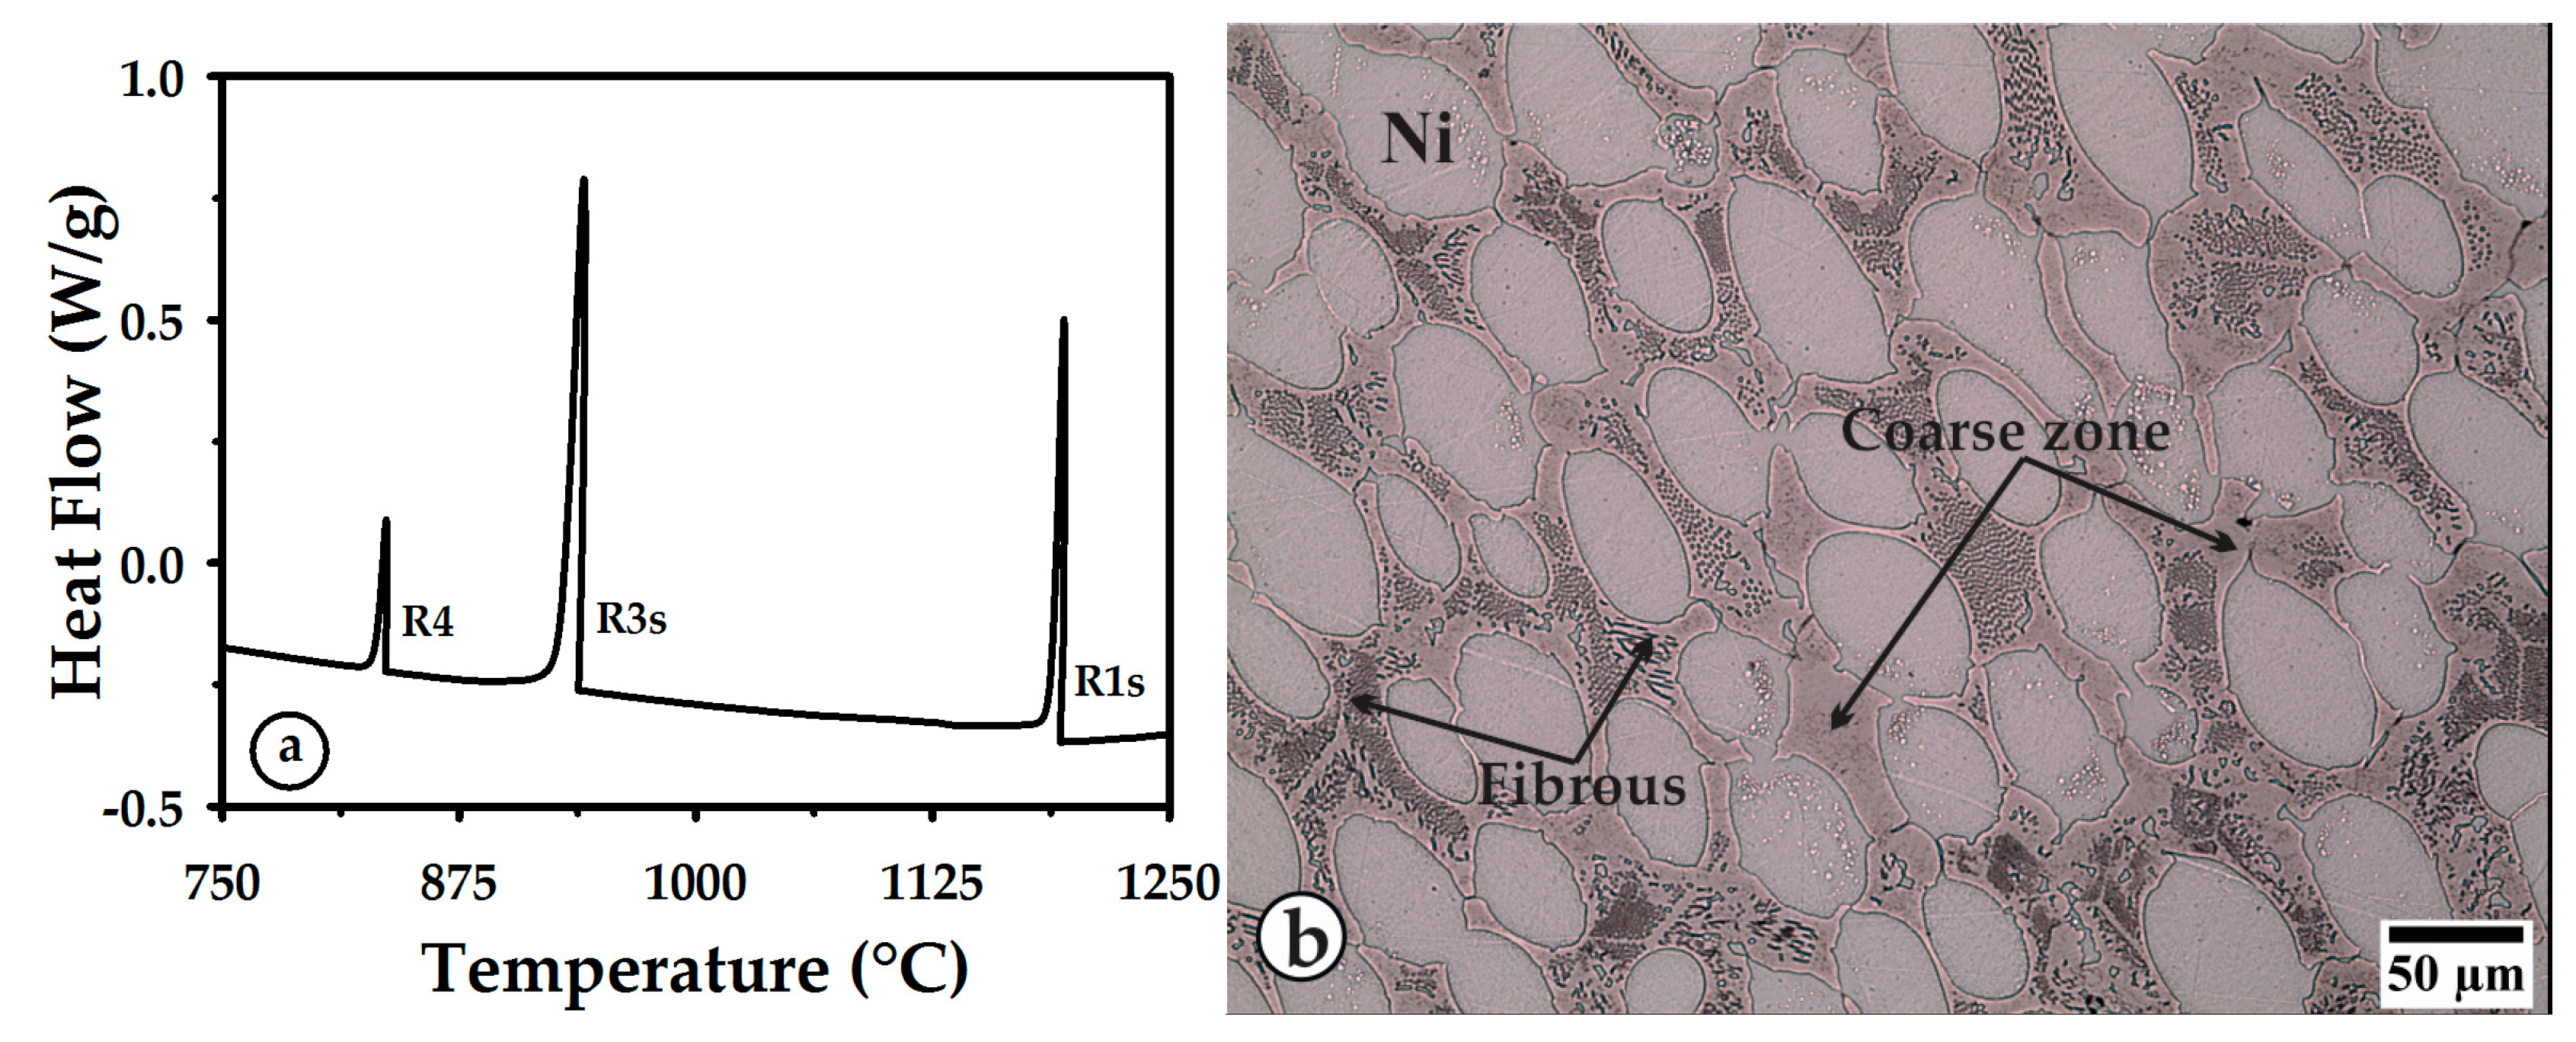
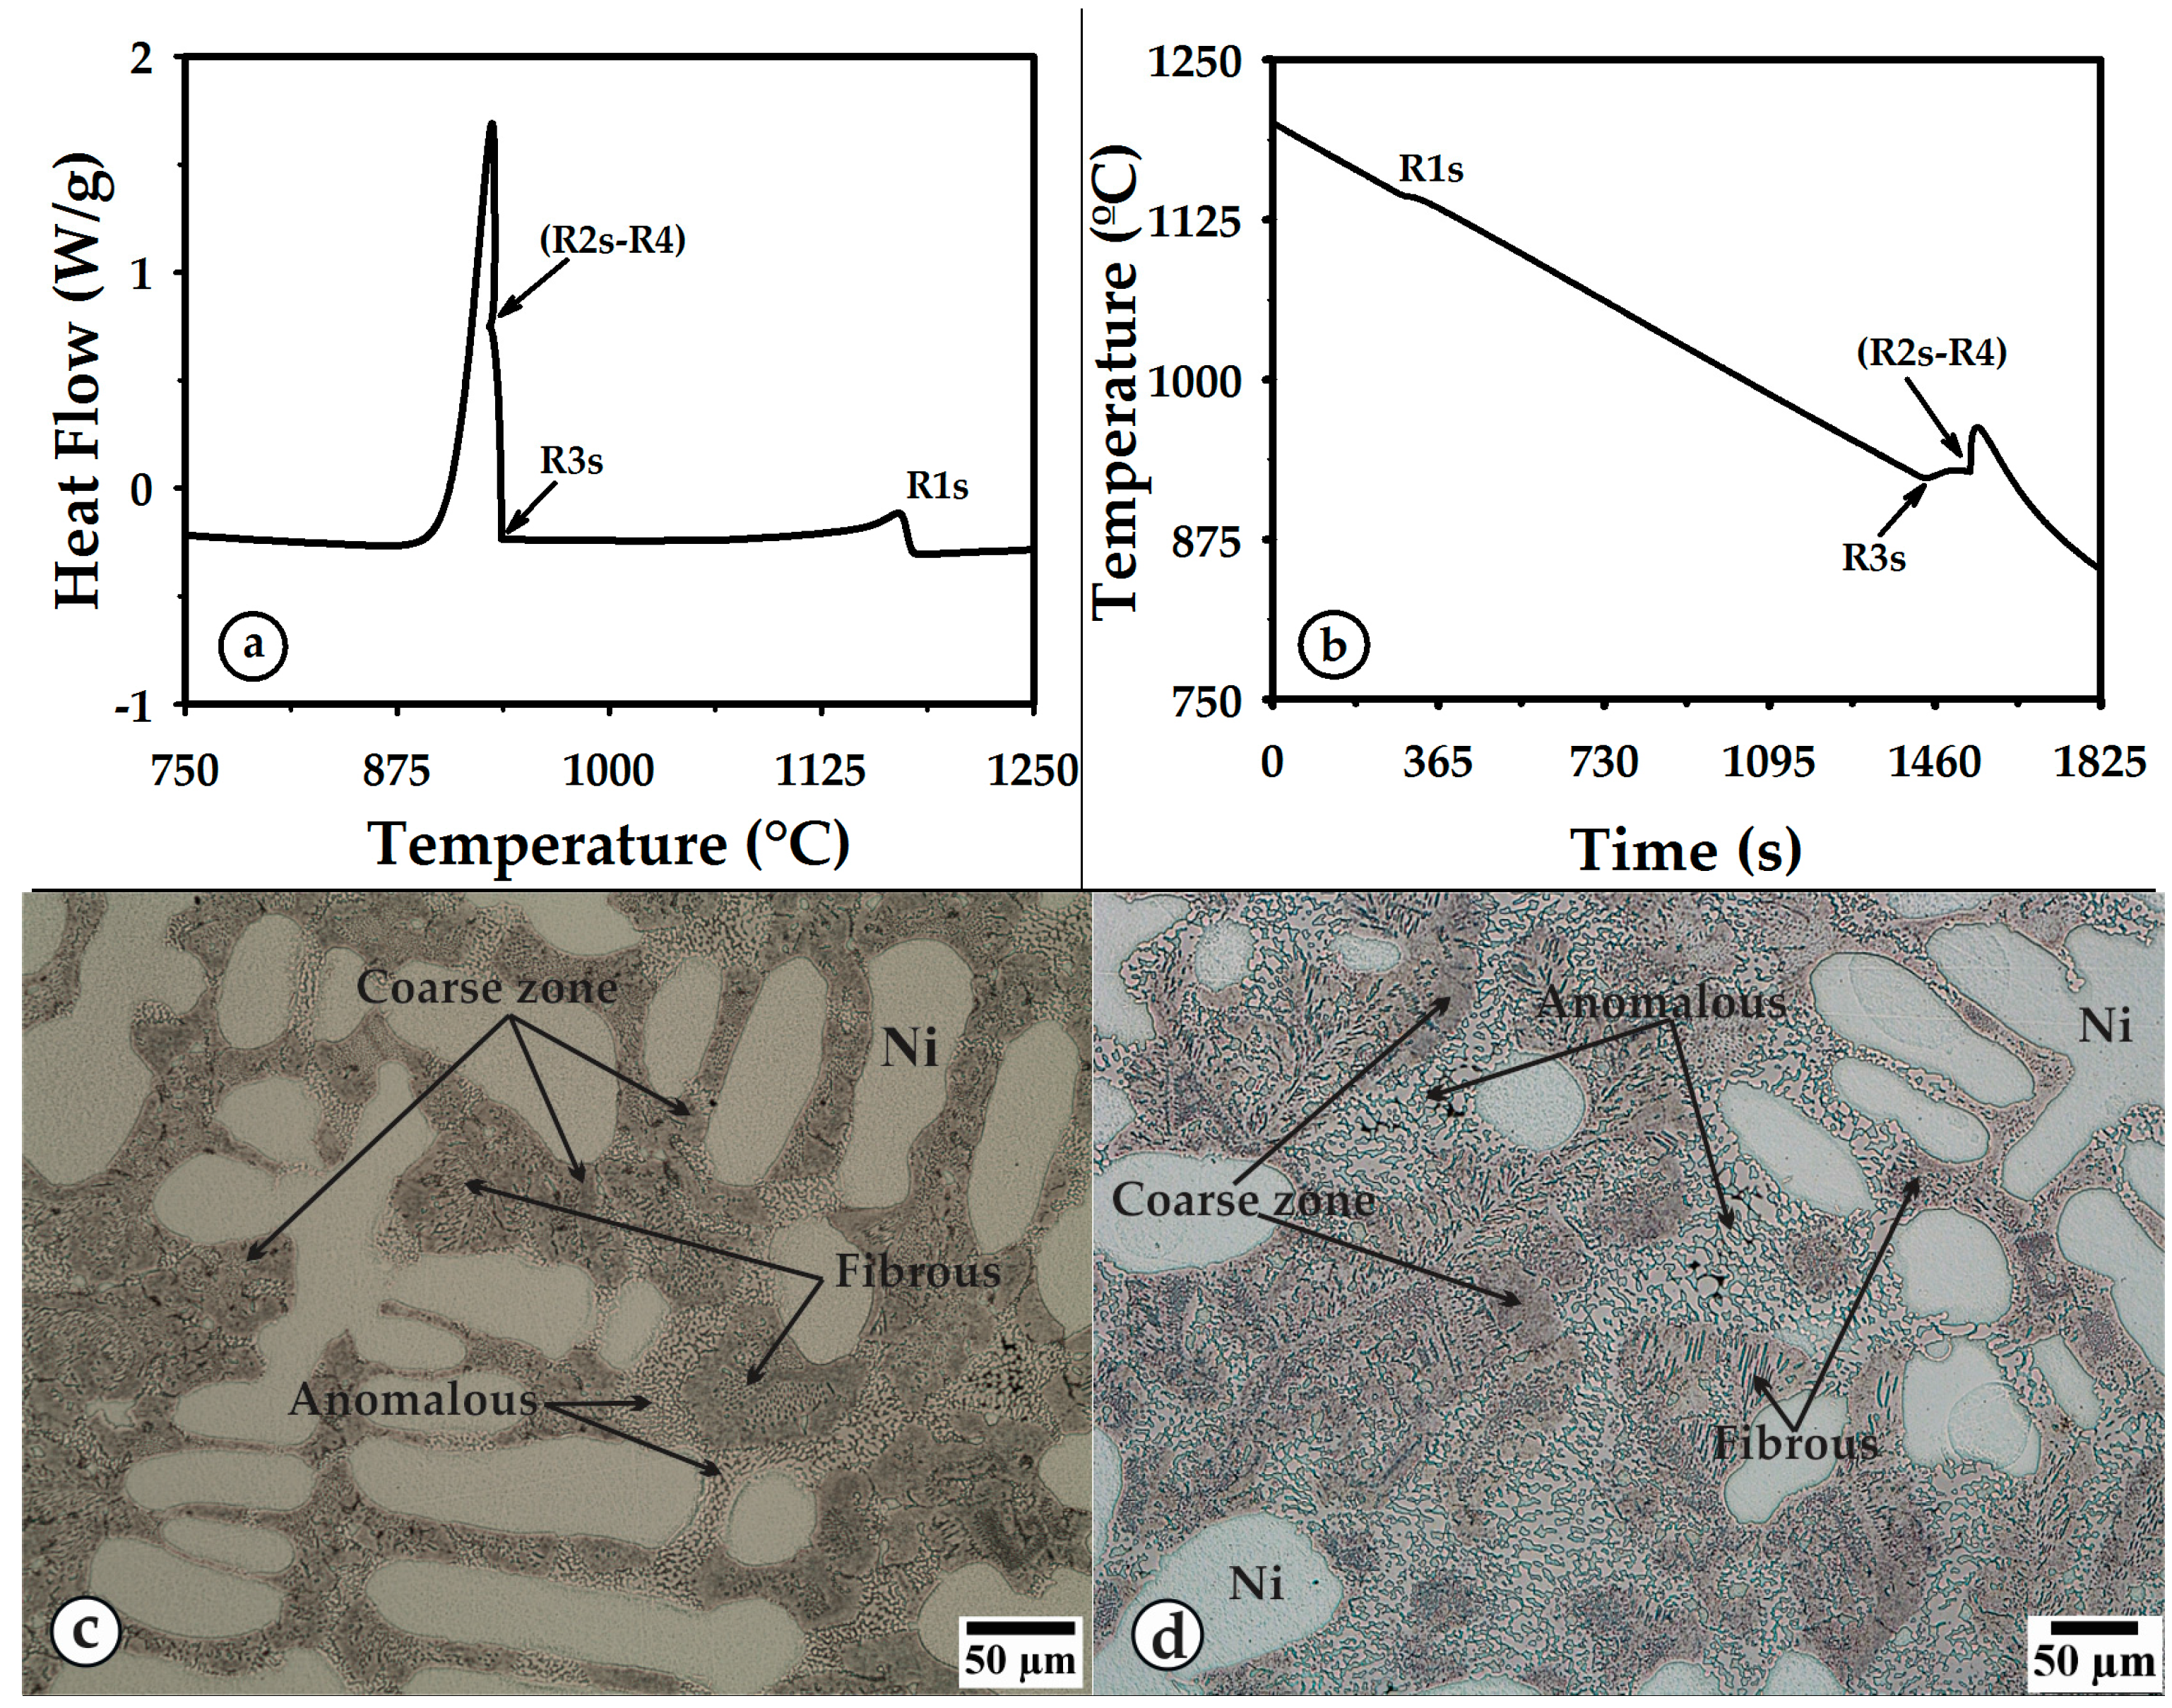
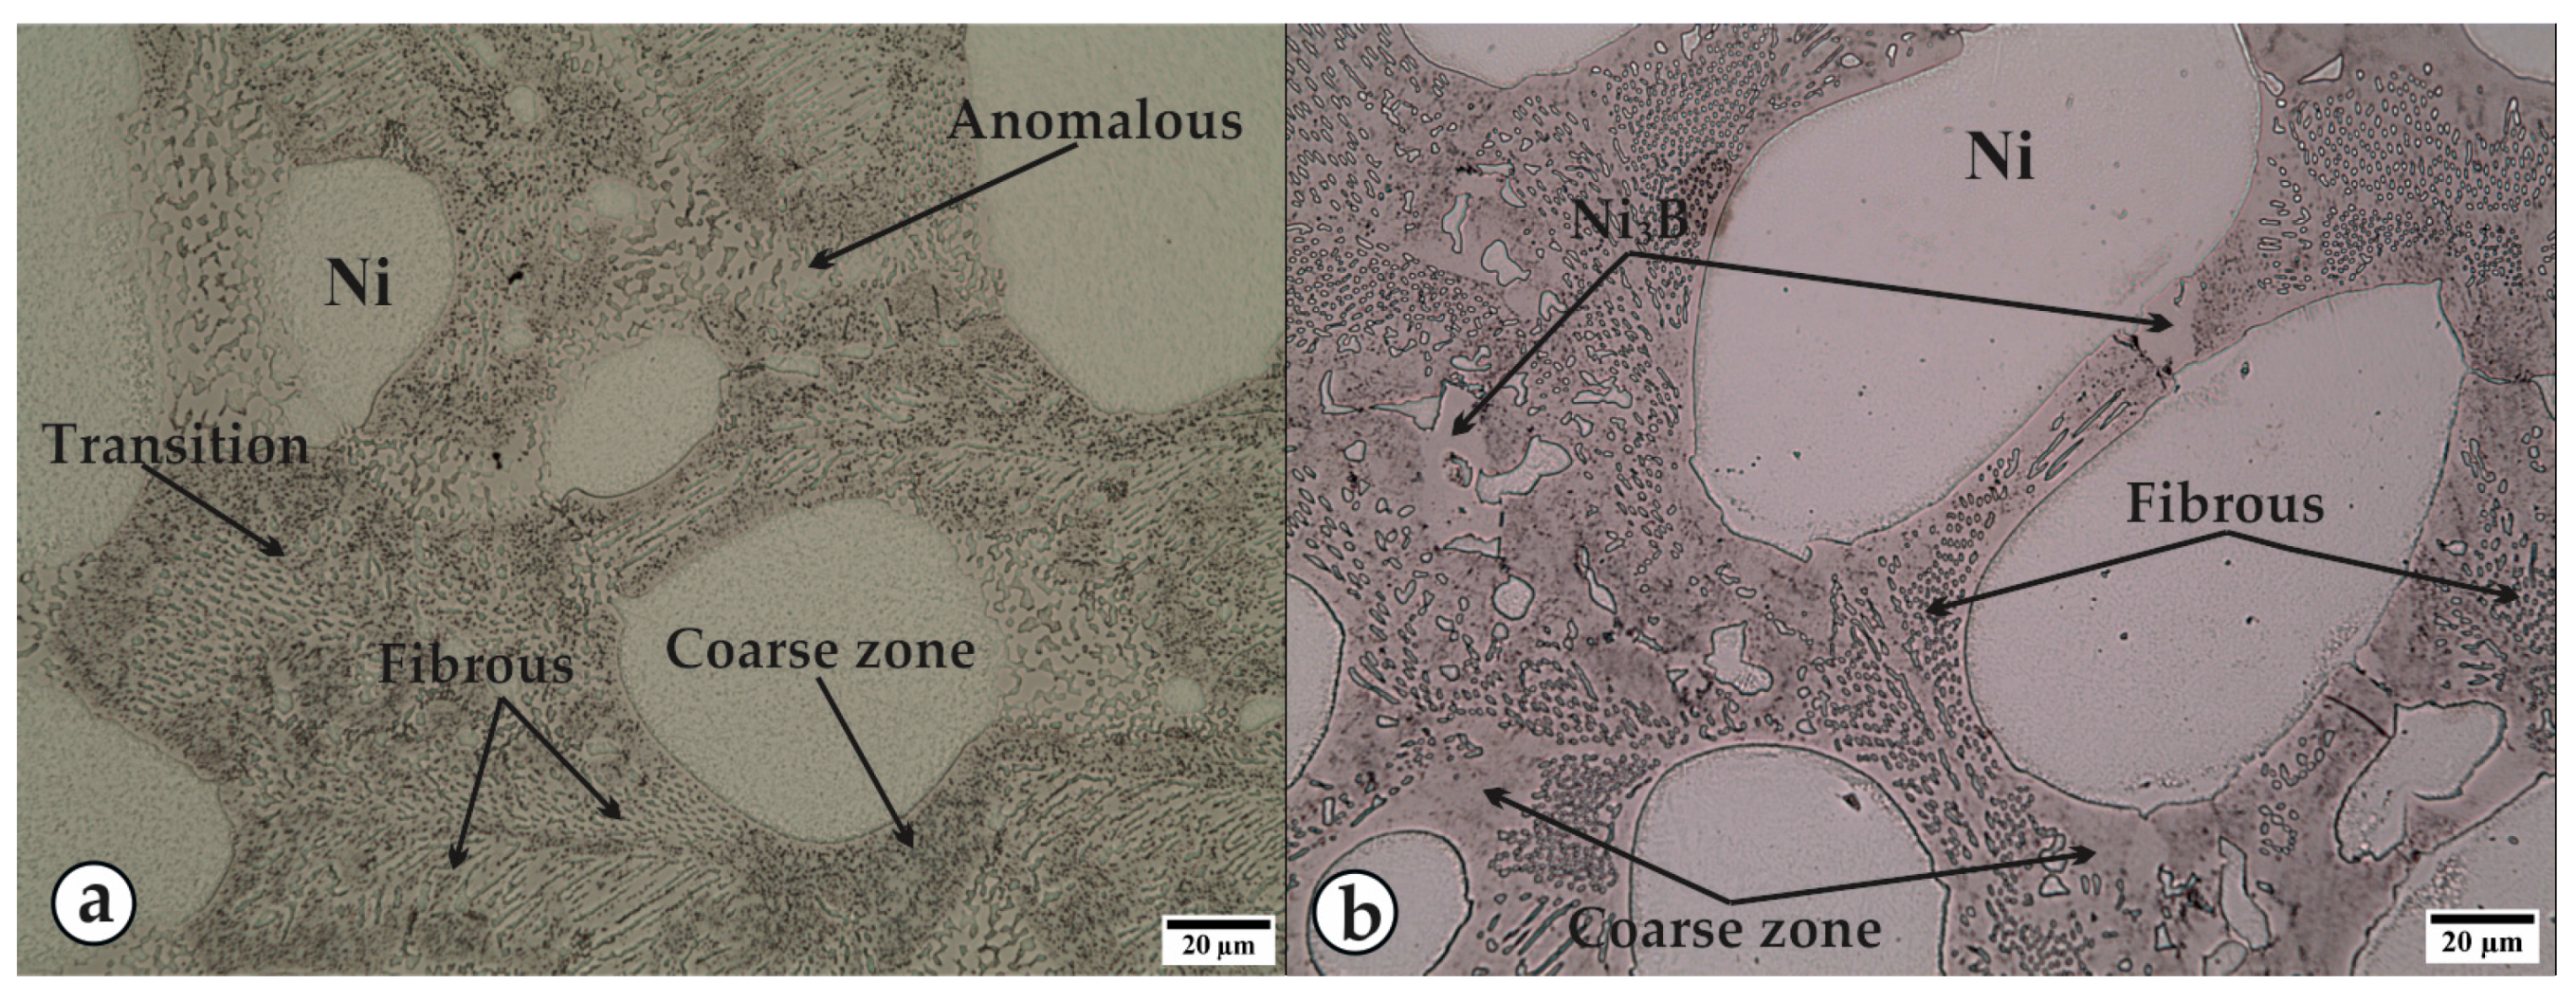
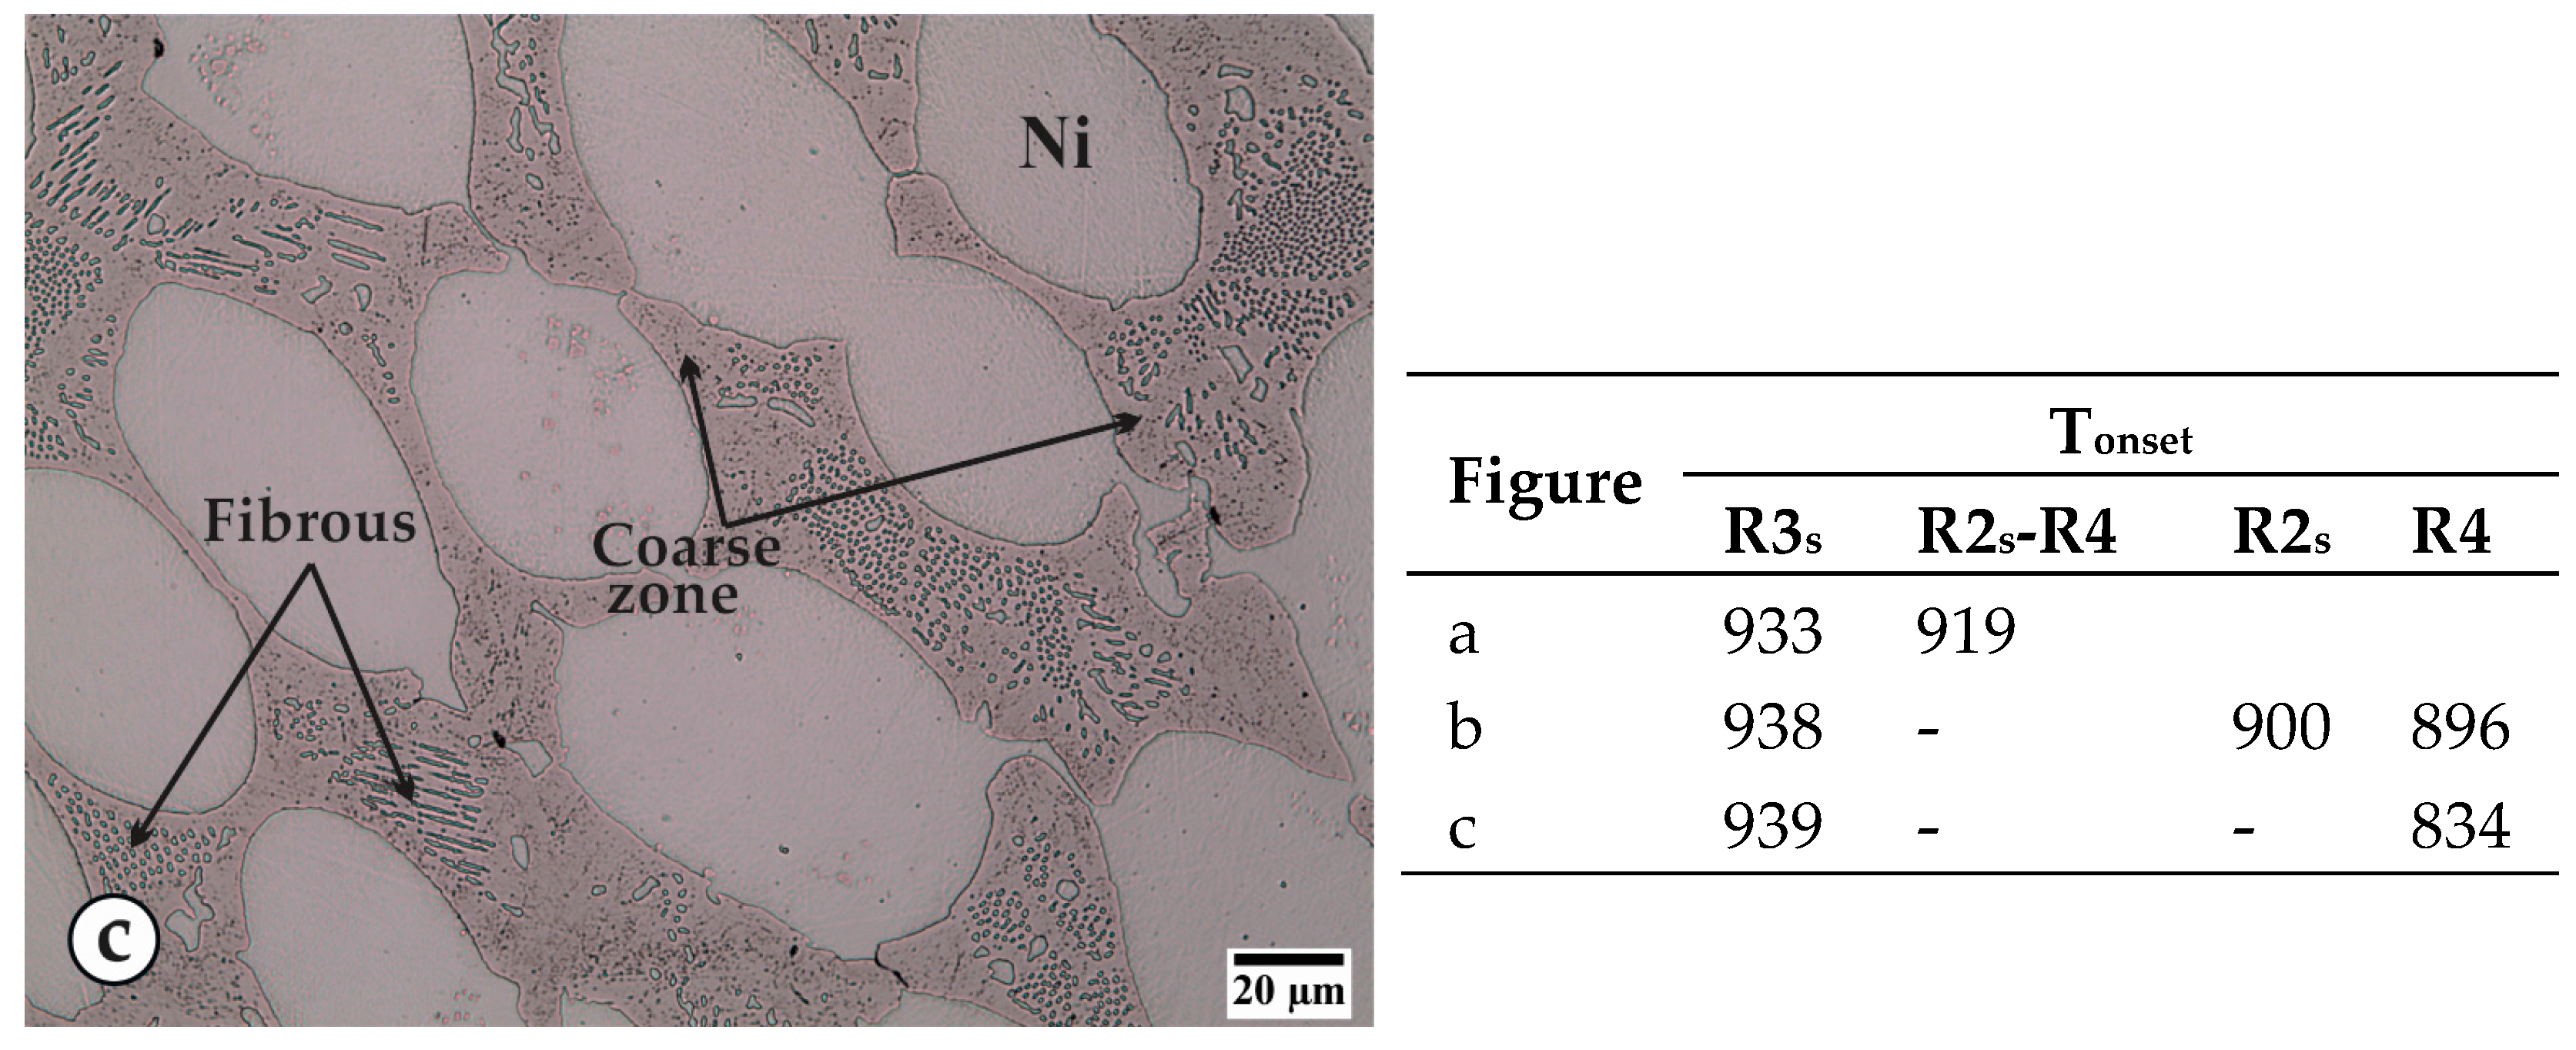
3.1. Thermal Curves and Microstructure
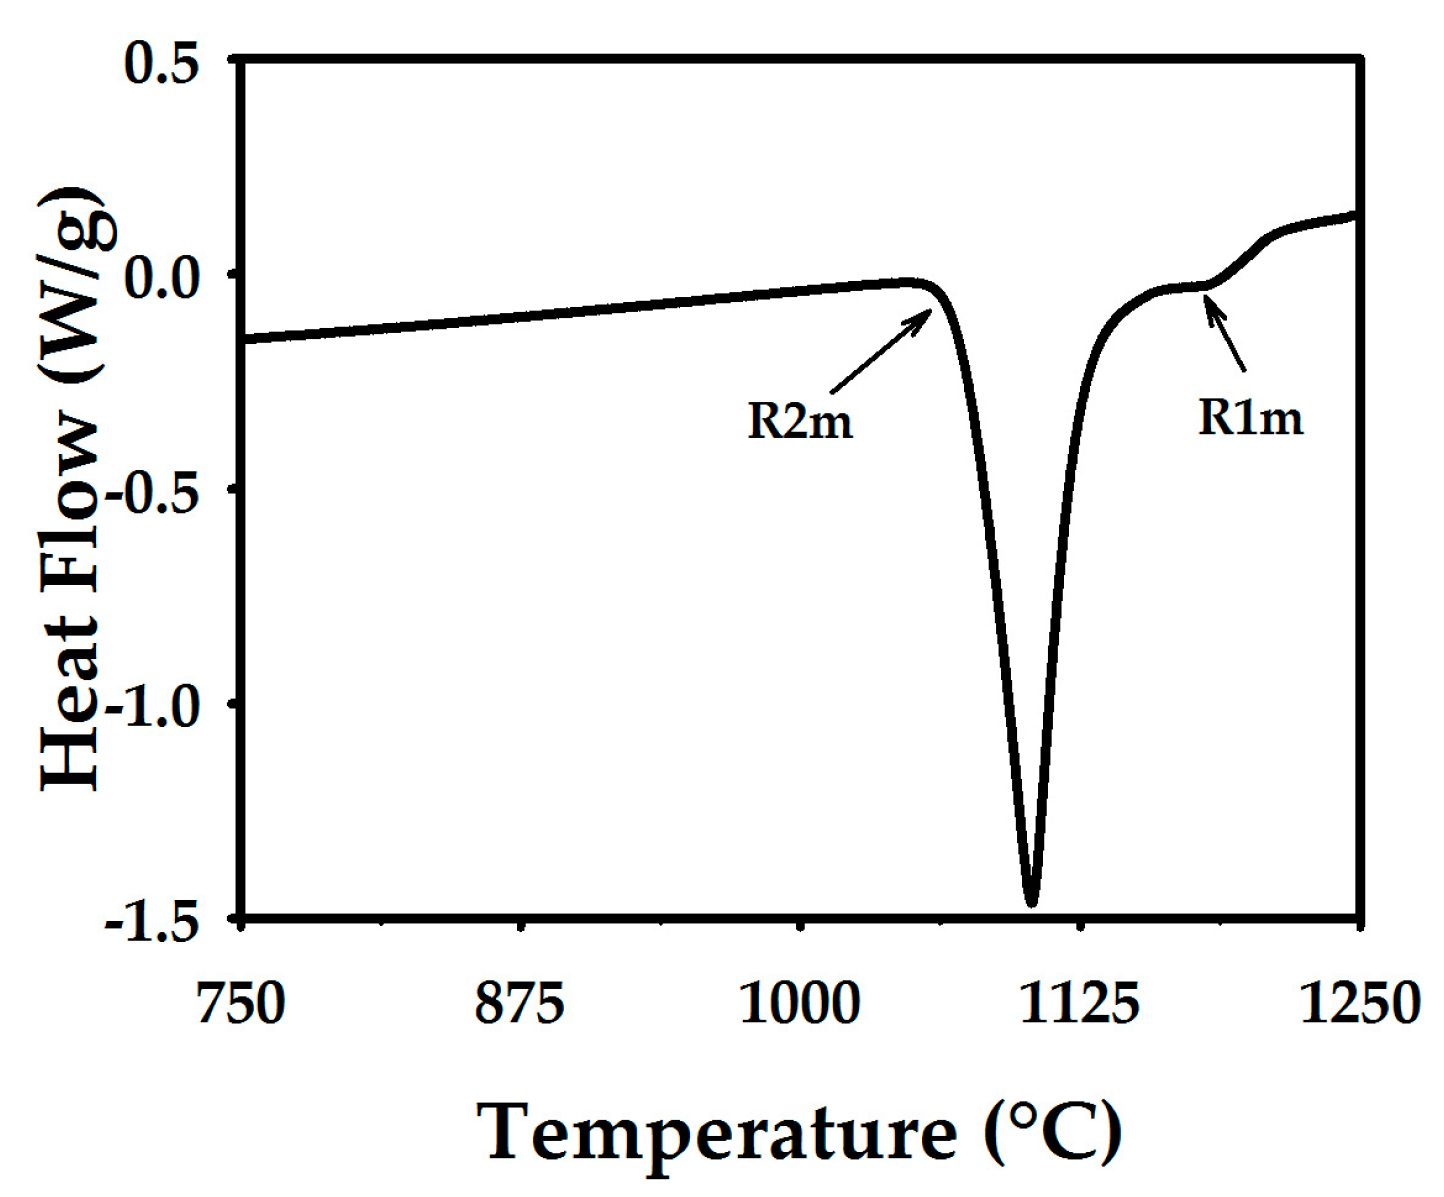
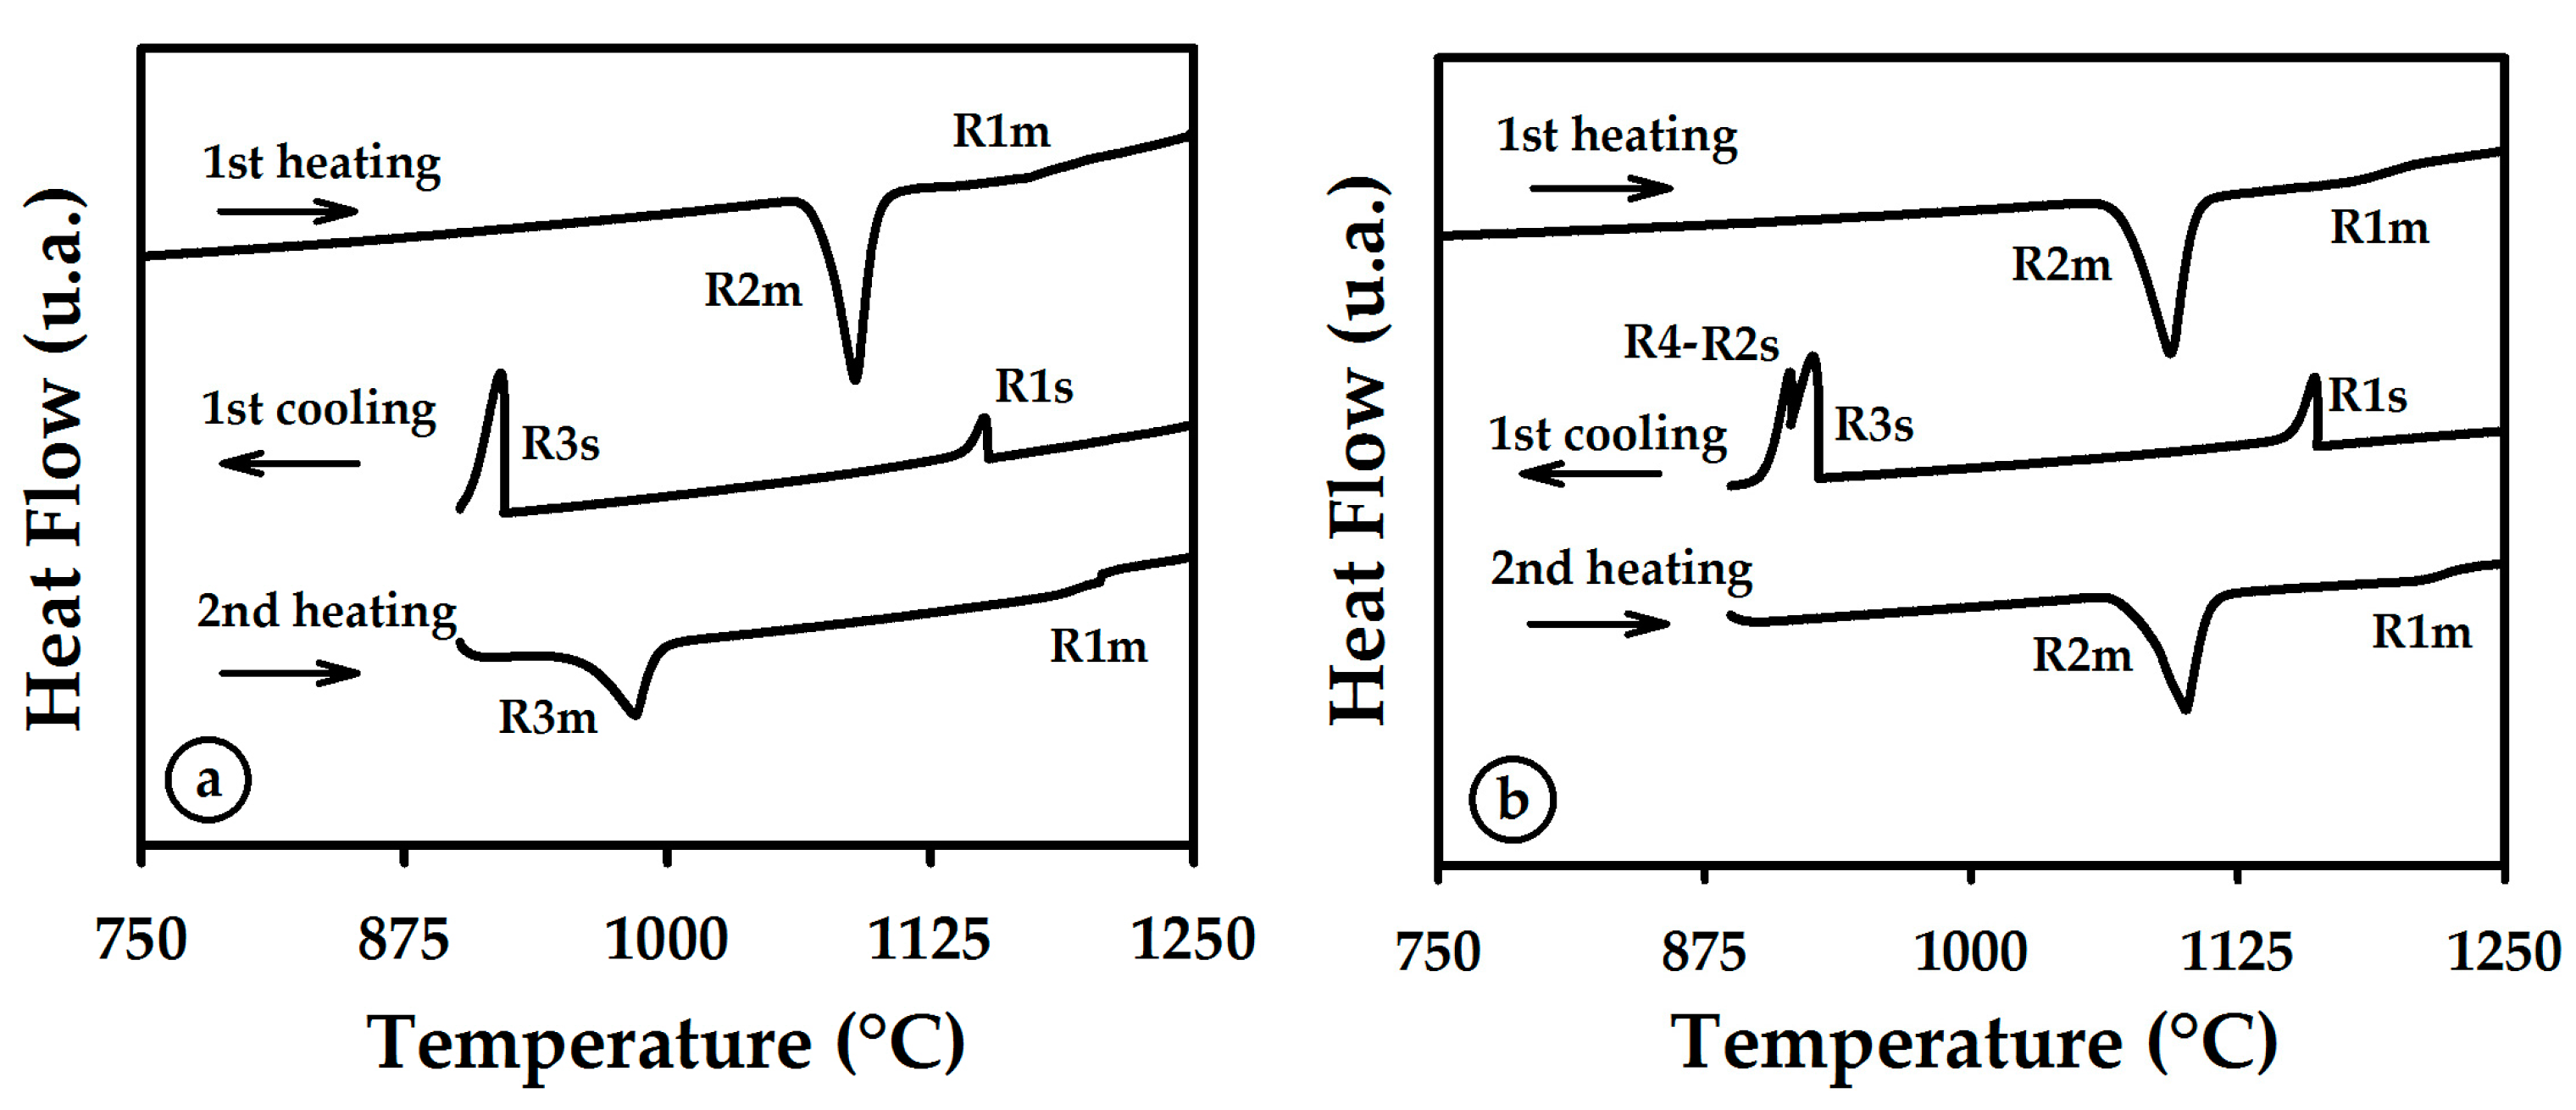
3.2. Heating
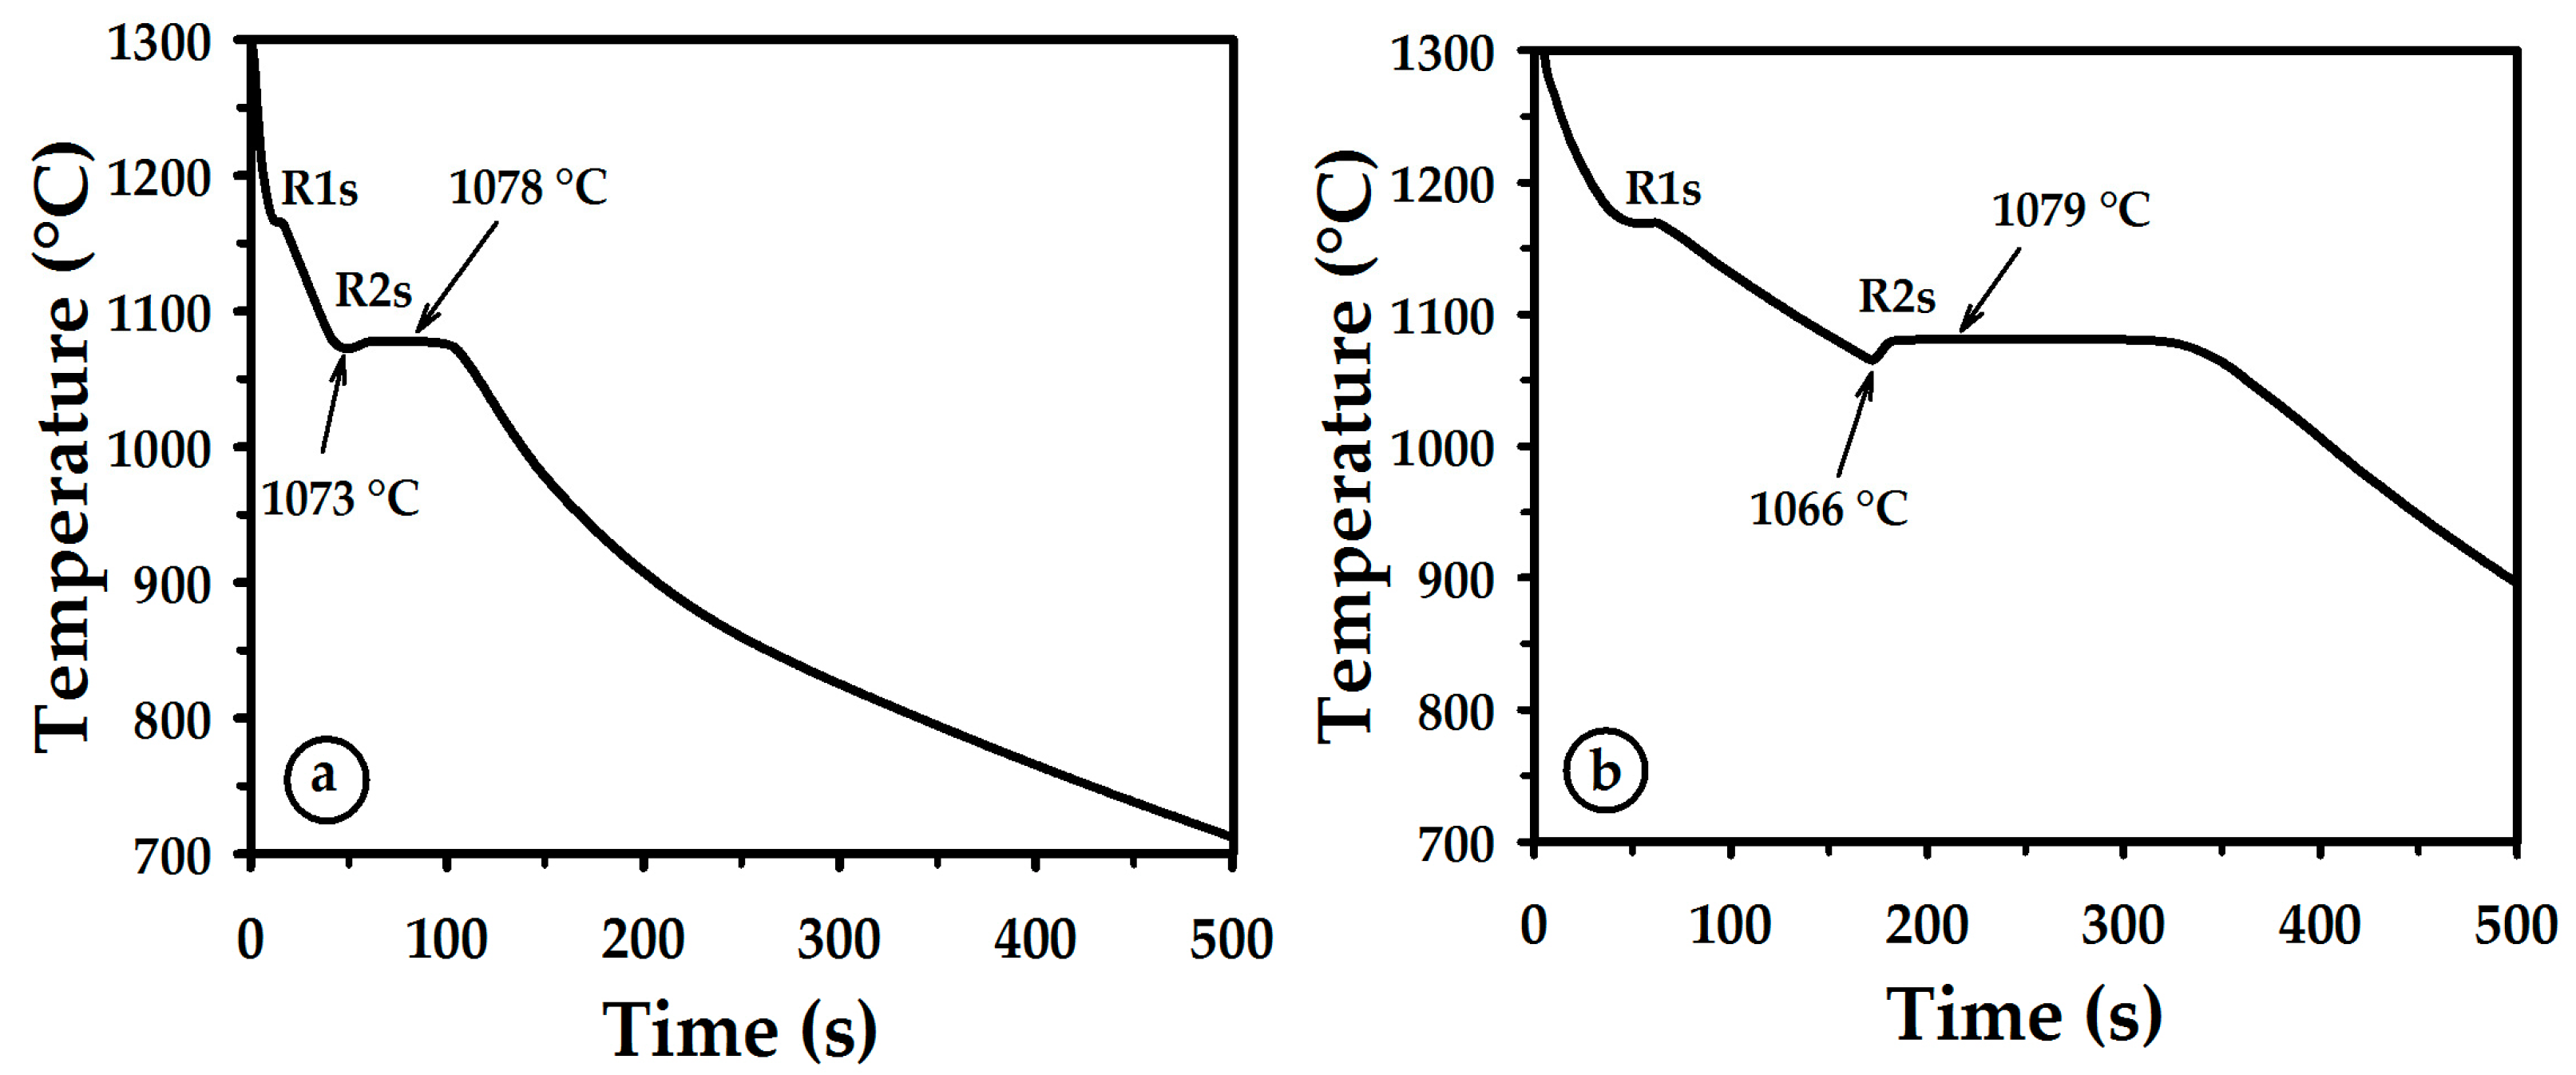
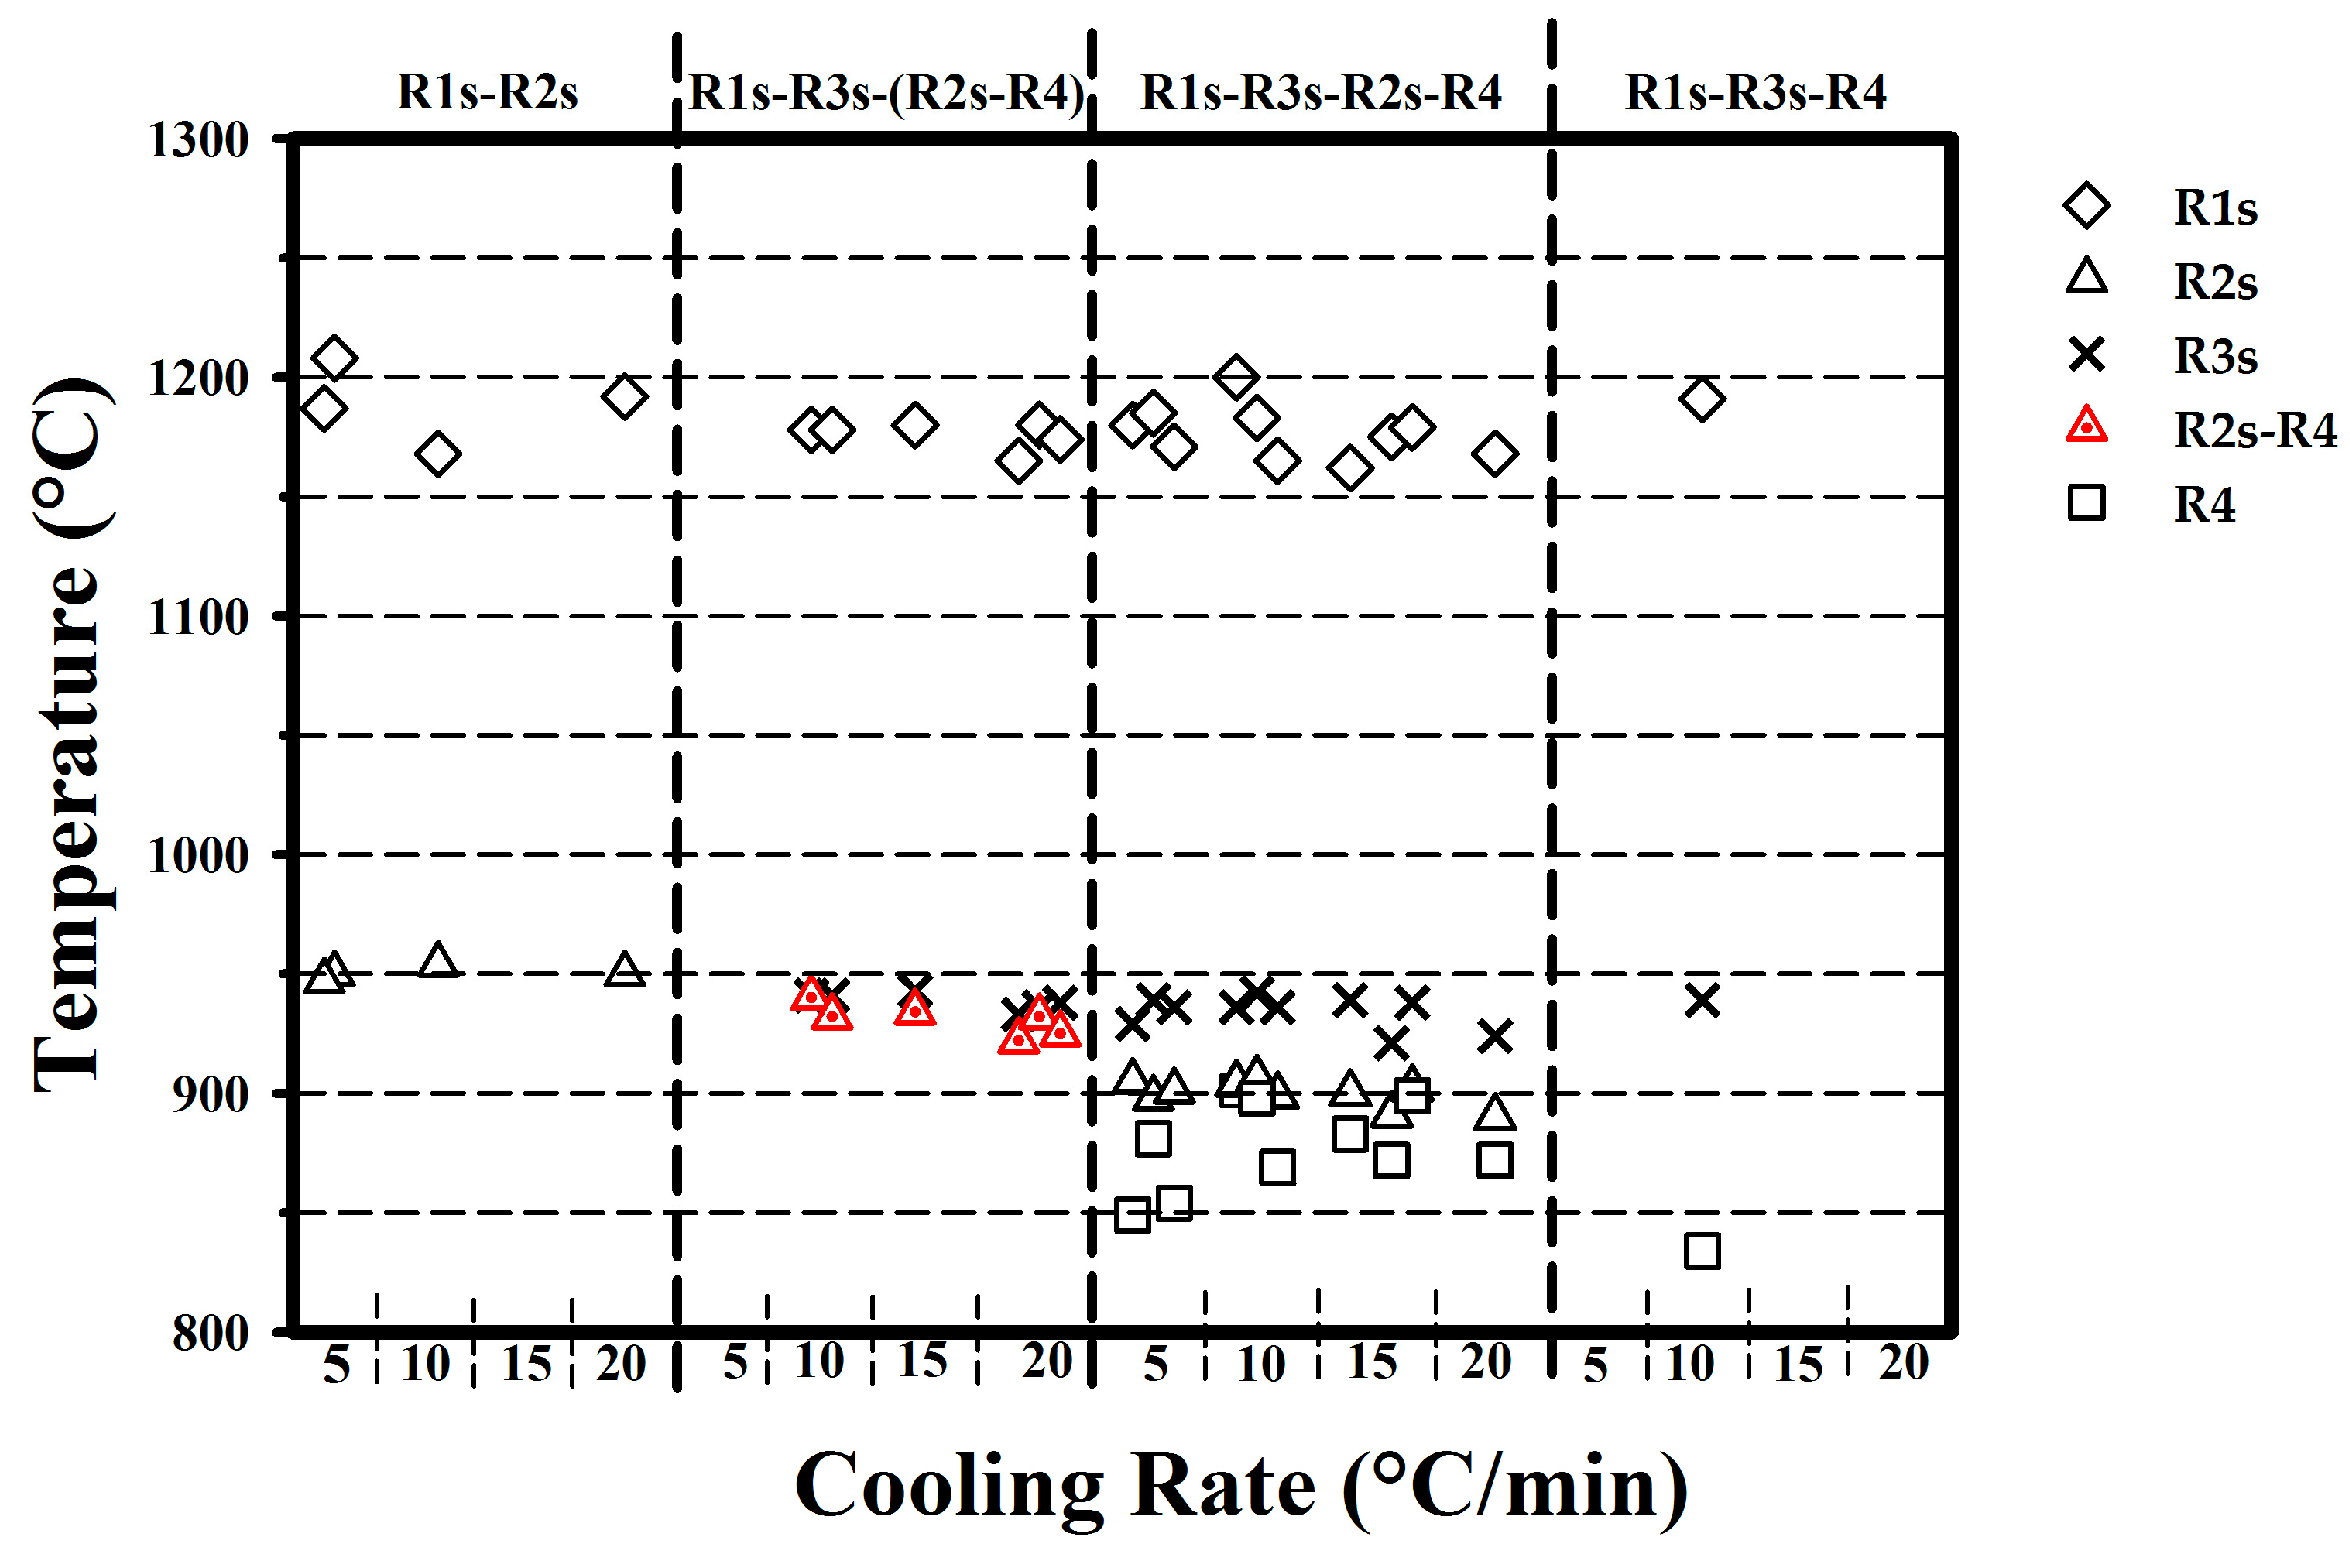
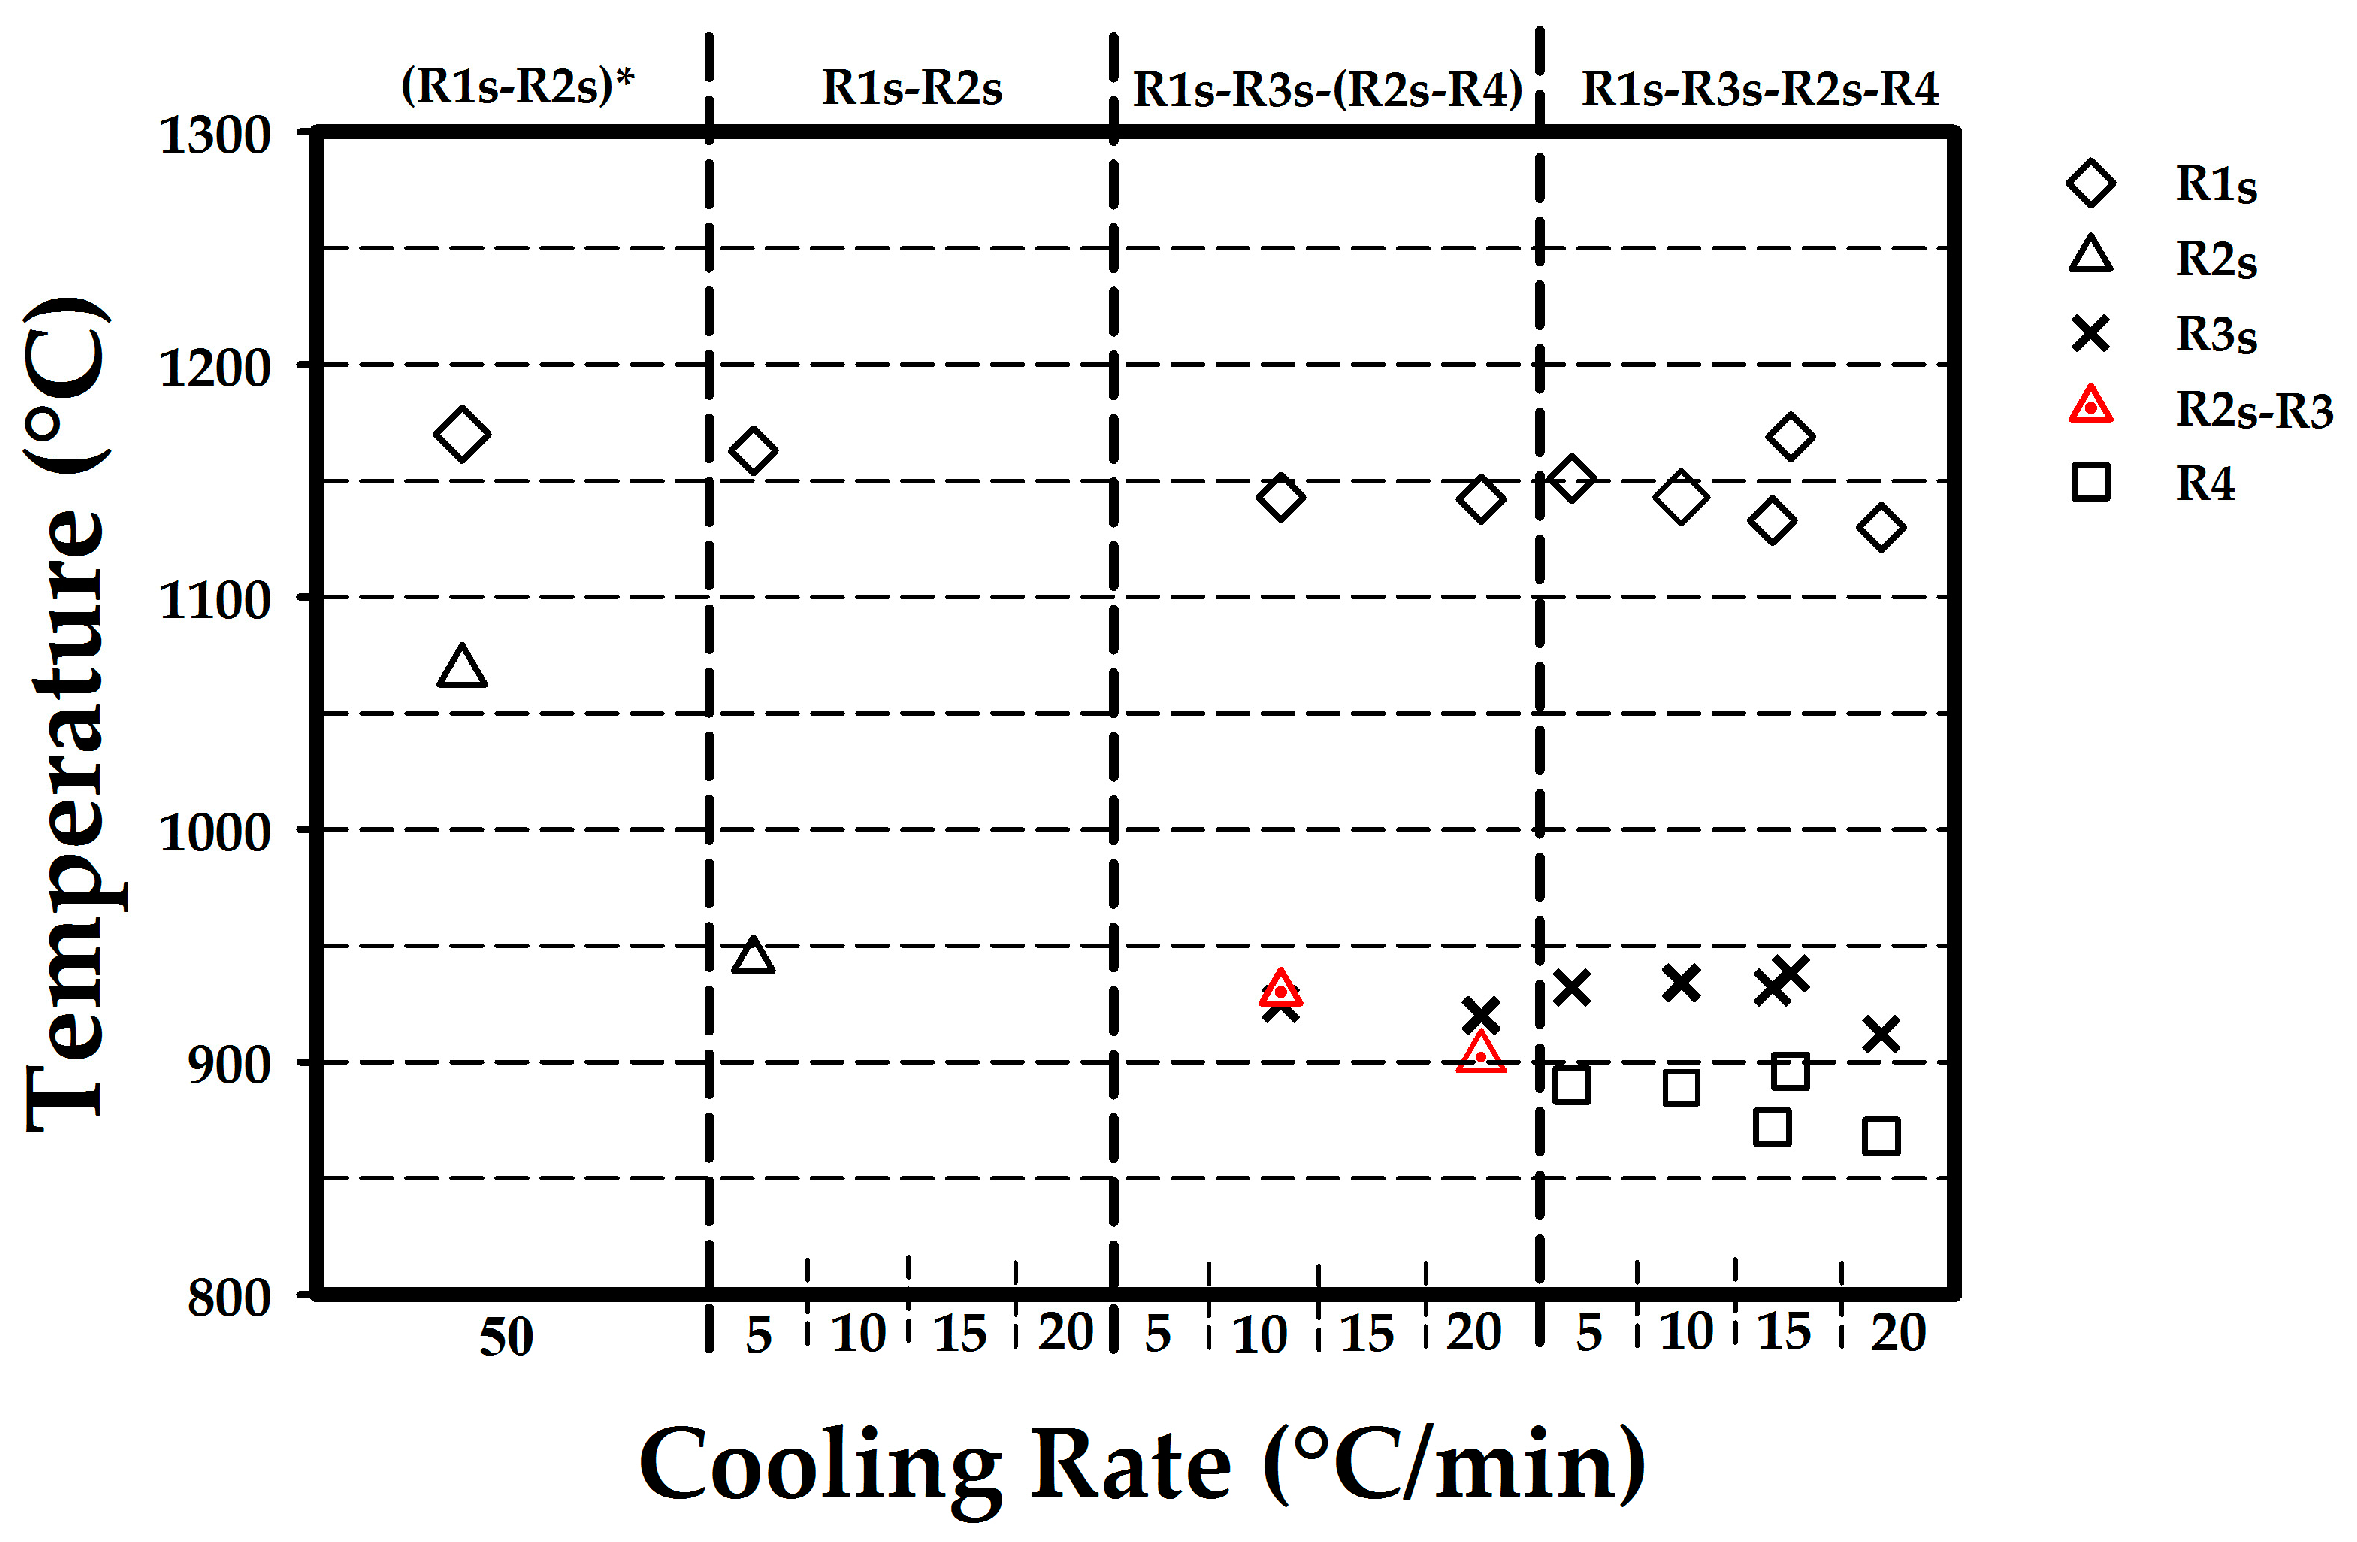
3.3. Cooling
4. Conclusions
Acknowledgments
Author Contributions
Conflicts of Interest
References
- Lebaili, S.; Durand-Charre, M.; Hamar-Thibault, S. The metallurgical structure of as-solidified Ni-Cr-B-Si-C hardfacing alloys. J. Mater. Sci. 1988, 23, 3603–3611. [Google Scholar] [CrossRef]
- Knotek, O. On the structure of Ni-Cr-B-Si hardfacing alloys and their bonding reactions. J. Vac. Sci. Technol. 1974, 11, 798–801. [Google Scholar] [CrossRef]
- Ajao, J.; Hamar-Thibault, S. Structure observations by high-resolution electron microscopy of Ni-B melt-spun alloys. J. Mater. Sci. 1989, 24, 3647–3659. [Google Scholar] [CrossRef]
- Ajao, J.; Hamar-Thibault, S. Influence of additions on the solidification behaviour of Ni-B alloys—Crystallography of Ni-Ni3B eutectic. J. Mater. Sci. 1988, 23, 1112–1125. [Google Scholar] [CrossRef]
- Morris, D.G. Glass formation and crystallisation in Ni-Si-B alloys—II. Crystal formation on annealing. Acta Metall. 1984, 32, 837–849. [Google Scholar] [CrossRef]
- Morris, D.G. Crystallization embrittlement of Ni-Si-B alloys. J. Mater. Sci. 1985, 20, 331–340. [Google Scholar] [CrossRef]
- Zhu, C.L.; Wang, Q.; Wang, Y.M.; Qiang, J.B.; Dong, C. Ni-based B-Fe-Ni-Si-Ta bulk metallic glasses designed using cluster line, minor alloying, and element substitutions. Intermetallics 2010, 18, 791–795. [Google Scholar] [CrossRef]
- Ohodnicki, P.R.; Cates, N.C.; Laughlin, D.E.; McHenry, M.E.; Widom, M. Ab initio theoretical study of magnetization and phase stability of the (Fe,Co,Ni)23B6 and (Fe,Co,Ni)23Zr6 structures of Cr23C6 and Mn23Th6 prototypes. Phys. Rev. B Condens. Matter Mater. Phys. 2008, 78, 1–13. [Google Scholar] [CrossRef]
- Knotek, O.; Lugscheider, E. Brazing Filler Metals Based on Reacting Ni-Cr-B-Si Alloys. Weld. Res. Suppl. 1976, 55, 314–318. [Google Scholar]
- Jalilian, F.; Jahazi, M.; Drew, R.A.L. Microstructural evolution during transient liquid phase bonding of Inconel 617 using Ni-Si-B filler metal. Mater. Sci. Eng. A 2006, 423, 269–281. [Google Scholar] [CrossRef]
- Yuan, X.; Kang, C.Y.; Kim, M.B. Microstructure and XRD analysis of brazing joint for duplex stainless steel using a Ni-Si-B filler metal. Mater. Charact. 2009, 60, 923–931. [Google Scholar] [CrossRef]
- Tanaka, K.; Hidaka, K. Hard Facing Nickel-Base Alloy. U.S. Patent 4,404,049, 13 September 1983. [Google Scholar]
- Gurumoorthy, K.; Kamaraj, M.; Rao, K.P.; Rao, A.S.; Venugopal, S. Microstructural aspects of plasma transferred arc surfaced Ni-based hardfacing alloy. Mater. Sci. Eng. A 2007, 456, 11–19. [Google Scholar] [CrossRef]
- Ming, Q.; Lim, L.C.; Chen, Z.D. Laser cladding of nickel-based hardfacing alloys. Surf. Coat. Technol. 1998, 106, 174–182. [Google Scholar] [CrossRef]
- Hampton, M.D.; Schur, D.V.; Zaginaichenko, S.Y.; Trefilov, V.I. Hydrogen Materials Science and Chemistry of Metal Hydrides; Springer: Berlin/Heidelberg, Germany, 2012. [Google Scholar]
- Davis, J.R. Handbook of Thermal Spray Technology; ASM International: Novelty, OH, USA, 2004. [Google Scholar]
- Teramoto, T.; Hidaka, K. Hard Facing Nickel Base Alloy. U.S. Patent 4,425,300, 10 January 1984. [Google Scholar]
- Davis, J.R. Nickel, Cobalt, and Their Alloys. Asm Specialty Handbook; ASM International: Novelty, OH, USA, 2000. [Google Scholar]
- Lebaili, S.; Hamar-Thibault, S. Equilibres Liquide-Solide Dans Le Système Ni-B-Si Dans la Region Riche en Nickel. Acta Metall. 1987, 35, 701–710. [Google Scholar] [CrossRef]
- Flemings, M.C. Solidification Processing; Wiley Online Library: Hoboken, NJ, USA, 1974. [Google Scholar]
- Kurz, W.; Fisher, D.J. Fundamentals of Solidification; CRC Press: Boca Raton, FL, USA, 1998. [Google Scholar]
- Baricco, M.; Ferrari, E.; Battezzati, L. Undercooling experiments in a high temperature differential scanning calorimeter. In Materials Research Society Symposium—Proceedings; Materials Research Society: Pittsburgh, PA, USA, 1996; Volume 398, pp. 81–86. [Google Scholar]
- Xu, J.; Liu, F.; Dang, B. Phase selection in undercooled Ni-3.3 Wt Pct B alloy melt. Metall. Mater. Trans. Phys. Metall. Mater. Sci. 2013, 44, 1401–1408. [Google Scholar] [CrossRef]
- Xu, J.F.; Liu, F.; Xu, X.L.; Dang, B. Undercooled solidification of Ni-3.3 wt-%B alloy and cooling curve description. Mater. Sci. Technol. UK 2013, 29, 36–42. [Google Scholar] [CrossRef]
- Xu, J.; Liu, F.; Zhang, D. Phase selection of undercooled solidification of Ni-4.5 wt% B alloy. J. Mater. Res. 2013, 28, 3347–3354. [Google Scholar] [CrossRef]
- Ajao, J.A. Preparation and Structural Characterization of Vanadium Doped Ni-B Binary Hard Alloys. J. Miner. Mater. Charact. Eng. 2010, 9, 559–568. [Google Scholar] [CrossRef]
- Boettinger, W.J.; Kattner, U.R.; Moon, K.W.; Perepezko, J.H. DTA and Heat-Flux DSC Measurements of Alloy Melting and Freezing; Citeseer: State College, PA, USA, 2006. [Google Scholar]
- Croker, M.N.; Baragar, D.; Smith, R.W. Anomalous eutectic growth. II. The relationship between faceted/non-faceted eutectic structures. J. Cryst. Growth 1975, 30, 198–212. [Google Scholar] [CrossRef]
- Clopet, C.R.; Cochrane, R.F.; Mullis, A.M. The origin of anomalous eutectic structures in undercooled Ag-Cu alloy. Acta Mater. 2013, 61, 6894–6902. [Google Scholar] [CrossRef]
- Wei, X.X.; Lin, X.; Xu, W.; Huang, Q.S.; Ferry, M.; Li, J.F.; Zhou, Y.H. Remelting-induced anomalous eutectic formation during solidification of deeply undercooled eutectic alloy melts. Acta Mater. 2015, 95, 44–56. [Google Scholar] [CrossRef]
- Xu, J.; Liu, F.; Zhang, D. In situ observation of solidification of undercooled hypoeutectic Ni-Ni3B alloy melt. J. Mater. Res. 2013, 28, 1891–1902. [Google Scholar] [CrossRef]
- ASTM E384: Standard Test Method for Knoop and Vickers Hardness of Materials. In ASTM Standards; ASM International: Novelty, OH, USA, 2012; pp. 1–43.


| B | Si | Fe | Cr | Al | Ti | C | S | Ni |
|---|---|---|---|---|---|---|---|---|
| 10.945 | 3.228 | 0.030 | 0.020 | 0.062 | 0.002 | 0.074 | 0.015 | Balance |
| Reaction | Description |
|---|---|
| R1m or R1s | Melting or solidification of nickel. |
| R2m or R2s | Melting or solidification of the stable constituent of eutectic Ni-Ni3B. |
| R3m or R3s | Melting or solidification of the metastable NixBy alone or as part of a eutectic constituent. |
| R4 | Solid-state transformation of the NixBy constituent to Ni-Ni3B stable constituents. |
| R2m (°C) | Comments | Reference |
|---|---|---|
| Tonset = 1070 ± 2 °C Tpeak = 1100 ± 4 °C | Ni-10.95 at. % B-3.23 at. % Si alloy. Average of 21 data points from peaks observed during heating. | This study. |
| T = 1100 °C | Ni-16.2 at. % B-1 at. % Si, during heating. | [4] |
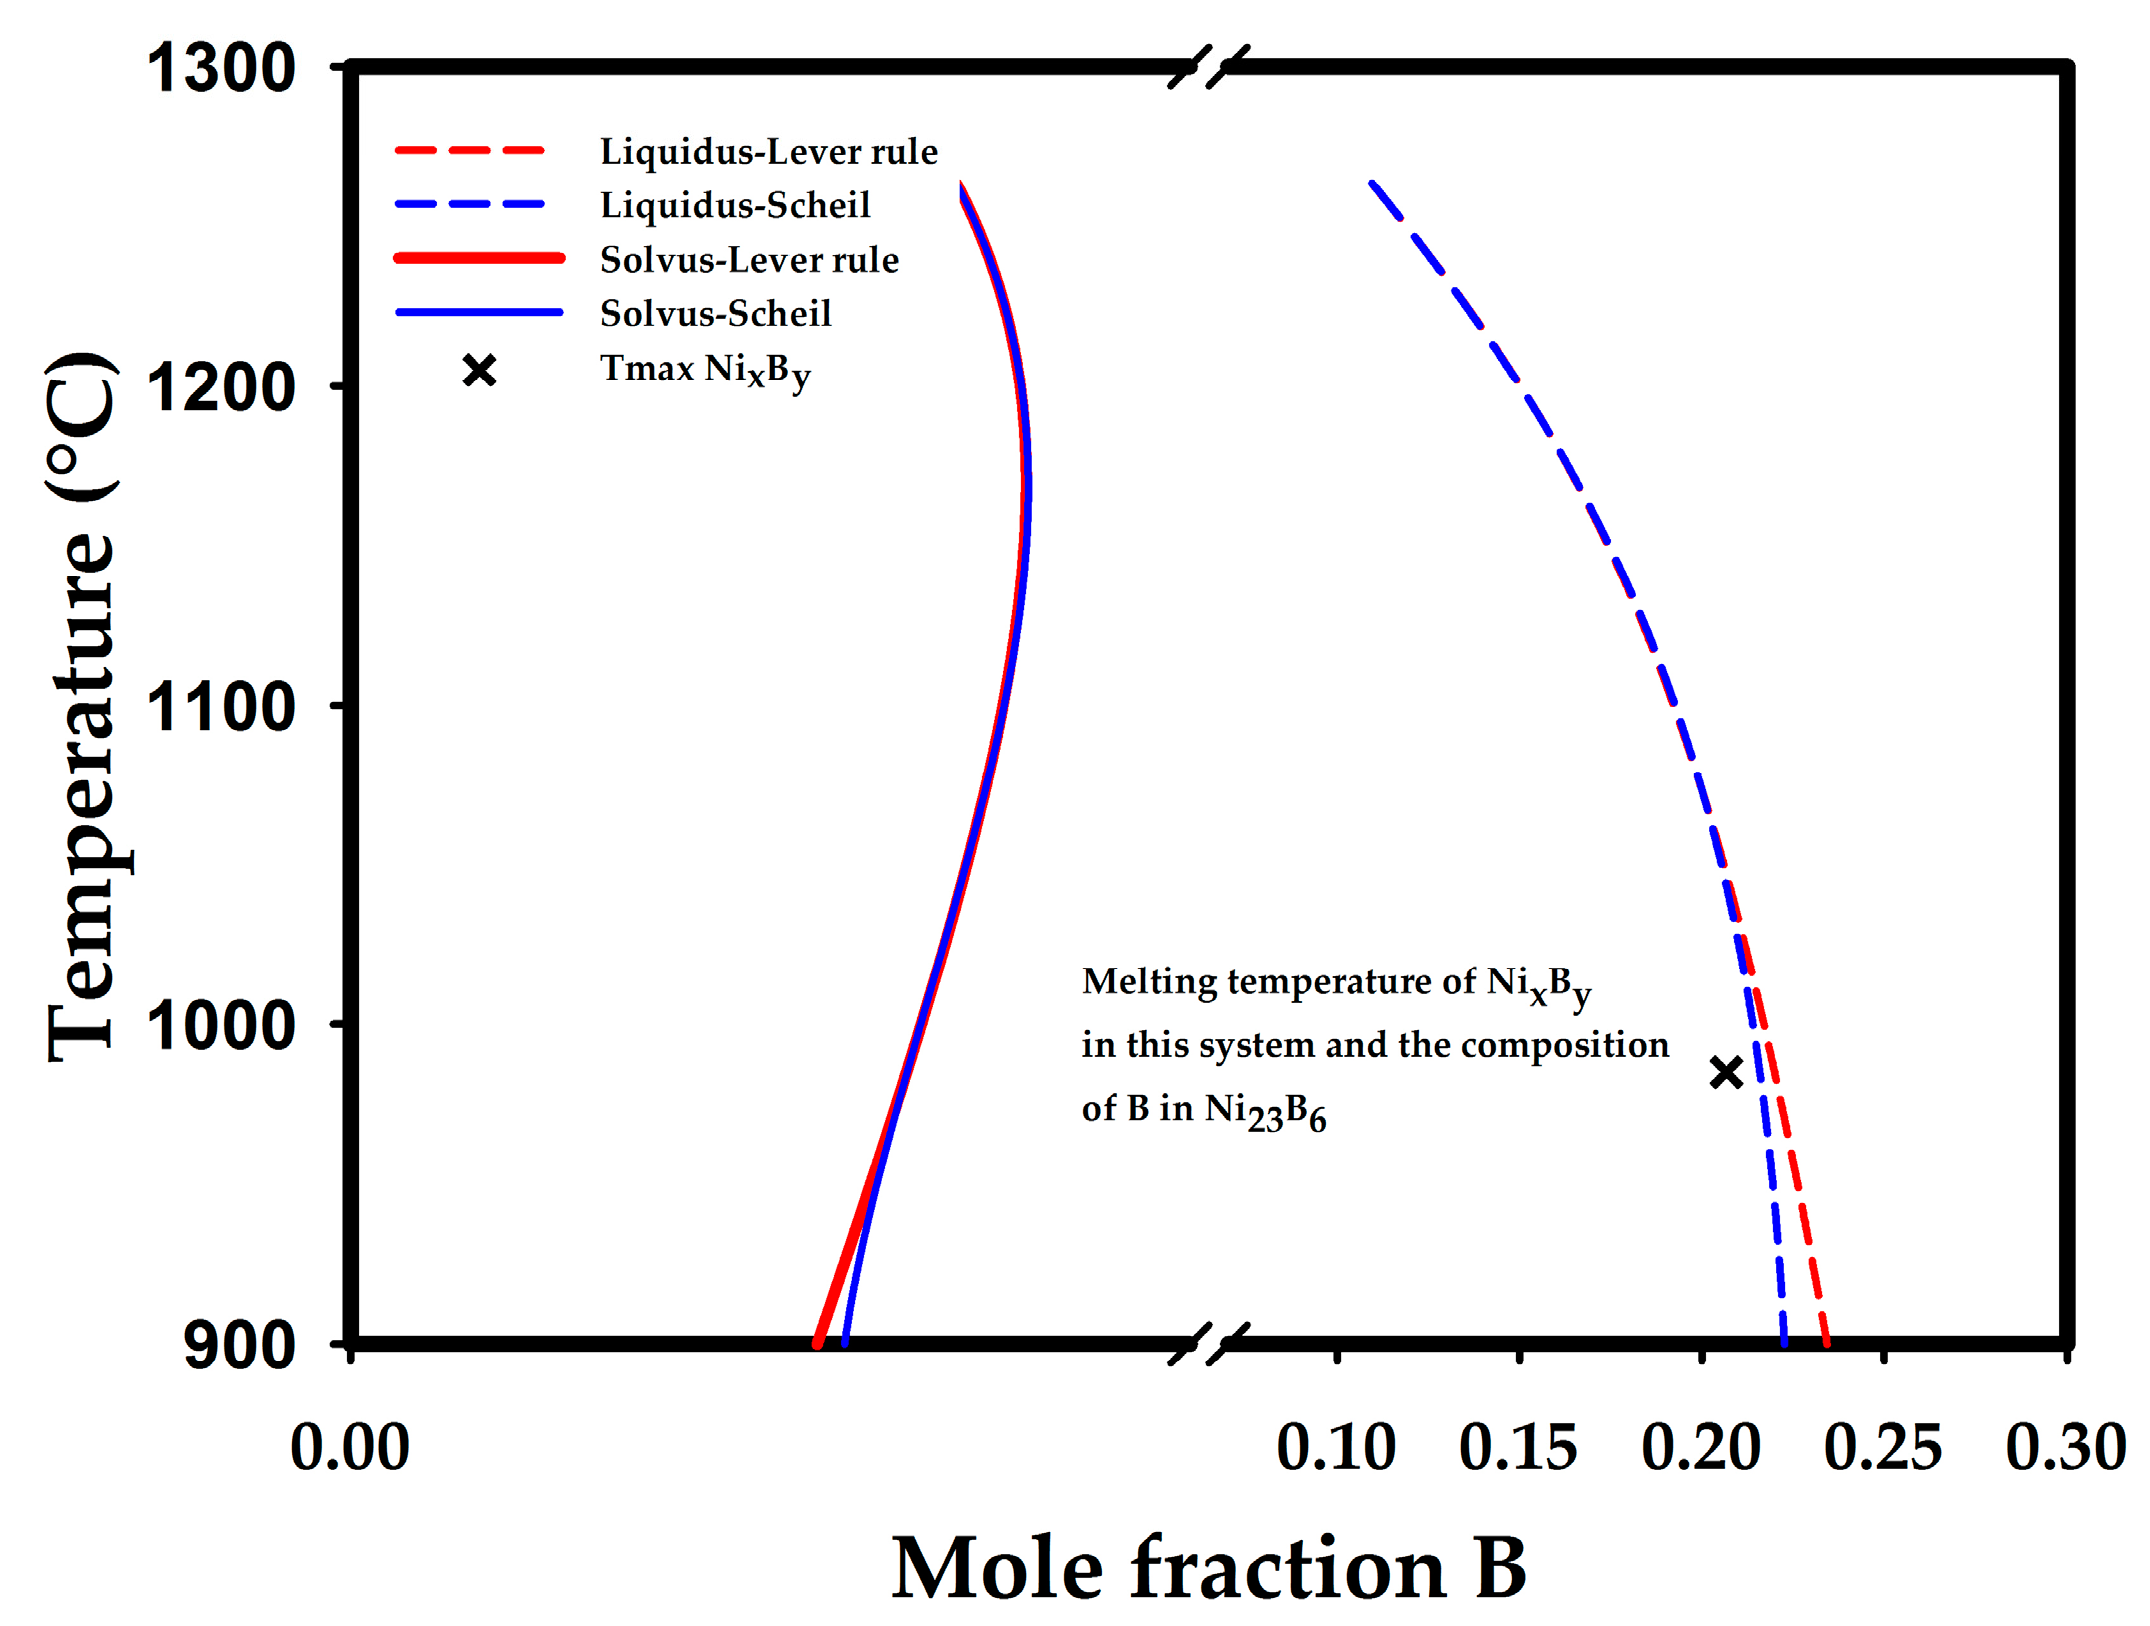
| Tini = 1128 °C Tend = 1125 °C | Ni-10.95 at. % B-3.23 at. % Si alloy. Tini and Tend are the initial and final temperatures for eutectic reaction, respectively. | ThermoCalc simulation with TCNI5 database data, lever rule. |
| Tini = 1129 °C Tend = 1090 °C | Ni-10.95 at. % B-3.23 at. % Si alloy. | ThermoCalc simulation with TCNI5 database data, Scheil-Gulliver model with activated option of fast diffusing elements. |
© 2017 by the authors. Licensee MDPI, Basel, Switzerland. This article is an open access article distributed under the terms and conditions of the Creative Commons Attribution (CC BY) license (http://creativecommons.org/licenses/by/4.0/).
Share and Cite
Fraga-Chávez, K.L.; Castro-Román, M.J.; Herrera-Trejo, M.; Ramírez-Vidaurri, L.E.; Aguilera-Luna, I. Phase Selection during Solidification of Ni-10.95 at. % and B-3.23 at. % Si Alloy. Metals 2017, 7, 187. https://doi.org/10.3390/met7060187
Fraga-Chávez KL, Castro-Román MJ, Herrera-Trejo M, Ramírez-Vidaurri LE, Aguilera-Luna I. Phase Selection during Solidification of Ni-10.95 at. % and B-3.23 at. % Si Alloy. Metals. 2017; 7(6):187. https://doi.org/10.3390/met7060187
Chicago/Turabian StyleFraga-Chávez, Karla L., Manuel Jesús Castro-Román, Martín Herrera-Trejo, Luciano Eliezer Ramírez-Vidaurri, and Israel Aguilera-Luna. 2017. "Phase Selection during Solidification of Ni-10.95 at. % and B-3.23 at. % Si Alloy" Metals 7, no. 6: 187. https://doi.org/10.3390/met7060187