Metal Pollution Indices of Bottom Sediment and Surface Water Affected by Acid Mine Drainage


Abstract
:1. Introduction
2. Materials and Methods
2.1. Metal Pollution Index
2.2. Partition Coefficient
2.3. Correlation Coefficient
2.4. Coefficient Determination
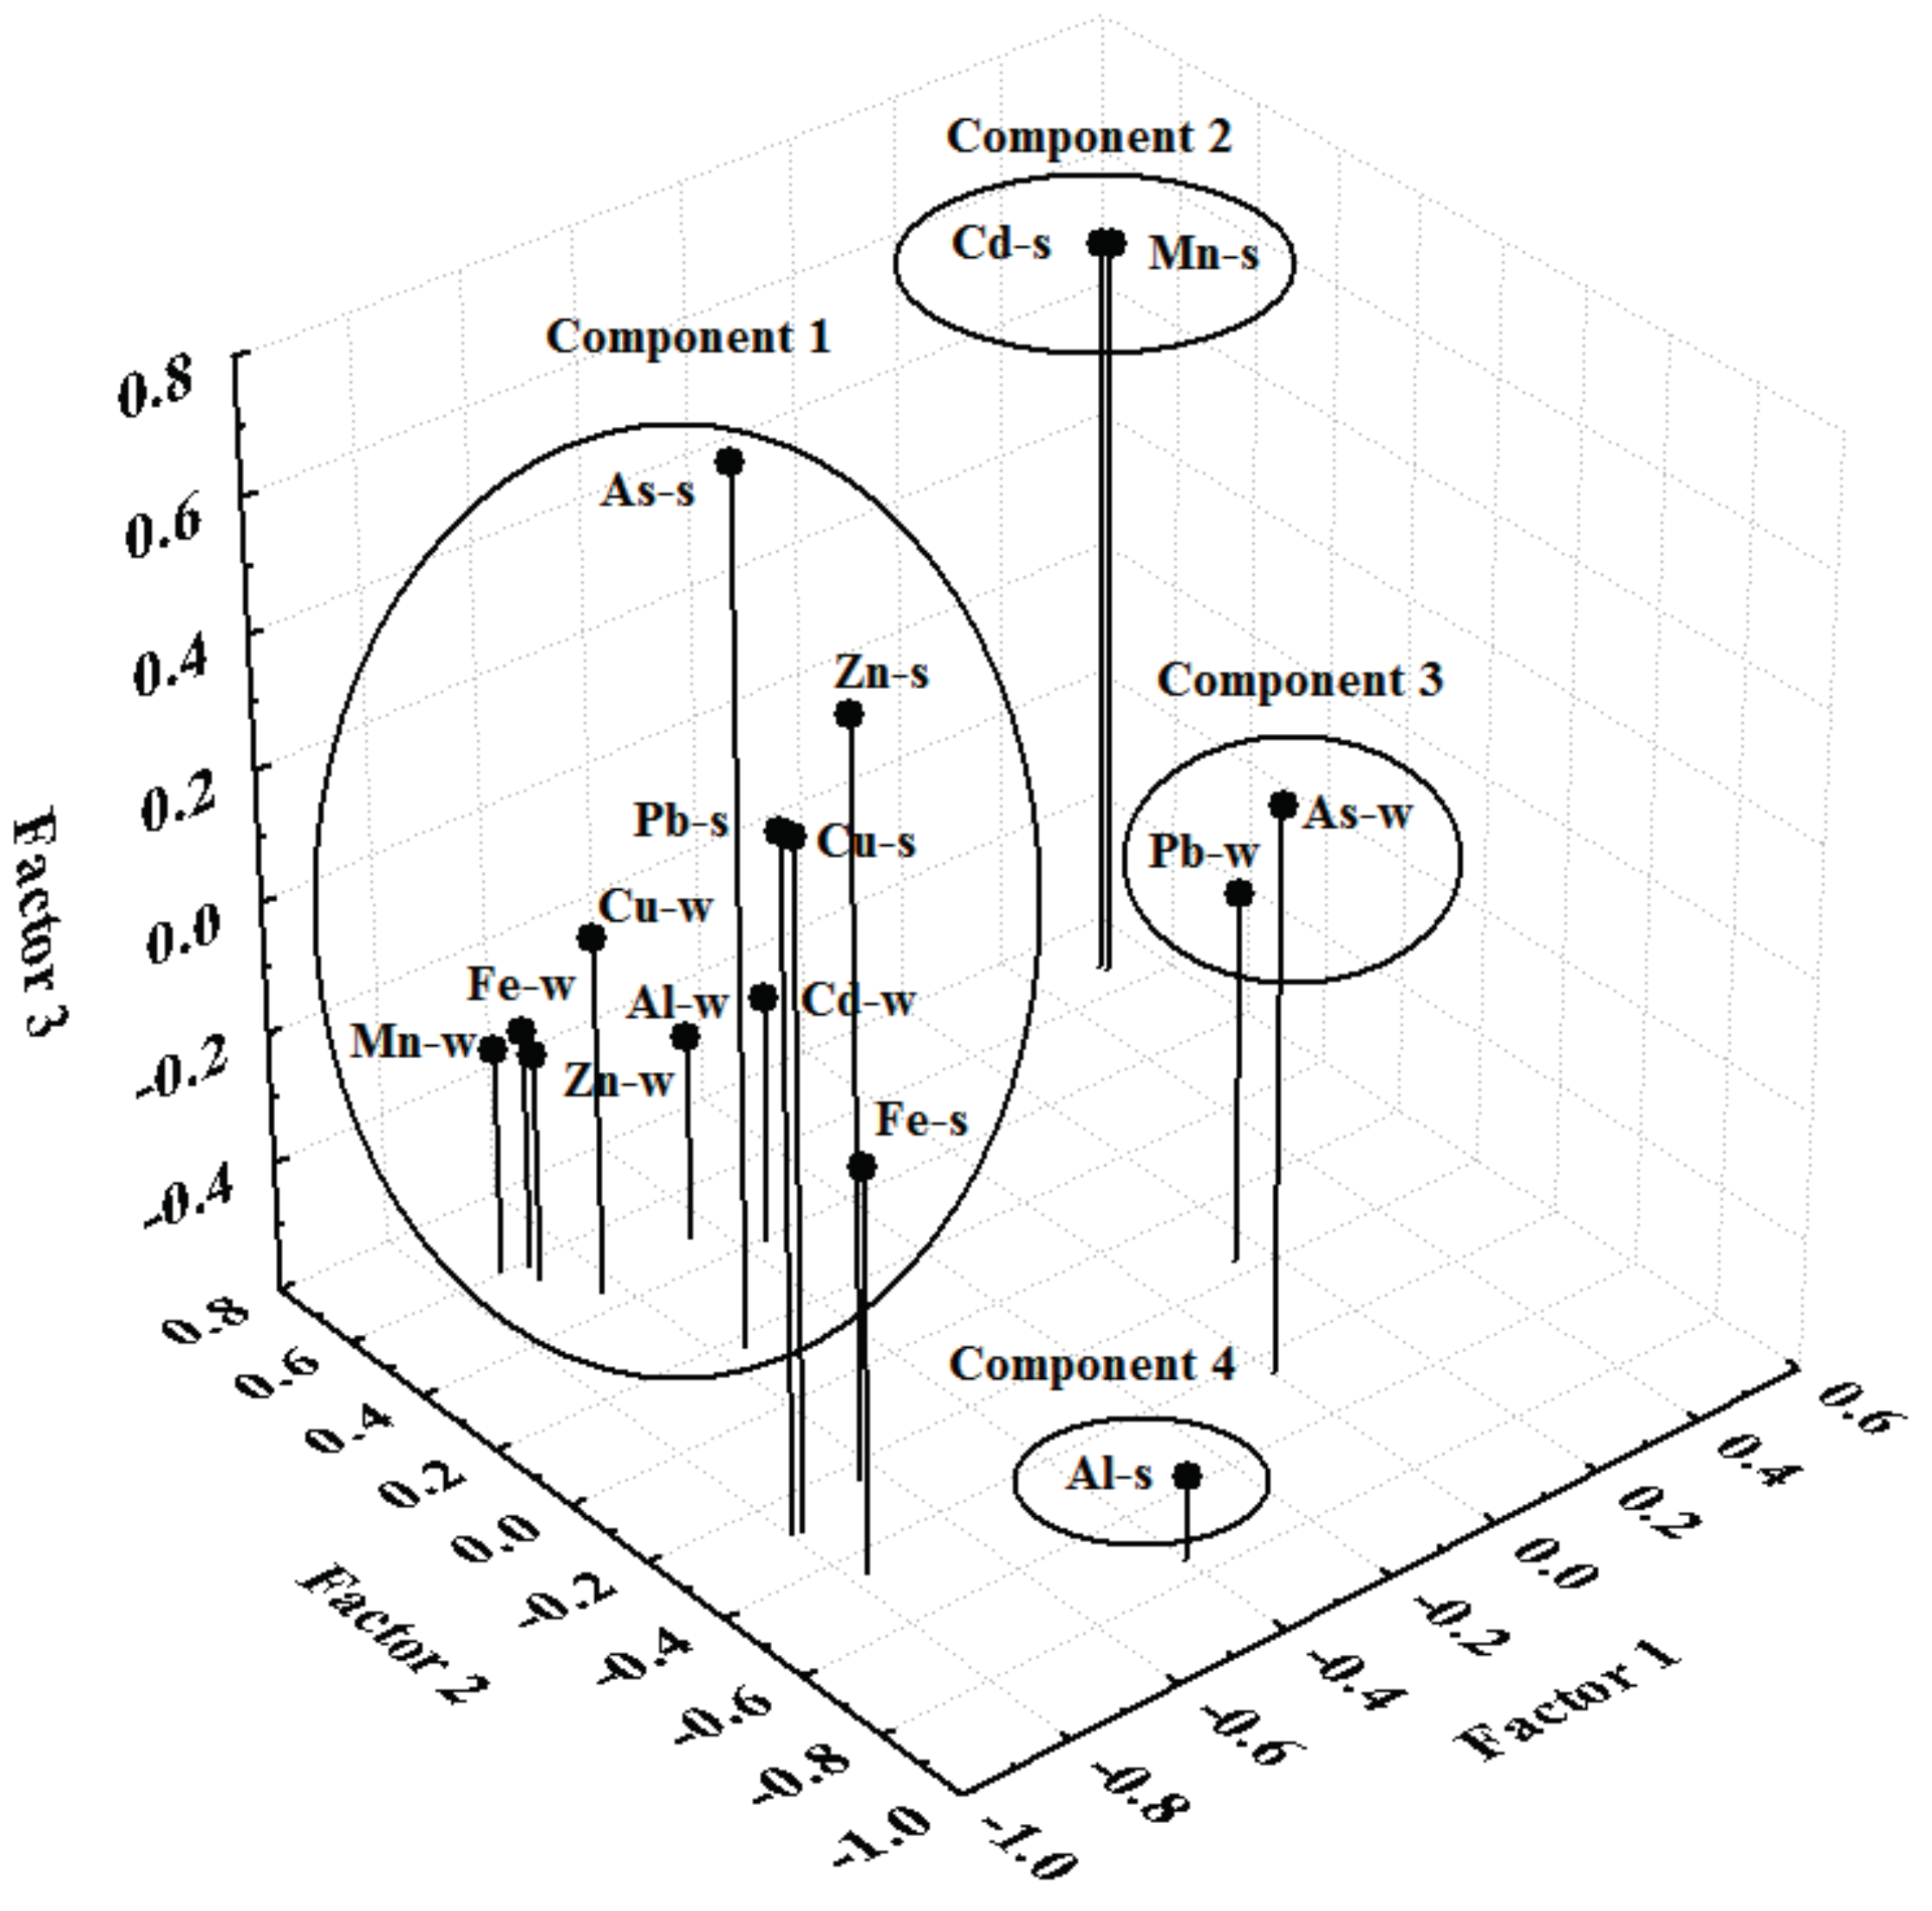
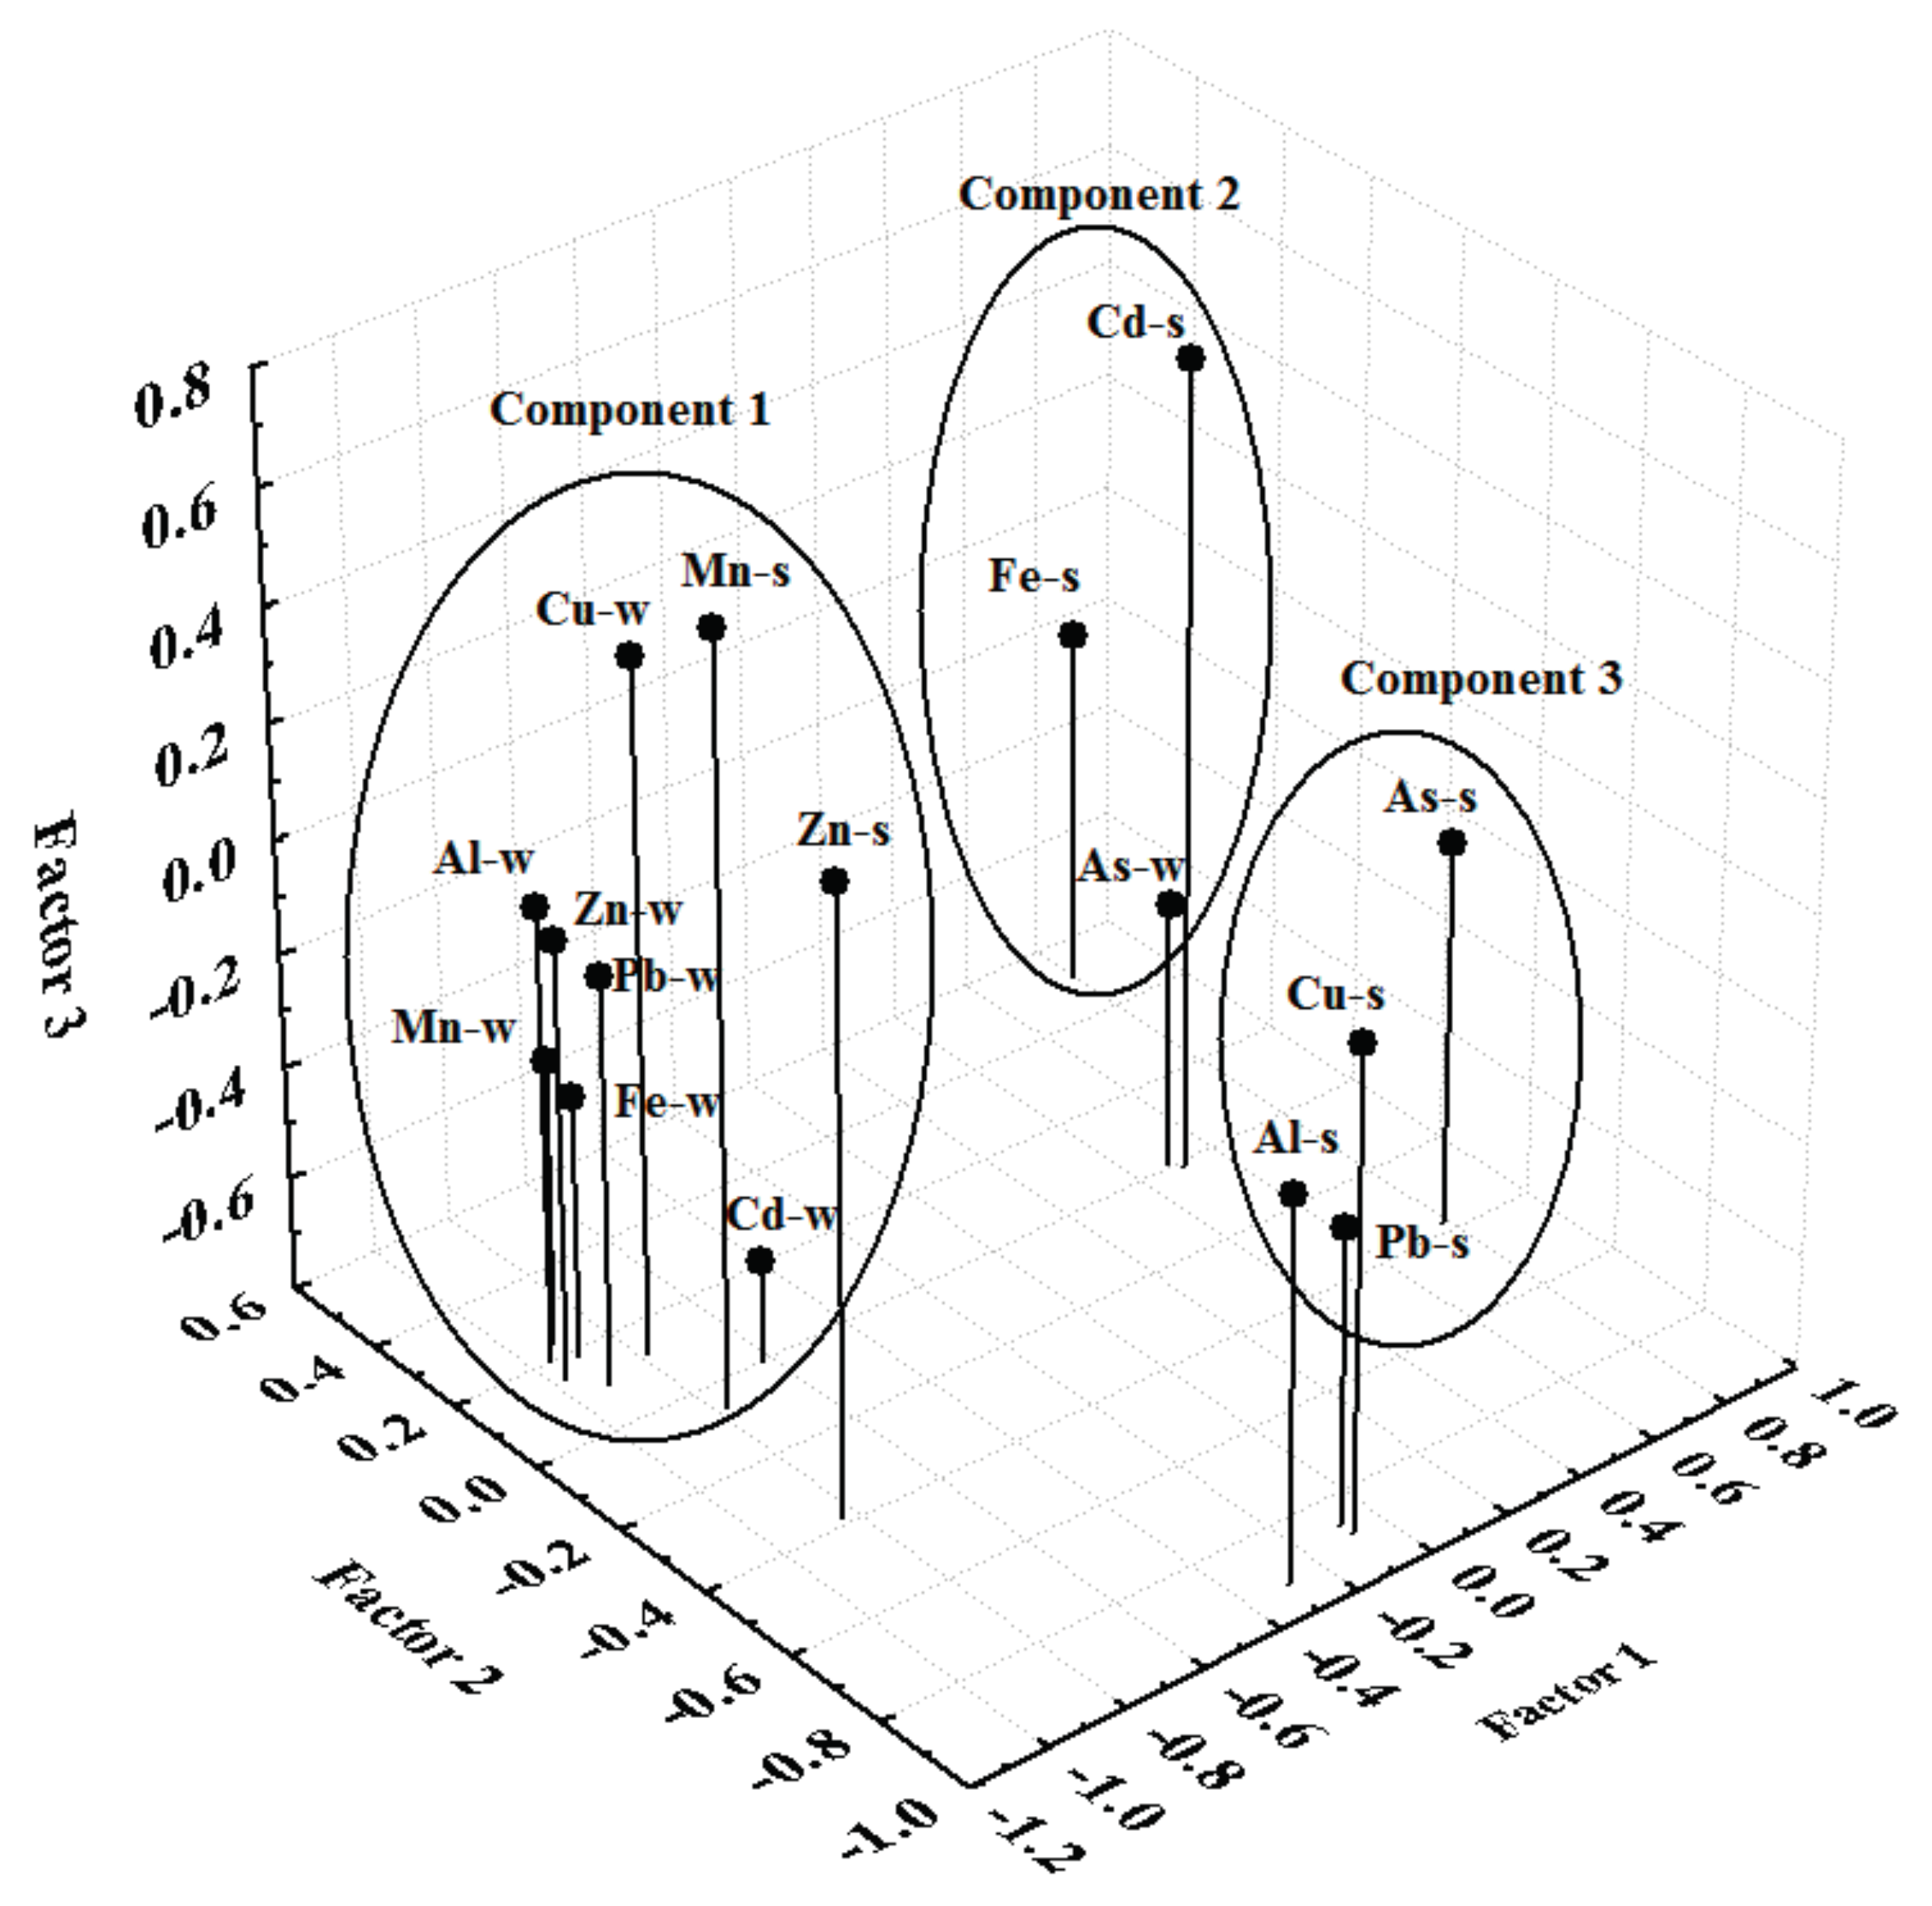
2.5. Principal Component Analysis
3. Results and Discussion
4. Conclusions
Acknowledgments
Author Contributions
Conflicts of Interest
References
- Cevik, F.; Goksu, M.; Derici, O.; Findik, O. An assessment of metal in surface sediments of Seyhan dam by using enrichment factor, geoaccumulation index and statistical analyses. Environ. Monit. Assess. 2009, 148, 291–305. [Google Scholar] [CrossRef]
- Andrade, S.; Poblet, A.; Scagliola, M.; Vodopivez, C.; Curtosi, A.; Pucci, A.; Marcovecchio, J. Distribution of heavy metals in surface sediments from an Antartic marine ecosystem. Environ. Monit. Assess. 2001, 66, 147–158. [Google Scholar] [CrossRef] [PubMed]
- Masoud, M.A.; Elewa, A.E.S.; Ali, A.E.; Mohamed, E.A. Distribution of some metal concentrations in water and sediments of lake Edku, Egypt. Bull. Chem. Technol. Maced. 2005, 24, 21–34. [Google Scholar]
- Simeonov, V.; Stratis, J.; Samara, C.; Zachariadis, G.; Voutsa, D.; Anthemidis, A.; Sofoniou, M.; Kouimtzis, T. Assessment of the surface water quality in Northern Greece. Water Res. 2003, 37, 4119–4124. [Google Scholar] [CrossRef]
- Sargaonkar, A.; Deshpande, V. Development of an overall index of pollution for surface water based on a general classification scheme in Indian context. Environ. Monit. Assess. 2003, 89, 43–67. [Google Scholar] [CrossRef] [PubMed]
- Safran, K. Canadian Water Quality Guidelines for the Protection of Aquatic Life. CCME Water Quality Index 1.0. User’s Manual 2001. Excerpt from Publ. No. 1299:13. Available online: http://www.ccme.ca/assets/pdf/wqi_techrprtfctsht_e.pdf (accessed on 25 November 2013).
- Bem, H.; Gallorini, M.; Rizzio, E.; Krzemin, S.M. Comparative studies on the concentrations of some elements in the urban air particulate matter in Lodz City of Poland and in Milan, Italy. Environ. Int. 2003, 29, 423–428. [Google Scholar] [CrossRef]
- Demkova, L.; Árvay, J.; Bobuľská, L.; Tomáš, J.; Stanovič, R.; Lošák, T.; Harangozo, L.; Vollmannová, A.; Bystrická, J.; Musilová, J.; et al. Accumulation and environmental risk assessment of heavy metals in soil and plants of four different ecosystems in a former polymetallic ores mining and smelting area (Slovakia). J. Environ. Sci. Health 2017, 1–12. [Google Scholar] [CrossRef] [PubMed]
- Demková, L.; Bobul’ská, L.; Árvay, J.; Jezný, T.; Ducsay, L. Biomonitoring of heavy metals contamination by mosses and lichens around Slovinky tailing pond (Slovakia). J. Environ. Sci. Health Part A 2017, 52, 30–36. [Google Scholar] [CrossRef] [PubMed]
- Davies, C.A.; Tomlinson, K.; Stephenson, T. Heavy metals in River Tees estuary sediments. Environ. Technol. 1991, 12, 961–972. [Google Scholar] [CrossRef]
- Shukla, R.; Sharma, Y.K. Heavy metal toxicity in environment. In Environmental Monitoring and Management; Trivedi, A., Jaiswal, K., Pandey, B.N., Trivedi, S.P., Eds.; Alfa Publications: Delhi, India, 2008; pp. 137–162. ISBN 978-81-907843-8-2. [Google Scholar]
- Martine, J.M.; Whitfield, M. The significance of river input of chemical elements to the Ocean. In Trace Metals in Seawater; Bruland, K.W., Burton, J.D., Goldberg, E.D., Eds.; Plenum: New York, NY, USA, 1993; pp. 265–296. [Google Scholar]
- Jackson, T.A. The biogeochemical and ecological significance of interactions between colloidal minerals and trace elements. In Environmental Interactions of Clays; Parker, A., Rae, J.E., Eds.; Springer: Berlin, Germany, 1998; pp. 93–205. [Google Scholar]
- Agirtas, M.S.; Kilice, F. Determination of Cu, Ni, Mn and Zn pollution in soil at the shore of Van Lake with Flame Atomic Spectrophotmetry. Bull. Pure Appl. Sci. 1999, 18, 45–47. [Google Scholar]
- Goodwin, T.H.; Young, A.R.; Holmes, M.G.R.; Old, G.H.; Hewitt, N.; Leeks, G.J.L.; Packman, J.C.; Smith, B.P.G. The temporal and spatial variability of sediment transport and yields within the Bradford Beck catchment, West Yorkshire. Sci. Total Environ. 2003, 314, 475–494. [Google Scholar] [CrossRef]
- Slesarova, A.; Kusnierova, M.; Luptakova, A.; Zeman, J. An overview of occurrence and evolution of acid mine drainage in the Slovak Republic. In Proceedings of the 22nd Annual International Conference on Contaminated Soils, Sediments and Water, Amherst, MA, USA, 15–18 October 2007; Edt Amherst: Curran Associates, Inc.: Red Hook, NY, USA, 2007; pp. 11–19, ISBN 9781604239515. [Google Scholar]
- Andriotti, J.L.S. Principal Component Analysis Applied to Stream Sediment Data in Passo Do Salsinho, RS, Brazil. Available online: http://docplayer.net/11271098-Principal-component-analysis-applied-to-stream-sediment-data-in-passo-do-salsinho-rs-brazil.html (accessed on 13 February 2017).
- Wahua, T.A.T. Applied Statistics for Scientific Studies; Afrika-Link Books: Aba, Nigeria, 1999; pp. 129–249. [Google Scholar]
- Teodorovic, I.; Djukic, N.; Maletin, S.; Miljanovic, B.; Jugovac, N. Metal pollution index: Proposal for freshwater monitoring based on trace metal accumulation in fish. Tiscia 2000, 32, 55–60. [Google Scholar]
- Usero, J.; Gonzales-Regalado, E.; Gracia, I. Trace metals in bivalve molluscs Ruditapes decussatus and Ruditapes philippinarum from the Atlantic Coast of southern Spain. Environ. Int. 1997, 23, 291–298. [Google Scholar] [CrossRef]
- Usero, J.; Gonzales-Regalado, E.; Gracia, I. Trace metals in bivalve molluscs Chameleo gallina from the Atlantic Coast of southern Spain. Mar. Pollut. Bull. 2003, 32, 305–310. [Google Scholar] [CrossRef]
- Mardia, K.V.; Kent, J.T.; Bibby, J.M. Multivariate Analysis; Academic Press: London, UK, 1979. [Google Scholar]
- Jongman, R.H.; Ter Braak, C.J.; van Tongeren, O.F. Data Analysis in Community and Landscape Ecology; Cambridge University Press: Cambridge, UK, 1995; pp. 116–125. [Google Scholar]
- Hair Júnior, J.F.; Black, W.C.; Babin, B.J.; Anderson, R.E.; Tatham, R.L. Análise Multivariada de Dados, 6th ed.; Bookman: Porto Alegre, Brazil, 2009. [Google Scholar]
- Kaiser, H.F. The application of electronic computers to factor analysis. Edu. Psychol. Meas. 1960, 20, 141–151. [Google Scholar] [CrossRef]
- Balintova, M.; Petrilakova, A.; Singovszká, E. Study of metal ion sorption from acidic solutions. Theor. Found. Chem. Eng. 2012, 46, 727–731. [Google Scholar] [CrossRef]
- Balintova, M.; Petrilakova, A. Study of pH influence on selective precipitation of heavy metals from acid mine drainage. Chem. Eng. Trans. 2011, 25, 345–350. [Google Scholar]


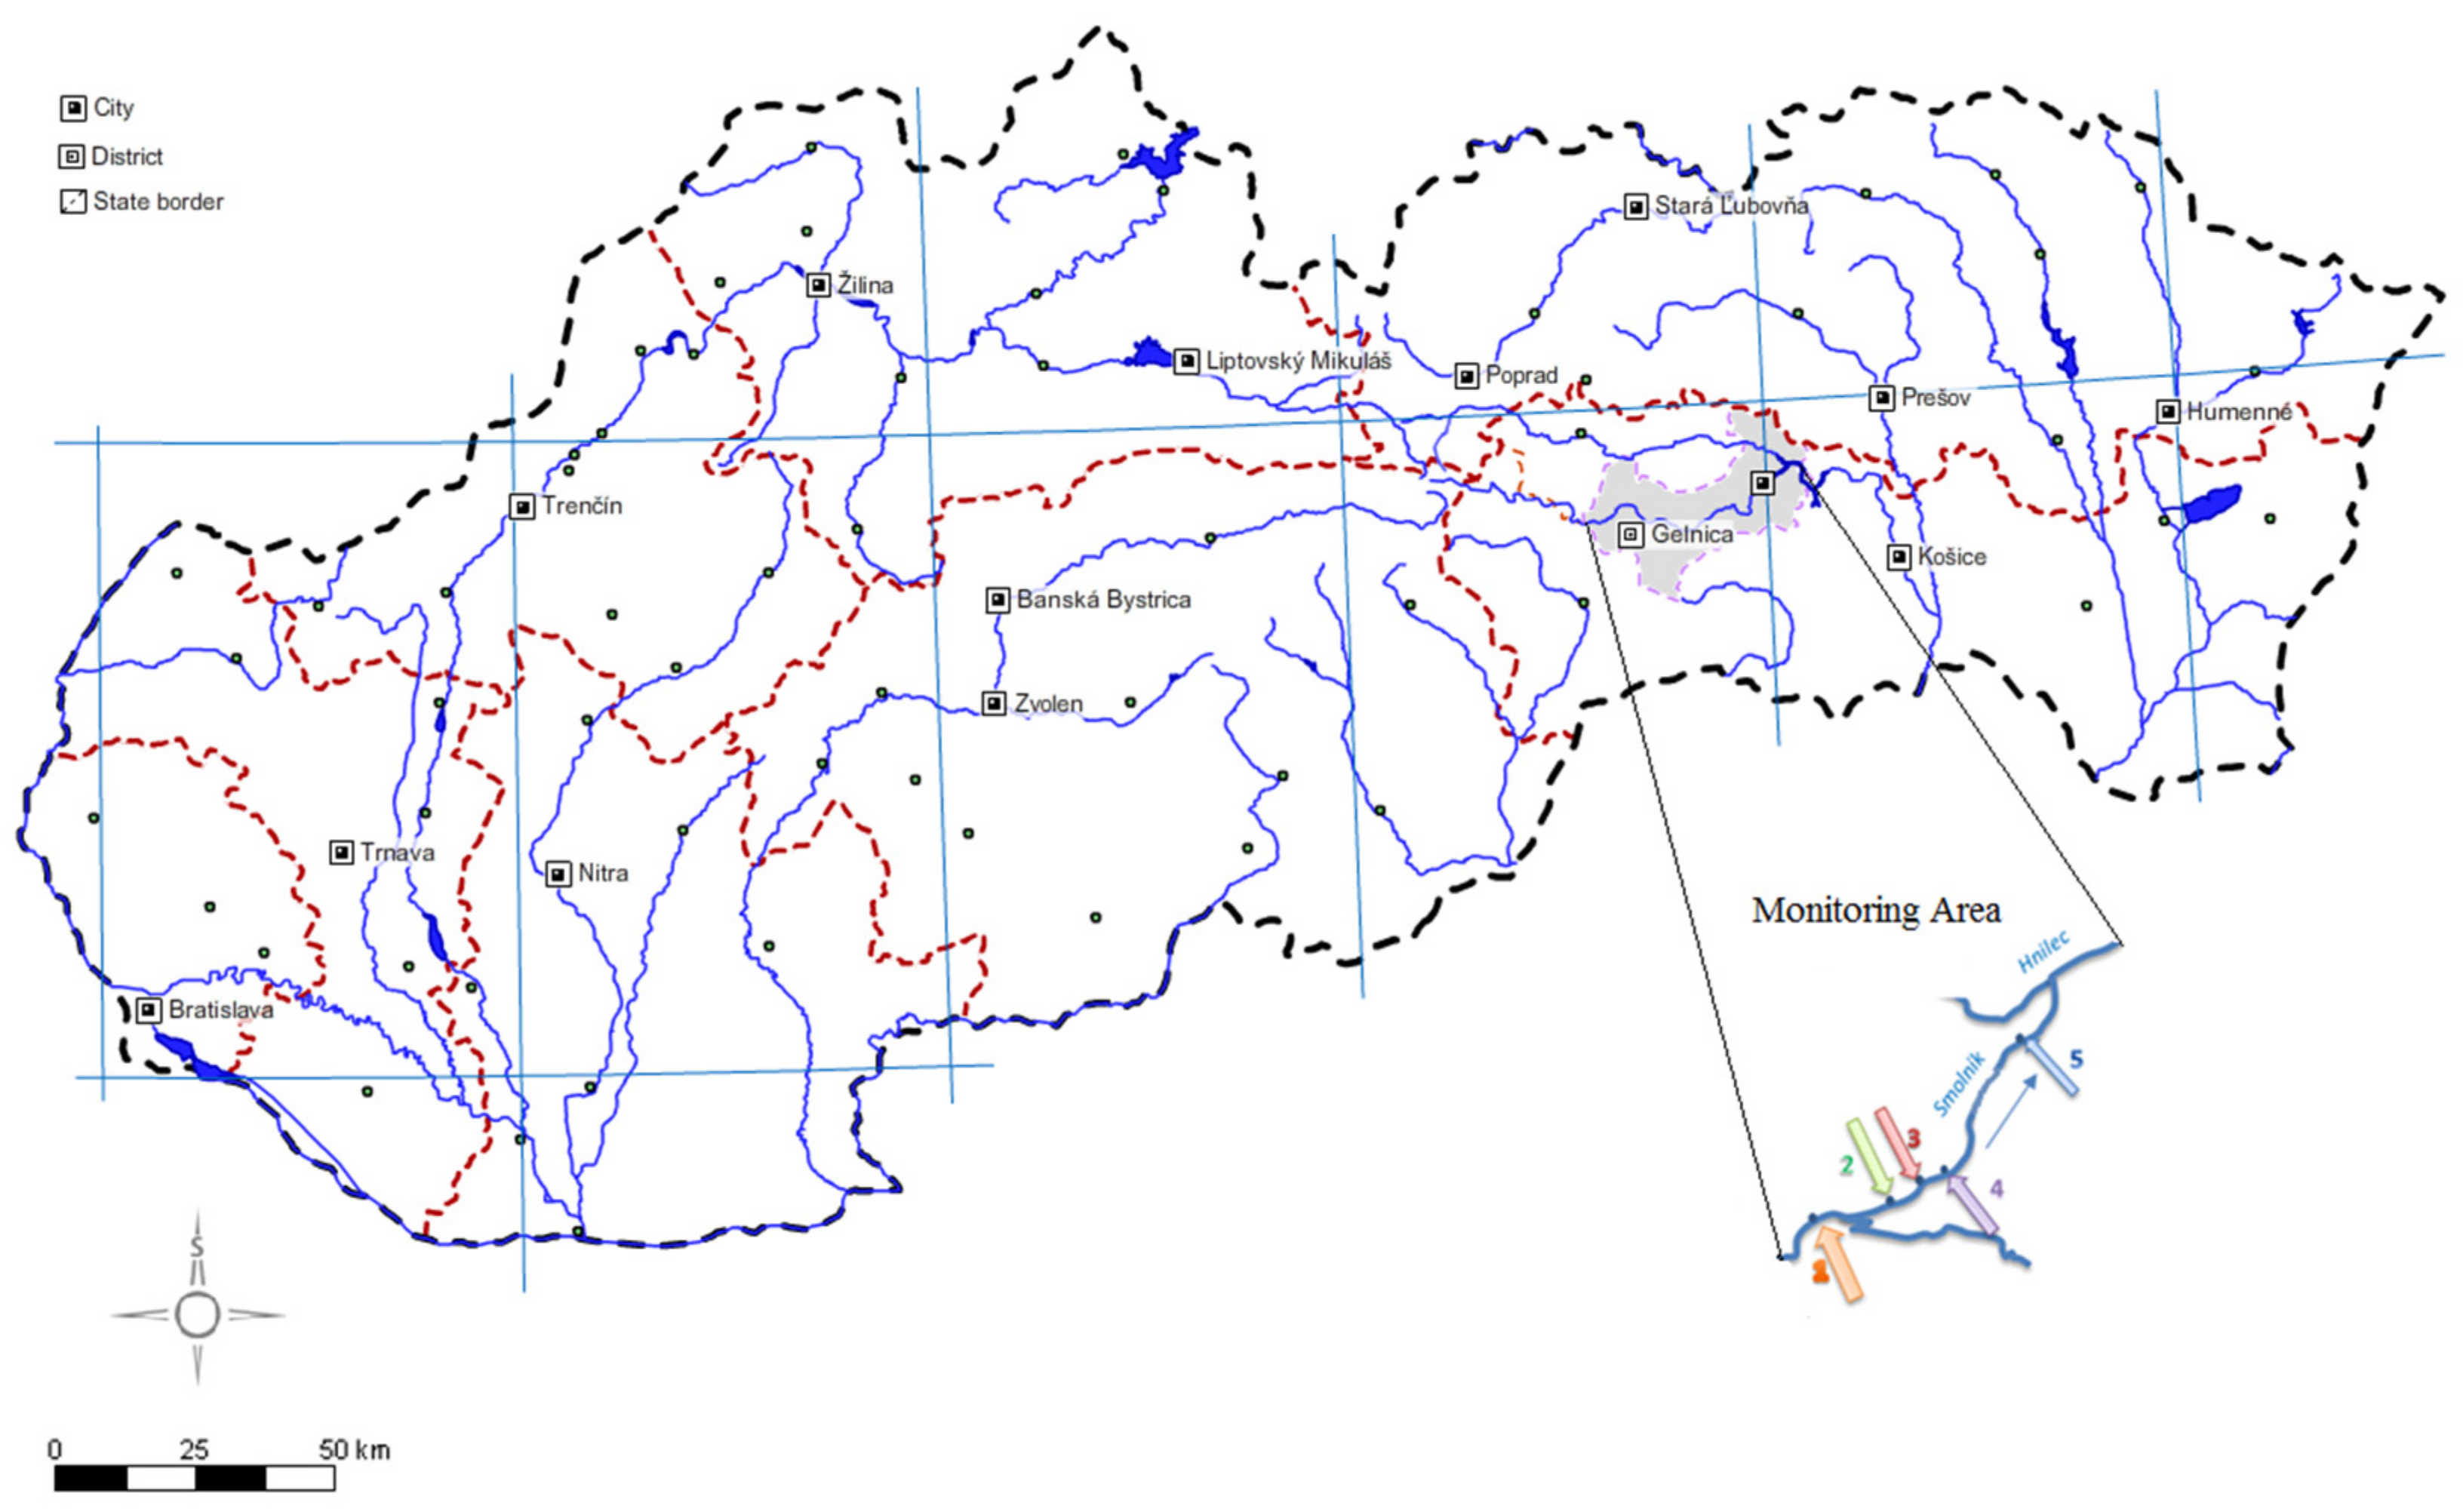
| Sample Site | GPS Coordinates | Description |
|---|---|---|
| 1 | 48°43′27.6965658″ N | Site 1: uncontaminated part; outside Smolnik village |
| 20°42′59.2164803″ E | ||
| 2 | 48°44′21.9978463″ N | Site 2: uncontaminated part; small bridge crossing to the Pech shaft |
| 20°45′37.2264862″ E | ||
| 3 | 48°44′18.0496747″ N | Site 3: source of AMD—Pech shaft |
| 20°45′44.9512482″ E | ||
| 4 | 48°44′46.1817014″ N | Site 4: contaminated part; 200 m downstream of the Pech shaft |
| 20°46′28.4995937″ E | ||
| 5 | 48°45′2.2642765″ N | Site 5: contaminated part; inflow to the Hnilec River |
| 20°46′39.41082″ E |
| Media | Metals | Stations | ||||
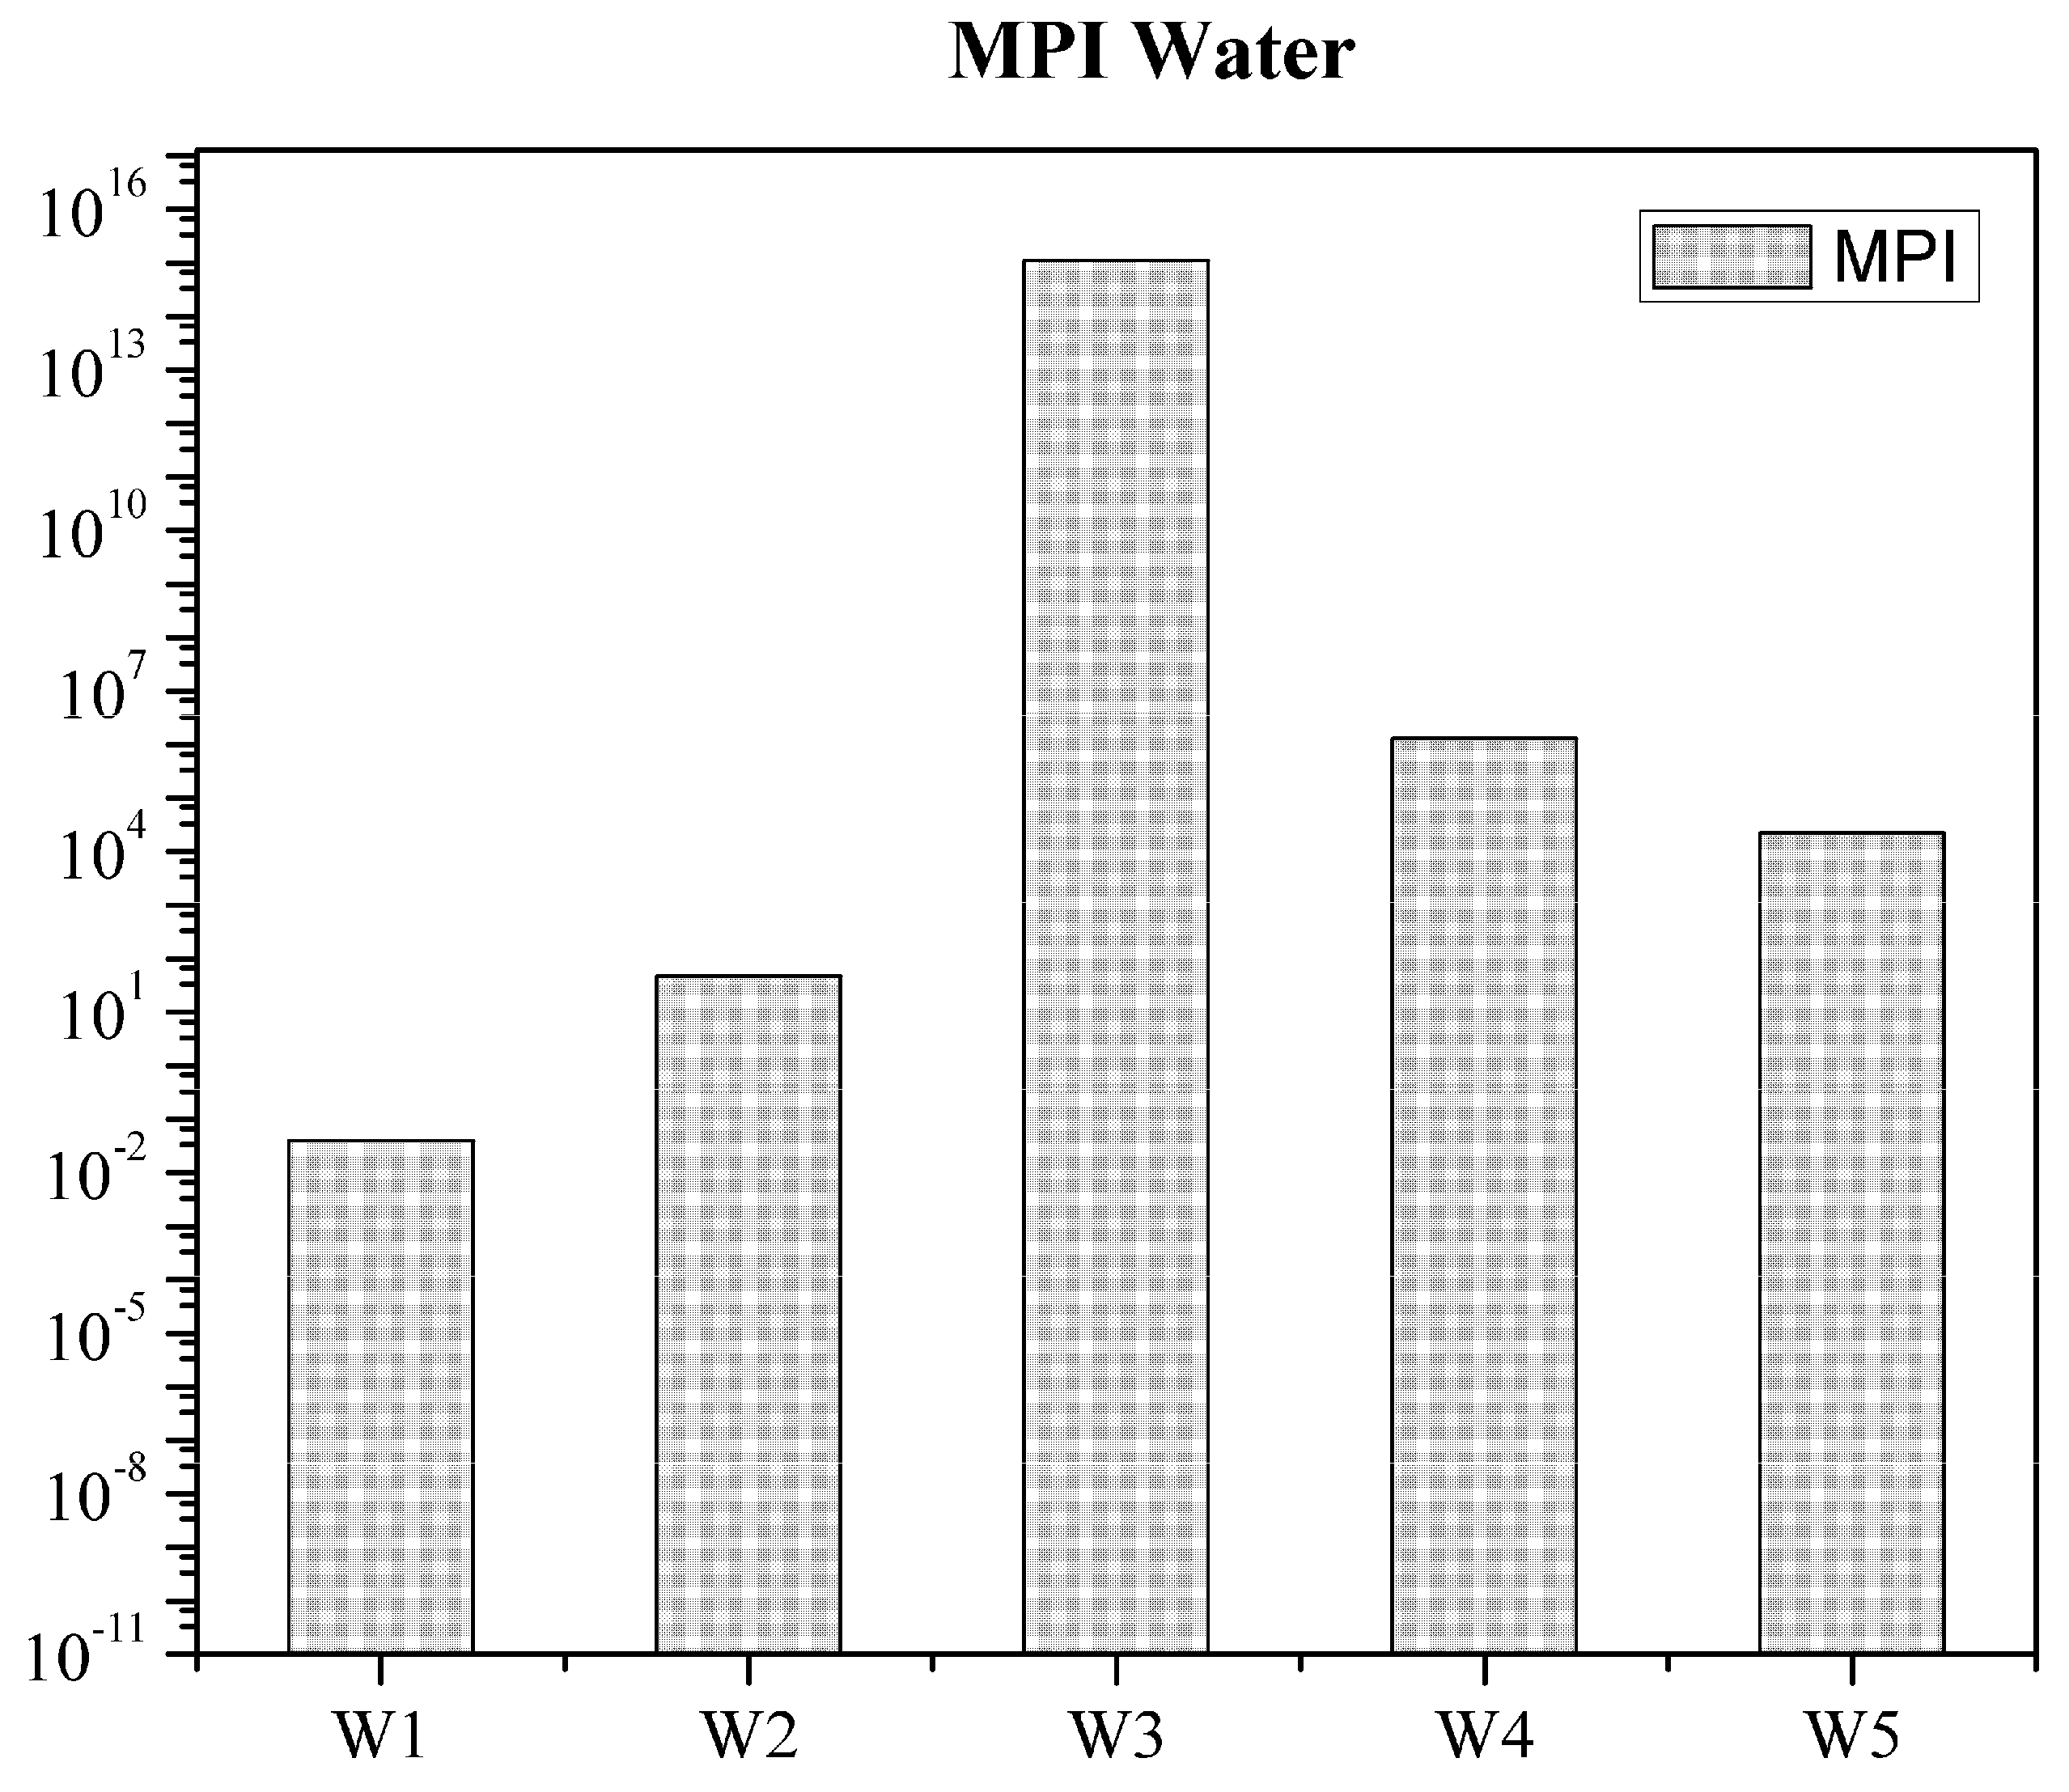
| W1 | W2 | W3 | W4 | W5 | ||
| Surface water (mg·L−1) | Fe | 0.058 ± 0.012 | 0.889 ± 0.899 | 332.60 ± 85.621 | 13.634 ± 8.789 | 5.919 ± 5.723 |
| Mn | 0.011 ± 0.003 | 0.125 ± 0.114 | 25.990 ± 6.205 | 1.250 ± 0.726 | 0.976 ± 0.621 | |
| Al | 0.033 ± 0.032 | 0.165 ± 0.217 | 67.680 ± 18.431 | 1.283 ± 1.641 | 0.348 ± 0.746 | |
| Cu | 0.004 ± 0.005 | 0.013 ± 0.008 | 1.594 ± 0.722 | 0.105 ± 0.119 | 0.047 ± 0.066 | |
| Zn | 0.004 ± 0.001 | 0.044 ± 0.044 | 7.448 ± 2.271 | 0.372 ± 0.251 | 0.272 ± 0.217 | |
| As | 0.002 ± 0.001 | 0.001 ± 0.001 | 0.035 ± 0.017 | 0.002 ± 0.001 | 0.001 ± 0.001 | |
| Cd | 0.0003 * | 0.0003 * | 0.014 ± 0.008 | 0.001 ± 0.001 | 0.0003 * | |
| Pb | 0.005 * | 0.005 * | 0.055 ± 0.008 | 0.005 ± 0.001 | 0.005 * | |
| Media | Metals | Stations | ||||
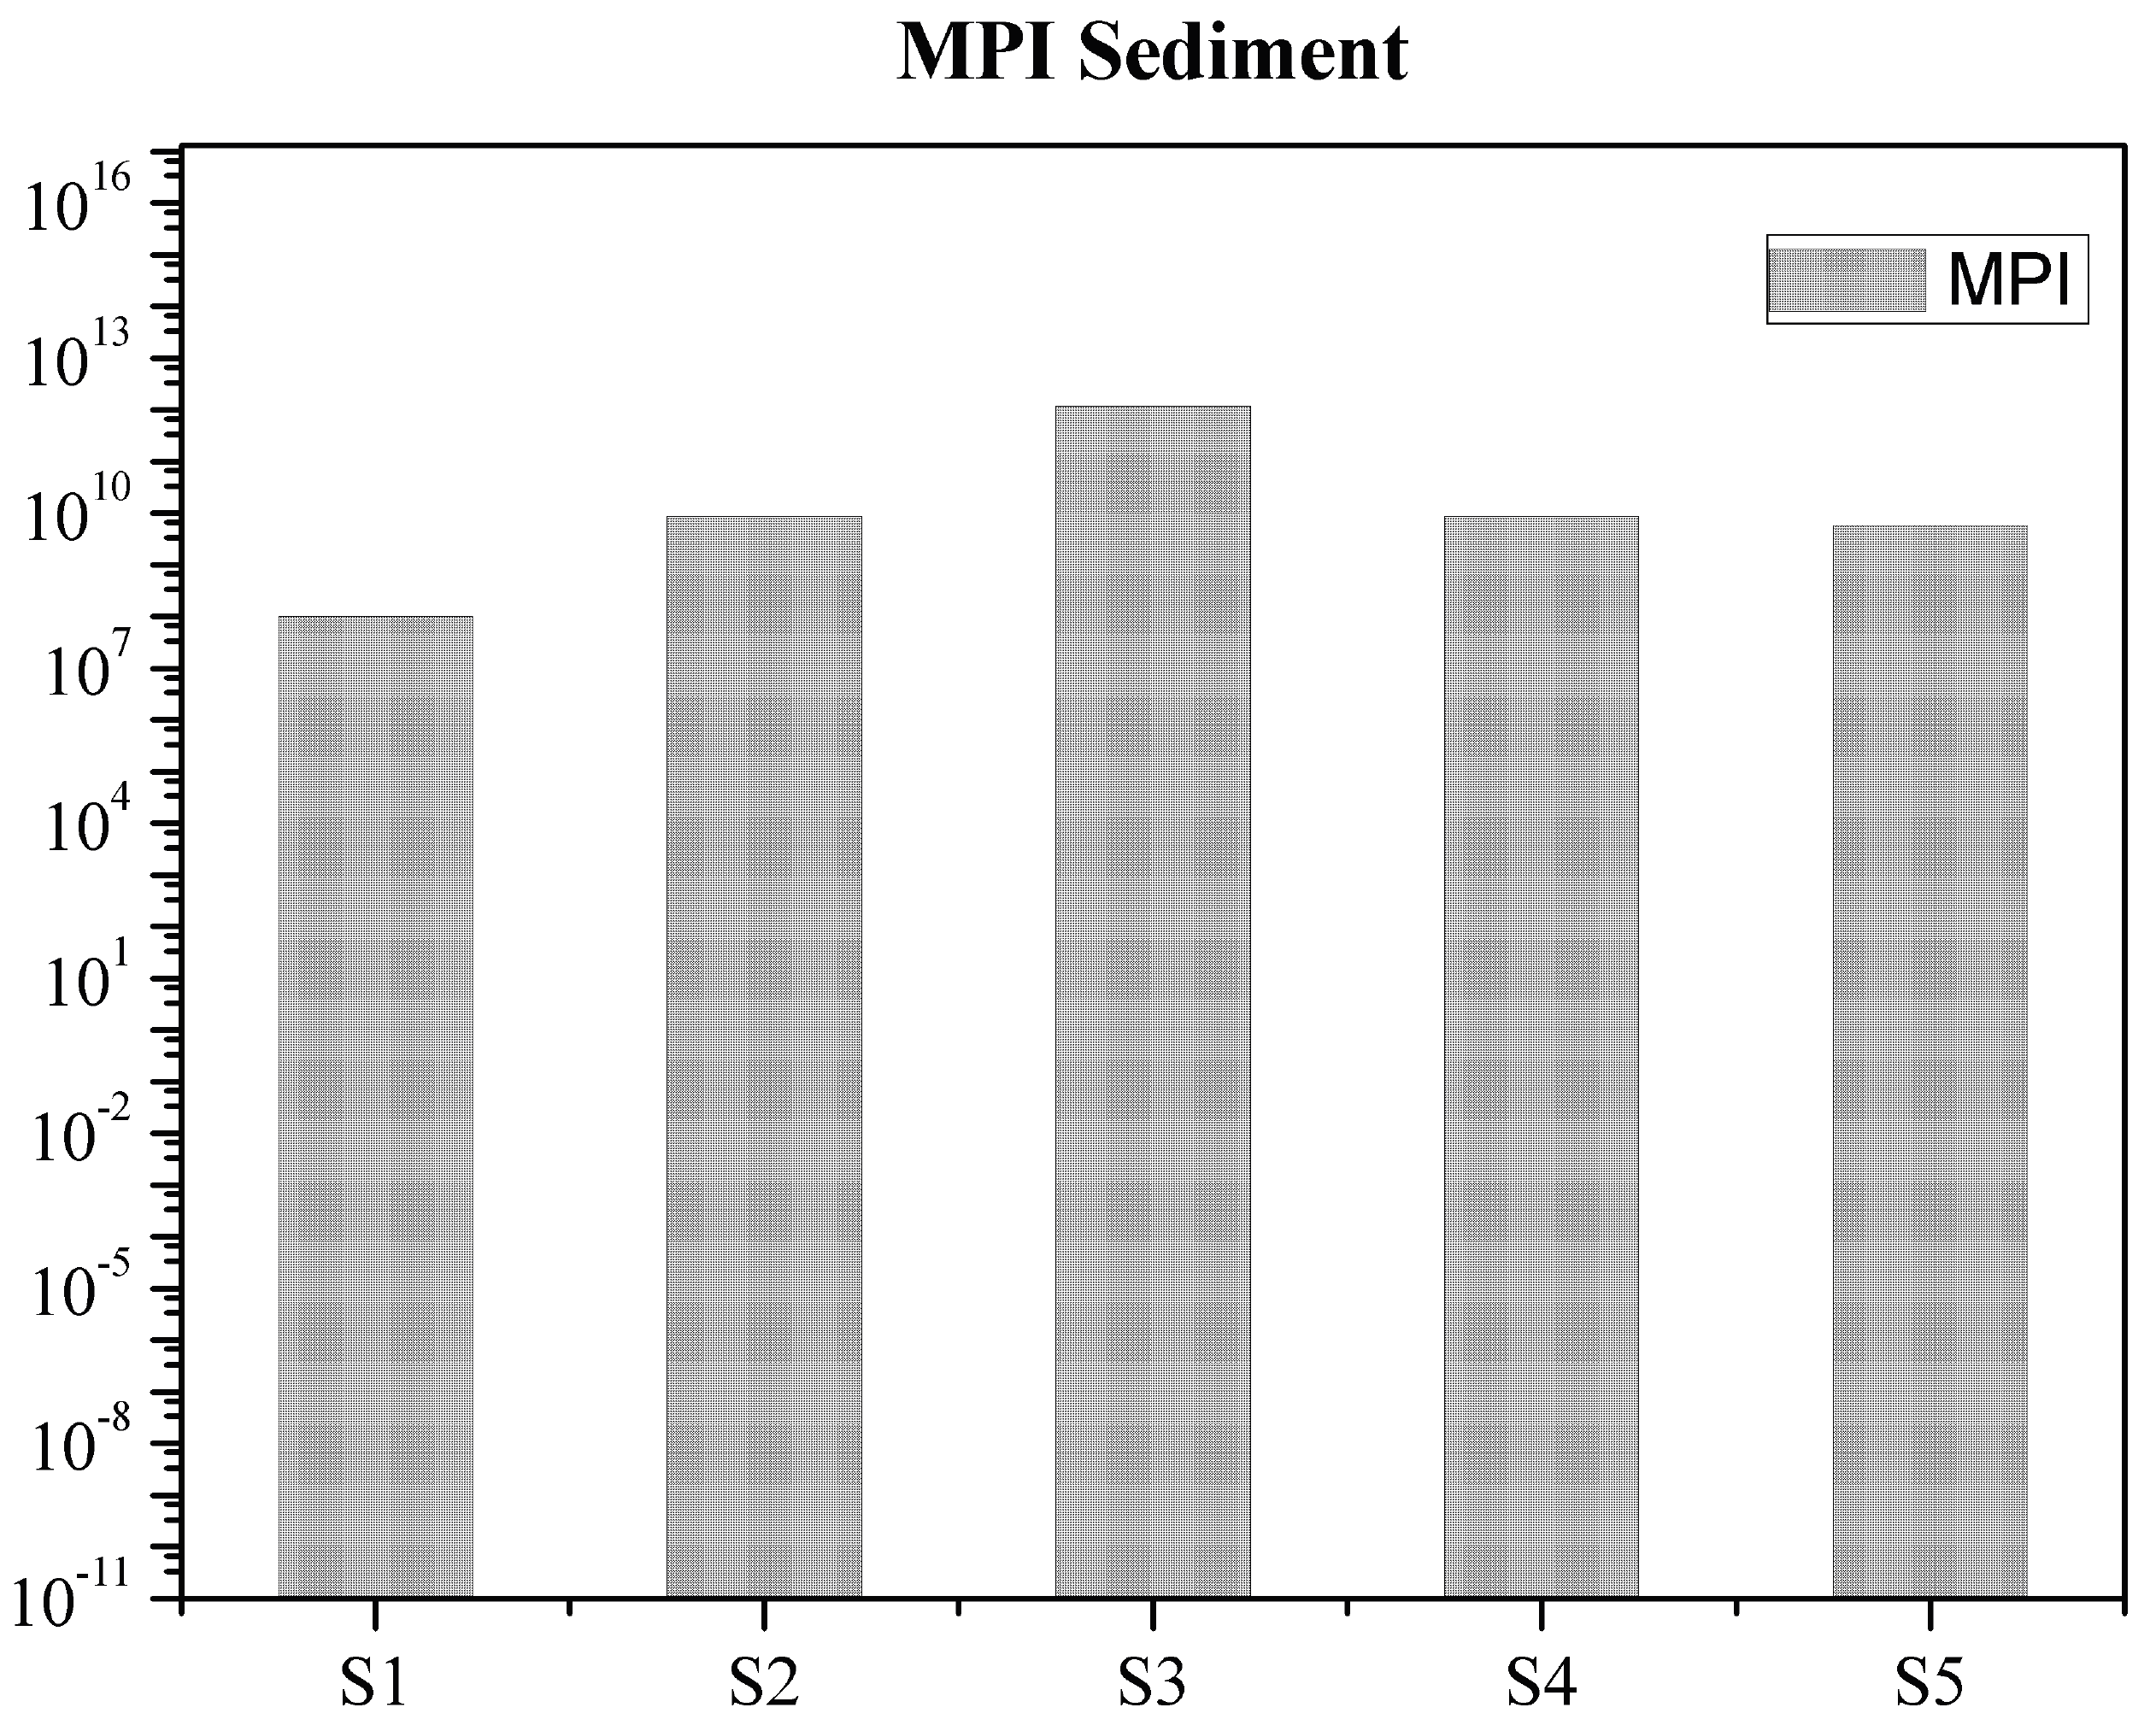
| S1 | S2 | S3 | S4 | S5 | ||
| Sediments (mg·kg−1) | Fe | 41,550.0 ± 5316.9 | 50,450.0 ± 18,569.4 | 343,600.0 ± 55,068.0 | 79,450.0 ± 36,415.4 | 97,810.0 ± 80,710.7 |
| Mn | 900.0 ± 253.8 | 535.3 ± 145.3 | 234.0 ± 261.3 | 580.0 ± 145.7 | 584.0 ± 170.9 | |
| Al | 73,810.0 ± 6220.4 | 61,490.0 ± 21,764.1 | 21,940.0 ± 13,692.8 | 64,280.0 ± 3719.0 | 62,270.0 ± 13,105.1 | |
| Cu | 132.50 ± 44.09 | 266.23 ± 131.18 | 482.40 ± 201.60 | 404.10 ± 226.45 | 519.20 ± 158.32 | |
| Zn | 150.60 ± 26.01 | 180.50 ± 42.52 | 119.30 ± 82.13 | 196.80 ± 65.21 | 240.30 ± 49.76 | |
| As | 44.50 ± 13.18 | 82.30 ± 17.26 | 2137.90 ± 743.33 | 142.20 ± 73.30 | 97.80 ± 26.66 | |
| Cd | 0.50 * | 4.850 ± 13.756 | 1.150 ± 2.005 | 0.50 * | 0.50 * | |
| Pb | 43.50 ± 10.99 | 91.80 ± 41.93 | 679.40 ± 872.20 | 170.90 ± 87.44 | 110.90 ± 44.65 | |
| Sample Site | pH |
|---|---|
| 1 | 6.19 ± 0.73 |
| 2 | 6.33 ± 0.82 |
| 3 | 3.98 ± 0.07 |
| 4 | 5.53 ± 0.51 |
| 5 | 5.80 ± 0.66 |
| Metals | Relationship [Sediment (Y) and Surface Water (x)] | Determination Coefficient r2 | Correlation Coefficient r | Partition Coefficient kd | log Kd |
|---|---|---|---|---|---|
| Fe | Y = 69.705x − 136.28 | 54% | 0.733 | 1735.7 | 3.24 |
| Al | Y = 14.044x − 27.792 | 52% | 0.718 | 4082.7 | 3.61 |
| Cu | Y = 100,541x + 62,517 | 94% | 0.967 | 1023.5 | 3.01 |
| Zn | Y = −3599.6x + 189,842 | 2% | 0.372 | 21.91 | 1.34 |
| As | Y = 392,156x − 706,648 | 94% | 0.967 | 61,090 | 4.79 |
| Cd | Y = −339.3x − 2628.5 | 7% | 0.255 | 305,198.1 | 5.48 |
| Pb | Y = −88,068x − 35,118 | 26% | 0.506 | 68,962.3 | 4.84 |
| Couple of Elements | 1 2 * | 4 5 * | 3 ** | |||
|---|---|---|---|---|---|---|
| Water | Sediment | Water | Sediment | Water | Sediment | |
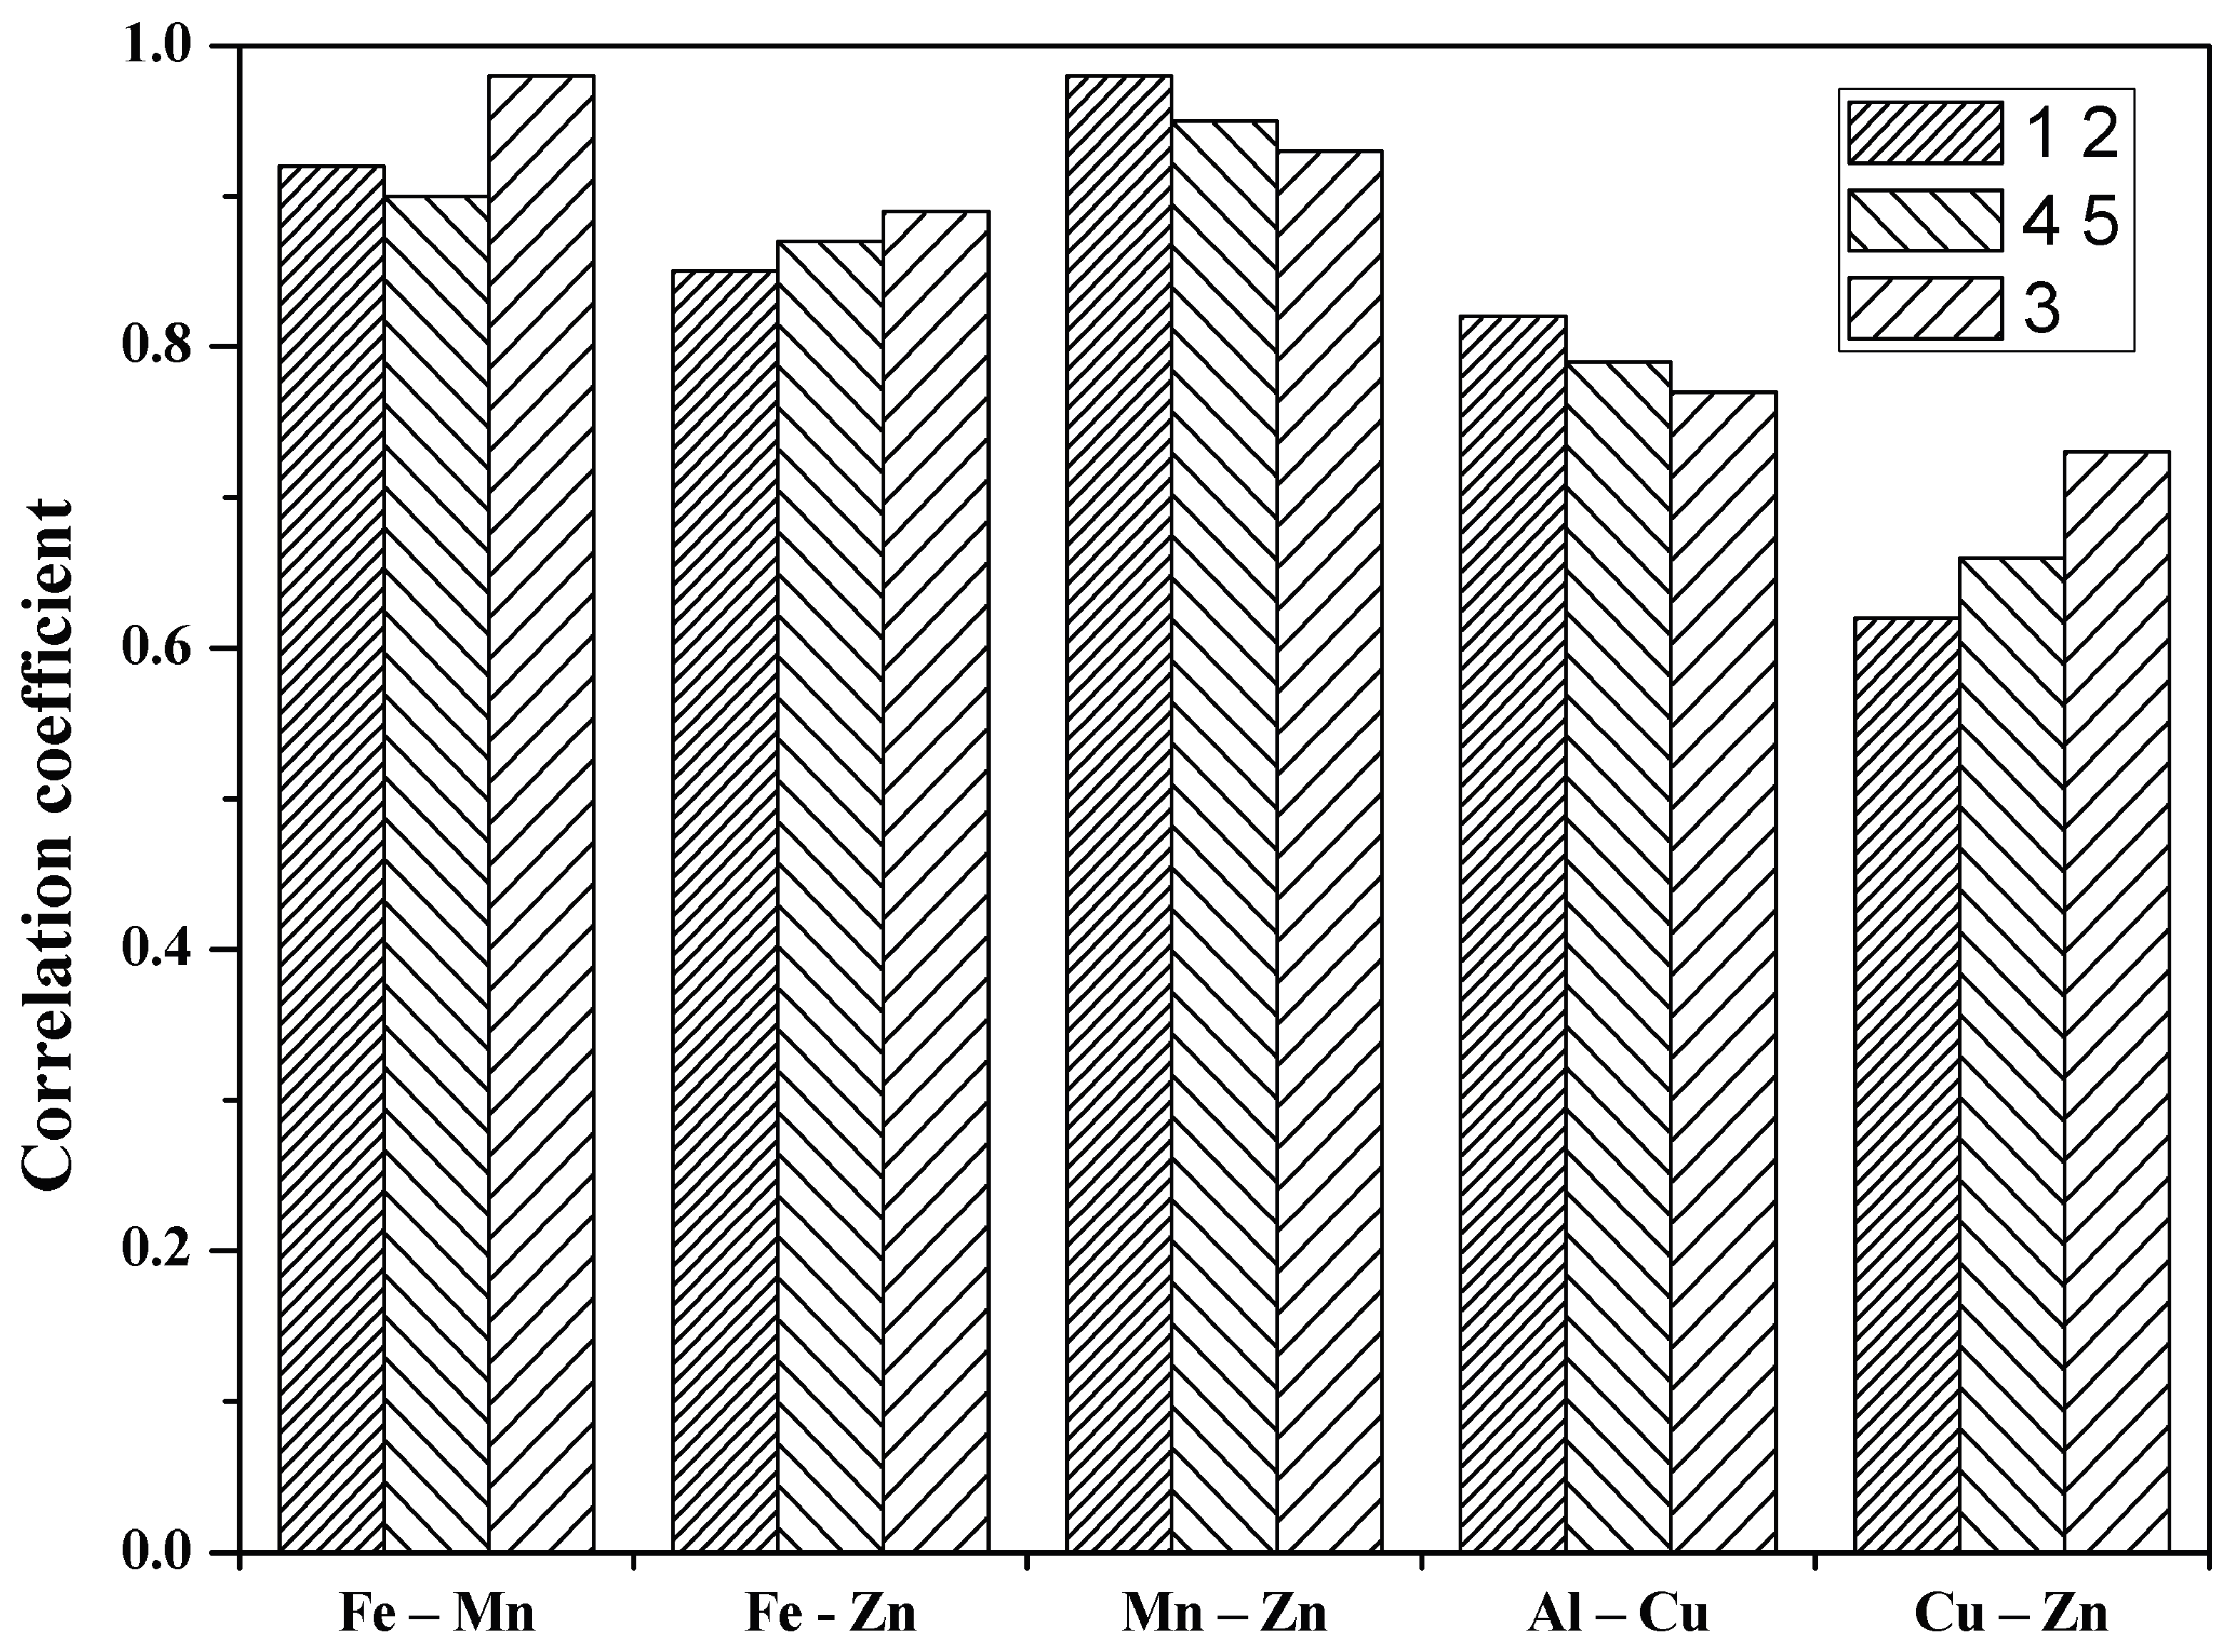
| Fe-Mn | 0.92 | −0.67 | 0.90 | −0.44 | 0.98 | −0.77 |
| Fe-Al | 0.44 | 0.67 | 0.45 | −0.78 | 0.90 | −0.69 |
| Fe-Cu | 0.53 | 0.64 | 0.45 | 0.67 | 0.55 | −0.46 |
| Fe-Zn | 0.85 | 0.54 | 0.87 | 0.09 | 0.89 | −0.93 |
| Fe-As | −0.26 | 0.49 | 0.08 | 0.15 | −0.34 | 0.39 |
| Fe-Cd | 0.79 | −0.66 | 0.39 | 0.00 | 0.78 | 0.26 |
| Fe-Pb | −0.13 | 0.70 | 0.26 | −0.18 | 0.83 | −0.45 |
| Mn-Al | 0.59 | 0.93 | 0.49 | 0.33 | 0.93 | 0.23 |
| Mn-Cu | 0.67 | 0.57 | 0.52 | −0.04 | 0.57 | 0.08 |
| Mn-Zn | 0.98 | 0.93 | 0.95 | 0.28 | 0.93 | 0.88 |
| Mn-As | −0.30 | −0.32 | 0.04 | 0.15 | −0.32 | −0.57 |
| Mn-Cd | 0.51 | 0.74 | 0.30 | −0.16 | 0.74 | −0.05 |
| Mn-Pb | −0.14 | 0.85 | 0.25 | 0.35 | 0.85 | −0.04 |
| Al-Cu | 0.82 | 0.77 | 0.79 | –0.41 | 0.77 | 0.81 |
| Al-Zn | 0.50 | 0.97 | 0.48 | 0.04 | 0.97 | 0.59 |
| Al-As | −0.26 | −0.53 | 0.09 | 0.05 | −0.53 | 0.11 |
| Al-Cd | 0.12 | 0.58 | 0.10 | 0.13 | 0.58 | −0.18 |
| Al-Pb | −0.11 | 0.82 | 0.59 | 0.28 | 0.82 | 0.84 |
| Cu-Zn | 0.62 | 0.73 | 0.66 | 0.75 | 0.73 | 0.43 |
| Cu-As | −0.05 | −0.49 | −0.16 | 0.52 | −0.49 | 0.23 |
| Cu-Cd | 0.17 | 0.12 | 0.22 | −0.20 | 0.12 | −0.09 |
| Cu-Pb | −0.14 | 0.73 | 0.05 | 0.23 | 0.73 | 0.66 |
| Zn-As | −0.27 | −0.44 | −0.10 | 0.49 | −0.44 | −0.48 |
| Zn-Cd | 0.38 | 0.60 | 0.32 | −0.18 | 0.60 | −0.27 |
| Zn-Pb | −0.14 | 0.86 | 0.06 | 0.38 | 0.86 | 0.24 |
| As-Cd | −0.12 | −0.40 | 0.19 | 0.17 | −0.40 | 0.22 |
| As-Pb | 0.08 | −0.18 | 0.43 | 0.89 | −0.18 | 0.23 |
| Cd-Pb | −0.05 | 0.53 | 0.05 | 0.18 | 0.53 | −0.11 |
© 2017 by the authors. Licensee MDPI, Basel, Switzerland. This article is an open access article distributed under the terms and conditions of the Creative Commons Attribution (CC BY) license (http://creativecommons.org/licenses/by/4.0/).
Share and Cite
Singovszka, E.; Balintova, M.; Demcak, S.; Pavlikova, P. Metal Pollution Indices of Bottom Sediment and Surface Water Affected by Acid Mine Drainage. Metals 2017, 7, 284. https://doi.org/10.3390/met7080284
Singovszka E, Balintova M, Demcak S, Pavlikova P. Metal Pollution Indices of Bottom Sediment and Surface Water Affected by Acid Mine Drainage. Metals. 2017; 7(8):284. https://doi.org/10.3390/met7080284
Chicago/Turabian StyleSingovszka, Eva, Magdalena Balintova, Stefan Demcak, and Petra Pavlikova. 2017. "Metal Pollution Indices of Bottom Sediment and Surface Water Affected by Acid Mine Drainage" Metals 7, no. 8: 284. https://doi.org/10.3390/met7080284
APA StyleSingovszka, E., Balintova, M., Demcak, S., & Pavlikova, P. (2017). Metal Pollution Indices of Bottom Sediment and Surface Water Affected by Acid Mine Drainage. Metals, 7(8), 284. https://doi.org/10.3390/met7080284